Embed Size (px)
Citation preview

Use of R in Genome-wide Association Studies (GWASs)Jing Hua ZhaoMRC Epidemiology Unit & Institute of Metabolic Science, UK
Qihua TanUniversity of Southern Denmark & Odense University Hospital

• “As the fifth edition … goes to press, completion of the human genome sequence is no longer news. This was not something that could safely have been anticipated when the first edition appeared in 1965; even when the fourth edition came out in 1987, few if any foresaw how quickly we would move into a world where whole genomes, not just individual genes, could be visualized and compared.”
• Watson et al. Molecular Biology of the Gene, fifth Edition, CSHL Press 2004
A preface

Sketch of the talk
1. Background
2. Basic association testing
3. Work under the R environment
4. Example: analysis of GAW16 Framingham data
5. Some remarks and summary

• This is a derivation of a presentation at useR!2007 on genetic association studies in general.
• Revision has been made in the context of genome-wide association studies (GWASs).
• This is further benefited from tutorials on useR!2008 and useR!2009.
• They all have a common aim—to demonstrate the utility and draw attention of the R environment for statistical genetics or genetic epidemiology.
1.1 History & aim

1.2 Genetic epidemiology
• It is the study of the role of genetic factors in determining health and disease in families and in populations, and the interplay of such genetic factors with environmental factors, or “a science which deals with the aetiology, distribution, and control of diseases in groups of relatives and with inherited causes of disease in populations” (http://en.wikipedia.org).
• It customarily includes study of familial aggregation, segregation, linkage and association. It is closely associated with the development of statistical methods for human genetics which deals with these four questions. The last two questions can only be answered if appropriate genetic markers available (Elston & Ann Spence. Stat Med 2006;25:3049-80).

1.3 Current approaches
GWAS
Linkage studies
Association studies
Genetic epidemiology

1.4 Linkage studies
• It is the study of cosegregation between genetic markers and putative disease loci, and has been very successful in localizing rare, Mendelian disorders but since has difficulty for traits which do not strictly follow Mendelian mode of inheritance, considerable linkage heterogeneity and it has limited resolution.
• It typically involves parametric (model-based) and nonparametric (model-free) methods, the latter most commonly refers to allele-sharing methods.
• The underlying concepts are nevertheless very important. It can still be useful in providing candidates for fine-mapping and association studies.
• With availability of whole genome data, it is possible to infer relationship or correlation between any individuals in a population.

1.5 Association studies
• They focus on association between particular allele and trait; it is only feasible with availability of dense markers.
• It has traditionally applied to both relatives in families and population sample. For the latter there has been serious concern over spurious association due to difference in allele frequencies between hidden sub-populations in a sample.
• A range of considerations has been made (Balding. Nat Rev Genet 2006;7:781-91) but the availability of whole genome data again refresh views including statistical examination of population substructure.

1.6 GWAS
• Any study of genetic variation across the entire human genomedesigned to identify genetic association with observable traits or the presence or absence of a disease, usually referring to studies with genetic marker density of 100,000 or more to represent a large proportion of variation in the human genome (Pearson & Manolio. JAMA 2008;299:1335-44), or simply … look for associations between DNA sequence variants and phenotypes of interest (Donnelly. Nature 2008; 456:728-31).
• The logic is associated with the so-called common disease common variant hypothesis (CD-CV). Common polymorphisms(MAF>1%) might contribute to susceptibility to common diseases, so that GWAS of common variants might be used to map loci contributing to common diseases. It therefore helps to catalog millions of common variants in the human population, massive genotypes to large number of individuals, and appropriate analytical framework (Altshuler et al. Science 2008; 322:881-888).
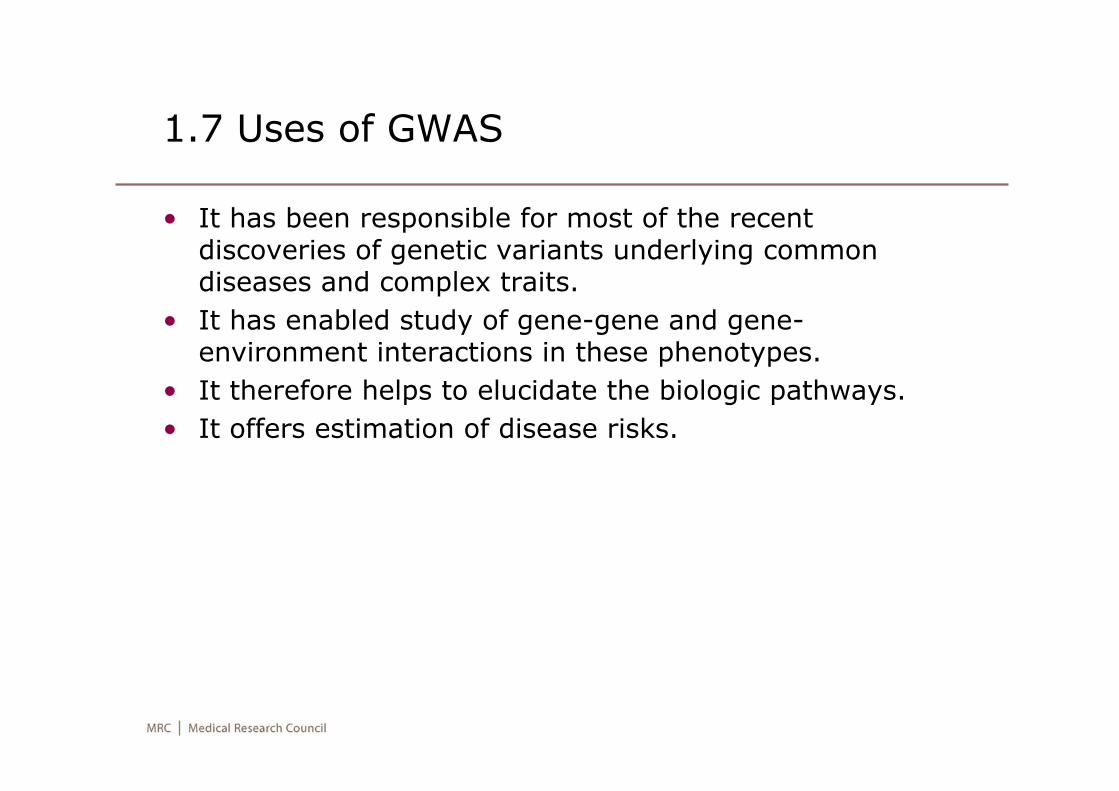
1.7 Uses of GWAS
• It has been responsible for most of the recent discoveries of genetic variants underlying common diseases and complex traits.
• It has enabled study of gene-gene and gene-environment interactions in these phenotypes.
• It therefore helps to elucidate the biologic pathways.• It offers estimation of disease risks.

1.8 Example: genetic epidemiology of obesity
• Obesity as public health issues• Definition of obesity• Pre-GWAS genetic study of obesity• GWAS of obesity
• FTO• MC4R• TMEM18, GNPDA2, SH2B1, MTCH2, KCTD15, NEGR1• More from the Genetic Investigation of
ANthropometric Traits (GIANT) consortium• Obesity-related anthropometric traits: height, waist
circumference.

2.1 Basic association testing
• Input: genotype, phenotype, map• For available SNP(s) do
• Extract appropriate per-SNP information (position, labels, etc) and per-individual genotypic and phenotypic information
• Code the genotype according to specific disease model (e.g., additive, dominant, recessive) at run-time
• Obtain quality control statistics• Perform association testing, e.g. under GLM
• End do• Typically, we can define the second allele at a SNP to be
effective.

2.2 Meta-analysis
• Consider two studies with sample sizes 32000 and 8000 both with p values 1e-8, we have a combined two-sided p value of 1.49e-14 but also yields p=4.89e-8 with p1=1e-4 and p2=1e-5.
• This is according to weighted z-score method and more results are available from metap in package gap.

2.3 Use of publicly available data
• Use of HapMap is now routine and an ongoing effort is the 1000 genomes project.
• The promotion of wider collaborations. One example is the database of Genotypes and Phenotypes (dbGaP, http://www.ncbi.nlm.nih.gov/sites/entrez?db=gap) to archive and distribute the results of studies that have investigated theinteraction of genotype and phenotype. Such studies include genome-wide association studies, medical sequencing, molecular diagnostic assays, as well as association between genotype and non-clinical traits. The advent of high-throughput, cost-effective methods for genotyping and sequencing has provided powerful tools that allow for the generation of the massive amount of genotypic data required to make these analyses possible.
• Genetic Analysis Workshops (GAWs) are organised every two years, see http://www.gaworkshop.org

2.4 Issues & challenges
• Handling of large data including external data. A typical GWAS can have ~0.5 million SNPs which can be extended to include imputed data based on publicly available data such as HapMap, so that a typical GWAS has ~2.5 million SNPs.
• Multiple testing adjustment. It is difficult since the number of true signals is expected to be low – which is different from the kind of situations in gene expression studies. A major remedy has been meta-analysis and replication in large consortia.
• A need of deeper understanding beyond the basic association testing, e.g., biology and the nature-nurture interplay.

3.1 R in the general context
• R offers more analytical methods because it is up-to-date.
• R is flexible in types of data without the need to merge them.
• R has its own and more powerful language and its procedures are open to modify. It has full matrix capabilities. It has provided many sample datasets which help with learning to use.
• R has a flexible and high-quality graphical facility. • R runs on Mac OS, Windows, Linux/Unix.• R is free and evolving that can be relied on for years.
• Muenchen RA. R for SAS and SPSS Users, Springer 2009.

3.2 R for genetic data
• The reliance and complacency among geneticists on standalone applications, e.g., a survey of Salem et al. Hum Genomics 2005; 2:39-66 revealed several dozens of haplotype analysis programs, Excoffier & Heckel. Nat Rev Genet 2006; 7:745-58 provided a lengthy survival guide for population genetics data analysis.
• There are many issues associated with their development and use, see Zhao & Tan. Hum Genomics 2006, 2:258-65. Essentially, R is in line with many features of the Linux system for application and development. It enables easy use of codes for genetic data in C/Fortran/Pascal, etc, and facilitates collaborations.

3.3 Work in the R environment
• A summary is available from the CRAN task view.• Elementary packages of linkage and association at
CRAN: genetics, haplo.stats (haplo.ccs, hapassoc), gap, identity, pedigree, hwde, multic, LDheatmap.
• Packages for GWAS: SNPassoc, snpMatrix, GenABEL, pbatR.
• Packages at BioConductor, an open source and open development software project for the analysis and comprehension of genomic data.
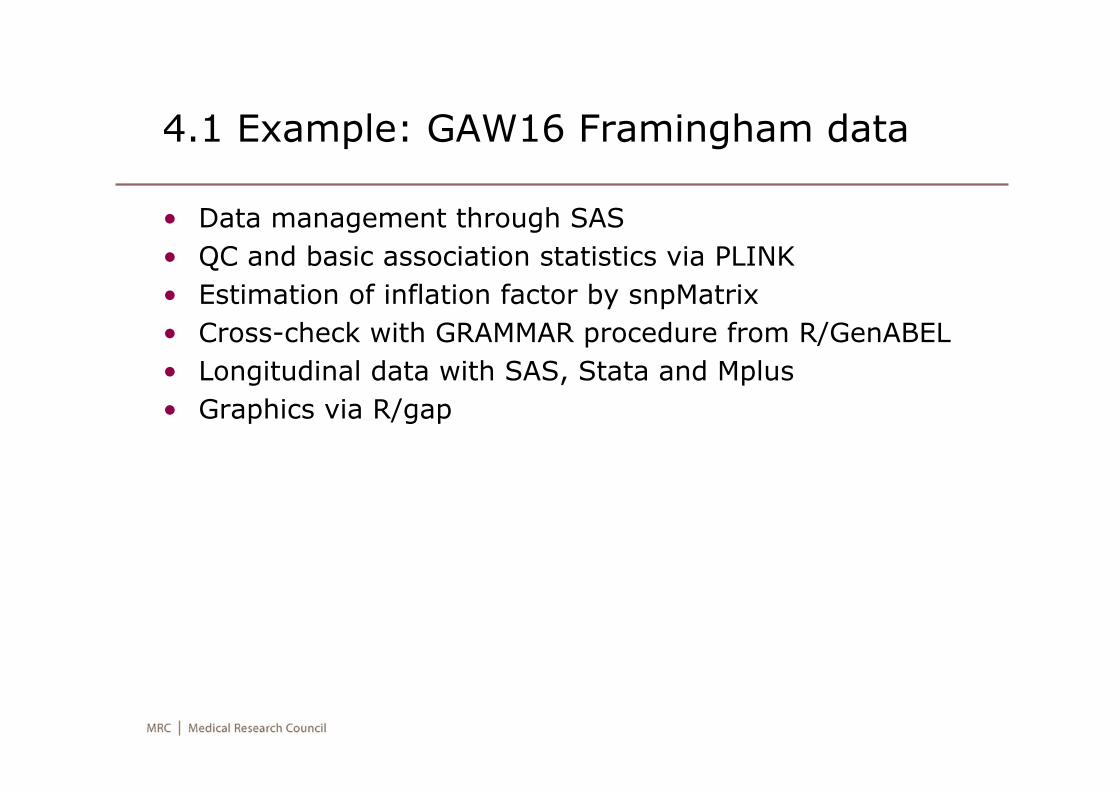
4.1 Example: GAW16 Framingham data
• Data management through SAS• QC and basic association statistics via PLINK• Estimation of inflation factor by snpMatrix• Cross-check with GRAMMAR procedure from R/GenABEL• Longitudinal data with SAS, Stata and Mplus• Graphics via R/gap

4.2 GenABEL: data input
library(GenABEL)# this is an example of Framingham data for GAW16convert.snp.tped(tped = "chrall.tped", tfam =
"pheno.tfam", out = "chrall.raw", strand = "+")df <- load.gwaa.data(phe = "pheno.dat", gen =
"chrall.raw", force = TRUE)
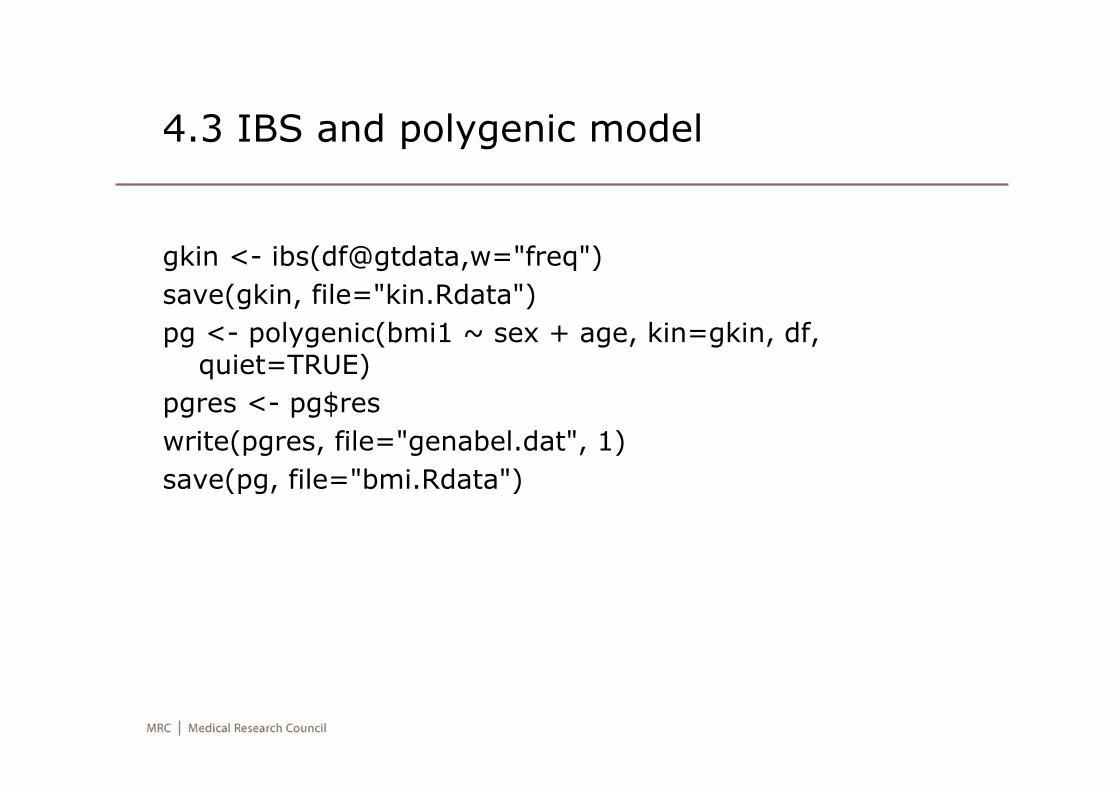
4.3 IBS and polygenic model
gkin <- ibs(df@gtdata,w="freq")save(gkin, file="kin.Rdata")pg <- polygenic(bmi1 ~ sex + age, kin=gkin, df,
quiet=TRUE)pgres <- pg$reswrite(pgres, file="genabel.dat", 1)save(pg, file="bmi.Rdata")

4.4 Q-Q plot of the original p values

4.5 Results with genomic control (λ=1.425)
Q-Q plot
Manhattan plot

5.1 A short summary
• GWAS is more useful than candidate gene alone by providing prior information of test statistics as shown with the Framingham data.
• GWAS goes beyond candidate gene studies in that it allows for analyses of a variety of traits.
• As with R, • Predominant use of R for genetic data in general is
yet to expect but undergoes a steady increase.• The general appeals lie in graphical representation,
validated and improved algorithm and availability of advanced statistical techniques.
• Concerted efforts exist under the R environment which is not covered here.
5.2 References
• Foulkes AS. Applied Statistical Genetics with R for Population-based Association Studies. Springer 2009
• Gentleman R, V Carey, W Huber, R Irizarry, S Dudoit. Bioinformatics and Computational Biology Solutions Using R and Bioconductor. Springer 2005
• Siegmund D, B Yakir. The Statistics of Gene Mapping. Springer 2007
• Wu R, C-X Ma, G Casella. Statistical Genetics of Quantitative Traits-Linkage, Maps and QTL. Springer 2007
• Zhao JH. Genome-wide Association Studies, tutorial given at UseR!2009. Presentation and codes are available from http://www.mrc-epid.cam.ac.uk/~jinghua.zhao/notes/useR2009