Embed Size (px)
Citation preview
27 THE LEADING EDGE January 2018 Special Section: Advancements in 3D seismic processing
Use of prestack depth migration for improving the accuracy of horizontal drilling in unconventional reservoirs
AbstractDepth imaging has long been a staple in offshore processing
sequences; however, conventional wisdom often dictates that prestack depth migration is unnecessary in the onshore, geologically benign settings encountered in most unconventional shale reser-voirs. Using examples from the Anadarko Basin, we demonstrate that careful depth imaging using updated processing flows yields significant benefits when compared to time imaging.
IntroductionPrestack depth migration (PSDM) is typically aimed at improv-
ing image quality in areas of complex geology, such as below salt or faults, and has traditionally been applied only in the presence of such challenges. Exploring and producing unconventional reservoirs generates different challenges. We are required to formulate lateral drilling paths along thin, often less than 30 ft thick intervals, at a typical depth of 8000–12,000 ft. Prestack time migrated (PSTM) data are routinely used for interpretation, prospect generation, and well planning of unconventional plays. In many onshore U.S. basins, the general geology of unconventional plays consists of near-flat layers, but the velocity and anisotropy within these layers can vary laterally. PSTM based on hyperbolic assumptions is limited in its ability to accurately image geologic units with rapid lateral or vertical velocity changes. These limitations lead to inferior images. If stretched from time to depth, the existing errors will be carried over to the depth domain. Also, the historical use of vertical stretching to transform seismic data from time to depth in cases of benign geology lacks the lateral correction needed when converting data from time to depth. As a result, the depth registration will be incorrect, and the thickness of certain reservoir units will also be incorrect.
PSDM can do more than image complex structure and help resolve illumination issues. PSDM is the most accurate way (if not the only way) to correctly convert seismic data from recorded time to imaged depth. This opens a new frontier in the application of PSDM, assisting in the planning of horizontal drilling for unconventional, structurally benign plays. For horizontal drilling, the resolution needed for accurate well placement is much higher than that needed in conventional drilling. To address this new challenge, PSDM must be applied using a different set of work-flows. Until recently, PSDM using optimal parameterization was prohibitively expensive, and the resulting images were band limited. Today, with more powerful computer hardware and more advanced and accurate algorithms, PSDM can be performed with optimal parameterization. As a result, the PSDM data will be of higher quality, preserving higher frequencies and with similar character to PSTM. Unlike PSTM, PSDM takes geology into account by using a geologically meaningful model. Application of PSDM using a smooth model will result in an image similar
Marianne Rauch-Davies1, Scott Sutherland1, Michael Bradshaw2, Jeff Codd2, and David Kessler2
to PSTM. The key to generating a correct PSDM image is the construction and use of an appropriate earth model.
In this publication, we describe the revised workflow that will allow depth-domain model building and PSDM to be used successfully in seismic data imaging for the exploration and development of unconventional plays.
Processing challengesTime processing has limitations that cannot be overcome. Many
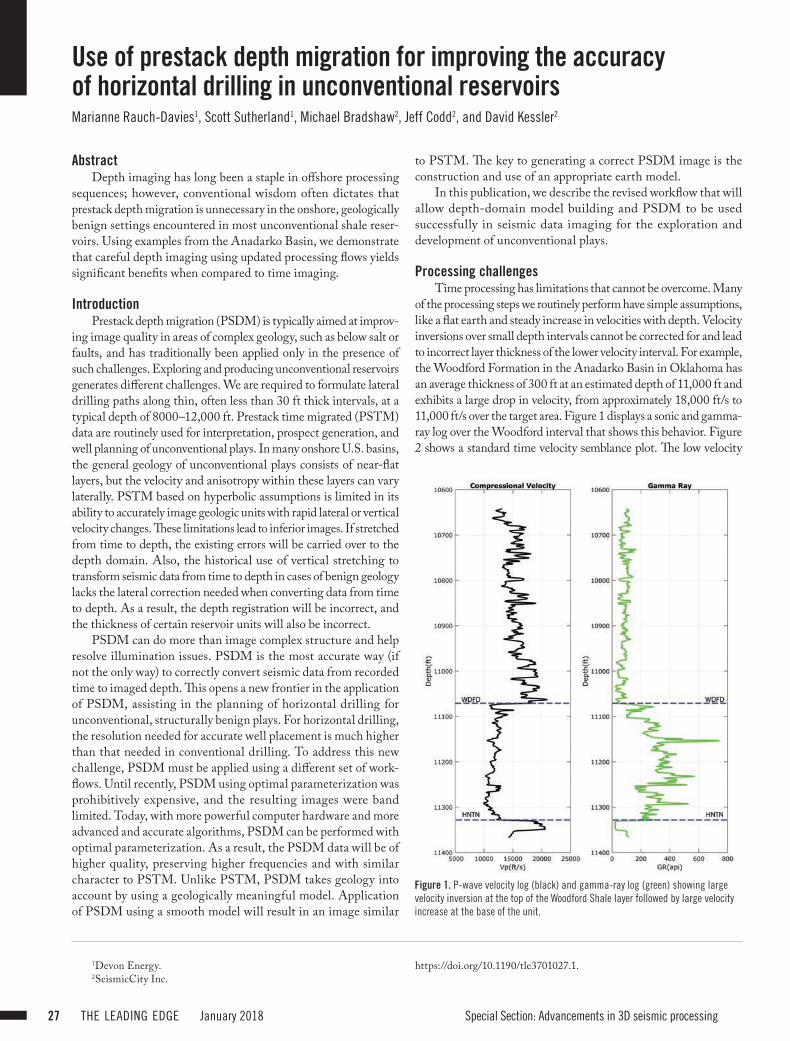
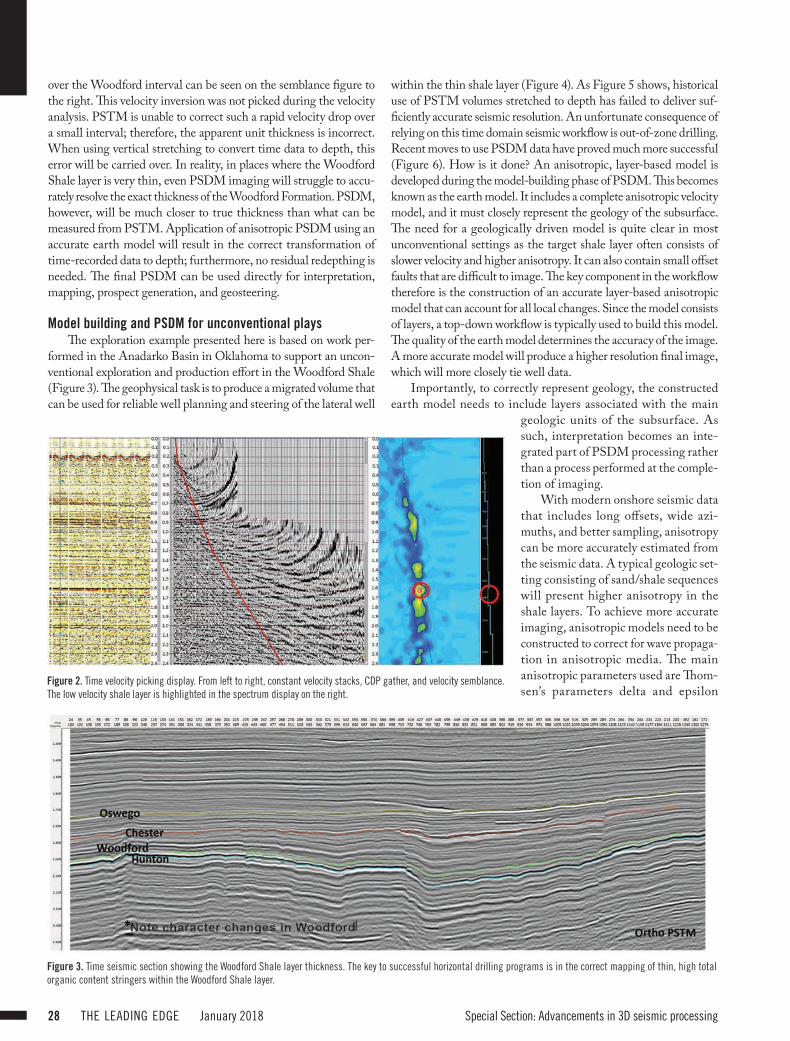
of the processing steps we routinely perform have simple assumptions, like a flat earth and steady increase in velocities with depth. Velocity inversions over small depth intervals cannot be corrected for and lead to incorrect layer thickness of the lower velocity interval. For example, the Woodford Formation in the Anadarko Basin in Oklahoma has an average thickness of 300 ft at an estimated depth of 11,000 ft and exhibits a large drop in velocity, from approximately 18,000 ft/s to 11,000 ft/s over the target area. Figure 1 displays a sonic and gamma-ray log over the Woodford interval that shows this behavior. Figure 2 shows a standard time velocity semblance plot. The low velocity
1Devon Energy.2SeismicCity Inc.
https://doi.org/10.1190/tle3701027.1.
Figure 1. P-wave velocity log (black) and gamma-ray log (green) showing large velocity inversion at the top of the Woodford Shale layer followed by large velocity increase at the base of the unit.
28 THE LEADING EDGE January 2018 Special Section: Advancements in 3D seismic processing
over the Woodford interval can be seen on the semblance figure to the right. This velocity inversion was not picked during the velocity analysis. PSTM is unable to correct such a rapid velocity drop over a small interval; therefore, the apparent unit thickness is incorrect. When using vertical stretching to convert time data to depth, this error will be carried over. In reality, in places where the Woodford Shale layer is very thin, even PSDM imaging will struggle to accu-rately resolve the exact thickness of the Woodford Formation. PSDM, however, will be much closer to true thickness than what can be measured from PSTM. Application of anisotropic PSDM using an accurate earth model will result in the correct transformation of time-recorded data to depth; furthermore, no residual redepthing is needed. The final PSDM can be used directly for interpretation, mapping, prospect generation, and geosteering.
Model building and PSDM for unconventional playsThe exploration example presented here is based on work per-
formed in the Anadarko Basin in Oklahoma to support an uncon-ventional exploration and production effort in the Woodford Shale (Figure 3). The geophysical task is to produce a migrated volume that can be used for reliable well planning and steering of the lateral well
within the thin shale layer (Figure 4). As Figure 5 shows, historical use of PSTM volumes stretched to depth has failed to deliver suf-ficiently accurate seismic resolution. An unfortunate consequence of relying on this time domain seismic workflow is out-of-zone drilling. Recent moves to use PSDM data have proved much more successful (Figure 6). How is it done? An anisotropic, layer-based model is developed during the model-building phase of PSDM. This becomes known as the earth model. It includes a complete anisotropic velocity model, and it must closely represent the geology of the subsurface. The need for a geologically driven model is quite clear in most unconventional settings as the target shale layer often consists of slower velocity and higher anisotropy. It can also contain small offset faults that are difficult to image. The key component in the workflow therefore is the construction of an accurate layer-based anisotropic model that can account for all local changes. Since the model consists of layers, a top-down workflow is typically used to build this model. The quality of the earth model determines the accuracy of the image. A more accurate model will produce a higher resolution final image, which will more closely tie well data.
Importantly, to correctly represent geology, the constructed earth model needs to include layers associated with the main
geologic units of the subsurface. As such, interpretation becomes an inte-grated part of PSDM processing rather than a process performed at the comple-tion of imaging.
With modern onshore seismic data that includes long offsets, wide azi-muths, and better sampling, anisotropy can be more accurately estimated from the seismic data. A typical geologic set-ting consisting of sand/shale sequences will present higher anisotropy in the shale layers. To achieve more accurate imaging, anisotropic models need to be constructed to correct for wave propaga-tion in anisotropic media. The main anisotropic parameters used are Thom-sen’s parameters delta and epsilon
Figure 2. Time velocity picking display. From left to right, constant velocity stacks, CDP gather, and velocity semblance. The low velocity shale layer is highlighted in the spectrum display on the right.
Figure 3. Time seismic section showing the Woodford Shale layer thickness. The key to successful horizontal drilling programs is in the correct mapping of thin, high total organic content stringers within the Woodford Shale layer.
January 2018 THE LEADING EDGE 29Special Section: Advancements in 3D seismic processing
(Thomsen, 1986). In the presence of dipping beds, the axis of anisotropy is added. Epsilon defines the difference in the speed that waves travel horizontally and laterally, and delta defines the rate of change of velocity. The use of anisotropic models and PSDM enables us to generate flat image gathers, which produce a final PSDM stack volume where the vertical and horizontal positioning of the seismic events is accurate. A further benefit of this process is the preservation of higher frequencies and therefore higher resolution. This is especially important in unconventional drilling as the lateral drilling intervals are often only 30–40 ft thick at depths of 8000–10,000 ft.
The availability of new wide-azimuth data has enabled a major change in the way PSTM and PSDM gathers are processed by moving from offset (or angle) to offset/azimuth gathers. Today we generate multiple azimuth gathers for each output common-depth-point (CDP) location. The use of multiple azimuths greatly enhances velocity estimation tools such as reflection tomography and further enables us to detect azimuthally dependent variations in velocity and anisotropic parameters. Due to the heterogeneity of the earth, seismic waves propagate with different velocities in different azimuth directions. If this is not addressed during imaging, the resulting common offset, varying azimuth (COVA)
gathers display characteristic sinusoidal behavior. For gather events to be located at the correct depth as well as spatial location, all events imaged on COVA gathers need to be flattened. If residual moveout remains, the resulting image will suffer from loss of frequency/resolution and the mis-tie between well data and seismic horizons will be larger.
The ability to generate accurate velocity and anisotropic fields has dramatically increased with the move to an azimuth-dependent tomographic inversion. This significantly improves the reliability of velocity and anisotropic fields by accounting for the heterogene-ity present in most organic shale intervals. Modern PSDM utilizes a full-azimuth tomographic solution to optimize the necessary velocity and anisotropic fields.
As PSDM is used for both imaging and accurate time-to-depth conversion, the final PSDM data must match all available well data as closely as possible. This should be done by adding complex-ity to the anisotropic model rather than forcing a local match. To achieve optimal seismic-to-well ties, further detailed velocity (and anisotropy) analysis needs to be performed. This can be achieved using a modification of the input used for reflection tomography. In addition to measuring residual moveout on migrated gathers, the discrepancy between seismic data and well data can be mea-
sured and input to a tomographic inver-sion. This procedure will work best when the discrepancy between seismic data and well data has been minimized by previous iterations of tomography. Therefore, it is performed as a final step in the construction of the anisotropic model. The resulting model consists of much higher fidelity, and the discrep-ancy between well data and the imaged seismic is minimal. Special care has to be taken during this process not to violate the principal components of the model by forcing ties. The objective is to minimize the discrepancy between
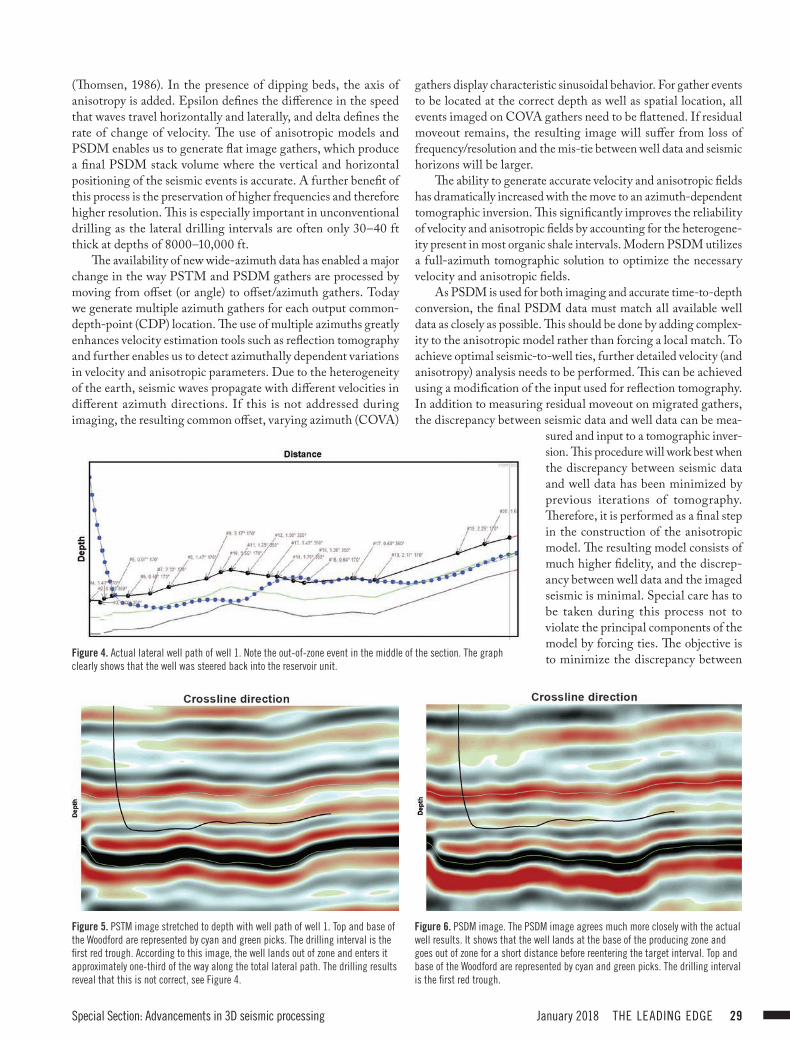
Figure 5. PSTM image stretched to depth with well path of well 1. Top and base of the Woodford are represented by cyan and green picks. The drilling interval is the first red trough. According to this image, the well lands out of zone and enters it approximately one-third of the way along the total lateral path. The drilling results reveal that this is not correct, see Figure 4.
Figure 6. PSDM image. The PSDM image agrees much more closely with the actual well results. It shows that the well lands at the base of the producing zone and goes out of zone for a short distance before reentering the target interval. Top and base of the Woodford are represented by cyan and green picks. The drilling interval is the first red trough.
Figure 4. Actual lateral well path of well 1. Note the out-of-zone event in the middle of the section. The graph clearly shows that the well was steered back into the reservoir unit.

30 THE LEADING EDGE January 2018 Special Section: Advancements in 3D seismic processing
seismic data and all well data available rather than force a local tie. This procedure enables us to generate the most reliable time-to-depth conversion mechanism and one that can be used reliably for lateral well-path planning.
Figure 7 shows an initial earth model and associated PSDM image derived using a long-offset, wide-azimuth 3D data set acquired in Oklahoma for exploration in the Woodford Shale (Rauch-Davies et al., 2016). The Woodford Formation has an average thickness of 300 ft at an approximate depth of 11,000 ft
and exhibits a large drop in velocity, from approximately 18,000 to 11,000 ft/s over the target area. PSTM is unable to correct for such a rapid velocity drop over an interval this small, and therefore the apparent unit thickness is incorrect. When using vertical stretching to convert the time data to depth, this error will be carried over to the depth domain. Figure 8 shows the final earth model and associated PSDM image. As Figure 8 demonstrates, the PSDM image accurately ties all provided formation tops.
Figure 8. Final layer-based velocity model and PSDM image. The PSDM volume closely ties all provided well data.
Figure 7. Initial velocity model and PSDM image.
January 2018 THE LEADING EDGE 31Special Section: Advancements in 3D seismic processing
Depth imaging and computation of rock properties
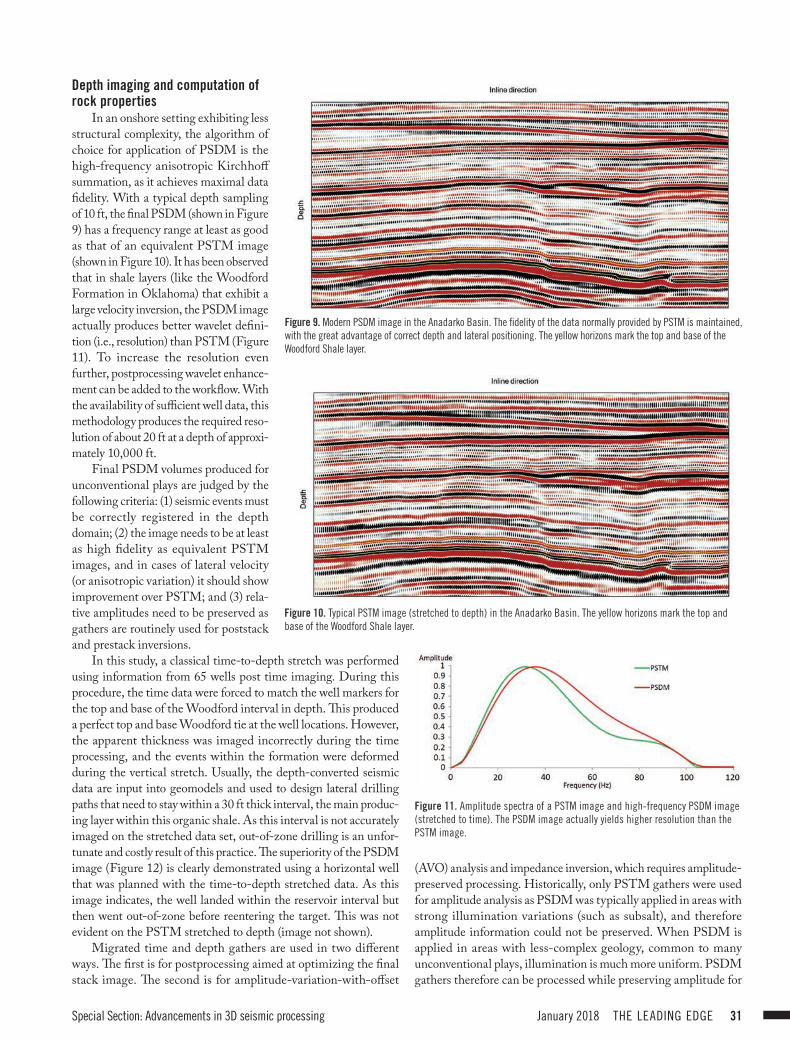
In an onshore setting exhibiting less structural complexity, the algorithm of choice for application of PSDM is the high-frequency anisotropic Kirchhoff summation, as it achieves maximal data fidelity. With a typical depth sampling of 10 ft, the final PSDM (shown in Figure 9) has a frequency range at least as good as that of an equivalent PSTM image (shown in Figure 10). It has been observed that in shale layers (like the Woodford Formation in Oklahoma) that exhibit a large velocity inversion, the PSDM image actually produces better wavelet defini-tion (i.e., resolution) than PSTM (Figure 11). To increase the resolution even further, postprocessing wavelet enhance-ment can be added to the workflow. With the availability of sufficient well data, this methodology produces the required reso-lution of about 20 ft at a depth of approxi-mately 10,000 ft.
Final PSDM volumes produced for unconventional plays are judged by the following criteria: (1) seismic events must be correctly registered in the depth domain; (2) the image needs to be at least as high fidelity as equivalent PSTM images, and in cases of lateral velocity (or anisotropic variation) it should show improvement over PSTM; and (3) rela-tive amplitudes need to be preserved as gathers are routinely used for poststack and prestack inversions.
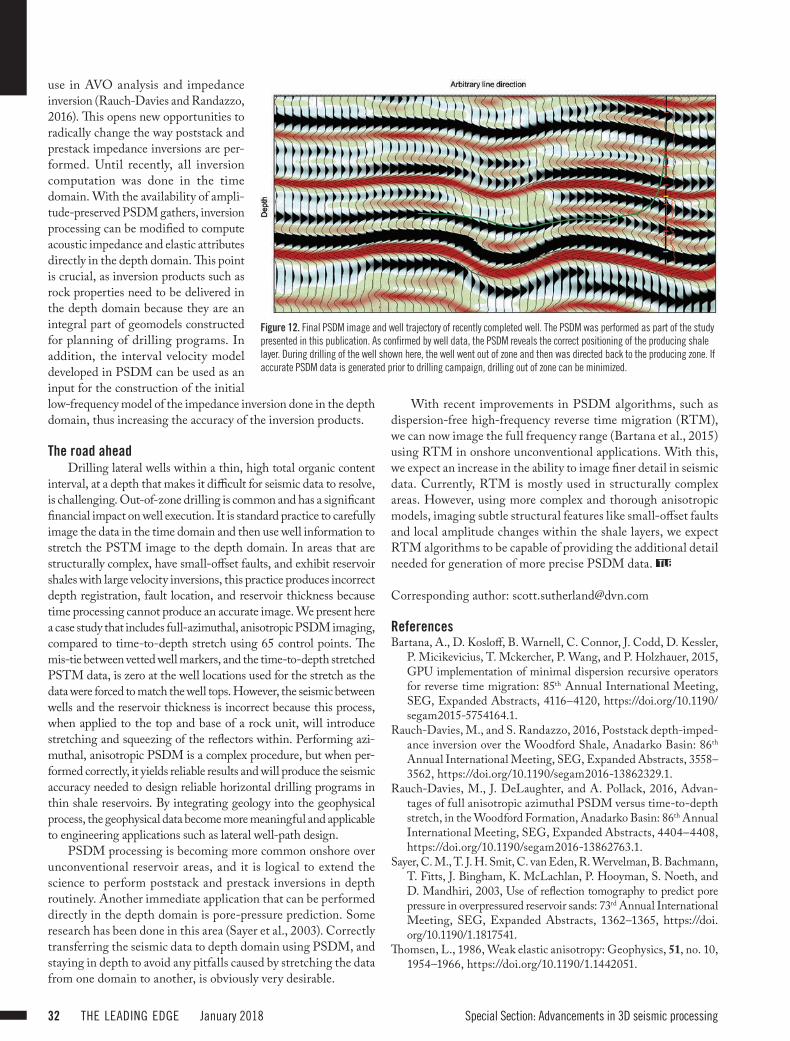
In this study, a classical time-to-depth stretch was performed using information from 65 wells post time imaging. During this procedure, the time data were forced to match the well markers for the top and base of the Woodford interval in depth. This produced a perfect top and base Woodford tie at the well locations. However, the apparent thickness was imaged incorrectly during the time processing, and the events within the formation were deformed during the vertical stretch. Usually, the depth-converted seismic data are input into geomodels and used to design lateral drilling paths that need to stay within a 30 ft thick interval, the main produc-ing layer within this organic shale. As this interval is not accurately imaged on the stretched data set, out-of-zone drilling is an unfor-tunate and costly result of this practice. The superiority of the PSDM image (Figure 12) is clearly demonstrated using a horizontal well that was planned with the time-to-depth stretched data. As this image indicates, the well landed within the reservoir interval but then went out-of-zone before reentering the target. This was not evident on the PSTM stretched to depth (image not shown).
Migrated time and depth gathers are used in two different ways. The first is for postprocessing aimed at optimizing the final stack image. The second is for amplitude-variation-with-offset
(AVO) analysis and impedance inversion, which requires amplitude-preserved processing. Historically, only PSTM gathers were used for amplitude analysis as PSDM was typically applied in areas with strong illumination variations (such as subsalt), and therefore amplitude information could not be preserved. When PSDM is applied in areas with less-complex geology, common to many unconventional plays, illumination is much more uniform. PSDM gathers therefore can be processed while preserving amplitude for
Figure 9. Modern PSDM image in the Anadarko Basin. The fidelity of the data normally provided by PSTM is maintained, with the great advantage of correct depth and lateral positioning. The yellow horizons mark the top and base of the Woodford Shale layer.
Figure 10. Typical PSTM image (stretched to depth) in the Anadarko Basin. The yellow horizons mark the top and base of the Woodford Shale layer.
Figure 11. Amplitude spectra of a PSTM image and high-frequency PSDM image (stretched to time). The PSDM image actually yields higher resolution than the PSTM image.
32 THE LEADING EDGE January 2018 Special Section: Advancements in 3D seismic processing
use in AVO analysis and impedance inversion (Rauch-Davies and Randazzo, 2016). This opens new opportunities to radically change the way poststack and prestack impedance inversions are per-formed. Until recently, all inversion computation was done in the time domain. With the availability of ampli-tude-preserved PSDM gathers, inversion processing can be modified to compute acoustic impedance and elastic attributes directly in the depth domain. This point is crucial, as inversion products such as rock properties need to be delivered in the depth domain because they are an integral part of geomodels constructed for planning of drilling programs. In addition, the interval velocity model developed in PSDM can be used as an input for the construction of the initial low-frequency model of the impedance inversion done in the depth domain, thus increasing the accuracy of the inversion products.
The road aheadDrilling lateral wells within a thin, high total organic content
interval, at a depth that makes it difficult for seismic data to resolve, is challenging. Out-of-zone drilling is common and has a significant financial impact on well execution. It is standard practice to carefully image the data in the time domain and then use well information to stretch the PSTM image to the depth domain. In areas that are structurally complex, have small-offset faults, and exhibit reservoir shales with large velocity inversions, this practice produces incorrect depth registration, fault location, and reservoir thickness because time processing cannot produce an accurate image. We present here a case study that includes full-azimuthal, anisotropic PSDM imaging, compared to time-to-depth stretch using 65 control points. The mis-tie between vetted well markers, and the time-to-depth stretched PSTM data, is zero at the well locations used for the stretch as the data were forced to match the well tops. However, the seismic between wells and the reservoir thickness is incorrect because this process, when applied to the top and base of a rock unit, will introduce stretching and squeezing of the reflectors within. Performing azi-muthal, anisotropic PSDM is a complex procedure, but when per-formed correctly, it yields reliable results and will produce the seismic accuracy needed to design reliable horizontal drilling programs in thin shale reservoirs. By integrating geology into the geophysical process, the geophysical data become more meaningful and applicable to engineering applications such as lateral well-path design.
PSDM processing is becoming more common onshore over unconventional reservoir areas, and it is logical to extend the science to perform poststack and prestack inversions in depth routinely. Another immediate application that can be performed directly in the depth domain is pore-pressure prediction. Some research has been done in this area (Sayer et al., 2003). Correctly transferring the seismic data to depth domain using PSDM, and staying in depth to avoid any pitfalls caused by stretching the data from one domain to another, is obviously very desirable.
With recent improvements in PSDM algorithms, such as dispersion-free high-frequency reverse time migration (RTM), we can now image the full frequency range (Bartana et al., 2015) using RTM in onshore unconventional applications. With this, we expect an increase in the ability to image finer detail in seismic data. Currently, RTM is mostly used in structurally complex areas. However, using more complex and thorough anisotropic models, imaging subtle structural features like small-offset faults and local amplitude changes within the shale layers, we expect RTM algorithms to be capable of providing the additional detail needed for generation of more precise PSDM data.
Corresponding author: [email protected]
ReferencesBartana, A., D. Kosloff, B. Warnell, C. Connor, J. Codd, D. Kessler,
P. Micikevicius, T. Mckercher, P. Wang, and P. Holzhauer, 2015, GPU implementation of minimal dispersion recursive operators for reverse time migration: 85th Annual International Meeting, SEG, Expanded Abstracts, 4116–4120, https://doi.org/10.1190/segam2015-5754164.1.
Rauch-Davies, M., and S. Randazzo, 2016, Poststack depth-imped-ance inversion over the Woodford Shale, Anadarko Basin: 86th Annual International Meeting, SEG, Expanded Abstracts, 3558–3562, https://doi.org/10.1190/segam2016-13862329.1.
Rauch-Davies, M., J. DeLaughter, and A. Pollack, 2016, Advan-tages of full anisotropic azimuthal PSDM versus time-to-depth stretch, in the Woodford Formation, Anadarko Basin: 86th Annual International Meeting, SEG, Expanded Abstracts, 4404–4408, https://doi.org/10.1190/segam2016-13862763.1.
Sayer, C. M., T. J. H. Smit, C. van Eden, R. Wervelman, B. Bachmann, T. Fitts, J. Bingham, K. McLachlan, P. Hooyman, S. Noeth, and D. Mandhiri, 2003, Use of reflection tomography to predict pore pressure in overpressured reservoir sands: 73rd Annual International Meeting, SEG, Expanded Abstracts, 1362–1365, https://doi.org/10.1190/1.1817541.
Thomsen, L., 1986, Weak elastic anisotropy: Geophysics, 51, no. 10, 1954–1966, https://doi.org/10.1190/1.1442051.
Figure 12. Final PSDM image and well trajectory of recently completed well. The PSDM was performed as part of the study presented in this publication. As confirmed by well data, the PSDM reveals the correct positioning of the producing shale layer. During drilling of the well shown here, the well went out of zone and then was directed back to the producing zone. If accurate PSDM data is generated prior to drilling campaign, drilling out of zone can be minimized.