Embed Size (px)
Citation preview

Use of merchandise statistics for Use of merchandise statistics for informed trade policymakinginformed trade policymaking
Presentation at the Workshop on the Revision of the recommendations on IMTS
Bangkok, 9 Sep 2008
Mia MikicTrade Policy Section
Trade and Investment [email protected]
www.unescap.org/tid/aptiad
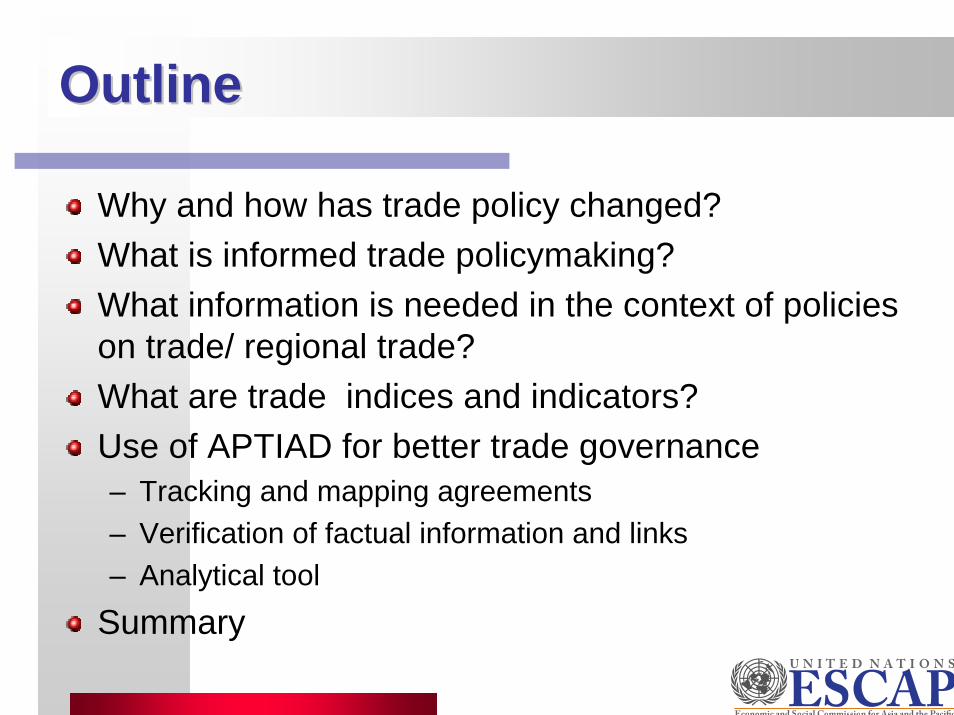
OutlineOutline
Why and how has trade policy changed?What is informed trade policymaking?What information is needed in the context of policies on trade/ regional trade?What are trade indices and indicators?Use of APTIAD for better trade governance– Tracking and mapping agreements– Verification of factual information and links– Analytical tool
Summary
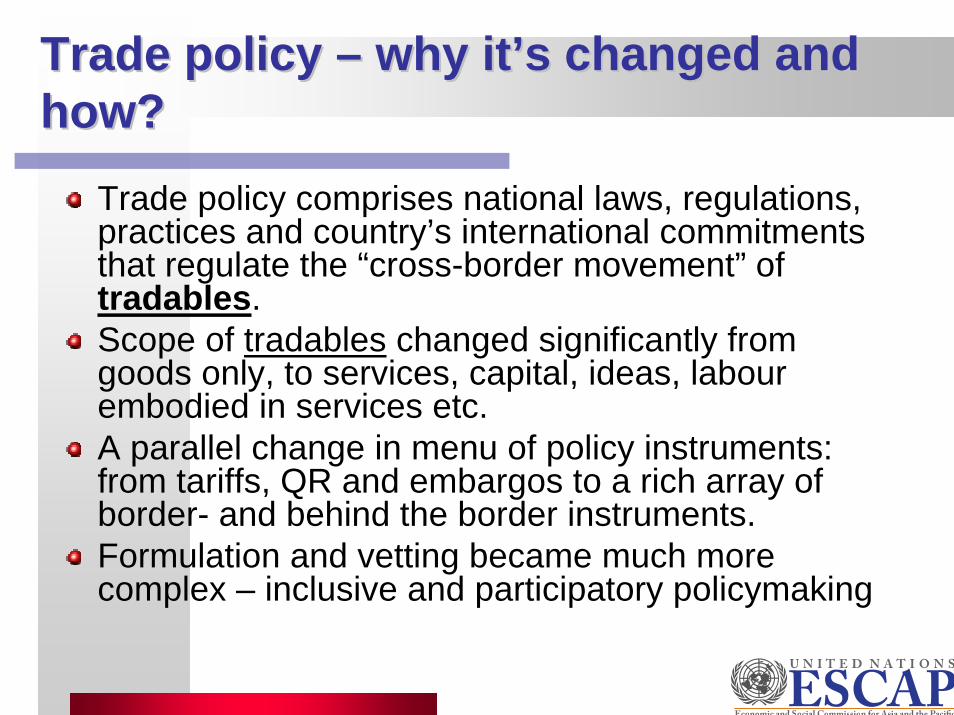
Trade policy Trade policy –– why itwhy it’’s changed and s changed and how?how?
Trade policy comprises national laws, regulations, practices and country’s international commitments that regulate the “cross-border movement” of tradables.Scope of tradables changed significantly from goods only, to services, capital, ideas, labour embodied in services etc. A parallel change in menu of policy instruments: from tariffs, QR and embargos to a rich array of border- and behind the border instruments.Formulation and vetting became much more complex – inclusive and participatory policymaking
Informed trade policymakingInformed trade policymaking
Using statistical and other techniques in obtaining sound and transparent data to be used in the consultative process between government and other stakeholders in any area of public policymakingOften down to tracking, monitoring and evaluation of the results of policies that have been put in placeAllows for democratization of policymaking, especially in trade area, where impacts always cause some income-distributional effects
Sample of issues facing Sample of issues facing policymakerspolicymakers
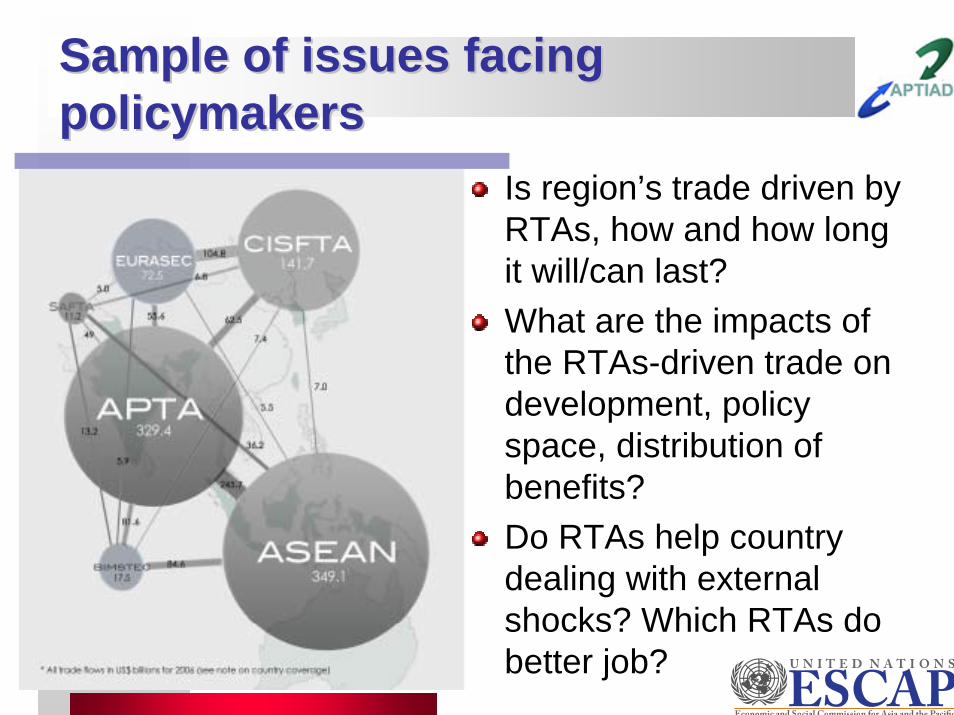
Is region’s trade driven by RTAs, how and how long it will/can last?What are the impacts of the RTAs-driven trade on development, policy space, distribution of benefits?Do RTAs help country dealing with external shocks? Which RTAs do better job?

What information is neededWhat information is needed
Statistical data on– Domestic economy (production structure,
employment, consumption, prices etc)– Commodity /merchandise trade data
(imports/exports):Disaggregated and total bilateral flows
– Services trade (imports/exports)– FDI (flows, stocks); by source/destination and
sector– Movements of people/labour
Terms of trade / unit valuesTariffs, non-tariff barriers, behind the border barriersInternational commitments

Reliability and availability of dataReliability and availability of dataTrade statistics not very reliable due to – Not complete (smuggling, non-reporting, mistakes)– Imports for re-exports and re-exports included– Value of export (international conventions for
reporting trade stats not adhered to)– No coverage for services– Problems of classification– Exchange rates – Measurements– Errors…
Availability – non-reporting, break in series, classification inconsistency, etc

Trade indices and indicatorsTrade indices and indicators
Trade indicators are second-level data combining two or more variables into one meaningful measure.The objective of trade indicators is to highlight characteristics of trade patterns and trade developments with a view of contributing to assessment of trade competitiveness
Trade performance indicators can Trade performance indicators can provide insights into:provide insights into:
How much is a country dependent on a regional trade?How intense is trade with regional partners?Are regional trading partner’s exports becoming more similar (more competitive) or more complementary?Is there geographical re-orientation of export after some external shock?How to identify natural trading partners?Is intra-industry trade increasing in aftermath of PTA?Etc….

……availability of indicatorsavailability of indicators
Many “off the shelf” (“over the counter”)
To properly use them it is useful to know how are they constructed, what influences their values, what data to use, where to find data …Get inspiration on constructing new indicators!
DatabasesDatabases
UN COMTRADEITC Market Analysis Tools (www.intracen.org/mat) World Bank World Trade Indicators (www.worldbank.org/wti2007)

APTIAD and its uses of trade APTIAD and its uses of trade statistics and indicatorsstatistics and indicators
Source of information for– Mapping of agreements and regional trade
landscape– Factual data and descriptive information on
MembershipDuration of negotiationNotification and WTO consideration processContents of agreements in areas of liberalization of trade in goods, services, trade facilitation, other areas and rules of origin
Glossary

Mapping PTAs*Mapping PTAs*
PTA93
(12P)
BTA66
(8P)
Country-bloc
14 (2P)
RTA13
(2P)
FTA54
FA7
PTA (PC)
5
FTA5
FA8
CU1
FTA5
FA3
CU 1 and PTA
(PC)4
GSTP
*Coverage: PTAs in force (pending ratification in brackets)
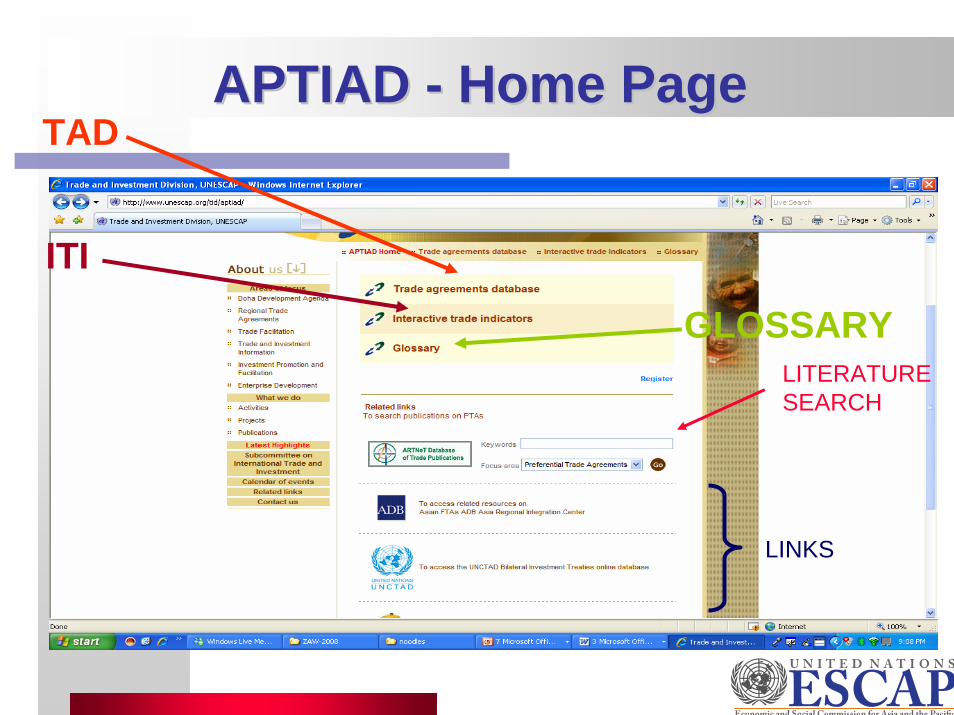
APTIAD APTIAD -- Home PageHome PageTAD
ITI
GLOSSARYLITERATURESEARCH
LINKS

Trade Agreements Database Trade Agreements Database -- TADTAD
SEARCH by differentCRITERIA
DownloadPDF, excel or word
Scroll136
PTAs
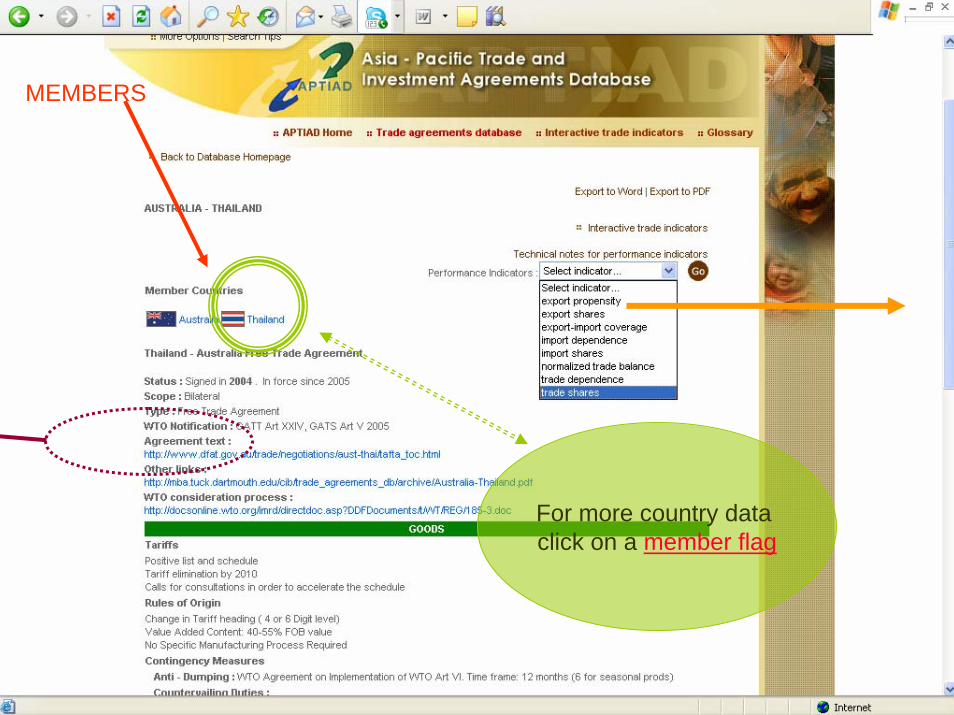
MEMBERS
For more country data click on a member flag
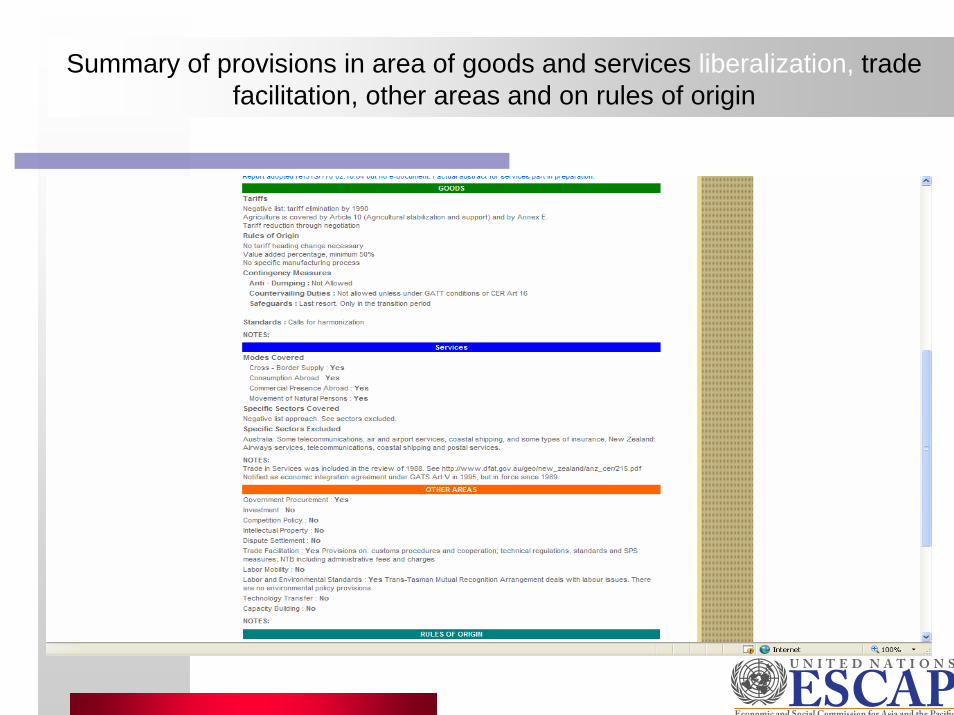
Summary of provisions in area of goods and services liberalization, trade facilitation, other areas and on rules of origin

Glossary is extended oftenGlossary is extended often
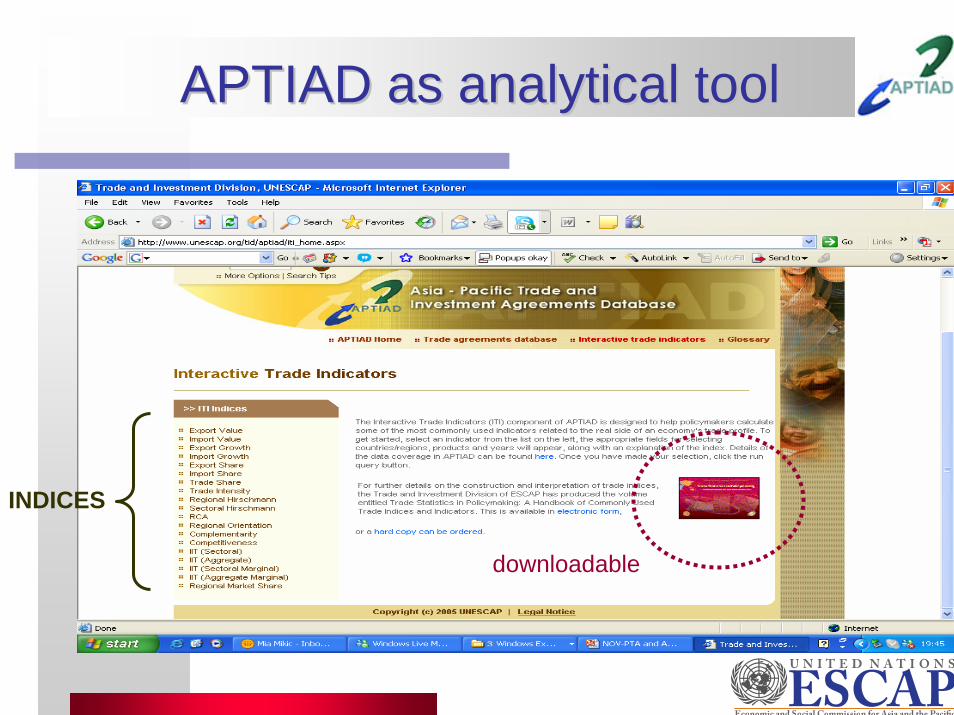
APTIAD as analytical toolAPTIAD as analytical tool
INDICES
downloadable
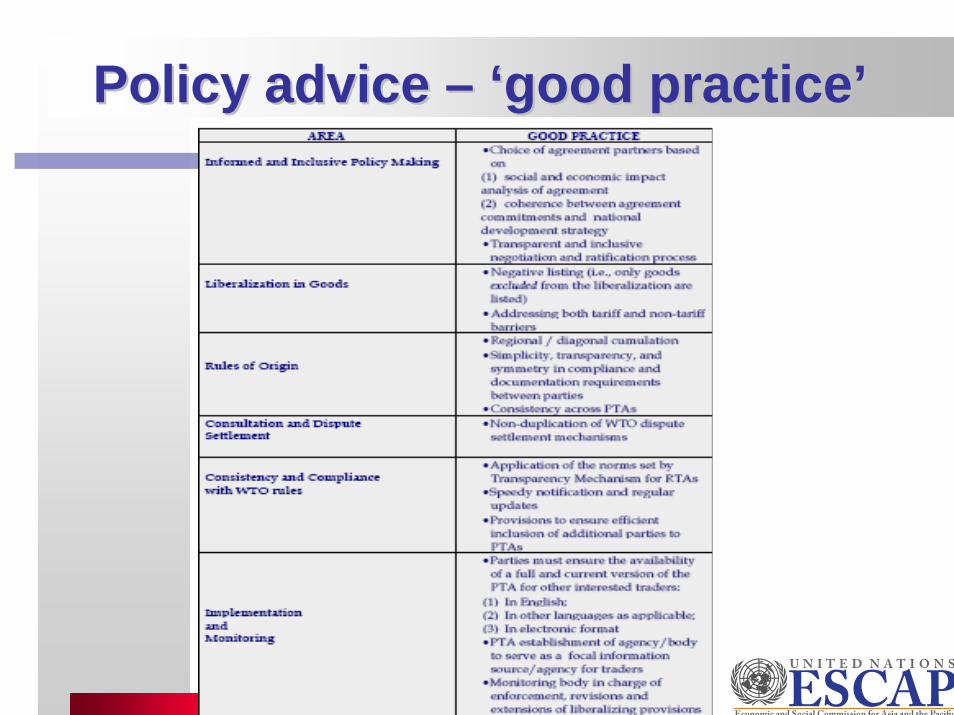
Policy advice Policy advice –– ‘‘good practicegood practice’’

SummarySummary
Trade needs to be governed to produce equitable benefits to all This task requires information and dataAPTIAD provides factual information and can be used to calculate trade performance indicatorsNEXT STEPS IN APTIAD:– more details on trade facilitation, investment and services
liberalization– (links on) data on preferential tariffs (and NTBs)– more frequent update of statistical data– simulations