Embed Size (px)
Citation preview

ISSN 1808-057X
R. Cont. Fin. – USP, São Paulo, v. 29, n. 78, p. 343-354, set./dez. 2018 343
DOI: 10.1590/1808-057x201805970
*The authors would like to thank the editors and anonymous reviewers for the relevant contributions, as well as Professor Ricardo Malagueño.
Original Article
Use of management reports and performance of sales managers in an insurance company*José Carlos Tiomatsu Oyadomari1,2
https://orcid.org/0000-0003-3059-3102Email: [email protected]
Bruno Duque1
https://orcid.org/0000-0002-0622-5572Email: [email protected]
Edelcio Koitiro Nisiyama3
https://orcid.org/0000-0002-6335-6085Email: [email protected]
Ronaldo Gomes Dultra-de-Lima1
https://orcid.org/0000-0001-8009-0963Email: [email protected]
Octavio Ribeiro de Mendonça Neto1
https://orcid.org/0000-0002-6123-6733Email: [email protected]
¹Universidade Presbiteriana Mackenzie, Programa de Pós-Graduação em Controladoria e Finanças Empresariais, São Paulo, SP, Brazil2Insper, Graduação em Administração, São Paulo, SP, Brazil3Insper, Programa de Pós-Graduação e Educação Executiva, São Paulo, SP, Brazil
Received on 06.01.2017 – Desk acceptance on 06.27.2017 – 5th version approved on 02.23.2018 – Ahead of print on 08.02.2018Associate Editors: Rubens Famá and Claudio Wanderley
ABSTRACTThis article aims to investigate the relationship between perceptions of the enabling dimension and the technical validity of the management reports of an insurance company and the performance of its sales managers, mediated by the use of these reports. Companies invest resources in providing management reports for business managers to take decisions, so understanding what influences the use of these reports and whether this use is associated with performance constitutes a relevant subject for both academia and professional practice. The results may be useful for organizations that are taking decisions to invest in management reports, showing that technical validity is what best influences the use of these reports, at least in the short term, which is also a contribution to the theory. Secondary data were combined with a survey of 231 respondents from an insurance company and analyzed using the structural equation modeling (SEM) technique via partial least squares (PLS). The article contributes to the literature and management accounting practice by demonstrating that, unlike in previous studies, the enabling dimension does not positively influence the use of management reports. On the other hand, the study shows that technical validity, which is a more tangible dimension of the quality of management reports, is positively associated with their use and that this use influences the performance of the sales managers.
Keywords: use of management reports, sales performance, sales managers, insurers, enabling.
Address for correspondence
José Carlos Tiomatsu OyadomariUniversidade Presbiteriana Mackenzie, Programa de Pós-Graduação em Controladoria e Finanças EmpresariaisRua da Consolação, 930, Prédio 45 – CEP 01302-907Consolação – São Paulo – SP – Brasil

R. Cont. Fin. – USP, São Paulo, v. 29, n. 78, p. 343-354, set./dez. 2018344
Use of management reports and performance of sales managers in an insurance company
1. INTRODUCTION
This article investigates the relationships between perceptions of the enabling dimension and the technical validity of the management reports of an insurance company and the performance of its sales managers, mediated by the use of these reports. The Brazilian studies on management accounting argue that obtaining performance involves, as preceding factors, the design and use of a management control system (Aguiar, Pace & Frezatti, 2009; Junqueira, Dutra, Zanzquetto & Gonzaga, 2016; Oyadomari, Frezatti, Mendonça, Cardoso & Bido, 2011).
As Chenhall (2003) explains, most of the studies have focused on professionals from the areas of controlling and also senior management. Thus, a gap in the studies focusing on employees from the operational area is noted, which in light of the specificities present challenges for designing indicators that are valid, adequate, and significant (Groen, Wouters & Wilderom, 2017). This is consistent with Naranjo-Gil and Hartmann (2006), for whom the orientation of managers in relation to their experience/training, whether more administrative or more technical, can imply different systems for using management reports.
Sales managers make routine decisions that strongly affect operating income, such as changes in the mix of products, prices, and promotion, among others, which require them to be quick, according to Forbes (2005) and Baum and Wally (2003). Frezatti (2006) states that when developing these activities managers use management reports.
Operational decisions are important, since it is at the micro level that a deliberate strategy is executed and tested. It is also via this process that an emerging strategy can arise (Thomas & Ambrosini, 2015) and strategic objectives are transformed into results (Srivastava & Sushil, 2015).
For managers to use management reports they need to perceive that these reports have the facilitating dimension, which is a construct defined as enabling perceptions (Mahama & Cheng, 2013), which are derived from the formalization of the controls. Thus, management controls
can be classified with regard to their formalization as enabling or coercive (Tessier, 2014). With the enabling form, users understand that the reports were implemented to assist in the development of their activities, unlike the coercive form, whose understanding is that there is forced adherence to the procedures.
Yet, there are more tangible dimensions of the quality of management controls, including technical validity (Burney, Henle & Widener, 2009), whose construct is defined as the user’s evaluation in relation to the accuracy, accessibility, reliability, timeliness, and comprehensibility of these controls.
In light of these arguments, this paper aims to answer the following research question: what are the relationships between perceptions of the enabling dimension and the technical validity of the management reports of an insurance company and the performance of its sales managers, mediated by the use of these report?
The results of this article have relevant practical implications, especially for organizations, since these need to know whether investments in improving management reports affect user performance (Berry, Coad, Harris, Otley & Stringer, 2009).
Our study contributes to advancing the literature and management accounting practice, more specifically with regard to the relationship between the use and the performance of management reports, by showing that despite being high, the perception of the enabling dimension does not positively influence the use of the reports, unlike the technical validity, which is a more tangible dimension. Another important result shows that the use of management reports influences the performance of sales managers, although with a low explanatory power.
This article is structured in the following way: the theoretical framework and the formulation of the hypotheses follow this introduction. Then the methodological procedures, the analysis, and the discussion of the results are presented, ending with the final remarks.
2. THEORETICAL FRAMEWORK AND HYPOTHESES
This literature review will address the main constructs being analyzed that are the objects of this study: enabling dimension, technical validity, and use. Next, we will
address the relationship between the intensity of use of management reports and operational performance.

R. Cont. Fin. – USP, São Paulo, v. 29, n. 78, p. 343-354, set./dez. 2018 345
José Carlos Tiomatsu Oyadomari, Bruno Duque, Edelcio Koitiro Nisiyama, Ronaldo Gomes Dultra-de-Lima & Octavio Ribeiro de Mendonça Neto
2.1 Enabling Dimension
The literature in the area of psychology suggests that perception is an important factor that affects the attitudes and behavior of people in an organization (Mahama & Cheng, 2013, p. 90). This behavioral aspect related to positive or negative perceptions regarding the management control system is addressed in the management accounting literature in the dimension of control formalization, which can be divided into two types: enabling or coercive (Spékle & Kruiss, 2014; Tessier, 2014). This dimension is based on the seminal article on types of bureaucracy by Adler and Borys (1996), which explains the difference between enabling formalization and coercive formalization of the work process.
The concept of enabling is used to describe an organizational technology that helps workers to deal effectively with the contingencies of their daily practice (Adler & Borys, 1996). In contrast, rules, systems, and reports planned for forced adherence to procedures are called coercive (Adler & Borys, 1996).
Based on these concepts, Ahrens and Chapman (2004) show how managers aim efficiency and flexibility using management control systems in an enabling and not coercive way. The authors argue that the concept of enabling systems allows for an approach for resolving the traditional dichotomy between mechanical controls that seek efficiency and organic controls that seek flexibility.
In turn, Chapman and Kihn (2009) state that the enabling construct is based on four principles: (i) it works with the user’s intelligence, instead of replacing it; (ii) it makes it possible to unfold the processes to identify the causes; (iii) it enables the internal transparency of the processes for which the users are responsible; (iv) it enables overall transparency, with regard to fitting these processes into the organization as a whole, and also flexibility, since it enables the criteria of each member to be fulfilled, who are authorized to interrupt the use.
Mahama and Cheng (2013) investigated whether managers who perceive management control systems (specifically cost control) as being more enabling than coercive have higher performance levels in their activities. Using a survey of intermediate level managers of Australian companies (excluding accounting and financial managers), the authors conclude that there is a positive relationship between these perceptions and the intensity with which they use these systems.
For the purposes of this paper and based on Chapman and Kihn (2009) and Mahama and Cheng (2013), enabling is considered as an facilitating dimension, defined as
a construct that indicates whether managers perceive that the controls have been developed to help them in carrying out their work, improving the capacity for self-management, flexibility, and understanding of the overall situation.
As in Mahama and Cheng (2013) and Schoute (2009), in this study the term intensity of use is adopted to describe the extent to which the management control system, in this case the management report, is used.
It is argued that the perception of the enabling dimension of a management control system has a positive impact on its use. Thus, in line with Mahama and Cheng (2013), the following hypothesis was established:
H1: there is a positive association between the perception of the enabling dimension and the intensity of use of reports in a management control system.
2.2 Technical Validity and Use
Few studies in management accounting have elaborated on the subject of information system quality. In Brazil, it is worth citing the paper by Frezatti, Aguiar, and Rezende (2007), who investigated the attributes of management accounting based on the literature on information systems.
Internationally, Burney et al. (2009)’s article should be highlighted – it shows that the perception of managers is also influenced by the degree of technical validity of the performance measuring systems, such validity being evaluated by the accuracy, accessibility, reliability, timeliness, and comprehensibility of the information provided by the system. These characteristics are also found in the model from DeLone and McLean (2003), which considers the positive influence of the quality of the system and quality of the information, both on the intention of use and on the use of the information systems.
DeLone and McLean (2003) believe that the use of the system is a measure that evaluates the success of information systems and that this measure is appropriate for most cases. However, it is noted that the use of the system is typically voluntary and can be operationalized in different ways, such as frequency of use, time of use, number of accesses, pattern of use, and dependence.
Considering that the construct called technical validity, proposed by Burney et al. (2009), is a variable preceding the use of management reports and represents more tangible characteristics of the perception of the quality of the management reports, the following hypothesis was established:
H2: there is a positive association between the technical validity and the intensity of use of management reports.

R. Cont. Fin. – USP, São Paulo, v. 29, n. 78, p. 343-354, set./dez. 2018346
Use of management reports and performance of sales managers in an insurance company
2.3 The Intensity of Use of Management Reports and Operational Performance
There is considerable interest in understanding the sources of superior sales performance, especially regarding the role of managers in the results. In this context, management control is an important dimension (Piercy, Cravens, & Lane, 2009). Although this topic is considered more and more relevant as the sales team assumes more autonomy, flexibility, and decision-making ability, the studies on the topic have presented contradictory results (Flaherty, Arnold, & Hunt, 2007).
In the view of Piercy et al. (2009), management control in sales is a continuous line between results-based controls and what the authors call behavior-based controls. The latter involve the daily management of the behavior of sales people, while results-based controls stimulate and remunerate people for sales volume and earnings, among other related elements.
With the use of results-based controls, achieving results is the responsibility of the salespeople, who are free to adopt their own methods to achieve their objectives, and they therefore assume risks, have autonomy, and responsibilities (Onyemah & Anderson, 2008). As for behavior-based controls, the main responsibility is of the managers, who impose a set of rules and sales and presentation techniques on their salespeople.
In general, the studies show that controls positively affect the performance of the sales team. For example, Joshi and Randall (2001) identified that the clarity of the
tasks affects performance, in the same way as the affective commitment of the salesperson to the organization. In turn, Piercy, Low, and Cravens (2004) analyzed the impact on the performance of salespeople in developing countries (Greece, India, and Malaysia) of the management control combined with financial incentives for these salespeople (bonus) and territorial design. The results revealed that performance is influenced by the territorial design and positively impacted by the management control. As for financial incentives, these did not present any effects on performance.
DeLone and McLean (2003) consider that the use of the system and its products of information influence users in how they carry out their work. Along the same lines, Hall (2008) explains that managers need information about the results of their units in order to feel intrinsically motivated and that they tend to be more effective, the more they understand what needs to be done. Finally, Burney and Widener (2007) conclude that the strategic systems for measuring performance positively affect performance via its relationships with relevant information regarding the work and ambiguities of the functions. These conclusions are in line with the work of Mahama and Cheng (2013).
Thus, based on the sales and management accounting literature, the following hypothesis was established:
H3: there is a positive association between the intensity of use of management reports and operational performance.
Figure 1 shows the theoretical model involving the constructs and the hypotheses.
Figure 1 Theoretical modelSource: Elaborated by the authors.

R. Cont. Fin. – USP, São Paulo, v. 29, n. 78, p. 343-354, set./dez. 2018 347
José Carlos Tiomatsu Oyadomari, Bruno Duque, Edelcio Koitiro Nisiyama, Ronaldo Gomes Dultra-de-Lima & Octavio Ribeiro de Mendonça Neto
3. METHODOLOGICAL PROCEDURES
In this chapter, the procedures adopted to carry out the research are described.
3.1 Research Type and Method
The study was carried out in a single organization (survey single entity), which is suitable for the purposes of this study, which is a comparison between the effects of the use of management reports and the performance of the sales managers of this organization. The data analyzed in this study were extracted from the database of the study by Duque (2016).
3.2 Company Studied
The studied company has been in existence for more than 70 years and is organized in the form of a corporate group that operates in various segments, predominantly in all types of insurance.
The company’s management control system is organized around an annual budget elaborated based on its three-year strategic plan, which in turn is guided by the company’s vision over a seven-year time horizon. The budgeting process is configured as the core of the company’s control system and monitoring the goals has, in recent years, become part of the managers’ day-to-day.
Besides the tools of control such as planning, budgets, and ABC costing (activity-based costing), which are widely used in the company, among other cybernetic controls, the company is also characterized by the presence of cultural controls (Malmi & Brown, 2008), with trust being an adopted organizational principle.
The company is organized in the form of branches, where the sales managers responsible for searching and monitoring the insurance brokers that sell the insurer’s products are based. Due to this routine, the sales managers predominantly act in the external environment, using the cell phones provided by the company as a work tool.
Observations collected by two of the authors allowed to identify that a critical factor is the acceptance of risks.
This aspect means that during a negotiation the sales manager has to analyze, for example, the risk history of the insured, which affects the value of the premium and consequently the profit margin. Another important aspect is the broker’s performance in terms of loyalty (sale of products from other insurers), besides the performance of the products compared to the competitors in the same operating region.
The organization was accessed by one of the authors, who at the time of the research acted in the area of financial reports for the market, an area with low potential for conflict of interest in relation to the individual results of the respondents.
Having identified the research opportunity, two authors were involved in meetings with the management to validate the proposal and obtain support from the organization. Three regional offices in São Paulo were visited by two of the authors, who interviewed the regional manager and some sales managers. The pre-test of the questionnaire was carried out on three sales managers, two coordinators from the sales control area, and one superintendent from the area. The contributions from these tests were limited to the clarity of the terms and the response time. Although these managers were excluded from the data collection, the effect of these responses is very small. Two PhD researchers also evaluated the questionnaire.
During the mentioned interviews and meetings, it was possible to obtain understandings of how the management reports available up to then were used (spreadsheets, online reports, among others) and how the transition to the new application that brings all the information together in a single platform was occurring. This platform, which takes the form of a cell phone application and is called “Production Guide”, brings together the information on all products, timelily showing the evolution of the sales of each product and of each sales manager, of each broker in terms of portfolio and of products, margins, and accidents, among other aspects.

R. Cont. Fin. – USP, São Paulo, v. 29, n. 78, p. 343-354, set./dez. 2018348
Use of management reports and performance of sales managers in an insurance company
3.3 Population and Sample
Table 1 presents the statistical data on the population and on the sample obtained with the questionnaires, which are quite close in terms of distribution.
Table 1Population and sample
Source: data made available by the company studied.
3.4 Operationalization of the Constructs and Questionnaire
3.4.1 Enabling dimension and use of management reports
The enabling dimension of the use of management reports is defined in this paper as the perception that the managers have regarding the system designed to facilitate, structure, and conduct their activities, generating more flexibility, autonomy, and understanding of the whole company. The operationalization of this construct is based on Mahama and Cheng (2013), who used the enabling perceptions of cost system construct operationalized by six variables, with a reverse response variable not being used in this study. The original question from Mahama and Cheng (2013) is presented below each statement.
In the statements in tables 2 and 3, a 7-point Likert scale was adopted, in which 1 means “totally disagree” and 7 means “totally agree”.
Table 2Enabling dimension of the use of management reports
Source: Adapted from Mahama and Cheng (2013).
The enabling dimension is present in the sample indicating high means, with the exception of the question on the ability to deal with unanticipated problems, which emerged as the lowest.
3.4.2 Technical validityFive statements that discussed the quality of the
management reports were initially suggested by the company’s management. Yet, in a subsequent analysis
Population Sample
Individuals (n) 552 231
Gender (%)
Male 58.9 59.3
Female 41.1 40.7
Position (%)
Regional manager 10.1 10.8
Sales manager II 27.4 25.5
Sales manager I 38.6 40.3
Superintendent/regional and executive director
7.2 8.2
Sales assistant 7.4 10.0
Others 9.2 5.2
I feel that the Production Guide is developed with the aim of: Variable Mean Standard deviation
Helping me to work more efficiently.I feel that the costing system is designed with the aim of enabling me to work more efficiently (CS1).
BEN1 6.57 0.820
Facilitating how I deal with unanticipated problems.I feel that the costing system is designed with the aim of facilitating how I deal with unanticipated work problems (CS3).
BEN2 5.33 1.488
Improving self-management of the work I am responsible for.I feel that the costing system is designed with the aim of improving the visibility I have over the work I am responsible for (CS4).
BEN3 6.53 0.801
Ensuring the flexibility with which I perform my work (facilitating decision making on the direction of my efforts).I feel that the costing system is designed with the aim of enhancing the flexibility with which I perform my job (CS5).
BEN4 6.26 0.930
Helping me to understand the company’s indicators.I feel that the costing system is designed with the aim of allowing me to understand the broader processes within my company (CS6).
BEN5 6.21 1.111
R. Cont. Fin. – USP, São Paulo, v. 29, n. 78, p. 343-354, set./dez. 2018 349
José Carlos Tiomatsu Oyadomari, Bruno Duque, Edelcio Koitiro Nisiyama, Ronaldo Gomes Dultra-de-Lima & Octavio Ribeiro de Mendonça Neto
of the literature, a construct used in studies in the area of management accounting was found, called degree of technical validity, developed by Burney et al. (2009). This construct in the original study was operationalized with five indicators (Burney et al. 2009), covering the user’s evaluation in relation to the accuracy, accessibility, reliability, timeliness, and comprehensibility of the
management reports. In this study, the technical validity was operationalized with three indicators. However, the accuracy and reliability indicators were not evaluated in this study in agreement with the measurement model presented in Table 5. It is evaluated that the construct is adequately measured with regard to validity and reliability.
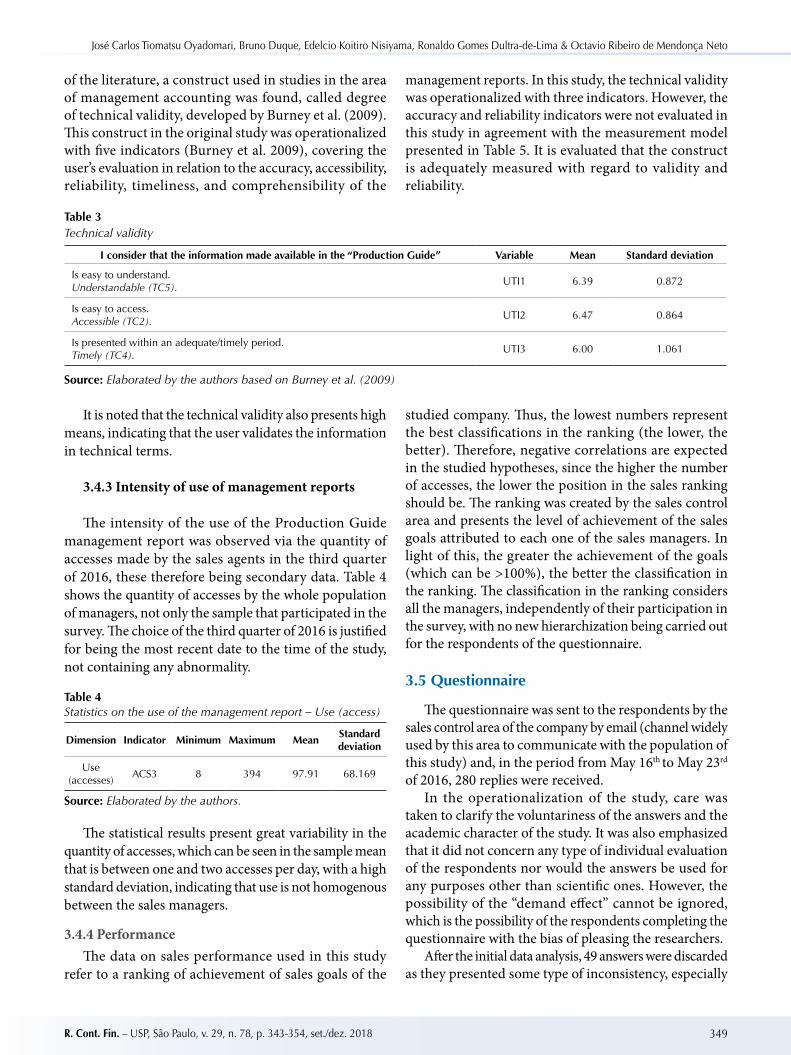
Table 3Technical validity
Source: Elaborated by the authors based on Burney et al. (2009)
It is noted that the technical validity also presents high means, indicating that the user validates the information in technical terms.
3.4.3 Intensity of use of management reports
The intensity of the use of the Production Guide management report was observed via the quantity of accesses made by the sales agents in the third quarter of 2016, these therefore being secondary data. Table 4 shows the quantity of accesses by the whole population of managers, not only the sample that participated in the survey. The choice of the third quarter of 2016 is justified for being the most recent date to the time of the study, not containing any abnormality.
Table 4Statistics on the use of the management report – Use (access)
Source: Elaborated by the authors.
The statistical results present great variability in the quantity of accesses, which can be seen in the sample mean that is between one and two accesses per day, with a high standard deviation, indicating that use is not homogenous between the sales managers.
3.4.4 PerformanceThe data on sales performance used in this study
refer to a ranking of achievement of sales goals of the
studied company. Thus, the lowest numbers represent the best classifications in the ranking (the lower, the better). Therefore, negative correlations are expected in the studied hypotheses, since the higher the number of accesses, the lower the position in the sales ranking should be. The ranking was created by the sales control area and presents the level of achievement of the sales goals attributed to each one of the sales managers. In light of this, the greater the achievement of the goals (which can be >100%), the better the classification in the ranking. The classification in the ranking considers all the managers, independently of their participation in the survey, with no new hierarchization being carried out for the respondents of the questionnaire.
3.5 Questionnaire
The questionnaire was sent to the respondents by the sales control area of the company by email (channel widely used by this area to communicate with the population of this study) and, in the period from May 16th to May 23rd of 2016, 280 replies were received.
In the operationalization of the study, care was taken to clarify the voluntariness of the answers and the academic character of the study. It was also emphasized that it did not concern any type of individual evaluation of the respondents nor would the answers be used for any purposes other than scientific ones. However, the possibility of the “demand effect” cannot be ignored, which is the possibility of the respondents completing the questionnaire with the bias of pleasing the researchers.
After the initial data analysis, 49 answers were discarded as they presented some type of inconsistency, especially
I consider that the information made available in the “Production Guide” Variable Mean Standard deviation
Is easy to understand.Understandable (TC5).
UTI1 6.39 0.872
Is easy to access.Accessible (TC2).
UTI2 6.47 0.864
Is presented within an adequate/timely period.Timely (TC4).
UTI3 6.00 1.061
Dimension Indicator Minimum Maximum MeanStandard deviation
Use (accesses)
ACS3 8 394 97.91 68.169

R. Cont. Fin. – USP, São Paulo, v. 29, n. 78, p. 343-354, set./dez. 2018350
Use of management reports and performance of sales managers in an insurance company
those with many missing data, leaving 231 valid responses. The main inconsistency found was not completing the whole survey. Another less observed inconsistency was related to the same answers for all the items. In addition, there were also three answers with a single piece of data missing and that were randomly distributed, substituted by the mean of their original variables (Hair, Black, Babin, Anderson & Tatham, 2009, p. 65). Next, the outliers were analyzed according to the recommendations of Hair et al. (2009, p. 79), who suggest working with standard values of up to ± 4 for a sample of more than 80. Only eight potential outliers were detected and kept in the sample.
3.6 Structural Equation Modeling
The relationship hypotheses established in this study were tested using structural equation modeling (SEM), a multivariate analysis technique used to explain the relationships of multiple dependency and inter-related, combining aspects of factor analysis and multiple regression analysis (Hair et al., 2009, p. 543), widely used in the Brazilian and international studies. By choosing this estimation method, the indications of Bisbe, Batista-Foguet, and Chenhall (2007) were considered, which suggest the partial least squares (PLS) method as an alternative for smaller samples.
4. ANALYSIS AND DISCUSSION OF THE RESULTS
Before proceeding to the discussion of the results, we evaluated the measurement model, and the discriminant and convergent validity. These were shown to be adequate for the research, as discussed below.
4.1 Evaluation of the Measurement Model
Based on the measurement model (Figure 2), we evaluated the common-method variance (CMV)
(Bagozzi, Yi & Phillips, 1991; Podsakoff, MacKenzie, Lee & Podsakoff, 2003; Podsakoff, MacKenzie & Podsakoff, 2012) using Harman’s single factor test. The result showed that the single factor extracted was responsible for 13.1% of the total variance. Based on this result, we can infer that the CMV does not constitute a problem, since the variance extracted is lower than 50%, and therefore there is no need for any correction of the model under analysis (Podsakoff et al., 2003, 2012).
Figure 2 Analyzed modelSource: Elaborated by the authors.

R. Cont. Fin. – USP, São Paulo, v. 29, n. 78, p. 343-354, set./dez. 2018 351
José Carlos Tiomatsu Oyadomari, Bruno Duque, Edelcio Koitiro Nisiyama, Ronaldo Gomes Dultra-de-Lima & Octavio Ribeiro de Mendonça Neto
4.2 Analysis of the Results of the Structural Equation Modeling
We evaluated the validity and reliability of the construct based on the average variance extracted (AVE). In Table 6, it can be observed that the constructs present adequate convergence, since the coefficients of the AVE are above
0.50 (Fornell & Larcker, 1981; Hair et al., 2009).Regarding the reliability of the model, both the
Cronbach’s alpha and the composite reliability (Table 5) are above 0.70, which indicates that the constructs present internal consistency (Hair, Ringle & Sarstedt, 2011; Henseler, Ringle & Sinkovics, 2009).
Table 5Cronbach’s alpha, reliability, and average variance extracted (AVE) of the partial least squares (PLS) model
Source: Elaborated by the authors
The discriminant validity can be measured via the square root of the AVE, which is in the main diagonal of the matrix in Table 6. As the values of this diagonal are above their intercorrelations, it can be said that there is
discriminant validity (Fornell & Larcker, 1981), which emphasizes the distinction between the constructs. This is also corroborated by the load factors (Figure 2), which are above the cut-off point of 0.50 (Fornell & Larcker, 1981).
Table 6 Matrix of correlations between the variables
Source: Elaborated by the authors.
For the purposes of this paper, the performance ranking was used, which has an inverted scale; that is, the lower the number in the ranking, the higher the resulting performance. Therefore, the association between the “use (access)” and “performance (ranking)” constructs will be negative.
The stability of the coefficients was evaluated using bootstrapping (Chin & Newsted, 1999, p. 332) based on the specification suggested by Hair et al. (2011, p. 145). The bootstrapping was specified with 5,000 resamplings and a 95% confidence interval. Table 7 presents the coefficients of the path and of the t test at a 5% level of significance of the latent variables.
Table 7T test of the partial least squares (PLS) model
*, ** = 1% and 10% significant, respectively.Source: Elaborated by the authors.
Cronbach’s alpha Composite reliability AVE
Use (access) 1.000 1.000 1.000
Enabling dimension 0.810 0.861 0.559
Performance (ranking) 1.000 1.000 1.000
Technical validity 0.825 0.895 0.742
Use (access) Enabling dimension Performance (ranking) Technical validity
Use (access) 1.000
Enabling dimension 0.096 0.748
Performance (ranking) -0.158 -0.173 1.000
Technical validity 0.135 0.548 -0.190 0.861
Original sample(O)
Sample mean(M)
Standard deviation(STDEV)
T value(|O/STDEV|)
P-value
Use (access) → Performance (ranking) -0.158 -0.158 0.062 2.545 0.011*
Enabling dimension → Use (access) 0.032 0.066 0.096 0.332 0.740
Technical validity → Use (access) 0.118 0.106 0.061 1.922 0.055**

R. Cont. Fin. – USP, São Paulo, v. 29, n. 78, p. 343-354, set./dez. 2018352
Use of management reports and performance of sales managers in an insurance company
Table 8 presents the coefficient of determination (R2), in which it is observed that the exogenous constructs technical validity and enabling dimension, together, have an explanatory power of approximately 2% in the endogenous construct use (access). In turn, only 2.5% of the variations in performance (ranking) are explained by the previous relationships. From these coefficients, it can be concluded that the structural model has a small effect on the explanation of the endogenous variables (Cohen, 1988).
Table 8R2 of the structural equation model
Source: Elaborated by the authors.
4.3 Analysis of the Hypotheses and Discussion of the Results
Next, we analyze and discuss the results of the tests of the hypotheses presented in the measurement model.
Hypothesis H1, which states that the enabling dimension is positively associated with the use of management reports, was not validated. The statistical tests show the positive coefficient of 0.032 (t value of 0.332 and p-value of 0.740), however it is statistically non-significant. Therefore, the results presented in this study do not confirm those obtained by Mahama and Cheng (2013).
Despite the fact that the evidence indicates a high mean for the enabling dimension, in contrast it is observed that the use (access) dimension has high variability in the use of these reports by the managers, indicating that other sources may influence this dimension, such as habitualization in the form of routines (Guerreiro, Pereira & Rezende, 2006).
H2, which mentions the positive relationship between the technical validity dimension and the use of
management reports, was validated at a level of 5%. The statistical tests showed a positive coefficient of 0.118 (t value of 1.922 and p-value of 0.055).
The results suggest that the greater the perception of technical validity, the greater the use. The low coefficient indicates that other factors may be associated with use that were not captured in this study.
Comparing the results of H1 and H2 with the literature, the latter suggests that other factors, not studied in this research, could explain use (access); for example, the controls of beliefs, which play the role of communicating the mission, and the vision and the organizational values, which influence the behavior of employees (Heinicke, Gunther & Widener, 2016; Widener, 2007), besides the clarity of the tasks and the salesperson’s commitment to the organization (Joshi & Randall, 2001).
As for H3, which mentions the negative relationship between the use of management reports dimension and operational performance, this was validated at a level of 1%. The statistical tests showed a coefficient with the correct direction of -0.158 (t value of 2.545 and p-value of 0.011). This result is consistent with the work of Mahama and Cheng (2013). However, it is observed that the explanatory power, given by the coefficient of determination of 0.025 (Table 8), is low.
This can be explained by the fact that the use of the application is recent and also because performance can be affected by different factors (Burney & Widener, 2007; Cheng, Luckett & Mahama, 2007; Drake, Wong & Salter, 2007; Hall, 2008; Spreitzer, 1996; Warren, 2006), such as: close management of the routines with the people involved in the sales process (Piercy et al., 2009), sales relationship, analytical capacity, availability of the sales manager, and intensity of the competition, among others.
Another possible explanation is that the short space of time that the application has been used (less than one year) may be a reason for the low coefficient of correlation indices observed, indicating that the application is still between the phase of the initial rule and the rule of the change (Tessier, 2014), with a potential gain in learning.
5. FINAL REMARKS
This study investigated what the relationships are between the perceptions of the enabling dimension, technical validity, the use of management reports, and the performance of the sales managers of an insurance company.
The study contributes to the literature in different aspects: the first innovation lies in the profile of the
respondents, that is, sales managers, who have been studied little in management accounting; the second concerns the combination of constructs, which until now had not been studied together, such as technical validity with the enabling dimension; another innovation is the study of management reports made available in the form of a cell phone application.
R2 R2 adjusted
Use (access) 0.019 0.010
Performance (ranking) 0.025 0.021

R. Cont. Fin. – USP, São Paulo, v. 29, n. 78, p. 343-354, set./dez. 2018 353
José Carlos Tiomatsu Oyadomari, Bruno Duque, Edelcio Koitiro Nisiyama, Ronaldo Gomes Dultra-de-Lima & Octavio Ribeiro de Mendonça Neto
Regarding the results, the study shows that despite being high, the perception of the enabling dimension does not positively influence the use of reports, suggesting that other factors may better explain their use, such as technical validity. It is also argued that technical validity is a more tangible construct that positively influences the use of management reports, especially when the interval of implementation of the report is short.
The study also makes a contribution to practice, since the results may be useful for organizations that are taking decisions to invest in management reports, particularly insurers, which invest large sums of resources in intangible
assets. The results indicate that the use of management reports influences the performance of sales managers, one of the main objectives of the areas that provide information for user decision making.
Future studies could be replicated seeking to widen the observations in different industries, with diversity of size, levels of maturity, and dissemination of the use of management reports. It is also suggested that other constructs are included that can help to explain sales performance, such as belief controls, organizational commitment, clarity of tasks, as well as assertiveness and speed of decisions.
REFERENCES
Adler, P. S., & Borys, B. (1996). Two types of bureaucracy: enabling and coercive. Administrative Science Quarterly, 41(1), 61-89.
Aguiar, A. B., Pace, E. S. U., & Frezatti, F. (2009). Análise do inter-relacionamento das dimensões da estrutura de sistemas de controle gerencial: um estudo piloto. RAC-Eletrônica, 3(1), 1-21.
Ahrens, T., & Chapman, C. S. (2004). Accounting for flexibility and efficiency: a field study of management control systems in a restaurant chain. Contemporary Accounting Research, 21(2), 271-301.
Bagozzi, R. P., Yi, Y., & Phillips, L. W. (1991). Assessing construct validity in organizational research. Administrative Science Quarterly, 36(3), 421.
Baum, R.J., & Wally, S. (2003). Strategic decision speed and firm performance. Strategic Management Journal, 24(11), 1107-1129.
Berry, A. J., Coad, A. F., Harris, E. P., Otley, D. T., & Stringer, C. (2009). Emerging themes in management control: a review of recent literature. The British Accounting Review, 41(1), 2-20.
Bisbe, J., Batista-Foguet, J-M., & Chenhall, R. (2007). Defining management accounting constructs: a methodological note on the risks of conceptual misspecification. Accounting, Organizations and Society, 32(7-8), 789-820.
Burney, L. L., Henle, C. A., & Widener, S. K. (2009). A path model examining the relations among strategic performance measurement system characteristics, organizational justice, and extra- and in-role performance. Accounting, Organizations and Society, 34(3-4), 305-321.
Burney, L., & Widener, S. K. (2007). Strategic performance measurement systems, job-relevant information, and managerial behavioral responses – role stress and performance. Behavioral Research in Accounting, 19(1), 43-69.
Chapman, C. S., & Kihn, L. A. (2009). Information system integration, enabling control and performance. Accounting, Organizations and Society, 34(2), 151-169.
Cheng, M. M., Luckett, P. F., & Mahama, H. (2007). Effect of perceived conflict among multiple performances. Accounting and Finance, 47(2), 221-242.
Chenhall, R. H. (2003). Management control systems design within its organizational context: findings from contingency – based research and directions for the future. Accounting, Organizations and Society, 28(2-3), 97-322.
Chin, W. W., & Newsted, P. R. (1999). Structural equation modeling analysis with small sample using partial least squares. In R. H. Hoyle (Ed.), Statistical strategies for small sample research (pp. 307-348). Thousand Oaks, CA: Sage Publications.
Cohen, J. (1988). Statistical power analysis for the behavioral sciences (2nd ed.). New York, NY: Psychology Press.
DeLone, W. H., & McLean, E. R. (2003). The DeLone and McLean model of information systems success: a ten-year update. Journal of Management Information Systems, 19(4), 9-30.
Drake, A. R., Wong, J., & Salter, S. B. (2007). Empowerment, motivation, and performance: examining the impact of feedback and incentives on no management employees. Behavioral Research in Accounting, 19(1), 71-89.
Duque, B. S. (2016). Uso de relatórios gerenciais e desempenho de vendas em companhia seguradora (Master’s disssertation, Corporate Controlling, Universidade Presbiteriana Mackenzie, São Paulo).
Flaherty, K. E., Arnold, T. J., & Hunt, C. S. (2007). The influence of the selling situation on the effectiveness of control: toward a holistic perspective. Journal of Personal Selling and Sales Management, 27(3), 221-233.
Forbes, D. P. (2005). Managerial determinants of decision speed in new ventures. Strategic Management Journal, 26(4), 355-366.
Fornell, C., & Larcker, D. F. (1981). Evaluating structural equation models with unobservable variables and measurement error. Journal of Marketing Research, 18(1), 39-50.
Frezatti, F. (2006). O paradigma econômico na contabilidade gerencial: um estudo empírico sobre a associação entre taxas de retorno sobre o patrimônio líquido e diferentes perfis da contabilidade gerencial. Revista de Administração, 41(1), 5-17.
Frezatti, F., Aguiar, A. B., & Rezende, A. J. (2007). Relacionamento entre atributos da contabilidade gerencial e satisfação do usuário. Revista de Administração Mackenzie, 8(2), 128-161.
R. Cont. Fin. – USP, São Paulo, v. 29, n. 78, p. 343-354, set./dez. 2018354
Use of management reports and performance of sales managers in an insurance company
Groen, B. A. C., Wouters, M. J. F., & Wilderom, C. P. M. (2017). Employee participation, performance metrics, and job performance: a survey study based on self-determination theory. Management Accounting Research, 36, 51-66.
Guerreiro, R., Pereira, C. A., & Rezende, A. J. (2006). Em busca do entendimento da formação dos hábitos e das rotinas da contabilidade gerencial: um estudo de caso. Revista de Administração Mackenzie, 7(2), 78-101.
Hair , J. F., Jr., Black, W. C., Babin, B. J., Anderson, R. E., & Tatham, R. L. (2009). Análise multivariada de dados. Porto Alegre, RS: Bookman.
Hair, J. F., Ringle, C. M., & Sarstedt, M. (2011). PLS-SEM: indeed a silver bullet. The Journal of Marketing Theory and Practice, 19(2), 139-152.
Hall, M. (2008). The effect of comprehensive performance measurement systems on role clarity, psychological empowerment and managerial performance. Accounting, Organizations and Society, 33(2-3), 141-163.
Heinicke, A., Gunther, T. W., & Widener, S. K. (2016, December). An examination of the relationship between the extent of a flexible culture and the levers of control system: the key role of beliefs control. Management Accounting Research, 33, 25-41.
Henseler, J., Ringle, C. M., & Sinkovics, R. R. (2009). The use of partial least squares path modeling in international marketing. Advances in International Marketing, 20(20), 277-319.
Joshi, A. W., & Randall, S. (2001). The indirect effects of organizational controls on sales person performance and customer orientation. Journal of Business Research, 54(1), 1-9
Junqueira, E., Dutra, E. V., Zanzquetto, H., Filho, & Gonzaga, R. P. (2016). Efeito das escolhas estratégicas e dos sistemas de controle gerencial no desempenho organizacional.Revista Contabilidade & Finanças, 27(72), 334-348.
Mahama, H., & Cheng, M. M. (2013). The effect of managers’ enabling perceptions on costing system use, psychological empowerment, and task performance. Behavioral Research in Accounting, 25(1), 89-114.
Malmi, T., & Brown, D. A. (2008). Management control systems as a package –opportunities, challenges and research directions. Management Accounting Research, 19(4), 287-300.
Naranjo‐Gil, D., & Hartmann, F. (2006). How top management teams use management accounting systems to implement strategy. Journal of Management Accounting Research, 18(1), 21-53.
Onyemah, V., & Anderson, E. (2008). Inconsistencies among the constitutive elements of a sales force control system: test of a configuration theory-based performance prediction. Journal of Personal Selling and Sales Management, 29(1), 9-24.
Oyadomari, J. C. T., Frezatti, F., Mendonça, O. R., Neto, Cardoso R. L., & Bido, D. S. (2011). Uso do sistema de controle gerencial e desempenho: um estudo em empresas brasileiras sob a perspectiva da resources-based view. REAd – Revista Eletrônica de Administração, 17(2), 298-329.
Piercy, N. F., Cravens, D. W., & Lane, N. (2009). Sales management control level and competencies: antecedents and consequences. Industrial Marketing Management, 38(4), 459-467.
Piercy, N. F., Low, G. S., & Cravens, D. W. (2004). Examining the effectiveness of sales management control practices in developing countries. Journal of World Business, 39(3), 255-267.
Podsakoff, P. M., MacKenzie, S. B., & Podsakoff, N. P. (2012, January). Sources of method bias in social science research and recommendations on how to control it. Annual Review of Psychology, 63, 539-569.
Podsakoff, P. M., MacKenzie, S. B., Lee, J.-Y., & Podsakoff, N. P. (2003). Common method biases in behavioral research: a critical review of the literature and recommended remedies. The Journal of Applied Psychology, 88(5), 879-903.
Schoute, M. (2009). The relationship between cost system complexities, purposes of use, and cost system effectiveness. The British Accounting Review, 41(4), 208-226.
Spékle, R., & Kruis, A-M. (2014). Management control research: a review of current developments (pp. 30-46). In D. Otley, K. Soin (Orgs.), Management control and uncertainty, London: Palgrave MacMillan.
Spreitzer, G. M. (1996). Social structural characteristics of psychological empowerment. Academy of Management Journal, 29(2), 483-504.
Srivastava, A. K., & Sushil, (2015). Modeling organizational and information systems for effective strategy execution. Journal of Enterprise Information Management, 28(4), 556-578.
Tessier, S. (2014). Managing management controls (pp. 149-161). In D. Otley, K. Soin (Orgs.). Management control and uncertainty. London: Palgrave MacMillan.
Thomas, L., & Ambrosini, V. (2015). Materializing strategy: the role of comprehensiveness and management controls in strategy formation in volatile environments. British Journal of Management, 26(S1), 105-124.
Warren, W. H. (2006). The dynamics of perception and action. Psychological Review, 113(2), 358-389.
Widener, S. K. (2007). An empirical analysis of the levers of control framework. Accounting, Organizations and Society, 32(7-8), 757-788.