Embed Size (px)
Citation preview

USE OF LIDAR DATA TO CONSTRAIN THE MATCHING OF CONJUGATE FEATURES IN LARGE-SCALE IMAGERY OVER URBAN AREAS
Ruifang Zhai
Ayman F. Habib Dept. of Geomatics Engineering, University of Calgary, 2500 University Drive NW,
Calgary, AB, Canada, T2N1N4 [email protected] [email protected]
ABSTRACT
Reliable and accurate 3-D reconstruction of man-made objects, especially buildings, is essential for many applications that involve the use of digital 3-D city models. This paper aims at developing a semi-automated technique for building rooftop reconstruction employing a combination of large-scale aerial imagery and airborne laser scanning data acquired by Light Detection and Ranging (LiDAR) technology. First, the LiDAR data are segmented to derive above-ground planar patches, which are tentatively used as building rooftops. Second, the planar patches are used to obtain rough estimates of the rooftop boundaries. Line extraction and stereo matching techniques are then utilized to obtain actual boundaries of building rooftops from imagery. In this study, Canny Edge Detection together with edge linking and splitting techniques are used to define a group of straight line segments in the imagery. To increase the reliability and accuracy of the matching of conjugate linear features, several constraints are used for candidate line selection in 2D overlapping imagery and 3D LiDAR planar patches respectively, so as to remove some non-probable candidate line pairs. Additionally, a cost function is defined to obtain the correct line pair for each roof boundary. Manual editing is introduced into the final step of the process to deal with cases where the derived boundaries of building rooftops are not complete or not correct. Finally, the performance of these developed procedures is illustrated through experiments using real data.
INTRODUCTION Building reconstruction from imagery has been one of the key research areas in photogrammetry and computer
vision. With the increasing adoption of LiDAR systems, the manipulation of range data is becoming a promising tool for building reconstruction. Aerial photogrammetry has been and still is one of the preferred ways to obtain three-dimensional information of objects, but this method strongly depends on the image quality as well as the presence of sufficient contrast between adjacent image regions. LiDAR systems are able to provide dense clouds of directly measured 3D points, however, the main drawback of LiDAR technique is that the laser beam just samples the earth’s surface in some fixed pattern, and it is not capable of pointing to particular objects directly. Thus, its planimetric measurement accuracy is not very high (Brenner, 2005). Based on the advantages and disadvantages of the LiDAR and photogrammetric data, it is most promising to combine aerial photogrammetry and laser scanning to obtain highly automated, yet very accurate results (Brenner, 2005). In the recent years, several data fusion algorithms have been developed to reconstruct building models using various data combinations: LiDAR data and aerial imagery (Rottenseiner et al., 2002; Hu et al., 2004; Chen et al., 2005); LiDAR data and three-line-scanner images (Nakagawa et al., 2002); LiDAR data and high-resolution satellite images (Fraser et al., 2001; Guo, 2002); LiDAR data, aerial images and a 2D map (Vosselman, 2002); and terrestrial laser scanner data and images (Lee. et al., 2004). These methods can roughly be categorized into model-driven methods, which try to fit some kind of synthetic building model into the data, and data-driven methods, which try to locate planes in the laser scanner point clouds or imagery and group them into buildings (Schwalbe et al., 2005). The latter method emphasizes the representation of wide variations in building shapes, but may fail where all significant features of a building object cannot be extracted by low-level vision algorithms (Sohn et al., 2007). This paper focuses on the development of a semi- automated technique for the reconstruction of complex building roofs from stereo optical images and LiDAR data. For nearly all buildings, the most noticeable features are linear features. To represent linear features, straight edges are utilized as building rooflines as they can be more accurately located than point features when using feature-matching techniques (McIntosh et al., 2002). Therefore, linear features are the primitives used in this research.
Most of the buildings involved in this work are complex, and thus there is no existing model-driven method that ASPRS 2008 Annual Conference
Portland, Oregon April 28 - May 2, 2008

can be used. Thus, in this paper, we will not address model-driven algorithms. In other words, the information acquired from the imagery and the LiDAR data will comprise the main information we will consider during the process of defining the building rooftops. Figure 1 shows a flowchart of the process used in this work. The whole process consists of five main parts: preprocessing; candidate line selection in 2D overlapping imagery; candidate line selection in 3D LiDAR planes; cost function definition; followed by 3D wire-frame construction. First, LiDAR data are segmented to derive above-ground planar patches, which are tentatively used as building rooftops. Due to the irregular distribution of LiDAR footprints, it is expected that the derived boundaries will be only rough estimates of the rooftop boundaries. The amount of deviation between the LiDAR and actual boundaries depends on the point density of the LiDAR data (i.e., higher density will lead to more accurate boundaries). In this regard, the imagery is used to improve the quality of the LiDAR-derived boundaries. The boundaries of the segmented LiDAR patches are thus projected onto the imagery using the Interior Orientation Parameters (IOP) and the Exterior Orientation Parameters (EOP) of the involved imaging system. The projected LiDAR boundaries are then used to define a buffer zone in the images, in which more accurate boundaries are expected. Line extraction and stereo matching techniques are performed on the imagery to obtain more accurate estimates of the actual boundaries of the rooftops from the imagery. In this research, Canny Edge Detection and edge linking techniques are used to define a group of straight lines in the imagery. The matching of conjugate features in large-scale imagery over urban areas is known to be a difficult task due to the geometric and radiometric variations caused by relief displacements. Therefore, to increase the reliability of the matching of conjugate linear features, we implement several constraints for each building boundary, both in overlapping imagery, as well as in 3D space through the use of the segmented 3D LiDAR planar patches. These procedures are implemented in an interactive software, which allows the operator to verify the matching results and, if needed, to define correct matches. Finally, the performance of the developed procedures is illustrated through the results of experiments using real data. In the following section, the preprocessing procedures are presented. The details of building roof reconstruction by combing LiDAR data and imagery are outlined in the Methodologies section. Experiments with real data and discussions are presented in the Experimental results and discussions section, followed by conclusions and recommendations for future work.
Stop LiDAR data Segmentation
Linear feature detection in
imagery
Similarity measure definition
Yes End
Complete building rooftop from
matched results ?
Preprocessing
Candidate Line Selection In 2D Imagery
Candidate Line Selection In 3D LiDAR Plane
Manual Editing
Full Building Rooftop Model
No Probable operations 1 Line Removing 2 Line Splitting 3 Line Editing
Constraints 1 Normal distance 2 Orientation 3 Standard deviation of gray value 4 Angular difference
Constraints 1 Normal distance 2 Orientation 3 Overlapping ratio 4 Length ratio
LiDAR Data Imagery Data
Geo-referencing
Figure. 1. The flow chart for semi-automatic 3-D reconstruction of building rooftops.
ASPRS 2008 Annual Conference Portland, Oregon April 28 - May 2, 2008

PREPROCESSING Prior to the building rooftop reconstruction, it is important to do some necessary preprocessing of the LiDAR data
and aerial imagery. The main preprocessing steps include: geo-referencing between LiDAR data and imagery data, generation of rough building rooftop boundaries from LiDAR data, and linear feature detection in aerial images. The first step, the geo-referencing process, is one of the most important preprocessing steps for building rooftop reconstruction, when LiDAR and imagery data are being combined. The synergistic attributes of the LiDAR and photogrammetric data can only be achieved after their proper registration to a common reference frame. There is no point-to-point correspondence between the photogrammetric data and LiDAR data. Therefore, LiDAR linear and areal features are used as the primitives for the geo-referencing of the photogrammetric data, and bundle adjustment procedures are implemented to obtain the geo-referencing parameters using the linear and areal features. The detailed procedures for these methods are introduced in Habib et al. (2007). Once the two data are registered to a common reference frame, segmentation techniques are used to derive approximate building rooftop boundaries from the LiDAR data. The main motivations for the use of LiDAR data segmentation is that it allows us to abstract the huge number of points in a typical LiDAR survey and to relate the LiDAR discrete points to physical buildings. A novel ground/non-ground point classification technique (Chang et al., 2007) is used to separate the ground and non-ground points. The underlying concept of this classification methodology is that non-ground points will occlude ground points. The non-ground points are then used to generate a building hypothesis, where some of the non-ground points are considered to belong to building rooftops. Planar patch segmentation is then performed on these points, and the boundaries of these planes are obtained. For detailed information on this algorithm, please refer to Kim et al. (2007). Once the rough building boundaries are derived from the LiDAR data, the boundaries are projected onto the imagery, and are used to aid in detecting linear features in the aerial imagery. Four main procedures are involved in linear feature detection from imagery: edge detection; edge tracking; edge splitting; and edge linking (Hu, et al., 2001). The basic idea of Canny Edge Detection is to detect the zero-crossings of the second directional derivative of the smoothed image. This method is used for the detection of the building edges. This technique produces discrete points that are located at intensity discontinuities. That is, Canny Edge Detection produces discrete points along linear or curved edges that are located within the imagery. These points are then joined to form linear or non-linear edges by chaining the neighbouring points together. The next step is to split one chain into individual short chains by Douglas-Peucker algorithm (Douglas et al. 1977). These split short edges are then converted into linear features through the use of line fitting. The final step investigates the relationship between these small lines, and links them together if they belong to the same edge. Therefore, through this process the linear features in the 2D imagery are obtained.
METHODOLOGIES
Although the generated building rooftop boundaries from LiDAR data do not represent the exact building rooftops, they can still be used for the initial hypothesis of the building boundaries. As the geo-referencing relation between the LiDAR data and the imagery data is available, all these rough boundaries provided by the LiDAR data can be projected onto the involved imagery, thus providing the rough locations for the building rooftops in the imagery.
Candidate Line Selection from Aerial Imagery
As mentioned above, the projected boundaries obtained from LiDAR data segmentation are used as initial hypotheses for building rooftops in the imagery. In this regard, the projected line segments in the stereo images will be helpful for candidate line selection, by considering the relations between the projected roof boundary and detected linear features from the imagery. The detection of linear features in the imagery provides too many edge lines, and we are only interested in the lines that represent the building edges. The large number of lines detected in the imagery can make it quite difficult to find the correct building edges. Thus, only the extracted edges in the imagery which are in the vicinity of the projected lines from the LiDAR data will be considered as candidate lines. As such, the main constraints for candidate line selection for each boundary will come from the following factors (some of them are shown in Figure 2).
1) Normal distance constraint: Normal distance is defined as the average distance between the end points in a detected line segment to the projected line from the LiDAR data. If the normal distance between the extracted line and the projected line is smaller than a certain threshold, which comes from empirical experiences, the detected line segment will be considered as a candidate line.
ASPRS 2008 Annual Conference Portland, Oregon April 28 - May 2, 2008
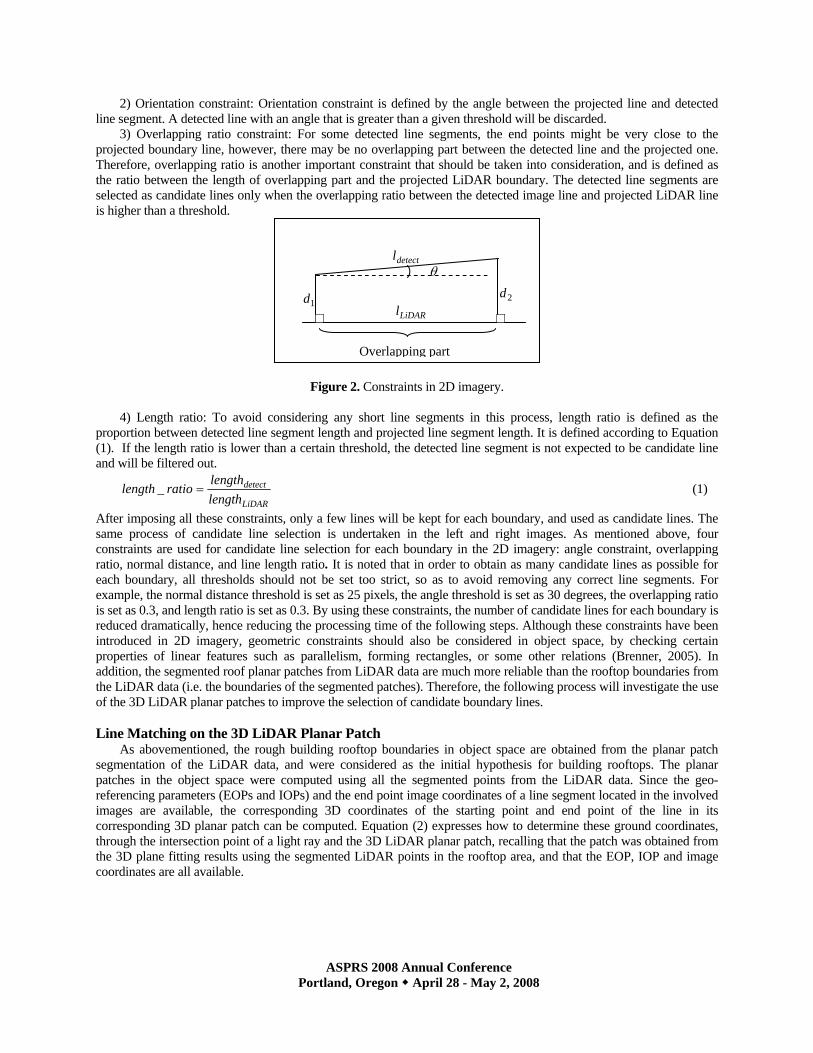
2) Orientation constraint: Orientation constraint is defined by the angle between the projected line and detected line segment. A detected line with an angle that is greater than a given threshold will be discarded.
3) Overlapping ratio constraint: For some detected line segments, the end points might be very close to the projected boundary line, however, there may be no overlapping part between the detected line and the projected one. Therefore, overlapping ratio is another important constraint that should be taken into consideration, and is defined as the ratio between the length of overlapping part and the projected LiDAR boundary. The detected line segments are selected as candidate lines only when the overlapping ratio between the detected image line and projected LiDAR line is higher than a threshold.
LiDARl
detectl
Overlapping part
θ
1d 2d
Figure 2. Constraints in 2D imagery.
4) Length ratio: To avoid considering any short line segments in this process, length ratio is defined as the proportion between detected line segment length and projected line segment length. It is defined according to Equation (1). If the length ratio is lower than a certain threshold, the detected line segment is not expected to be candidate line and will be filtered out.
LiDAR
detect
lengthlength
ratiolength =_ (1)
After imposing all these constraints, only a few lines will be kept for each boundary, and used as candidate lines. The same process of candidate line selection is undertaken in the left and right images. As mentioned above, four constraints are used for candidate line selection for each boundary in the 2D imagery: angle constraint, overlapping ratio, normal distance, and line length ratio. It is noted that in order to obtain as many candidate lines as possible for each boundary, all thresholds should not be set too strict, so as to avoid removing any correct line segments. For example, the normal distance threshold is set as 25 pixels, the angle threshold is set as 30 degrees, the overlapping ratio is set as 0.3, and length ratio is set as 0.3. By using these constraints, the number of candidate lines for each boundary is reduced dramatically, hence reducing the processing time of the following steps. Although these constraints have been introduced in 2D imagery, geometric constraints should also be considered in object space, by checking certain properties of linear features such as parallelism, forming rectangles, or some other relations (Brenner, 2005). In addition, the segmented roof planar patches from LiDAR data are much more reliable than the rooftop boundaries from the LiDAR data (i.e. the boundaries of the segmented patches). Therefore, the following process will investigate the use of the 3D LiDAR planar patches to improve the selection of candidate boundary lines.
Line Matching on the 3D LiDAR Planar Patch
As abovementioned, the rough building rooftop boundaries in object space are obtained from the planar patch segmentation of the LiDAR data, and were considered as the initial hypothesis for building rooftops. The planar patches in the object space were computed using all the segmented points from the LiDAR data. Since the geo-referencing parameters (EOPs and IOPs) and the end point image coordinates of a line segment located in the involved images are available, the corresponding 3D coordinates of the starting point and end point of the line in its corresponding 3D planar patch can be computed. Equation (2) expresses how to determine these ground coordinates, through the intersection point of a light ray and the 3D LiDAR planar patch, recalling that the patch was obtained from the 3D plane fitting results using the segmented LiDAR points in the rooftop area, and that the EOP, IOP and image coordinates are all available.
ASPRS 2008 Annual Conference Portland, Oregon April 28 - May 2, 2008

)(0
)(*)(*)(**)(*)(*
)(*)(*)(**)(*)(*
80706
50403
80706
20100
cDCZBYAX
bcayyaxxacayyaxxa
ZZYY
acayyaxxacayyaxxa
ZZXX
S
S
S
S
=+++−−+−−−+−
=−−
−−+−−−+−
=−−
(2)
where, ),,,,,,,,( 876543210 aaaaaaaaa are the rotation matrix composed by the rotation angles ),,( κϕω from
image coordinate system to object coordinate system; ),,( sSS ZYX are the three shift parameters in EOP between the LiDAR system and aerial imagery system;
),,( 00 cyx are the IOP of the imaging system; ),( yx are the end point coordinates of the candidate line segment;
are the 3D coordinates of the intersection point between the LiDAR planar patch and the light ray, which are the unknown parameters;
),,( ZYX
(A, B, C, D) are the parameters which define the planar patch. Equation 2(a) and 2(b) come from the collinearity equation, and 2(c) is the plane equation of the LiDAR plane.
With the known parameters (EOP, IOP and image coordinates), the unknown parameters are easily derived from these equations. In this way, the candidate lines from the stereo images can be projected back onto the LiDAR planar patch. For the linear features investigated in this research, most of the edges are usually located at the intersections of walls and rooftops. In addition, most of the building rooftops are visible in the imagery. Since the roof is likely to be a homogeneous area, the area of the image that is located inside the roof and along the roof boundary will be similar. In addition, the area inside the roof boundary will be more similar (or more homogeneous) than the area outside the roof boundary, even in cases where there exists shadows or occlusions. In this regard, some procedures will only be implemented in the image window that is within the roof boundary and along the candidate line. For a candidate line pair from stereo images, the start points and end points of the two lines may not be the same in 3D object space, even though they represent the same line. Therefore, the key problem to be resolved is how to determine the common line part between the candidate line pairs. This common line part is then to be used in locating the homogenous image area that will be used in the following steps.
),,( ZYX
A common method used to obtain the common part of the candidate line is through the use of epipolar geometry. That is, starting from the candidate line in the left image, obtain the corresponding epipolar lines for the two end points in the right image. Using the epipolar geometry, the same procedures are taken in the left image to get the epipolar lines that cross the end points of the line segment from the right image. The common part of the line is thus easy to compute under the constraint from epipolar geometry. Epipolar geometry, however, cannot always be employed to get the common line part between the candidate line in the stereo images, in particular for the case when the lines are parallel or nearly parallel to the base line. In this regard, some other strategies have to be undertaken to roughly obtain the common part. The main strategy for this is shown in Figure 3. In the 3D LiDAR planar patch, the orthogonal points (A’, B’) on the candidate line are computed from the two end points (A, B) which are located on the candidate
line from the left imagery. The points (C’, D’) on are then defined by the orthogonal projection of end points (C,
D) which are located on , the candidate line from the right imagery. The common part between the candidate lines will then be defined by the four points, BC’ in the left candidate line and B’C in the right candidate line, as shown in Figure 3.
rightL leftL
leftL
rightL
ASPRS 2008 Annual Conference Portland, Oregon April 28 - May 2, 2008

A
B
C
D
A’
C’
B’
D’
leftl
rightl
Common part
Common part
Figure 3. Computing the common part between the candidate lines from the stereo images.
Once all candidate line pairs on the LiDAR planar patches are acquired, and the common line part is used to locate the homogenous area along these candidate line pairs in the stereo images, an approach that is similar to the principle used in the 2D imagery is used to remove some non-probable candidate line pairs by considering the 3D object space. Through the careful consideration of the relation between each line pair in the roof planar patch, along with the properties of the homogenous area in the stereo images, several constraints between the line pairs and the homogeneous area will be imposed. These constraints include: normal distance constraint, orientation constraint, standard deviation of gray value constraint, and angular difference constraint. Figure 4 shows the first two constraints in the 3D LiDAR plane.
1. Normal distance constraint: Similar to the normal distance computation in the 2D imagery, normal distance in the 3D LiDAR plane is computed as the average distance from each end point of one candidate lines to the other. That is, the distance between A and A’, B and B’, etc., as shown in Figure 4. The normal distance is computed by averaging all the distances involved . The line pairs with normal distances greater than the given threshold will be filtered out.
),,,( 4321 dddd
2. Orientation constraint: It is defined by the angle between a 3D candidate line pair in the LiDAR planar patch, shown as the angle θ in Figure 4. When the angle between the candidate line pair is lower than the set threshold, they will be kept and used in the following process.
θ
leftl
rightl 2d
4d
1d
3d
B
B’
C’D’
DC
A’
A
Figure 4. Normal distance constraint and parallelism constraint in a 3D LiDAR planar patch.
3. Standard deviation of gray values: The standard deviation of gray values in the homogeneous image area in the left image and the right image will also be compared. The intensity distribution of the image area that is within the rooftop is very even. Using this knowledge, the standard deviation of the gray values should be lower than a certain threshold. Only when the standard deviation of the gray value satisfies the constraint, will the angular difference between the two average RGB vectors of the roof area be computed, which is introduced as the next constraint.
4. Angular difference between the average RGB vectors: Angular difference between the average RGB vectors of the common area in the imagery windows is based on the calculation of the average vector angle between the two
ASPRS 2008 Annual Conference Portland, Oregon April 28 - May 2, 2008

average RGB vectors. The vector angle distinguishes differences in chromaticity, independent of luminance or intensity (Dony et al., 1999). It is mainly used for edge detection and change detection. Here, we introduce this method to compute the angular difference between the average RGB vectors of the two homogeneous image windows with respect to the stereo images. For the homogenous image window in the stereo images, the average gray values in Red, Green and Blue are first computed, and then the angular difference is obtained using these average gray values.
In all, we have considered the normal distance, orientation, standard deviation of the gray values, and angular difference between the average RGB vectors of the homogeneous image window as the constraints. The similarity measure will be computed for the candidate line pair only when all these conditions are satisfied.
Similarity Measure
Several candidate line pairs will likely satisfy the constraints outlined in the previous sections. These line pairs are thus kept and will be used to determine the boundaries of the rooftop. From these probable line pairs, only one line pair must be selected as the correctly matched line pair. Therefore, a cost function is defined in order to locate one line pair for each boundary. Given that the normal distance threshold between the candidate line pair in the 3D LiDAR planar patch is , the normal distance between one candidate line pair is , the average angular difference of RGB vectors between the image window of the same area is
thresholdd normald
RGBθ , and the threshold for the angular difference is
thresholdθ , the cost function is defined according to Equation (3), while considering the constraints introduced in Subsection B. A correctly selected line pair for one boundary should be as close to each other as possible in the 3D rooftop planar patch. That is, the normal distance constraint should have a larger weight than the constraint from the angular difference between the RGB vectors. Only the line pairs satisfying all the constraints in Subsection B will be used in the similarity measure computation, and among them, the line pair with the highest similarity measure will be determined as the correct line pair.
3.0*)0.1(7.0*)0.1(threshold
RGB
threshold
normal
dd
sθθ
−+−= (3)
Where, s is the similarity measure.
Closed 3D Wire-Frame Construction After all the outlined procedures are completed, the final matched results can be obtained for the building
boundaries. The derived line fragments should be then extended and intersected to obtain the corner points, which will form the 3D wire-frame for the building rooftops. However, not all the boundaries will be obtained from the matching procedure, thus interactive operations have to be introduced into the system to obtain a closed 3D wire-frame. The majority of the manual editing process includes splitting, removing, and editing. Splitting will be necessary for building rooftops that had one or more missing boundaries in the original building rooftop boundaries that were defined from the LiDAR data segmentation results, while the removing process is mainly used when there are some redundant boundary lines and finally editing is used to correct some wrongly matched lines.
EXPERIMENTAL RESULTS AND DISCUSSIONS
To evaluate the performance of the proposed methodology for refining building roofs using airborne LiDAR data
and imagery data, the proposed approach has been implemented in Visual C++ software. An airborne laser scanning dataset covering the University of Calgary campus was acquired. The dataset is from an Optech 3100 Sensor model, was acquired at a flying height of 1,400 meters, has a ground point spacing of 0.75m, and vertical accuracy of 15 cm. Aerial imagery, with an image scale 1:5000, was also acquired. To illustrate the proposed procedures used in this research, the intermediate results for two specific building roofs are presented in Figure 5 & Figure 6. The building in the first example has a simple rectangular shape, while the second example shown in Figure 6 exemplifies a building that contains protruding details. The derived building rooftop boundaries from the segmentation of the 3D LiDAR dataset are shown in Figures 5(a) & 6(a). The derived 3D boundaries from the 3D LiDAR dataset are projected onto the imagery, and are shown in Figure 5(b) & Figure 6(b). It is noted that for some of the boundaries, there is big offset between the projected line segment and the real building roof boundary, which is visible in the imagery. This shows the need for the combination of the imagery and the LiDAR dataset to refine the results. The detection of straight line segments in the imagery are shown in Figure 5c & Figure 6c, and are displayed in red. For the candidate line selection in 2D imagery data, all the thresholds are set as follows. The normal distance threshold is set as 25 pixels, the angle between the detected line segment and projected LiDAR boundary is set as 30 degrees, the
ASPRS 2008 Annual Conference Portland, Oregon April 28 - May 2, 2008

threshold for the overlapping ratio is set as 0.3, and the length ratio is also set as 0.3. All the involved thresholds are set to be flexible so as to obtain as many probable candidate lines as possible. After the processing in 2D imagery is complete, several detected lines are kept as the candidate lines for each boundary. The candidate lines are then refined with regard to the constraints in the 3D rooftop planar patch. As for the process in the 3D rooftop planar patch, the normal distance threshold is set as 0.1 meter, and the angular difference is set as 15 degrees. The standard deviation of the gray values for the common image window is 2.0, and the angular difference of the RGB vector threshold is set as 2.0 degrees. Compared with the initial input 3D boundaries, the result of the wire-frame shown in Figure 5(f) looks much improved for the first building rooftop. As for the second building, for some short boundaries no lines have been detected, which causes some missing lines to be missing in the last matched results. These procedures thus produce non-complete building rooftop boundaries in some cases. The matched results shown in Figure 6(f), however, also present a significant improvement compared to the original results. To compensate for the missing boundaries, manual editing procedures are introduced to make a complete 3D wire-frame, which is shown in Figure 6(g).
(a) (b)
(c) (d)
(e) (f)
Figure 5. Intermediate results of conjugate feature matching for regular building rooftop. (a) the 3D building
rooftop boundaries from the segmented LiDAR datasets, (b) projected LiDAR boundaries in the aerial imagery, (c) the detected line segments in the roof area; (d) probable candidate line selection results , (e) matched line segments, (f) the
complete 3D wire-frame after conjugate feature matching.
ASPRS 2008 Annual Conference Portland, Oregon April 28 - May 2, 2008

(a) (b)
(c) (d)
(e) (f) (g)
Figure 6. Conjugate feature matched result for a second building. (a) the 3D rooftop boundaries from the
segmented LiDAR datasets, (b) projected boundaries in aerial imagery, (c) detected line segments in the roof area, (d) probable candidate line selection results, (e) matched line segments, (f) initial 3D boundaries from matched results, (g)
the complete 3D wire-frame after conjugate feature matching and manual editing.
For all the buildings covering the Campus area, it was found that some boundaries are either missing or have been incorrectly located. Therefore, interactive operations are needed to compensate for these boundaries. The interactive interface used for manual editing is shown in Figure 7. A complete 3D building rooftop will be formed by connecting the line segments. For visual comparison, all the wire-frames are shown in Figure 8, which include the initial input 3D boundaries from LiDAR data segmentation, the 3D boundaries after matching, and 3D closed wire-frames after manual editing. After some manual editing is introduced, all the missing boundaries are obtained, and all the wrong boundaries have been corrected. In addition, some redundant boundaries from the input boundaries are removed, and thus complete building rooftops are obtained. The original building rooftop boundaries from LiDAR data and the complete 3D wire-frames of some specific building rooftops are also shown in Figures 8(d) & 8(e). Compared with the original building
ASPRS 2008 Annual Conference Portland, Oregon April 28 - May 2, 2008

rooftop boundaries from the segmentation results of the LiDAR data, as shown in Figure 8(a), the building rooftops from the results of the proposed techniques look much better and have a higher compatibility with the true building rooftops, which testify to combination of LiDAR data and aerial imagery to obtain more successful results compared with using either of the data alone.
Figure 7. Screenshot of the interface for manual editing operations, which include line removing, splitting and editing.
ASPRS 2008 Annual Conference Portland, Oregon April 28 - May 2, 2008

(a) (b) (c)
(d) (e)
Figure 8. Building rooftop boundaries (a) the initial building rooftop boundaries from LiDAR data segmentation,
(b) building rooftop boundaries after conjugate linear matching, (c) the complete 3D wire-frames after manual editing, (d) the initial building rooftop boundaries of some buildings, (e) the complete 3D wire-frames after manual editing.
CONCLUSIONS AND RECOMMENDATIONS FOR FUTURE WORK We have introduced a semi-automatic approach to recognize and reconstruct a variety of complex buildings from
aerial imagery and LiDAR data. To conclude, the combination of accurate edge information from aerial digital images with the segmented LiDAR data, will lead to more encouraging results in comparison to using either of the two separate data sources alone. The proposed procedures make use of the advantages of both the LiDAR data and photogrammetric data. In other words, it takes advantage of high horizontal accuracy from aerial images and high vertical accuracy from LiDAR data. The experiment results collaborate the potential of this approach.
Experiments with real data show that the proposed technique could be used to obtain relatively accurate building boundaries from LiDAR data and large-scale imagery. The building boundaries from the segmentation results of LiDAR data will be improved by introducing the aerial imagery, while the selection of the best line candidates in the imagery is improved through the use of the LiDAR data. It confirms the theory that LiDAR and imagery data are complementary data, and that the combination of LiDAR data and imagery data will derive better results than using either of them individually.
Although this work has produced significant results and conclusions, future work is to be done, and will
ASPRS 2008 Annual Conference Portland, Oregon April 28 - May 2, 2008

concentrate on the following remaining issues. (1) Through the outlined procedure, it was observed that not every boundary is correctly matched due to
various factors. However, it has also been observed that many of the buildings in the dataset are composed of regular rectangles, and thus a model-driven method could also be introduced into the research so as to compensate for missing boundaries.
(2) Some boundaries appear in more than two images. In this case, multiple images can be considered in the reconstruction process in order to get more reliable results.
(3) In the process of the similarity measure, the line pair with the highest similarity measure will be considered as the correct line pair, without considering the effect from shadows, occlusions and other factors. These effects should be taken into consideration in future work.
ACKNOWLEDGEMENTS The authors would like to thank the GEOIDE (GEOmatics for Informed Decisions) Network of Centers of Excellence of Canada for its financial support of this research (SII#43). The authors are also indebted to the University of Calgary Information technology for providing the LiDAR/image data and the valuable feedback.
REFERENCES Brenner C., 2005. Building Reconstruction from images and laser scanning, International Journal of Applied Earth
Observation and Geoinformation, 6: 187-198. Chang, Y., Kim, C., Kersting, A., and A. Habib, 2007. New approach for DTM generation from LiDAR data, 28th
Asian Conference on Remote Sensing (ACRS2007), Kuala Lumpur, November 12-16, 2007. Chen, L., Teo, T., and J. Rau, 2005. Building Reconstruction from LiDAR Data and Aerial Imagery, Geoscience and
Remote Sensing Symposium. IGARSS '05. Proceedings. 2005 IEEE International, 2846-2849. July 25-29, 2005.
Dony, R.D. and S. Wesolkowski, 1999. Edge detection on color images using RGB vector angles, Proceedings of the 1999 IEEE Canadian Conference on Electrical and Computer Engineering, Shaw Conference Center, Edmonton, Alberta, Canada May 9-12, 1999, pp. 687-692.
Douglas, D.H. and Peucker, T.K., 1973. Algorithms for the reductions of the number of points required to represent a digitized line or its caricature, The Canadian Cartographer, 10(2), pp. 112-122.
Fraser, C.S., Baltsavias, E. and A. Gruen, 2001. 3D Building reconstruction from high-resolution Ikonos stereo imagery, Automatic Extraction of man-made objects from aerial and space images (III), Ascona01, pp. 331-344.
Guo T., 2002. Combining high-resolution satellite imagery and airborne laser scanning data for generating bareland DEM in urban areas. http://www.commission5.isprs.org/kunming02/download/GuoTao.pdf
Habib, A., Ghanma, M., and E. Mitishita, 2004. Co-registration of Photogrammetric and LiDAR data: Methodology and Case study, Brazilian Journal of Cartography (RBC), Vol. 56/01, July 2004, pp.1-13.
Habib, A., Bang, K., Aldelgawy, M., and S. Shin, 2007. Intergration of photogrammetric and LiDAR data in a multi-primitive triangulartion procedure. ASPRS 2007 Annual Conference – Identifying Geospatial Solutions, Tampa, Florida, May 7-11, 2007.
Heuel, S., and T.H. Kolbe, 2001. Building reconstruction: the dilemma of generic versus specific models, KI, 15(3): pp. 57-62.
Hu, J., You, S., Neumann, U., and K.K. Park, 2004. Building Modeling from LiDAR & Aerial Imagery. ASPRS 2004 Annual Conference, Denver, Colorado, May 23 - 28, 2004.
Hu, X. and Z. Zhang, 2001. Object-space based interactive extraction of manmade object from aerial images. Proceedings of the society of SPIE, Vol. 45520-8194-4280-1, 2001, pp. 274-279.
Kim, C., Habib, A., and P. Mrstik, 2007. New Approach for Planar Patch Segmentation using Airborne Laser Data, ASPRS 2007 Annual Conference – Identifying Geospatial Solutions, Tampa, Florida, May 7-11, 2007.
Lee, I., and Y. Choi, 2004. Fusion of terrestrial laser scanner data and images for building reconstruction. http://www.isprs.org/istanbul2004/comm5/papers/189.pdf
McIntosh, K., and A. Krupnik, 2002. Integration of laser-derived DSMs and matched image edges for generating accurate surface model, ISPRS Journal of Photogrammetry & Remote Sensing 56: pp. 167-176.
ASPRS 2008 Annual Conference Portland, Oregon April 28 - May 2, 2008

Nakagawa, M., Shibasaki, R. and Y. Kagawa, 2002. Fusion stereo linear CCD image and Laser Range Data for Building 3D Urban Model. IAPRS, Vol. 34, Part 4, pp. 200-211.
RottenSteiner, F., and J. Jansa, 2002. Automatic extraction of building from LiDAR data and aerial images, IAPRS, 2002, Vol. 34, Part 4, pp. 295-301.
Schmid, C., and A. Zisserman, 1997. Automatic Line Matching across Views, 1997 IEEE computer society conference on computer vision and pattern recognition, CVPR’97, Puerto Rico., June 17-19, 1997, pp. 666-671. http://citeseer.ist.psu.edu/schmid97automatic.html
Sohn, G., and I. Dowman, 2007. Data fusion of high-resolution satellite imagery and LiDAR data for automatic building reconstruction, ISPRS Journal of Photogrammetry and Remote Sensing, 62: 43-63.
Schwalbe, E., Maas, H., and F. Seidel, 2005. 3D building model generation from airborne laser scanner data using 2D GIS data and orthogonal point cloud projections. ISPRS WG III/3, III/4, V/3 Workshop “Laser scanning 2005”, Enschede, the Netherlands, Sep. 12-14. http://ieeexplore.ieee.org/iel5/10226/32598/01525661.pdf
Vosselman G., 2002. Fusion of laser scanning data, maps and aerial photographs for building reconstruction, International Geoscience and Remote Sensing Symposium, Toronto, Canada, 24-28 June, 2002. http://www.itc.nl/personal/vosselman/papers/vosselman2002.igarss.pdf
ASPRS 2008 Annual Conference Portland, Oregon April 28 - May 2, 2008


![The Conjugate Gradient Method...Conjugate Gradient Algorithm [Conjugate Gradient Iteration] The positive definite linear system Ax = b is solved by the conjugate gradient method](https://img.pdfslide.us/doc/110x75/5e95c1e7f0d0d02fb330942a/the-conjugate-gradient-method-conjugate-gradient-algorithm-conjugate-gradient.jpg)