Embed Size (px)
Citation preview

LA-UR-Approved for public release;distribution is unlimited.
Title:
Author(s):
Submitted to:
Form 836 (8/00)
Los Alamos National Laboratory, an affirmative action/equal opportunity employer, is operated by the University of California for the U.S.Department of Energy under contract W-7405-ENG-36. By acceptance of this article, the publisher recognizes that the U.S. Governmentretains a nonexclusive, royalty-free license to publish or reproduce the published form of this contribution, or to allow others to do so, for U.S.Government purposes. Los Alamos National Laboratory requests that the publisher identify this article as work performed under theauspices of the U.S. Department of Energy. Los Alamos National Laboratory strongly supports academic freedom and a researcher’s right topublish; as an institution, however, the Laboratory does not endorse the viewpoint of a publication or guarantee its technical correctness.
04-5890
USE OF INVERSE SOLUTIONS FOR RESIDUAL STRESS MEASUREMENT
Gary S. Schajer (Univ. of British Columbia)Michael B. Prime (ESA-WR)
Journal of Engineering Materials and TechnologyVolume 128, Number 3, July 2006, 375-382

1
Use of Inverse Solutions for Residual Stress Measurements
Gary S. Schajer Dept. Mechanical Engineering, University of British Columbia, Vancouver, Canada
Michael B. Prime Engineering Sciences and Applications Div., Los Alamos National Lab., Los Alamos, NM, USA
Abstract
For most of the destructive methods used for measuring residual stresses,
the relationship between the measured deformations and the residual stresses are
in the form of an integral equation, typically a Volterra equation of the first kind.
Such equations require an inverse method to evaluate the residual stress solution.
This paper demonstrates the mathematical commonality of physically different
measurement types, and proposes a generic residual stress solution approach. The
unit pulse solution method that is presented is conceptually straightforward and
has direct physical interpretations. It uses the same basis functions as the Hole-
Drilling integral method, and also permits enforcement of equilibrium constraints.
In addition, Tikhonov regularization is shown to be an effective way to reduce the
influences of measurement noise. The method is successfully demonstrated using
data from Slitting (crack compliance) measurements, and excellent
correspondence with independently determined residual stresses is achieved.
January 2005

2
Introduction
A common way of measuring residual stresses in a specimen is to cut away some stressed
material and to measure the resulting deformations in the adjacent material. The residual
stresses existing in the removed material can then be calculated from the measured deformations,
typically displacements or strains. This is the fundamental basis for the “destructive”
measurement methods [1]. Commonly used techniques include Sachs’ Method [2], Layer
Removal [3], Hole-Drilling [4,5], and Slitting (crack compliance) [6,7]. The details of the
material removal geometry and the deformation measurements of the various techniques vary
greatly. However, the general principle is the same for all methods.
A computational challenge arises when evaluating residual stresses from deformation
data from destructive measurements. It occurs because the calculated stresses exist in one region
(the removed material) while the measurements are made in a different region (the adjacent
material). The measured deformation at a given point in the adjacent material depends on all the
stresses within the removed material. Thus, there is not a one-to-one relationship between
deformation and residual stress. Instead, the relationship is in the form of an integral equation.
This feature profoundly controls the character of the solution.
Even though the various destructive measurement methods differ greatly in their material
removal and deformation measurement geometries, the resulting integral equations are almost all
generically similar. However, this similarity is not always apparent. Each technique seems to
have its own specific calculation method, sometimes not entirely effective. It is the objective of
this paper to draw attention to the mathematical commonality of the destructive methods, and to
present a generic procedure for achieving effective and reliable solutions.
The proposed solution procedure uses unit pulses as basis functions to solve the integral
equations. This method is conceptually straightforward and has direct physical interpretations.
The method also permits enforcement of equilibrium constraints. In addition, Tikhonov
regularization is used to reduce the influences of measurement noise. The application and
effectiveness of the mathematical method is demonstrated using data from Slitting (crack
compliance) measurements.

3
Integral Equations
The relationship between the measured deformations and the residual stresses for a
typical destructive method takes the form of an integral equation. For methods based on
incremental material removal, this integral is most commonly a Volterra equation of the first
kind [8]:
∫ σ=h
h 0
dH (H) h)g(H, )h(d (1)
where d(h) is the deformation (displacement or strain) measured when the depth of the removed
material equals h. The initial depth h0 typically equals zero, but may have a non-zero value
depending on coordinate system choice. Equation (1) indicates that the measured deformations
d(h) depend on the stresses σ originally present at all depths H within the removed material. The
kernel function g(H,h) describes the deformation sensitivity to a stress at depth H within
removed material of depth h.
Equation (1) is called an “inverse problem” because evaluation of the unknown quantity
σ(H) requires a solution from left to right. This process is complicated by the appearance of the
stress term within the integral. In contrast, the “forward” solution for finding d(h) from a known
σ(H) can proceed directly from right to left.
The Sachs Boring-Out Method [2] provides an example of a residual stress measurement
technique that fits the format of Equation (1). In the Sachs method, relieved strains are measured
from strain gages attached to the outside of a cylinder or tube as stressed material is bored out
from the center. Traditionally, the stress/strain relations are expressed in differential form:
⎟⎟⎠
⎞⎜⎜⎝
⎛Ψ
+−
Ψ−′=σθ (r) r2
rb dr
(r)d r2rb E )r( 2
2222 (2)
⎟⎟⎠
⎞⎜⎜⎝
⎛Λ−
Λ−′=σ (r) dr
(r)d r2rb E )r(
22
a (3)
where E′ = E/(1-ν2) is the plane strain Young’s Modulus, and ψ(r) = εθ(r) + ν εa(r) and Λ(r) =
εa(r) + ν εθ(r) are combination strains when the bored out radius reaches r. σa(R) and σθ(R) are

4
the axial and circumferential stresses at radius R within the removed material. Equations (2) and
(3) have the advantage of being “forward” solutions. However, they have the disadvantage of
requiring evaluation of differential quantities, which is a calculation well known for error
sensitivity, and for not explicitly enforcing equilibrium.
Equations (2) and (3) can be integrated to achieve the format of Equation (1) [9]:
dR )R( )r - (b E
2r )r(r
a 22 θσ′
=Ψ ∫ (4)
dR R )R( )r - (b E
2 )r( a
r
a 22 σ
′=Λ ∫ (5)
where b is the outside radius and a is the initial inside radius. An undesirable feature of these
equations is the presence of the denominator term b2-r2. It creates a singularity by zero division
at r = b, and a large range of kernel function values for r < b. This large range of values makes
practical solutions of Equations (4) and (5) ill-conditioned and sensitive to round-off errors. The
problem can be avoided by noting that the denominator term does not involve the integrand R,
and therefore can be factored out of the integrals. Transferring the denominator term to the left
side removes its ill effects. With this change, Equations (4) and (5) become:
dR )R( br
b 2)r( )r - (b E )r(d 2
r
a 2
22
θθ σ=Ψ′
= ∫ (6)
dR (R) bR
b 2)r( )r - (b E )r(d a2
r
a 2
22
a σ=Λ′
= ∫ (7)
These equations retain the form of Equation (1), with the “data” terms dθ and da
becoming scaled quantities. The corresponding kernel functions behave smoothly and remain
within a compact range, even at r = b. Consequently, they give numerical solutions that are
much better conditioned than the theoretically equivalent Equations (4) and (5). The additional
factors E′/b2 are included so that the kernel function integrals are dimensionless. This feature
assists with numerical tabulations of the kernel function integrals when needed for practical
calculations.

5
At r = b the left sides of Equations (4) and (5) equal zero. The associated right sides are
recognized as the circumferential and axial force equilibrium conditions:
∫ θθ σ==b
a dr )R( 0 )b(d (8)
∫ σ==b
a aa dr R )R( 0 )b(d (9)
The additional term R occurs in Equation (9) because of the circular geometry. For other
geometries, an additional term analogous to R indicates moment equilibrium.
Similar equations apply to the Layer Removal Method. In this case, measurements are
made from strain gages attached to a planar specimen as layers of stressed material are removed
from the opposite face [3]. The combination strain Γ(h) = εx(h) + ν εy(h) measured when the
depth of removed material reaches h is [10]:
dH (H) h) -(W E
4h -2W - 6H )h(h
0 2 σ⎥⎦
⎤⎢⎣
⎡
′=Γ ∫ (10)
where σ is the stress at depth H, and W is the original plate thickness. Analogous to the Sachs
Equations (4) and (5), the denominator term (W-h)2 creates a singularity in Equation (10) by zero
division at h = W. As before, this singularity can be removed by factoring the term out of the
integral and transferring it to the left side of the equation. The result is:
dH (H) W
4h -2W - 6H W
)h( h) -(W E )h(d 2
h
0 2
2
h σ=Γ′
= ∫ (11)
For the extreme case when h = W, the left side of Equation (11) equals zero. The right side then
corresponds to moment equilibrium:
dH (H) W)- (H 0 (W)d W
0 h σ== ∫ (12)
For Hole-Drilling and Slitting measurements, integral equations of the form of Equation
(1) also apply. However, because of the more complex geometries involved, the corresponding
kernel functions cannot be determined analytically. Instead, the kernel functions are evaluated
numerically using finite element calculations [11,12]. Slitting measurements are analogous to

6
Layer Removal measurements, and have a singularity when the slit depth h approaches the full
plate thickness W. This singularity can similarly be avoided by multiplying the measured strains
and the kernel function by the factor E′ (W-h)2 / W2.
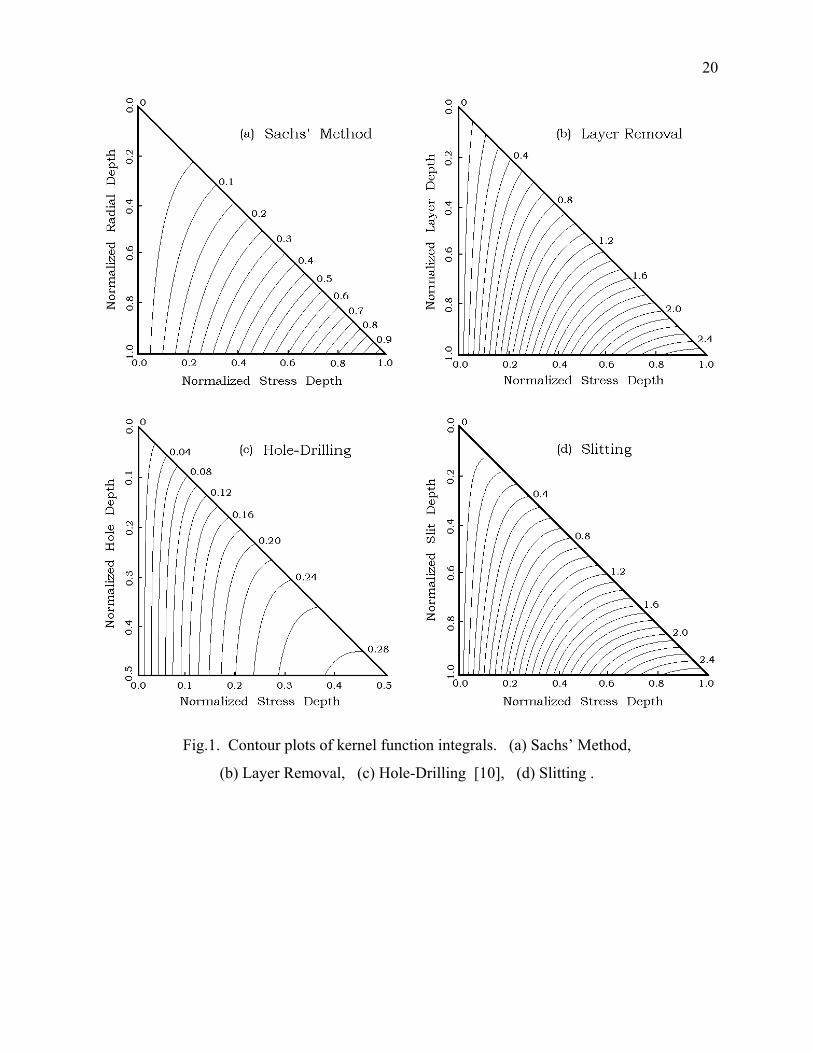
The generic similarity of the various residual stress measurement methods can be seen
clearly by comparing their kernel functions. In the next section, it will be shown that the integral
of the kernel function is a useful quantity. Figure 1 shows the integrals of the dimensionless
kernel functions for the Sachs, Layer Removal, Hole-Drilling and Slitting methods. The close
similarity of these diagrams is quite remarkable given the wide differences in the practical details
of the different methods. This similarity motivates the objective of the present work to develop a
generic residual stress calculation method that will give effective and reliable results for a wide
range of destructive measurement techniques.
Solution Method
An effective way of solving an inverse equation such as Equation (1) is to express the
unknown function, here the stress profile σ(H), as the sum of a series of basis functions ui(H)
multiplied by coefficients ci to be determined [7].
∑=σ )H(u c (H) ii (13)
The solution involves determining the coefficient values ci. The basis functions ui(H) must be
linearly independent and their combination must be able to represent the solution adequately.
Possible choices include unit pulses [11,13,14], power series [11], and Legendre polynomials
[6,9]. Each of these choices has advantages and disadvantages. The unit pulses and power
series are conceptually and algebraically straightforward. However, they do not automatically
obey equilibrium. Conversely, Legendre polynomials do automatically obey equilibrium, but
they are more complex to implement.
Here, unit pulses are chosen as basis functions because they are conceptually
straightforward. They directly use the kernel function data in Figure 1 to obtain their
deformation vs. stress calibration. Figure 2 graphically shows a series of unit pulse functions.
The width of each pulse corresponds to successive increments in material removal depth, which

7
are not necessarily all equal. The deformations are measured after each material removal
increment. For unit pulses, the coefficients ci is Equation (13) correspond to the stresses σi
within each material increment. Thus, it is convenient to rename the generic coefficients ci in
Equation (13) with the specific notation σi. The symbol σi will be used in place of ci in all
following equations.
Substitution of unit pulse functions into Equations (1) and (13) yields the matrix
equation:
G σ = d (14)
where
d = F ε (15)
and
∫∫∫ −==1-j
0
j
0
j
1-j
h
h i
h
h i
h
h iij dH )hg(H, dH )hg(H, dH )hg(H, G (16)
In Equation (14), the left-side (solution) vector σ corresponds to the stresses within each
of the increments. The right-side (data) vector d corresponds to the set of deformation
measurements ε made after each material removal increment. For example, these “deformation
measurements” could represent the combination strains Ψ(r), Λ(r) or Γ(h) in Equations (4), (5) or
(10). For the Sachs and Layer Removal methods, F in Equation (15) is a matrix with
E’(b2-ri2)/2b2 or E’(W-hi)2/W2 along its diagonal.
The coefficients Gij in Equation (16) are the differences of integrals of the kernel function
for the particular residual stress measurement method. The format of this equation is chosen
because each integral term in the right is a function of only two variables, hi and hj. This feature
makes it easy to tabulate and interpolate these integrals to obtain practical numerical values of
Gij. If Equation (16) had been expressed in the more compact form achieved by combining the
two integrals into a single integral spanning hj-1 to hj, a more complex three-variable
interpolation would have been needed Figure 1 shows some example contour plots of the
integrals, while Figure 3 schematically shows the physical meaning of the matrix terms on the
left of Equation (16) for the case of Hole-Drilling (and analogously for the other methods).
Coefficient Gij is seen to correspond to the deformation caused by a stress within increment “j”

8
of a hole that is “i” increments deep. Because the deformations are sensitive only to stresses
within the removed material, non-zero values of Gij occur only when j ≤ i. Thus, G is lower
triangular. For Hole-Drilling and some implementations of other methods, Equation (14) is
sufficient to provide a solution for the residual stresses within each depth increment. In this
case, it corresponds to the “Integral Method” [11].
Equilibrium
With several residual stress measurement methods, e.g., Sachs’ method, Layer Removal
and Slitting, the material removal can proceed through almost the entire thickness of the
material. In such cases, enforcement of equilibrium becomes an additional need. This constraint
can be achieved by expanding Equation (14) by an additional row corresponding to the
theoretical extreme case of complete material removal. This row corresponds to an equilibrium
equation such as (8), (9) or (12). The additional row determines the stress in the ligament
remaining after completion of material removal.
⎥⎥⎥⎥
⎦
⎤
⎢⎢⎢⎢
⎣
⎡
=
⎥⎥⎥⎥
⎦
⎤
⎢⎢⎢⎢
⎣
⎡
σσσσ
⎥⎥⎥⎥
⎦
⎤
⎢⎢⎢⎢
⎣
⎡
0ddd
GGGGGGG
GGG
3
2
1
4
3
2
1
44434241
333231
2221
11
(17)
Equation (17) shows an example where deformation measurements di have been made
after three material removal increments. The fourth (additional) row has a zero on the right side,
and enforces equilibrium. σ1, σ2, σ3 are the stresses within the three material removal
increments, and σ4 is the stress within the remaining ligament. For meaningful results, the
thickness of the remaining ligament should be similar to that of the material removal increments.
If this is not the case, the estimate of the stress in the remaining ligament may not be realistic,
and Equation (14) should be used to estimate the stresses within the removed material only.
The above method of adding an extra row to Equation (14) is effective when only one
equilibrium condition needs to be enforced. This is the case when using the Sachs method.
However, for Layer Removal and Slitting, both force and moment equilibrium apply, but only
moment equilibrium is enforced by the additional row in Equation (17). The method of

9
Lagrange multipliers [14] can be used to add the force equilibrium constraint. However, it does
this at the cost of disturbing the moment equilibrium condition contained in the added row in
Equation (17). There is only the one independent stress available in the remaining ligament, so it
cannot be chosen to enforce two equilibrium conditions simultaneously.
The force equilibrium procedure suggested here is first to compute the stresses σ using
Equation (17), or the regularized solution to be described in the next section. Then compute the
force residual corresponding to those stresses. The size of this force residual provides a measure
of the quality of the measured data. The corresponding “average stress” should be much smaller
than the maximum calculated stress, preferably less than 1%. This average stress can then be
subtracted from the previously calculated stresses to give an “adjusted” stress profile that obeys
force equilibrium.
Regularization
All practical data are a combination of “true data” and measurement noise. The noise
component causes local distortions that produce proportionally larger distortions in the computed
stress solution. For solutions using pulse functions, the noise amplification is usually kept small
by using only a few unevenly spaced material removal increments [11,16]. This approach is
effective, but it diminishes the data content of the calculation, and decreases the spatial
resolution of the stress solution.
The opposite approach is taken here, where the data content of the calculation is
increased by using displacements measured while making a large number of material removal
increments. The resulting noise amplification is ameliorated by using Tikhonov regularization
[17]. This procedure effectively smoothes the stress solution [18,19]. It diminishes the adverse
effect of the noise without significantly distorting the part of the stress solution corresponding to
the “true data”.
The Tikhonov method involves modifying Equation (17) to penalize the local extreme
values in the stress solution that occur because of the presence of noise. The penalty can be
applied to the norm of the stresses, thereby creating a “small” solution. Alternatively, it may be

10
applied to the norms of the first or second derivatives of the stresses, thus creating a “flat” or
“smooth” solution. In general, any combination of penalty types may be used.
Penalization of the extreme values associated with measurement noise alters the stress
solution such that it no longer exactly obeys Equation (17). Consequently, there is a misfit
between the measured data d and the data corresponding to the regularized solution σ. The
regularized stresses do not include any influence from the misfit. Therefore, the misfit should
ideally contain mostly noise, and very little true data. The amount of regularization should be
chosen to achieve this objective; it should be sufficiently large to reduce substantially the
artifacts created by the noise, but not so large as to distort significantly the structure of the true
solution.
When implementing Tikhonov regularization, Equation (17) is pre-multiplied by GT and
augmented by an extra term. The result is:
(GTG + β CT ST H S C) σ = GTd (18)
where matrix C evaluates the chosen derivative of the stress solution that is to be penalized. For
“small”, “flat” or “smooth” solutions, C numerically approximates the zeroth, first or second
derivatives respectively. For evenly spaced data, C contains rows (0,1,0), (0,-1,1) or (-1,2,-1)
centered along its main diagonal. For residual stress calculations, “smooth” (second derivative)
regularization is a good choice because it does not significantly disturb force or moment
equilibrium. For uniformly spaced data, the matrix product H S C has the following structure
⎥⎥⎥⎥
⎦
⎤
⎢⎢⎢⎢
⎣
⎡
−−−−
⎥⎥⎥⎥
⎦
⎤
⎢⎢⎢⎢
⎣
⎡
⎥⎥⎥⎥
⎦
⎤
⎢⎢⎢⎢
⎣
⎡
=
0000121001210000
ss
ss
)/Wh-(h )/W h-(h )/W h-(h
)/W h-(h
4
3
2
1
34
23
12
01
C SH (19)
where the first and last rows of C are set to zero to eliminate the small and flat regularization that
an “incomplete” (-1 2 –1) pattern would produce at the end points. For example, a non-zero row
sum indicates small regularization. For non-uniformly spaced data, the rows i = 2, N-1 of matrix
C have the following tridiagonal structure:
( )( ) ( )
( )( ) ( )
( )( ) ( )1i1ii1i
2
i1i1ii
2
1ii1i1i
2
h-h h-hN/W 2
h-h h-hN/W 2
h-h h-hN/W 2
−+++−−−+
−− (20)

11
Matrix S in Equations (18) and (19) contains along its main diagonal the standard errors
si in the deformation data di. This matrix adjusts the amount of regularization to fit the expected
measurement error of each deformation datum di.
In Equations (18), β is a weighting factor called the regularization parameter. β = 0
indicates no regularization, and β > 0 indicates an increasing amount of regularization. The
Morozov Discrepancy Principle [17] can be used to determine the value of β that gives the
optimal regularization that substantially reduces noise without significantly distorting the true
solution. If the noise in the data are Gaussian with zero mean, the Morozov principle specifies
that the optimal value of β is achieved when the chi-squared statistic, χ2, equals the number of
data points N. Here, this corresponds to
N )( s
d - d 2N
1 i i
measi
calci2 =−=⎟⎟
⎠
⎞⎜⎜⎝
⎛=χ −
=∑ dGσS 1 (21)
where dimeas are the measured deformation data, and di
calc are the deformation data corresponding
to the regularized σj that are calculated using Equations (1) and (15).
In many practical cases, the situation is complicated by the presence of matrix F in
Equation (15). A strain quantity ε is actually measured, and is then mathematically transformed
into the data quantity d for use in the subsequent calculations. When working in terms of ε
Equation (21) becomes
N )( e -
2N
1 i i
measi
calci2 =−=⎟⎟
⎠
⎞⎜⎜⎝
⎛ εε=χ −
=∑ εGσFE -11 (22)
where ei are the standard errors in the measured strains. Commonly, the measured strains have a
uniform standard error, ei = e for all i. Equation (22) can then be rearranged as:
2e N
=
− εGσF-1
(23)
In this simplified case, the Morozov discrepancy principle is seen to match the mean square data
misfit to the standard error in the measured data.
When enforcing equilibrium, there are no measured data associated with the material in
the last (remaining) layer. Thus, the last line of the matrix calculation in Equation (23) must be

12
omitted and N reduced to N-1. The pre-multiplication by F-1 is simply done by dividing the
elements of Gσ by fi. Omission of the last line of the matrix calculation avoids the zero division
by the final fn = 0.
For the case of uniform strain measurement errors ei = e for all i, the corresponding
matrix S has the same form as F, but with the elements multiplied by a factor containing E’.
Consequently, it is acceptable to replace S in Equation (18) with F, and absorb the factor into β.
If e is known, then the optimally regularized solution can be determined by finding the
value of β that simultaneously solves Equations (18) and (23). This solution can be found
iteratively. However, in practice, the standard error e is usually not reliably known. Values
previously determined by the measurement equipment manufacturer or user may not apply to the
specific circumstances of the particular measurement. Thus, a systematic method is needed to
estimate the standard measurement error within the given data. The approach suggested here is
to assume that the “true data” have slowly varying curvature on a spatial scale that is large
compared with the depth increments used for the data measurement. Thus, any shape feature in
the true data profile is spanned by several measurements. Under these conditions, any more
rapidly varying changes in the measured data can be assumed to be noise.
A convenient method to separate slowly and rapidly varying features in the measured
strains is to consider the data in groups of four adjacent points. A least-squares parabola is
evaluated that passes among successive sets of four points. The least-squares solution is needed
because a parabola does not in general exactly fit more than three data points. However, if there
were no data noise, the parabola would likely fit the smooth “true data” quite well, and there
would be almost no misfit between the curve and the four points. Thus, with noisy data, the
misfit could be mostly attributed to the noise. It may be shown that for strain data taken at four
equal depth increments, the local misfit norm is
( 24321 3 3
201 normmisfit local ε−ε+ε−ε= ) (24)
For the case where all the standard errors are the same, i.e., si = s, then the standard error
can be estimated using

13
(∑=
+++ ε−ε+ε−ε−
≈3 - N
1 i
23i2i1ii
2 3 3 )3N(20
1 e ) (25)
Although it is not exact, the estimated value of e2 is useful as a starting value for
choosing a reasonable amount of regularization when solving Equations (18) and (23).
Sometimes, it may be necessary to adjust the estimate if the resulting regularization is either
insufficient to remove noise artifacts, or is excessive in distorting the true solution.
Practical Example
The mathematical procedure described in the previous sections was applied to the data
from a Slitting experiment on a known-stress specimen. To prepare the specimen, strain gages
were attached to the top and bottom of a stress-relieved stainless steel beam, 30.0mm deep.
Residual stresses were induced in the beam by loading it into the plastic range using a four-point
bend fixture. On removal of the load, the beam unloaded elastically, leaving permanent plastic
deformations and substantial axial residual stresses. During this loading and unloading, the total
load and corresponding strains were measured. The profile of the residual stresses was
calculated from the measured strain data using the stress-strain curve identification method
described by Mayville and Finnie [20]. Before destructive measurement by Slitting, the residual
stresses in the beam were measured by neutron and x-ray diffraction, and within the associated
uncertainty ranges, the results agreed with those of the stress-strain curve calculation [21].
Following the creation and evaluation of the residual stresses, the beam was mounted in a
wire electro-discharge machine that progressively cut a slit extending from one surface of the
beam almost all the way to the opposite surface. A 200 µm diameter hard brass wire was used
for the cutting, which was performed using “skim cut” settings so that only negligible stresses
would be induced. The cutting was done in 36 steps, at approximately 0.8mm intervals to a final
depth of 29.26 mm, 97.5% of the beam depth. The cut depth and the strain measured by a strain
gage mounted on the opposite surface were recorded at the completion of each step. After
cutting, the width of the cut was measured as 267 µm.

14
Figure 4 shows the measured strains vs. cut depth. The measurements were quite stable,
with minimal noise. The standard error in the strain measurements was estimated using Equation
(25) as 0.7 micro-strain. The last two strains were omitted in this calculation because they had
apparent errors substantially larger than the others. These errors likely occurred because it was
difficult to support the very flexible remaining ligament without introducing any external loads.
The corresponding residual stresses were calculated by iteratively solving Equations (18) and
(23).
Finite element calculations were used to generate the data for matrix G. The calculations
followed a standard procedure using finite elements [12], with pulse functions being used here as
basis functions instead of the polynomials previously used. The mesh was a 2-D plane-strain
mesh of quadratic shape function quadrilaterals. The mesh included the finite slit width. The
elastic modulus of the stainless steel was taken as 194 GPA, measured during the bending, and
Poisson’s ratio was taken as 0.28 from reported values. In Figure 1(d), the function values at the
extreme limit corresponding to a slit depth exactly equal to the specimen total depth were
determined by assuming an analogy to Equation (11) for Layer Removal. These values
correspond to moment equilibrium, as indicated in Equation (12). Figure 5 shows the residual
stress profile calculated using Equations (18) and (23), and the profile calculated from the strains
measured during the bend test. The stresses are plotted at the midpoint of each interval and
connected by straight lines. The two profiles are almost identical. This excellent
correspondence gives strong confidence in the applicability of the numerical method described
here and of the stress-strain curve identification method of Mayville and Finnie [20]. In
addition, the stress residual required to achieve a zero force resultant is 1.3 MPa, which is just
over 1% of the maximum observed stress values. This small size of this residual gives further
confidence in the results. To achieve the best estimate of the actual solution, the Equation (18)
profile plotted in Figure 5 includes an a-posteriori subtraction of the stress residual.
Figure 6 shows residual stress profiles calculated using three different amounts of
regularization: insufficient, optimal (corresponding to Figure 5), and excessive. These
respectively correspond to misfit norms of a tenth, equal and ten times the optimal value of 0.7
micro-strain. In this case, where the data are high quality, with only modest measurement errors,
the sensitivity to the amount of regularization is not large. This is not necessarily a general

15
behavior. The under-regularized stress profile has oscillations on the left side, but has a sharp
curve at the first stress peak. The over-regularized stress profile does not have the initial
oscillations, but it excessively smoothes the first stress peak. The optimally regularized stress
profile mostly avoids the initial oscillations while still giving a sharp curve at the first stress
peak.
Figure 7 shows the strain misfits corresponding to the calculated residual stress profiles
in Figure 6. Regularization is seen to act like a low-pass filter. With insufficient regularization,
the misfit contains a small amount of high frequency noise. With increased (optimal)
regularization, the misfit also takes in some lower frequency noise, and therefore grows in size.
The shape is still quite random, and likely mostly contains measurement noise. With excessively
large regularization, the misfit takes in a yet lower frequency component with wavelengths
spanning several data points. This non-random structure indicates that the increase was taken
mostly from the “true solution” rather than from the remaining measurement noise.
Discussion
Although not apparent in this example, the computed stress value at the right end of the
residual stress curve in Figure 5 can be sensitive to data errors. This last value corresponds to
the stress in the ligament remaining after the last cut. The error sensitivity occurs because the
last stress value has no data of its own, but is calculated using moment equilibrium from all the
other data. Thus, the last stress is forced to compensate for most of the accumulated errors in all
the other stresses. When working with non-ideal data, more realistic results may be achieved by
disabling moment equilibrium enforcement by setting the last row of matrix G in Equation (17)
to zero. The presence of regularization allows Equation (18) to continue to give a solution for
the stress in the remaining ligament. In this case, the result is essentially an extrapolation of the
adjacent stress values. If desired, an a-posteriori moment equilibrium correction can be made in
the same way as a force equilibrium correction.
When seeking solutions from inverse equations such as those presented here, it is
important to be realistic in ones expectations. Inverse equations are very sensitive to data noise,
and they rarely give well-defined solutions of the type provided by “forward” equations. In

16
some ways, the “solution” to an inverse equation can be considered as a “best guess.” The
solution process is analogous to someone trying to guess the contents of a wrapped gift by
squeezing the wrapping paper. If the wrapping is very thin (low measurement noise) the shape
of the contents can be probed in some detail, and a realistic conclusion can be made about the
gift. However, as the wrapping gets thicker (increased measurement noise), the ability to probe
the shape of the contents and make a realistic conclusion progressively deteriorates. With these
ideas in mind, it is clear that high quality data form a primary requirement. Meticulous
experimental technique is therefore essential for getting reliable results.
Conclusions
For most of the destructive methods used for measuring residual stresses, the relationship
between the measured deformations and the residual stresses are in the form of an integral
equation. Such equations require an inverse method to evaluate the residual stress solution.
This paper demonstrates the mathematical commonality of physically different
measurement types, thereby permitting a generic residual stress solution approach. The unit
pulse solution method presented here is conceptually straightforward and has direct physical
interpretations. It also permits enforcement of equilibrium constraints. The method is
successfully demonstrated using data from Slitting measurements, and excellent correspondence
with independently determined residual stresses is achieved. In addition, Tikhonov
regularization is shown to be an effective way to reduce the influences of measurement noise.
When working with non-ideal data, it may be desirable to enforce equilibrium after, rather than
within, the stress calculation.
Acknowledgments
This work was financially supported by the Natural Sciences and Engineering Research
Council of Canada (NSERC) and by the Los Alamos National Laboratory, NM, USA, operated
by the University of California for the United States Department of Energy under contract
W-7405-ENG-36.

17
References
1. Schajer, G. S., 2001, “Residual Stresses: Measurement by Destructive Testing.”
Encyclopedia of Materials: Science and Technology, Elsevier, pp.8152-8158.
2. Sachs, G., and Espey, G., 1941, “Measurement of Residual Stresses in Metal.” Iron Age,
Sept. 18, pp.63-71; Sept. 25, pp.36-42.
3. Treuting, R. G., and Read, W. T., 1951, “A Mechanical Determination of Biaxial
Residual Stress in Sheet Materials,” Journal of Applied Physics, 22(2), pp.130-134.
4. American Society for Testing and Materials, 1999, “Standard Test Method for
Determining Residual Stresses by the Hole-Drilling Strain Gage Method.” Standard
E837-99. American Society for Testing and Materials, West Conshohocken, PA
5. Measurements Group, 1993, “Measurement of Residual Stresses by the Hole Drilling
Strain-Gage Method,” Tech Note TN-503-5, Measurements Group, Raleigh, NC, 20 pp.
6. Cheng, W., and Finnie, I., 1986, “Measurement of Residual Hoop Stress in Cylinders
Using the Compliance Method,” Journal of Engineering Materials and Technology, 108,
pp.87-92.
7. Prime, M. B., 1999, “Residual Stress Measurement by Successive Extension of a Slot:
The Crack Compliance Method,” Applied Mechanics Reviews, 52(2), pp.75-96.
8. Parker, R. L., 1994, “Geophysical Inverse Theory,” Princeton University Press, New
Jersey.
9. Lambert, J. W., 1953, “A Method of Deriving Residual Stress Equations,” Proceedings
SESA, 12(1), pp.91-96.
10. Virkar, A. V., 1990, “Determination of Residual Stress Profile Using a Strain Gage
Technique,” Journal of the American Ceramic Society, 73(7), pp.2100-2102.
11. Schajer, G. S., 1988, “Measurement of Non-Uniform Residual Stresses Using the Hole-
Drilling Method,” Journal of Engineering Materials and Technology, 110(4), Part I:
pp.338-343, Part II: pp.344-349.

18
12. Rankin, J. E., Hill, M. R., and Hackel, L. A., 2003, “The Effects of Process Variations on
Residual Stress in Laser Peened 7049 T73 Aluminum Alloy,” Materials Science and
Engineering A, A349, pp.279-291.
13. Bijak-Zochowski, M., 1978, “A Semi-destructive Method of Measuring Residual
Stresses,” VDI-Berichte, 312, pp.469-476.
14. Ritchie, D., and Leggatt, R. H., 1987, “The Measurement of the Distribution of Residual
Stresses Through the Thickness of a Welded Joint,” Strain, 23(2), pp.61-70.
15. Dahlquist, G., Björck, Å., and Anderson, N., 1974, “Numerical Methods,” Prentice-
Hall, Englewood Cliffs.
16. Vangi, D., 1994, “Data Management for the Evaluation of Residual Stresses by the
Incremental Hole-Drilling Method,” Journal of Engineering Materials and Technology,
116(4), pp.561-566.
17. Tikhonov, A., Goncharsky, A., Stepanov, V., and Yagola, A., 1995, ”Numerical Methods
for the Solution of Ill-Posed Problems,” Kluwer, Dordrecht.
18. Liu, X., and Schajer, G. S., 1997, “More Reliable Calculations for Layer-Removal
Residual Stress Measurements,” Proceedings of SEM Spring Conference on
Experimental Mechanics, pp.255-256.
19. Tjhung, T., and Li, K., 2003, “Measurement of In-plane Residual Stresses Varying with
Depth by the Interferometric Strain/Slope Rosette and Incremental Hole-Drilling,”
Journal of Engineering Materials and Technology, 125(2), pp.153-162.
20. Mayville, R. A., and Finnie, I., 1982, “Uniaxial Stress-Strain Curves from a Bending
Test.” Experimental Mechanics, 41(2), pp.197-201.
21. Prime, M. B., et al., 1998, “Several Methods Applied to Measuring Residual Stress in a
Known Specimen,” Proc. SEM Spring Conference on Experimental and Applied
Mechanics, Houston, Texas, pp.497-499.

19
List of Figures
1. Contour plots of kernel function integrals. (a) Sachs’ Method, (b) Layer Removal,
(c) Hole-Drilling [11], (d) Slitting.
2. Unit pulse functions used for the residual stress solution.
3. Physical interpretation of matrix coefficients Gij for the Hole-Drilling method.
4. Strain vs. slit depth for a residual stress measurement using the Slitting method.
5. Residual stress profiles. Solid line = calculated from Fig.4 data using Equations (18) and
(23). Dashed line = calculated from bending strains.
6. Residual stress profiles calculated using different amounts of regularization. Misfit
norms = 0.07, 0.7 (optimal) and 7.0 micro-strain.
7. Strain misfits calculated using different amounts of regularization.
Misfit norms: (a) = 0.07, (b) = 0.7 (optimal), and (c) = 7.0 micro-strain.
20
Fig.1. Contour plots of kernel function integrals. (a) Sachs’ Method,
(b) Layer Removal, (c) Hole-Drilling [10], (d) Slitting .

21
Figure 2. Unit pulse functions used for the residual stress solution.
Figure 3. Physical interpretation of matrix coefficients Gij for the Hole-Drilling method.

22
-600
-400
-200
0
200
0 5 10 15 20 25 30
Slit Depth, mm
Mea
sure
d M
icro
-Str
ain
Figure 4. Strain vs. slit depth for a residual stress measurement using the Slitting method.

23
-150
-100
-50
0
50
100
150
0 5 10 15 20 25 30
Slit Depth, mm
Res
idua
l St
ress
, M
Pa Eqns (18) & (23)
Bending Test
Figure 5. Residual stress profiles. Solid line = calculated from Fig.4 data
using Equations (18) and (23). Dashed line = calculated from bending strains.
-150
-100
-50
0
50
100
150
0 5 10 15 20 25 30
Slit Depth, mm
Res
idua
l St
ress
, M
Pa
misfit norm = .07
misfit norm = 0.7
misfit norm = 7.0
Figure 6. Residual stress profiles calculated using different amounts of regularization.
Misfit norms = 0.07, 0.7 (optimal) and 7.0 micro-strain.

24
-0.3-0.2-0.10.00.10.20.3
-3.0-2.0-1.00.01.02.03.0
-30-20-10
0102030
0 5 10 15 20 25 30
( a )S t r a i n
mi s f i t
µ ε
( b )
( c )
Figure 7. Strain misfits cal
Misfit norms: (a) = 0.07,
Sl i t Depth , mm
culated using different amounts of regularization.
(b) = 0.7 (optimal), and (c) = 7.0 micro-strain.


![RESIDUAL STRESS MEASUREMENTS BY NEUTRON …3 Residual stress measurements by neutron diffraction at the IBR-2 pulsed reactor 493 strains along different [hkl] directions simultaneously,](https://img.pdfslide.us/doc/110x75/60de95aa68163e53d2609032/residual-stress-measurements-by-neutron-3-residual-stress-measurements-by-neutron.jpg)