Embed Size (px)
Citation preview
A Feasibility Study
Perspectives for the
Use of Hydrogen as Fuelin Inland Shipping
Perspectives for the Use of Hydrogen as Fuel in Inland Shipping
A Feasibility Study
Contractees:
Mariko GmbH FME Bergmannstraße 36 Laan Corpus den Hoorn 101 26789 Leer 9728 JR Groningen www.mariko-leer.de www.fme.nl
Contractor Leadership:
Institute for Combustion Engines VKA RWTH Aachen University Forckenbeckstraße 4 52074 Aachen www.vka.rwth-aachen.de
October 2018
Within the project
The MariGreen project is co-financed under the INTERREG V A program Germany-Netherlands with funds
from the European Regional Development Fund (ERDF) and the Dutch Ministry of Economic Affairs (Minis-
terie van Economische Zaken), the State of Lower Saxony (Niedersächsische Staatskanzlei), the North
Rhine-Westphalian Ministry of Economic Affairs, Energy, Industry, SMEs and Crafts and the provinces of
Drenthe, Flevoland, Friesland, Gelderland, Groningen, Noord-Brabant and Overijssel. It is supported by the
program management INTERREG at the Ems Dollart Region (EDR).
Supported by:
Abstract
After emission limits for particulates, CO, HC and NOx have been tightened in the last
years, this trend is expected to continue. In order to comply with the new standards,
alternative propulsions systems as well as fuels should be considered. From this point
of view, hydrogen is very promising, because it allows for a significant reduction of emis-
sions.
In this study, current technical alternatives are compared and contrasted with the special
requirements in inland shipping. To do so, several stages from hydrogen production and
distribution to the storage and conversion of hydrogen onboard the vessel are covered.
First, various ways of hydrogen production are explained including an analysis of the
local distribution of production sites. With special regard to the transport to the harbor,
the potentials are elaborated and compared to current and predicted future requirements
regarding a supply infrastructure. In a next step, the features of various hydrogen storage
technologies are presented. These include storage in compressed gaseous and liquid
form as well as Liquid Organic Hydrogen Carriers (LOHC) and metal hydride storages.
In the same way the characteristics of relevant fuel cell types are introduced as well as
the particularities and challenges regarding the usage of hydrogen in internal combustion
engines.
These analyses in combination with a definition of the requirements regarding the con-
structional integration and the operation of these technologies onboard ships are the
basis for a rough dimensioning of the hydrogen storage system for four exemplary ships
(cargo vessel, pushed convoy, cabin vessel, Rhine ferry) that can be considered repre-
sentative for their respective kind. For every type of vessel, the combinations of the se-
lected energy storage and conversion technologies are evaluated systematically based
on typical operational profiles.
In this study also instruction and training concepts for several fields and tasks as well as
occupational groups are introduced. Finally, the relevant legal situation including identi-
fied gaps is presented and strategies are pointed out how hydrogen technologies can be
established in inland shipping.
Key words: hydrogen, inland shipping, hydrogen storage, combustion engine, fuel
cell
Table of Contents
1 Project Background, Goal, Partners and Funding ................................ 11
2 Inland Water Way Transportation ........................................................... 14
2.1 Inland waterway network ........................................................................... 14
2.2 Inland waterway transportation .................................................................. 15
2.3 Emissions .................................................................................................. 19
2.4 The European inland waterway fleet .......................................................... 20
2.4.1 Cargo vessel ............................................................................................. 24
2.4.2 Pushed convoy .......................................................................................... 27
2.4.3 Cabin vessel .............................................................................................. 29
2.4.4 Rhine ferry ................................................................................................. 30
3 Hydrogen Applications: Current Status ................................................. 32
3.1 Hydrogen applications in the shipping sector ............................................. 32
3.2 Possibilities of technology transfer............................................................. 34
3.3 Hydrogen: Chemical properties ................................................................. 35
4 Technological Feasibility ........................................................................ 38
4.1 Infrastructure and supply ........................................................................... 38
4.1.1 Methods of hydrogen production ............................................................... 38
4.1.2 Current situation of hydrogen production ................................................... 42
4.1.3 Ecological and economical assessment .................................................... 46
4.1.4 Requirements and development potential.................................................. 49
4.2 Transport to and storage in the harbor ...................................................... 50
4.2.1 Current situation ........................................................................................ 50
4.2.2 Requirements ............................................................................................ 52
4.2.3 Development potential ............................................................................... 52
4.3 Onboard storage and bunkering ................................................................ 53
4.3.1 Types of hydrogen storage ........................................................................ 53
4.3.2 Energy densities ........................................................................................ 64
4.3.3 Bunkering .................................................................................................. 65
4.3.4 Requirements regarding constructional integration .................................... 67
4.4 Energy conversion ..................................................................................... 70
4.4.1 Internal Combustion Engine ...................................................................... 70
4.4.2 Fuel cell ..................................................................................................... 73
4.4.3 Gravimetric and monetary comparison of combustion engines and fuel cells ........................................................................................................... 79
4.5 Application cases ...................................................................................... 80
4.5.1 Boundary conditions .................................................................................. 80
4.5.2 Requirements for each specific type of ship .............................................. 86
4.5.3 Features of storage technologies .............................................................. 87
4.5.4 Features of energy converter technologies ................................................ 88
4.5.5 Combinations of storage and converter technologies ................................ 89
4.5.6 Matrix combination and case evaluation .................................................... 89
5 Legal Frame Conditions .......................................................................... 92
5.1 Emission regulations ................................................................................. 92
5.2 Rules for fuel cells in shipping ................................................................... 95
5.3 General international standards for fuel cells ............................................. 96
5.4 Standards for hydrogen storage ................................................................ 98
5.5 Standards for hydrogen bunkering .......................................................... 100
5.6 Identified gaps ......................................................................................... 102
6 Instruction and Training ....................................................................... 104
6.1 Present state: Use of hydrogen for energy generation in shipping ........... 104
6.2 Recording and requirements of existing education and training programs ................................................................................................. 105
6.3 Development of training concepts with regard to individual aspects ........ 106
6.4 Development of a new combined training and education concept ........... 107
6.5 Development of a possible training schedule ........................................... 108
7 Summary ................................................................................................ 109
8 Action Guidance .................................................................................... 111
9 Bibliography .......................................................................................... 116
Figures
Fig. 1.1: Logos of the partners involved in this feasibility study ........................ 12
Fig. 2.1: Inland waterways in Europe in 2015 (*Data from 2008) [Dat15] ......... 14
Fig. 2.2: Modal split of freight transport per country as percentage of ton-kilometers in 2015 [Dat15] .................................................................. 15
Fig. 2.3: Development of freight transport of inland waterways for countries over 1000 ton-km [Dat15] ........................................................................... 16
Fig. 2.4: Goods transported in the riparian states of the Rhine in 2016 excluding Switzerland [Dat15] ............................................................................ 18
Fig. 2.5: CO2 emissions of shipping compared to global emissions [Gue11] .... 19
Fig. 2.6: Emission limit value for IWT engines > 130kW [CCN18][EPC98][EPC04][Die18] ........................................................ 20
Fig. 2.7: Illustration of classification of inland waterways [UNC18] ................... 23
Fig. 2.8: Example of a cargo motor vessel ....................................................... 24
Fig. 2.9: Example operating profile of a day ..................................................... 26
Fig. 2.10: Energy demand of a cargo ship in upstream (left) and downstream (right) voyage ..................................................................................... 27
Fig. 2.11: Example of a pushed convoy ............................................................. 27
Fig. 2.12: Power distribution of a pushed convoy ............................................... 28
Fig. 2.13: Example of a cabin vessel .................................................................. 29
Fig. 2.14: Example of a Rhine ferry .................................................................... 30
Fig. 4.1: Fraction of hydrogen from different technologies [APr18] ................... 43
Fig. 4.2: Hydrogen production sites [Fra15] ..................................................... 44
Fig. 4.3: Power-to-X project sites in Germany based on [EPG18] .................... 45
Fig. 4.4: Primary energy expended and GHG emissions producing 1 MJFuel of fuel [Edw14] ....................................................................................... 47
Fig. 4.5: Energy expended and Greenhouse gas emissions for 2020+ FCEV [Edw14] .............................................................................................. 48
Fig. 4.6: Hydrogen pipeline in the Rhine-Ruhr area [CEW09] .......................... 53
Fig. 4.8: Compressed hydrogen storage system .............................................. 54
Fig. 4.9: EMS high-compressed hydrogen container system [EMS18] ............. 55
Fig. 4.10: Liquid hydrogen storage system ......................................................... 56
Fig. 4.11: LOHC storage system ........................................................................ 58
Fig. 4.12: LOHC tank configurations: two separate tanks (A), multi-chamber tanks (B), diaphragm tank (C) ............................................................ 59
Fig. 4.13: Hydrogenious release box [Hyd16] .................................................... 60
Fig. 4.14: Concept configuration of the hydrolysis of sodium borohydride using a catalyst, water generating and recirculation from the fuel cell [H2F18] .............................................................................................. 63
Fig. 4.15: Volumetric calorific value over gravimetric calorific value for different fuels and conditions [She17] [Bie16] [Kle10] ...................................... 64
Fig. 4.16: Three possible ways of bunkering conceivable for hydrogen [Vog12]. 66
Fig. 4.17: Efficiency of fuel cell systems ............................................................. 74
Tables
Table 2.1: Classification of goods according to NST2007 [Dat15] ....................... 17
Table 2.2: European inland waterway fleet [Eur18] ............................................. 21
Table 2.3: Classification of European inland waterways [UNC18] ....................... 22
Table 2.4: Dimensions and operating profile of a cargo motor vessel ................. 25
Table 2.5: Dimensions and operating profile of a pushed convoy ....................... 28
Table 2.6: Dimensions and operating profile of a cabin vessel ............................ 30
Table 2.7: Dimensions and operating profile of a Rhine ferry .............................. 31
Table 3.1: Overview of hydrogen in shipping projects [Tro17] ............................. 32
Table 3.2: Properties of hydrogen [Eic10] ........................................................... 36
Table 4.1: Characteristics of the Hydrogenious release box [Hyd16] .................. 61
Table 4.2: Types of metal hydrides [Buc82] ........................................................ 62
Table 4.3: Specific energy storage densities including the system ...................... 64
Table 4.4: Estimated costs for ICE incl. gear box and modifications for hydrogen operation ............................................................................................ 73
Table 4.5: Overview of various characteristics of fuel cell systems relevant for maritime applications, according to [Bie16] and [Led95] ..................... 75
Table 4.6: Comparison LT-PEMFC and SOFC regarding applications and characteristics based on [DOE18a] .................................................... 76
Table 4.7: Select market available fuel cells as specified by the manufacturers .. 78
Table 4.8: Weight and dimensions of a 374 kW marine diesel engine and various fuel cell systems (*estimation) ............................................................ 79
Table 4.9: Weight and dimensions of a 749 kW marine diesel engine and various fuel cell systems (*estimation) ............................................................ 80
Table 4.10: Energy consumption and storage size for the cargo vessel ................ 82
Table 4.11: Energy consumption and storage size for the pushed convoy ............ 83
Table 4.12: Energy consumption and storage size for the cabin vessel ................ 83
Table 4.13: Energy consumption and storage size for the Rhine ferry .................. 84
Table 4.14: Fueling times for LOHC and Diesel for the selected application cases ................................................................................................. 85
Table 4.15: Rating of requirements to their ship-specific relevance ...................... 86
Table 4.16: Analysis of technical features for storage ........................................... 87
Table 4.17: Analysis of technical features for converters ...................................... 88
Table 4.18: Evaluation of storage and converter combinations ............................. 89
Table 4.19: Ship-specific suitability of energy conversion technologies ................. 90
Table 4.20: Ship-specific suitability of energy storage technologies ...................... 90
Table 5.1: CCNR Stage I (Directive 97/68/EC) ................................................... 92
Table 5.2: CCNR Stage II (Directive 2004/26/EG) .............................................. 93
Table 5.3: Regulation (EU) 2016/1628 of the European Parliament .................... 93
Table 5.4: Sub-categories of engine category IWP ............................................. 94
Table 5.5: Dates of application of Regulation (EU) 2016/1628 for engine category IWP .................................................................................................... 94
Table 5.6: Non-road steady-state test cycles (NRSC) for engines of category IWP .................................................................................................... 95
Table 5.7: Overview of applicable class rules for fuel cell installations and their status [Tro17] ..................................................................................... 95

Table 5.8: Overview of applicable class rules and key features; adapted from [Tro17] ............................................................................................... 96
Table 5.9: Regulatory Gaps; partly adapted from [Tro17] .................................. 103

Nomenclature
λ combustion air ratio -
ρ density kg/m3
cp specific heat capacity J/(kg*K)
Abbreviations and Acronyms
AEL alkaline electrolysis
AIP air independent propulsion
BMVI Bundesministerium für Verkehr und digitale Infrastruktur
BV Bureau Veritas
CCGT Combined Cycle Gas Turbine
CCNR Central Commission for the Navigation on the Rhine
CESNI Comité Européen pour l’Élaboration de Standards dans le Domaine de
Navigation Intérieure
CH2 compressed hydrogen
CH4 methane
CO carbon monoxide
CO2 carbon dioxide
DME dimethyl ether
DNV Det Norske Veritas
ECMT European Conference of Ministers of Transport
EFRE Europäischer Fond für Regionale Entwicklung
EGR exhaust gas recirculation
EIB Innovation Fund or the European Investment Bank
ESD electrostatic discharge protected
ETS Emission Trading System
EU European
EX-Zone hazardous area
FC fuel cell
FCH JU Fuel Cells and Hydrogen Joint Undertaking
GHLV gaseous hydrogen land vehicle
GL Germanischer Lloyd
H2 hydrogen
H2O Water
HC unburnt Hydrocarbons
HTEL high temperature electrolysis
HTPEM high temperature polymeric electrolyte membrane
ICE internal combustion engine
IEC International Electrotechnical Commission
IGF-Code International Code of Safety for Ship Using Gases or Other Low-flashpoint
Fuels
IMO International Maritime Organiziation
ISO Internationale Organisation für Normung
IVR International Association of the Rhine Ship Register
IWP engines above 19 kW used for direct or indirect propulsion of inland waterway
vessels
IWT inland waterway transportation
KOH potassium hydroxide
LH2 liquid hydrogen
LHV electrical efficiency
LNG liquid natural gas
LOHC liquid organic hydrogen carriers
LR Lloyds Register
MCFC molten carbonate fuel cell
MEA membrane-electrode assemblies
MeOH methanol
MLI multilayer insulation
NaBH4 sodium borohydride
NAPE Nationaler Aktionsplan Energieeffizienz
NG natural gas
NH3 ammonia
NIP National Innovation Program Hydrogen and Fuel Cell Technology
NOx nitrogen oxides
NST2007 Einheitliches Güterverzeichnis für die Verkehrsstatistik
O2 oxygen
P2X Power-to-X
PAFC phosphoric acid fuel cell
PEFC polymer electrolyte fuel cell
PEM proton exchange membrane
PEMEL proton exchange membrane electrolysis
PEMFC polymer electrolyte membrane fuel cell
PM particulate emission mass
PN particulate emission number
R&D research and developement
SAE Society of Automotive Engineers
SOFC solid oxide fuel cells
TEU Twenty-foot Equivalent Unit
TRL Technology Readiness Level
TTW tank-to-wheel
VBW The Association for European Inland Navigation and Waterways
VKA The Institute for Combustion Engines
WTT well-to-tank
WTW well-to-wheel
11
1 Project Background, Goal, Partners and Funding
Within the project MariGreen – Maritime Innovations in Green Technologies – funded by
Interreg, 65 partners from Germany and the Netherlands join their forces to develop and
demonstrate innovations for green and low-emission shipping. In addition to the 12 sub-
projects, which are mainly concerned with the use of liquid natural gas (LNG) and wind
as power sources for ship propulsion, the present feasibility study deals with the use of
hydrogen in inland waterway transport. Whereas LNG is being introduced as a transition
fuel to reduce emissions in the near future, hydrogen offers the potential to achieve the
long-term goal of emission free-mobility.
Motivated by the increasing pressure towards a green mobility sector, in this study, the
current technical possibilities and perspectives of the hydrogen technology in inland ship-
ping are demonstrated.
After a general introduction to inland shipping in Europe (chapter 2), an overview of ex-
istent hydrogen technology applications in inland shipping and possibilities of technology
transfer from other sectors are presented (chapter 3). Current technical alternatives are
compared and contrasted with the special requirements in inland shipping. To do so,
several stages of the hydrogen, from its production and distribution to the storage and
conversion onboard the vessel are covered.
First, several ways of hydrogen production are explained including an analysis of the
local distribution of production sites. With special regard to the transport to the harbor,
the potentials are elaborated and compared to current and predicted future requirements
regarding a supply infrastructure (sections 4.1 and 4.2). In a next step, the features of
various hydrogen storage technologies are presented. These include storage in com-
pressed gaseous and liquid form as well as liquid organic hydrogen carriers (LOHC) and
metal hydride storages (section 4.3). In the same way the characteristics of relevant fuel
cell types are introduced as well as the particularities and challenges regarding the usage
of hydrogen in internal combustion engines (section 4.4).
These analyses in combination with a definition of the requirements regarding the con-
structional integration and the operation of these technologies onboard ships are the
basis for a rough dimensioning of the storage for four exemplary ships (cargo vessel,
pushed convoy, cabin vessel, Rhine ferry) that can be considered representative for their
respective kind. For every type of vessel the combinations of the selected energy storage
and conversion technologies are evaluated systematically (section 4.5).
12
In this study also instruction and training concepts for several fields and tasks as well as
occupational groups are introduced. Finally, the relevant legal situation including identi-
fied gaps is presented and strategies are pointed out how hydrogen technologies can be
established in inland shipping. (chapters 5 to 8)
Fig. 1.1: Logos of the partners involved in this feasibility study
In this feasibility study the partners shown in Fig. 1.1 were involved. The input data to
the analyses in this study are based on literature research and own investigations of the
partners. The main contributions of the partners are as follows.
DST provided statistical data and information about IWT, hydrogen projects in the mari-
time sector, hydrogen infrastructure, training for hydrogen applications, operational pro-
files and the legal situation of implementation of hydrogen technologies.
TU Delft, TU Eindhoven and the company Electric Ship Facilities provided information
about metal hydride hydrogen storage and fuel cell technologies.
abh INGENIEUR-TECHNIK GmbH collected detailed information about storage and hy-
drogen powered internal combustion engines. The latter part was achieved in coopera-
tion with the Institute for Combustion Engines (VKA) of RWTH Aachen University
The topic of education and training in the context with hydrogen on ships was covered
by the Hochschule Emden/Leer.

13
The Association for European Inland Navigation and Waterways (VBW) provided infor-
mation about the legal framework and wrote the action guidance.
The Institute for Combustion Engines (VKA) of RWTH Aachen University scanned,
sorted and assessed the information provided by the partners. Where necessary, further
investigations were carried out. VKA also executed the exemplary operational calcula-
tions and the evaluation of technical alternatives based on requirements jointly defined
by the partners. Moreover, VKA ensured the coherence of all information and was re-
sponsible for creating this report.
14
2 Inland Water Way Transportation
The Netherlands, Belgium, Germany and France – for the Rhine region in particular –
have a major interest in maintaining and expanding inland waterway transport as an im-
portant part of the logistics chain. Adhering to current and future exhaust emission limit
values is therefore a key objective. That is why necessary changes in propulsion and
fuel technology are given high priority in order to make inland waterway transport sus-
tainable and at the same time to maintain its competitiveness.
In this chapter, an overview is given of the European inland waterway network, goods
and quantities transported, emissions and the inland waterway fleet.
2.1 Inland waterway network
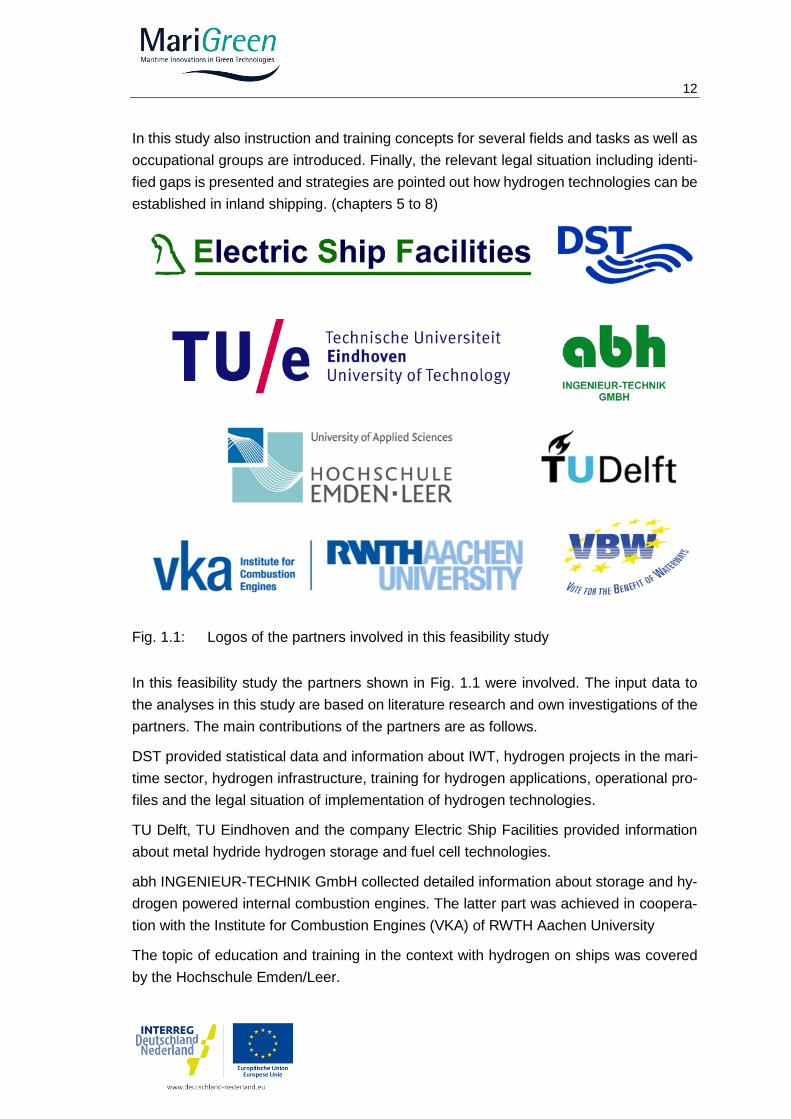
The European inland waterways cover a length of over 41,500 kilometers, divided into
navigable rivers and lakes and artificial canals. In Fig. 2.1 the length of inland waterways
is shown by country. Due to its geographical environment, Finland has the longest net-
work of navigable waterways, closely followed by Germany with almost 8000 km. Despite
the Netherlands’ small area, the length of its waterways amounts to more than 6000 km.
Whereas in Finland, Poland, Hungary, Romania, and Bulgaria, the vast majority of water
ways is on natural water bodies, in Germany about one fourth are canals and in the
Netherlands, France, Italy and Belgium this fraction is even more than 50 %.
Fig. 2.1: Inland waterways in Europe in 2015 (*Data from 2008) [Dat15]
0
1000
2000
3000
4000
5000
6000
7000
8000
9000
Len
gth
/ k
m
Canals Navigable rivers and lakes
15
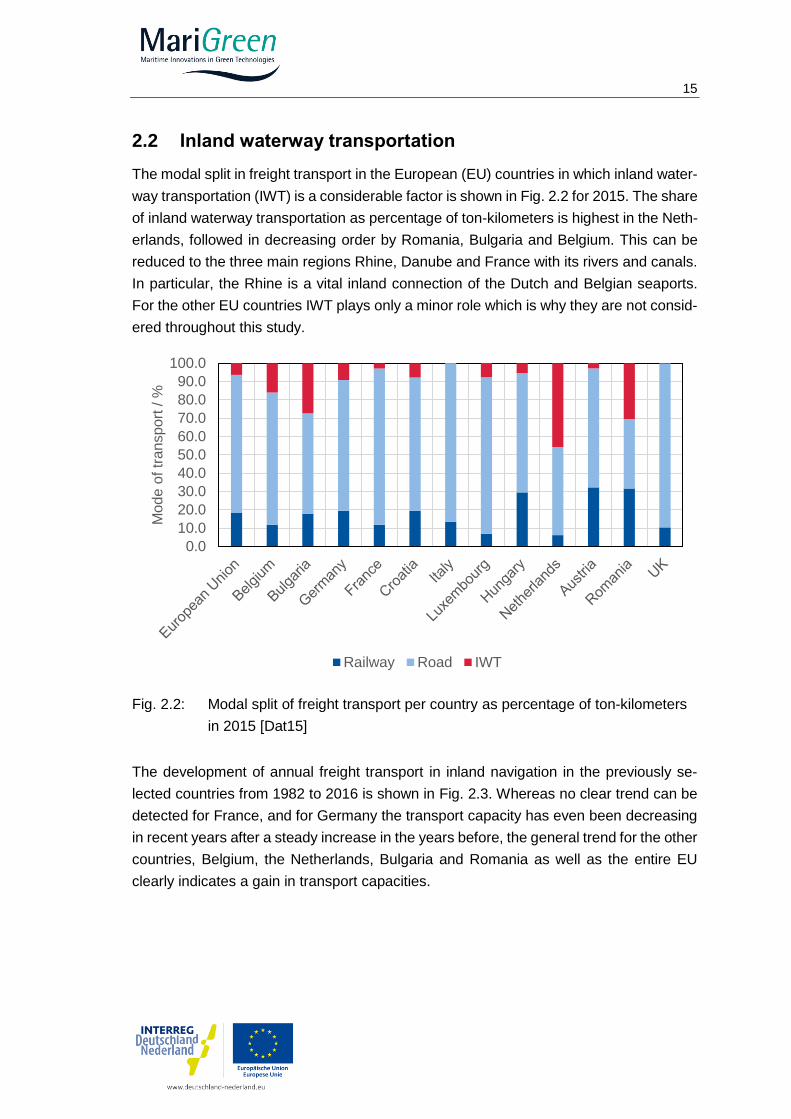
2.2 Inland waterway transportation
The modal split in freight transport in the European (EU) countries in which inland water-
way transportation (IWT) is a considerable factor is shown in Fig. 2.2 for 2015. The share
of inland waterway transportation as percentage of ton-kilometers is highest in the Neth-
erlands, followed in decreasing order by Romania, Bulgaria and Belgium. This can be
reduced to the three main regions Rhine, Danube and France with its rivers and canals.
In particular, the Rhine is a vital inland connection of the Dutch and Belgian seaports.
For the other EU countries IWT plays only a minor role which is why they are not consid-
ered throughout this study.
Fig. 2.2: Modal split of freight transport per country as percentage of ton-kilometers
in 2015 [Dat15]
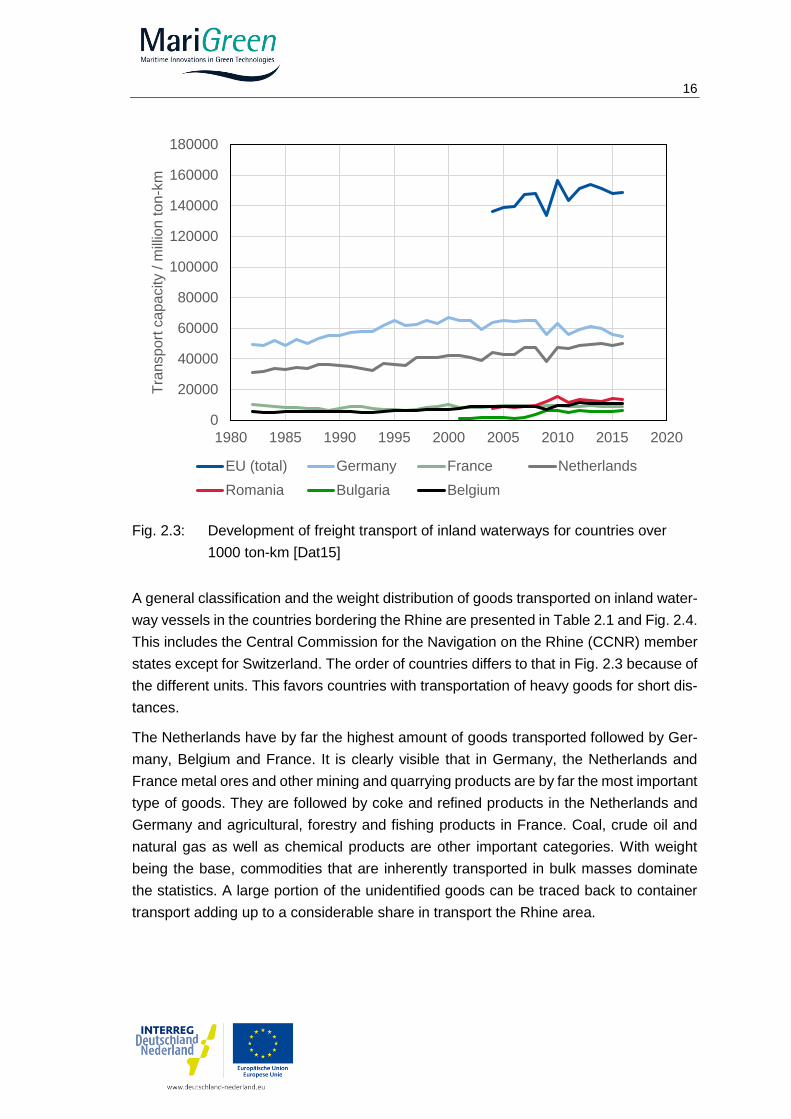
The development of annual freight transport in inland navigation in the previously se-
lected countries from 1982 to 2016 is shown in Fig. 2.3. Whereas no clear trend can be
detected for France, and for Germany the transport capacity has even been decreasing
in recent years after a steady increase in the years before, the general trend for the other
countries, Belgium, the Netherlands, Bulgaria and Romania as well as the entire EU
clearly indicates a gain in transport capacities.
0.0
10.0
20.0
30.0
40.0
50.0
60.0
70.0
80.0
90.0
100.0
Mo
de
of tr
ansp
ort
/ %
Railway Road IWT
16
Fig. 2.3: Development of freight transport of inland waterways for countries over
1000 ton-km [Dat15]
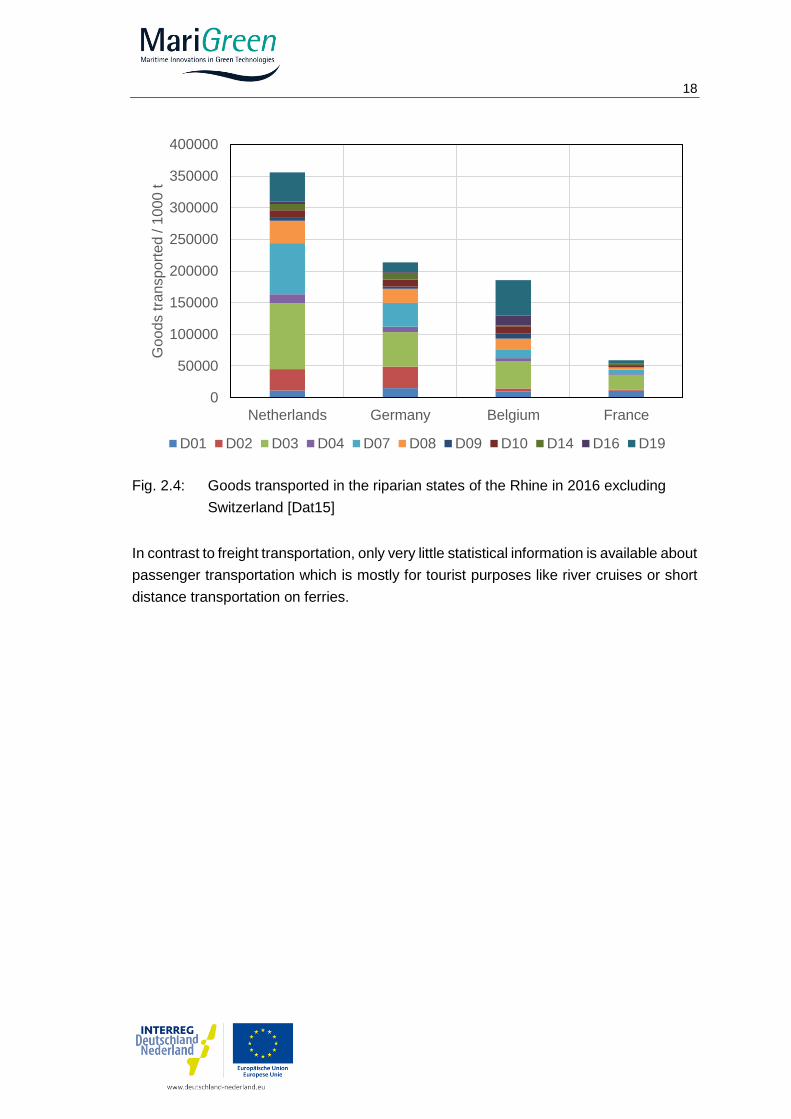
A general classification and the weight distribution of goods transported on inland water-
way vessels in the countries bordering the Rhine are presented in Table 2.1 and Fig. 2.4.
This includes the Central Commission for the Navigation on the Rhine (CCNR) member
states except for Switzerland. The order of countries differs to that in Fig. 2.3 because of
the different units. This favors countries with transportation of heavy goods for short dis-
tances.
The Netherlands have by far the highest amount of goods transported followed by Ger-
many, Belgium and France. It is clearly visible that in Germany, the Netherlands and
France metal ores and other mining and quarrying products are by far the most important
type of goods. They are followed by coke and refined products in the Netherlands and
Germany and agricultural, forestry and fishing products in France. Coal, crude oil and
natural gas as well as chemical products are other important categories. With weight
being the base, commodities that are inherently transported in bulk masses dominate
the statistics. A large portion of the unidentified goods can be traced back to container
transport adding up to a considerable share in transport the Rhine area.
0
20000
40000
60000
80000
100000
120000
140000
160000
180000
1980 1985 1990 1995 2000 2005 2010 2015 2020
Tra
nsp
ort
ca
pa
city /
mill
ion t
on
-km
EU (total) Germany France Netherlands
Romania Bulgaria Belgium
17
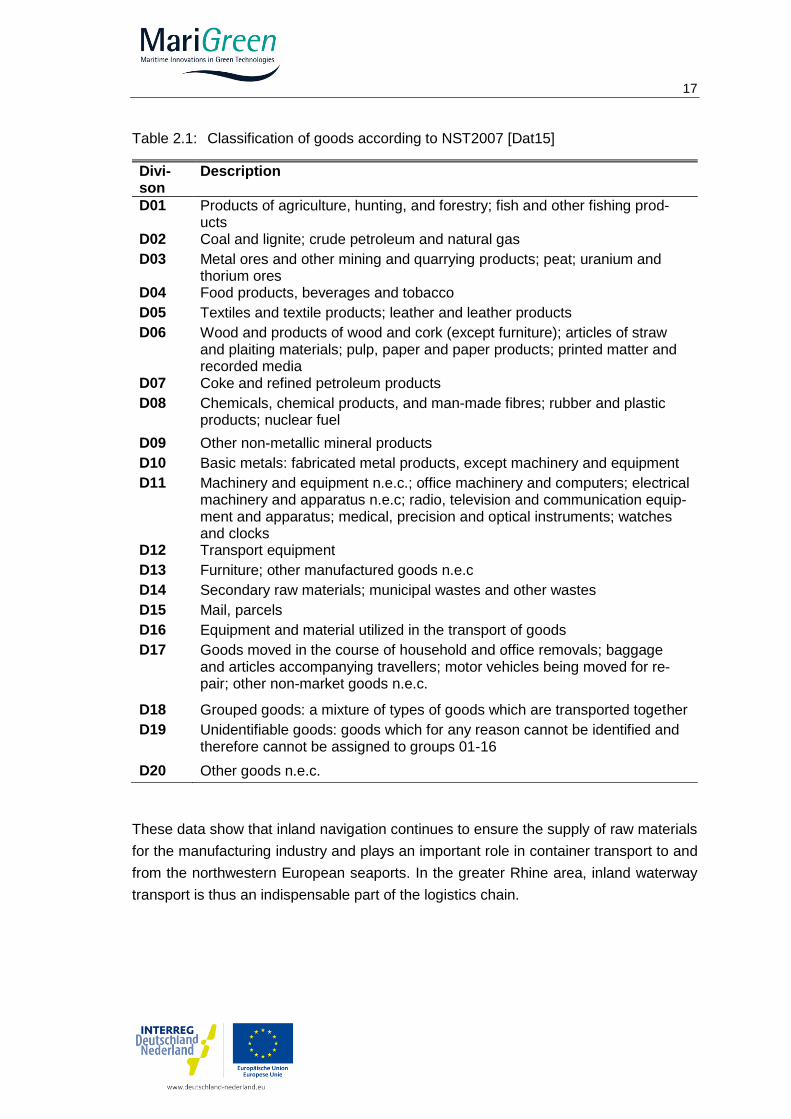
Table 2.1: Classification of goods according to NST2007 [Dat15]
Divi-son
Description
D01 Products of agriculture, hunting, and forestry; fish and other fishing prod-ucts
D02 Coal and lignite; crude petroleum and natural gas
D03 Metal ores and other mining and quarrying products; peat; uranium and thorium ores
D04 Food products, beverages and tobacco
D05 Textiles and textile products; leather and leather products
D06 Wood and products of wood and cork (except furniture); articles of straw and plaiting materials; pulp, paper and paper products; printed matter and recorded media
D07 Coke and refined petroleum products
D08 Chemicals, chemical products, and man-made fibres; rubber and plastic products; nuclear fuel
D09 Other non-metallic mineral products
D10 Basic metals: fabricated metal products, except machinery and equipment
D11 Machinery and equipment n.e.c.; office machinery and computers; electrical machinery and apparatus n.e.c; radio, television and communication equip-ment and apparatus; medical, precision and optical instruments; watches and clocks
D12 Transport equipment
D13 Furniture; other manufactured goods n.e.c
D14 Secondary raw materials; municipal wastes and other wastes
D15 Mail, parcels
D16 Equipment and material utilized in the transport of goods
D17 Goods moved in the course of household and office removals; baggage and articles accompanying travellers; motor vehicles being moved for re-pair; other non-market goods n.e.c.
D18 Grouped goods: a mixture of types of goods which are transported together
D19 Unidentifiable goods: goods which for any reason cannot be identified and therefore cannot be assigned to groups 01-16
D20 Other goods n.e.c.
These data show that inland navigation continues to ensure the supply of raw materials
for the manufacturing industry and plays an important role in container transport to and
from the northwestern European seaports. In the greater Rhine area, inland waterway
transport is thus an indispensable part of the logistics chain.
18
Fig. 2.4: Goods transported in the riparian states of the Rhine in 2016 excluding
Switzerland [Dat15]
In contrast to freight transportation, only very little statistical information is available about
passenger transportation which is mostly for tourist purposes like river cruises or short
distance transportation on ferries.
0
50000
100000
150000
200000
250000
300000
350000
400000
Netherlands Germany Belgium France
Go
od
s tra
nsp
ort
ed / 1
00
0 t
D01 D02 D03 D04 D07 D08 D09 D10 D14 D16 D19
19
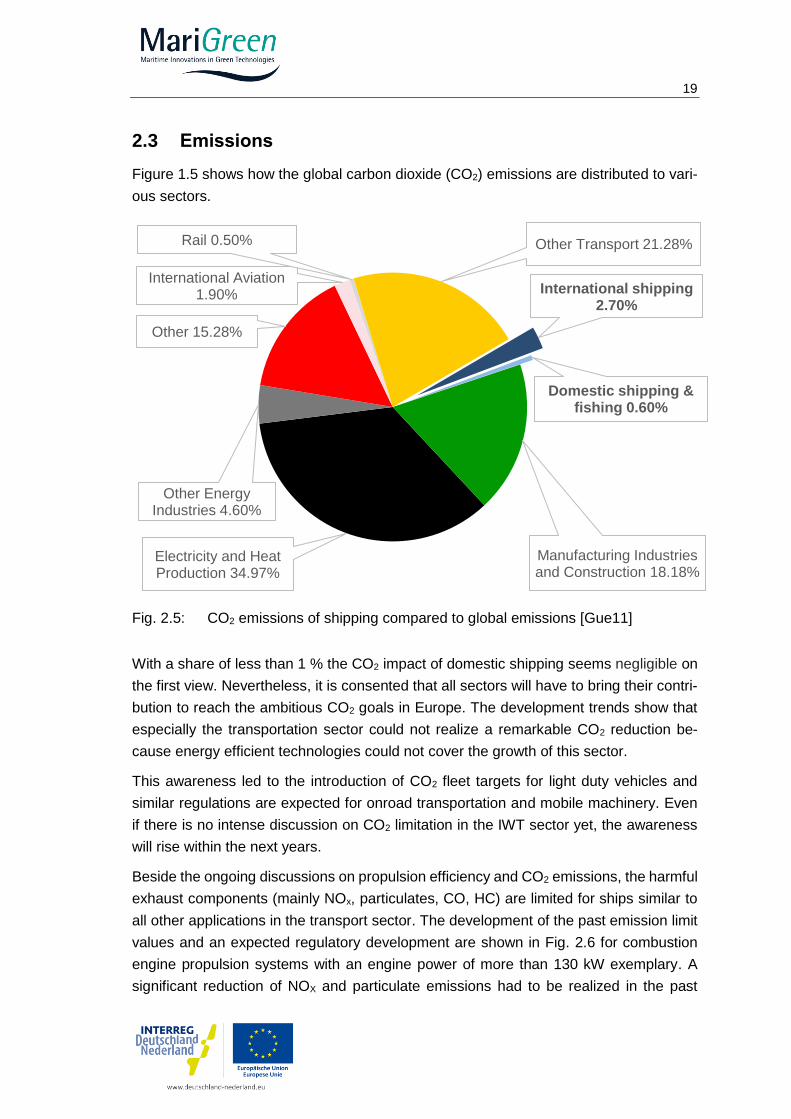
2.3 Emissions
Figure 1.5 shows how the global carbon dioxide (CO2) emissions are distributed to vari-
ous sectors.
Fig. 2.5: CO2 emissions of shipping compared to global emissions [Gue11]
With a share of less than 1 % the CO2 impact of domestic shipping seems negligible on
the first view. Nevertheless, it is consented that all sectors will have to bring their contri-
bution to reach the ambitious CO2 goals in Europe. The development trends show that
especially the transportation sector could not realize a remarkable CO2 reduction be-
cause energy efficient technologies could not cover the growth of this sector.
This awareness led to the introduction of CO2 fleet targets for light duty vehicles and
similar regulations are expected for onroad transportation and mobile machinery. Even
if there is no intense discussion on CO2 limitation in the IWT sector yet, the awareness
will rise within the next years.
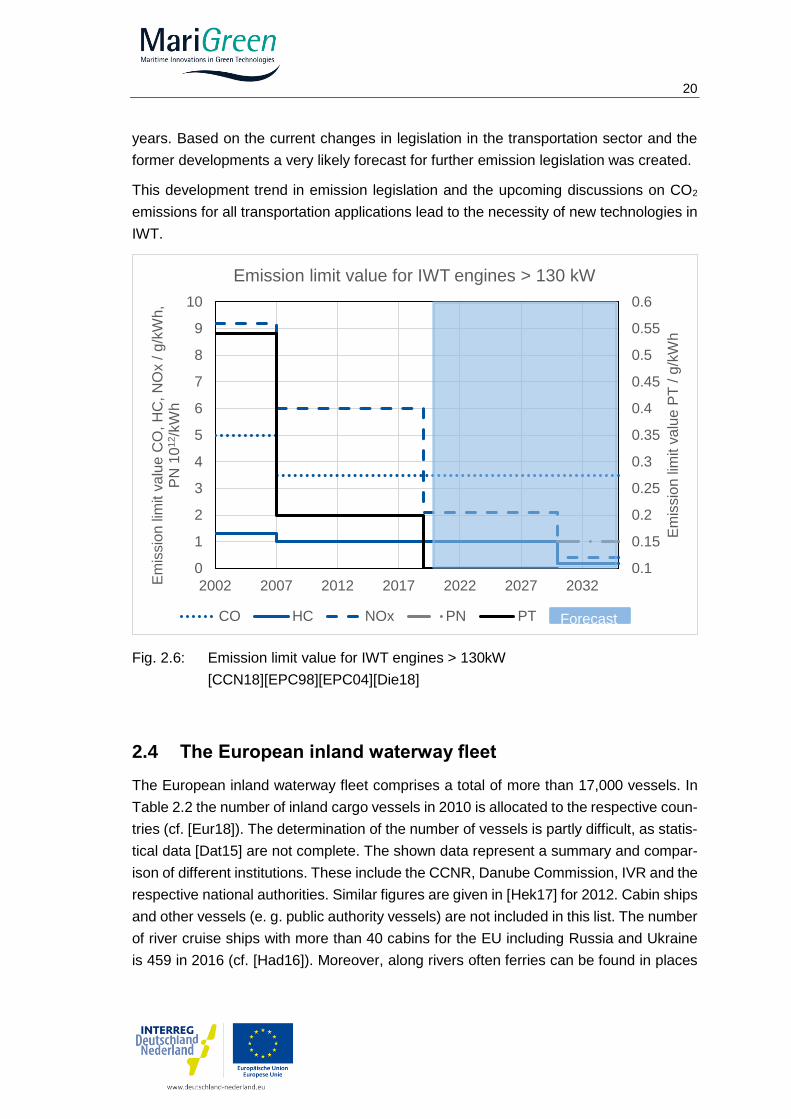
Beside the ongoing discussions on propulsion efficiency and CO2 emissions, the harmful
exhaust components (mainly NOx, particulates, CO, HC) are limited for ships similar to
all other applications in the transport sector. The development of the past emission limit
values and an expected regulatory development are shown in Fig. 2.6 for combustion
engine propulsion systems with an engine power of more than 130 kW exemplary. A
significant reduction of NOX and particulate emissions had to be realized in the past
Electricity and Heat Production 34.97%
Other Energy Industries 4.60%
Other 15.28%
International Aviation1.90%
Rail 0.50% Other Transport 21.28%
International shipping2.70%
Domestic shipping & fishing 0.60%
Manufacturing Industries and Construction 18.18%
20
years. Based on the current changes in legislation in the transportation sector and the
former developments a very likely forecast for further emission legislation was created.
This development trend in emission legislation and the upcoming discussions on CO2
emissions for all transportation applications lead to the necessity of new technologies in
IWT.
Fig. 2.6: Emission limit value for IWT engines > 130kW
[CCN18][EPC98][EPC04][Die18]
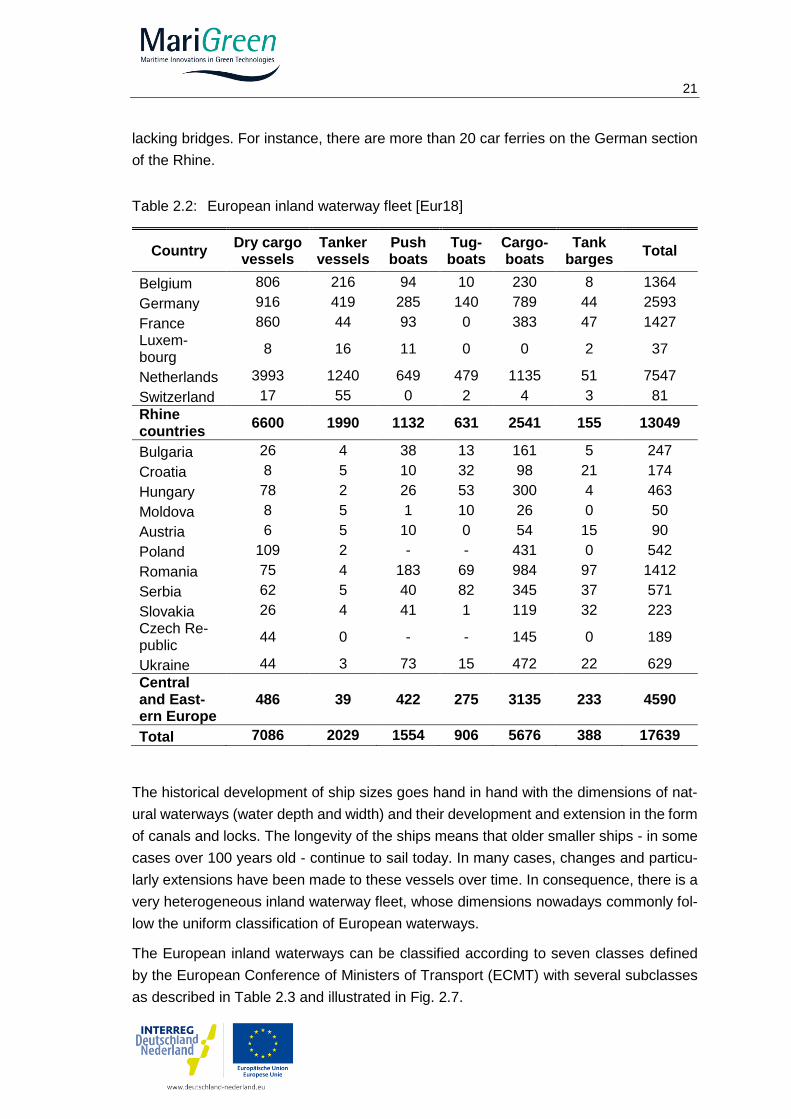
2.4 The European inland waterway fleet
The European inland waterway fleet comprises a total of more than 17,000 vessels. In
Table 2.2 the number of inland cargo vessels in 2010 is allocated to the respective coun-
tries (cf. [Eur18]). The determination of the number of vessels is partly difficult, as statis-
tical data [Dat15] are not complete. The shown data represent a summary and compar-
ison of different institutions. These include the CCNR, Danube Commission, IVR and the
respective national authorities. Similar figures are given in [Hek17] for 2012. Cabin ships
and other vessels (e. g. public authority vessels) are not included in this list. The number
of river cruise ships with more than 40 cabins for the EU including Russia and Ukraine
is 459 in 2016 (cf. [Had16]). Moreover, along rivers often ferries can be found in places
0.1
0.15
0.2
0.25
0.3
0.35
0.4
0.45
0.5
0.55
0.6
0
1
2
3
4
5
6
7
8
9
10
2002 2007 2012 2017 2022 2027 2032
Em
issio
n lim
it v
alu
e P
T / g
/kW
h
Em
issio
n lim
it v
alu
e C
O, H
C, N
Ox /
g/k
Wh
, P
N 1
01
2/k
Wh
Emission limit value for IWT engines > 130 kW
CO HC NOx PN PT Forecast
21
lacking bridges. For instance, there are more than 20 car ferries on the German section
of the Rhine.
Table 2.2: European inland waterway fleet [Eur18]
Country Dry cargo vessels
Tanker vessels
Push boats
Tug-boats
Cargo-boats
Tank barges
Total
Belgium 806 216 94 10 230 8 1364
Germany 916 419 285 140 789 44 2593
France 860 44 93 0 383 47 1427
Luxem-bourg
8 16 11 0 0 2 37
Netherlands 3993 1240 649 479 1135 51 7547
Switzerland 17 55 0 2 4 3 81
Rhine countries
6600 1990 1132 631 2541 155 13049
Bulgaria 26 4 38 13 161 5 247
Croatia 8 5 10 32 98 21 174
Hungary 78 2 26 53 300 4 463
Moldova 8 5 1 10 26 0 50
Austria 6 5 10 0 54 15 90
Poland 109 2 - - 431 0 542
Romania 75 4 183 69 984 97 1412
Serbia 62 5 40 82 345 37 571
Slovakia 26 4 41 1 119 32 223
Czech Re-public
44 0 - - 145 0 189
Ukraine 44 3 73 15 472 22 629
Central and East-ern Europe
486 39 422 275 3135 233 4590
Total 7086 2029 1554 906 5676 388 17639
The historical development of ship sizes goes hand in hand with the dimensions of nat-
ural waterways (water depth and width) and their development and extension in the form
of canals and locks. The longevity of the ships means that older smaller ships - in some
cases over 100 years old - continue to sail today. In many cases, changes and particu-
larly extensions have been made to these vessels over time. In consequence, there is a
very heterogeneous inland waterway fleet, whose dimensions nowadays commonly fol-
low the uniform classification of European waterways.
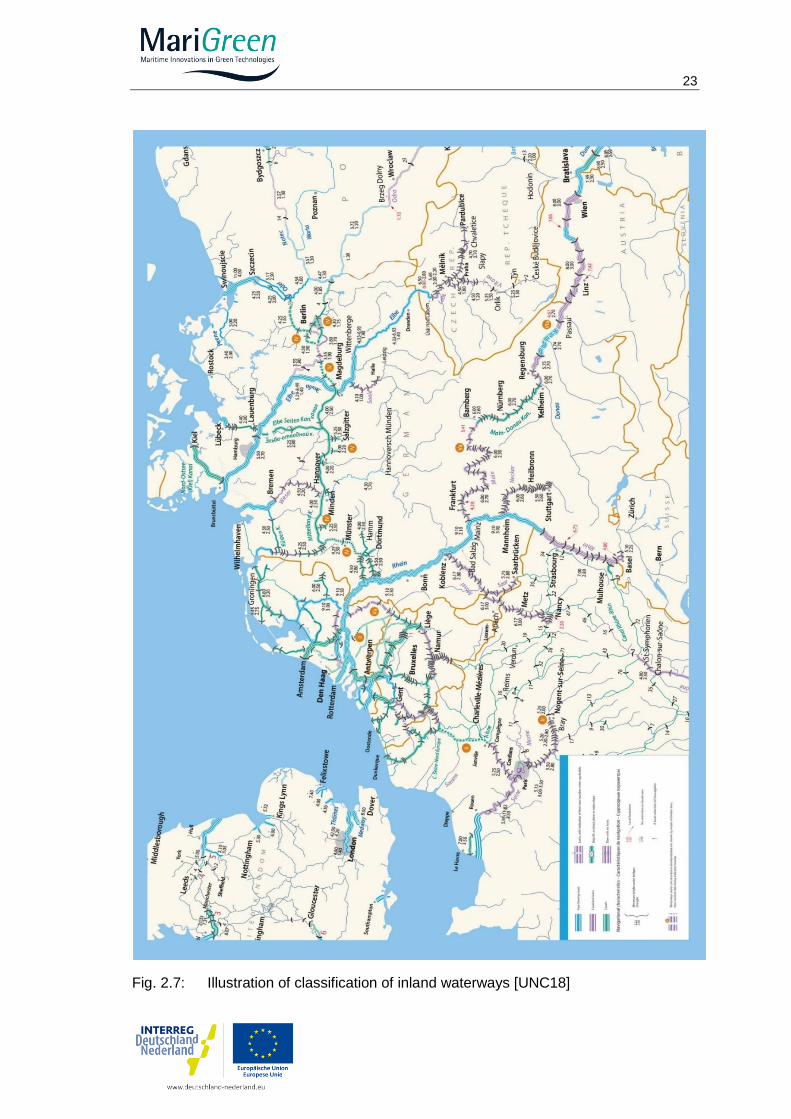
The European inland waterways can be classified according to seven classes defined
by the European Conference of Ministers of Transport (ECMT) with several subclasses
as described in Table 2.3 and illustrated in Fig. 2.7.
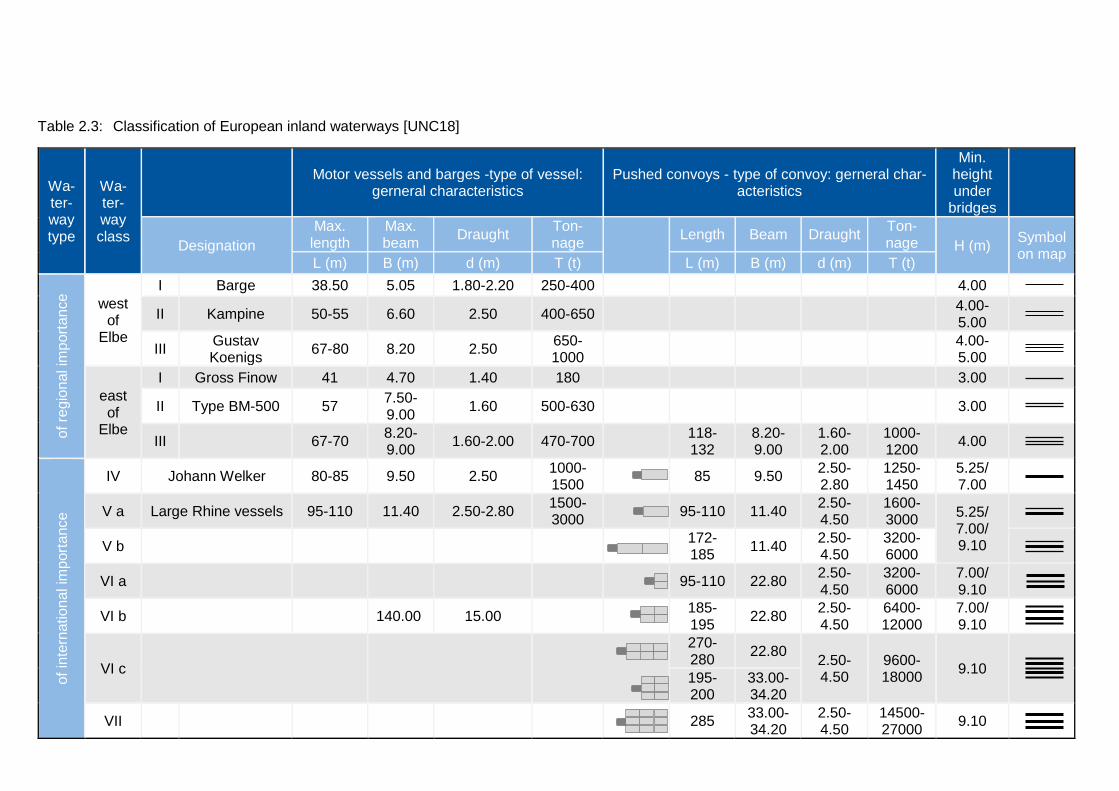
Table 2.3: Classification of European inland waterways [UNC18]
Wa-ter-way type
Wa-ter-way class
Motor vessels and barges -type of vessel:
gerneral characteristics Pushed convoys - type of convoy: gerneral char-
acteristics
Min. height under
bridges
Designation
Max. length
Max. beam
Draught Ton-nage
Length Beam Draught Ton-nage H (m)
Symbol on map
L (m) B (m) d (m) T (t) L (m) B (m) d (m) T (t)
of re
gio
na
l im
port
ance
west of
Elbe
I Barge 38.50 5.05 1.80-2.20 250-400 4.00
II Kampine 50-55 6.60 2.50 400-650 4.00-5.00
III Gustav Koenigs
67-80 8.20 2.50 650-1000
4.00-5.00
east of
Elbe
I Gross Finow 41 4.70 1.40 180 3.00
II Type BM-500 57 7.50-9.00
1.60 500-630 3.00
III 67-70 8.20-9.00
1.60-2.00 470-700 118-132
8.20-9.00
1.60-2.00
1000-1200
4.00
of
inte
rnatio
na
l im
port
ance
IV Johann Welker 80-85 9.50 2.50 1000-1500
85 9.50 2.50-2.80
1250-1450
5.25/ 7.00
V a Large Rhine vessels 95-110 11.40 2.50-2.80 1500-3000
95-110 11.40 2.50-4.50
1600-3000
5.25/ 7.00/ 9.10
V b 172-185
11.40 2.50-4.50
3200-6000
VI a 95-110 22.80 2.50-4.50
3200-6000
7.00/ 9.10
VI b 140.00 15.00 185-195
22.80 2.50-4.50
6400-12000
7.00/ 9.10
VI c
270-280
22.80 2.50-4.50
9600-18000
9.10 195-
200 33.00-34.20
VII
285 33.00-34.20
2.50-4.50
14500-27000
9.10
23
Fig. 2.7: Illustration of classification of inland waterways [UNC18]
24
In order to achieve the best possible portrayal of the inland waterway fleet, the following
types of vessels will therefore be used, which differ in size as well as their operational
profile. Nevertheless, the selection considers the most common types and sizes of ships
for various application cases. These are a cargo vessel that can navigate on the all nav-
igable German rivers and canals, a pushed convoy as it is common especially on the
Lower Rhine, a cabin vessel that runs on bigger German rivers and river ferry which can
be found in many places. Based on these types of vessels, the application of hydrogen
is investigated in this project. However, it should always be kept in mind that a theoretical
transformation to hydrogen propulsion requires many individual solutions for different
ship sizes. A good compilation of the different types of inland waterway vessels with data
on dimensions and motorization can be found in [Ste16].
2.4.1 Cargo vessel
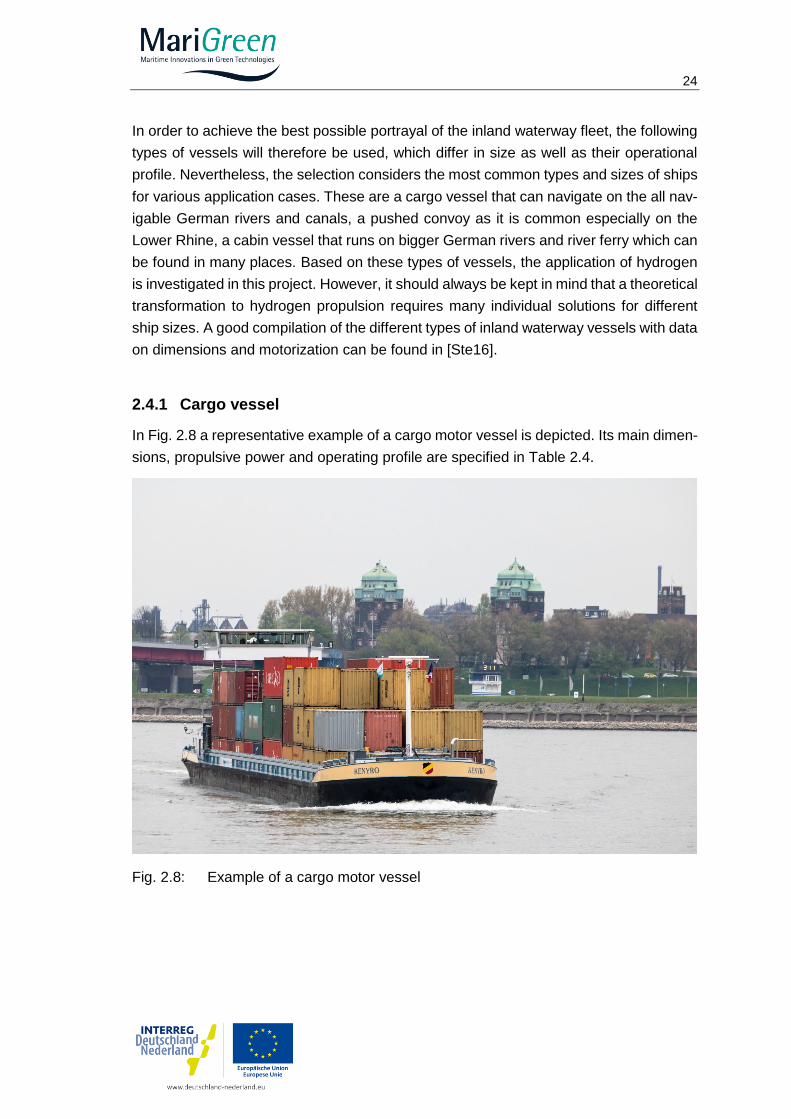
In Fig. 2.8 a representative example of a cargo motor vessel is depicted. Its main dimen-
sions, propulsive power and operating profile are specified in Table 2.4.
Fig. 2.8: Example of a cargo motor vessel
25
Table 2.4: Dimensions and operating profile of a cargo motor vessel
Cargo Vessel
Dimensions Length 110 m Width 11.45 m Max. draught 3.65 Cargo capacity 3285 t
Container capacity 192 TEU
Propulsive power Main engine 1300 kW
Bow thruster 500 kW
The required propulsion power strongly depends on the area of operation. On the Rhine,
the maximum propulsion power is selected in such way that the ship can navigate the
difficult route between Bingen and St. Goarshausen without external help. This route is
characterized by its narrow, curvy profile resulting in high currents. For tributary streams
as well as canals the necessary power is lower than for the Rhine. Self-evidently the
power for running upstream is higher than that for running downstream. Additionally, the
power requirement depends greatly on the driven speed.
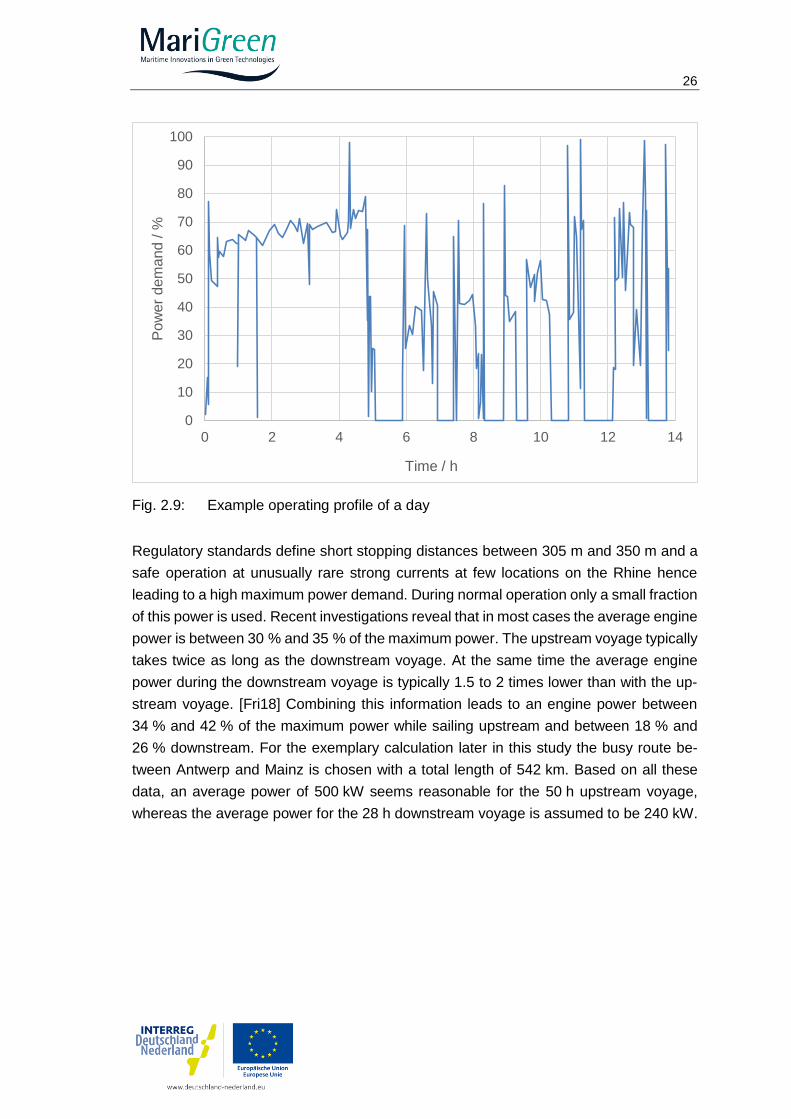
In Fig. 2.9 an exemplary load profile is presented for a cargo motor vessel first moving
upstream on a large river and then traveling upstream into a tributary stream. The phases
of zero power represent the locking processes. This particular ship is equipped with rel-
atively little maximum power of 1100 kW and because of a good order situation was
operated at high speed during the measurements. It should be noted that the load profile
can look completely different depending on the specific situation. Influencing factors are
the travel area, the weather, the order situation, etc. Nevertheless, the exemplary profile
represents a good mix and realistic relationships of the various operating conditions.
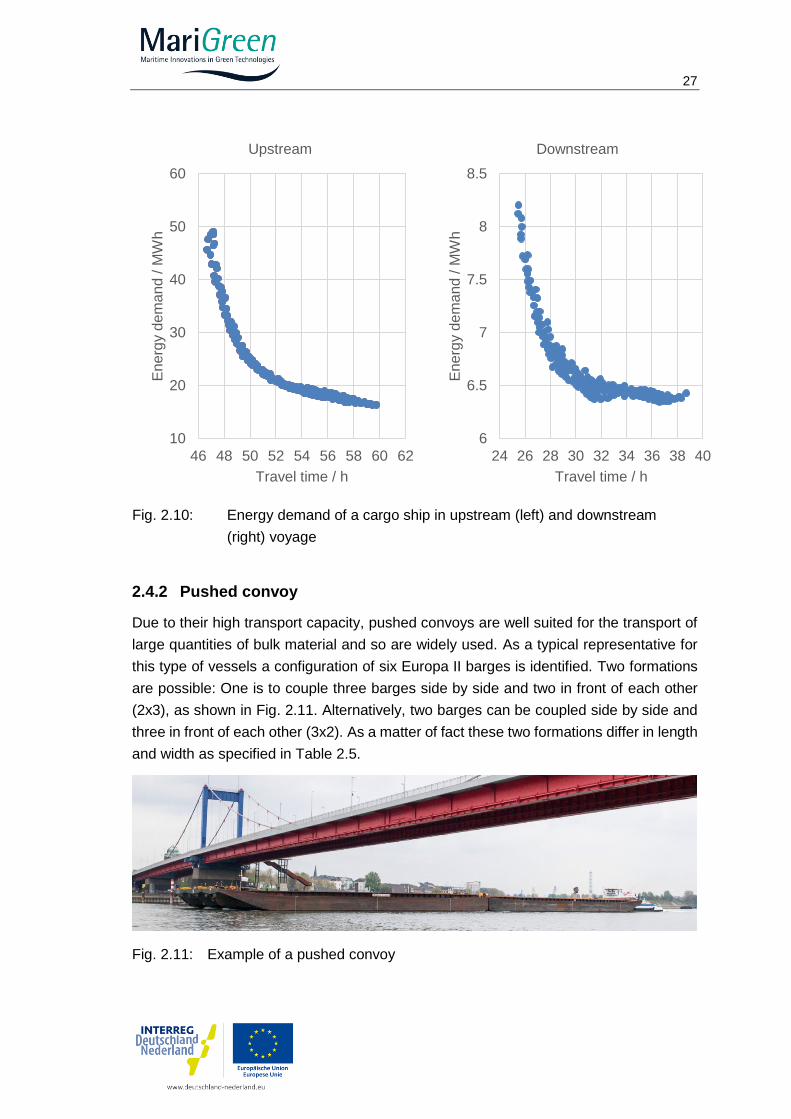
Using data on natural discharge conditions and water levels in relation to the seasons
and simulation of shipping under each condition, the correlation between energy demand
and duration of voyages can be determined. Fig. 2.10 show this correlation for the up-
stream and downstream voyage, respectively.
26
Fig. 2.9: Example operating profile of a day
Regulatory standards define short stopping distances between 305 m and 350 m and a
safe operation at unusually rare strong currents at few locations on the Rhine hence
leading to a high maximum power demand. During normal operation only a small fraction
of this power is used. Recent investigations reveal that in most cases the average engine
power is between 30 % and 35 % of the maximum power. The upstream voyage typically
takes twice as long as the downstream voyage. At the same time the average engine
power during the downstream voyage is typically 1.5 to 2 times lower than with the up-
stream voyage. [Fri18] Combining this information leads to an engine power between
34 % and 42 % of the maximum power while sailing upstream and between 18 % and
26 % downstream. For the exemplary calculation later in this study the busy route be-
tween Antwerp and Mainz is chosen with a total length of 542 km. Based on all these
data, an average power of 500 kW seems reasonable for the 50 h upstream voyage,
whereas the average power for the 28 h downstream voyage is assumed to be 240 kW.
0
10
20
30
40
50
60
70
80
90
100
0 2 4 6 8 10 12 14
Po
we
r d
em
and
/ %
Time / h
27
Fig. 2.10: Energy demand of a cargo ship in upstream (left) and downstream
(right) voyage
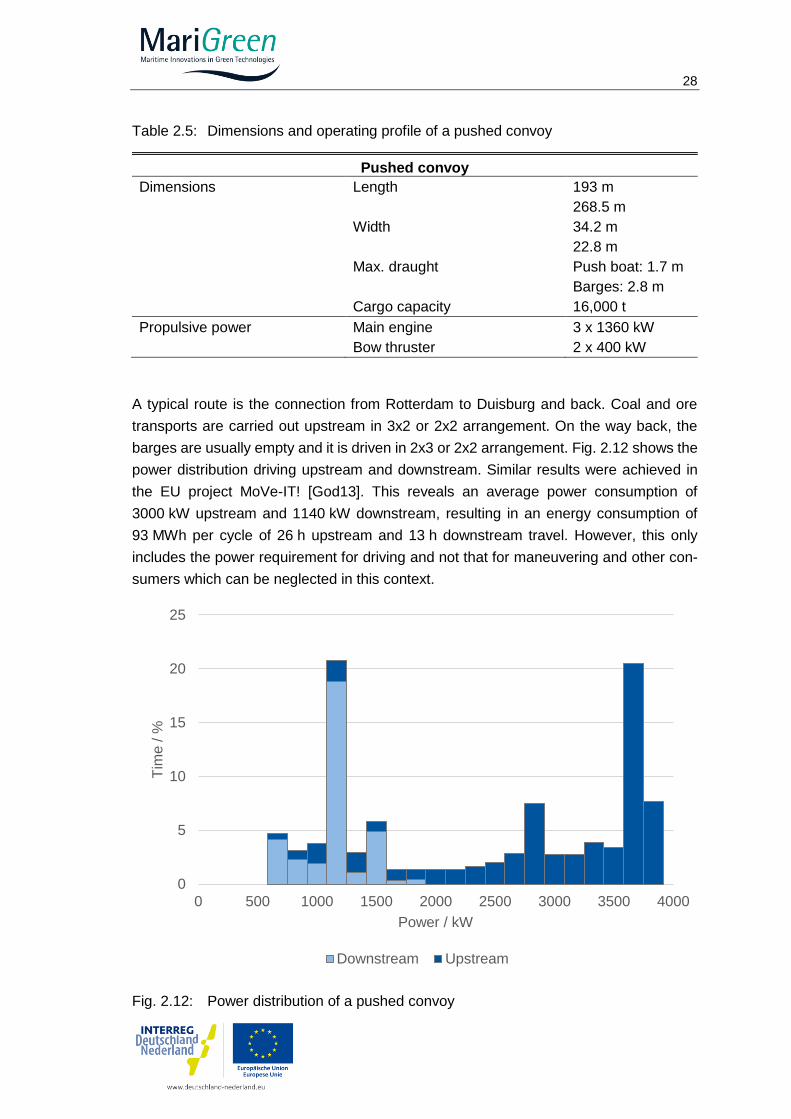
2.4.2 Pushed convoy
Due to their high transport capacity, pushed convoys are well suited for the transport of
large quantities of bulk material and so are widely used. As a typical representative for
this type of vessels a configuration of six Europa II barges is identified. Two formations
are possible: One is to couple three barges side by side and two in front of each other
(2x3), as shown in Fig. 2.11. Alternatively, two barges can be coupled side by side and
three in front of each other (3x2). As a matter of fact these two formations differ in length
and width as specified in Table 2.5.
Fig. 2.11: Example of a pushed convoy
10
20
30
40
50
60
46 48 50 52 54 56 58 60 62
En
erg
y d
em
and
/ M
Wh
Travel time / h
Upstream
6
6.5
7
7.5
8
8.5
24 26 28 30 32 34 36 38 40E
nerg
y d
em
and
/ M
Wh
Travel time / h
Downstream
28
Table 2.5: Dimensions and operating profile of a pushed convoy
Pushed convoy
Dimensions Length 193 m 268.5 m Width 34.2 m 22.8 m Max. draught Push boat: 1.7 m Barges: 2.8 m
Cargo capacity 16,000 t
Propulsive power Main engine 3 x 1360 kW
Bow thruster 2 x 400 kW
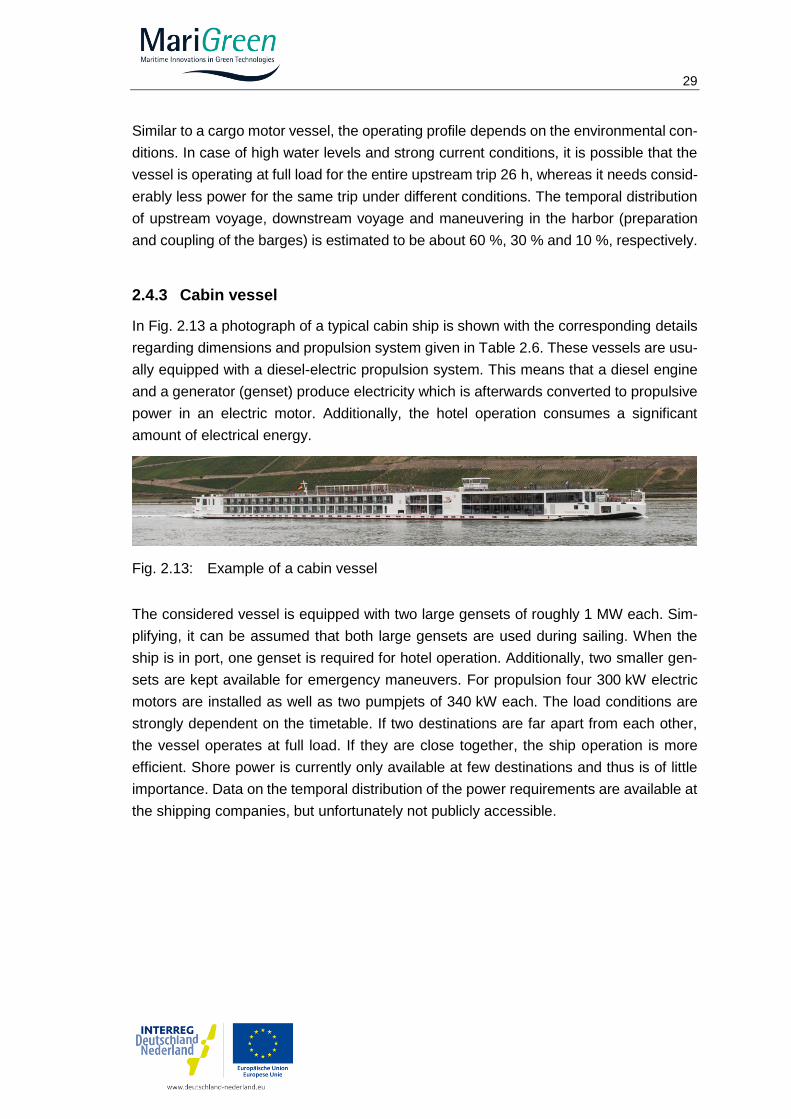
A typical route is the connection from Rotterdam to Duisburg and back. Coal and ore
transports are carried out upstream in 3x2 or 2x2 arrangement. On the way back, the
barges are usually empty and it is driven in 2x3 or 2x2 arrangement. Fig. 2.12 shows the
power distribution driving upstream and downstream. Similar results were achieved in
the EU project MoVe-IT! [God13]. This reveals an average power consumption of
3000 kW upstream and 1140 kW downstream, resulting in an energy consumption of
93 MWh per cycle of 26 h upstream and 13 h downstream travel. However, this only
includes the power requirement for driving and not that for maneuvering and other con-
sumers which can be neglected in this context.
Fig. 2.12: Power distribution of a pushed convoy
0
5
10
15
20
25
0 500 1000 1500 2000 2500 3000 3500 4000
Tim
e / %
Power / kW
Downstream Upstream
29
Similar to a cargo motor vessel, the operating profile depends on the environmental con-
ditions. In case of high water levels and strong current conditions, it is possible that the
vessel is operating at full load for the entire upstream trip 26 h, whereas it needs consid-
erably less power for the same trip under different conditions. The temporal distribution
of upstream voyage, downstream voyage and maneuvering in the harbor (preparation
and coupling of the barges) is estimated to be about 60 %, 30 % and 10 %, respectively.
2.4.3 Cabin vessel
In Fig. 2.13 a photograph of a typical cabin ship is shown with the corresponding details
regarding dimensions and propulsion system given in Table 2.6. These vessels are usu-
ally equipped with a diesel-electric propulsion system. This means that a diesel engine
and a generator (genset) produce electricity which is afterwards converted to propulsive
power in an electric motor. Additionally, the hotel operation consumes a significant
amount of electrical energy.
Fig. 2.13: Example of a cabin vessel
The considered vessel is equipped with two large gensets of roughly 1 MW each. Sim-
plifying, it can be assumed that both large gensets are used during sailing. When the
ship is in port, one genset is required for hotel operation. Additionally, two smaller gen-
sets are kept available for emergency maneuvers. For propulsion four 300 kW electric
motors are installed as well as two pumpjets of 340 kW each. The load conditions are
strongly dependent on the timetable. If two destinations are far apart from each other,
the vessel operates at full load. If they are close together, the ship operation is more
efficient. Shore power is currently only available at few destinations and thus is of little
importance. Data on the temporal distribution of the power requirements are available at
the shipping companies, but unfortunately not publicly accessible.
30
Table 2.6: Dimensions and operating profile of a cabin vessel
Cabin Vessel
Dimensions Length 135 m Width 11.45 m Max. draught 2 m Passengers 190
Crew 45
Propulsive power Diesel electric engine
Gensets 2x994 kW
2x383 kW Propulsion 4x300 kW
Pumpjets 2x340 kW
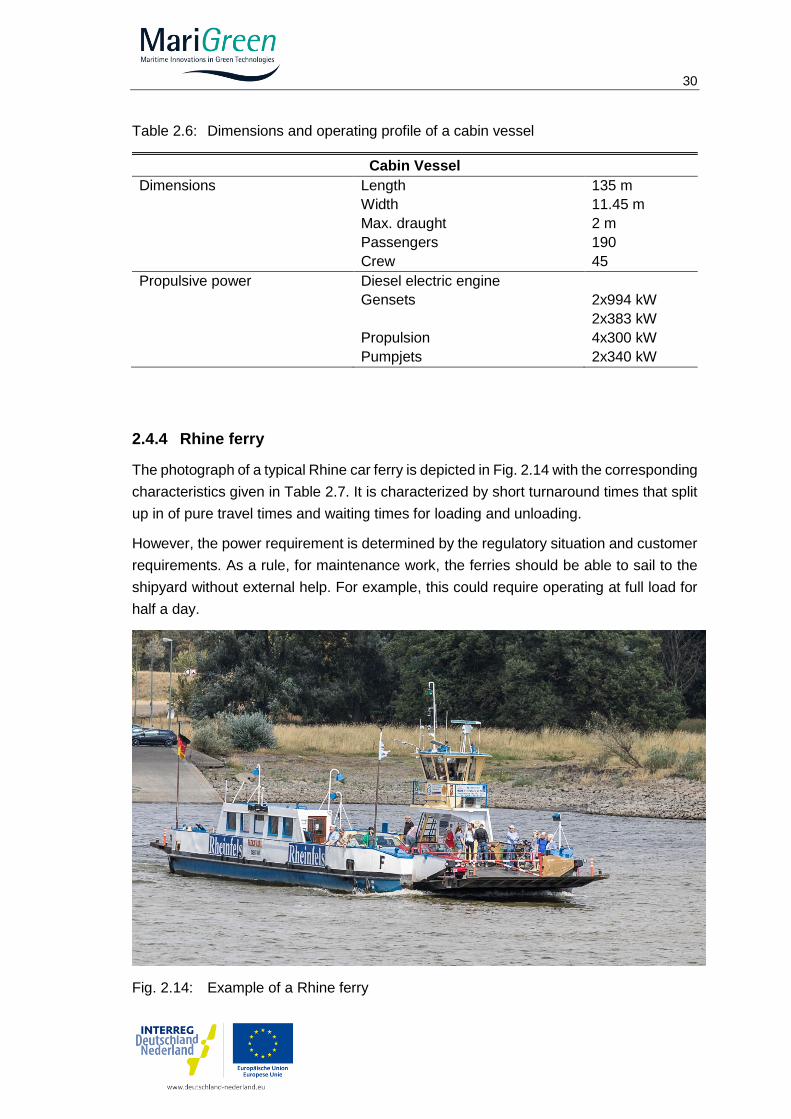
2.4.4 Rhine ferry
The photograph of a typical Rhine car ferry is depicted in Fig. 2.14 with the corresponding
characteristics given in Table 2.7. It is characterized by short turnaround times that split
up in of pure travel times and waiting times for loading and unloading.
However, the power requirement is determined by the regulatory situation and customer
requirements. As a rule, for maintenance work, the ferries should be able to sail to the
shipyard without external help. For example, this could require operating at full load for
half a day.
Fig. 2.14: Example of a Rhine ferry
31
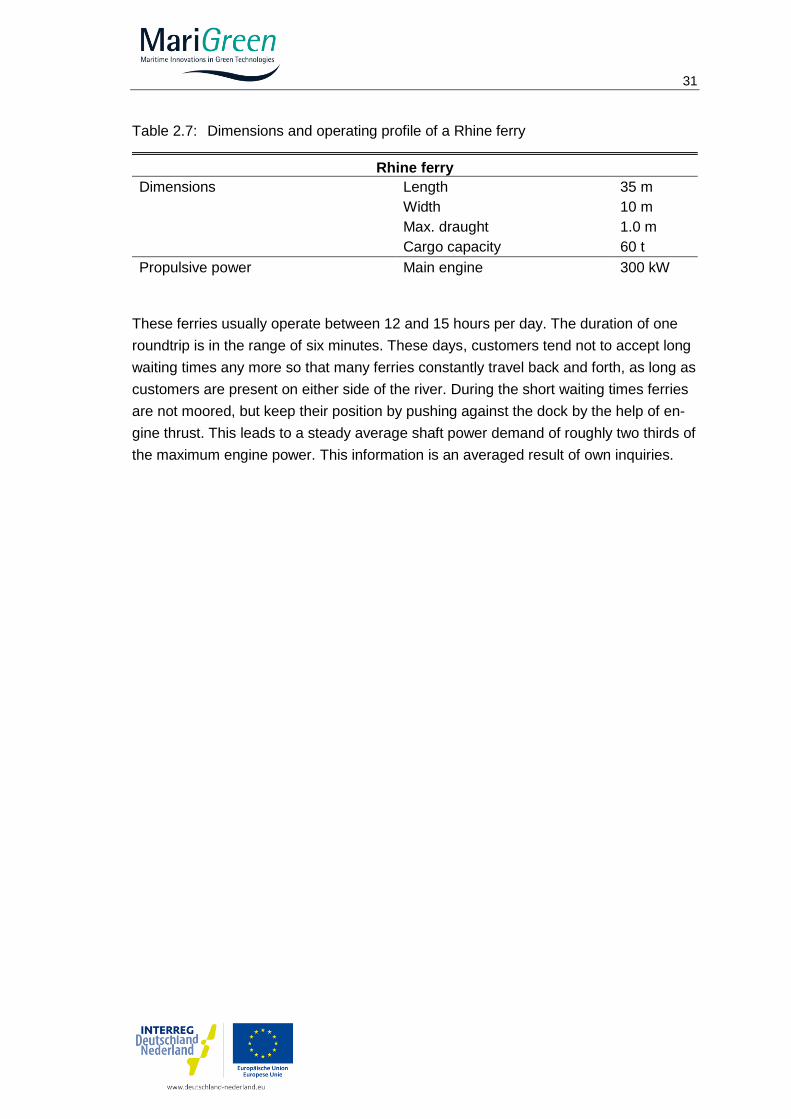
Table 2.7: Dimensions and operating profile of a Rhine ferry
Rhine ferry
Dimensions Length 35 m Width 10 m Max. draught 1.0 m Cargo capacity 60 t
Propulsive power Main engine 300 kW
These ferries usually operate between 12 and 15 hours per day. The duration of one
roundtrip is in the range of six minutes. These days, customers tend not to accept long
waiting times any more so that many ferries constantly travel back and forth, as long as
customers are present on either side of the river. During the short waiting times ferries
are not moored, but keep their position by pushing against the dock by the help of en-
gine thrust. This leads to a steady average shaft power demand of roughly two thirds of
the maximum engine power. This information is an averaged result of own inquiries.
32
3 Hydrogen Applications: Current Status
In this chapter, the current status of hydrogen applications is presented beginning with
hydrogen projects in the shipping sector in section 3.1. This is followed by a description
of the developments in other sectors the technologies might be transferred from in sec-
tion 3.2. Finally, in section 3.3 the chemical properties of hydrogen are presented point-
ing out the advantages and challenges of hydrogen use.
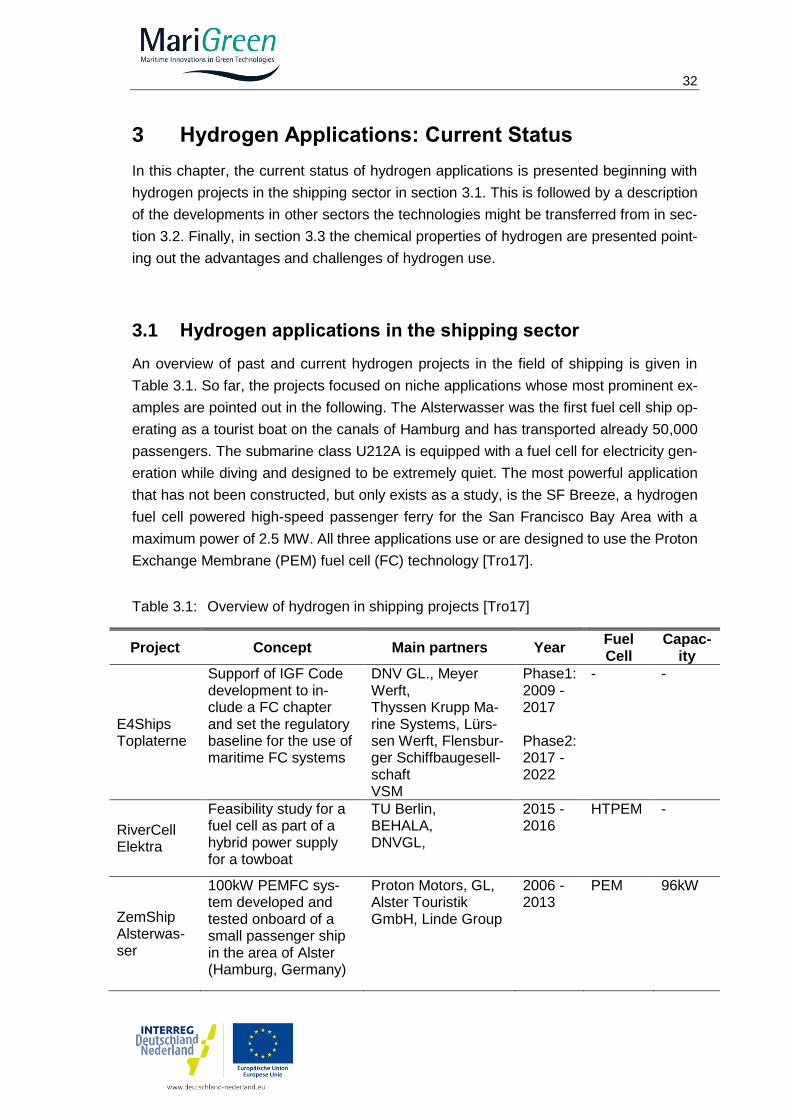
3.1 Hydrogen applications in the shipping sector
An overview of past and current hydrogen projects in the field of shipping is given in
Table 3.1. So far, the projects focused on niche applications whose most prominent ex-
amples are pointed out in the following. The Alsterwasser was the first fuel cell ship op-
erating as a tourist boat on the canals of Hamburg and has transported already 50,000
passengers. The submarine class U212A is equipped with a fuel cell for electricity gen-
eration while diving and designed to be extremely quiet. The most powerful application
that has not been constructed, but only exists as a study, is the SF Breeze, a hydrogen
fuel cell powered high-speed passenger ferry for the San Francisco Bay Area with a
maximum power of 2.5 MW. All three applications use or are designed to use the Proton
Exchange Membrane (PEM) fuel cell (FC) technology [Tro17].
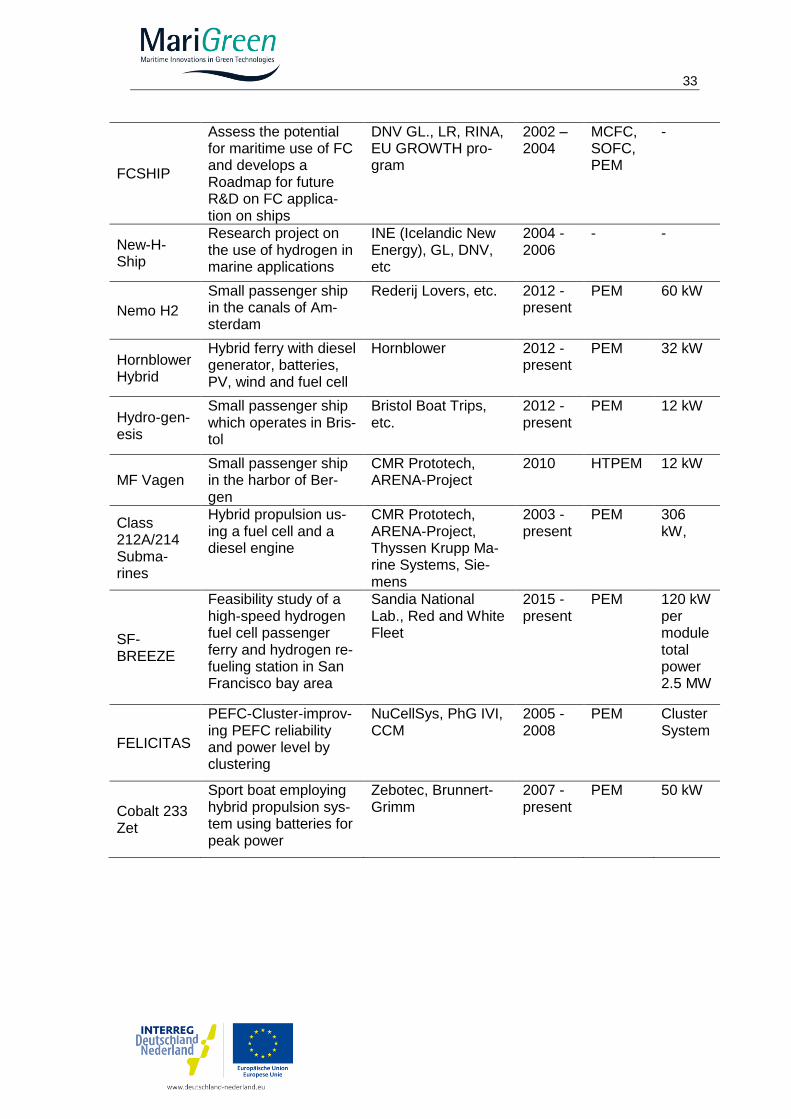
Table 3.1: Overview of hydrogen in shipping projects [Tro17]
Project Concept Main partners Year Fuel Cell
Capac-ity
E4Ships Toplaterne
Supporf of IGF Code development to in-clude a FC chapter and set the regulatory baseline for the use of maritime FC systems
DNV GL., Meyer Werft, Thyssen Krupp Ma-rine Systems, Lürs-sen Werft, Flensbur-ger Schiffbaugesell-schaft VSM
Phase1: 2009 - 2017 Phase2: 2017 - 2022
- -
RiverCell Elektra
Feasibility study for a fuel cell as part of a hybrid power supply for a towboat
TU Berlin, BEHALA, DNVGL,
2015 - 2016
HTPEM -
ZemShip Alsterwas-ser
100kW PEMFC sys-tem developed and tested onboard of a small passenger ship in the area of Alster (Hamburg, Germany)
Proton Motors, GL, Alster Touristik GmbH, Linde Group
2006 - 2013
PEM 96kW
33
FCSHIP
Assess the potential for maritime use of FC and develops a Roadmap for future R&D on FC applica-tion on ships
DNV GL., LR, RINA, EU GROWTH pro-gram
2002 – 2004
MCFC, SOFC, PEM
-
New-H-Ship
Research project on the use of hydrogen in marine applications
INE (Icelandic New Energy), GL, DNV, etc
2004 - 2006
- -
Nemo H2
Small passenger ship in the canals of Am-sterdam
Rederij Lovers, etc. 2012 - present
PEM 60 kW
Hornblower Hybrid
Hybrid ferry with diesel generator, batteries, PV, wind and fuel cell
Hornblower 2012 - present
PEM 32 kW
Hydro-gen-esis
Small passenger ship which operates in Bris-tol
Bristol Boat Trips, etc.
2012 - present
PEM 12 kW
MF Vagen Small passenger ship in the harbor of Ber-gen
CMR Prototech, ARENA-Project
2010 HTPEM 12 kW
Class 212A/214 Subma-rines
Hybrid propulsion us-ing a fuel cell and a diesel engine
CMR Prototech, ARENA-Project, Thyssen Krupp Ma-rine Systems, Sie-mens
2003 - present
PEM 306 kW,
SF-BREEZE
Feasibility study of a high-speed hydrogen fuel cell passenger ferry and hydrogen re-fueling station in San Francisco bay area
Sandia National Lab., Red and White Fleet
2015 - present
PEM 120 kW per module total power 2.5 MW
FELICITAS
PEFC-Cluster-improv-ing PEFC reliability and power level by clustering
NuCellSys, PhG IVI, CCM
2005 -2008
PEM Cluster System
Cobalt 233 Zet
Sport boat employing hybrid propulsion sys-tem using batteries for peak power
Zebotec, Brunnert-Grimm
2007 - present
PEM 50 kW
34
3.2 Possibilities of technology transfer
In the field of forklifts and similar industrial trucks, in Germany solutions with electric
motors and fuel cell drives are already market-available from a number of manufacturers
and are tested in practice [HMU13]. In the city of Basel in Switzerland, a sweeper with
fuel cell drive was tested in a field trial. In addition to a significant reduction in energy
consumption, however, problems with practical suitability were also identified [Emp18].
The prerequisite for operating hydrogen powered vehicles is the availability of hydrogen
as fuel, for example in the form of gas stations on the company premises. With increasing
numbers of produced units and the consistent suitability for practical use, prices can be
expected to drop significantly facilitating a large-scale introduction of these vehicles.
Fuel cell drives have also been developed in the field of local public transportation with
buses [FCB17a] and private car transport in recent years. Meanwhile, serial production
fuel cell drive passenger cars are available on the European marked and further models
have been announced for the next years from leading car manufactures. In France the
first FC e-bike was introduced in 2018 [Huc18]. In Germany, the National Innovation
Program Hydrogen and Fuel Cell Technology (NIP) [NIP18] promotes development in all
modes of transport. In 2017 Alstom introduced a fuel cell powered regional train [Als18]
that has entered commercial operation in September 2018. In February 2018 also Sie-
mens announced to develop a fuel cell drive for trains in cooperation with RWTH Aachen
University [NOW18].
Beside all these smaller initiatives, the first country having established a comprehensive
strategy for hydrogen is Japan [BHS18]. This strategy aims for a hydrogen based society
by 2050. The key aspects are:
1. Realizing low-cost hydrogen use
2. Developing international hydrogen supply chains
3. Renewable energy expansion in Japan and regional revitalization
4. Hydrogen use in power generation
5. Hydrogen use in mobility
6. Hydrogen use in industrial processes and heat utilization
7. Using fuel cell technologies
8. Using innovative technologies
9. International expansion
10. Promotion of citizens’ understanding and regional cooperation
Within the subaspect "Hydrogen use in mobility" Japan aims at 200,000 hydrogen vehi-
cles and a network of 320 independent hydrogen stations by 2025. The hydrogen pro-
duction shall be renewable-based and a commercialization of the hydrogen stations is to
be pushed. The number of FC buses shall be increased to around 100 by 2020 and
around 1200 by 2030. In the same time frames, the number of hydrogen powered forklifts
35
shall rise from 500 to 10,000. Moreover, the development and commercialization of FC
trucks and the promotion of FCs for ships is included in the strategy.
In a similar timeframe the European institutions like H2-Mobility aim to initialize up to 400
hydrogen gas stations to enable a significant rise of the fuel cell vehicle share in Europe.
The increasing level of activities in the automotive sector can have a positive impact on
the use of the technology in shipping. It can be expected that prices for hydrogen as well
as components such as storage tanks and energy conversion technologies will drop with
the technology being on the rise. Simultaneously, the number of suppliers, the variety of
components, as well as their performance and reliability will increase. The shipping sec-
tor can also profit from advancements in the hydrogen infrastructure
Besides making use of similarities with the automotive sector, the shipping industry can
profit even more from the experience with hydrogen applications in trains. This is be-
cause to a certain extent the boundary conditions in the shipping and railroad sectors
are alike. In both cases, a propulsion power of up to several MW is used. The large
number of daily operating hours comes along with long design ranges. Furthermore, both
ships and trains are constructed for a lifetime of ten thousands of operating hours. Dif-
ferences can be seen in the power profile which tends to be more dynamic with trains
than with ships. This, however, cannot be generalized since it highly depends on the
very specific use cases.
3.3 Hydrogen: Chemical properties
This section gives an overview of the occurrence and chemical properties of hydrogen.
With 93% of the existing atoms and 75% of the mass hydrogen is by far the most abun-
dant element in the universe mostly occurring in the atomic state (H) due to environmen-
tal conditions. On earth, because of its reactivity, hydrogen only occurs in bound form.
However, hydrogen is rarely found in the molecular form (H2 ). Instead, it is most common
in inorganic hydrides, especially in water (H2O) and in a variety of organic compounds
such as hydrocarbons, e.g. alcohols, aldehydes, acids, fats, carbohydrates or proteins
(see [Sic16] and [Eic10]). Due to the low atomic mass, hydrogen accounts for only 0.12%
of the earth’s mass. Table 3.2 summarizes the most important properties of hydrogen.
With a boiling temperature of -253 °C and a melting temperature of -259.2 °C, hydrogen
is an almost permanent gas. Since the critical temperature at -239.96 °C is also ex-
tremely low, a pressure increase to support liquefaction (critical pressure 13.1 bar) is
only possible to a limited extent.
With the stated ignition and detonation limits (see Table 3.2), hydrogen can ignite in a
wide range of concentrations compared to other fuels. In a combustion process, this
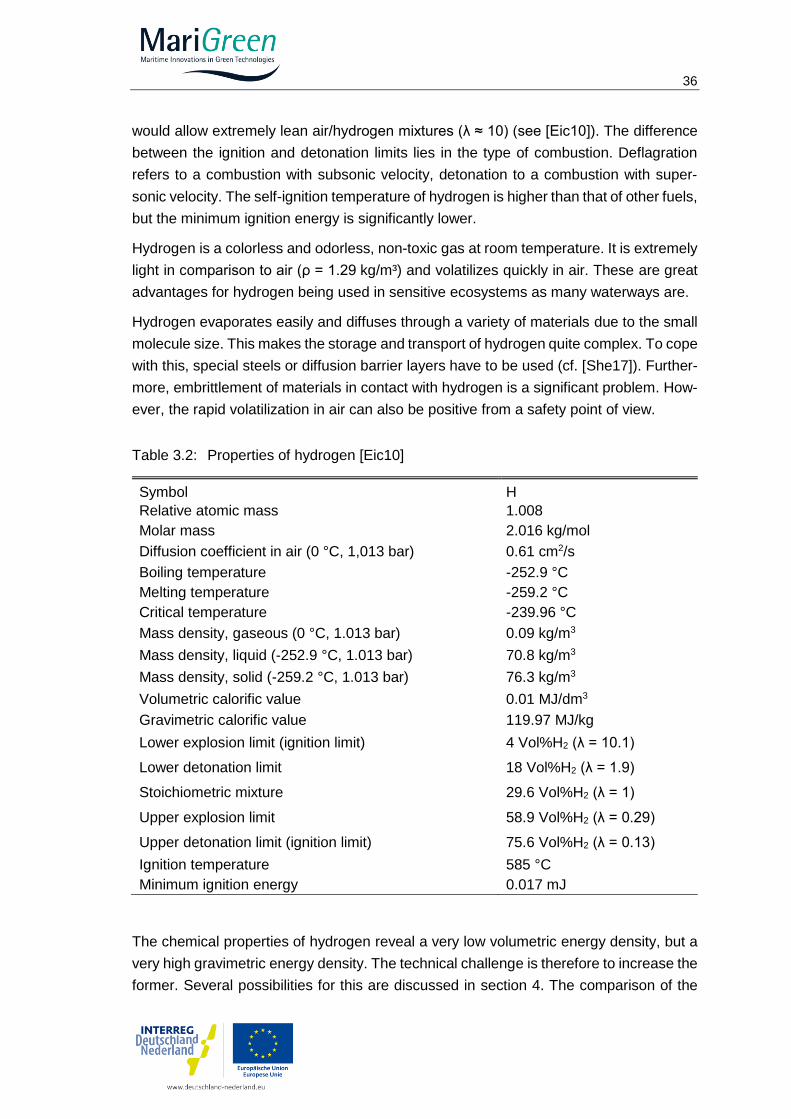
36
would allow extremely lean air/hydrogen mixtures (λ ≈ 10) (see [Eic10]). The difference
between the ignition and detonation limits lies in the type of combustion. Deflagration
refers to a combustion with subsonic velocity, detonation to a combustion with super-
sonic velocity. The self-ignition temperature of hydrogen is higher than that of other fuels,
but the minimum ignition energy is significantly lower.
Hydrogen is a colorless and odorless, non-toxic gas at room temperature. It is extremely
light in comparison to air (ρ = 1.29 kg/m³) and volatilizes quickly in air. These are great
advantages for hydrogen being used in sensitive ecosystems as many waterways are.
Hydrogen evaporates easily and diffuses through a variety of materials due to the small
molecule size. This makes the storage and transport of hydrogen quite complex. To cope
with this, special steels or diffusion barrier layers have to be used (cf. [She17]). Further-
more, embrittlement of materials in contact with hydrogen is a significant problem. How-
ever, the rapid volatilization in air can also be positive from a safety point of view.
Table 3.2: Properties of hydrogen [Eic10]
Symbol H
Relative atomic mass 1.008
Molar mass 2.016 kg/mol
Diffusion coefficient in air (0 °C, 1,013 bar) 0.61 cm2/s
Boiling temperature -252.9 °C
Melting temperature -259.2 °C
Critical temperature -239.96 °C
Mass density, gaseous (0 °C, 1.013 bar) 0.09 kg/m3
Mass density, liquid (-252.9 °C, 1.013 bar) 70.8 kg/m3
Mass density, solid (-259.2 °C, 1.013 bar) 76.3 kg/m3
Volumetric calorific value 0.01 MJ/dm3
Gravimetric calorific value 119.97 MJ/kg
Lower explosion limit (ignition limit) 4 Vol%H2 (λ = 10.1)
Lower detonation limit 18 Vol%H2 (λ = 1.9)
Stoichiometric mixture 29.6 Vol%H2 (λ = 1)
Upper explosion limit 58.9 Vol%H2 (λ = 0.29)
Upper detonation limit (ignition limit) 75.6 Vol%H2 (λ = 0.13)
Ignition temperature 585 °C
Minimum ignition energy 0.017 mJ
The chemical properties of hydrogen reveal a very low volumetric energy density, but a
very high gravimetric energy density. The technical challenge is therefore to increase the
former. Several possibilities for this are discussed in section 4. The comparison of the
37
net calorific values of some fuels is shown in Fig. 4.15. The given values are based on
publications [Bou11], [Bas16], [Höh03] and [Sta18]. A similar presentation is available in
[She17]. The values vary slightly in the literature, as the reference temperatures differ
and the composition of natural gas and fuels is different.
Hydrogen is a highly flammable gas which, due to its properties, is excellently suited as
a fuel. The handling requires great care and compliance with the safety regulations. How-
ever, the necessary safety regulations, if not yet existent, need not differ significantly
compared to other fuels as the hazards are very similar. Necessary training measures
for the handling of hydrogen are discussed in section 6.
Although CO2 is not emitted directly when hydrogen is converted to other forms of en-
ergy, the global warming potential related to emissions in the various ways of hydrogen
production must not be ignored. It is discussed in section 4.1.
38
4 Technological Feasibility
In the following section the relevant technological aspects regarding the use of Hydrogen
as a fuel in IWT are discussed. I order to give a holistic overview the whole chain from
production to conversion will be considered in four steps. On this basis, in chapter 4.5,
the most promising technologies for the four exemplary ships defined in chapter 2.4 will
be assessed.
4.1 Infrastructure and supply
In a first step, the various sources of hydrogen will be discussed with regard to their
technology and their impact on ecology and economy. Furthermore, the local distribution
of the most important hydrogen sources will be discussed. In a final step, the possible
development potential of the future hydrogen infrastructure is estimated.
4.1.1 Methods of hydrogen production
Hydrogen production can be differentiated into reforming from fossil fuel and production
from electrolysis of water as described subsequently.
4.1.1.1 Reforming of fossil fuels
The following sections briefly summarize the ways in which hydrocarbons are reformed.
Due to the limited fossil fuels (hydrocarbons) and the carbon dioxide produced as a by-
product in all the processes described below, reforming must be assessed critically.
Steam reforming
Steam reforming is an endothermic catalytic reaction of light hydrocarbons with water
vapor (cf. [Eic10]). Production is possible in large-scale industrial plants at pressures
between 20 bar and 40 bar and temperatures between 700 °C and 900 °C. The net re-
action equation is given in following equation (4.1).
The simplest form of this reforming is carried out with natural gas (consisting primarily of
methane, CH4). The following reactions occur (cf. [Eic10]):
𝐶𝑛𝐻𝑚𝑂𝑘 + (𝑛 − 𝑘)𝐻2𝑂 → 𝑛𝐶𝑂 + (𝑛 +
𝑚
2− 𝑘)𝐻2 (4.1)
𝐶𝐻4 +𝐻2𝑂 → 𝐶𝑂 + 3𝐻2; Δ𝑅𝐻 = 206𝑘𝐽
𝑚𝑜𝑙 (4.2)
39
𝐶𝐻4 + 2𝐻2𝑂 → 𝐶𝑂2 + 4𝐻2; Δ𝑅𝐻 = 165𝑘𝐽
𝑚𝑜𝑙 (4.3)
The resulting synthesis gas – a mixture of carbon monoxide and hydrogen with propor-
tions of carbon dioxide, water vapor and residual hydrocarbons – is a widely used source
product in the chemical industry. In addition to ammonia synthesis, methanol production
and Fischer-Tropsch synthesis, it is also used to produce hydrogen. With the water gas
reaction (shift reaction) the gas cooled down to about 400 °C is further processed in a
slightly exothermic catalytic reaction with water vapor:
𝐶𝑂 + 𝐻2𝑂 → 𝐶𝑂2 +𝐻2; ΔR𝐻 = −41𝑘𝐽
𝑚𝑜𝑙 (4.4)
After the carbon dioxide has been separated, hydrogen with a purity of about 99.99 % is
produced. The production capacities of steam reforming plants range from 150 Nm³/h to
100,000 Nm³/h hydrogen with efficiencies of 75 % to 80 %.
Partial oxidation
Partial oxidation is suitable for reforming heavy hydrocarbons with the help of oxygen.
The catalytic reaction takes place exothermically with the following net reaction equation
(cf. [Eic10]):
𝐶𝑛𝐻𝑚 + (
𝑛
2)𝑂2 → 𝑛𝐶𝑂 + (
𝑚
2)𝐻2 (4.5)
The reaction takes place at temperatures between 600 °C and 850 °C using catalysts.
Otherwise, temperatures between 1250 °C and 1400 °C are necessary (see [Zak10]).
The resulting synthesis gas can be converted into hydrogen and carbon dioxide analo-
gous to equation (4.4). This process achieves capacities of 100,000 Nm³/h with an effi-
ciency of about 70 %. The exothermic reaction does not require an external heat source
but the supply of oxygen. Overall, the partial oxidation is therefore less efficient than the
steam reforming, but allows a wide range of hydrocarbons to be converted without the
use of methane (see [Eic10]).
Autothermal reforming
Autothermal reforming is a combination of steam reforming and partial oxidation profiting
from the advantages of both ways of reforming. The net reaction equation for methane
is as follows (cf. [Eic10]):
4𝐶𝐻4 + 𝑂2 + 2𝐻2𝑂 → 4𝐶𝑂 + 10𝐻2; Δ𝑅𝐻 = 170𝑘𝐽
𝑚𝑜𝑙 (4.6)
40
The catalytic reaction is slightly endothermic and takes place at temperatures of 850 °C.
The advantages of the process are the independence of an external heat supply, but
oxygen must be provided and the exhaust gases must be cleaned in a more complex
process due to formation of nitrogen oxides (NOx) (see [She17]).
4.1.1.2 Electrolysis of water
Electrolysis is the conversion of electrical energy into chemical energy. In the considered
case it means the decomposition of water molecules (H2O) into hydrogen (H2) and oxy-
gen (O2) by applying direct current.
2𝐻2𝑂(𝑙) 𝐸𝑙𝑒𝑐𝑡𝑟𝑜𝑙𝑦𝑠𝑖𝑠→ 2𝐻2(𝑔) + 𝑂2(𝑔); Δ𝑅𝐻 = 572
𝑘𝐽
𝑚𝑜𝑙 (4.7)
As an electrolyte, pure water dissociates to a small extent into H+ ions and OH- ions and
is already conductive in this state (cf. [Eic10]). However, the instability of the H+-ion leads
to a fast connection with a water molecule, so that the so-called oxonium ions H3O+ and
hydroxide OH- ions are formed.
𝐻2𝑂(𝑙) ⇄ 𝐻
+(𝑎𝑞) + 𝑂𝐻−(𝑎𝑞) (4.8)
2𝐻2𝑂(𝑙) ⇄ 𝐻3𝑂
+(𝑎𝑞) + 𝑂𝐻−(𝑎𝑞) (4.9)
From a chemical point of view, the electrolysis of water is a redox reaction, a combination
of oxidation (electron release) and reduction (electron absorption). At the cathode, the
minus pole of the electrolysis, electron absorption takes place in addition to the dissoci-
ation of the water by reducing the dissociated oxonium ion H3O+:
8𝐻2𝑂 → 4𝐻3𝑂
+ + 4𝑂𝐻−
4𝐻3𝑂+ + 4𝑒− → 2𝐻2 + 4𝐻2𝑂
(4.10)
This leads to the net cathode reaction:
4𝐻2𝑂(𝑙) + 4𝑒
− → 2𝐻2(𝑔) + 4𝑂𝐻−(𝑎𝑞) (4.11)
The anode, the positive pole of electrolysis, absorbs electrons from the hydroxide ion,
which is oxidized to water under release of oxygen.
4𝑂𝐻−(𝑎𝑞) → 2𝐻2𝑂(𝑙) + 𝑂2(𝑔) + 4𝑒
− (4.12)
The shown reactions describe the behavior of alkaline electrolysis (AEL). In practice,
potassium hydroxide KOH is often used instead of pure water as electrolyte for increas-
ing the conductivity of the solution. The reactions take place at low temperatures be-
tween 60 °C and 80 °C (cf. [Smo10] [She17]). AEL has been in commercial use for about
100 years and this type of plant dominates the market. The gross efficiency ranges be-
tween 65 % and 82 %. The largest plants will have a hydrogen production capacity of
760 Nm³/h with an overall electrical power consumption of 5.3 MW(see [She17]).
41
Another process of electrolysis that has been commercially used in smaller applications
for about 20 years is the proton exchange membrane electrolysis (PEMEL). As the name
suggests, a proton conducting polymer membrane (PEM) is used as the electrolyte. With
50 °C to 80 °C (cf. [Smo10]), the working temperatures are similar to those of AEL. These
kind of plants are usually slightly smaller than AEL plants and can produce up to
240 Nm³/h with a required electrical power of 1.15 MW at a system efficiency between
65 % and 78 % (see [She17] [Smo10]). The net reaction equations at the cathode and
anode, respectively, are shown below:
4𝐻3𝑂
+(𝑎𝑞) + 4𝑒− → 2𝐻2(𝑔) + 4𝐻2𝑂(𝑙) (4.13)
6𝐻2𝑂(𝑙) → 𝑂2(𝑔) + 4𝐻3𝑂
+(𝑎𝑞) + 4𝑒− (4.14)
A newer method of electrolysis is high temperature electrolysis (HTEL) with solid oxides
(solid oxide electrolysis, SOEL). The reactions take place at temperatures between
700 °C and 1000 °C (cf. [Smo10]). At present, this electrolysis is still on a laboratory
scale, achieving efficiencies of up to 85 % (see [She17]). The net reaction equations at
the cathode and anode are shown below:
2𝐻2𝑂(𝑔) + 4𝑒
− → 2𝐻2(𝑔) + 2𝑂2− (4.15)
2𝑂2− → 𝑂2(𝑔) + 4𝑒
− (4.16)
4.1.1.3 Other methods
Hydrogen can also be obtained in a variety of other processes as a by-product or directly.
It is a byproduct of gasoline reforming, ethene production or chlor-alkali electrolysis, for
example. The direct splitting (cracking) of mostly long-chain hydrocarbons can be carried
out at high temperatures above 800 °C without the formation of carbon dioxide and fol-
lows the following net reaction equation:
𝐶𝑛𝐻𝑚 → 𝑛𝐶 + (
𝑚
2)𝐻2 (4.17)
A further development of this process is the Kværner process, which takes place in a
plasma torch at temperatures of around 1600 °C. The high temperatures and the low
hydrogen yield compared to steam reforming make this process rather uneconomical.
Coal gasification is another process based on the conversion of a carbon carrier with an
oxygen-containing gasification agent (see [Eic10]). The common disadvantage of crack-
ing and coal gasification is the use of fossil fuels.
Other approaches use solar radiation to produce hydrogen. Highly concentrated radia-
tion splits water and carbon dioxide into hydrogen, carbon monoxide and oxygen. At
temperature ranges of 800 °C to 1500 °C. Redox materials can function as catalysts in
42
this context. Another method using single photons stimulates chemical reactions sepa-
rating water and carbon dioxide. Additionally using electrical energy can accelerate the
reactions which take place at temperatures below 100 °C. These solar processes are
being intensively researched at the German Aerospace Center, e.g. [DLR18a] [DLR18b].
The biological production of hydrogen on the basis of bio photolysis, for example by
green algae or by fermentation of biomass, are still in the research stage and have so
far played little role. However, as they are based on renewable raw materials, they could
become more important in the future. Current developments and future research needs
for hydrogen from biomass can be found in [FNR06].
4.1.2 Current situation of hydrogen production
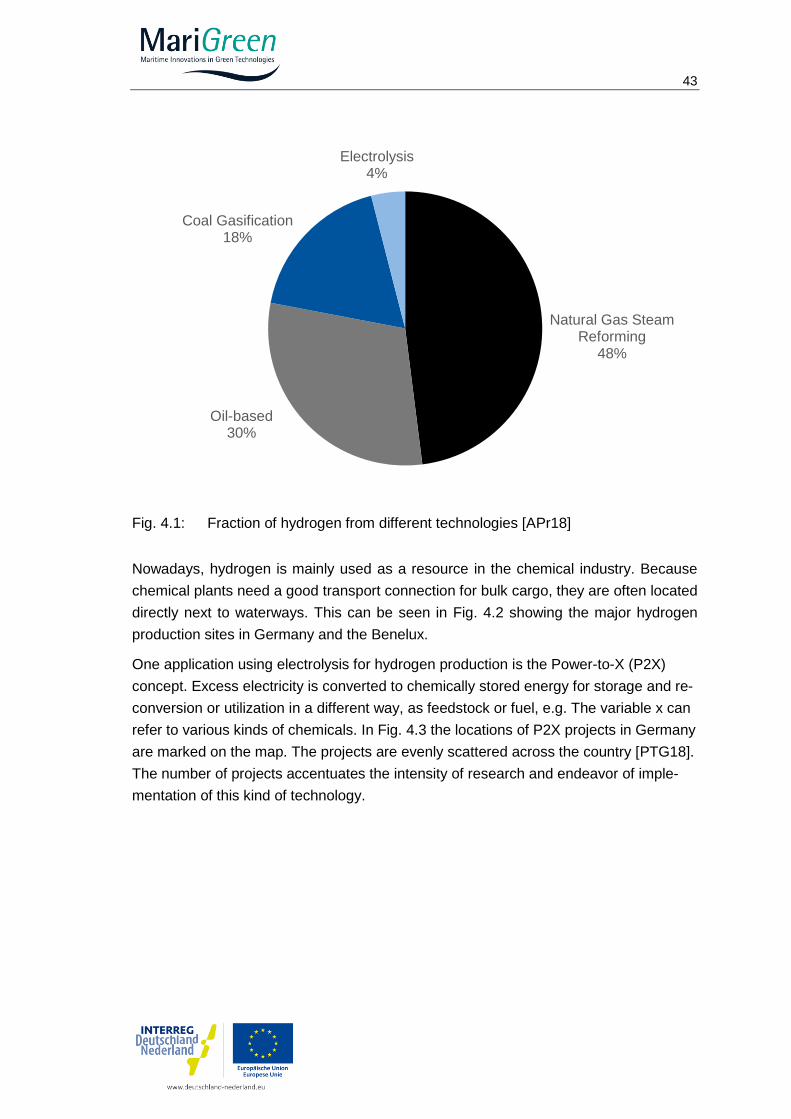
Nowadays 96 % of the hydrogen worldwide originate from fossil sources, half of which
from natural gas. Coal gasification is a common method of hydrogen production in China.
For cost reasons, only 4 % of the hydrogen are produced by means of electrolysis of
water which is shown in Fig. 4.1 [APr18].
According to a study in the context of certifHY project, "the global demand for hydrogen
in 2010 was around 43 million tons and was foreseen to reach 50 million tons by 2015,
primarily as a result of the demand of the ammonia production, methanol and petroleum
refinery operations. Asia and Pacific are the world’s leading consumers of hydrogen rep-
resenting 1/3 of the global consumption followed by North America and Western Europe
with a share of 16% (7 million tons H2). [Fra15]
The CertifHy project came to the conclusion, that in 2015 "the hydrogen production is led
by a few large industrial actors who play a key role in establishing internally a market
price" [Fra15]. The Shell Study [She17] announces a price of 9.50 € per kg.
43
Fig. 4.1: Fraction of hydrogen from different technologies [APr18]
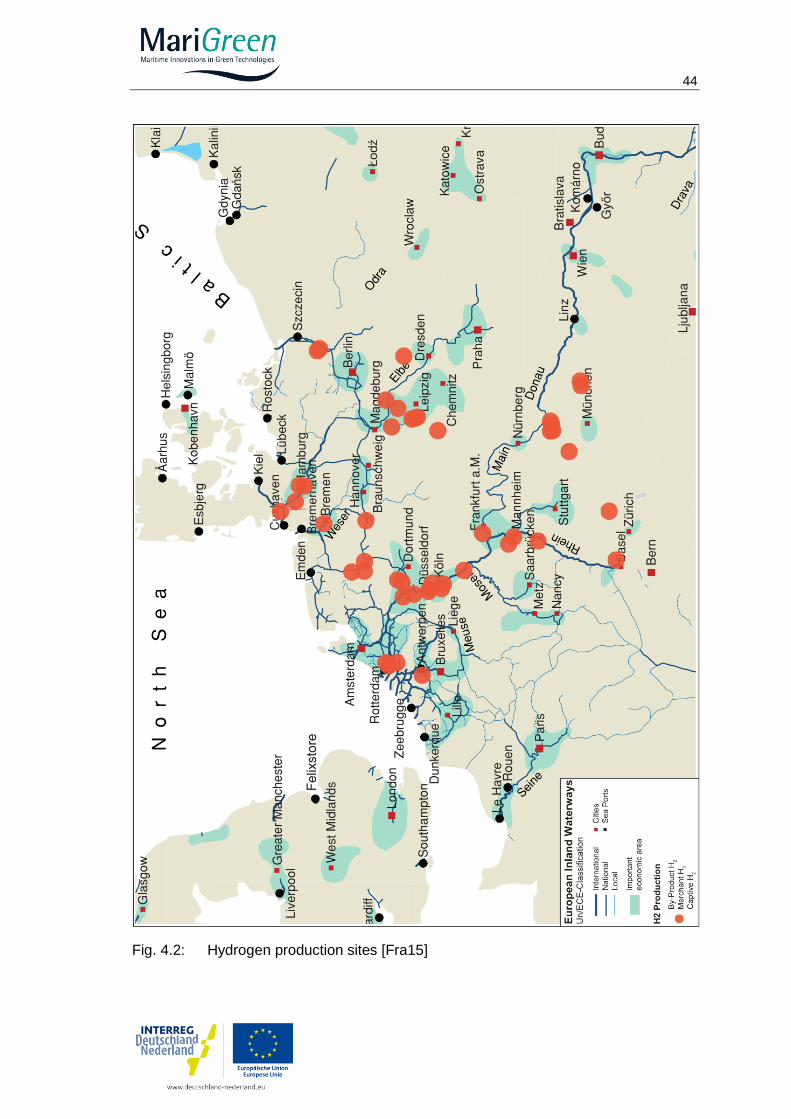
Nowadays, hydrogen is mainly used as a resource in the chemical industry. Because
chemical plants need a good transport connection for bulk cargo, they are often located
directly next to waterways. This can be seen in Fig. 4.2 showing the major hydrogen
production sites in Germany and the Benelux.
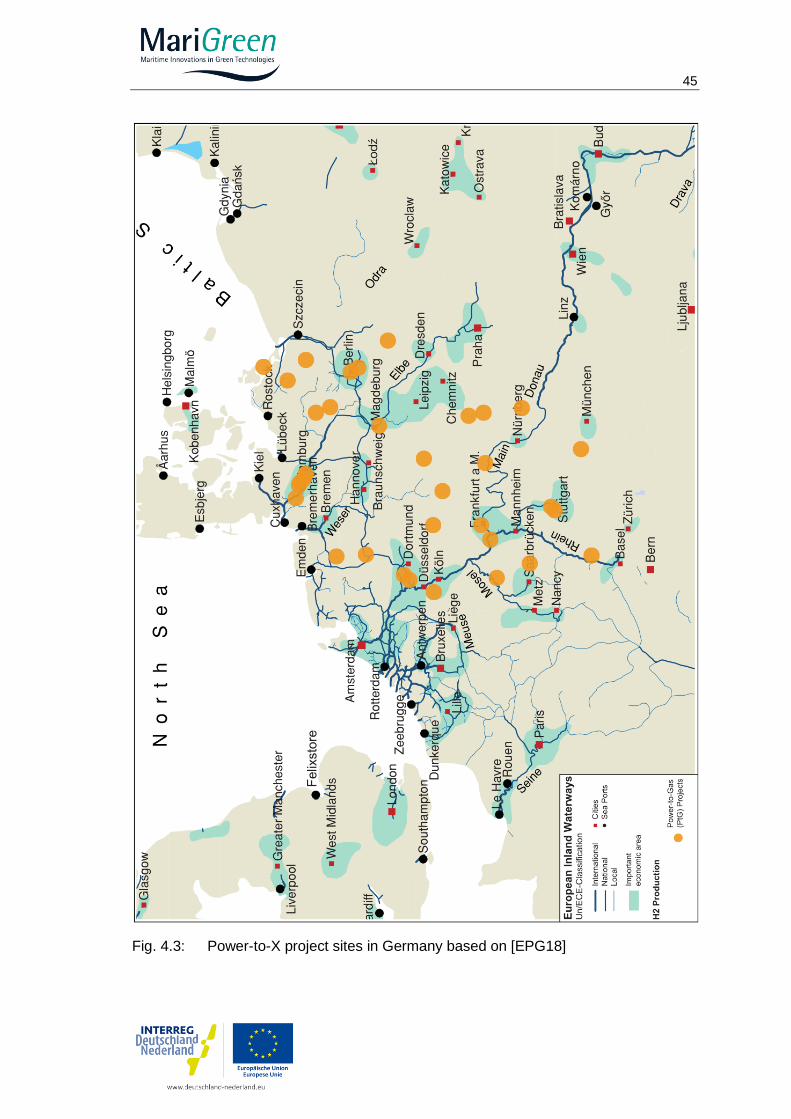
One application using electrolysis for hydrogen production is the Power-to-X (P2X)
concept. Excess electricity is converted to chemically stored energy for storage and re-
conversion or utilization in a different way, as feedstock or fuel, e.g. The variable x can
refer to various kinds of chemicals. In Fig. 4.3 the locations of P2X projects in Germany
are marked on the map. The projects are evenly scattered across the country [PTG18].
The number of projects accentuates the intensity of research and endeavor of imple-
mentation of this kind of technology.
Natural Gas Steam Reforming
48%
Oil-based30%
Coal Gasification18%
Electrolysis4%
44
Fig. 4.2: Hydrogen production sites [Fra15]
45
Fig. 4.3: Power-to-X project sites in Germany based on [EPG18]
46
4.1.3 Ecological and economical assessment
Regarding local emissions, using hydrogen in a combustion process or in fuel cells is
attractive, since the reaction product is pure water without any direct greenhouse gas
emissions. However, a comprehensive evaluation always requires consideration of the
entire process of fuel production, distribution and use. The evaluation of energy effi-
ciency is usually carried out by the well-to-tank (WTT) approach for power generation
and the tank-to-wheel (TTW) approach for implementation in the vehicle. Combined,
this results in a well-to-wheel (WTW) view of the entire process.
The energy consumption for supplying energy in different forms on different paths as
well as the corresponding greenhouse gas emissions are analyzed in a study by the
Joint Research Center of the European Commission, Eucar and concawe (JEC)
[Edw14]. These data are the basis for the following analyses comparing various paths
of providing hydrogen. Similar data are also published in the Shell study [She17].
In Fig. 4.4 the results of the WTT analysis are depicted showing the primary energy
consumption on the left and the greenhouse gas emissions on the right axis with the left
and the right bar of each pair corresponding to the respective side.
The blue bars correspond to hydrogen production by means of thermal reforming. The
calculations are based on pipeline transport of natural gas over a distance of 4000 km
and in case of central reformation an additional transport of the hydrogen over 100 km.
It is clearly visible that on-site reformation requires more energy than central reformation
due to the higher efficiency of large-scale refineries. Road transport of hydrogen is more
inefficient than pipeline transport, but due to the relatively small distance of 100 km the
calculations is based on this effect appears to be negligible. The previously described
alternatives are about delivering the hydrogen in compressed form. Another way exem-
plarily compared here is central reformation and subsequent liquefaction in order to in-
crease the volumetric power density for road transport, followed by vaporization and
compression on site. Do to the high energy consumption of both the liquefaction and the
compression, this path even exceeds the on-site reformation. It only pays off for long
distance, e.g. intercontinental, hydrogen transport, because any extra conversion re-
duces efficiency. That is, hydrogen should be produced in the form it is stored onboard
the vessel. These deliberations refer to the primary energy consumption, but also hold
true for CO2 emissions.
Additionally, the impact of hydrogen production via electrolysis is considered. In a first
option, the natural gas is used to run a combined cycle gas turbine (CCGT), a highly
efficient process creating electricity. This electricity is then used for on-site water elec-
trolysis. The energy effort is three times as great compared to the most efficient way of
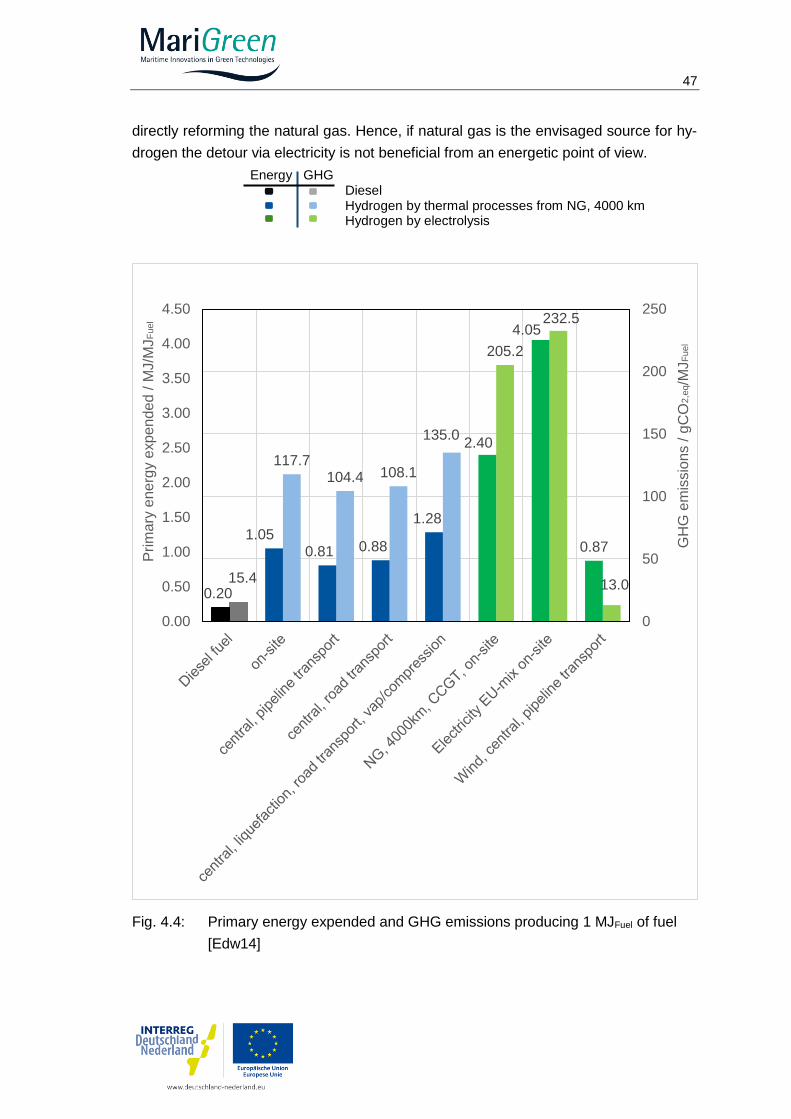
47
directly reforming the natural gas. Hence, if natural gas is the envisaged source for hy-
drogen the detour via electricity is not beneficial from an energetic point of view.
Fig. 4.4: Primary energy expended and GHG emissions producing 1 MJFuel of fuel
[Edw14]
15.4
117.7104.4 108.1
135.0
205.2
232.5
13.00.20
1.050.81 0.88
1.28
2.40
4.05
0.87
0.00
0.50
1.00
1.50
2.00
2.50
3.00
3.50
4.00
4.50
0
50
100
150
200
250
Prim
ary
ene
rgy e
xp
en
de
d /
MJ/M
JF
uel
GH
G e
mis
sio
ns / g
CO
2,e
q/M
JF
uel
Energy GHG Diesel Hydrogen by thermal processes from NG, 4000 km Hydrogen by electrolysis
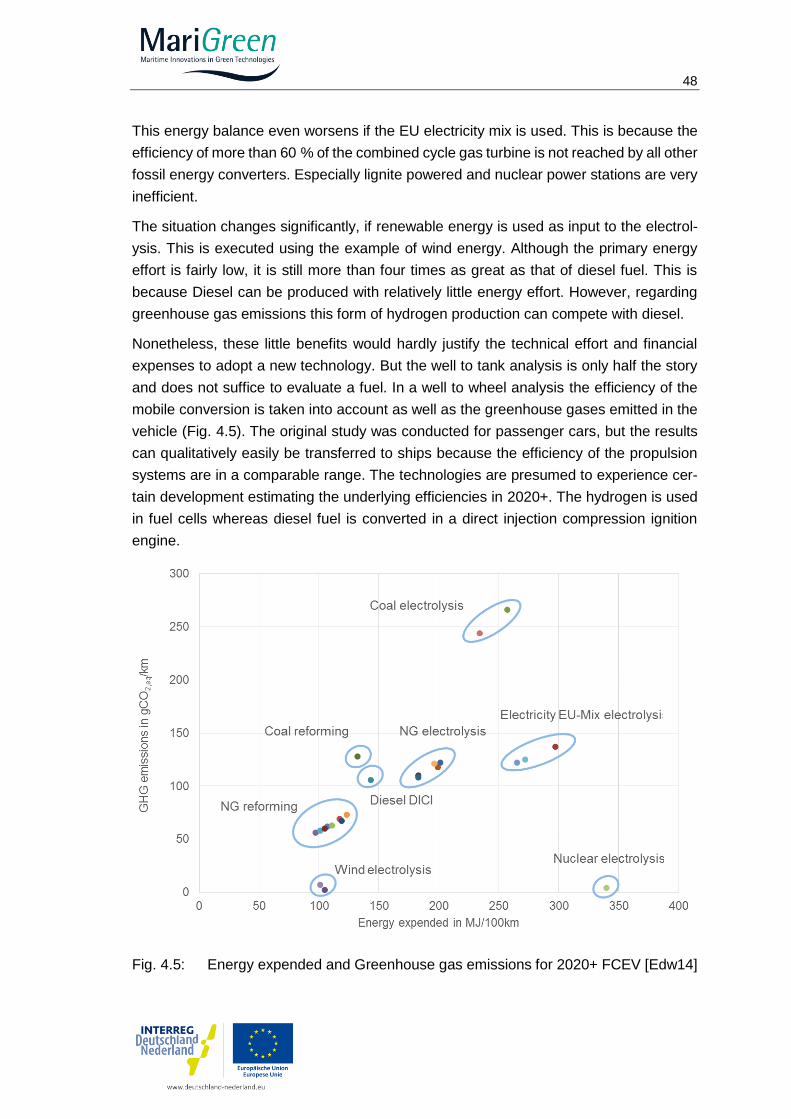
48
This energy balance even worsens if the EU electricity mix is used. This is because the
efficiency of more than 60 % of the combined cycle gas turbine is not reached by all other
fossil energy converters. Especially lignite powered and nuclear power stations are very
inefficient.
The situation changes significantly, if renewable energy is used as input to the electrol-
ysis. This is executed using the example of wind energy. Although the primary energy
effort is fairly low, it is still more than four times as great as that of diesel fuel. This is
because Diesel can be produced with relatively little energy effort. However, regarding
greenhouse gas emissions this form of hydrogen production can compete with diesel.
Nonetheless, these little benefits would hardly justify the technical effort and financial
expenses to adopt a new technology. But the well to tank analysis is only half the story
and does not suffice to evaluate a fuel. In a well to wheel analysis the efficiency of the
mobile conversion is taken into account as well as the greenhouse gases emitted in the
vehicle (Fig. 4.5). The original study was conducted for passenger cars, but the results
can qualitatively easily be transferred to ships because the efficiency of the propulsion
systems are in a comparable range. The technologies are presumed to experience cer-
tain development estimating the underlying efficiencies in 2020+. The hydrogen is used
in fuel cells whereas diesel fuel is converted in a direct injection compression ignition
engine.
Fig. 4.5: Energy expended and Greenhouse gas emissions for 2020+ FCEV [Edw14]
49
In the well to wheel analysis significant advantages turn out for hydrogen produced by
means of electrolysis using electricity generated by wind energy. It exhibits top values
regarding the expended energy per distance driven and best values regarding green-
house gas emissions.
Coal reforming and electrolysis are shown because significant amounts of hydrogen are
produced this way in China.
Comparable to the ecological consideration it is not self-evident that hydrogen production
can be economically competitive to currently used fuels. The hydrogen costs are mainly
driven by the energy source. Hydrogen produced from fossil sources as coal or natural
gas requires additional efforts in refinery and further treatment. In this simple view hy-
drogen will always be more expensive than its sources. However, a significant advantage
arises in using electricity from renewable sources. In these scenarios hydrogen forms
the first step in most process chains for energy storage as gaseous or liquid energy
carrier. In all these scenarios significant gains in production capacity and radical changes
of the market can be expected.
Regarding the current prices on fueling stations, it should be noted that the price is po-
litically fixed nowadays and a supply to vessels could be realized much more cost effi-
ciently so that a reduction of more than 50 % of the current fuel station price (9.5 €/kg)
is reasonable.
4.1.4 Requirements and development potential
Unless produced by means of electrolysis using renewable energy sources hydrogen is
not beneficial compared to diesel fuel regarding solely the aspect of primary energy use
and CO2 emissions as demonstrated in the previous section. Although hydrogen has
certain benefits regarding carbon monoxide (CO), soot, hydrocarbons and partly NOx
independently from its origin, against the described background CO2-neutral so-called
green hydrogen is one major demand to ensure the reasonableness of the endeavor.
It can be expected that in the next years more and more hydrogen is very likely to be
produced from renewable sources. This development is accelerated by the nuclear
phase-out in Germany as well as the general intention to reduce the amount of energy
originating from fossil energy carriers. With an increasing fraction of renewable energies
being fed into the grid the amount of overflow energy increases more than proportion-
ately. Besides reducing power generation, shifting power demand to periods of high
power supply, storing energy is one possibility, but also a major challenge. In an inte-
grated energy system hydrogen can act as a buffer storage for fluctuating renewable
energies. The hydrogen can either be stored and converted back to electricity to be fed
into the grid in periods of low power production or used as fuel for mobile purposes.
Sector coupling is commonly considered a main leverage to cope with the more and
50
more fluctuating energy supply. The existence of the many Power-to-X demonstrator
projects underlines the clear trend towards an integrated energy system and hydrogen
production by means of electrolysis additionally.
One demonstrating example for this kind of energy system can be found on the Orkney
Islands. In the Surf ’n’ Turf project an electrolyzer powered by the tidal turbines and a
wind turbine produces green hydrogen. This is transported to Kirkwall, where it is con-
verted back into electricity by a fuel cell and used as an auxiliary power source for the
inter-island ferries docked overnight. [FCB17b]
Another major aspect is the quality of the hydrogen for certain application. Especially
PEM fuel cells require highly pure fuel. The quality of the hydrogen strongly depends on
its source. Hydrogen produced by means of PEM-electrolysis is only contains water and
oxygen apart from hydrogen. Hydrogen from reformation of fossil fuels is also contami-
nated by carbon dioxide, carbon monoxide and sulfurous compounds. In this context the
trend towards hydrogen production from electricity clearly has a positive impact. At the
same time, gas producers and gas station operators consider the requirements of fuel
cells regarding fuel quality as too strict so that hydrogen costs might drop by the possi-
bility to use lower quality fuel. [Emo13]
Notwithstanding, during the transition period hydrogen from reformed fossil fuels can
serve adequately as fuel for hydrogen demonstrator ships.
4.2 Transport to and storage in the harbor
The various technologies of hydrogen storage will be explained in detail in chapter 4.3.
In this chapter only the principal types, namely in compressed or liquid form and in form
of liquid organic hydrogen carriers (LOHC) will be covered.
4.2.1 Current situation
The two main variants for transporting and storing hydrogen are in liquid and in gaseous
form under pressure. However, also other forms are worth considering – especially for
storage in the harbor.
Liquid hydrogen (LH2) must first be liquefied in a complex process. Since the boiling
temperature of hydrogen is 20.4 K, the process is carried out in cryotechnical plants. The
energy used for this is, depending on the system, between 20% and 35% of the energy
content of the hydrogen in relation to the lower calorific value [Mar15]. The liquid hydro-
gen is stored in double-walled vacuum-insulated containers at a maximum operating
pressure between 5 and 12 bar [Kle10] [Eic10] [Hei06]. However, heat influx cannot be
avoided, which leads to the so-called boil-off, the vaporization of hydrogen. The boil-off
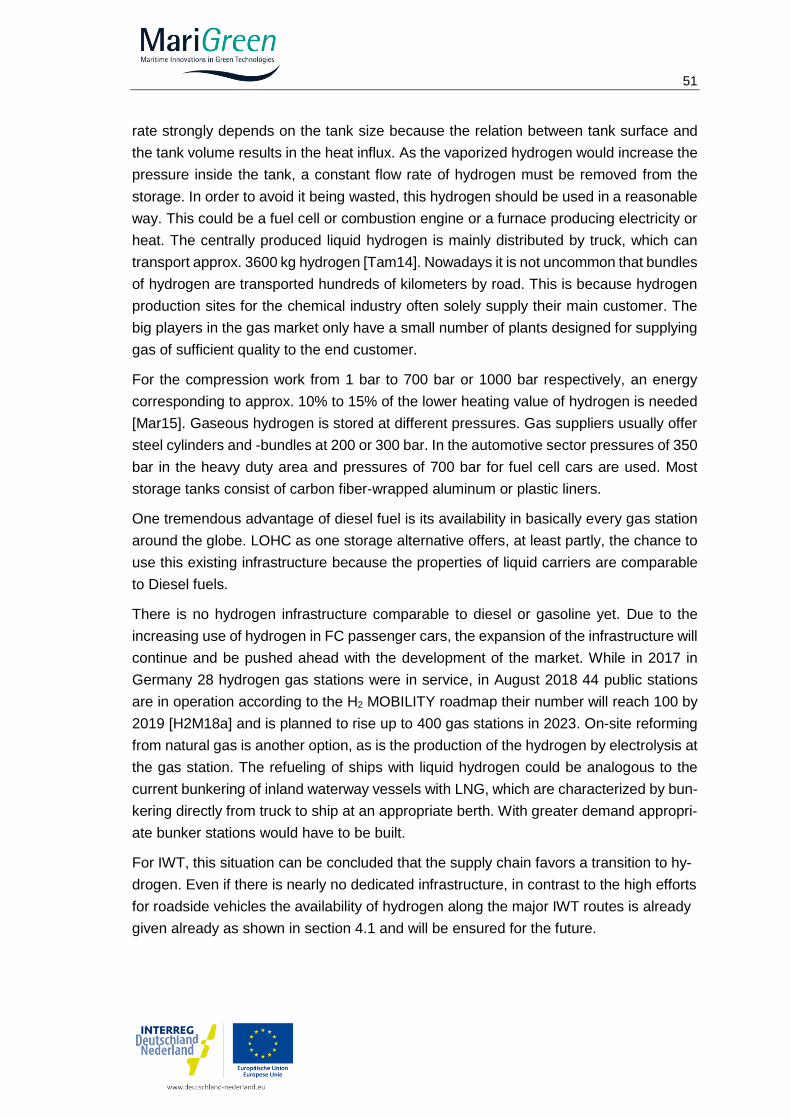
51
rate strongly depends on the tank size because the relation between tank surface and
the tank volume results in the heat influx. As the vaporized hydrogen would increase the
pressure inside the tank, a constant flow rate of hydrogen must be removed from the
storage. In order to avoid it being wasted, this hydrogen should be used in a reasonable
way. This could be a fuel cell or combustion engine or a furnace producing electricity or
heat. The centrally produced liquid hydrogen is mainly distributed by truck, which can
transport approx. 3600 kg hydrogen [Tam14]. Nowadays it is not uncommon that bundles
of hydrogen are transported hundreds of kilometers by road. This is because hydrogen
production sites for the chemical industry often solely supply their main customer. The
big players in the gas market only have a small number of plants designed for supplying
gas of sufficient quality to the end customer.
For the compression work from 1 bar to 700 bar or 1000 bar respectively, an energy
corresponding to approx. 10% to 15% of the lower heating value of hydrogen is needed
[Mar15]. Gaseous hydrogen is stored at different pressures. Gas suppliers usually offer
steel cylinders and -bundles at 200 or 300 bar. In the automotive sector pressures of 350
bar in the heavy duty area and pressures of 700 bar for fuel cell cars are used. Most
storage tanks consist of carbon fiber-wrapped aluminum or plastic liners.
One tremendous advantage of diesel fuel is its availability in basically every gas station
around the globe. LOHC as one storage alternative offers, at least partly, the chance to
use this existing infrastructure because the properties of liquid carriers are comparable
to Diesel fuels.
There is no hydrogen infrastructure comparable to diesel or gasoline yet. Due to the
increasing use of hydrogen in FC passenger cars, the expansion of the infrastructure will
continue and be pushed ahead with the development of the market. While in 2017 in
Germany 28 hydrogen gas stations were in service, in August 2018 44 public stations
are in operation according to the H2 MOBILITY roadmap their number will reach 100 by
2019 [H2M18a] and is planned to rise up to 400 gas stations in 2023. On-site reforming
from natural gas is another option, as is the production of the hydrogen by electrolysis at
the gas station. The refueling of ships with liquid hydrogen could be analogous to the
current bunkering of inland waterway vessels with LNG, which are characterized by bun-
kering directly from truck to ship at an appropriate berth. With greater demand appropri-
ate bunker stations would have to be built.
For IWT, this situation can be concluded that the supply chain favors a transition to hy-
drogen. Even if there is nearly no dedicated infrastructure, in contrast to the high efforts
for roadside vehicles the availability of hydrogen along the major IWT routes is already
given already as shown in section 4.1 and will be ensured for the future.
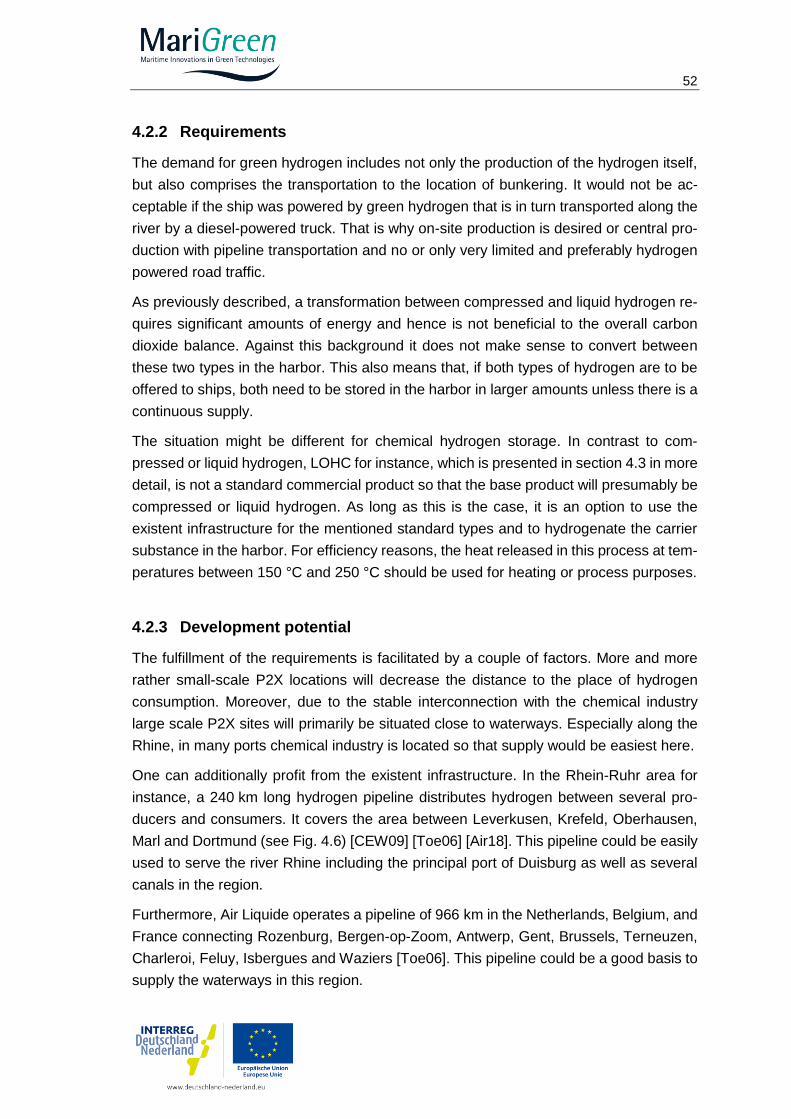
52
4.2.2 Requirements
The demand for green hydrogen includes not only the production of the hydrogen itself,
but also comprises the transportation to the location of bunkering. It would not be ac-
ceptable if the ship was powered by green hydrogen that is in turn transported along the
river by a diesel-powered truck. That is why on-site production is desired or central pro-
duction with pipeline transportation and no or only very limited and preferably hydrogen
powered road traffic.
As previously described, a transformation between compressed and liquid hydrogen re-
quires significant amounts of energy and hence is not beneficial to the overall carbon
dioxide balance. Against this background it does not make sense to convert between
these two types in the harbor. This also means that, if both types of hydrogen are to be
offered to ships, both need to be stored in the harbor in larger amounts unless there is a
continuous supply.
The situation might be different for chemical hydrogen storage. In contrast to com-
pressed or liquid hydrogen, LOHC for instance, which is presented in section 4.3 in more
detail, is not a standard commercial product so that the base product will presumably be
compressed or liquid hydrogen. As long as this is the case, it is an option to use the
existent infrastructure for the mentioned standard types and to hydrogenate the carrier
substance in the harbor. For efficiency reasons, the heat released in this process at tem-
peratures between 150 °C and 250 °C should be used for heating or process purposes.
4.2.3 Development potential
The fulfillment of the requirements is facilitated by a couple of factors. More and more
rather small-scale P2X locations will decrease the distance to the place of hydrogen
consumption. Moreover, due to the stable interconnection with the chemical industry
large scale P2X sites will primarily be situated close to waterways. Especially along the
Rhine, in many ports chemical industry is located so that supply would be easiest here.
One can additionally profit from the existent infrastructure. In the Rhein-Ruhr area for
instance, a 240 km long hydrogen pipeline distributes hydrogen between several pro-
ducers and consumers. It covers the area between Leverkusen, Krefeld, Oberhausen,
Marl and Dortmund (see Fig. 4.6) [CEW09] [Toe06] [Air18]. This pipeline could be easily
used to serve the river Rhine including the principal port of Duisburg as well as several
canals in the region.
Furthermore, Air Liquide operates a pipeline of 966 km in the Netherlands, Belgium, and
France connecting Rozenburg, Bergen-op-Zoom, Antwerp, Gent, Brussels, Terneuzen,
Charleroi, Feluy, Isbergues and Waziers [Toe06]. This pipeline could be a good basis to
supply the waterways in this region.
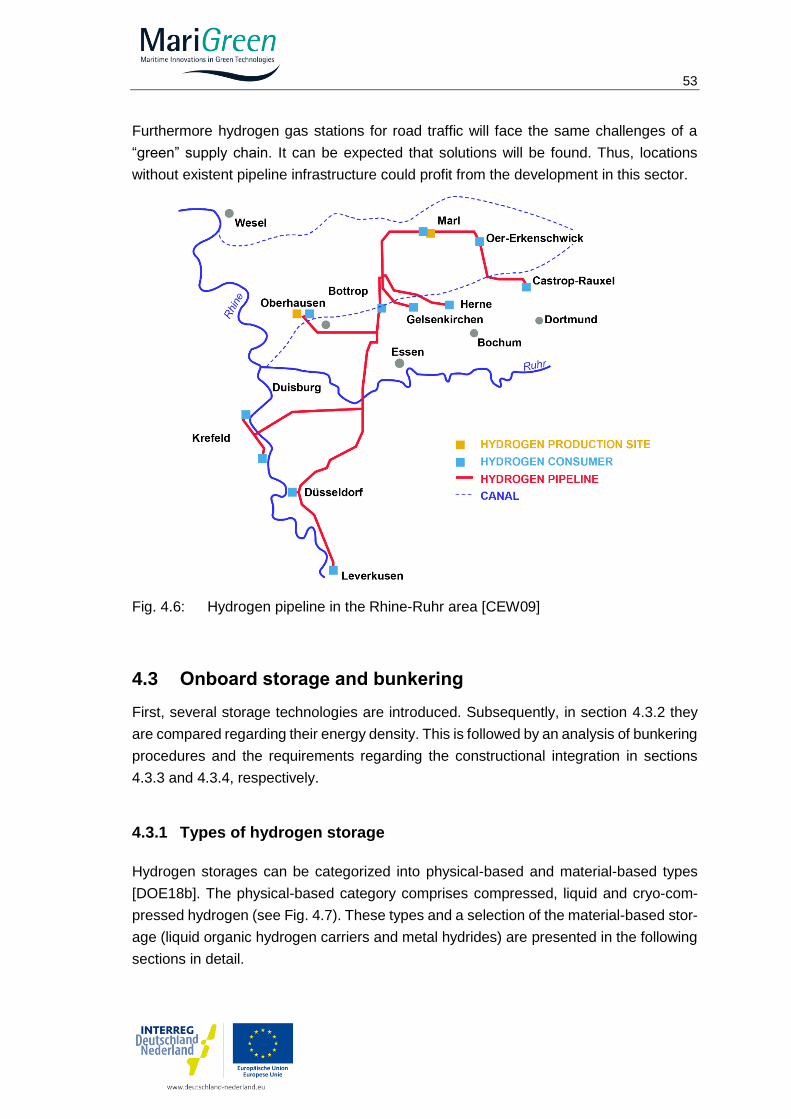
53
Furthermore hydrogen gas stations for road traffic will face the same challenges of a
“green” supply chain. It can be expected that solutions will be found. Thus, locations
without existent pipeline infrastructure could profit from the development in this sector.
Fig. 4.6: Hydrogen pipeline in the Rhine-Ruhr area [CEW09]
4.3 Onboard storage and bunkering
First, several storage technologies are introduced. Subsequently, in section 4.3.2 they
are compared regarding their energy density. This is followed by an analysis of bunkering
procedures and the requirements regarding the constructional integration in sections
4.3.3 and 4.3.4, respectively.
4.3.1 Types of hydrogen storage
Hydrogen storages can be categorized into physical-based and material-based types
[DOE18b]. The physical-based category comprises compressed, liquid and cryo-com-
pressed hydrogen (see Fig. 4.7). These types and a selection of the material-based stor-
age (liquid organic hydrogen carriers and metal hydrides) are presented in the following
sections in detail.
54
Fig. 4.7: Overview of storage technologies (according to [BMW12])
Compressed hydrogen
As mentioned before, compressed hydrogen is usually stored at pressures of up to
700 bar at ambient temperature. As only a valve is needed to control the mass flow rate,
withdrawing compressed hydrogen for usage is relatively simple (see Fig. 4.8).
Fig. 4.8: Compressed hydrogen storage system
One innovative example of particular interest for shipping applications is to store the
hydrogen in standard intermodal freight containers. This configuration allows for short-
ening the fueling times by facilitating a quick exchange of the entire tank. For container
ships this method is an easy retrofit, because an accessible storage site of perfect di-
mensions is already available and accessible. A solution offered by EMS is depicted in
Fig. 4.9. This 40 ft high cube container contains 162 composite vessels of 211 liters con-
tent each. The minimal and nominal working pressure as well as the maximum fill pres-
sure are 20 bar, 500 bar and 625 bar, respectively. In a pressure range between 500 bar
and 20 bar 1021 kg hydrogen can be stored in the entire 40 ft HC container. The weight
of the empty vessels is 19,602 kg and the structure and rest of the container about 8 t.
The price for one container is listed at approximately 900,000 €.
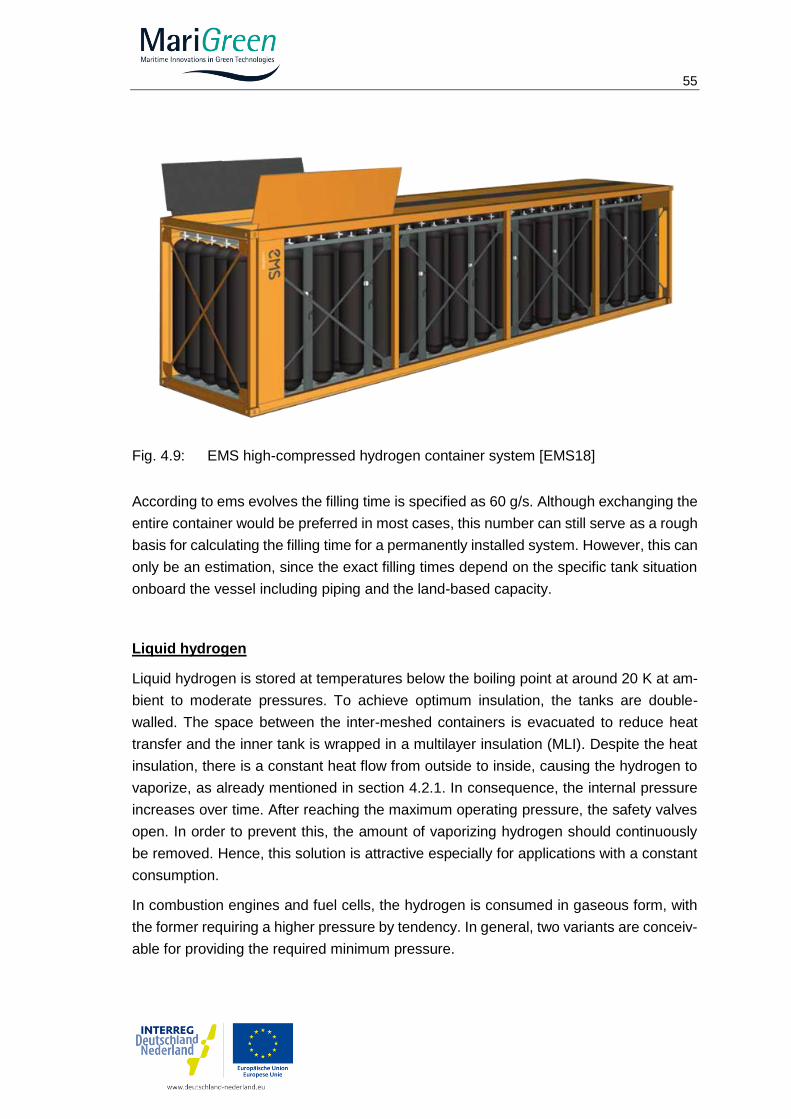
55
Fig. 4.9: EMS high-compressed hydrogen container system [EMS18]
According to ems evolves the filling time is specified as 60 g/s. Although exchanging the
entire container would be preferred in most cases, this number can still serve as a rough
basis for calculating the filling time for a permanently installed system. However, this can
only be an estimation, since the exact filling times depend on the specific tank situation
onboard the vessel including piping and the land-based capacity.
Liquid hydrogen
Liquid hydrogen is stored at temperatures below the boiling point at around 20 K at am-
bient to moderate pressures. To achieve optimum insulation, the tanks are double-
walled. The space between the inter-meshed containers is evacuated to reduce heat
transfer and the inner tank is wrapped in a multilayer insulation (MLI). Despite the heat
insulation, there is a constant heat flow from outside to inside, causing the hydrogen to
vaporize, as already mentioned in section 4.2.1. In consequence, the internal pressure
increases over time. After reaching the maximum operating pressure, the safety valves
open. In order to prevent this, the amount of vaporizing hydrogen should continuously
be removed. Hence, this solution is attractive especially for applications with a constant
consumption.
In combustion engines and fuel cells, the hydrogen is consumed in gaseous form, with
the former requiring a higher pressure by tendency. In general, two variants are conceiv-
able for providing the required minimum pressure.
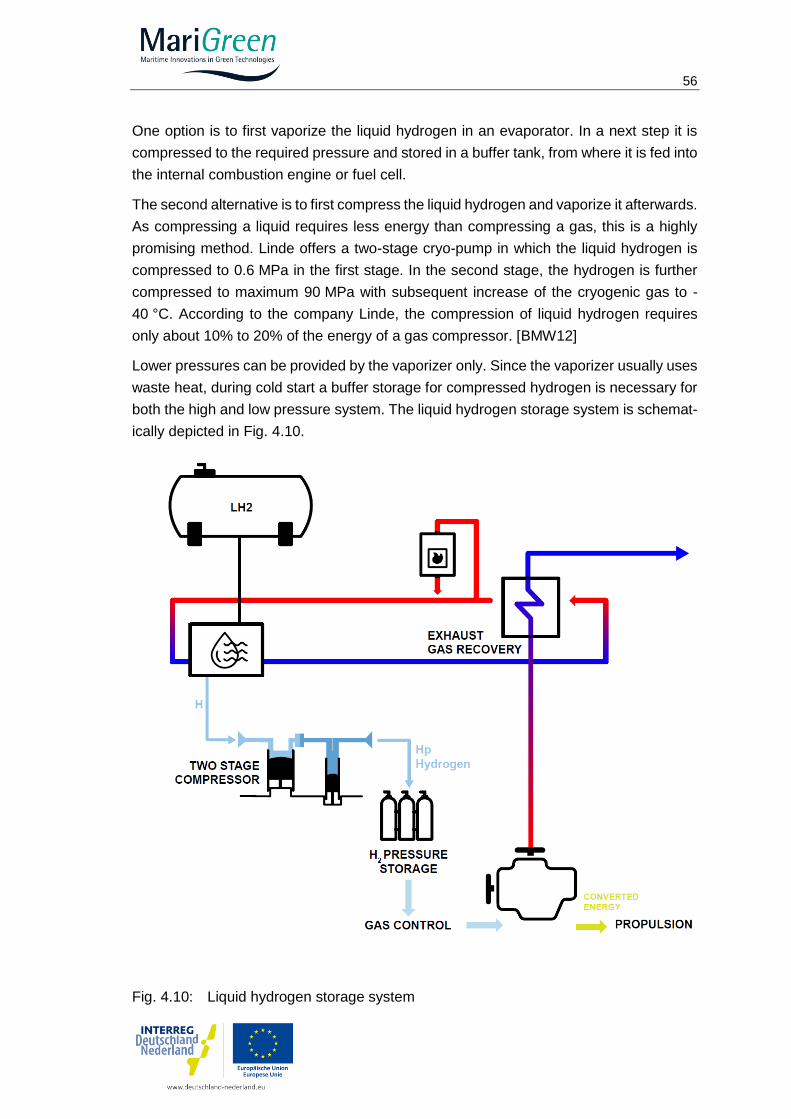
56
One option is to first vaporize the liquid hydrogen in an evaporator. In a next step it is
compressed to the required pressure and stored in a buffer tank, from where it is fed into
the internal combustion engine or fuel cell.
The second alternative is to first compress the liquid hydrogen and vaporize it afterwards.
As compressing a liquid requires less energy than compressing a gas, this is a highly
promising method. Linde offers a two-stage cryo-pump in which the liquid hydrogen is
compressed to 0.6 MPa in the first stage. In the second stage, the hydrogen is further
compressed to maximum 90 MPa with subsequent increase of the cryogenic gas to -
40 °C. According to the company Linde, the compression of liquid hydrogen requires
only about 10% to 20% of the energy of a gas compressor. [BMW12]
Lower pressures can be provided by the vaporizer only. Since the vaporizer usually uses
waste heat, during cold start a buffer storage for compressed hydrogen is necessary for
both the high and low pressure system. The liquid hydrogen storage system is schemat-
ically depicted in Fig. 4.10.
Fig. 4.10: Liquid hydrogen storage system
57
The filling time for a 3500 kg delivery is about 4 h pumping time after precooling the pipes
for about 1 h.
Due to a lack of offers, the cost for the LH2 storage tank can only be very roughly esti-
mated using a formula provided in [Win89]. Converting the currency from DM to € using
the official exchange rate and taking into account the general inflation rate from 1989 to
2017 of 67 % leads to
Cost 𝐿𝐻2 𝑠𝑡𝑜𝑟𝑎𝑔𝑒 𝑡𝑎𝑛𝑘 =14,500
(V𝑚3)0.3 €
𝑚³ (4.1)
Cryo-compressed hydrogen
Another method currently being in the prototype stadium is called cryo-compressed hy-
drogen storage and a mixture of compressed and liquid storage. The pressurized hydro-
gen is stored at temperatures above the boiling temperature at elevated pressure. It
reaches its highest density at temperatures below -200 °C at pressures up to 1000 bar.
[BMW12]
Liquid Organic Hydrogen Carriers
A liquid organic hydrogen carrier is hydrogenated and dehydrogenated to store and re-
lease the hydrogen, respectively. With no molecular hydrogen being present in the LOHC
storage, the core aspect is binding the hydrogen to the carrier substance
The exothermic hydrogenation reaction proceeds between 150 and 250 °C at a pressure
of over 20 bar. Per molecule of the carrier fluid (LOHC-), 9 molecules of H2 can be taken
(loading of about 6.2 mass percent with hydrogen possible). The released energy of
about 9 kWhth / kg H2 must be dissipated and can be used for heating or process pur-
poses [Pre16]. The hydrogenated fluid (LOHC+) can then be stored at ambient condi-
tions. Platinum, ruthenium, rhodium, nickel or copper are used as catalysts in the hydro-
genation process.
In comparison to the hydrogenation the dehydrogenation in an endothermic reaction tak-
ing place at higher temperatures between 250 °C and 320 °C, but at lower pressures
between 1 and 3 bar. The low-hydrogen LOHC- can then be stored until reused for hy-
drogenation. For the dehydrogenation, commercial catalysts (platinum as a catalytic sub-
stance and alumina or carbon as a carrier) may be used. The power control of the re-
leaser can be regulated by changing the LOHC mass flow rate or the reaction conditions.
The required dehydrogenation heat plays a central role. After the carrier fluid has been
stored for an extended period of time, it is delivered to the releaser at ambient tempera-
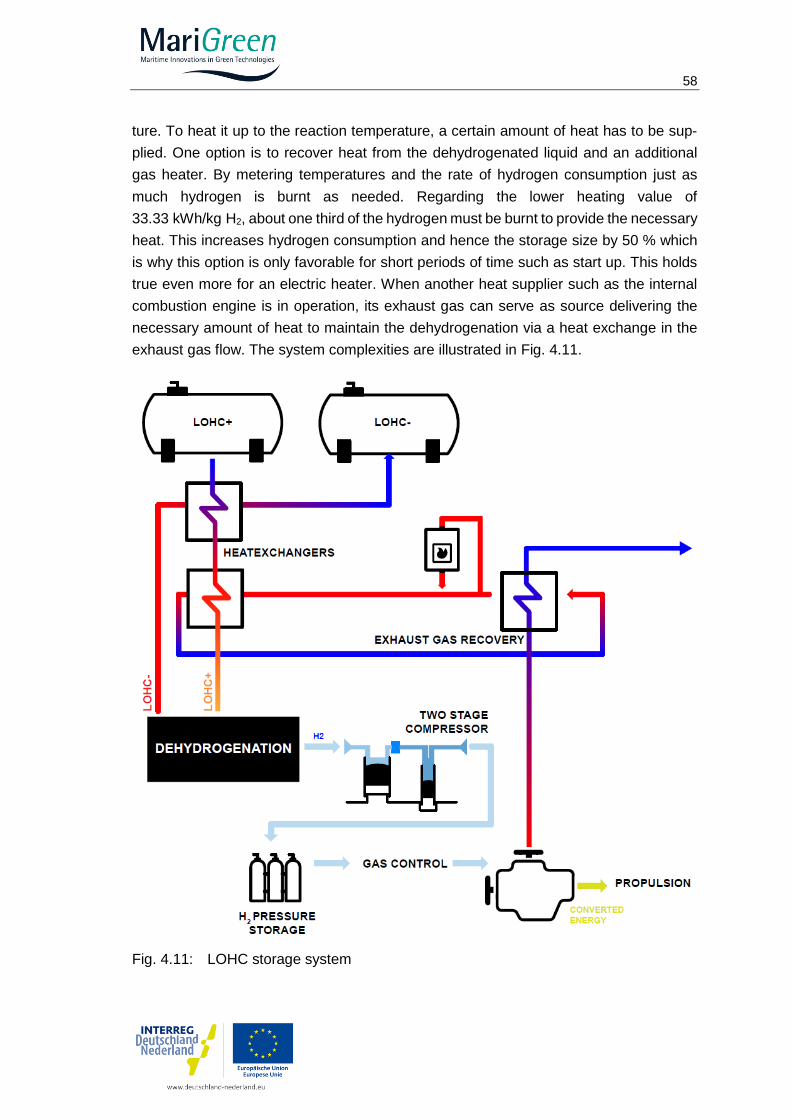
58
ture. To heat it up to the reaction temperature, a certain amount of heat has to be sup-
plied. One option is to recover heat from the dehydrogenated liquid and an additional
gas heater. By metering temperatures and the rate of hydrogen consumption just as
much hydrogen is burnt as needed. Regarding the lower heating value of
33.33 kWh/kg H2, about one third of the hydrogen must be burnt to provide the necessary
heat. This increases hydrogen consumption and hence the storage size by 50 % which
is why this option is only favorable for short periods of time such as start up. This holds
true even more for an electric heater. When another heat supplier such as the internal
combustion engine is in operation, its exhaust gas can serve as source delivering the
necessary amount of heat to maintain the dehydrogenation via a heat exchange in the
exhaust gas flow. The system complexities are illustrated in Fig. 4.11.
Fig. 4.11: LOHC storage system
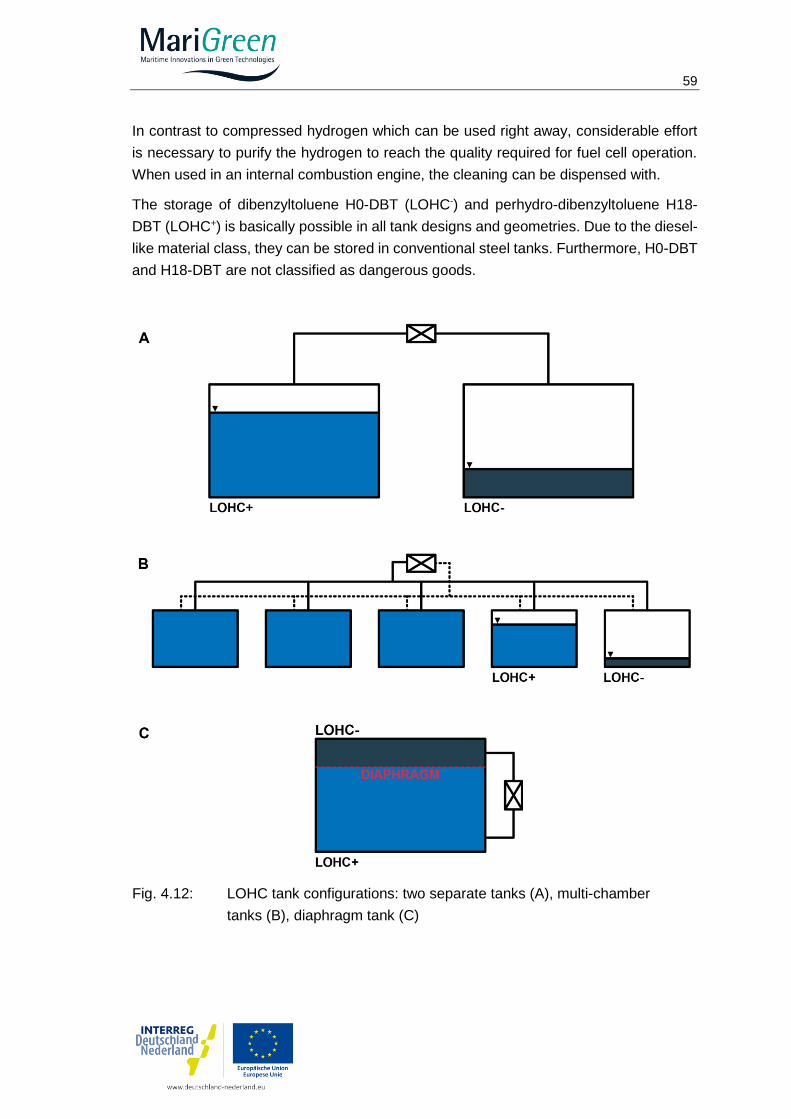
59
In contrast to compressed hydrogen which can be used right away, considerable effort
is necessary to purify the hydrogen to reach the quality required for fuel cell operation.
When used in an internal combustion engine, the cleaning can be dispensed with.
The storage of dibenzyltoluene H0-DBT (LOHC-) and perhydro-dibenzyltoluene H18-
DBT (LOHC+) is basically possible in all tank designs and geometries. Due to the diesel-
like material class, they can be stored in conventional steel tanks. Furthermore, H0-DBT
and H18-DBT are not classified as dangerous goods.
Fig. 4.12: LOHC tank configurations: two separate tanks (A), multi-chamber
tanks (B), diaphragm tank (C)
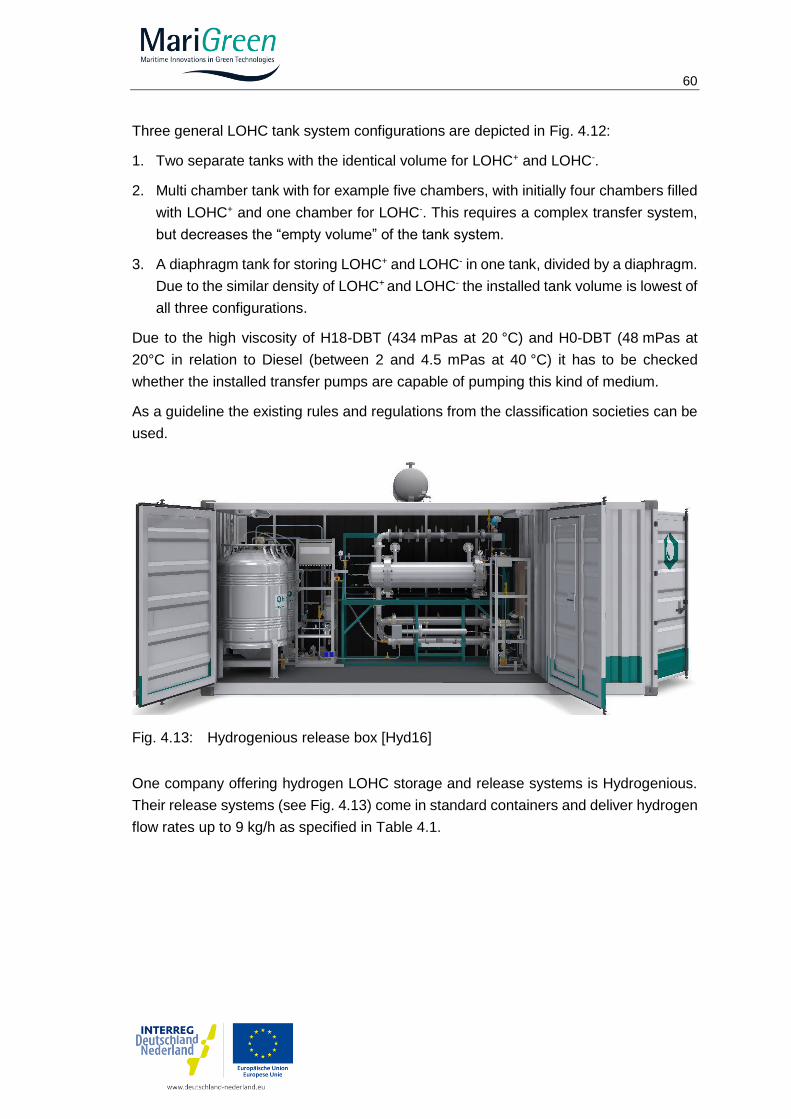
60
Three general LOHC tank system configurations are depicted in Fig. 4.12:
1. Two separate tanks with the identical volume for LOHC+ and LOHC-.
2. Multi chamber tank with for example five chambers, with initially four chambers filled
with LOHC+ and one chamber for LOHC-. This requires a complex transfer system,
but decreases the “empty volume” of the tank system.
3. A diaphragm tank for storing LOHC+ and LOHC- in one tank, divided by a diaphragm.
Due to the similar density of LOHC+ and LOHC- the installed tank volume is lowest of
all three configurations.
Due to the high viscosity of H18-DBT (434 mPas at 20 °C) and H0-DBT (48 mPas at
20°C in relation to Diesel (between 2 and 4.5 mPas at 40 °C) it has to be checked
whether the installed transfer pumps are capable of pumping this kind of medium.
As a guideline the existing rules and regulations from the classification societies can be
used.
Fig. 4.13: Hydrogenious release box [Hyd16]
One company offering hydrogen LOHC storage and release systems is Hydrogenious.
Their release systems (see Fig. 4.13) come in standard containers and deliver hydrogen
flow rates up to 9 kg/h as specified in Table 4.1.
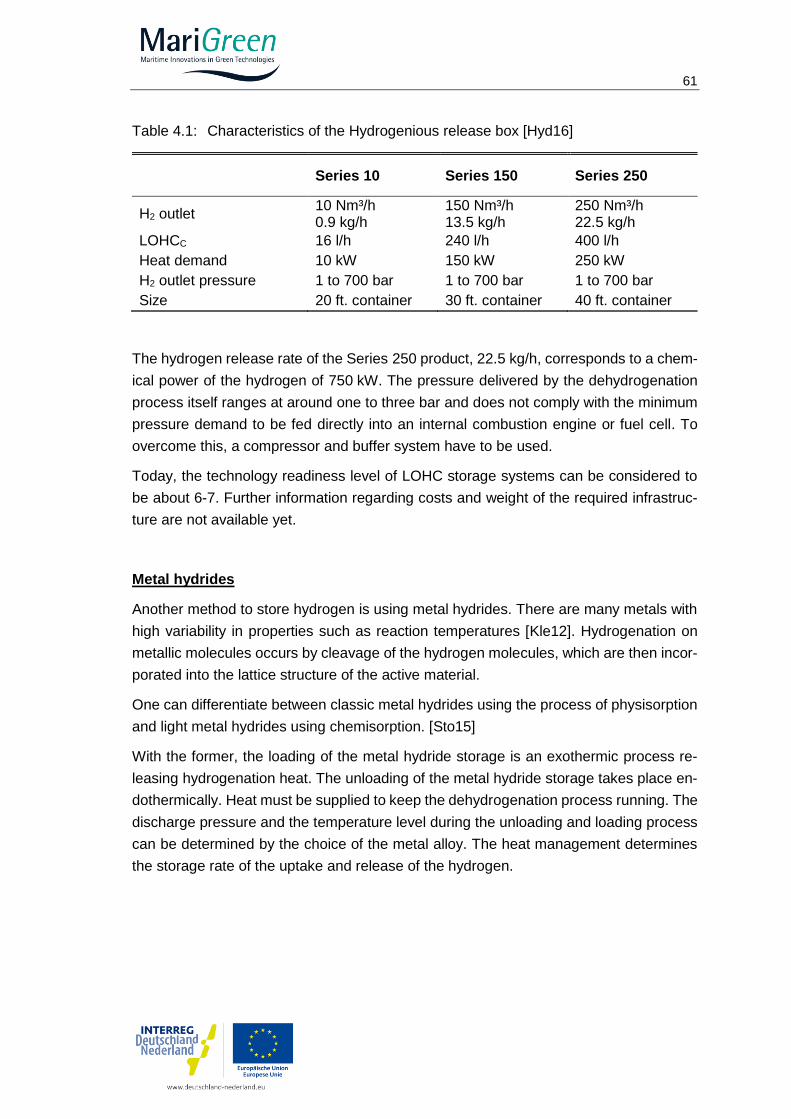
61
Table 4.1: Characteristics of the Hydrogenious release box [Hyd16]
Series 10 Series 150 Series 250
H2 outlet 10 Nm³/h 0.9 kg/h
150 Nm³/h 13.5 kg/h
250 Nm³/h 22.5 kg/h
LOHCC 16 l/h 240 l/h 400 l/h
Heat demand 10 kW 150 kW 250 kW
H2 outlet pressure 1 to 700 bar 1 to 700 bar 1 to 700 bar
Size 20 ft. container 30 ft. container 40 ft. container
The hydrogen release rate of the Series 250 product, 22.5 kg/h, corresponds to a chem-
ical power of the hydrogen of 750 kW. The pressure delivered by the dehydrogenation
process itself ranges at around one to three bar and does not comply with the minimum
pressure demand to be fed directly into an internal combustion engine or fuel cell. To
overcome this, a compressor and buffer system have to be used.
Today, the technology readiness level of LOHC storage systems can be considered to
be about 6-7. Further information regarding costs and weight of the required infrastruc-
ture are not available yet.
Metal hydrides
Another method to store hydrogen is using metal hydrides. There are many metals with
high variability in properties such as reaction temperatures [Kle12]. Hydrogenation on
metallic molecules occurs by cleavage of the hydrogen molecules, which are then incor-
porated into the lattice structure of the active material.
One can differentiate between classic metal hydrides using the process of physisorption
and light metal hydrides using chemisorption. [Sto15]
With the former, the loading of the metal hydride storage is an exothermic process re-
leasing hydrogenation heat. The unloading of the metal hydride storage takes place en-
dothermically. Heat must be supplied to keep the dehydrogenation process running. The
discharge pressure and the temperature level during the unloading and loading process
can be determined by the choice of the metal alloy. The heat management determines
the storage rate of the uptake and release of the hydrogen.
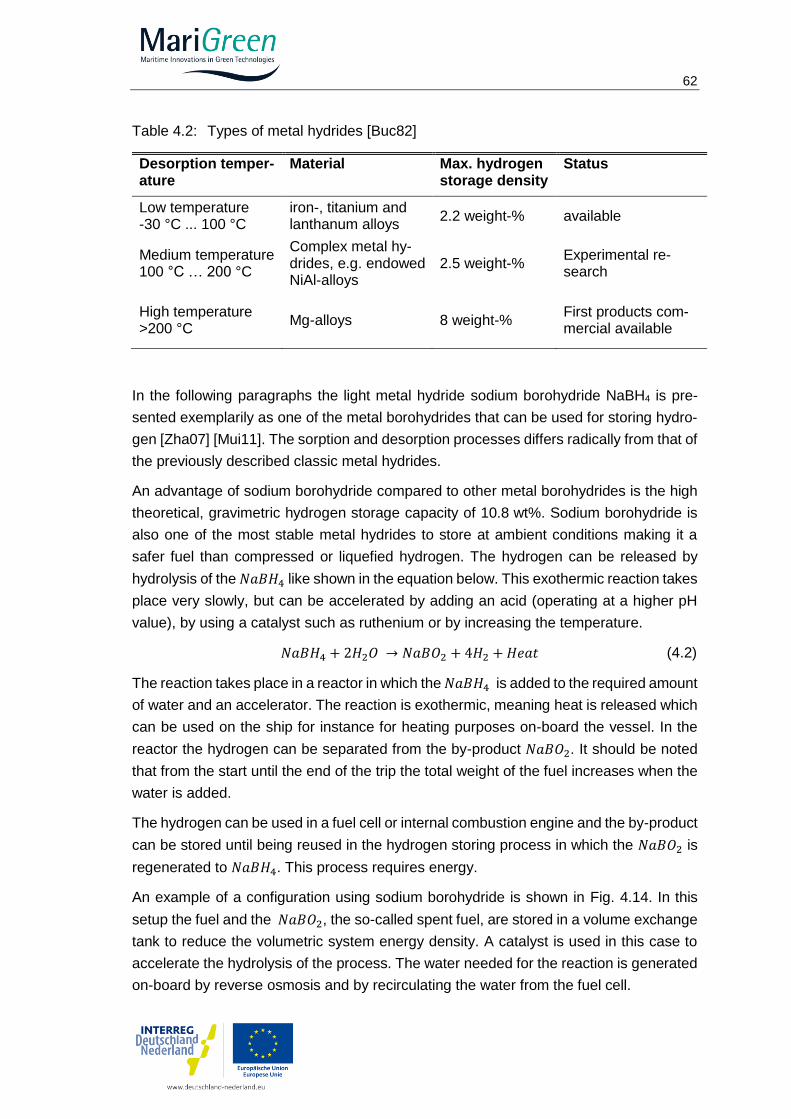
62
Table 4.2: Types of metal hydrides [Buc82]
Desorption temper-ature
Material Max. hydrogen storage density
Status
Low temperature -30 °C ... 100 °C
iron-, titanium and lanthanum alloys
2.2 weight-% available
Medium temperature 100 °C … 200 °C
Complex metal hy-drides, e.g. endowed NiAl-alloys
2.5 weight-% Experimental re-search
High temperature >200 °C
Mg-alloys 8 weight-% First products com-mercial available
In the following paragraphs the light metal hydride sodium borohydride NaBH4 is pre-
sented exemplarily as one of the metal borohydrides that can be used for storing hydro-
gen [Zha07] [Mui11]. The sorption and desorption processes differs radically from that of
the previously described classic metal hydrides.
An advantage of sodium borohydride compared to other metal borohydrides is the high
theoretical, gravimetric hydrogen storage capacity of 10.8 wt%. Sodium borohydride is
also one of the most stable metal hydrides to store at ambient conditions making it a
safer fuel than compressed or liquefied hydrogen. The hydrogen can be released by
hydrolysis of the 𝑁𝑎𝐵𝐻4 like shown in the equation below. This exothermic reaction takes
place very slowly, but can be accelerated by adding an acid (operating at a higher pH
value), by using a catalyst such as ruthenium or by increasing the temperature.
𝑁𝑎𝐵𝐻4 + 2𝐻2𝑂 → 𝑁𝑎𝐵𝑂2 + 4𝐻2 +𝐻𝑒𝑎𝑡 (4.2)
The reaction takes place in a reactor in which the 𝑁𝑎𝐵𝐻4 is added to the required amount
of water and an accelerator. The reaction is exothermic, meaning heat is released which
can be used on the ship for instance for heating purposes on-board the vessel. In the
reactor the hydrogen can be separated from the by-product 𝑁𝑎𝐵𝑂2. It should be noted
that from the start until the end of the trip the total weight of the fuel increases when the
water is added.
The hydrogen can be used in a fuel cell or internal combustion engine and the by-product
can be stored until being reused in the hydrogen storing process in which the 𝑁𝑎𝐵𝑂2 is
regenerated to 𝑁𝑎𝐵𝐻4. This process requires energy.
An example of a configuration using sodium borohydride is shown in Fig. 4.14. In this
setup the fuel and the 𝑁𝑎𝐵𝑂2, the so-called spent fuel, are stored in a volume exchange
tank to reduce the volumetric system energy density. A catalyst is used in this case to
accelerate the hydrolysis of the process. The water needed for the reaction is generated
on-board by reverse osmosis and by recirculating the water from the fuel cell.
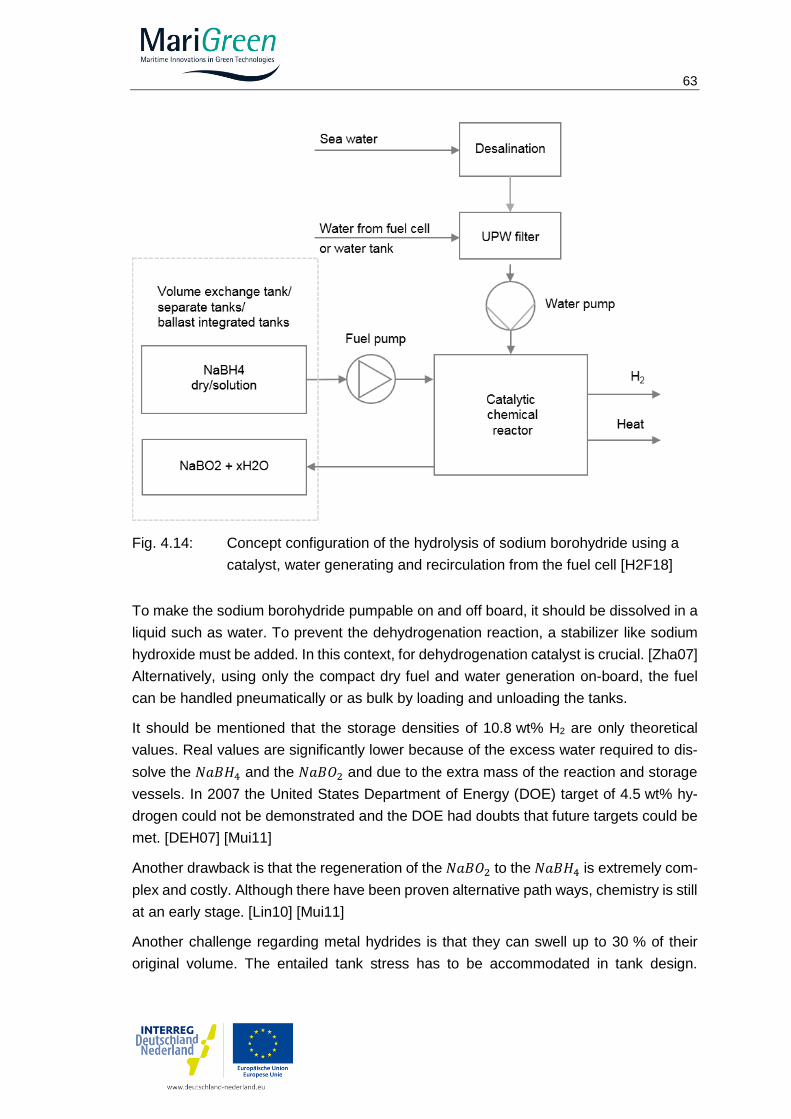
63
Fig. 4.14: Concept configuration of the hydrolysis of sodium borohydride using a
catalyst, water generating and recirculation from the fuel cell [H2F18]
To make the sodium borohydride pumpable on and off board, it should be dissolved in a
liquid such as water. To prevent the dehydrogenation reaction, a stabilizer like sodium
hydroxide must be added. In this context, for dehydrogenation catalyst is crucial. [Zha07]
Alternatively, using only the compact dry fuel and water generation on-board, the fuel
can be handled pneumatically or as bulk by loading and unloading the tanks.
It should be mentioned that the storage densities of 10.8 wt% H2 are only theoretical
values. Real values are significantly lower because of the excess water required to dis-
solve the 𝑁𝑎𝐵𝐻4 and the 𝑁𝑎𝐵𝑂2 and due to the extra mass of the reaction and storage
vessels. In 2007 the United States Department of Energy (DOE) target of 4.5 wt% hy-
drogen could not be demonstrated and the DOE had doubts that future targets could be
met. [DEH07] [Mui11]
Another drawback is that the regeneration of the 𝑁𝑎𝐵𝑂2 to the 𝑁𝑎𝐵𝐻4 is extremely com-
plex and costly. Although there have been proven alternative path ways, chemistry is still
at an early stage. [Lin10] [Mui11]
Another challenge regarding metal hydrides is that they can swell up to 30 % of their
original volume. The entailed tank stress has to be accommodated in tank design.
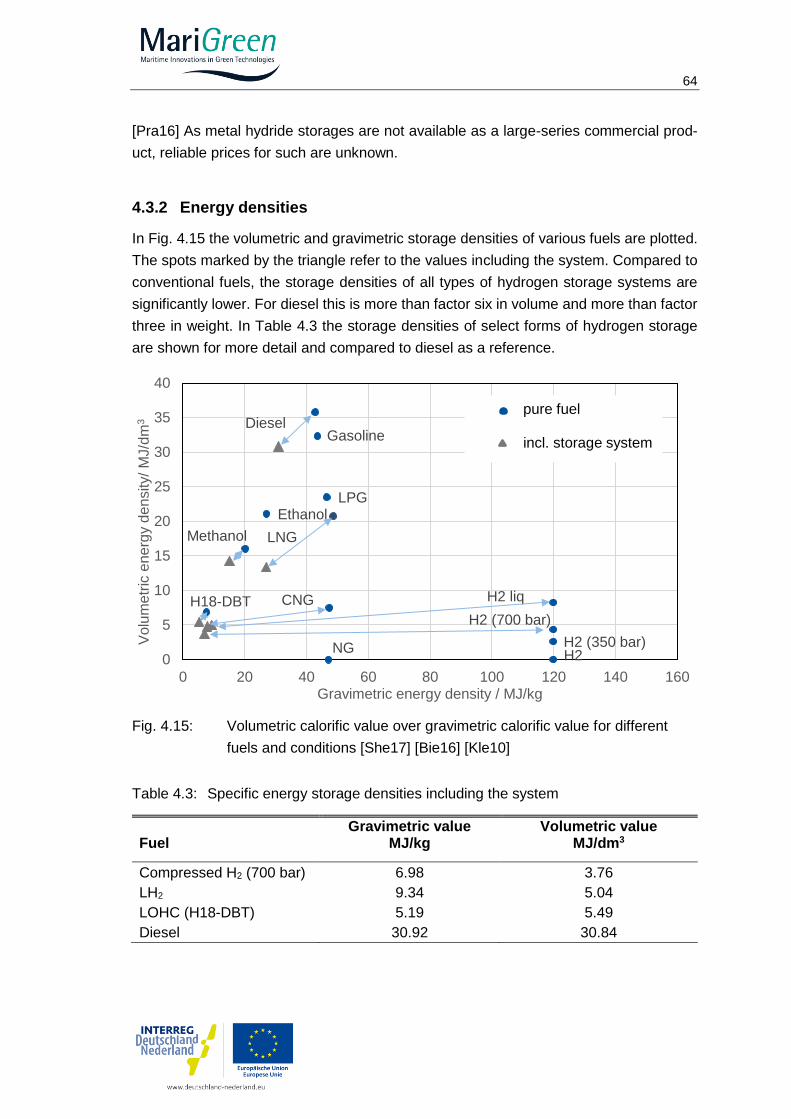
64
[Pra16] As metal hydride storages are not available as a large-series commercial prod-
uct, reliable prices for such are unknown.
4.3.2 Energy densities
In Fig. 4.15 the volumetric and gravimetric storage densities of various fuels are plotted.
The spots marked by the triangle refer to the values including the system. Compared to
conventional fuels, the storage densities of all types of hydrogen storage systems are
significantly lower. For diesel this is more than factor six in volume and more than factor
three in weight. In Table 4.3 the storage densities of select forms of hydrogen storage
are shown for more detail and compared to diesel as a reference.
Fig. 4.15: Volumetric calorific value over gravimetric calorific value for different
fuels and conditions [She17] [Bie16] [Kle10]
Table 4.3: Specific energy storage densities including the system
Fuel
Gravimetric value MJ/kg
Volumetric value MJ/dm3
Compressed H2 (700 bar) 6.98 3.76
LH2 9.34 5.04
LOHC (H18-DBT) 5.19 5.49
Diesel 30.92 30.84
Methanol
Ethanol
DieselGasoline
LPG
LNG
CNG
NG
H2 liq
H2 (700 bar)
H2 (350 bar)H2
H18-DBT
0
5
10
15
20
25
30
35
40
0 20 40 60 80 100 120 140 160
Vo
lum
etr
ic e
ne
rgy d
en
sity/
MJ/d
m3
Gravimetric energy density / MJ/kg
pure fuel
incl. storage system
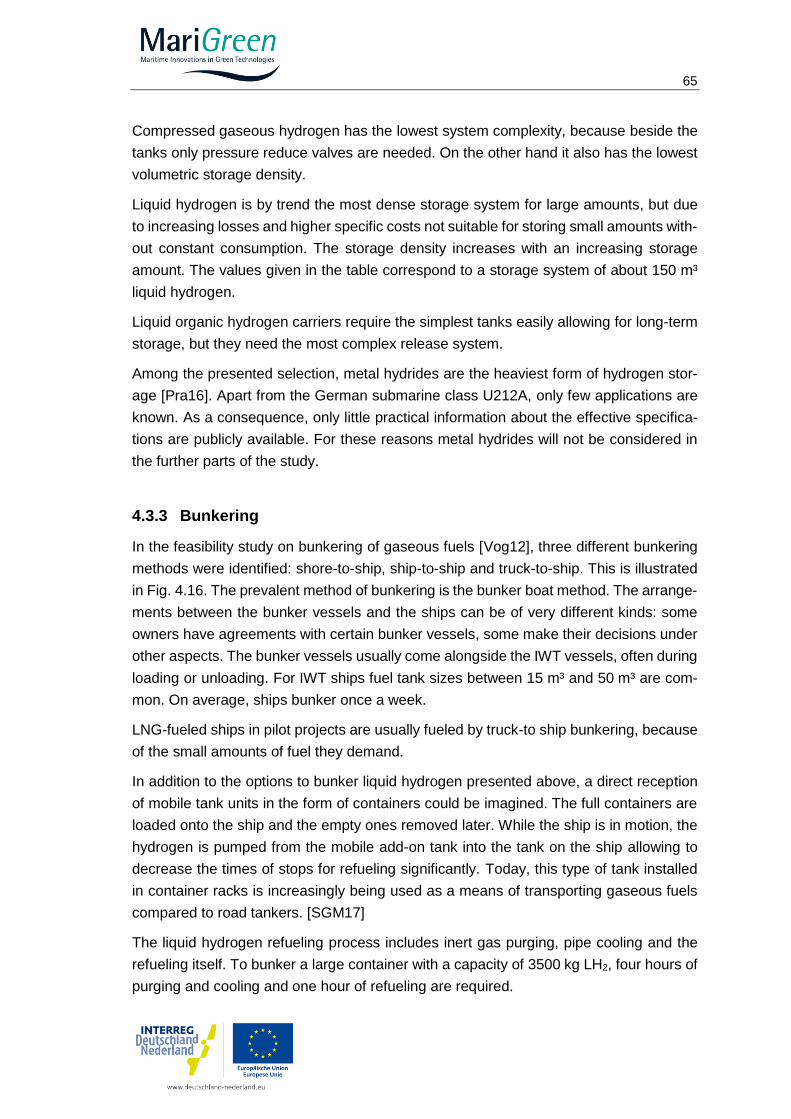
65
Compressed gaseous hydrogen has the lowest system complexity, because beside the
tanks only pressure reduce valves are needed. On the other hand it also has the lowest
volumetric storage density.
Liquid hydrogen is by trend the most dense storage system for large amounts, but due
to increasing losses and higher specific costs not suitable for storing small amounts with-
out constant consumption. The storage density increases with an increasing storage
amount. The values given in the table correspond to a storage system of about 150 m³
liquid hydrogen.
Liquid organic hydrogen carriers require the simplest tanks easily allowing for long-term
storage, but they need the most complex release system.
Among the presented selection, metal hydrides are the heaviest form of hydrogen stor-
age [Pra16]. Apart from the German submarine class U212A, only few applications are
known. As a consequence, only little practical information about the effective specifica-
tions are publicly available. For these reasons metal hydrides will not be considered in
the further parts of the study.
4.3.3 Bunkering
In the feasibility study on bunkering of gaseous fuels [Vog12], three different bunkering
methods were identified: shore-to-ship, ship-to-ship and truck-to-ship. This is illustrated
in Fig. 4.16. The prevalent method of bunkering is the bunker boat method. The arrange-
ments between the bunker vessels and the ships can be of very different kinds: some
owners have agreements with certain bunker vessels, some make their decisions under
other aspects. The bunker vessels usually come alongside the IWT vessels, often during
loading or unloading. For IWT ships fuel tank sizes between 15 m³ and 50 m³ are com-
mon. On average, ships bunker once a week.
LNG-fueled ships in pilot projects are usually fueled by truck-to ship bunkering, because
of the small amounts of fuel they demand.
In addition to the options to bunker liquid hydrogen presented above, a direct reception
of mobile tank units in the form of containers could be imagined. The full containers are
loaded onto the ship and the empty ones removed later. While the ship is in motion, the
hydrogen is pumped from the mobile add-on tank into the tank on the ship allowing to
decrease the times of stops for refueling significantly. Today, this type of tank installed
in container racks is increasingly being used as a means of transporting gaseous fuels
compared to road tankers. [SGM17]
The liquid hydrogen refueling process includes inert gas purging, pipe cooling and the
refueling itself. To bunker a large container with a capacity of 3500 kg LH2, four hours of
purging and cooling and one hour of refueling are required.
66
Fig. 4.16: Three possible ways of bunkering conceivable for hydrogen [Vog12].
The bunker stations consist of two hose connections; one for the hydrogen and inert gas
fill and one for the cool down gas return. Each hose is equipped with a dry break coupling,
an emergency release coupling, one isolating flange and gas leakage sensors.
Alternatively, bunkering can take place directly from compressed H2 delivery trucks. The
bunkering of compressed hydrogen can also take place via an exchange of whole con-
tainer racks. This allows shorter waiting times. The volume flow rate of the compressed
hydrogen during filling is approximately 60 g/s, as specified by ems.
The existing diesel infrastructure can be used to refuel LOHC. But the lower energy den-
sity of LOHC fuels leads to longer refueling times and larger tank volumes. This will be
discussed in more detail in Chapter 4.5.1.
Due to its limited operational radius the situation differs for ferries. Truck-to-ship bunker-
ing is usual nowadays. As long as fueling is carried out by trucks, fueling time is no critical
aspect with ferries, because the diesel truck drives onto the ferry where it stays during
the entire fueling process while normal operation continues. In case of hydrogen it should
be ensured that the ferry operation can continue during the fueling process. Direct cou-
pling to nearby gas stations is a beneficial option and should be considered when select-
ing the positions for hydrogen gas stations.
The frequency of diesel bunkering differs significantly between the considered ferries,
ranging from once every two to once every four weeks. A higher frequency would be
67
possible in order to reduce the necessary size of potential hydrogen storages. A detailed
overview of the duration of bunkering with the various technologies can be found in sec-
tion including an exemplary calculation for the select representative types of ships.
4.3.4 Requirements regarding constructional integration
In this subchapter, the requirements regarding the constructional integration for both hy-
drogen storage and energy conversion systems are dealt with, mainly related to regula-
tory and safety aspects.
The constructional integration poses certain basic challenges: The complex storage sys-
tem raises the weight and so does the additionally needed equipment for an electrostatic
discharge protected (ESD) room and a vent mast. The weight distribution being strongly
dependent on the storage technique and type of ship can only be evaluated in combina-
tion with a general arrangement plan which should be covered in a follow-up study. The
increased occupied space, which is in IWT the far more important criterion, is very chal-
lenging as well. When placed on deck, the maximum height defined by the desired bridge
clearance also has to be respected. Moreover, other criteria have to be respected such
as the requirement that the tank room has to be accessible from the open deck. In order
to avoid loss of propulsion, the hydrogen propulsion system must have the same redun-
dancy level (tanks, vaporizer, etc.) as conventional marine gasoil (MGO) ships. Accord-
ing to the class requirements, areas with extreme surface temperatures have to be iden-
tified
For all types of vessel, the limited air draft at the sailing route is the most important issue
regarding the installation of the outlet of the pressure relief valves which will be required
for the installation of a liquid hydrogen storage and compressed hydrogen (CH2) storage
tank system.
According to the IGF code chapters 6.7.2.7 and 6.7.2.8, the outlets from the pressure
relief valves shall normally be located at least 10 m from the nearest:
1. air intake, air outlet or opening to accommodation, service and control spaces, or
other non-hazardous area; and
2. exhaust outlet from machinery installations.
Each pressure relief valve installed on a liquefied gas fuel tank shall be connected to a
venting system, which shall be:
1. constructed in a way that the discharge will be unimpeded and normally be di-
rected vertically upwards at the exit;
2. arranged to minimize the possibility of water or snow entering the vent system;
and
68
3. arranged such that the height of vent exits shall normally not be less than B/3 or
6 m, whichever is the greater, above the weather deck and 6 m above working
areas and walkways. However, vent mast height could be limited to lower value
according to special consideration by the administration.
It has to be checked in detail in a follow-up study if the required distances can be reduced
by presenting the results of a dispersion analysis to the administration for evaluation.
In the IGF code Chapter 12.5 three hazardous area zones are defined:
Hazardous Zone 0
This zone includes, but is not limited to the interiors of fuel tanks, any pipework for pres-
sure-relief or other venting systems for fuel tanks, pipes and equipment containing fuel.
Hazardous Zone 1
This zone includes, but is not limited to:
1. tank connection spaces, fuel storage hold spaces and interbarrier spaces;
2. fuel preparation room arranged with ventilation according to 13.6; areas on open
deck, or semi-enclosed spaces on deck, within 3 m of any fuel tank outlet, gas or
vapor outlet, bunker manifold valve, other fuel valves, fuel pipe flange, fuel prep-
aration room ventilation outlets and fuel tank openings for pressure release pro-
vided to permit the flow of small volumes of gas or vapor mixtures caused by
thermal variation;
3. areas on open deck or semi-enclosed spaces on deck, within 1.5 m of fuel prep-
aration room entrances, fuel preparation room ventilation inlets and other open-
ings into zone 1 spaces;
4. areas on the open deck within spillage coamings surrounding gas bunker mani-
fold valves and 3 m beyond these, up to a height of 2.4 m above the deck;
5. enclosed or semi-enclosed spaces in which pipes containing fuel are located,
e.g. ducts around fuel pipes, semi-enclosed bunkering stations
6. the ESD-protected machinery space is considered a non-hazardous area during
normal operation, but requires the equipment mandatory to be certified as suita-
ble for zone 1 in case a gas leakage is detected.
7. a space protected by an airlock is considered as non-hazardous area during nor-
mal operation, but requires the equipment mandatory to be certified as suitable
for zone 1 in case of a loss in differential pressure between the protected space
and the hazardous area.
8. except for type C tanks, an area within 2.4 m of the outer surface of a fuel con-
tainment system where such surface is exposed to the weather
69
Hazardous Zone 2
This zone includes, but is not limited to areas within 1.5 m surrounding open or semi-
enclosed spaces of zone 1 as well as a space containing bolted hatches to the tank
connection space.
To identify the hazardous zones a hazardous area plan is mandatory to define the instal-
lation of the electrical equipment, ventilation systems and passenger accommodation
spaces. At this stage no general arrangement plan is available and it is not possible to
prepare the hazardous area plan for the vessel types.
In the IGF code chapter 6.6.4 the storage of compressed gas is normally not acceptable
but may be permitted after special consideration and approval from the administration.
Machinery space concepts
The IGF code describes two alternative concepts for the machinery space:
1. Gas safe machinery space
2. ESD protected machinery space
For the gas safe machinery space a single failure in the fuel system should not lead to a
gas release into the machinery space. That means that the gas pipes have to be double
walled piping, also at the internal combustion engine (ICE).
ESD protection should be limited to machinery spaces that are certified for periodically
unattended operation. The following minimum arrangement shall be provided:
Gas detector
Shut off valve
Redundancy
Efficient ventilation
Gas pipes without gastight external enclosure may be accepted under the following re-
strictions (IGF Code chapter 6.6.3)
Engines for generating propulsion power and electric power shall be located in
two or more machinery spaces not having any common boundaries unless it can
be documented that a single casualty will not affect both spaces.
The gas machinery space shall contain only a minimum of such necessary equip-
ment, components and systems as are required to ensure that the gas machinery
maintains its function
A fixed gas detection system shall be fitted arranged to automatically shut down
the gas supply, and disconnect all electrical equipment or installations not of a
certified safe type.
70
Without doubt the gas safe machinery space is the target for a refit or new building to
avoid extremely complex arrangements regarding the location of the electrical equip-
ment, ventilation and main engines / main generators.
4.4 Energy conversion
Onboard the vessels, hydrogen can either be converted to the required form of energy
by an internal combustion engine (either direct drive or in combination with a genset and
an electric motor; see section 4.4.1) or a fuel cell and an electric motor, see section 4.4.2.
When comparing ICEs and FCs, one must distinguish between mechanical and electrical
energy. Internal combustion engines provide mechanical energy, whereas fuel cells di-
rectly produce electricity. Power used for propulsion is mechanical power, whereas most
auxiliary consumers demand electrical energy. Conversion between these forms always
comes with losses.
4.4.1 Internal Combustion Engine
The conversion of hydrogen to mechanical energy using internal combustion engines
(ICE) seems beneficial for several reasons. Especially applications requiring a high pro-
pulsion power and low energy consumption for auxiliaries can profit with a direct conver-
sion.
The majority of currently available propulsion systems in inland waterway vessels are
based on internal combustion engines. The use of hydrogen as fuel offers the possibility
to adapt existing engine concepts to hydrogen beside the new design of engines dedi-
cated to hydrogen as fuel.
The properties of hydrogen as fuel differ significantly from current fuels so that several
changes in the setup of a combustion engine are required.
Injection System
Turbocharger and intercooler
Ignition system
Lubrication system
Cooling system
Valvetrain
Compression ratio
Crankcase ventilation
Whereas changes in injection, charging and ignition are mandatory to realize an H2-ICE
without lack of performance the further mentioned points need to be adapted if zero
emission combustion shall be realized. The most important system within the aforemen-
tioned is the injection system. In principle, two main approaches can be considered. One
71
is the injection into the intake manifold leading to a mixture formation outside of the com-
bustion chamber. The second one is the direct injection into the combustion chamber
and an internal mixture formation.
Injection into the manifold:
Technically less demanding
More suitable for retrofit approaches
Reduction of cylinder charge
Accurate timing to valvetrain required to avoid backfire
The integration of manifold fuel injection systems does not require any changes to the
cylinder head. They can be mounted on the intake manifold directly upstream the intake
valves and so they are more suitable for retrofitting existing engines. To avoid an ignita-
ble mixture in the intake that could lead to backfire the injection timing must accurately
be coupled to the intake valve opening time. The high volume of injected H2 replaces up
to 30 % of the air charge compared to a conventional engine running on diesel fuel. This
reduction of cylinder charge directly reduces the achievable engine power. As counter-
measure an adaption of the charging system is required. According to [SAE03] an addi-
tional boost pressure of 850 mbar is sufficient to realize constant power output. Another
countermeasure can be the use of cryogenic hydrogen (if LH2 is used) that would cool
the charge during injection resulting in a rising charge density. Injection systems for H2
port fuel injection are meanwhile available (e.g. from 2G Energy AG)
Direct injection
High technical effort for adaption of engine design
Complex technology
High gas pressures compared to port fuel injection
No influence on cylinder charge
Reduced risk of backfire
Reduced H2 slip
Most of the major demerits of port fuel injection systems can be solved using direct in-
jection systems. The injection of hydrogen into the cylinder during compression stroke
does not influence the cylinder charge and avoids any H2 in the intake manifold so that
the risk of backfire is drastically reduced. A typical cylinder head design of a combustion
engine does not allow significant changes like the setup of an additional injector because
the available space is used for optimized valve positioning as well as coolant and lubri-
cation channels. This leads to a higher effort for the mounting of an injection and an
ignition system into an existing design.
To use hydrogen in internal combustion engines an ignition system is required. This sys-
tem has to be added if a compression ignition engine is the base for a conversion. Com-
pared to other gaseous fuels like natural gas, hydrogen has the advantage of high flame
velocities and good ignitability which allow the use of spark plugs also for large bore
engine designs. The heat rating of these spark plugs has to be selected carefully to
72
match the combustion parameters. As a result of the very clean H2 combustion no de-
posits on spark plugs are expected so that colder plugs could be used and the mainte-
nance intervals could be extended.
To realize a comparable power and dynamic behavior as a diesel powered engine an
exchange or modification of the charging system is necessary. Especially in low end
torque (low engine speed high torque) higher boosting pressures have to be realized. In
retrofit applications the turbocharger has to be exchanged or a charger has to be added
if a naturally aspired engine is used as base.
The properties of hydrogen as fuel enable nearly zero emission combustion concepts.
Emissions of carbon monoxide, hydrocarbons and particulates are fully oil borne if hy-
drogen is used as fuel. Compared to hydrocarbon fuels these emissions are initially very
low. To further reduce these emissions changes in the lubrication system have to be
considered. These measures include changes in crankcase ventilation, valve shaft seal-
ing and also piston rings which shall be considered in the design of a dedicated H2 engine
but would be too costly in retrofit approaches. The emission level for NOx emissions is
comparable to a diesel or gasoline engine or even higher. To reduce NOx emissions
exhaust gas recirculation (EGR) as well as lean combustion can be used. The high ig-
nitability of hydrogen air mixtures allow air to fuel ratios of λ > 2. In such lean conditions
the NOx emissions are close to the detection limit. In combination with direct injection
systems this can be used to unthrottle the engine and use the efficiency benefits. Due to
the very clean combustion EGR could be adapted much easier and so it can be used for
NOx reduction and unthrottling.
Considering the minimum necessary modifications to realize a reliable, efficient and low
emission engine operation, add-on costs of 20% are valued to be reasonable. The
budget prices in Table 4.4 have been provided by Zeppelin Power Systems GmbH & Co.
KG incl. the gear box.
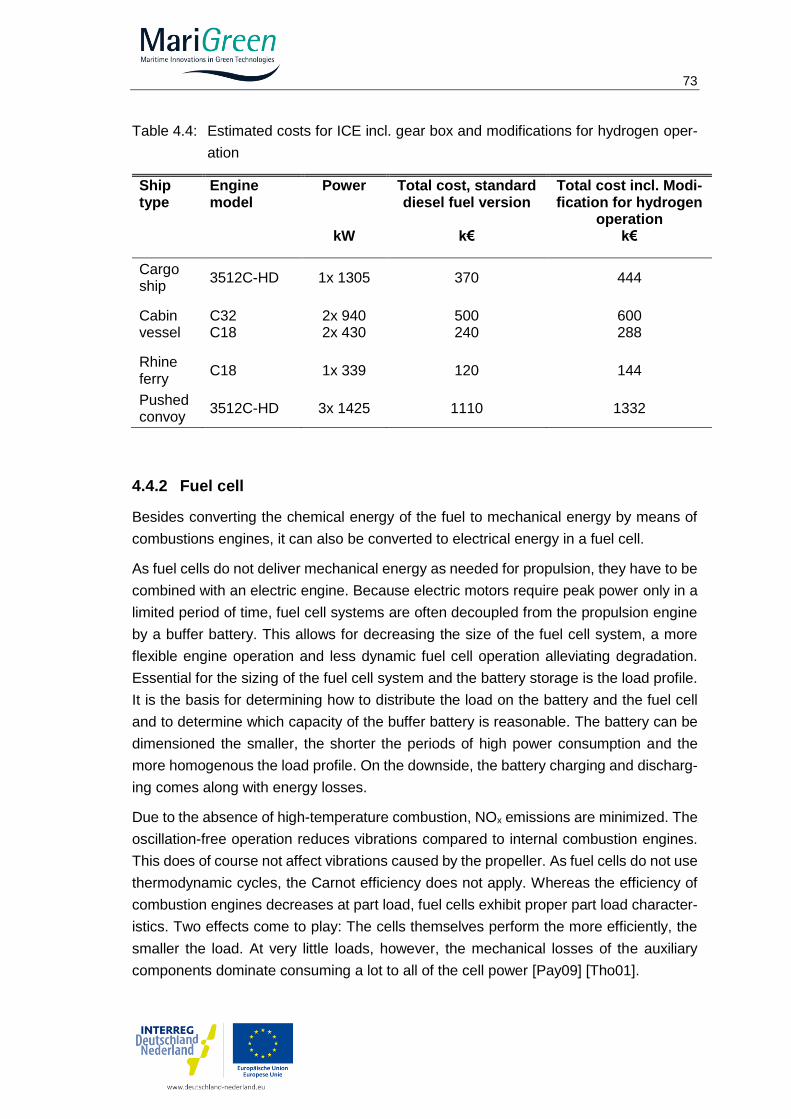
73
Table 4.4: Estimated costs for ICE incl. gear box and modifications for hydrogen oper-
ation
Ship type
Engine model
Power
kW
Total cost, standard diesel fuel version
k€
Total cost incl. Modi-fication for hydrogen
operation k€
Cargo ship
3512C-HD 1x 1305 370 444
Cabin vessel
C32 C18
2x 940 2x 430
500 240
600 288
Rhine ferry
C18 1x 339 120 144
Pushed convoy
3512C-HD 3x 1425 1110 1332
4.4.2 Fuel cell
Besides converting the chemical energy of the fuel to mechanical energy by means of
combustions engines, it can also be converted to electrical energy in a fuel cell.
As fuel cells do not deliver mechanical energy as needed for propulsion, they have to be
combined with an electric engine. Because electric motors require peak power only in a
limited period of time, fuel cell systems are often decoupled from the propulsion engine
by a buffer battery. This allows for decreasing the size of the fuel cell system, a more
flexible engine operation and less dynamic fuel cell operation alleviating degradation.
Essential for the sizing of the fuel cell system and the battery storage is the load profile.
It is the basis for determining how to distribute the load on the battery and the fuel cell
and to determine which capacity of the buffer battery is reasonable. The battery can be
dimensioned the smaller, the shorter the periods of high power consumption and the
more homogenous the load profile. On the downside, the battery charging and discharg-
ing comes along with energy losses.
Due to the absence of high-temperature combustion, NOx emissions are minimized. The
oscillation-free operation reduces vibrations compared to internal combustion engines.
This does of course not affect vibrations caused by the propeller. As fuel cells do not use
thermodynamic cycles, the Carnot efficiency does not apply. Whereas the efficiency of
combustion engines decreases at part load, fuel cells exhibit proper part load character-
istics. Two effects come to play: The cells themselves perform the more efficiently, the
smaller the load. At very little loads, however, the mechanical losses of the auxiliary
components dominate consuming a lot to all of the cell power [Pay09] [Tho01].
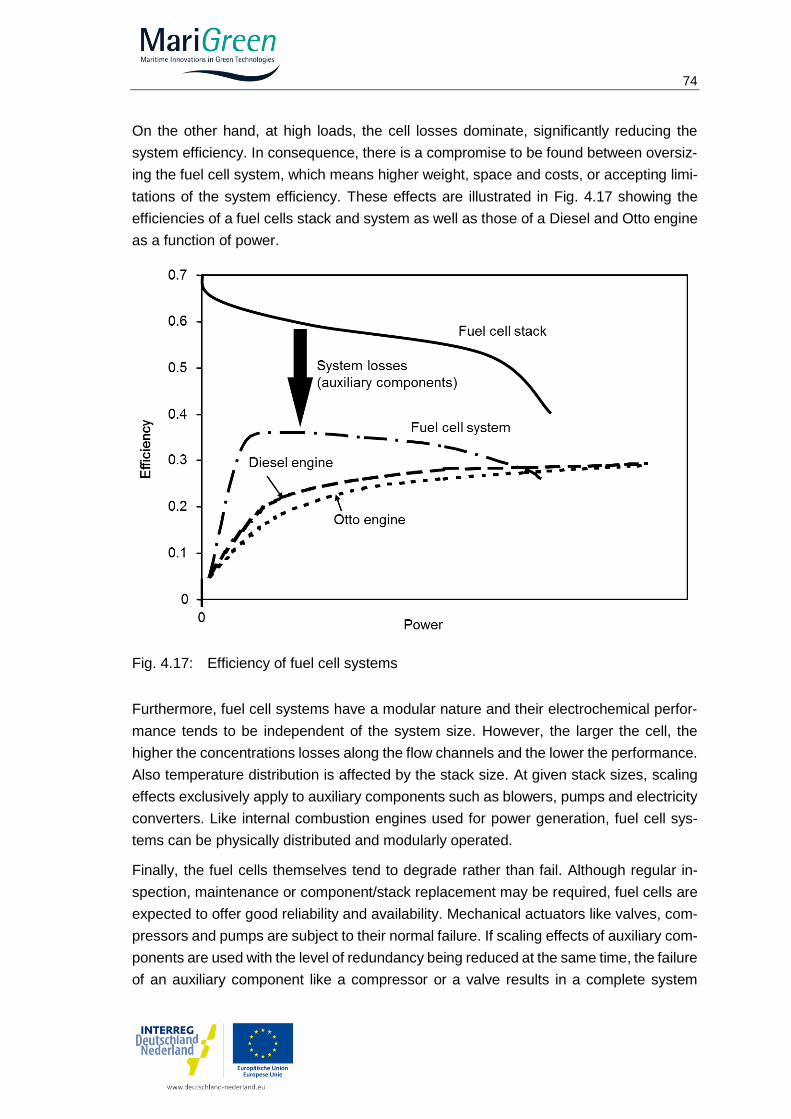
74
On the other hand, at high loads, the cell losses dominate, significantly reducing the
system efficiency. In consequence, there is a compromise to be found between oversiz-
ing the fuel cell system, which means higher weight, space and costs, or accepting limi-
tations of the system efficiency. These effects are illustrated in Fig. 4.17 showing the
efficiencies of a fuel cells stack and system as well as those of a Diesel and Otto engine
as a function of power.
Fig. 4.17: Efficiency of fuel cell systems
Furthermore, fuel cell systems have a modular nature and their electrochemical perfor-
mance tends to be independent of the system size. However, the larger the cell, the
higher the concentrations losses along the flow channels and the lower the performance.
Also temperature distribution is affected by the stack size. At given stack sizes, scaling
effects exclusively apply to auxiliary components such as blowers, pumps and electricity
converters. Like internal combustion engines used for power generation, fuel cell sys-
tems can be physically distributed and modularly operated.
Finally, the fuel cells themselves tend to degrade rather than fail. Although regular in-
spection, maintenance or component/stack replacement may be required, fuel cells are
expected to offer good reliability and availability. Mechanical actuators like valves, com-
pressors and pumps are subject to their normal failure. If scaling effects of auxiliary com-
ponents are used with the level of redundancy being reduced at the same time, the failure
of an auxiliary component like a compressor or a valve results in a complete system
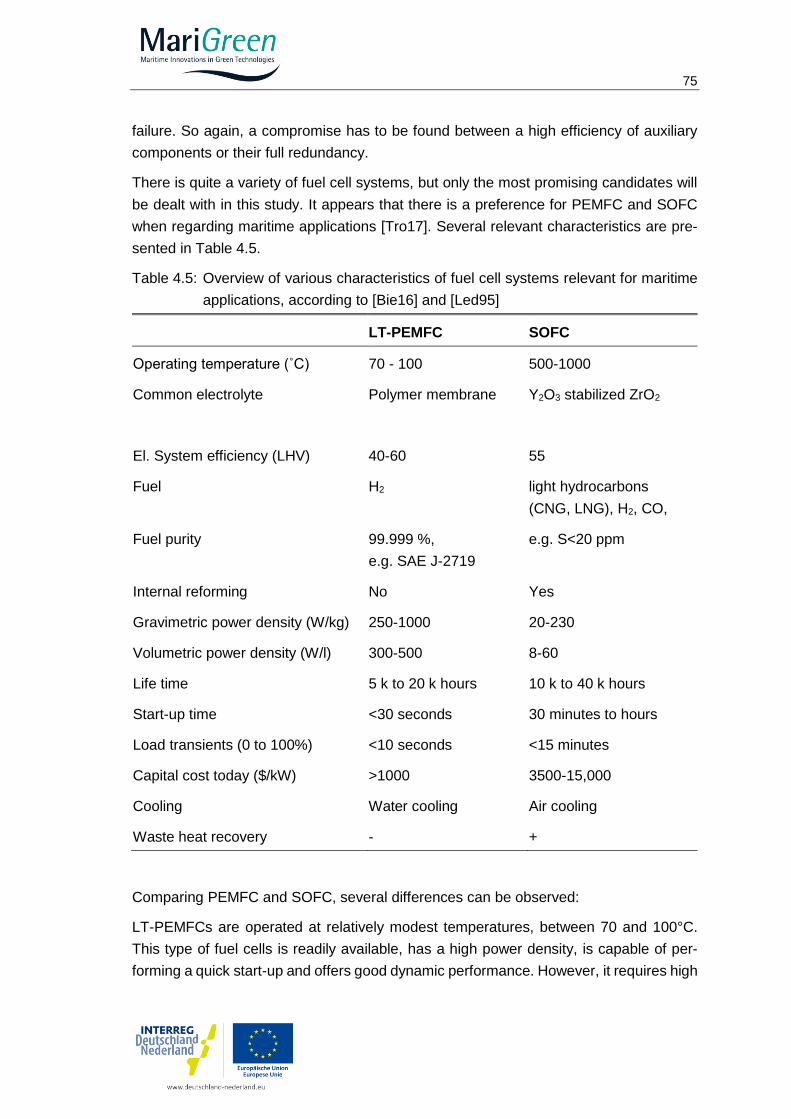
75
failure. So again, a compromise has to be found between a high efficiency of auxiliary
components or their full redundancy.
There is quite a variety of fuel cell systems, but only the most promising candidates will
be dealt with in this study. It appears that there is a preference for PEMFC and SOFC
when regarding maritime applications [Tro17]. Several relevant characteristics are pre-
sented in Table 4.5.
Table 4.5: Overview of various characteristics of fuel cell systems relevant for maritime
applications, according to [Bie16] and [Led95]
LT-PEMFC SOFC
Operating temperature (˚C) 70 - 100 500-1000
Common electrolyte Polymer membrane Y2O3 stabilized ZrO2
El. System efficiency (LHV) 40-60 55
Fuel H2 light hydrocarbons
(CNG, LNG), H2, CO,
Fuel purity 99.999 %,
e.g. SAE J-2719
e.g. S<20 ppm
Internal reforming No Yes
Gravimetric power density (W/kg) 250-1000 20-230
Volumetric power density (W/l) 300-500 8-60
Life time 5 k to 20 k hours 10 k to 40 k hours
Start-up time <30 seconds 30 minutes to hours
Load transients (0 to 100%) <10 seconds <15 minutes
Capital cost today ($/kW) >1000 3500-15,000
Cooling Water cooling Air cooling
Waste heat recovery - +
Comparing PEMFC and SOFC, several differences can be observed:
LT-PEMFCs are operated at relatively modest temperatures, between 70 and 100°C.
This type of fuel cells is readily available, has a high power density, is capable of per-
forming a quick start-up and offers good dynamic performance. However, it requires high
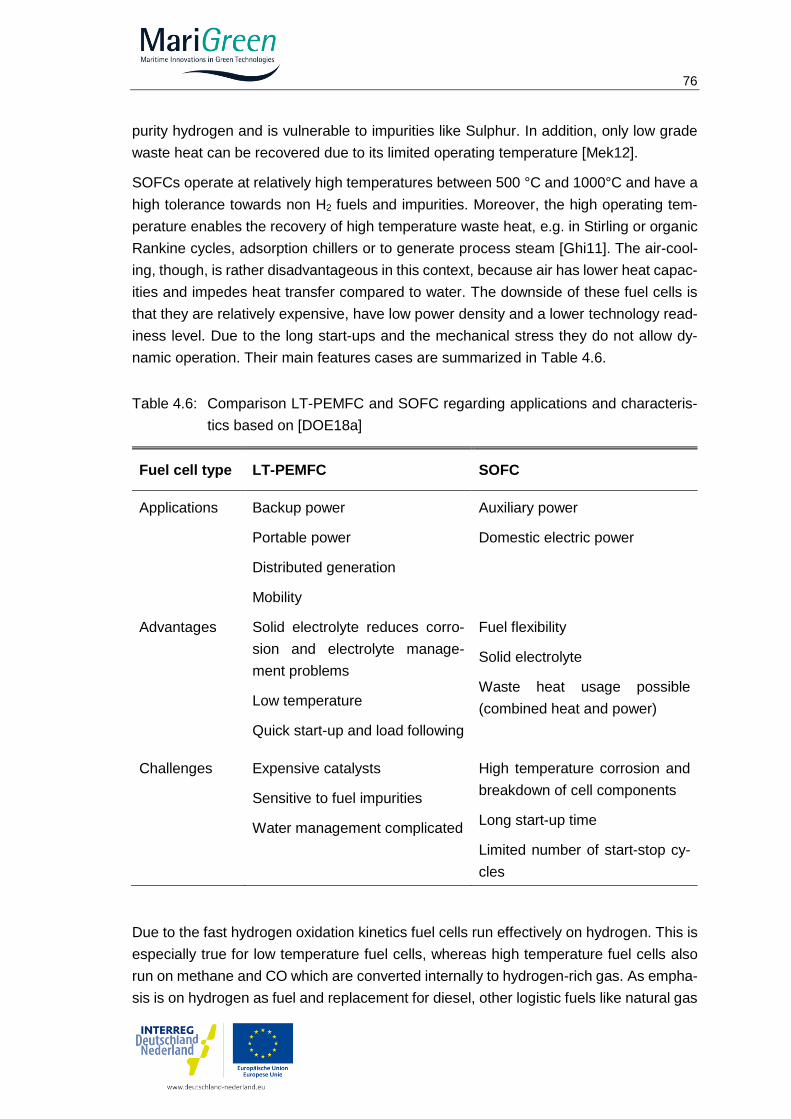
76
purity hydrogen and is vulnerable to impurities like Sulphur. In addition, only low grade
waste heat can be recovered due to its limited operating temperature [Mek12].
SOFCs operate at relatively high temperatures between 500 °C and 1000°C and have a
high tolerance towards non H2 fuels and impurities. Moreover, the high operating tem-
perature enables the recovery of high temperature waste heat, e.g. in Stirling or organic
Rankine cycles, adsorption chillers or to generate process steam [Ghi11]. The air-cool-
ing, though, is rather disadvantageous in this context, because air has lower heat capac-
ities and impedes heat transfer compared to water. The downside of these fuel cells is
that they are relatively expensive, have low power density and a lower technology read-
iness level. Due to the long start-ups and the mechanical stress they do not allow dy-
namic operation. Their main features cases are summarized in Table 4.6.
Table 4.6: Comparison LT-PEMFC and SOFC regarding applications and characteris-
tics based on [DOE18a]
Fuel cell type LT-PEMFC SOFC
Applications Backup power
Portable power
Distributed generation
Mobility
Auxiliary power
Domestic electric power
Advantages Solid electrolyte reduces corro-
sion and electrolyte manage-
ment problems
Low temperature
Quick start-up and load following
Fuel flexibility
Solid electrolyte
Waste heat usage possible
(combined heat and power)
Challenges Expensive catalysts
Sensitive to fuel impurities
Water management complicated
High temperature corrosion and
breakdown of cell components
Long start-up time
Limited number of start-stop cy-
cles
Due to the fast hydrogen oxidation kinetics fuel cells run effectively on hydrogen. This is
especially true for low temperature fuel cells, whereas high temperature fuel cells also
run on methane and CO which are converted internally to hydrogen-rich gas. As empha-
sis is on hydrogen as fuel and replacement for diesel, other logistic fuels like natural gas

77
(NG), methanol (MeOH), dimethyl ether (DME), and ammonia (NH3) will not be discussed
here.
Currently there are no SOFC fuel cells available that are designed for pure hydrogen
operation [Pra16], although this would be possible from a technical point of view. One
reason is that the major advantage of SOFC technology is the flexibility regarding various
kinds of fuels which come along with a couple of disadvantages, as mentioned. This
makes SOFCs attractive for stationary operations in location where fuels like natural gas
are available, whereas in other applications like the automotive sector in which pure hy-
drogen is available or desired PEM fuel cells are commonly preferred.
As known, there are many suppliers of different types of fuel cells. In Fig. 4.7 a selection
of fuel cell suppliers is listed. It was attempted to list suppliers which are able to provide
fuel cells for marine applications incl. sufficient power. Not included in this comparison
are costs, an important criterion for selecting a system. It is salient that the fuel cell sys-
tem offered by Powercell is advertised with an energy density four times as high as that
of established competitors. It should be noted that this is not a series, but a prototype
product whose long-term functionality still is to be proven.
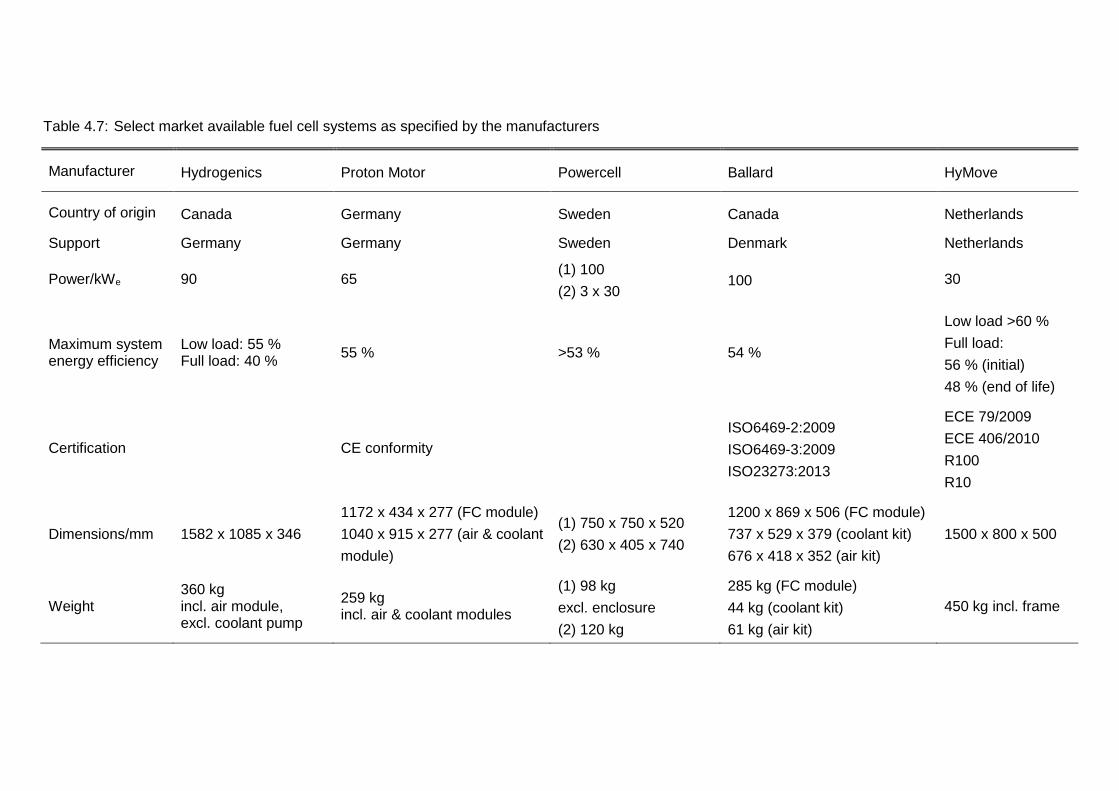
Table 4.7: Select market available fuel cell systems as specified by the manufacturers
Manufacturer Hydrogenics Proton Motor Powercell Ballard HyMove
Country of origin Canada Germany Sweden Canada Netherlands
Support Germany Germany Sweden Denmark Netherlands
Power/kWe 90 65 (1) 100
(2) 3 x 30 100 30
Maximum system energy efficiency
Low load: 55 % Full load: 40 %
55 % >53 % 54 %
Low load >60 %
Full load:
56 % (initial)
48 % (end of life)
Certification CE conformity
ISO6469-2:2009
ISO6469-3:2009
ISO23273:2013
ECE 79/2009
ECE 406/2010
R100
R10
Dimensions/mm 1582 x 1085 x 346
1172 x 434 x 277 (FC module)
1040 x 915 x 277 (air & coolant
module)
(1) 750 x 750 x 520
(2) 630 x 405 x 740
1200 x 869 x 506 (FC module)
737 x 529 x 379 (coolant kit)
676 x 418 x 352 (air kit)
1500 x 800 x 500
Weight 360 kg incl. air module, excl. coolant pump
259 kg incl. air & coolant modules
(1) 98 kg
excl. enclosure
(2) 120 kg
285 kg (FC module)
44 kg (coolant kit)
61 kg (air kit)
450 kg incl. frame
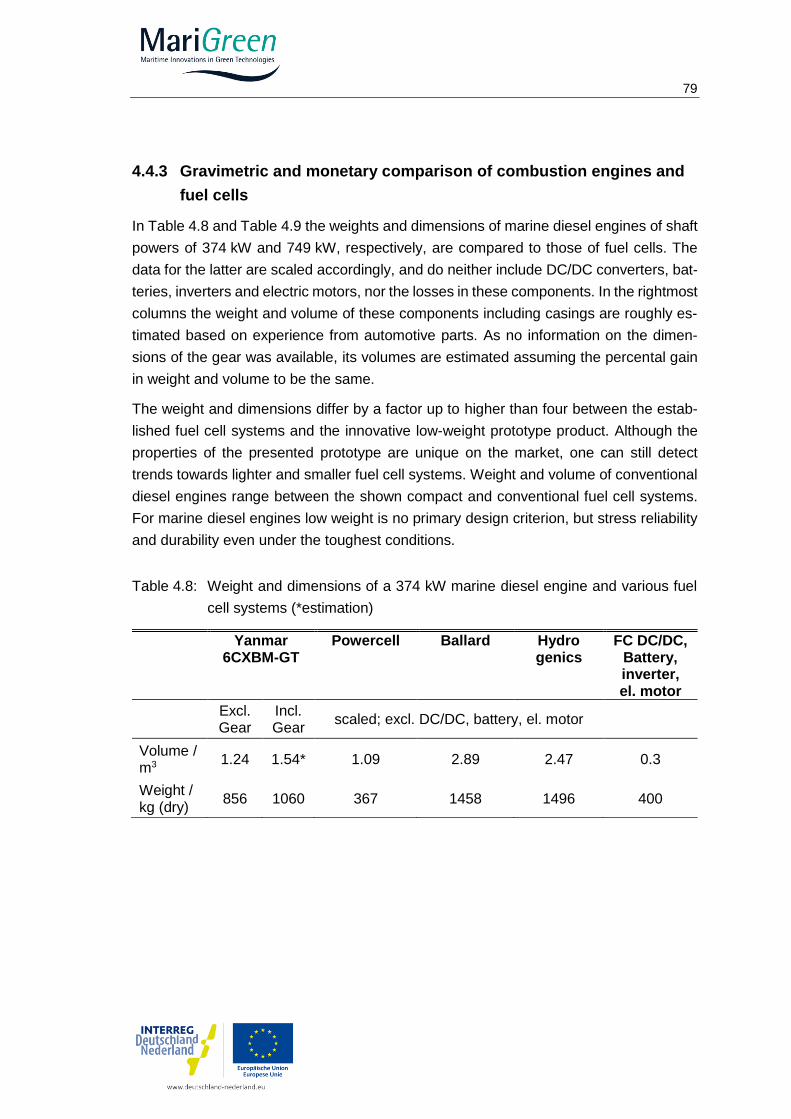
79
4.4.3 Gravimetric and monetary comparison of combustion engines and
fuel cells
In Table 4.8 and Table 4.9 the weights and dimensions of marine diesel engines of shaft
powers of 374 kW and 749 kW, respectively, are compared to those of fuel cells. The
data for the latter are scaled accordingly, and do neither include DC/DC converters, bat-
teries, inverters and electric motors, nor the losses in these components. In the rightmost
columns the weight and volume of these components including casings are roughly es-
timated based on experience from automotive parts. As no information on the dimen-
sions of the gear was available, its volumes are estimated assuming the percental gain
in weight and volume to be the same.
The weight and dimensions differ by a factor up to higher than four between the estab-
lished fuel cell systems and the innovative low-weight prototype product. Although the
properties of the presented prototype are unique on the market, one can still detect
trends towards lighter and smaller fuel cell systems. Weight and volume of conventional
diesel engines range between the shown compact and conventional fuel cell systems.
For marine diesel engines low weight is no primary design criterion, but stress reliability
and durability even under the toughest conditions.
Table 4.8: Weight and dimensions of a 374 kW marine diesel engine and various fuel
cell systems (*estimation)
Yanmar
6CXBM-GT Powercell Ballard Hydro
genics FC DC/DC,
Battery, inverter, el. motor
Excl. Gear
Incl. Gear
scaled; excl. DC/DC, battery, el. motor
Volume / m3
1.24 1.54* 1.09 2.89 2.47 0.3
Weight / kg (dry)
856 1060 367 1458 1496 400
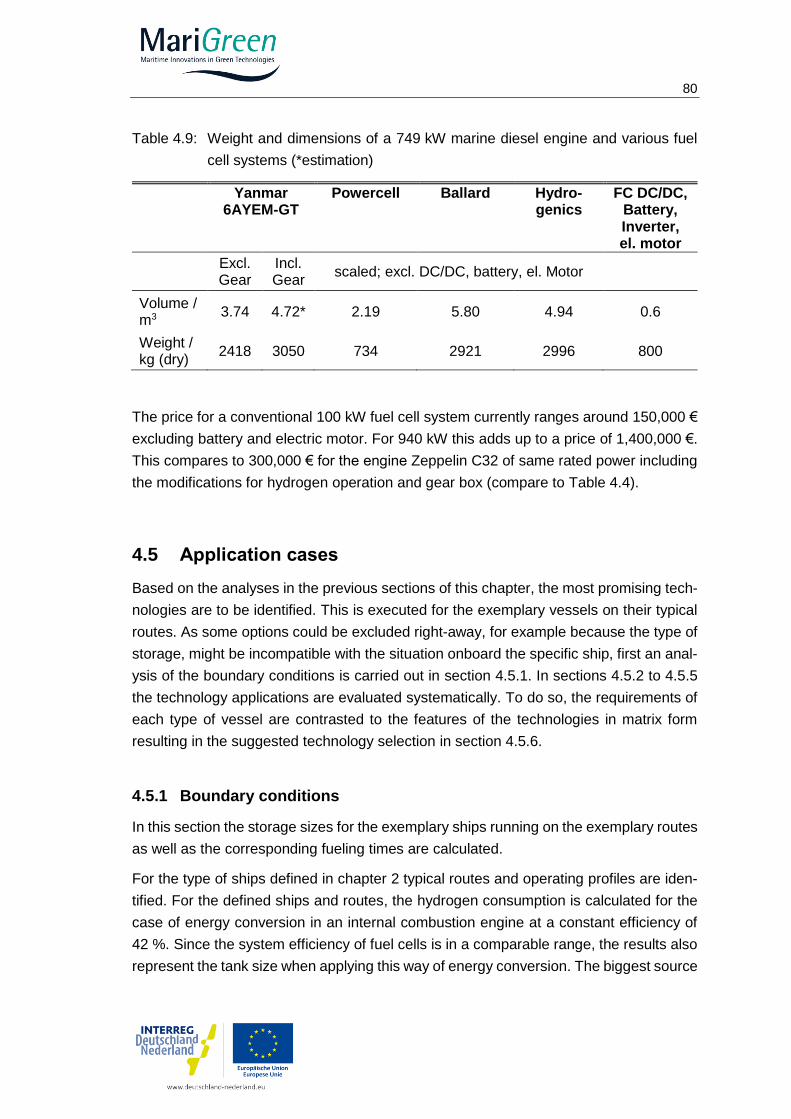
80
Table 4.9: Weight and dimensions of a 749 kW marine diesel engine and various fuel
cell systems (*estimation)
Yanmar
6AYEM-GT Powercell Ballard Hydro-
genics FC DC/DC,
Battery, Inverter, el. motor
Excl. Gear
Incl. Gear
scaled; excl. DC/DC, battery, el. Motor
Volume / m3
3.74 4.72* 2.19 5.80 4.94 0.6
Weight / kg (dry)
2418 3050 734 2921 2996 800
The price for a conventional 100 kW fuel cell system currently ranges around 150,000 €
excluding battery and electric motor. For 940 kW this adds up to a price of 1,400,000 €.
This compares to 300,000 € for the engine Zeppelin C32 of same rated power including
the modifications for hydrogen operation and gear box (compare to Table 4.4).
4.5 Application cases
Based on the analyses in the previous sections of this chapter, the most promising tech-
nologies are to be identified. This is executed for the exemplary vessels on their typical
routes. As some options could be excluded right-away, for example because the type of
storage, might be incompatible with the situation onboard the specific ship, first an anal-
ysis of the boundary conditions is carried out in section 4.5.1. In sections 4.5.2 to 4.5.5
the technology applications are evaluated systematically. To do so, the requirements of
each type of vessel are contrasted to the features of the technologies in matrix form
resulting in the suggested technology selection in section 4.5.6.
4.5.1 Boundary conditions
In this section the storage sizes for the exemplary ships running on the exemplary routes
as well as the corresponding fueling times are calculated.
For the type of ships defined in chapter 2 typical routes and operating profiles are iden-
tified. For the defined ships and routes, the hydrogen consumption is calculated for the
case of energy conversion in an internal combustion engine at a constant efficiency of
42 %. Since the system efficiency of fuel cells is in a comparable range, the results also
represent the tank size when applying this way of energy conversion. The biggest source
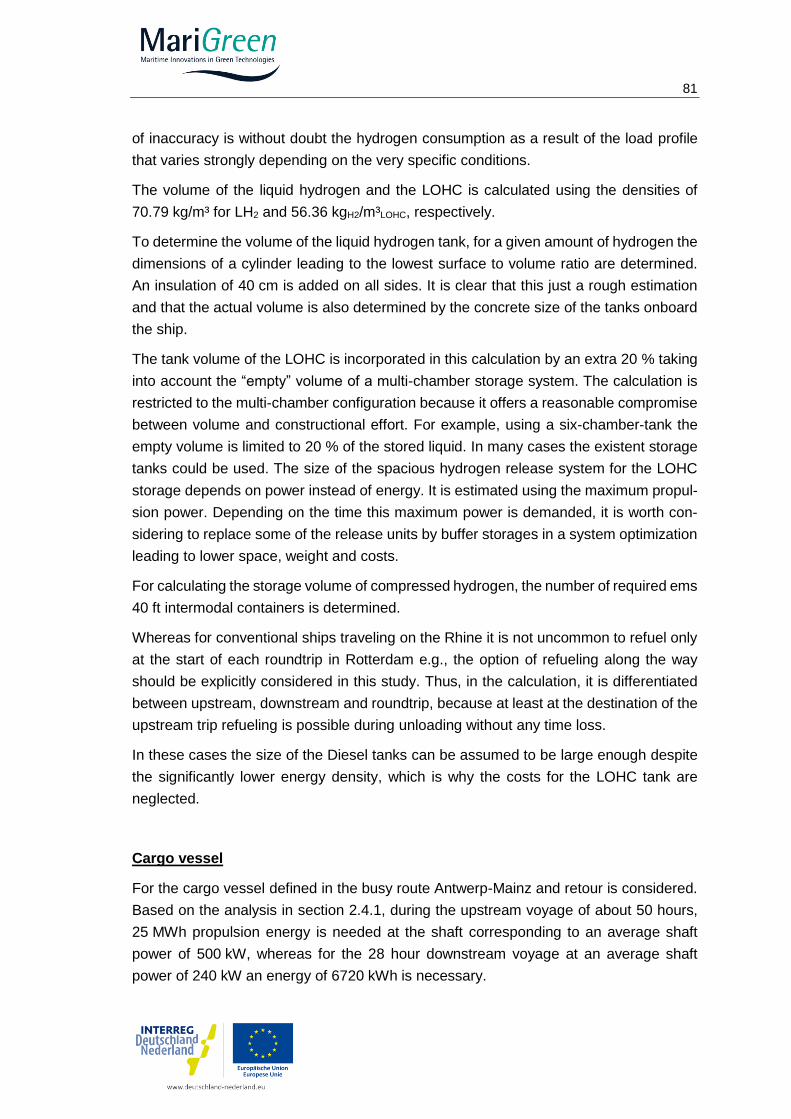
81
of inaccuracy is without doubt the hydrogen consumption as a result of the load profile
that varies strongly depending on the very specific conditions.
The volume of the liquid hydrogen and the LOHC is calculated using the densities of
70.79 kg/m³ for LH2 and 56.36 kgH2/m³LOHC, respectively.
To determine the volume of the liquid hydrogen tank, for a given amount of hydrogen the
dimensions of a cylinder leading to the lowest surface to volume ratio are determined.
An insulation of 40 cm is added on all sides. It is clear that this just a rough estimation
and that the actual volume is also determined by the concrete size of the tanks onboard
the ship.
The tank volume of the LOHC is incorporated in this calculation by an extra 20 % taking
into account the “empty” volume of a multi-chamber storage system. The calculation is
restricted to the multi-chamber configuration because it offers a reasonable compromise
between volume and constructional effort. For example, using a six-chamber-tank the
empty volume is limited to 20 % of the stored liquid. In many cases the existent storage
tanks could be used. The size of the spacious hydrogen release system for the LOHC
storage depends on power instead of energy. It is estimated using the maximum propul-
sion power. Depending on the time this maximum power is demanded, it is worth con-
sidering to replace some of the release units by buffer storages in a system optimization
leading to lower space, weight and costs.
For calculating the storage volume of compressed hydrogen, the number of required ems
40 ft intermodal containers is determined.
Whereas for conventional ships traveling on the Rhine it is not uncommon to refuel only
at the start of each roundtrip in Rotterdam e.g., the option of refueling along the way
should be explicitly considered in this study. Thus, in the calculation, it is differentiated
between upstream, downstream and roundtrip, because at least at the destination of the
upstream trip refueling is possible during unloading without any time loss.
In these cases the size of the Diesel tanks can be assumed to be large enough despite
the significantly lower energy density, which is why the costs for the LOHC tank are
neglected.
Cargo vessel
For the cargo vessel defined in the busy route Antwerp-Mainz and retour is considered.
Based on the analysis in section 2.4.1, during the upstream voyage of about 50 hours,
25 MWh propulsion energy is needed at the shaft corresponding to an average shaft
power of 500 kW, whereas for the 28 hour downstream voyage at an average shaft
power of 240 kW an energy of 6720 kWh is necessary.
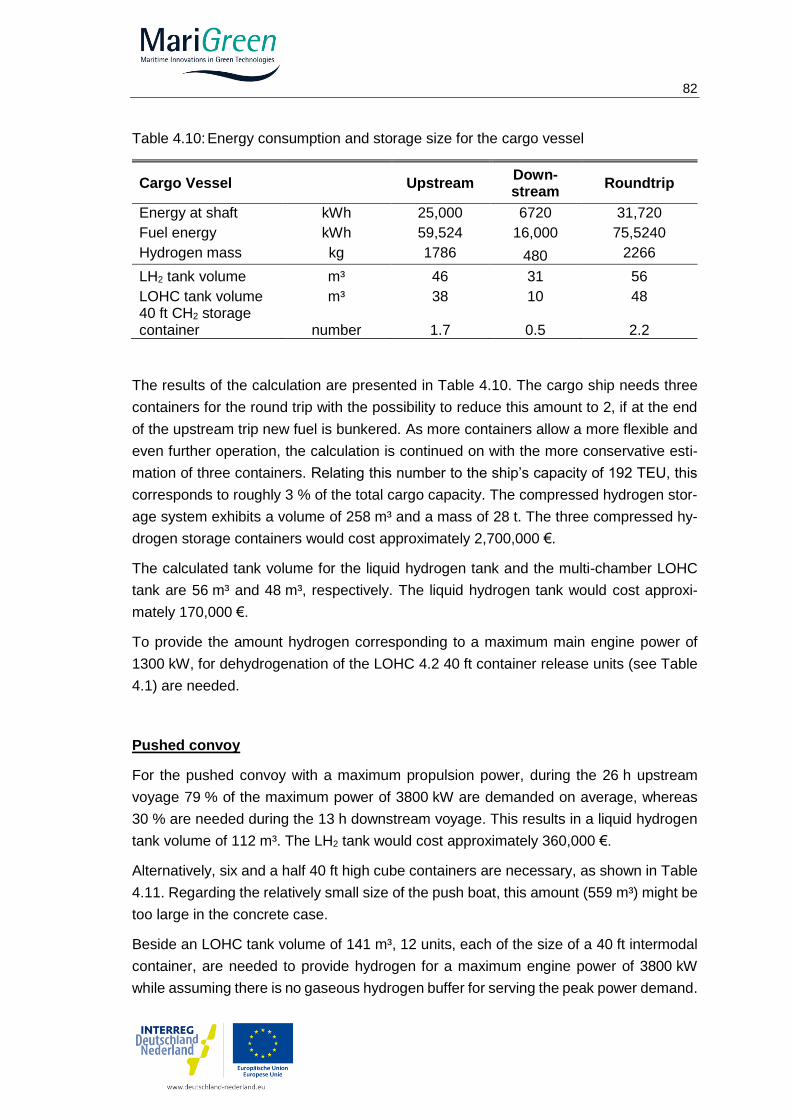
82
Table 4.10: Energy consumption and storage size for the cargo vessel
Cargo Vessel Upstream Down-stream
Roundtrip
Energy at shaft kWh 25,000 6720 31,720
Fuel energy kWh 59,524 16,000 75,5240
Hydrogen mass kg 1786 480 2266
LH2 tank volume m³ 46 31 56
LOHC tank volume m³ 38 10 48 40 ft CH2 storage container number 1.7 0.5 2.2
The results of the calculation are presented in Table 4.10. The cargo ship needs three
containers for the round trip with the possibility to reduce this amount to 2, if at the end
of the upstream trip new fuel is bunkered. As more containers allow a more flexible and
even further operation, the calculation is continued on with the more conservative esti-
mation of three containers. Relating this number to the ship’s capacity of 192 TEU, this
corresponds to roughly 3 % of the total cargo capacity. The compressed hydrogen stor-
age system exhibits a volume of 258 m³ and a mass of 28 t. The three compressed hy-
drogen storage containers would cost approximately 2,700,000 €.
The calculated tank volume for the liquid hydrogen tank and the multi-chamber LOHC
tank are 56 m³ and 48 m³, respectively. The liquid hydrogen tank would cost approxi-
mately 170,000 €.
To provide the amount hydrogen corresponding to a maximum main engine power of
1300 kW, for dehydrogenation of the LOHC 4.2 40 ft container release units (see Table
4.1) are needed.
Pushed convoy
For the pushed convoy with a maximum propulsion power, during the 26 h upstream
voyage 79 % of the maximum power of 3800 kW are demanded on average, whereas
30 % are needed during the 13 h downstream voyage. This results in a liquid hydrogen
tank volume of 112 m³. The LH2 tank would cost approximately 360,000 €.
Alternatively, six and a half 40 ft high cube containers are necessary, as shown in Table
4.11. Regarding the relatively small size of the push boat, this amount (559 m³) might be
too large in the concrete case.
Beside an LOHC tank volume of 141 m³, 12 units, each of the size of a 40 ft intermodal
container, are needed to provide hydrogen for a maximum engine power of 3800 kW
while assuming there is no gaseous hydrogen buffer for serving the peak power demand.
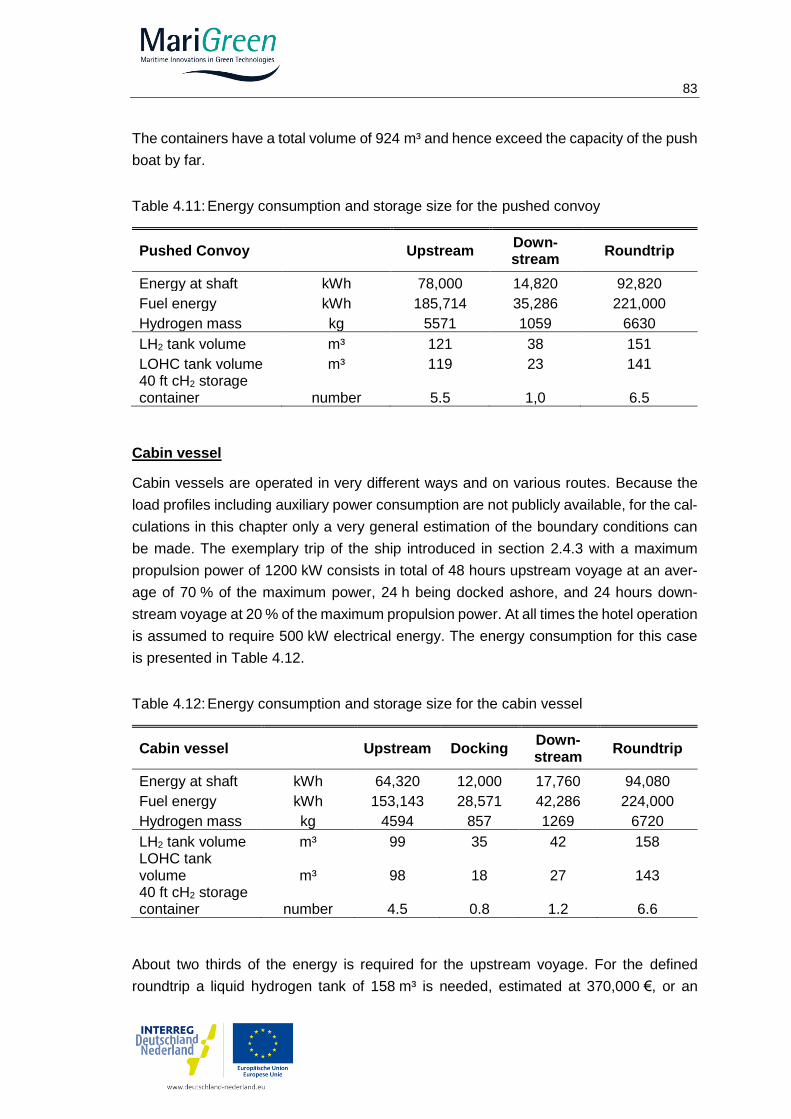
83
The containers have a total volume of 924 m³ and hence exceed the capacity of the push
boat by far.
Table 4.11: Energy consumption and storage size for the pushed convoy
Pushed Convoy Upstream Down-stream
Roundtrip
Energy at shaft kWh 78,000 14,820 92,820
Fuel energy kWh 185,714 35,286 221,000
Hydrogen mass kg 5571 1059 6630
LH2 tank volume m³ 121 38 151
LOHC tank volume m³ 119 23 141 40 ft cH2 storage container number 5.5 1,0 6.5
Cabin vessel
Cabin vessels are operated in very different ways and on various routes. Because the
load profiles including auxiliary power consumption are not publicly available, for the cal-
culations in this chapter only a very general estimation of the boundary conditions can
be made. The exemplary trip of the ship introduced in section 2.4.3 with a maximum
propulsion power of 1200 kW consists in total of 48 hours upstream voyage at an aver-
age of 70 % of the maximum power, 24 h being docked ashore, and 24 hours down-
stream voyage at 20 % of the maximum propulsion power. At all times the hotel operation
is assumed to require 500 kW electrical energy. The energy consumption for this case
is presented in Table 4.12.
Table 4.12: Energy consumption and storage size for the cabin vessel
Cabin vessel Upstream Docking Down-stream
Roundtrip
Energy at shaft kWh 64,320 12,000 17,760 94,080
Fuel energy kWh 153,143 28,571 42,286 224,000
Hydrogen mass kg 4594 857 1269 6720
LH2 tank volume m³ 99 35 42 158 LOHC tank volume m³ 98 18 27 143 40 ft cH2 storage container number 4.5 0.8 1.2 6.6
About two thirds of the energy is required for the upstream voyage. For the defined
roundtrip a liquid hydrogen tank of 158 m³ is needed, estimated at 370,000 €, or an
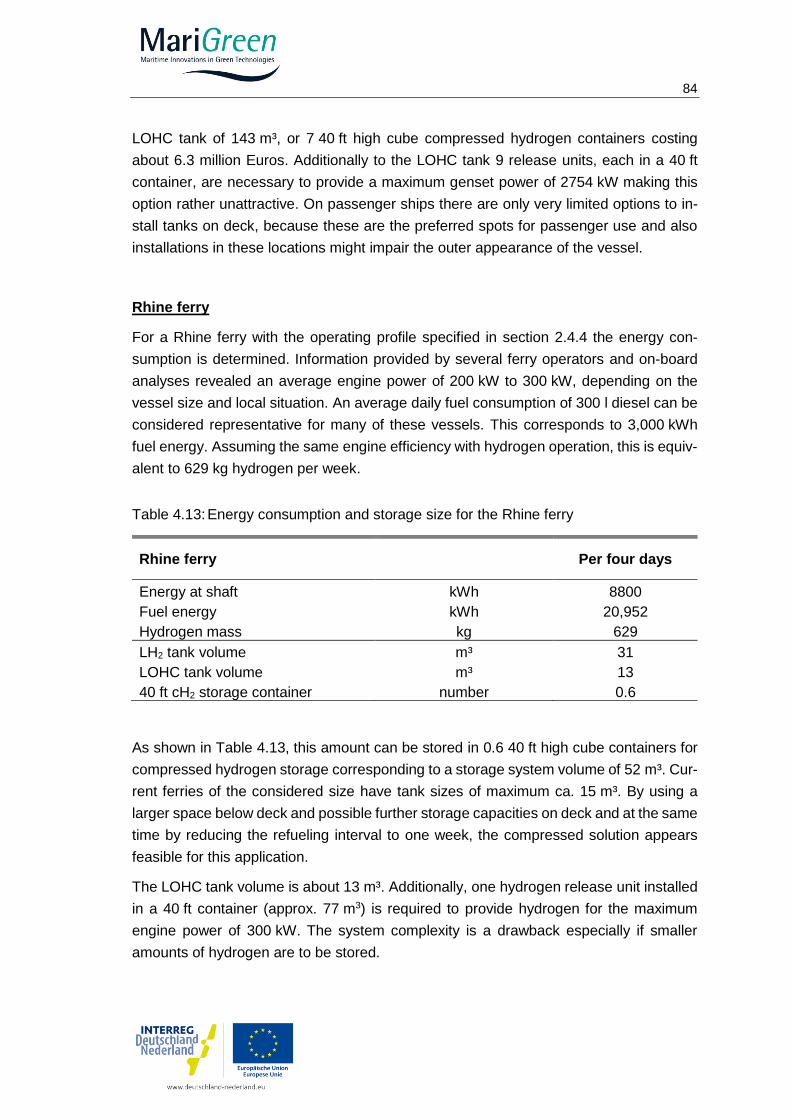
84
LOHC tank of 143 m³, or 7 40 ft high cube compressed hydrogen containers costing
about 6.3 million Euros. Additionally to the LOHC tank 9 release units, each in a 40 ft
container, are necessary to provide a maximum genset power of 2754 kW making this
option rather unattractive. On passenger ships there are only very limited options to in-
stall tanks on deck, because these are the preferred spots for passenger use and also
installations in these locations might impair the outer appearance of the vessel.
Rhine ferry
For a Rhine ferry with the operating profile specified in section 2.4.4 the energy con-
sumption is determined. Information provided by several ferry operators and on-board
analyses revealed an average engine power of 200 kW to 300 kW, depending on the
vessel size and local situation. An average daily fuel consumption of 300 l diesel can be
considered representative for many of these vessels. This corresponds to 3,000 kWh
fuel energy. Assuming the same engine efficiency with hydrogen operation, this is equiv-
alent to 629 kg hydrogen per week.
Table 4.13: Energy consumption and storage size for the Rhine ferry
Rhine ferry Per four days
Energy at shaft kWh 8800
Fuel energy kWh 20,952
Hydrogen mass kg 629
LH2 tank volume m³ 31
LOHC tank volume m³ 13
40 ft cH2 storage container number 0.6
As shown in Table 4.13, this amount can be stored in 0.6 40 ft high cube containers for
compressed hydrogen storage corresponding to a storage system volume of 52 m³. Cur-
rent ferries of the considered size have tank sizes of maximum ca. 15 m³. By using a
larger space below deck and possible further storage capacities on deck and at the same
time by reducing the refueling interval to one week, the compressed solution appears
feasible for this application.
The LOHC tank volume is about 13 m³. Additionally, one hydrogen release unit installed
in a 40 ft container (approx. 77 m3) is required to provide hydrogen for the maximum
engine power of 300 kW. The system complexity is a drawback especially if smaller
amounts of hydrogen are to be stored.
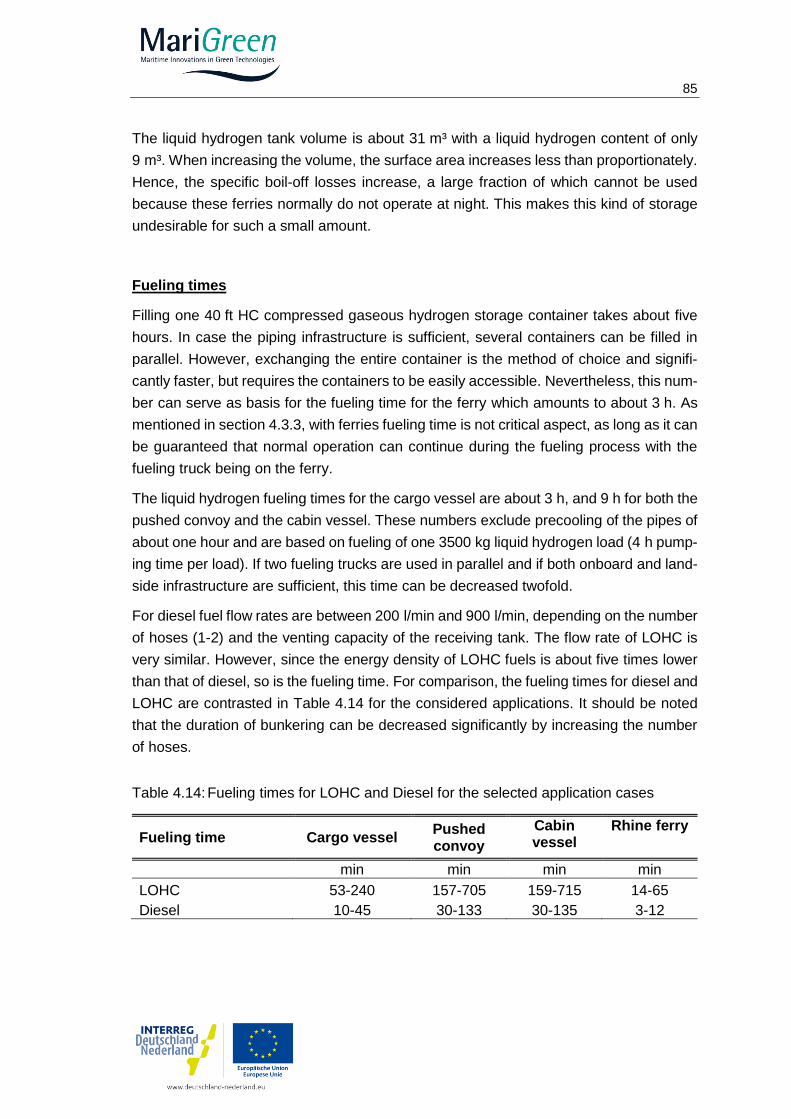
85
The liquid hydrogen tank volume is about 31 m³ with a liquid hydrogen content of only
9 m³. When increasing the volume, the surface area increases less than proportionately.
Hence, the specific boil-off losses increase, a large fraction of which cannot be used
because these ferries normally do not operate at night. This makes this kind of storage
undesirable for such a small amount.
Fueling times
Filling one 40 ft HC compressed gaseous hydrogen storage container takes about five
hours. In case the piping infrastructure is sufficient, several containers can be filled in
parallel. However, exchanging the entire container is the method of choice and signifi-
cantly faster, but requires the containers to be easily accessible. Nevertheless, this num-
ber can serve as basis for the fueling time for the ferry which amounts to about 3 h. As
mentioned in section 4.3.3, with ferries fueling time is not critical aspect, as long as it can
be guaranteed that normal operation can continue during the fueling process with the
fueling truck being on the ferry.
The liquid hydrogen fueling times for the cargo vessel are about 3 h, and 9 h for both the
pushed convoy and the cabin vessel. These numbers exclude precooling of the pipes of
about one hour and are based on fueling of one 3500 kg liquid hydrogen load (4 h pump-
ing time per load). If two fueling trucks are used in parallel and if both onboard and land-
side infrastructure are sufficient, this time can be decreased twofold.
For diesel fuel flow rates are between 200 l/min and 900 l/min, depending on the number
of hoses (1-2) and the venting capacity of the receiving tank. The flow rate of LOHC is
very similar. However, since the energy density of LOHC fuels is about five times lower
than that of diesel, so is the fueling time. For comparison, the fueling times for diesel and
LOHC are contrasted in Table 4.14 for the considered applications. It should be noted
that the duration of bunkering can be decreased significantly by increasing the number
of hoses.
Table 4.14: Fueling times for LOHC and Diesel for the selected application cases
Fueling time Cargo vessel Pushed convoy
Cabin vessel
Rhine ferry
min min min min
LOHC 53-240 157-705 159-715 14-65
Diesel 10-45 30-133 30-135 3-12
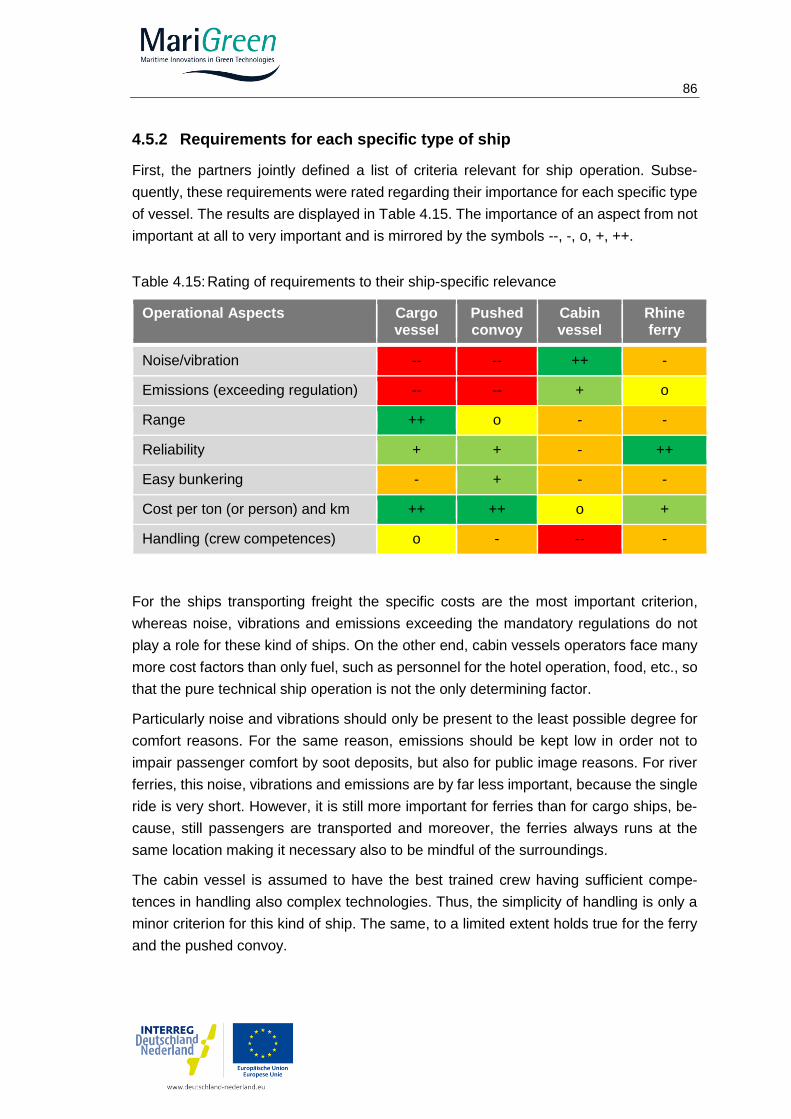
86
4.5.2 Requirements for each specific type of ship
First, the partners jointly defined a list of criteria relevant for ship operation. Subse-
quently, these requirements were rated regarding their importance for each specific type
of vessel. The results are displayed in Table 4.15. The importance of an aspect from not
important at all to very important and is mirrored by the symbols --, -, o, +, ++.
Table 4.15: Rating of requirements to their ship-specific relevance
For the ships transporting freight the specific costs are the most important criterion,
whereas noise, vibrations and emissions exceeding the mandatory regulations do not
play a role for these kind of ships. On the other end, cabin vessels operators face many
more cost factors than only fuel, such as personnel for the hotel operation, food, etc., so
that the pure technical ship operation is not the only determining factor.
Particularly noise and vibrations should only be present to the least possible degree for
comfort reasons. For the same reason, emissions should be kept low in order not to
impair passenger comfort by soot deposits, but also for public image reasons. For river
ferries, this noise, vibrations and emissions are by far less important, because the single
ride is very short. However, it is still more important for ferries than for cargo ships, be-
cause, still passengers are transported and moreover, the ferries always runs at the
same location making it necessary also to be mindful of the surroundings.
The cabin vessel is assumed to have the best trained crew having sufficient compe-
tences in handling also complex technologies. Thus, the simplicity of handling is only a
minor criterion for this kind of ship. The same, to a limited extent holds true for the ferry
and the pushed convoy.
Operational Aspects Cargo vessel
Pushed convoy
Cabin vessel
Rhine ferry
Noise/vibration -- -- ++ -
Emissions (exceeding regulation) -- -- + o
Range ++ o - -
Reliability + + - ++
Easy bunkering - + - -
Cost per ton (or person) and km ++ ++ o +
Handling (crew competences) o - -- -
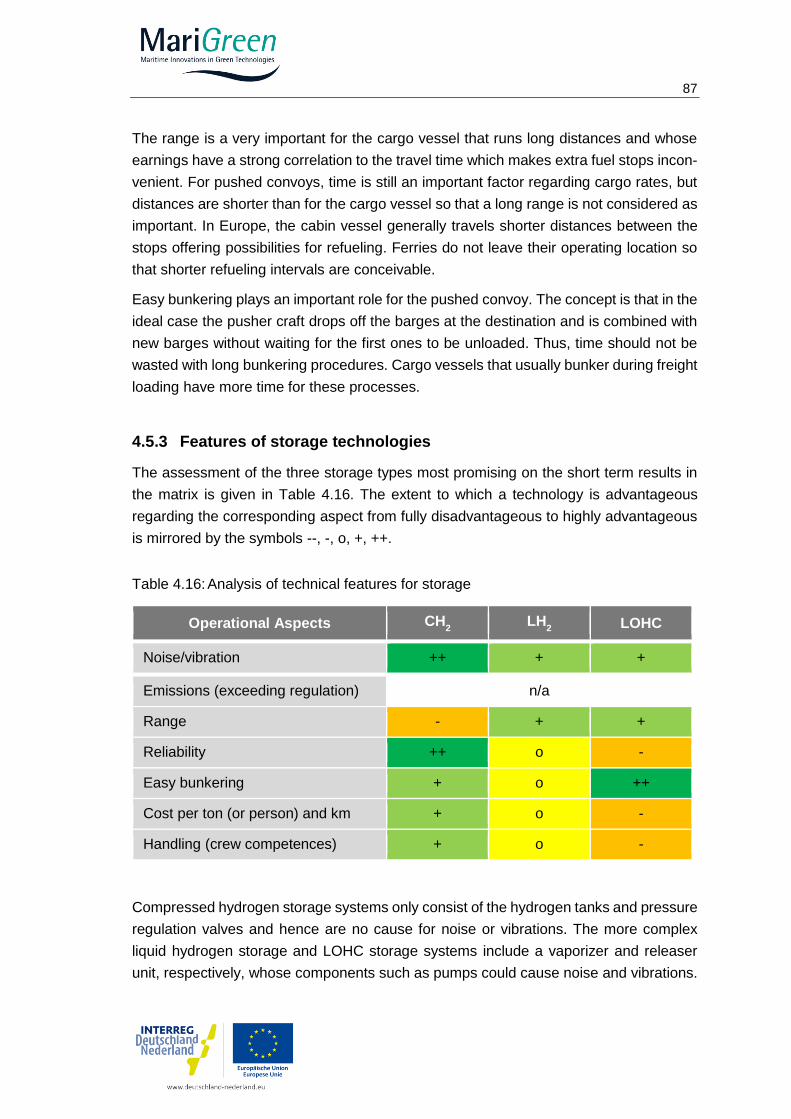
87
The range is a very important for the cargo vessel that runs long distances and whose
earnings have a strong correlation to the travel time which makes extra fuel stops incon-
venient. For pushed convoys, time is still an important factor regarding cargo rates, but
distances are shorter than for the cargo vessel so that a long range is not considered as
important. In Europe, the cabin vessel generally travels shorter distances between the
stops offering possibilities for refueling. Ferries do not leave their operating location so
that shorter refueling intervals are conceivable.
Easy bunkering plays an important role for the pushed convoy. The concept is that in the
ideal case the pusher craft drops off the barges at the destination and is combined with
new barges without waiting for the first ones to be unloaded. Thus, time should not be
wasted with long bunkering procedures. Cargo vessels that usually bunker during freight
loading have more time for these processes.
4.5.3 Features of storage technologies
The assessment of the three storage types most promising on the short term results in
the matrix is given in Table 4.16. The extent to which a technology is advantageous
regarding the corresponding aspect from fully disadvantageous to highly advantageous
is mirrored by the symbols --, -, o, +, ++.
Table 4.16: Analysis of technical features for storage
Operational Aspects CH2 LH
2 LOHC
Noise/vibration ++ + +
Emissions (exceeding regulation) n/a
Range - + +
Reliability ++ o -
Easy bunkering + o ++
Cost per ton (or person) and km + o -
Handling (crew competences) + o -
Compressed hydrogen storage systems only consist of the hydrogen tanks and pressure
regulation valves and hence are no cause for noise or vibrations. The more complex
liquid hydrogen storage and LOHC storage systems include a vaporizer and releaser
unit, respectively, whose components such as pumps could cause noise and vibrations.
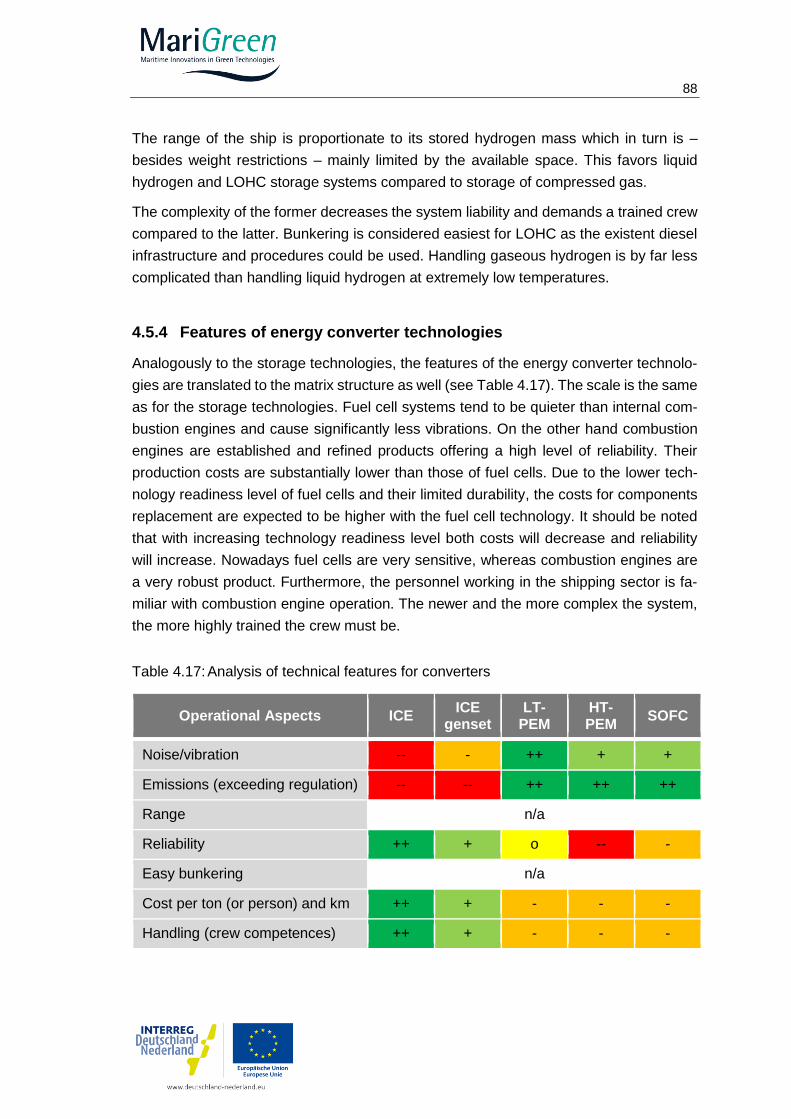
88
The range of the ship is proportionate to its stored hydrogen mass which in turn is –
besides weight restrictions – mainly limited by the available space. This favors liquid
hydrogen and LOHC storage systems compared to storage of compressed gas.
The complexity of the former decreases the system liability and demands a trained crew
compared to the latter. Bunkering is considered easiest for LOHC as the existent diesel
infrastructure and procedures could be used. Handling gaseous hydrogen is by far less
complicated than handling liquid hydrogen at extremely low temperatures.
4.5.4 Features of energy converter technologies
Analogously to the storage technologies, the features of the energy converter technolo-
gies are translated to the matrix structure as well (see Table 4.17). The scale is the same
as for the storage technologies. Fuel cell systems tend to be quieter than internal com-
bustion engines and cause significantly less vibrations. On the other hand combustion
engines are established and refined products offering a high level of reliability. Their
production costs are substantially lower than those of fuel cells. Due to the lower tech-
nology readiness level of fuel cells and their limited durability, the costs for components
replacement are expected to be higher with the fuel cell technology. It should be noted
that with increasing technology readiness level both costs will decrease and reliability
will increase. Nowadays fuel cells are very sensitive, whereas combustion engines are
a very robust product. Furthermore, the personnel working in the shipping sector is fa-
miliar with combustion engine operation. The newer and the more complex the system,
the more highly trained the crew must be.
Table 4.17: Analysis of technical features for converters
Operational Aspects ICE ICE genset
LT-PEM
HT-PEM SOFC
Noise/vibration -- - ++ + +
Emissions (exceeding regulation) -- -- ++ ++ ++
Range n/a
Reliability ++ + o -- -
Easy bunkering n/a
Cost per ton (or person) and km ++ + - - -
Handling (crew competences) ++ + - - -
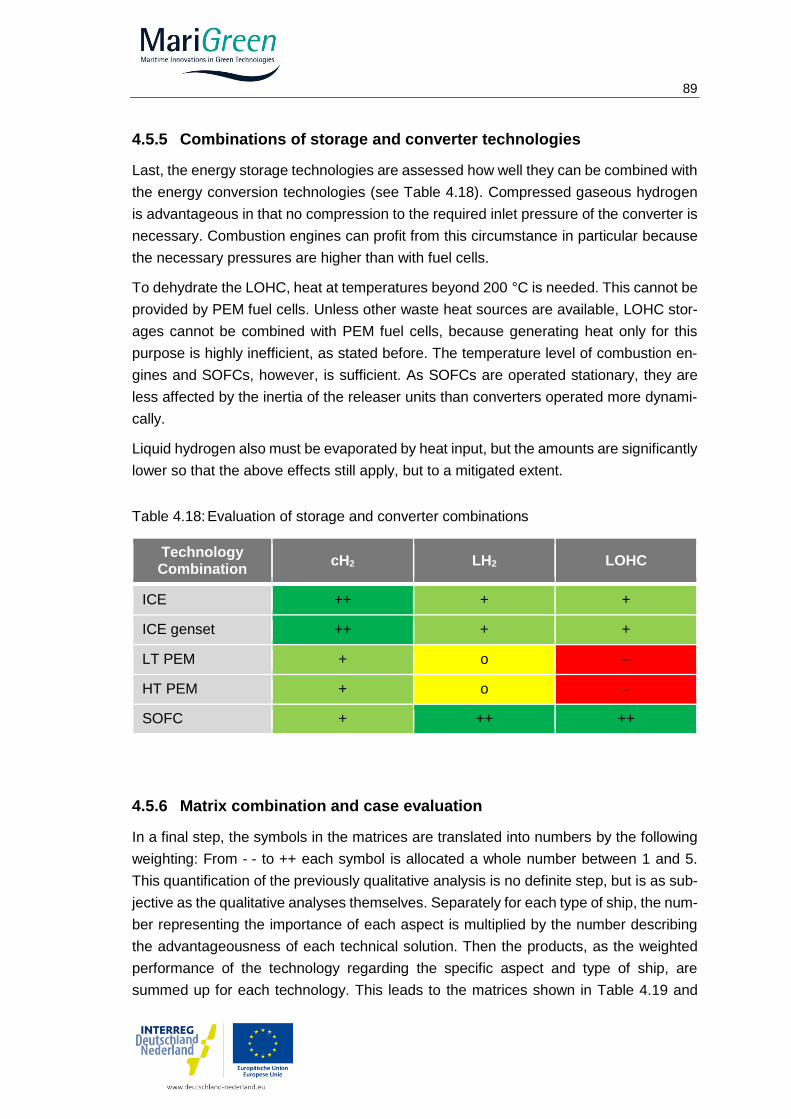
89
4.5.5 Combinations of storage and converter technologies
Last, the energy storage technologies are assessed how well they can be combined with
the energy conversion technologies (see Table 4.18). Compressed gaseous hydrogen
is advantageous in that no compression to the required inlet pressure of the converter is
necessary. Combustion engines can profit from this circumstance in particular because
the necessary pressures are higher than with fuel cells.
To dehydrate the LOHC, heat at temperatures beyond 200 °C is needed. This cannot be
provided by PEM fuel cells. Unless other waste heat sources are available, LOHC stor-
ages cannot be combined with PEM fuel cells, because generating heat only for this
purpose is highly inefficient, as stated before. The temperature level of combustion en-
gines and SOFCs, however, is sufficient. As SOFCs are operated stationary, they are
less affected by the inertia of the releaser units than converters operated more dynami-
cally.
Liquid hydrogen also must be evaporated by heat input, but the amounts are significantly
lower so that the above effects still apply, but to a mitigated extent.
Table 4.18: Evaluation of storage and converter combinations
Technology Combination
cH2 LH2 LOHC
ICE ++ + +
ICE genset ++ + +
LT PEM + o --
HT PEM + o --
SOFC + ++ ++
4.5.6 Matrix combination and case evaluation
In a final step, the symbols in the matrices are translated into numbers by the following
weighting: From - - to ++ each symbol is allocated a whole number between 1 and 5.
This quantification of the previously qualitative analysis is no definite step, but is as sub-
jective as the qualitative analyses themselves. Separately for each type of ship, the num-
ber representing the importance of each aspect is multiplied by the number describing
the advantageousness of each technical solution. Then the products, as the weighted
performance of the technology regarding the specific aspect and type of ship, are
summed up for each technology. This leads to the matrices shown in Table 4.19 and
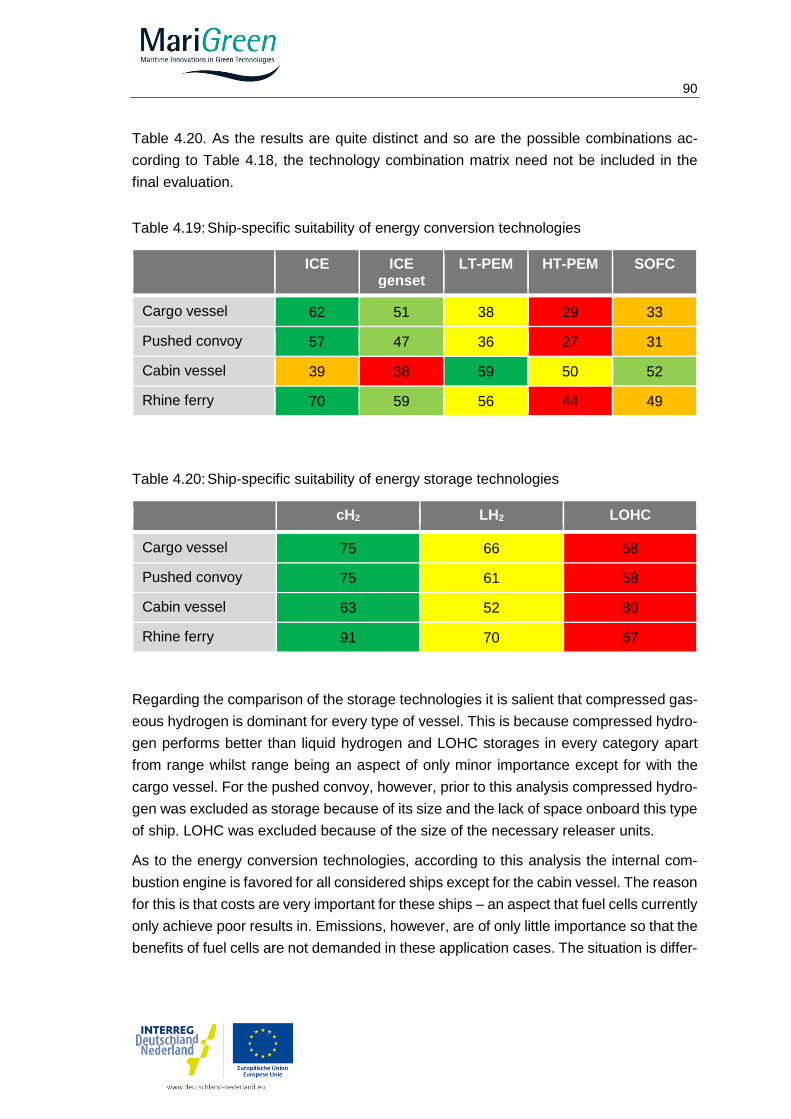
90
Table 4.20. As the results are quite distinct and so are the possible combinations ac-
cording to Table 4.18, the technology combination matrix need not be included in the
final evaluation.
Table 4.19: Ship-specific suitability of energy conversion technologies
ICE ICE
genset LT-PEM HT-PEM SOFC
Cargo vessel 62 51 38 29 33
Pushed convoy 57 47 36 27 31
Cabin vessel 39 38 59 50 52
Rhine ferry 70 59 56 44 49
Table 4.20: Ship-specific suitability of energy storage technologies
cH2 LH2 LOHC
Cargo vessel 75 66 58
Pushed convoy 75 61 58
Cabin vessel 63 52 80
Rhine ferry 91 70 67
Regarding the comparison of the storage technologies it is salient that compressed gas-
eous hydrogen is dominant for every type of vessel. This is because compressed hydro-
gen performs better than liquid hydrogen and LOHC storages in every category apart
from range whilst range being an aspect of only minor importance except for with the
cargo vessel. For the pushed convoy, however, prior to this analysis compressed hydro-
gen was excluded as storage because of its size and the lack of space onboard this type
of ship. LOHC was excluded because of the size of the necessary releaser units.
As to the energy conversion technologies, according to this analysis the internal com-
bustion engine is favored for all considered ships except for the cabin vessel. The reason
for this is that costs are very important for these ships – an aspect that fuel cells currently
only achieve poor results in. Emissions, however, are of only little importance so that the
benefits of fuel cells are not demanded in these application cases. The situation is differ-
91
ent for the cabin vessel whose requirements are contrary: whereas costs are not as im-
portant, the absence of noise and emissions is crucial. This analysis outputs the LT-PEM
fuel cell as the most favorable energy converter.
Though, it must be pointed out that these results are closely related to the chosen
weighting. For a different weighting the results might not be the same. Moreover, this
analysis is based on the current situation. If requirements shift, for instance based on
tightened regulatory noise or emission limits, different technologies will be favored. This
is also the case for a change in technical features. The further technological development
of the fuel cell technology and the transition from manual assembly to larger scale au-
tomatized production will lead to an increase in reliability, durability and a cost reduction.
Consistent with the matrix analysis and preceding exclusions, the direct drive internal
combustion engine in combination with a liquid hydrogen storage is the most favorable
solution for the pushed convoy.
Nevertheless, beside the recommendations of the matrix analysis also other configura-
tions are worth considering. For the cargo vessel a compressed hydrogen storage and
an internal combustion engine genset and electric propulsion motor combination is prom-
ising. In contrast to the rather steady load profile of a pushed convoy, it varies for the
exemplary cargo vessel that runs on major as well as tributary rivers and canals so that
the full potential of running the combustion engines in the optimal operation point inde-
pendent of the driving situation can be used.
The Rhine ferry could be equipped with a compressed hydrogen storage and an LT-PEM
fuel cell that harmonizes well with the often prevalent part load operation of the ferry.
Last, the cabin vessel could be operated with an SOFC and a liquid hydrogen storage.
The high auxiliary power consumption allows for less dynamic operation of the system
so that one major disadvantage of this technology can be compensated for. The waste
heat at high temperature can be used for dehydrogenation or vaporization and the hotel
operation.
It must be kept in mind that the presented results are valid under very specific boundary
conditions and that other configurations should be considered as well.
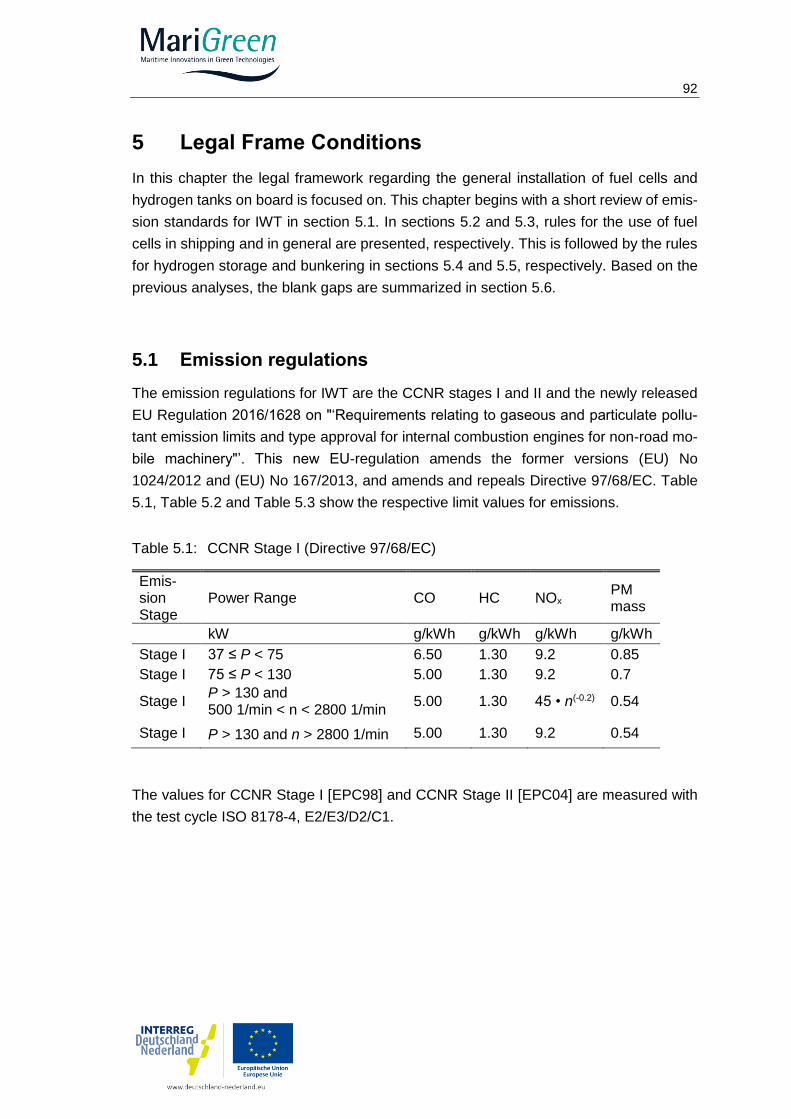
92
5 Legal Frame Conditions
In this chapter the legal framework regarding the general installation of fuel cells and
hydrogen tanks on board is focused on. This chapter begins with a short review of emis-
sion standards for IWT in section 5.1. In sections 5.2 and 5.3, rules for the use of fuel
cells in shipping and in general are presented, respectively. This is followed by the rules
for hydrogen storage and bunkering in sections 5.4 and 5.5, respectively. Based on the
previous analyses, the blank gaps are summarized in section 5.6.
5.1 Emission regulations
The emission regulations for IWT are the CCNR stages I and II and the newly released
EU Regulation 2016/1628 on "‘Requirements relating to gaseous and particulate pollu-
tant emission limits and type approval for internal combustion engines for non-road mo-
bile machinery"’. This new EU-regulation amends the former versions (EU) No
1024/2012 and (EU) No 167/2013, and amends and repeals Directive 97/68/EC. Table
5.1, Table 5.2 and Table 5.3 show the respective limit values for emissions.
Table 5.1: CCNR Stage I (Directive 97/68/EC)
Emis-sion Stage
Power Range CO HC NOx PM mass
kW g/kWh g/kWh g/kWh g/kWh
Stage I 37 ≤ P < 75 6.50 1.30 9.2 0.85
Stage I 75 ≤ P < 130 5.00 1.30 9.2 0.7
Stage I P > 130 and 500 1/min < n < 2800 1/min
5.00 1.30 45 • n(-0.2) 0.54
Stage I P > 130 and n > 2800 1/min 5.00 1.30 9.2 0.54
The values for CCNR Stage I [EPC98] and CCNR Stage II [EPC04] are measured with
the test cycle ISO 8178-4, E2/E3/D2/C1.
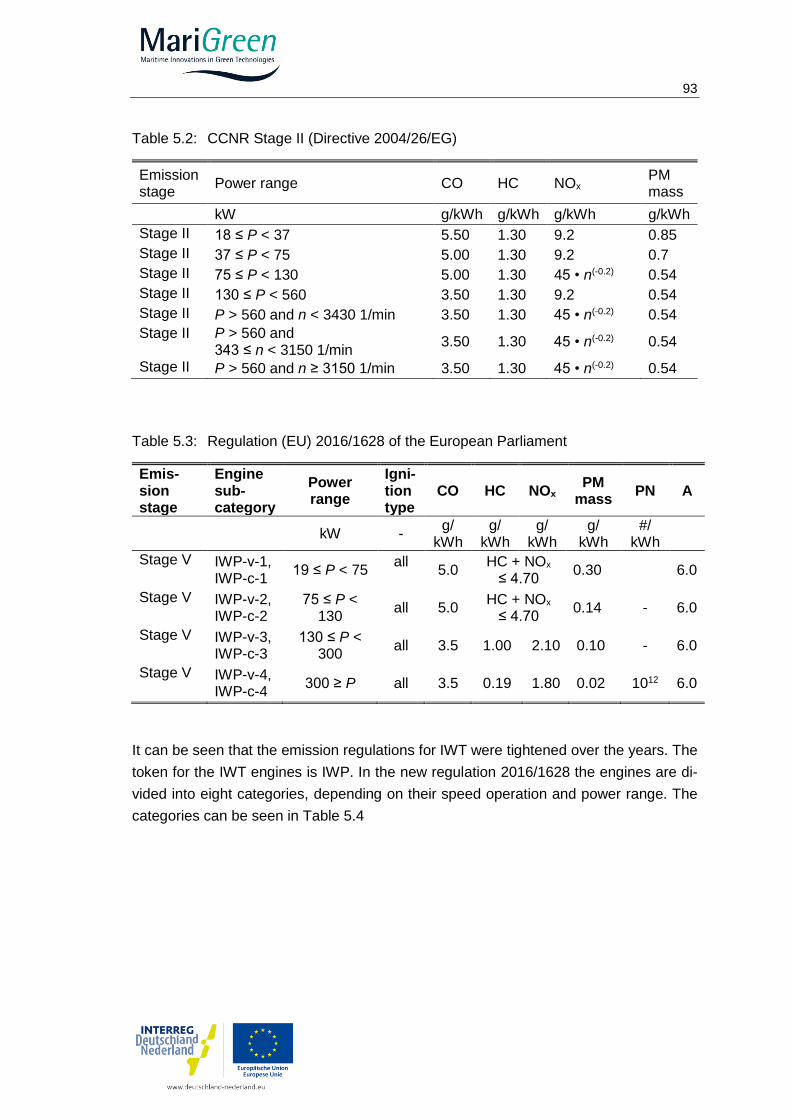
93
Table 5.2: CCNR Stage II (Directive 2004/26/EG)
Emission stage
Power range CO HC NOx PM mass
kW g/kWh g/kWh g/kWh g/kWh
Stage II 18 ≤ P < 37 5.50 1.30 9.2 0.85
Stage II 37 ≤ P < 75 5.00 1.30 9.2 0.7
Stage II 75 ≤ P < 130 5.00 1.30 45 • n(-0.2) 0.54
Stage II 130 ≤ P < 560 3.50 1.30 9.2 0.54
Stage II P > 560 and n < 3430 1/min 3.50 1.30 45 • n(-0.2) 0.54
Stage II P > 560 and 343 ≤ n < 3150 1/min
3.50 1.30 45 • n(-0.2) 0.54
Stage II P > 560 and n ≥ 3150 1/min 3.50 1.30 45 • n(-0.2) 0.54
Table 5.3: Regulation (EU) 2016/1628 of the European Parliament
Emis-sion stage
Engine sub- category
Power range
Igni-tion type
CO HC NOx PM
mass PN A
kW - g/
kWh g/
kWh g/
kWh g/
kWh #/
kWh
Stage V IWP-v-1, IWP-c-1
19 ≤ P < 75 all
5.0 HC + NOx
≤ 4.70 0.30 6.0
Stage V IWP-v-2, IWP-c-2
75 ≤ P < 130
all 5.0 HC + NOx
≤ 4.70 0.14 - 6.0
Stage V IWP-v-3, IWP-c-3
130 ≤ P < 300
all 3.5 1.00 2.10 0.10 - 6.0
Stage V IWP-v-4, IWP-c-4
300 ≥ P all 3.5 0.19 1.80 0.02 1012 6.0
It can be seen that the emission regulations for IWT were tightened over the years. The
token for the IWT engines is IWP. In the new regulation 2016/1628 the engines are di-
vided into eight categories, depending on their speed operation and power range. The
categories can be seen in Table 5.4
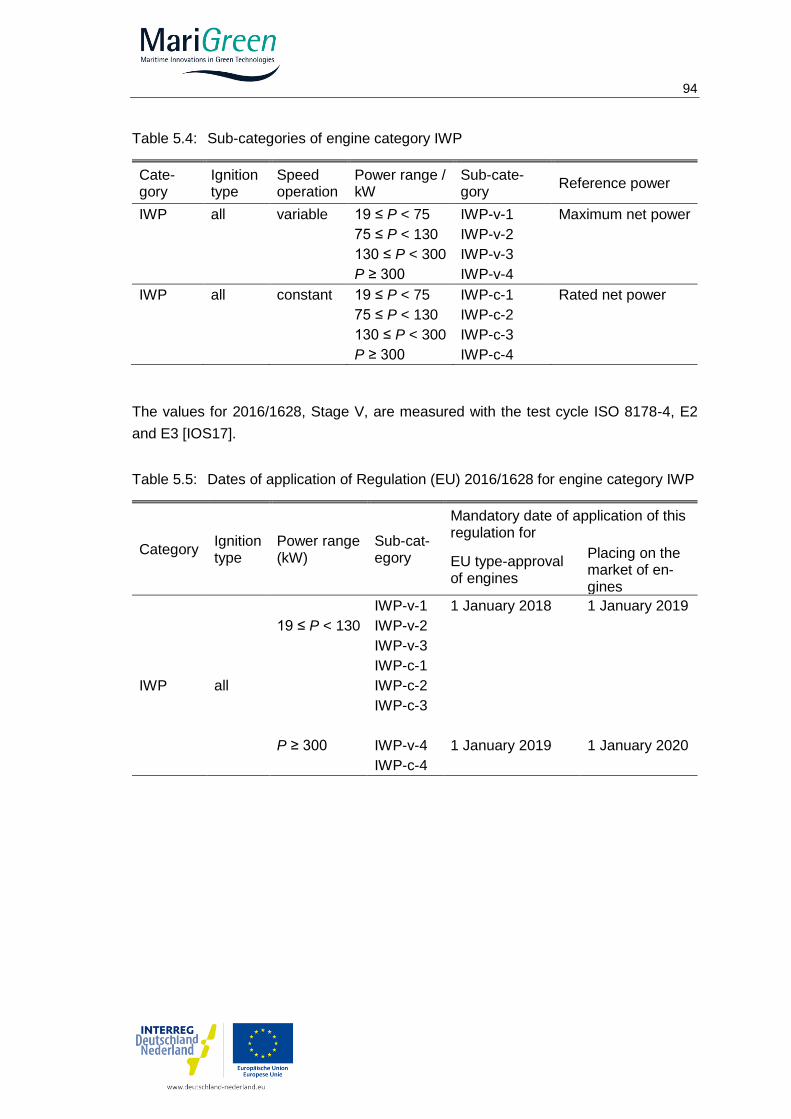
94
Table 5.4: Sub-categories of engine category IWP
Cate-gory
Ignition type
Speed operation
Power range / kW
Sub-cate-gory
Reference power
IWP all variable 19 ≤ P < 75 IWP-v-1 Maximum net power
75 ≤ P < 130 IWP-v-2
130 ≤ P < 300 IWP-v-3
P ≥ 300 IWP-v-4
IWP all constant 19 ≤ P < 75 IWP-c-1 Rated net power
75 ≤ P < 130 IWP-c-2
130 ≤ P < 300 IWP-c-3
P ≥ 300 IWP-c-4
The values for 2016/1628, Stage V, are measured with the test cycle ISO 8178-4, E2
and E3 [IOS17].
Table 5.5: Dates of application of Regulation (EU) 2016/1628 for engine category IWP
Category Ignition type
Power range (kW)
Sub-cat-egory
Mandatory date of application of this regulation for
EU type-approval of engines
Placing on the market of en-gines
IWP all
IWP-v-1 1 January 2018 1 January 2019
19 ≤ P < 130 IWP-v-2
IWP-v-3
IWP-c-1
IWP-c-2
IWP-c-3
P ≥ 300 IWP-v-4 1 January 2019 1 January 2020
IWP-c-4
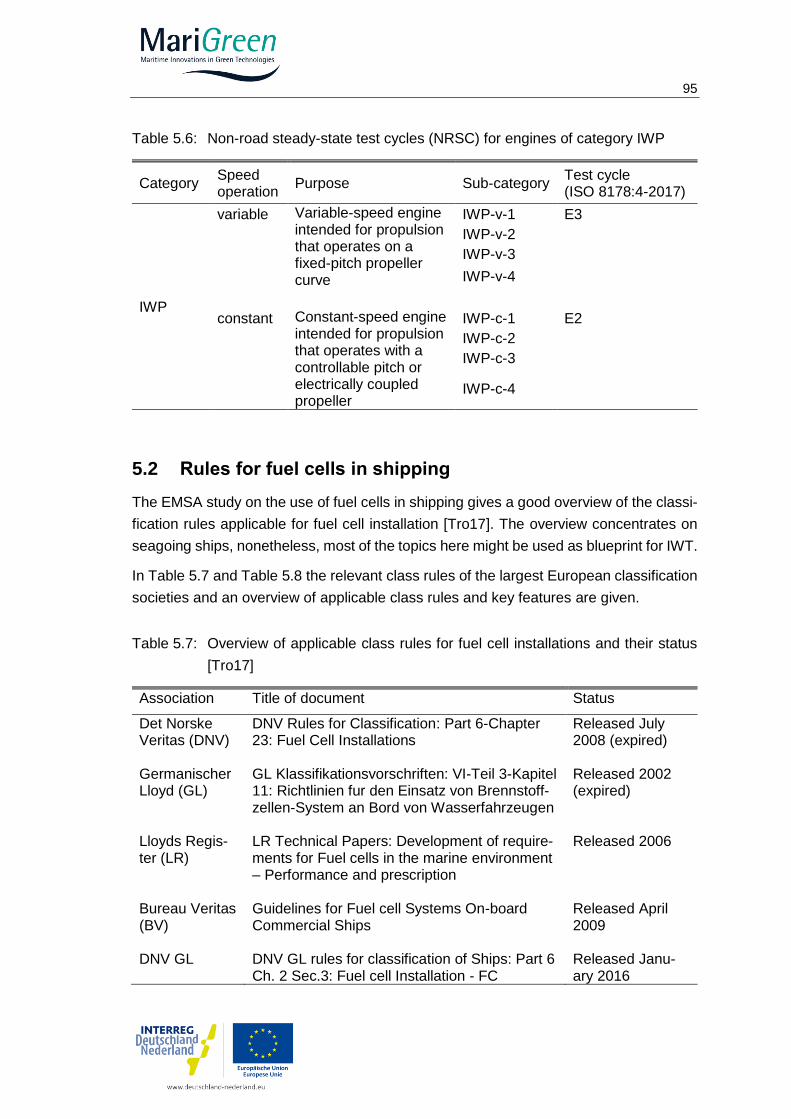
95
Table 5.6: Non-road steady-state test cycles (NRSC) for engines of category IWP
Category Speed operation
Purpose Sub-category Test cycle (ISO 8178:4-2017)
IWP
variable Variable-speed engine intended for propulsion that operates on a fixed-pitch propeller curve
IWP-v-1 E3
IWP-v-2
IWP-v-3
IWP-v-4
constant Constant-speed engine intended for propulsion that operates with a controllable pitch or electrically coupled propeller
IWP-c-1 E2
IWP-c-2
IWP-c-3
IWP-c-4
5.2 Rules for fuel cells in shipping
The EMSA study on the use of fuel cells in shipping gives a good overview of the classi-
fication rules applicable for fuel cell installation [Tro17]. The overview concentrates on
seagoing ships, nonetheless, most of the topics here might be used as blueprint for IWT.
In Table 5.7 and Table 5.8 the relevant class rules of the largest European classification
societies and an overview of applicable class rules and key features are given.
Table 5.7: Overview of applicable class rules for fuel cell installations and their status
[Tro17]
Association Title of document Status
Det Norske Veritas (DNV)
DNV Rules for Classification: Part 6-Chapter 23: Fuel Cell Installations
Released July 2008 (expired)
Germanischer Lloyd (GL)
GL Klassifikationsvorschriften: VI-Teil 3-Kapitel 11: Richtlinien fur den Einsatz von Brennstoff-zellen-System an Bord von Wasserfahrzeugen
Released 2002 (expired)
Lloyds Regis-ter (LR)
LR Technical Papers: Development of require-ments for Fuel cells in the marine environment – Performance and prescription
Released 2006
Bureau Veritas (BV)
Guidelines for Fuel cell Systems On-board Commercial Ships
Released April 2009
DNV GL DNV GL rules for classification of Ships: Part 6 Ch. 2 Sec.3: Fuel cell Installation - FC
Released Janu-ary 2016
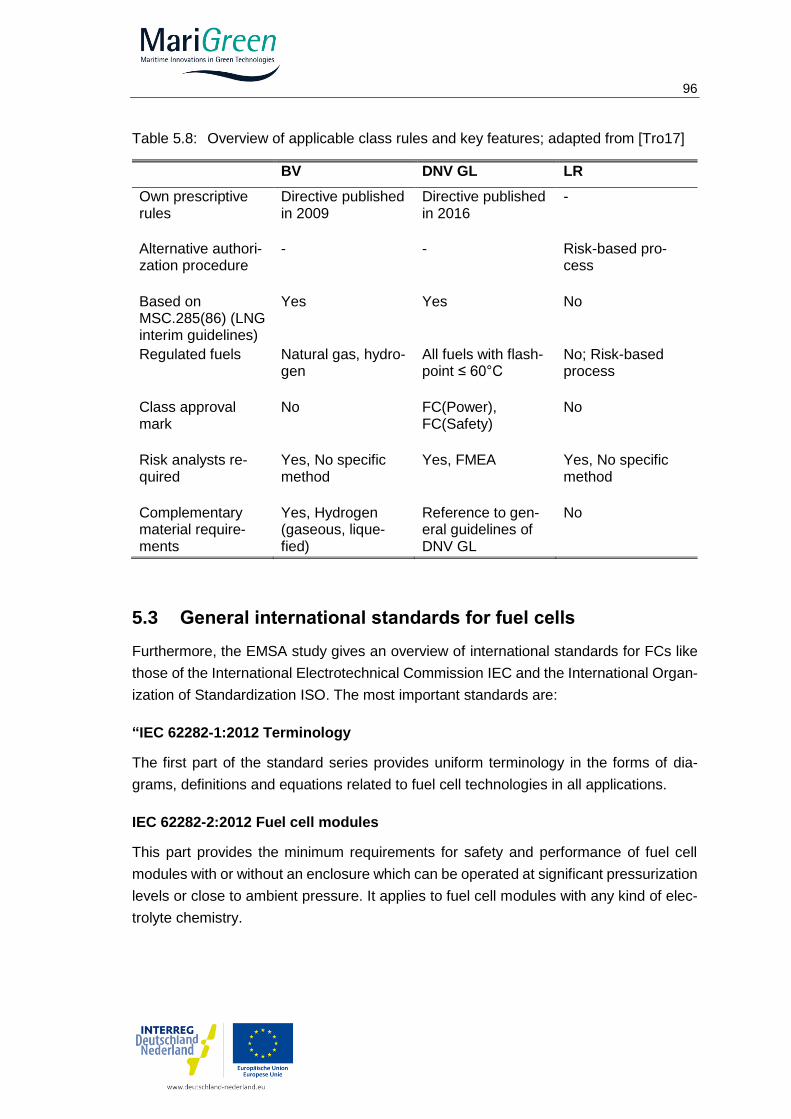
96
Table 5.8: Overview of applicable class rules and key features; adapted from [Tro17]
BV DNV GL LR
Own prescriptive rules
Directive published in 2009
Directive published in 2016
-
Alternative authori-zation procedure
- - Risk-based pro-cess
Based on MSC.285(86) (LNG interim guidelines)
Yes Yes No
Regulated fuels Natural gas, hydro-gen
All fuels with flash-point ≤ 60°C
No; Risk-based process
Class approval mark
No FC(Power), FC(Safety)
No
Risk analysts re-quired
Yes, No specific method
Yes, FMEA Yes, No specific method
Complementary material require-ments
Yes, Hydrogen (gaseous, lique-fied)
Reference to gen-eral guidelines of DNV GL
No
5.3 General international standards for fuel cells
Furthermore, the EMSA study gives an overview of international standards for FCs like
those of the International Electrotechnical Commission IEC and the International Organ-
ization of Standardization ISO. The most important standards are:
“IEC 62282-1:2012 Terminology
The first part of the standard series provides uniform terminology in the forms of dia-
grams, definitions and equations related to fuel cell technologies in all applications.
IEC 62282-2:2012 Fuel cell modules
This part provides the minimum requirements for safety and performance of fuel cell
modules with or without an enclosure which can be operated at significant pressurization
levels or close to ambient pressure. It applies to fuel cell modules with any kind of elec-
trolyte chemistry.
97
IEC 62282-3-100:2012 Stationary fuel cell power systems - Safety
This standard is applicable to stationary fuel cell power systems intended for indoor and
outdoor commercial, industrial and residential use in non-hazardous areas, with or with-
out the ability to recover useful heat. It applies to all kind of fuels like natural gas and
other methane rich gases, fuels from oil refining, liquids and hydrogen rich gaseous.
Although this part does not cover propulsion fuel cell power systems, it is applicable to
marine auxiliary power systems.
IEC 62282-3-200:2015 Stationary fuel cell power systems - Performance test meth-
ods
This part covers operational and environmental aspects of the stationary fuel cell power
systems performance for systems with an electrical output of over 10 kW (systems with
less than 10kW are dealt with IEC 62282-3-201).
IEC 62282-3-300:2012 Stationary fuel cell power systems - Installations
This part provides minimum safety requirements for the installation of indoor and outdoor
stationary fuel cell power systems in compliance with IEC 62282-3- 100.
IEC 62282-7-1:2010 Single cell test methods for polymer electrolyte fuel cell
(PEFC)
This Technical Specification describes standard single-cell test methods for polymer
electrolyte fuel cells (PEFCs). It provides consistent and repeatable methods to test the
performance of single cells and cell components, including membrane-electrode assem-
blies (MEAs) and flow plates. This Technical Specification is also available for fuel sup-
pliers to determine the maximum allowable impurities in fuels.
IEC 62282-7-2:2014 Single cell and stack performance tests for solid oxide fuel
cells (SOFC)
This standard describes test methods for a single cell and stack that is to be employed
in power generation systems using solid oxide fuel cells (SOFCs), but is not applicable
to small button cells that are designed for SOFC material testing and provide no practical
means of fuel utilization measurement. It is to be used for data exchanges in commercial
transactions between cell manufacturers and system developers.
ISO 14687-3:2014 Proton exchange membrane (PEM) fuel cell applications for sta-
tionary appliances
The purpose of this part is to establish an international standard of quality characteristics
of hydrogen fuel for stationary fuel cells.
98
ISO 16110-1:2007 Hydrogen generators using fuel processing technologies –
Safety
Part 1 of this standard applies to packaged, self-contained or factory matched hydrogen
generation systems with a capacity of less than 400 m³/h at 0 °C and 101.325 kPa, in-
tended for indoor and outdoor commercial, industrial, light industrial and residential use.
It applies to hydrogen generators using one or a combination of different fuels like natural
gas and other methane-rich gases, fuels derived from oil refining, fossil fuel sources (e.g.
methanol) and gaseous mixtures containing hydrogen gas. Hydrogen generators are re-
ferred to as devices that convert a fuel to a hydrogen-rich stream of composition and
conditions suitable for the type of device using the hydrogen. This device can be a fuel
cell power system, or a hydrogen compression, storage and delivery system. It aims to
cover all significant hazards, hazardous situations and events relevant to hydrogen gen-
erators, with the exception of those associated with environmental compatibility.
[…] Since 2008 fuel cells for maritime and other purposes in Germany have been certi-
fied according to DIN EN 62282-2 which is based on the IEC 62282-2 standard. Further-
more, the existing class guidelines for fuel cell installations on ships of the DNV GL and
of other classes contain references to the IEC standards and recommend test proce-
dures (manufacturer and sea trial) based on these standards. The IEC is currently work-
ing on the extension of 62282-3-400, to regulate small stationary fuel cell power system
with combined heat and power output and on 62282-8, to regulate Energy storage sys-
tems using fuel cell modules in reverse mode (coming into force 2019).” [Tro17]
5.4 Standards for hydrogen storage
The EMSA study also gives an overview of the standards for the storage of hydrogen
[Tro17]:
“ISOTR15916 Basis considerations for the safety of hydrogen systems
ISOTR15916 gives a very useful overview of safety relevant properties and related con-
siderations for hydrogen. Annex C gives a good and very relevant overview of low tem-
perature effects of hydrogen on materials, and the document also suggest suitable ma-
terial selection criteria including how to consider hydrogen embrittlement.
Compressed gas hydrogen storage
European standards covering pressure vessels used for pressures exceeding 0.5 bar
are harmonized with PED. EN 1252-1:1998 on storage tank materials, EN 1797:2001 on
gas/material compatibility, and EN 13648 part 1, 2, and 3 on safety devices for protection
against excessive pressure are some of the standards related to hydrogen storage.
99
ISO 15399 Gaseous Hydrogen - Cylinders and tubes for stationary storage.
This standard covers cylinders and tubes intended for the stationary storage of gaseous
hydrogen of up to a volume of 10 000 l and a pressure of 110 MPa, of seamless metallic
or composite construction. The EIGA code of practice IGC 15/06 covers storage of gas-
eous hydrogen. IGC 15/06 on gaseous hydrogen, compression, purification, and filling
into containers and storage installations at consumer site shall serve as a guide for de-
signers and operators of gaseous hydrogen stations and reflect the best practices cur-
rently available. It includes issues such as safety of personnel, operations instructions,
protection, and emergency situations. [...]
Liquid hydrogen storage IGF Code/IGC Code
The IGC and IGF codes cover storage of liquefied gas on-board ships. The defined C-
tank rules for storage of liquefied gas will in principle cover hydrogen cooled to liquefied
form. Additional considerations will however be required due to the properties of hydro-
gen including the low storage temperatures.
ISO/TC 220
This is a standard for Cryogenic vessels developed for land based application. Set of
standards in the field of insulated vessels (vacuum or non-vacuum) for the storage and
the transport of refrigerated liquefied gases of class 2 of "Recommendations on the
Transport of Dangerous Goods - Model regulations - of the United Nations", in particular
concerning the design of the vessels and their safety accessories, gas / materials com-
patibility, insulation performance, the operational requirements of the equipment and ac-
cessories.
Detection of leaks
ISO 26142:2010 Hydrogen detection apparatus - Stationary applications. This standard
defines the performance requirements and test methods of hydrogen detection appa-
ratus that measure and monitor hydrogen concentrations in stationary applications. The
standard cover hydrogen detection apparatus used to achieve the single and/or multi-
level safety operations, such as nitrogen purging or ventilation and/or system shut-off
corresponding to the hydrogen concentration. The requirements applicable to the overall
safety system and the installation requirements are excluded. This standard sets out only
the requirements applicable to a product standard for hydrogen detection apparatus,
such as precision, response time, stability, measuring range, and selectivity and poison-
ing. This standard is intended to be used for certification purposes.
100
Hydrogen piping network
The standard ISO 15649:2001 on piping for petroleum and natural gas industries is used
as a guideline also for hydrogen technologies. This standard is applicable to piping within
facilities and for packaged equipment, with exclusion of transportation pipelines and as-
sociated plant. The standard EN 13480:2002 is divided in 7 parts specifying the require-
ments for industrial piping systems and supports made of metallic materials.” [Tro17]
5.5 Standards for hydrogen bunkering
In the International Code of Safety for Ship Using Gases or other Low-flashpoint fuels
(IGF-Code) hydrogen is not listed as fuel [IMO17]. The EMSA study [Tro17] suggests to
establish a guideline for the bunkering of all low-flashpoint, cryogenic substances and
refers to the procedure for LNG:
“Some available regulative documents support bunkering of LNG, notably the ISO/TS
18683 - Guidelines for systems and installations for supply of LNG as fuel to ships, is-
sued Jan 2015. ISO TS 18683 was developed to clarify the aspects of bunkering of LNG
fuel in a port environment. The standard gives guidance on the minimum requirements
for the design and operation of the LNG bunkering facility, including the interface be-
tween the LNG supply facilities and receiving ship. The standard provides requirements
and recommendations for operator and crew competency training, for the roles and re-
sponsibilities of the ship crew and bunkering personnel during LNG bunkering opera-
tions, and the functional requirements for equipment necessary to ensure safe LNG bun-
kering operations of LNG fueled ships. The standard is applicable to bunkering of both
seagoing and inland trading vessels. It covers LNG bunkering from shore or ship LNG
supply facilities, and addresses operations required such as inerting, cooling down, and
loading.
The standard ISO 20519 "Ships and marine technology - Specification for bunkering of
gas fueled ships" is under preparation for its final publication. This standard will cover
aspects as vessel and transfer system design requirements, emergency release system
(breakaway) and emergency shut-down system, hoses, bunkering connections. Alt-
hough it is a standard for gas fueled ships, the standard appears to focus on LNG.
Over the last years, several guidelines designed to handle LNG bunkering have been
published. [...]
IACS LNG bunkering Guidelines (No 142)9 was published in June 2016. The
document provides recommendations for the responsibilities, procedures and
equipment required for LNG bunkering operations and sets harmonized minimum
101
baseline recommendations for bunkering risk assessment, equipment and oper-
ations.
The Society for Gas as a Marine Fuel (SGMF) has released the "LNG Bunkering
- Safety Guidelines" (Feb 2015). The document includes chapters on LNG haz-
ards, safety systems, bunkering and specific safety guidance for ship to ship,
shore to ship and truck to ship bunkering.
The International Association of Ports and Harbors (IAPH) issued check lists for
LNG bunkering.
Bureaus Veritas (BV) has also released LNG Bunkering Guidelines.
In Norway, bunkering of LNG to passenger vessels is subject to approval from the Nor-
wegian Directorate for Civil Protection independent on whether the bunkering is from a
permanent facility of from a truck. Requirements have not yet been developed for bun-
kering of hydrogen or other gaseous low flashpoint fuels as fuel in maritime applications.
Liquid hydrogen is commercially available on trucks hence the current practices applied
for hydrogen being transported as cargo should be consulted. At the MSC 96 in May
2016, an agreement was made to invite ISO to develop a standard LNG bunkering safety
checklist. [...]
The land side part of the bunkering operation is not part of the IGF-Code. Therefore,
other standards for safe bunkering of the relevant fuels are needed to support the imple-
mentation of bunkering technology for maritime use. The ships side of the bunkering
operation (from the bunkering flange on the ship side) is covered by the IGF-Code. For
bunkering of compressed hydrogen gas, experience and standards used in land based
applications will be relevant. A starting point will be the currently available systems for
filling of hydrogen on hydrogen cars, trucks and buses. Upscaling issues will need to be
addressed, considering the temperature requirements for safe hydrogen refueling as too
high temperatures in the receiving tanks must be avoided. SAE J2601 is an industry
standard on the protocol for fueling road vehicles developed by SAE (Society of Auto-
motive Engineers). It gives tables of ramp up rate of the tank pressure during fuel transfer
but its target is limited to transfers of relatively small amounts. It appears to be the only
published fueling protocol for fueling of hydrogen vehicles up to 700 bar tanks. The SAE
J2602 will be a good starting point, but current ongoing standardization initiatives should
also be consulted.
Other relevant standards are:
ISO 17268:2012 Gaseous hydrogen land vehicle refueling connection devices
This standard defines the design, safety and operation characteristics of gaseous hydro-
gen land vehicle (GHLV) refueling connectors consisting of, as applicable, a receptacle
102
and a protective cap (mounted on vehicle), and a nozzle. It applies to refueling connect-
ors which have working pressures of 110 bar, 250 bar, 350 bar and 700 bar.
ISO/TS 19880-1:2016 Gaseous hydrogen- Fueling stations - Part 1: General re-
quirements
This standard recommends the minimum design characteristics for safety and, where
appropriate, for performance of public and non-public fueling stations that dispense gas-
eous hydrogen to light duty land vehicles (e.g. Fuel cell Electric Vehicles). The recom-
mendations are in addition to applicable national regulations and codes, which can pro-
hibit certain aspects of this standard. ISO/TS 19880 is applicable to fueling for light duty
hydrogen land vehicles, but it can also be used as guidance for fueling buses, trams,
motorcycles and fork-lift truck applications, with hydrogen storage capacities outside of
current published fueling protocol standards, such as SAE J2601. It provides guidance
on elements of a fueling station as hydrogen production/delivery system, delivery of hy-
drogen by pipeline, liquid hydrogen storage, hydrogen purification systems, as applicable
and gaseous hydrogen dispensers.“ [17]
Useful information for both storage and bunkering might also be provided by ISO/TS
16901 from 2013 which is a guidance on performing risk assessment in the design of
onshore LNG installations including the ship/shore interface, by DNVGL-RP-G105 from
2015, “Development and operation of liquefied natural gas bunkering facilities” as well
as the ABS documents “LNG Bunkering: Technical and Operational Advisory” and “Bun-
kering of Liquefied Natural Gas-fueled Marine Vessels in North America”.
5.6 Identified gaps
Regarding the use of hydrogen as fuel on inland waterway vessels, some regulatory
gaps in the categories "Hydrogen as Fuel", "Bunkering", "Storage on Board" and "Fuel
Cell System" could be identified. The gaps are classified as legal or knowledge gaps.
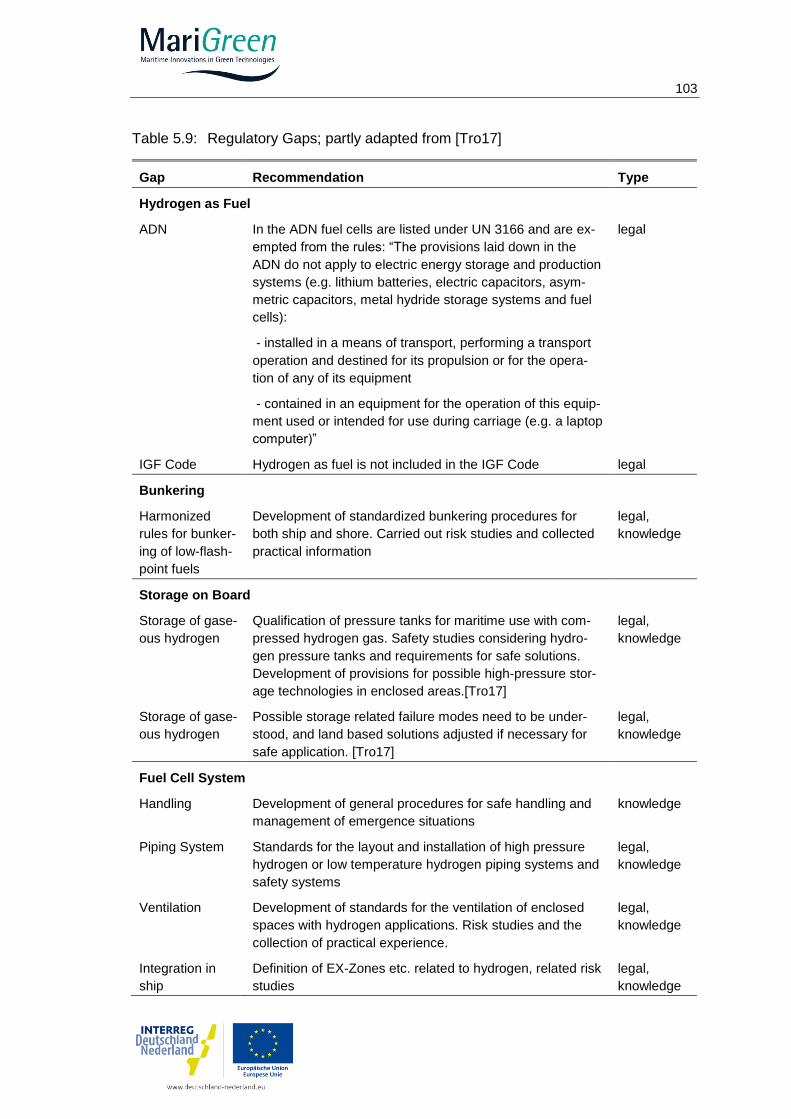
103
Table 5.9: Regulatory Gaps; partly adapted from [Tro17]
Gap Recommendation Type
Hydrogen as Fuel
ADN In the ADN fuel cells are listed under UN 3166 and are ex-
empted from the rules: “The provisions laid down in the
ADN do not apply to electric energy storage and production
systems (e.g. lithium batteries, electric capacitors, asym-
metric capacitors, metal hydride storage systems and fuel
cells):
- installed in a means of transport, performing a transport
operation and destined for its propulsion or for the opera-
tion of any of its equipment
- contained in an equipment for the operation of this equip-
ment used or intended for use during carriage (e.g. a laptop
computer)”
legal
IGF Code Hydrogen as fuel is not included in the IGF Code legal
Bunkering
Harmonized
rules for bunker-
ing of low-flash-
point fuels
Development of standardized bunkering procedures for
both ship and shore. Carried out risk studies and collected
practical information
legal,
knowledge
Storage on Board
Storage of gase-
ous hydrogen
Qualification of pressure tanks for maritime use with com-
pressed hydrogen gas. Safety studies considering hydro-
gen pressure tanks and requirements for safe solutions.
Development of provisions for possible high-pressure stor-
age technologies in enclosed areas.[Tro17]
legal,
knowledge
Storage of gase-
ous hydrogen
Possible storage related failure modes need to be under-
stood, and land based solutions adjusted if necessary for
safe application. [Tro17]
legal,
knowledge
Fuel Cell System
Handling Development of general procedures for safe handling and
management of emergence situations
knowledge
Piping System Standards for the layout and installation of high pressure
hydrogen or low temperature hydrogen piping systems and
safety systems
legal,
knowledge
Ventilation Development of standards for the ventilation of enclosed
spaces with hydrogen applications. Risk studies and the
collection of practical experience.
legal,
knowledge
Integration in
ship
Definition of EX-Zones etc. related to hydrogen, related risk
studies
legal,
knowledge
104
6 Instruction and Training
In this chapter, the special requirements regarding instruction and training of personnel
working with hydrogen are outlined.
6.1 Present state: Use of hydrogen for energy generation in
shipping
Hydrogen as an energy carrier has great potential for low-emission, environmentally
friendly (CO2-free) ship propulsion systems for inland and sea vessels. In this context,
inland waterway propulsion systems are of particular importance, as inland waterway
transport (compared to sea transport) is subject to very strict exhaust emission regula-
tions and is in direct competition with land-based transport (rail and truck). Low-emission
drive concepts already exist for these land-based transports (e.g. electrified platforms as
well as various solutions for low-emission trucks, the first hydrogen-powered buses and
cars are currently being tested). Further arguments for the use of hydrogen as fuel for
inland waterway shipping are the manageable energy requirements of these calls and
the possibility of building up a relatively simple hydrogen bunker infrastructure along the
shipping routes. This limits the size of the hydrogen tanks required on board the ships.
Today, molecular hydrogen plays no role as a fuel for both inland navigation and mari-
time shipping. One exception are conventionally powered submarines with a so-called
air independent propulsion (AIP) component from German production (e.g. submarines
of class U212a of the German Navy). These submarines store hydrogen (physically at-
tached) in metal hydride storage tanks outside the pressure hull and use the hydrogen
together with liquid stored oxygen in fuel cells (total power of the cells approx. 300 kWe).
The technical requirements of these systems are very high and cost-intensive due to
military requirements.
The use of hydrogen as an energy carrier for ship propulsion can be technically imple-
mented in various ways. In particular, there are different technologies for hydrogen stor-
age (pressure storage, liquefied gas storage, physical/chemical deposits) and for energy
conversion (e.g. fuel cells or petrol engines, see the previous chapters of this study).
There is no functional infrastructure to store and refuel ships in inland and sea harbors.
Hydrogen also plays no role today as cargo for shipping (=> hydrogen tanker). Today
there are no tankers (sea/inland) for the transport of molecular hydrogen (gaseous or
liquid). There is currently no significant infrastructure for hydrogen loading and unloading
in sea or inland ports. The International Maritime Organiziation (IMO) Regulations: Inter-
national Code for Ships using Gases and other Low Flashpoint Fuels (IGF Code, 01 /
2017) contains no statements about the use of hydrogen on seagoing ships.
105
In the 1980´s there were various projects for transporting large quantities of hydrogen by
ship. During this time, the renewable energy sources should be used for electrolysis of
water to hydrogen in Canada, for example. The hydrogen was to be brought to Europe
in a project of Thyssen Nordseewerke, Emden with large sea barges. These projects
were not realized.
It follows: There are no explicit regulations or training concepts for the handling of hydro-
gen as cargo or fuel of ocean-going or inland waterway vessels.
6.2 Recording and requirements of existing education and
training programs
The present study mainly deals with the use of hydrogen on seagoing and inland water-
way vessels. As already explained, there are no homogeneous training concepts for
these application scenarios today.
In the development of training concepts for the use of hydrogen on seagoing or inland
waterway vessels, the following existing training areas from related areas can theoreti-
cally be used:
Use of hydrogen as fuel for trucks and cars
Use of hydrogen in the chemical industry
Training contents of the German Armed Forces/German Navy for the operation
of the U212a submarine (or information from ThyssenKrupp Marine Systems
shipyard (HDW, Kiel))
Experience with the use of natural gas/ LNG on board ships
Providers of training/publications with the general topic: Use of hydrogen are e.g.:
TÜV Süd
Centre for further education for innovative energy technologies of the Chamber
of Crafts Ulm (WBZU)
TAK Akademie Deutsches Kraftfahrzeuggewerbe
European Commission: CORDIS : HYFACT: Training on the safe use of hydro-
gen
There are several publications on hydrogen use. e.g.:
BG Bahnen: Hydrogen safety in workshops (10/2009)
Shell Hydrogen Study (Hamburg 2017)
Various Linde Group publications

106
6.3 Development of training concepts with regard to
individual aspects
In the context of the use of hydrogen as an energy source for sea and inland waterway
vessels (focus on inland navigation), different groups of people with different training
needs arise.
Ship crews: Ship management, machinery personnel, deck personnel
Shipping company employees (technical inspection, crewing, cargo planning)
Port personnel (port captains, technical personnel, security personnel, etc.)
Port fire brigades, water police, pilots
Targeted training concepts are necessary for a safe and effective use of these new tech-
nologies with the different activity profiles of the individual groups. These concepts must
be based on different training modules that can be individually configured for the individ-
ual groups of people.
The trainings must contain theoretical and practical parts (trainings). The training con-
cept must be divided into different training methods:
Courses (in class form and/or e-learning modules) to impart the theoretical
knowledge
Training with simulation programs (imparting practical knowledge for the safe
handling of hydrogen systems)
Trainings / demonstrations in a real hydrogen facility (to deepen/ consolidate
the practical knowledge already acquired)
In doing so, account must be taken of the different educational levels and the very differ-
ent educational levels of the groups of people involved. The training concept should con-
sist of the following modules:
Hydrogen as an environmentally friendly fuel
Theoretical fundamentals
- Physical basics
- Chemical Basics
Properties of hydrogen in comparison with other fuels
Origin, transport, storage, implementation
Economic aspects of hydrogen use
Technology used in the use of hydrogen on ships (according to the solutions pro-
posed in the previous chapters)
(Combustion) Engines
Fuel cells
Components of the hydrogen systems used
- Pipelines/ fittings,
- Control and safety systems
- Tank technologies incl. pressure vessel regulation

107
- Bunker facilities
Operation of ships / ship installations with hydrogen as fuel
Safe handling of hydrogen plants / occupational safety
Visual, functional and leak tests
Bunkering
Maintenance /Maintenance
Accident prevention/behavior in the event of an accident
Effects of hydrogen propulsion systems on maneuverability
of ships (dynamics of propulsion, power reserves, ...)
Safe handling of hydrogen / potential hazards
Safety aspects when handling hydrogen
- Deep cold hydrogen
- Hydrogen at high pressure
- Risk of explosion if hydrogen is mixed with oxygen
Safety aspects for hydrogen storage
Safety aspects for the bunkering of hydrogen
Safety aspects in handling hydrogen propulsion systems on ships
- Behavior in engine rooms with H2 systems
- Behavior during repair and maintenance work on H2 systems
- Behavior in case of fire on board
- Behavior in the event of an accident
Legal basis for dealing with hydrogen
General rules
General requirements for seagoing and inland waterway vessels (not yet de-
fined)
Special rules and regulations (separate rules for ports and industrial facilities)
(not yet defined)
6.4 Development of a new combined training and education
concept
The existent training concepts for staff in contact with hydrogen are not suitable for the
special needs of the inland water vessel propulsion systems. Onshore and offshore as-
pects have to be part of the training concept. Today most of the education and training
concepts are based on various onshore applications.
According to the different needs of the program participants individual concepts to train
these people effectively have to be developed. The modular learning tool system (“box
of bricks”) as discussed in chapter 6.3 is helpful to combine the various learning aspects
into an individual training and education concept.

108
The learning level has to be adapted to the educational level of the participants. The
successful attendance shall be confirmed on an established certificate.
6.5 Development of a possible training schedule
The modular structure of the training concept allows individual adaptation of the training
courses for the individual occupational groups. The contents of the individual modules
("depth"/complexity - theory and practice) must also be individually adapted.
This will vary the duration of the training. A reliable statement on the structure of a train-
ing schedule is only possible after the results from the other work phases of this study
have been presented and the necessary learning content has been detailed.
109
7 Summary
After emission limits for particulates, CO, HC and NOx, for instance, have been tightened
in the last years, this trend is expected to continue. In order to comply with the new
standards, alternative propulsions systems as well as fuels should be considered. From
this point of view, hydrogen is very promising, because it allows for reducing emissions
significantly.
Hydrogen can be produced on a variety of paths. Nowadays the vast majority originates
from reformation of fossil energy carriers, whereas only 4 % comes from electrolysis.
Only when produced from renewable energy sources, it can play to its strengths regard-
ing both the use of primary energy and the CO2 emissions. Furthermore, hydrogen pro-
duction by means of electrolysis can offer benefits to grid stability and facilitate the effi-
cient use of renewable power plants by the so-called sector coupling. While the increas-
ing number of Power-to-X plants reveal the trend towards “green hydrogen”, during the
transition period conventional hydrogen can still serve as adequate fuel to promote hy-
drogen technologies.
The tight ties between chemical industry and hydrogen as well as between the chemical
industry and waterways lead to availability of hydrogen along the main shipping routes.
The expected growth of the hydrogen sector including the growing network of gas sta-
tions will further guarantee hydrogen availability across Europe. Against the background
that additional long-distance road transport would not be accepted to distribute hydrogen
to the consumers, electrolysis facilitates a decentralized hydrogen production. Further-
more, existent hydrogen pipeline networks like in the Rhine-Ruhr area and the Nether-
lands, Belgium and France can be used.
In the harbor, the hydrogen should preferably be stored in the form it is delivered from
the producer and provided to the consumer. Due to additional energy losses, conversion
between the various forms of storage should be strictly avoided. The conventional ways
of bunkering, namely by bunker boat, truck or pipeline can also be applied with hydrogen.
Hydrogen can be stored in various ways: for example in compressed or liquid form, in
liquid organic hydrogen carriers (LOHC) or metal hydrides. Compressed hydrogen stor-
age systems exhibit the lowest degree of system complexity, but also the lowest volu-
metric storage density. Liquid hydrogen is most dense, but rather suitable for storing
larger amounts to achieve a high volume-to-surface-area ratio which determines the boil-
off losses. To overcome these losses, permanently a certain amount of hydrogen must
be removed. Whereas LOHCs can be stored in normal diesel tanks, they require a com-
plex hydrogen release system. All forms of storage have their pros and cons and every
form is suitable for certain applications.
110
Onboard the vessels, the chemical energy stored in the hydrogen can be converted to
electricity and mechanical propulsion energy by means of internal combustion engines
or fuel cells and electric motors. Fuel cells neither emit any unburnt hydrocarbons nor
nitrogen oxides while creating less vibrations and by trend exhibiting the higher effi-
ciency. Combustion engines offer proven robustness, reliability and durability as well as
lower costs. To operate conventional internal combustion engines on hydrogen, several
components have to be modified. This can be done for new engines and as retrofit.
To represent the heterogeneous fleet of IWT vessels, four exemplary types of ships have
been defined. A cargo vessel, a pushed convoy, a cabin vessel and a Rhine ferry. For
each of these ships the necessary amount of hydrogen is calculated based on typical
operational profiles and compared to the boundary conditions in respect of the construc-
tional integration. The requirements of each type of vessel regarding operation are de-
fined and contrasted with the technical features of the energy storage and conversion
technologies. This analysis reveals four promising technical solutions for each type of
vessel. These can be compressed hydrogen storage for the cargo vessel and the ferry
and liquid hydrogen storage for the pushed convoy and the cabin vessel. As energy
converters, combustion engines are favored for the cargo vessel and the pushed convoy,
whereas fuel cells can be promising for the cabin vessel and the ferry. It should be noted
that also other combinations are possible and should be evaluated based on concrete
machinery space concepts and the specific operational profile.
This study is complemented by an analysis of the legal situation and a proposal of pos-
sible education and training concepts.
111
8 Action Guidance
As laid out in the preceding chapters of this study, hydrogen generated from renewable
energy sources constitutes a promising choice as alternative fuel in inland navigation on
a mid and long term perspective. Because of the small size of the inland navigation sec-
tor in comparison to the sectors of other modes of transport and its small and mid-sized
corporate structure a sustainable implementation of hydrogen technologies in inland nav-
igation will rely on public funding for market activation and needs to be embedded in a
cross-sectoral strategy.
The European Union as well as several member countries have acknowledged the po-
tentials of hydrogen as energy source and have launched different hydrogen roadmaps
and implementation strategies. The European Commission has supported development
of hydrogen and fuel cells since the early 1990s. Research has mainly been directed
towards performance and durability improvement and cost reduction. Hydrogen and fuel
cell technologies were identified amongst the new energy technologies needed to
achieve a 60 % to 80 % reduction in greenhouse gases by 2050, as presented in the
European Strategic Energy Technology Plan along with the Energy Policy Package in
January 2008.
The potential for fuel cells and hydrogen to enhance energy security and mitigate climate
change was recognized in 2003 with the creation of the Hydrogen and Fuel Cell Tech-
nology Platform. The platform brought together key stakeholders in the fuel cell and hy-
drogen fields who jointly developed an implementation plan. Published in 2007, the plan
addressed the technological and non-technological barriers to deployment of these dis-
ruptive technologies. It identified key issues and priorities for accelerating deployment of
portable, stationary and transport applications. The platform led to the formation of a
Public Private Partnership - the 'Fuel Cells and Hydrogen Joint Undertaking' (FCH JU) -
between the European Commission, industry and the research community. A main goal
of the FCH JU is to enable commercial deployment by 2020. The European Commission
channels support for fuel cell and hydrogen research and demonstration through the
FCH JU. For the period 2007-2013, European Commission support amounted to 470
million €. For the period from 2018 it was stated by the Commission that the FCH JU will
remain the core of its hydrogen strategy but that it will be complimented by funds from
CEF or TEN-T. Demonstrators will be funded via the EU Emission Trading System (ETS)
Innovation Fund or the European Investment Bank (EIB).
Together with the Scandinavian Countries, France and the UK, Germany is one of the
four major European players in the development of hydrogen in the transport- and energy
sector. Based on the German government’s 2016 to 2026 hydrogen and fuel cell tech-
nology program, the interdisciplinary National Innovation Program Hydrogen and Fuel
Cell Technology ensures the continuation of research and development in the area while
112
simultaneously addressing the pressing issue of market activation and providing neces-
sary support for initial products. The implementation of NIP is conducted via the corre-
sponding measures of the federal ministries involved. The Federal Ministry of Transport
and Digital Infrastructure (BMVI – Bundesministerium für Verkehr und digitale Infra-
struktur) is initially allocating a sum of 250 million euros until 2019 to support hydrogen
and fuel cell technology. The Funding Guideline for “Measures of Research, Develop-
ment and Innovation” / (Förderrichtlinie für “Maßnahmen der Forschung, Entwicklung
und Innovation”) was already published on 29 September 2016 [BMV16].
With the Funding Guideline for “Market Activation Measures within the Framework of the
National Innovation Programme Hydrogen and Fuel Cell Technology Phase 2 (Focus:
Sustainable Mobility)” / (“Maßnahmen der Marktaktivierung im Rahmen des Nationalen
Innovationsprogramms Wasserstoff- und Brennstoffzellentechnologie Phase 2
(Schwerpunkt Nachhaltige Mobilität)” of 17 February 2017, the BMVI supports the mar-
ket activation of products that have attained market maturity but are not yet competitive
in the market, as a preliminary step of the market launch.
The Federal Ministry for Economic Affairs and Energy (BMWi – Bundesministerium für
Wirtschaft und Energie) will continue supporting applied research and development in
hydrogen and fuel cell technology with around 25 million euros annually within the frame-
work of the 6th Energy Research Program. Moreover, in August 2016 the BMWi
launched a funding program within the scope of the National Action Plan Energy Effi-
ciency (NAPE – Nationaler Aktionsplan Energieeffizienz) for the procurement of fuel cell
heating devices for private customers. The Federal Ministries for the Environment as well
as Education and Research continue to be actively involved via the structures of NOW
GmbH in the strategic development of NIP.
In the Netherlands, the EU country with the largest inland fleet, the shipping sector (both
inland and ocean shipping) have set themselves the objective of achieving a 50% reduc-
tion in CO2 by 2050 in comparison with 2020 levels. The emission reduction objective is
part of the “Energy Efficiency and CO2 Reduction Agreement for Shipping” signed by the
Dutch Minister for Infrastructure and Environment. The Dutch “Sustainable Fuels Vision”
also identifies hydrogen generated from renewable energy sources as a long term solu-
tion for the reduction of transport emissions.
The Netherlands currently has over 100 hydrogen initiatives in various stages of devel-
opment, and this number is growing. In the specification of the transition pathways of the
Dutch Energy Agenda, hydrogen is emerging as one of the pillars of the energy transi-
tion, in addition to all kinds of other sustainable and climate-neutral options. To gain
greater insight into the role hydrogen may play for the energy transition and the steps
that will have to be taken towards achieving this, the Ministry of Economic Affairs and
Climate Policy has asked TKI New Gas (Top Sector Energy) to manage the drafting of a
Hydrogen Roadmap which was released in May 2018.
113
Other countries along the Rhine corridor such as Belgium and Switzerland have their
own hydrogen initiatives and are collaborating within EU hydrogen projects. The Euro-
pean and national activities described above form a solid basis and a comprehensive
approach for the implementation of hydrogen in the energy and transport sector. Yet, the
inland navigation sector as all branches has its particularities and any action taken to
promote hydrogen in this field should address these as laid out in the following action
guidance.
Infrastructure
Access to a reliable bunkering infrastructure is paramount for the success of hydrogen
in inland navigation. Around 85% of all ship transports in Europe are related to or routed
on the Rhine Corridor. As pointed out in section 4.1.2, major hydrogen production sites
are situated along the industrial centers of the Rhine corridor. Therefore, hydrogen initi-
atives should focus on sector coupling by further developing this synergy between exist-
ing industry and transport infrastructure in the Rhine corridor to establish the necessary
bunkering infrastructure.
Optimized funding schemes for inland waterway transport (IWT) pilots and pro-
moting collaboration
This study examines hydrogen solutions for four exemplary vessels with different bound-
ary conditions regarding their specific tasks and field of operation. Even though this ex-
amination is only a rough overview, it can be concluded that the optimal layout of the
conversion technology and the type of storage can vary between the different types of
ships and even within these groups between their field of operation and the given bound-
ary conditions. Therefore, funding should be open to all possible hydrogen technology
solutions including both fuel cells and internal combustion engines.
Most hydrogen IWT projects focused on feasibility and concept studies. For further de-
velopment case studies are needed. However, the conditions of most funding schemes
often neglect the business structure of the IWT sector and therefore exclude it from tak-
ing part in major hydrogen programs. Small and midsized businesses in inland naviga-
tion are often overburdened by the application procedures and the documentation re-
quired within European and national projects. Lacking own capital for investments is also
a significant barrier for project-involvement of these enterprises.
In order to promote the implementation of hydrogen in the IWT-Sector, various measures
and paths should be combined in an integral approach of new funding schemes. In order
to overcome economical barriers subsidies for hydrogen propulsion systems are re-
quired. For the remaining own contributions access to suitable loans has to be ensured.
114
However, these components for capital expenditure are not sufficient as long as no sav-
ings in operational costs or other ways for the return of investment can be achieved.
Therefore, an attractive framework needs to be established e. g. by excluding hydrogen
from taxation or reducing port fees for green ships.
The public sector should also promote collaboration between inland shipping companies,
research and development facilities, the energy sector, shippers and customers with in-
terest in hydrogen applications. The conversion of public authority ships to hydrogen can
serve as a forerunner for commercial inland navigation.
Technical Regulation for Hydrogen Use in IWT
The technical regulations for inland navigation in Europe are developed in a collaborative
process between the stakeholders under the umbrella of the European committee for
drawing up common standards in the field of inland navigation (Comité Européen pour
l’Élaboration de Standards dans le Domaine de Navigation Intérieure – CESNI). CESNI
was founded in 2015 by the EU-Commission and the CCNR. The current German pres-
idency of the CCNR has made the development of technical regulations for the use of
hydrogen in inland navigation one of their priorities. It can be expected that the develop-
ment of appropriate regulations will be included in the CESNI working program for 2019-
2021. This action should be strongly supported by the member states and the industry.
Forceful Market Uptake
Inland ships are very durable assets with a life span of 40 years and more. The same
accounts for engines used in inland ships which have an expected life span of up to 20
years. Therefore it is almost self-explanatory that renewal rates of ship capacities and
engines are very low. To avoid a chicken-and-egg dilemma as can be observed from the
market uptake of LNG in inland navigation, a forceful market uptake of hydrogen has to
include public funding for engine renewal and the installation of the bunkering infrastruc-
ture. With the funding guideline “Nachhaltige Modernisierung von Binnenschiffen” (Sus-
tainable Modernization of Inland Ships) the German Ministry of Transport and Digital
Infrastructure has established a practical tool which is open to new technologies and can
be developed to the needs of the sector with regard to a hydrogen uptake. Only few other
countries up to today have specific funding for the inland shipping sector. The Nether-
lands for example rely on special depreciations while Belgium only has regional funding
for the installation of SCR/DPF-Systems or the renewal of Diesel-Engines. Switzerland
has no funding scheme for inland navigation due to its small fleet. Hence, funding
schemes on the European level should be examined to develop a level playing field for
a hydrogen market uptake in inland navigation. Business economic and financing options
for greening innovations in IWT were also discussed extensively within the H2020 project
PROMINENT (Reference: Ecorys, “D6.3 Business economic and financing options for

115
greening innovations in IWT/D6.5 Financial impact of Greening IWT for Europe”, April
2018, www.prominent-iwt.eu) [PRO18]. The proposed greening fund also includes a so-
called sector contribution in terms of a differentiated surcharge on fuel costs which is
increased for ships with older emission standards. These topics are currently also dis-
cussed within CESNI’s Economic Committee.
116
9 Bibliography
[Air18] Air Liquide, https://industrie.airliquide.de/wasserstoffanlagen
Accessed: 17.08.18
[Als18] Alstom, http://www.alstom.com/products-services/product-cata-
logue/rail-systems/trains/products/coradia-ilint-regional-train-/
Accessed: 12.08.2018
[APr18] AirProducts, http://www.airproducts.com/industries/energy/power/
power-generation/faqs.aspx. Accessed: 17.08.18
[Bas16] van Basshuysen, R. Natural Gas and Renewable Methane for Power-
trains. Future Strategies for a Climate-Neutral Mobility, Springer Inter-
national Publishing, Switzerland, 2016
[BHS18] Basic Hydrogen Strategy. Ministerial Council on Renewable Energy,
Hydrogen and Related Issues, Dec, 2017.
[Bie16] Biert, L. v., Godjevac, M., Visser, K., Aravind, P. (2016). “A review of
fuel cell systems for maritime applications”. In: J. Power Sources 327,
345-364
[BMV16] Bundesministerium für Verkehr und digitale Infrastruktur. Förderrichtli-
nie für “Maßnahmen der Forschung, Entwicklung und Innovation im
Rahmen des Nationalen Innovationsprogramms Wasserstoff- und
Brennstoffzellentechnologie. 2016; https://www.now-gmbh.de/content/2-
bundesfoerderung-wasserstoff-und-brennstoffzelle/1-foerderricht-
linien/foerderrichtlinie_banz-at-29.09.2016-b4.pdf.
Accessed: 30.10.2018
[BMW12] BMW, cryo-compressed hydrogen storage, presentation
https://stfc.ukri.org/stfc/cache/file/F45B669C-73BF-495B-
B843DCDF50E8B5A5.pdf
[Bou11] Boundy, B., Diegel, S.W., Wright, L., Davis, S. C. Biomass Energy Data
Book. 4th edition. 2011
[Buc82] Buchner, H. Energiespeicherung in Metallhydriden. Wien; New York :
Springer. 1982
[CEW09] Cluster EnergieWirtschaft; Wasserstoff – Schlüssel zu weltweit nachhal-
tiger Energiewirtschaft. Beispiele aus Nordrhein-Westfalen von der
Produktion zur Anwendung, 2009
117
[Dat15] Database Transport, Eurostat. http://ec.europa.eu/eurostat/web/trans-
port/data/database. Accessed: 15.01.2018
[DEH07] Go/No-Go Recommendation for Sodium Borohydride for On-Board Ve-
hicular Hydrogen Storage, U. S. Department of Energy Hydrogen Pro-
gram, Independent Review, 2007
[Die18] DieselNet, https://www.dieselnet.com/standards/eu/nonroad.php
Accessed: 26.06.2018
[DLR18a] Institute of Solar Research, DLR. Solar fuels - Sustainable energy carri-
ers for the future. http://www.dlr.de/sf/en/desktopdefault.aspx/tabid-
10908/19142_read-44566/. Accessed: 17.08.18
[DLR18b] Institute of Solar Research, DLR. High temperature redox systems - a
battery for solar radiation. http://www.dlr.de/sf/en/desk-
topdefault.aspx/tabid-10910/19266_read-44940/. Accessed: 17.08.18
[DOE18a] U.S. Energy Department. Comparison of Fuel Cell Technologies.
Adapted from https://www.energy.gov/eere/fuelcells/comparison-fuel-
cell-technologies. Accessed: 12.08.2018
[DOE18b] U.S. Energy Department. Hydrogen Storage. https://www.en-
ergy.gov/eere/fuelcells/hydrogen-storage. Accessed: 30.04.18
[Edw14] R. Edwards, J.-F. Larivé, D. Rickeard, and W. Weindorf. Well-to-Wheels
Analysis of Future Automotive Fuels and Powertrains in the European
Context. Version 4.a. Luxemburg: Joint Research Center of the Euro-
pean Commission, Eucar and Concaw (JEC), 2014
[Eic10] Eichlseder, H., Klell, M. Wasserstoff in der Fahrzeugtechnik. Erzeu-
gung, Speicherung, Anwendung. 2nd edition. Springer Fachmedien
Wiesbaden GmbH, 2010.
[Emo13] e-mobil BW GmbH, Fraunhofer ISE, et al., Wasserstoff-Infrastruktur für
eine nachhaltige Mobilität, Stuttgart, 2013
[Emp18] Nideröst, R. EMPA Swiss Federal Laboratories for Materials Science
and Technology, Zwischenbilanz zu Wasserstoff-Kommunalfahrzeug in
Basel. Energieverbrauch halbiert, technisch anspruchsvoll. https://idw-
online.de/de/news369230. Accessed: 05.03.2018
[EMS18] EMS Evolve, “Hydrogen Storage”, Brochure 08/18
[EPC04] Directive 2004/ 26/EC of the European Parliament and of the Council of
21 April 2004 amending Directive 97/68/EC on the approximation of the
laws of the Member States relating to measures against the emission of
118
gaseous and particulate pollutants from internal combustion engines to
be installed in non-road mobile machinery. Directive. 2004.
[EPC98] Directive 97/68/EC of the European Parliament and of the Council of 16
December 1997 on the approximation of the laws of the Member States
relating to measures against the emission of gaseous and particulate
pollutants from internal combustion engines to be installed in non-road
mobile machinery. Directive. 1998.
[EPC16] Regulation (EU) 2016/1628 of the European Parliament and of the
Council of 14 September 2016 on requirements relating to gaseous and
particulate pollutant emission limits and type-approval for internal com-
bustion engines for non-road mobile machinery, amending Regulations
(EU) No 1024/2012 and (EU) No 167/2013, and amending and repeal-
ing Directive 97/68/EC
[EPG18] European Power to Gas. Power-to-gas (demonstration) projects in Eu-
rope. http://europeanpowertogas.com/projects-in-europe/
Accessed: 26.08.2018.
[Eur18] De Europese binnenvaartvloot. https://www.informatie.binnen-
vaart.nl/schepen. Accessed: 15.01.2018
[FCB17a] “Cologne funded for largest fuel cell hybrid bus fleet in Germany”. In:
Fuel Cells Bulletin 2017.10 (2017), page 2.
[FCB17b] “Orkney tidal energy produces hydrogen, fuel cell is installed”. In: Fuel
Cells Bulletin 2017.10 (2017), pages 14 –15
[FNR06] Fachagentur Nachwachsende Rohstoffe e.V., editor. Gülzower Fachge-
spräche Band 25 (2006): Wasserstoff aus Biomasse.
[Fra15] Fraile D., et al. Overview of the market segmentation for hydrogen
across potential customer groups, based on key application areas.
Technical report. CertifHY Project, 2015.
[Fri18] Friedhoff, B., Abma, D., van Mensch, P., Verbeek, R., Schulz, A., Lutz,
A. (2018). „Digital solutions for environmental performance and efficient
navigation using on-board monitoring and river modelling”. In: 7th
Transport Research Arena TRA 2018, Vienna, Austria
[Ghi11] Ghirardo, F., Santin, M., Traverso, A., Massardo, A. (2011). “Heat re-
covery options for onboard fuel cell systems”. In: International journal of
hydrogen energy, 36(13), 8134-8142.
[God13] Godjevac, M. D4.1 Operational profiles. Delft University of Technology,
2013
119
[Gue11] Guesnet, T. “Energy efficiency of inland water ships - and how to im-
prove it”. In: ZKR CCR Workshop - Workshop - CO2 Emissions from In-
land Navigation. Apr. 2011
[H2F18] H2Fuel-Systems BV. H2Fuel: carrier of hydrogen. http://www.h2-
fuel.nl/wp-content/uploads/2016/11/H2Fuel-New-doc_UK_02-11-
2016_def-V4.pdf. Accessed: 31.10.2018
[H2M18a] H2 Mobility Deutschland. Stand des Netzausbaus. 2018
[Had16] Hader, A. The River Cruise Fleet. Handbook 2016/17. Printed privately,
Bayreuth, 2016
[Hei06] Heinzel, A. Brennstoffzellen: Entwicklung, Technologie, Anwendung,
Energietechnik. 3rd Edition. Müller, 2006
[Hek17] Hekkenberg, R., Liu, J. “Developments in inland waterway vessels”. In:
Inland Waterway Transport - Challenges and prospects. Edited by B.
Wiegmans and R. Konings. 2017.
[HMU13] Hessisches Ministerium für Umwelt, Energie, Landwirtschaft und Ver-
braucherschutz. Flurförderzeuge mit Brennstoffzellen. Technical report.,
2013
[Höh03] Höhlein B., et al. Methanol als Energieträger. Schriften des Forschungs-
zentrums Jülich, Reihe Energietechnik, Volume 28. 2003
[Huc18] Hucko, M. Erstes Wasserstoff-Bike in Serie. http://www.spie-
gel.de/auto/aktuell/pragma-industries-erstes-wasserstoff-e-bike-in-serie-
kommt-aus-frankreich-a-1184316.html.%20, Accessed: 27.02.2018
[Hyd16] Hydrogenious Technologies GmbH. Systeme zur sicheren und effizien-
ten Wasserstoffspeicherung und -logistik mit LOHC, 2016
[IMO17] International Maritime Organization. International Code of Safety for
Ship Using Gases or Other Low-flashpoint Fuels (IGF Code). 2017
[IOS17] International Organization for Standardization. Reciprocating internal
combustion engines - Exhaust emission measurement - Part 4: Steady-
state and transient test cycles for different engine applications. Norm.
2017
[Kle10] Klell, M. (2010). “Storage of Hydrogen in the Pure Form”. In M. Hir-
scher, Handbook of Hydrogen Storage: New Materials for Future En-
ergy Storage (pp. 1-37). Weinheim: WILEY-VCH Verlag GmbH & Co
[Kle12] Klebanoff, L., Keller, J. Final Report for the DOE Metal Hydride Center
of Excellence, 2012
120
[Led95] Ledjeff, K. (Hrsg.): Brennstoffzellen. Heidelberg: C.F. Müller-Verlag,
1995
[Lin10] Linehan, S., Allen, N., et al. Low-Cost Precursors to Novel Hydrogen
Storage Materials, DOE Hydrogen Program, 2010
[Mar15] Martin, S. NEMESIS2+: Hydrogen production at refuelling stations from
biodiesel and diesel EU-Project Final Report. Technical report. DLR
e.V., 2015
[Mek12] Mekhilef, S., Saidur, R., Safari, A. (2012). “Comparative study of differ-
ent fuel cell technologies”. In: Renewable and Sustainable Energy Re-
views, 16(1), 981-989.
[Mui11] Muir, S., Yao, X. (2011). “Progress in sodium borohydride as a hydro-
gen storage material: Development of hydrolysis catalysts and reaction
systems”. In: International Journal of Hydrogen Energy, 36(10), 5983–
5997. https://doi.org/10.1016/j.ijhydene.2011.02.032
[NIP18] National Innovation Programme. https://www.now-gmbh.de/en/national-
innovation-programme. Accessed: 28.03.2018
[Now18] National Organisation Hydrogen and Fuel Cell Technology
https://www.now-gmbh.de/en/news/press/Siemens-receives-funding-ap-
proval-for-development-of-fuel-cell-drive-for-trains
Accessed: 12.08.2018
[Pay09] Payne, R., Love, J., Kah, M. (2009). Generating electricity at 60% elec-
trical efficiency from 1-2 kWe SOFC products. ECS Trans. 25 (2), 231-
239
[PTG18] Dena Deutsche Energie Platform, http://www.powertogas.info/power-to-
gas/pilotprojekte-im-ueberblick/?no_cache=1. Accessed: 16.08.18
[Pra16] Pratt, J.-W., Klebanoff, L.-E. Feasibility of the SF-BREEZE: a Zero-
Emission, Hydrogen Fuel Cell, High-Speed Passenger Ferry, Sandia
National Laboratories, 2016
[Pre16] Preuster, P., Papp, C., Wasserscheid, P. Liquid Organic Hydrogen Car-
riers (LOHCs): Toward a Hydrogen-free Hydrogen Economy, Accounts
of Chemical Research, 2016
[PRO18] Ecorys, “D6.3 Business economic and financing options for greening in-
novations in IWT/D6.5 Financial impact of Greening IWT for Europe”,
April 2018, www.prominent-iwt.eu. Accessed: 30.10.18
121
[SAE03] Berckmüller, M., Rottengruber, H., Eder, A., Brehm, N., et al., "Poten-
tials of a Charged SI-Hydrogen Engine". SAE Technical Paper 2003-01-
3210, 2003, https://doi.org/10.4271/2003-01-3210.
[SGM17] The society for gas as marine fuel. Gas as a marine fuel. An introduc-
tory guide. 2017
[She17] Shell Hydrogen Study. Energy of the future? Sustainable Mobility
through Fuel Cells and H2. Technical report. 2017.
[Sic16] Sicius, H. Wasserstoff und Alkalimetalle: Elemente der ersten Haupt-
gruppe. Eine Reise durch das Periodensystem. Springer Fachmedien,
Wiesbaden, 2016
[Smo10] Smolinka, T., Günther, M., Garche, J. (2010) NOW-Studie "Stand und
Entwicklungspotenzial der Wasserelektrolyse zur Herstellung von Was-
serstoff aus regenerativen Energien". Kurzfassung des Abschlussber-
ichts. Version Revision 1 (2011). Fraunhofer ISE and FCBAT.
[Sta18] Staffell, I. The Energy and Fuel Data Sheet. http://www.aca-
demia.edu/1073990/The_Energy_and_Fuel_Data_Sheet
Accessd: 05.03.2018
[Ste16] Steller, I. (2016). Typenkompass Frachtschiffe. Binnenschifffahrt auf eu-
ropäischen Wasserstraßen. Verlag Pietsch, Stuttgart
[Sto15] Stolten, D. (2015). Grundlagen und Techniken der Brennstoffzellen. Ka-
pitel 6: Energieträger für Brennstoffzellen, p.18. Lehrstuhl für Brenn-
stoffzellen (RWTH)
[Tam14] Tamhankar, S. (2014). Terminal Operations for Tube Trailer and Liquid
Tanker Filling: Status, Challenges and R&D Needs. Presentation.
[Tho01] Thorstensen, B. (2001). A parametric study of fuel cell system efficiency
under full and part load operation. J. Power Sources 92 (1), 9-16
[Toe06] Toepler, J. (2006). The Technological Steps of Hydrogen Introduction,
Ingolstadt
[Tro17] Tronstad, T., Astrand, H., Haugom, G., Langfeldt, L. (2017). Study on
the use of fuel cells in shipping. Technical report. EMSA European Mar-
itime Safety Agency
[UNC18] Map of the European Inland Waterway Network. United Nations Eco-
nomic Commission for Europe (UNECE). https://www.unece.org/filead-
min/DAM/trans/main/sc3/European_inland_waterways_-_2012.pdf
Accessed: 16.01.2018
122
[Vog12] Vogler, F., Scholz, B., Langfeldt, L. (2012). Machbarkeitsstudie zum
Bunkern von Flüssiggasen in deutschen Häfen. Germanischer Lloyd
SE.
[Win89] Wasserstoff als Energieträger, herausgegeben von Carl-Jochen Winter
und Joachim Nitsch, Zweite, überarbeitete Auflage, Springer Verlag
1989
[Zak10] Zakkour P., Cook, G. (2010) CCS Roadmap for industry: High-purity
CO2 sources. Technical report. Carbon Counts Company.
[Zha07] Zhang, J., Zheng, Y., Gore, J. P., Fisher, T. S. (2007). “1 kWe sodium
borohydride hydrogen generation system. Part I: Experimental study”.
In: Journal of Power Sources, 165(2), 844–853.
https://doi.org/10.1016/j.jpowsour.2006.12.055