Embed Size (px)
Citation preview
DEJELIA RAMONA GÓMEZ GONZÁLEZ
Use of highly pathogenic Avian Influenza propagation models in the Dominican Republic
São Paulo
2017
DEJELIA RAMONA GÓMEZ GONZÁLEZ
Uso de Modelos de Propagación de Influenza aviar de alta patogenicidad en la República Dominicana
Tese apresentada ao Programa de Pós-Graduação em Epidemiologia Experimental aplicada às zoonoses da Faculdade de Medicina Veterinária e Zootecnia da Universidade de São Paulo para obtenção do Título de Doutor em Ciências.
Departamento:
Medicina Veterinária Preventiva e Saúde Animal
Área de concentração:
Epidemiologia Experimental Aplicada às Zoonoses
De acordo:______________________
Orientador
São Paulo 2017
Obs: A versão original se encontra disponível na Biblioteca da FMVZ/USP
Autorizo a reprodução parcial ou total desta obra, para fins acadêmicos, desde que citada a fonte.
DADOS INTERNACIONAIS DE CATALOGAÇÃO NA PUBLICAÇÃO
(Biblioteca Virginie Buff D’Ápice da Faculdade de Medicina Veterinária e Zootecnia da Universidade de São Paulo)
T.3484 Gómez González, Dejelia Ramona FMVZ Use of high pathogenicity avian influenza propagation models in the Dominican
Republic / Dejelia Ramona Gómez González. -- 2017. 70 f.: il.
Título traduzido: Utilização de modelos de propagação de influenza aviária de alta patogenicidade na República Dominicana.
Tese (Doutorado) - Universidade de São Paulo. Faculdade de Medicina Veterinária e
Zootecnia. Departamento de Medicina Veterinária Preventiva e Saúde Animal, São Paulo, 2017.
Programa de Pós-Graduação: Epidemiologia Experimental Aplicada ás Zoonoses.
Área de concentração: Epidemiologia Experimental Aplicada às Zoonoses.
Orientador: Prof. Dr. Fernando Ferreira.
1. Avian influenza. 2. H5N2. 3. Spatial model. 4. Transmission rate. 5. Poultry contact network. I. Título.
U N l V E RS Í DA D E D £ SÃO PA U IO
Comissão de Ética no Uso de Animais
São Paulo, 2nd March 2017
CERTIFIED
We certify that.the Research "", protocol number CEUAx 5385310114, under the responsibility Fernando Ferreira, agree with Ethical
Principies in Animal Research adopted by Ethic Committee in the Use of Animais of School of Veterinary Medicine and Animal
Science (University of São Paulo), and was approved in the meeting of day February 19, 2014.
Certificamos que o protocolo do Projeto de Pesquisa intitulado "Uso de modelos para simulación de brotes de Influenza aviar de alta
patogenicidad en Ia República Dominicana", protocolado sob o CEUAx n9 5385310114, sob a responsabilidade de Fernando
Ferreira, está de acordo com os princípios éticos de experimentação animal da Comissão de Ética no Uso de Animais da Faculdade
de Medicina Veterinária e Zootecnia da Universidade de São Paulo, e foi aprovado na reunião de 19 de fevereiro de 2014.
\\s
Profa. Dra. Denise Tabacchi Fantoni Roseli da Costa GomesPresidente da Comissão de Ética no Uso de Animais Secretaria Executiva da Comissão de Ética no Uso de Animais
Faculdade de Medicina Veterinária e Zootecnia da Universidade Faculdade de Medicina Veterinária e Zootecnia da Universidadede São Paulo de São Paulo
Av. Prof. Dr. Orlando Marques de Paiva, 87. Cidade Universitária: Armando de Salles Oliveira CEP 05508-270 São Paulo/SP - Brasil - tel: 55 (11) 3091-7676/0904 / fax: 55 (11) 3032-2224Horário de atendimento: 2a a 6a das 8h as 17h : e-mail: [email protected]
CEUA N 5335310114
FOLHA DE AVALIAÇÃO
Autor: GOMEZ GONZÁLEZ, Dejelia Ramona
Título: Uso de Modelos de Propagación de Influenza aviar de alta
patogenicidad en la República Dominicana.
Tese apresentada ao Programa de
Pós-Graduação em Epidemiologia
Experimental aplicada às zoonoses da
Faculdade de Medicina Veterinária e
Zootecnia da Universidade de São
Paulo para obtenção do Título de
Doutor em Ciências.
Data: _____/_____/_______
Banca Examinadora
Prof. Dr. ________________________________________________________
Instituição:_________________________Julgamento:____________________
Prof. Dr. ________________________________________________________
Instituição:_________________________Julgamento:____________________
Prof. Dr. ________________________________________________________
Instituição:_________________________Julgamento:____________________
Prof. Dr. ________________________________________________________
Instituição:_________________________Julgamento:____________________
Prof. Dr. ________________________________________________________
Instituição:_________________________Julgamento:____________________

Nothing like feeling guided by God, nothing like feeling the
support of the family; my God, my mother, my children, to you I
dedicate this work.
To Natasha, Valerie and Dany Emmanuel. With all my love.
Nada como sentirse guiado por Dios, nada como sentir el apoyo de la
familia; mi Dios, mi madre, mis hijos, a ustedes dedico con todo mi
amor este trabajo.
A Natasha, Valerie y Dany Emmanuel con todo mi amor.

ACKNOWLEDGES
Many people are in the way, all of them we learn. The best teachings are given by
those who give for love, by vocation; to them, I must thank their teachings and it is
certain that I will not forget them.
I specially recognize the special support of my advisor, Prof. Dr. Fernando Ferreira, for
understand the interest of pos graduates and collaborate with all of us, and for his
special dedication to this work, I never forget your valuable contribution for we all be
better and get our dreams.
Thanks to the Prof. Dr. Paulo Brandão for his full collaboration to our project.
I thank my co advisors, and all my colleagues from Brazil and the Dominican Republic
who supported me at all times.
Special thanks to my friends Andrea, Camila and Ana and my sister Soraya who
always support and kept me motivated.
Thanks to the administrative personnel of the Department of Preventive Veterinary
Medicine and the secretary of pos graduation.
I thank the University of São Paulo for opening doors to international students and the
CAPES program for support the realized project.
Thanks to the authorities of the Ministry of Agriculture of Dominican Republic,
Directorate of livestock, and the Council for Agricultural and Forestry Research for
contribute to this goal and to support all time this initiative that opens the door to
research in the poultry area.

Knowing is not enough, we must apply. Willing is not enough, we must also do.
Não basta saber, também deve aplicar-se. Não é suficiente querer, devemos
também fazer.
No basta saber, se debe también aplicar. No es suficiente querer, se debe
también hacer.
Johann Wolfgang Goethe
RESUMO
GOMEZ GONZÁLEZ, D. R. Utilização de Modelos de Propagação de Influenza Aviar de alta patogenicidade na República Dominicana. [Use of Highly Pathogenic Avian Influenza Propagation Models in the Dominican Republic.] 2017, 70 f. Tese (Doutorado em Ciências) - Faculdade de Medicina Veterinária y Zootecnia, Universidade de São Paulo, São Paulo, 2017.
A utilização de modelos epidemiológicos como uma ferramenta para avaliar o
comportamento de algumas doenças é cada vez mais comum. Modelos têm
sido utilizados para representar a infecção pela influenza aviária com base no
histórico de surtos causados pelo subtipo H5N1 altamente patogênico, além
disso, tem-se modelado transmissão intra-rebanho por causa do subtipo H7N7
a partir de dados de mortalidade. Os primeiros surtos de gripe aviária em aves
de curral nas Américas vieram do subtipo H5N2; desde então, e por mais de 30
anos, a linhagem H5N2 Norte americana tem sido detectada em outros países
das Américas. Um vírus do mesmo subtipo e linhagem foi detectado em 2007
na República Dominicana; para estudar o possível impacto de um surto sobre a
população desenvolvemos um modelo SIR com vários cenários de infecção a
partir de parâmetros de H5N2 linhagem Norte americano. O estudo foi baseado
em uma população real através da rede de contato de aves formada por 951
granjas; foi representada transmissão por alta e baixa patogenicidade ao longo
de um período de 100 dias sem utilização de estratégias de controle. Seis
cenários para alta patogenicidade e seis para baixa patogenicidade foram
simulados seguido com sete repetições; todos os cenários levaram a surtos
com progressão semelhante com curva epidêmica em declínio a partir do dia
34; no cenário de baixa a infecção é mantida ao longo do tempo.
Palavras-chave: Gripe aviária. H5N2. Modelo espacial. Taxa de transmissão. Rede de contato de aves.
ABSTRACT
GOMEZ GONZÁLEZ, D. R. Use of Highly Pathogenic Avian Influenza Propagation Models in the Dominican Republic. [Utilização de Modelos de Propagação de Influenza Aviar alta patogenicidade na República Dominicana.] 2017, 70 s. Thesis - (Doctorate in Science) Faculty of Veterinary Medicine and Animal Science, University of São Paulo, São Paulo, 2017.
The use of epidemiological models as a tool to evaluate the behavior of some
diseases is increasingly common. Models have been used to represent infection
with avian influenza, based on the history of outbreaks caused by the highly
pathogenic H5N1 subtype, besides that, within-flock transmission due to H7N7
has been modeled from mortality data. The first outbreaks of influenza in poultry
in the Americas arose from subtype H5N2; since then and for more than 30
years the subtype H5N2 North American lineage has been detected in other
countries of the Americas. A virus of the same subtype and lineage was
detected in 2007 in the Dominican Republic; to study the possible impact of an
outbreak on the population we have developed a SIR model with several
infection scenarios using parameters from the H5N2 North American lineage.
The study was based on a real population through the poultry network contact
of 951 farms; high and low pathogenic transmission was represented during a
period of 100 days without the use of control strategies. Six scenarios for highly
pathogenic and six scenarios for low pathogenic were simulated with seven
repetitions each; all scenarios led to outbreaks with similar progression with
epidemic curve declining from day 34; in low pathogenic the infection is
maintained over time.
Keywords: Avian Influenza. H5N2. Spatial model. Transmission rate. Poultry
contact network.
RESUMEN
GOMEZ GONZÁLEZ, D. R. Utilización de Modelos de Propagación de Influenza Aviar alta patogenicidad en la República Dominicana. [Use of Highly Pathogenic Avian Influenza Propagation Models in the Dominican Republic.] 2017, 70 p. Tesis (Doutorado em Ciências) - Faculdade de Medicina Veterinária y Zootecnia, Universidade de São Paulo, São Paulo, 2017.
La utilización de modelos epidemiológicos como instrumento para evaluar el
comportamiento de algunas enfermedades en humanos y animales es cada
vez más frecuente. En aves se han utilizado algunos modelos para representar
infección por virus de Influenza aviar, basados en los antecedentes de brotes
originados por el subtipo H5N1 de alta patogenicidad, además se ha modelado
transmisión intra-parvada por causa del subtipo H7N7 a partir de datos de
mortalidad. Los primeros brotes de influenza en aves de corral en las Américas
surgieron a partir subtipo H5N2; desde entonces y durante más de 30 años el
subtipo H5N2 linaje Norteamericano ha sido detectado en otros países de Las
Américas. Un virus del mismo subtipo y linaje fue detectado en 2007 en la
República Dominicana; para estudiar el posible impacto de un brote en la
población desarrollamos un modelo SIR con varios escenarios de infección a
partir del virus subtipo H5N2 de linaje norteamericano. El estudio fue basado en
una población real a través de la red de contacto de aves representando
transmisión por virus de alta y de baja patogenicidad a partir de parámetros de
H5N2 linaje Norteamericano; la epidemia se representó durante un período de
100 días sin utilización de estrategias de control. Seis escenarios para alta
patogenicidad y seis para baja patogenicidad fueron simulados con siete
repeticiones cada uno, todos los escenarios dieron lugar a brotes de progresión
similar con curva epidémica que disminuye a partir del día 34; la infección por
baja patogenicidad se mantiene a lo largo de los 100 días.
Palabras clave: Influenza aviar. H5N2. Modelo espacial. Tasa de transmisión.
Red de contacto avícola.
SUMMARY
INTRODUCTION ................................................................................................. 13
Origins of the A/Chicken/Domin.Rep/2397-7/08 H5N2, a low pathogenic avian influenza virus from the Dominican Republic. ............................................. 16
Database for the Register of Poultry Production in the Dominican Republic........ 26
Contact networks in poultry production systems for surveillance and control of avian diseases. ................................................................................................ 37
Propagation models of high and low pathogenicity Avian Influenza in poultry operations in the Dominican Republic. ................................................................. 53
CONCLUSION ..................................................................................................... 59
APÊNDICE ..................................................................................................... 60
13
INTRODUÇÃO
O surgimento de novas cepas de vírus influenza tipo A em populações de
animais representa um desafio permanente para os serviços de saúde e
veterinários dos países, pelo seu potencial zoonótico e de pandemia. É de
grande importância fortalecer a preparação dos serviços de saúde para
responder a estas ameaças. A República Dominicana faz parte dos países da
região das Américas que têm implementado novas estratégias em programas
de saúde, desde o final de 2007, quando foi detectado o vírus da gripe H5N2
de baixa patogenicidade.
O objetivo deste trabalho é dirigido para tratar infecção de gripe aviária em
vários aspectos, características virológicas, relação evolutiva e epidemiologia
molecular do vírus; transmissibilidade; população suscetível; utilização de
modelos estatísticos em saúde animal, registro e análise epidemiológica dos
dados; e aplicação de ferramentas matemáticas e computacionais modernas,
todas relacionadas com a dinâmica do hospedeiro, as características do agente
e retenção no ambiente. A estrutura particular do vírus da gripe, a sua
capacidade de mutação e a presença imprevisível em aves selvagens e aves
de capoeira levam a desenhar novas estratégias de controle e prevenção.
Realizar um estudo nesta importante área da saúde animal permite que, do
ponto de vista epidemiológico, redirecionar e concentrar-se várias questões
que estão ligadas à dinâmica da transmissão da doença.
14
INTRODUCTION
The emergence of new strains of the Influenza A virus in animal populations
poses a permanent challenge for the health and the veterinary services of the
countries for their zoonotic and pandemic potential. It is of great importance to
strengthen the level of preparedness of health services to address these
threats. The Dominican Republic is part of the countries of the Americas that
have implemented new strategies in the health programs, since at the end of
2007 an influenza virus subtype H5N2 of low pathogenic was detected.
The objective of this work is to approach the avian influenza infection in several
aspects, virological characteristics, evolutionary relationship and molecular
epidemiology of the virus; transmissibility; susceptible population; use of
statistical models in animal health, registration and epidemiological data
analysis; and application of modern mathematical and computational tools, all
related to the dynamics of the host, the characteristics of the agent and their
permanence in the environment. The particular structure of influenza viruses,
their ability to mutate and their unpredictable presence in wild and poultry lead
to the development of new control and prevention strategies.
Conducting a study in this important area of animal health allows, from the
epidemiological point of view, to redirect and concentrate several themes that
are united in the dynamics of disease transmission.
15
INTRODUCCIÓN
El surgimiento de nuevas cepas del virus Influenza Tipo A en poblaciones
animales plantea un permanente desafío para los servicios los servicios
veterinarios por su potencial zoonótico y pandémico. Resulta de gran
relevancia fortalecer el nivel de preparación de los servicios sanitarios para
hacer frente a estas amenazas. La República Dominicana es parte de los
países de la región de Las Américas que han implementado nuevas estrategias
en los programas sanitarios, desde que a finales del año 2007 fuera detectado
un virus de influenza subtipo H5N2 de baja patogenicidad.
El objetivo de este trabajo es dirigido al abordaje de la infección por influenza
aviar en varios aspectos, características virológicas, relación evolutiva y
epidemiología molecular del virus; transmisibilidad; población susceptible;
utilización de modelos estadísticos en salud animal, registro y análisis
epidemiológico de datos; y aplicación de modernas herramientas matemáticas
y computacionales, todo esto relacionado con la dinámica del hospedero, las
características del agente y su permanencia en el medio ambiente. La
particular estructura de los virus de influenza, su capacidad de mutar y su
impredecible presencia en aves silvestres y de corral conducen a trazar nuevas
estrategias de control y prevención.
Realizar una estudio esta importante área de la salud animal permite, desde el
punto de vista epidemiológico, redirigir y concentrar varios temas que van
unidos en la dinámica de transmisión de las enfermedades.
16
Origins of the A/Chicken/Domin.Rep/2397-7/08 H5N2, a low pathogenic
avian influenza virus from the Dominican Republic
Gómez, D.R.,1, 3, Brandão, P.,2 and Ferreira, F.1
1Laboratory of Epidemiology and Biostatistics, Department of Preventive Veterinary Medicine and Animal Health, School of Veterinary Medicine and Animal Science, University of São Paulo., 2 Laboratory of Molecular Virology, Department of Preventive Veterinary Medicine and Animal Health, School of Veterinary Medicine and Animal Science, University of São Paulo., 3General Directorate of Livestock, Ministry of Agriculture Dominican Republic.
Abstract
Subtypes of avian Influenza viruses (AIV) H5N2 have caused important outbreaks in
poultry populations in North America countries in its pathogenic form emerging from
low pathogenic virus. Over the years low pathogenicity strains of the same subtype and
lineage have been reported in other countries of the Americas; the control strategies
used in the affected countries were different. During the 1983-84 Pennsylvania highly
pathogenic AIV outbreaks, birds were depopulated without vaccination. During the
1994-95 Mexico outbreaks in presence of both, high and low pathogenicity viruses,
strategies were based on the use of vaccines which to date are still used. In 2014-2015
a novel eurasian H5 reassorted with North American LPAI first reported in wild birds in
British Columbia, Canada caused H5N8, H5N1 and H5N2 large outbreaks in United
States in wild birds and poultry. Reassorted Eurasian H5N2 was North-America´s wild
bird H5N2 LPAI origin. The study of the origins of the Dominican strain involve the
evolutionary relationship and molecular epidemiology of HPAI and LPAI H5N2 North
American lineage isolated in different countries of the Americas, the Caribbean and
Taiwan and is focused on low pathogenic strains that have given rise to new strains
circulating in poultry population over 30 years. This subject leads to demonstrate the
transmissibility of low pathogenic North American lineage which gave rise to
A/Chicken/Domin.Rep./2397-7/08 H5N2 LPAI isolated in 2007 in the Dominican
Republic and their likelihood of introduction to other countries or regions.
Keywords: Avian Influenza, low pathogenic, H5N2, North American lineage,
evolutionary relationship, molecular epidemiology.
Orígenes de A/Chicken/Dom.Rep/2397-7/08 H5N2, un virus de influenza aviar de
baja patogenicidad de República Dominicana
Subtipos de virus de Influenza aviar H5N2 patógenos han causado importantes brotes
en poblaciones de aves de corral en países de Norte América emergiendo de virus de
baja patogenicidad. A lo largo de los años cepas de baja patogenicidad del mismo
subtipo y linaje se han reportado en otros países de las Américas; las estrategias de
control utilizadas en los países afectados fueron diferentes. En los brotes de alta
patogenicidad emergentes en 1983-84 en Pennsylvania las aves fueron despobladas
sin hacer uso de vacunas. En los brotes de México de 1994-95 en presencia de virus
17
de alta y baja patogenicidad, la estrategia fue basada en el uso de vacunas que hasta
la fecha son utilizadas. En 2014-2015 un nuevo virus H5 de linaje Euroasiático
reorganizado genéticamente con virus de baja patogenicidad de origen en
Norteamérica fue reportado por primera vez en Columbia Británica, Canadá, además
causó brotes de H5N8, H5N1 y H5N2 en Estados Unidos en aves silvestres y aves de
corral. El virus H5N2 Euroasiático se originó a partir de virus Norteamericano H5N2 de
aves silvestres. El estudio de los orígenes de la cepa Dominicana envuelve la relación
evolutiva y la epidemiologia molecular del linaje Norteamericano H5N2 presente en
diferentes países de Las Américas, El Caribe y Taiwán enfocados en los virus de baja
patogenicidad que han dado lugar a cepas que circulan en las poblaciones de aves de
corral por más de 30 años. Este tema conduce a demostrar la transmisibilidad del
linaje norteamericano de baja patogenicidad que dio origen al virus
A/Chicken/Domin.Rep./2397-7/08 H5N2 aislado en el año 2007 en la República
Dominicana República y la probabilidad de introducirse a nuevos países o regiones.
Palabras clave: Influenza aviar, baja patogenicidad, H5N2, linaje norteamericano,
relación evolutiva, epidemiología molecular.
18
INTRODUCTION
Many countries in The Americas have been
reported avian influenza (AI) virus in
poultry. In North America in 1983 low
pathogenic avian influenza (LPAI) H5N2
virus was detected in the state of
Pennsylvania, United States, mutating into
high pathogenic (HPAI) in 1984 (Swayne,
2008a; Alexander, Parsons, and Manvell,
1986; Alexander 2007; Alexander and
Brown, 2009). In 2004, an H5N2 avian
influenza virus that met the molecular
criteria for classification as a HPAI virus
was isolated from chickens in the state of
Texas, United States (Lee el al., 2005). It
was the first highly pathogenic strain
reported in the United States in 20 years
(Lee el al., 2005), was the only highly
pathogenic virus reported to the OIE not
pathogenic for chickens (Seene, 2006).
Ten years later in Mexico LPAI H5N2 was
detected in March 1994; in December 1994
the virus mutated to HPAI (Villarreal, 2009).
The last HPAI virus was isolated in June
1995, and since then only LPAI virus has
been found (Villarreal-Chávez and Rivera-
Cruz, 2002). Studies of some North
American H5N2 LP lineage viruses resulted
in variable morbidity and mortality rates in
chickens. 0% morbidity and mortality in
A/chicken/Mexico/26654-1374/94 (H5N2)
and A/chicken/Jalisco/14589-660/94
(H5N2) inoculated by intranasal route
(Swayne et al., 1997); 0% mortality in
A/chicken/Hidalgo/26654-1368/94 (H5N2)
by different routes (Horimoto et al., 1995);
6% morbidity and mortality by intranasal
route in A/chicken/Hidalgo/26654-1368/94
(H5N2) and 31% by intravenous route
(Swayne et al., 1997);
A/chicken/Jalisco/14589-660/94 (H5N2) 19
% morbidity and mortality by intravenous
route (Swayne et al., 1997);
A/chicken/Pennsylvania/l/83 (H5N2) 20%
morbidity and mortality by intranasal route;
10% morbidity and mortality by
intramuscular route; 10% morbidity and
mortality by direct contact (Alexander et al.
(1986); 33% morbidity and 20% mortality in
A/chicken/Pennsylvania/21525/83 (H5N2)
(Mo et al., 1997).
HPAI A/chicken/Pennsylvania/1370/83
(H5N2) by intranasal route resulted in 100%
morbidity and mortality (Bean et al, 1985;
van der Goot et al, 2003); and 90%
morbidity and mortality (Alexander et al,
1986).
Despite being low pathogenicity some
H5N2 North American lineage viruses
continued to spread; two Central America
countries, Guatemala (2000) and El
Salvador (2001) were also affected with
LPAI virus (OIE). In the Caribbean, at the
end of 2007 the Dominican Republic
reported the first occurrence of H5N2 virus
(OIE) and subsequently in mid-2008 Haiti
reported first occurrence LPAI H5N2 sub
clinical infection (OIE).
A/chicken/Domin.Rep/2397-7/08 H5N2
LPAI was isolated and classified by the
National Veterinary Diagnostic Laboratory
in Iowa, NVSL, of United States of America.
In early 2015 in Central America, Belize
reported first occurrence of LPAI H5N2.
The Belize report indicates that the virus
was classified by NVSL as North American
LPAI H5N2 98.8% similar to
A/CK/Mexico/2012 H5N2 (OIE). All the
H5N2 low pathogenic viruses reported in
Central America and in the Caribbean were
classified as North American lineage.
In late 2014 and early 2015 a new HPAI
H5N2 virus was reported in North America.
A novel Eurasian H5 reassorted with North
American LPAI, first reported in wild birds in
British Columbia, Canada, caused H5N8,
H5N1 and H5N2 outbreaks in United
States, was proposed as HPAI
intercontinental group A (icA). Reassorted
Eurasian H5N2 was North-America´s wild
bird A/Northern/Pintail/40964/2014 H5N2
LPAI origin. The novel H5N2 virus first
reported in British Columbia, Canada,
possessed gene segments related of HPAI
H5N8 viruses and North American lineage
waterfowl viruses (Pasick et al. 2015); next
a similar virus was reported in wild birds in
United States causing large outbreaks in
some US states (OIE), (NWHC-USDA). In
August of 2015 Mexico reported LPAI H5N2
subclinical infection in commercial layers.
The event probably will be an important
19
piece in the phylogeny and transmissibility
of the low pathogenic H5N2 viruses, after
more than two decades of the emergence
of low pathogenic virus in Mexico.
Some H5 and H7 subtypes AIVs can
undergo mutational changes that have
serious consequences when allowed to
circulate in poultry for an extended period of
time (Lee el al, 2005), as demonstrated
close relationship in the phylogenetic
analysis of the HA and several internal
genes (NP, M, and NS) between two
isolates from chicken in Texas
(A/Chicken/Texas/298313/04 HPAI and
A/Chicken/Texas/167280-4/02 LPAI), which
indicates a reassortment event had
occurred with unknown viruses. (Escorcia
et al., 2010).
This study reveal the origins of the H5N2
subtype virus of low pathogenicity isolated
in 2007 in the Dominican Republic, and its
similarity with the available H5N2 strains of
North America lineage demonstrating the
persistence of these viruses in some
countries in the Americas, making obvious
the potential of transmissibility of LPAIV of
this lineage over more than 30 years.
MATERIALS AND METHODS
Phylogenetic analysis of North American
Lineage H5N2
GenBank information has been used to
build the North American avian influenza
HA (H5N2) tree. The nucleotide sequences
were aligned using CLUSTAL / W
application running in BioEdit v. 7.2.5 with
nucleotide the sequence of
A/Chicken/Domin.Rep/23977/08 (kindly
provided by Istituto Zooprofilattico
Sperimental delle Venezie) and sequences
were obtained from the GenBank .
The evolutionary history was inferred by
using the Maximum Likelihood method
based on the General Time Reversible
model. The tree with the highest log
likelihood (-5668.3318) is shown [Fig. 1].
The percentage of trees in which the
associated taxa clustered together is shown
next to the branches. Initial tree(s) for the
heuristic search were obtained
automatically by applying Neighbor-Join
and BioNJ algorithms to a matrix of
pairwise distances estimated using the
Maximum Composite Likelihood (MCL)
approach, and then selecting the topology
with superior log likelihood value. The rate
variation model allowed for some sites to be
evolutionarily invariable ([+I], 48.0105%
sites). The tree is drawn to scale, with
branch lengths measured in the number of
substitutions per site. The analysis involved
50 nucleotide sequences. Codon positions
included were 1st+2nd+3rd+Noncoding. All
positions containing gaps and missing data
were eliminated. There were a total of 986
positions in the final dataset. Evolutionary
analyses were conducted in MEGA7
(Kumar, Stecher AND, Tamura, 2016).
RESULTS AND DISCUSSION
The phylogenetic tree shows the
evolutionary relationship of the Dominican
strain A/Chicken/Domin.Rep/2397-7/08 with
the low pathogenic strain
A/chicken/Hidalgo/28159-232/1994, their
most recent common ancestor.
The low pathogenic strain
A/Chicken/Domin.Rep/2397-7/08 (H5N2)
was isolated in 2007 in the Dominican
Republic, and is related with two LPAI
Mexican strains, A/Chicken/Hidalgo/28159-
232/1994 (H5N2) (94.2% identity), and
A/chicken/Hidalgo/232/94 (H5N2) (94.1%
identity). Interestingly, among strains
compared, the next virus closest to the
Dominican strain is
A/chicken/Taiwan/1209/03 (H5N2) (93.7%
identity). In turn, A/chicken/Taiwan/1209/03
(H5N2) and these two Hidalgo strains
identities is 98.2% and 98.1% respectively.
Others strains isolates in Taiwan in 2008,
2012 and 2013 in poultry are evolutionary
more distant of the Dominican strain (91.8
to 90.2%).
The Dominican strain is distant 87.9% and
87.5% respectively from the Guatemala
(2000) and El Salvador (2001) isolates.
20
Figure 1. Maximum Likelihood tree with the GTR model for the partial HA gene of H5N2 AIVs. The bar represents the number of substitutions per site and the
nodes are the bootstrap values (1,000 replicates). Strain A/Chicken/Dom.Rep/23977/08 is in bold.
21
Table 1. Similarities of A/Chicken/Domin.Rep/23977/08 (H5N2) with North American isolates Seq->
A/chicken/Domin.Rep/23977/08(VIR34171H5N2)
CY006040.1 A/chicken/Hidalgo/28159-232/1994(H5N2)
GU052659.1 A/chicken/Mexico/31381-991/1994(H5N2)
GU186565.1 A/chicken/Mexico/31381-3/1994(H5N2)
FJ610108.1 A/chicken/Jalisco/14589-660/1994(H5N2)
GU052651.1 A/chicken/Guanajuato/28159-546/1995(H5N2)
GU186573.1 A/chicken/Mexico/31381-7/1994(H5N2)
AB558474.1 A/chicken/Queretaro/14588-19/1995(H5N2)
GU052690.1 A/chicken/Mexico/28159-541/1995(H5N2)
AB558473.1 A/chicken/Puebla/8623-607/1994(H5N2)
GU052667.1 A/chicken/Puebla/14586-654/1994(H5N2)
U79448.1 A/chicken/Queretaro/7653-20/95(H5N2)
CY014717.1 A/chicken/Chis/15224/1997(H5N2)
GU052596.2 A/chicken/Chiapas/15406/1997(H5N2)
FJ610094.1 A/chicken/Puebla/14587-644/1994(H5N2)
GU052588.1 A/chicken/Mexico/37821-771/1996(H5N2)
GU186557.1 A/chicken/Guatemala/194573/2002(H5N2)
GU052636.2 A/chicken/ElSalvador/102711-2/2001(H5N2)
AY497063.1| A/chicken/Hidalgo/232/94 (H5N2)
A/chicken/Domin.Rep/23977/08(VIR34171H5N2) ID 0,942 0,932 0,932 0,926 0,926 0,928 0,919 0,927 0,911 0,911 0,91 0,91 0,914 0,909 0,908 0,879 0,875 0,941 CY006040.1 A/chicken/Hidalgo/28159-232/1994(H5N2) 0,942 ID 0,987 0,985 0,982 0,982 0,979 0,971 0,962 0,959 0,959 0,96 0,958 0,949 0,955 0,954 0,926 0,92 0,998 GU052659.1 A/chicken/Mexico/31381-991/1994(H5N2) 0,932 0,987 ID 0,991 0,986 0,986 0,976 0,977 0,961 0,958 0,958 0,966 0,957 0,947 0,954 0,952 0,925 0,919 0,988 GU186565.1 A/chicken/Mexico/31381-3/1994(H5N2) 0,932 0,985 0,991 ID 0,984 0,984 0,974 0,977 0,959 0,956 0,956 0,964 0,955 0,947 0,952 0,95 0,925 0,919 0,986 FJ610108.1 A/chicken/Jalisco/14589-660/1994(H5N2) 0,926 0,982 0,986 0,984 ID 0,989 0,971 0,978 0,954 0,953 0,953 0,965 0,95 0,941 0,949 0,945 0,921 0,915 0,983 GU052651.1 A/chicken/Guanajuato/28159-546/1995(H5N2) 0,926 0,982 0,986 0,984 0,989 ID 0,971 0,978 0,954 0,953 0,953 0,965 0,95 0,944 0,949 0,947 0,922 0,916 0,983 GU186573.1 A/chicken/Mexico/31381-7/1994(H5N2) 0,928 0,979 0,976 0,974 0,971 0,971 ID 0,96 0,978 0,963 0,963 0,951 0,961 0,951 0,959 0,956 0,932 0,924 0,98 AB558474.1 A/chicken/Queretaro/14588-19/1995(H5N2) 0,919 0,971 0,977 0,977 0,978 0,978 0,96 ID 0,947 0,958 0,958 0,984 0,941 0,931 0,954 0,937 0,909 0,903 0,972 GU052690.1 A/chicken/Mexico/28159-541/1995(H5N2) 0,927 0,962 0,961 0,959 0,954 0,954 0,978 0,947 ID 0,945 0,945 0,94 0,948 0,94 0,943 0,941 0,92 0,911 0,963 AB558473.1 A/chicken/Puebla/8623-607/1994(H5N2) 0,911 0,959 0,958 0,956 0,953 0,953 0,963 0,958 0,945 ID 0,991 0,95 0,94 0,939 0,989 0,943 0,91 0,902 0,96 GU052667.1 A/chicken/Puebla/14586-654/1994(H5N2) 0,911 0,959 0,958 0,956 0,953 0,953 0,963 0,958 0,945 0,991 ID 0,95 0,94 0,942 0,995 0,945 0,91 0,902 0,96 U79448.1 A/chicken/Queretaro/7653-20/95(H5N2) 0,91 0,96 0,966 0,964 0,965 0,965 0,951 0,984 0,94 0,95 0,95 ID 0,934 0,923 0,946 0,928 0,903 0,897 0,961 CY014717.1 A/chicken/Chis/15224/1997(H5N2) 0,91 0,958 0,957 0,955 0,95 0,95 0,961 0,941 0,948 0,94 0,94 0,934 ID 0,928 0,936 0,933 0,958 0,949 0,959 GU052596.2 A/chicken/Chiapas/15406/1997(H5N2) 0,914 0,949 0,947 0,947 0,941 0,944 0,951 0,931 0,94 0,939 0,942 0,923 0,928 ID 0,938 0,951 0,906 0,898 0,95 FJ610094.1 A/chicken/Puebla/14587-644/1994(H5N2) 0,909 0,955 0,954 0,952 0,949 0,949 0,959 0,954 0,943 0,989 0,995 0,946 0,936 0,938 ID 0,941 0,908 0,898 0,956 GU052588.1 A/chicken/Mexico/37821-771/1996(H5N2) 0,908 0,954 0,952 0,95 0,945 0,947 0,956 0,937 0,941 0,943 0,945 0,928 0,933 0,951 0,941 ID 0,902 0,895 0,955 GU186557.1 A/chicken/Guatemala/194573/2002(H5N2) 0,879 0,926 0,925 0,925 0,921 0,922 0,932 0,909 0,92 0,91 0,91 0,903 0,958 0,906 0,908 0,902 ID 0,984 0,927 GU052636.2 A/chicken/ElSalvador/102711-2/2001(H5N2) 0,875 0,92 0,919 0,919 0,915 0,916 0,924 0,903 0,911 0,902 0,902 0,897 0,949 0,898 0,898 0,895 0,984 ID 0,921 AY497063.1| A/chicken/Hidalgo/232/94 (H5N2) 0,941 0,998 0,988 0,986 0,983 0,983 0,98 0,972 0,963 0,96 0,96 0,961 0,959 0,95 0,956 0,955 0,927 0,921 ID
22
These two isolates show 98.4% similarity
between them having a common ancestor,
A/chicken/Chis/15224/1997(H5N2), distant
95.8% and 94.9 % respectively.
The LPAI virus isolated in Belize (2015)
was classified as North American LPAI
H5N2 virus 98.8% similar to
A/CK/Mexico/2012 H5N2 (OIE). The strains
of Haiti (2008), Belize (2015) and Sinaloa,
Mexico (2015) were not available for this
study.
The strains of United States 1982, 1997
and 2004, and the Eurasian-strains of
British Columbia 2014
A/chicken/BC/FAV8/2014,
A/chicken/BC/FAV9/2014 and
A/turkey/BC/FAV10/2014 are distant of the
Mexican lineage and the Dominican strain.
The Phylogenetic HA analysis shows that
the origin of A/Chicken/Domin.Rep/2397-
7/08 (H5N2) is part of H5N2 North
American Lineage. The tree relates
different strains isolated in poultry in some
countries of the Americas region.
The evolutionary relationship of
A/Chicken/Domin.Rep/2397-7/08 (H5N2)
suggests that it has its origins in a low
pathogenic North American lineage virus
isolated 22 years ago in Mexico. The
molecular epidemiology of H5N2 viruses of
North American lineage isolated in different
countries of North and Central America,
Dominican Republic on the Hispaniola
Island in the Caribbean region, and in the
island of Taiwan in Asia suggests how low
pathogenic strains can be introduced into
new regions, islands and/or continents. HA
phylogeny demonstrates that LPAI H5N2
has been circulating in poultry population
over 30 years evidencing its ability to be
introduced in poultry populations giving rise
to new sub lineages. Over the years some
studies have shown peculiarities of Mexican
lineage that support these conclusions.
A/chicken/Mexico/CPA-232/94 (H5N2) is
the seed strain officially authorized to
produce all the commercial inactivated
vaccines in Mexico (Villareal-Chavez, 2003;
Lee, et al., 2004; Escorcia, et al., 2008 and
2010). The sequences of
A/chicken/Hidalgo/232/94 vaccine strain
were tested and compared with
A/chicken/Mexico/232/1994 because of
nomenclature discrepancy and were found
to be similar (Lee, 2004).
At least four distinct clusters were observed
within the Mexican lineage isolates, divided
in Jalisco, Puebla, A and B sub lineages.
One early isolate (A/CK/Puebla/28159-
474/95) seemed to be the progenitor strain
of the new B sub lineage which includes
isolates from Guatemala and El Salvador.
A/chicken/Hidalgo/232/94 and
A/chicken/Mexico/232/1994 belonged to
Jalisco sub lineage, as majority of the
earlier isolates (Lee et al, 2004). Viruses
circulating in Mexico between 1994 and
1998 were highly divergent to viruses
isolated between 2002 and 2008 (Escorcia
et al, 2010).
The H5N2 viruses in the Dominican
Republic and Haiti were shown to be
closely related to the Mexican lineage of
H5N2, which has been circulating in Mexico
since early 1994 (Seene 2009).
Phylogenetic analyses of H5N2 viruses
prevalent in the chicken population in
Taiwan show that they were generated by
reassortment between an H5N2 virus that
originated from Mexico in 1994 and a
locally enzootic H6N1 virus lineage. (Lee et
al., 2014).
Through over thirty years H5N2 influenza
virus has been circulating in some countries
in the Americas. Since the Pennsylvania
outbreak in 1983 to the Belize and Mexico
2015 outbreaks, North American lineage
H5N2 viruses have been reported in poultry
birds in eight countries of the Americas
region (Canada, United States of America
and Mexico in high pathogenic form;
Guatemala, El Salvador, Dominican
Republic, Haiti and Belize in low pathogenic
form) (OIE). Within this period the same
lineage was detected in Taiwan with
variable level of pathogenicity showing by
phylogenetic analyses that they were
generated by reassortment between an
H5N2 virus originated from Mexico in 1994
and a locally enzootic H6N1 virus lineage.
23
The reemergence of a North American
vaccine strain virus in Asia is a strong
indication that a vaccine may be the source
of this H5N2 virus (Lee, et al., 2014).
Divergence between different strains of
LPAI H5N2 isolates in Mexico circulating
between 1994 to 1998 and 2002 to 2008
demonstrate by HI assay variable results in
titers indicating that the differences may
warrant a new vaccine and serosurveillance
antigen update (Escorcia et al., 2010).
Different Phylogenetic HA and
pathogenicity analysis of North American
H5N2 isolates have demonstrated their
ability of divergence.
In the subclinical infection occurred in game
cocks in the Dominican Republic the
transmission rate could not be calculated;
seroconversion was not efficient, probably
because of the low pathogenic and low
transmissibility of the virus, probably
because the game cocks were kept
separates in cages distanced at least 2
meters from each other. The apparent
morbidity in field in the birds was initially
0.87 % and 2.6% at the end of the
monitoring and depopulation period which
lasted for more than 30 days; during this
period the birds did not show any clinical
signs or mortality. Despite the serological
findings, in this group of birds it was not
possible to isolate the virus. (Gomez,
personal observation).
This study can lead to evaluate a new
perception of risk in the studies of
transmission of the low pathogenic North
American lineage and the Hidalgo H5N2
sub lineage. We recommend further studies
of transmissibility, both in field and
laboratory, as well as molecular studies, to
detect if changes have occurred in
A/Chicken/Domin.Rep/2397-7/08 strain
since detected in 2007.
Our study shows the origins of
A/Chicken/Domin.Rep/2397-7/08 and their
likelihood with the HA genes of H5N2 AIVs
North American lineage that have remained
circulating in poultry populations,
suggesting the ability to spread in some
way over time thus were introduced into
other regions. The surveillance of avian
influenza in low pathogenic subclinical
infection may not be efficient if morbidity
and mortality rates are very low; the
epidemiology of the virus over the time
should be focused, so, we suggest post
quarantine surveillance and further tests of
biological products; countries carrying out
serological surveillance should use those
antigens related to strains representing the
greatest risk. Furthermore, these
conclusions suggest the evaluation of the
serological tests currently used in the
surveillance in the Dominican Republic and
their antigenic relationship with the strain
closest to the Dominican virus.
These results can provide better
understanding of evolutionary relationship
of the viruses in the region and how low
pathogenic viruses indefinitely circulating
may be involved in selective pressure to
mutate into highly pathogenic. The
opportunity of mutation for new clades from
low pathogenic virus circulating through the
years may mean the difference between the
magnitude of an outbreak in one country
and the risk of introduction and spread of
those viruses in different countries in the
region. Isolate new strains could collaborate
to develop advanced molecular
epidemiology studies. Recent 2015
outbreaks of H5N2 North American lineage
most likely can offer relevant data on the
rate of infection in field and diversity of
changes in the isolates.
ACKNOWLEDGEMENTS
Instituto Zooprofilattico Sperimentale delle
Venezie (IZSVe), Italia.
Central Veterinary Laboratory (LAVECEN),
Ministry of Agriculture, Dominican Republic.
REFERENCES
Alexander, D.J., 2007. An overview of the
epidemiology of avian influenza. Vaccine
25, 5637– 5644.
24
Alexander, D.J., Brown, I.H., 2009. History
of highly pathogenic avian influenza. Rev.
Sci. Tech. Off. Int. Epiz. 28, 19–38.
Alexander, D.J., Parsons, G., Manvell, R.J.,
1986. Experimental assessment of the
pathogenicity of eight avian influenza A
viruses of H5 subtype for chickens, turkeys,
ducks and quail. Avian Pathol. 15, 647–
662.
Bean, W.J., Kawaoka, Y., Wood, J.M.,
Pearson, J.E. and Webster, R.G.,
Characterization of Virulent and Avirulent
A/Chicken/Pennsylvania/83 Influenza A
Viruses: Potential Role of Defective
Interfering RNAs in Nature. JOURNAL OF
VIROLOGY, Apr. 1985, p. 151-160 Vol. 54,
No. 1 0022-538X/85/040151-10
Chang-Chun David Lee , Zhu, H., Huang,
Pei-Yu., Peng, L., Chang L.C., Yip, C.H.,
Li, Y.T., Cheung, C.L., Compans, R., Yang,
Ch., Smith, D.K., Lam, T.T., King, C.C.,
and Guanb, Y., 2014. Emergence and
Evolution of Avian H5N2 Influenza Viruses
in Chickens in Taiwan.
Dominican Republic, Surveillance System
of Avian Influenza, Official Statement.
Gomez, D., 2014. Dirección General de
Ganadería, (DIGEGA), Ministerio de
Agricultura.
Elbers, A.R.W., Fabri, T.H.F., de Vries,
T.S., de Wit, J.J., Pijpers, A., Koch, G.,
2004. The highly pathogenic avian
influenza A (H7N7) virus epidemic in the
Netherlands in 2003 : lessons learned from
the first five outbreaks. Avian Dis. 48, 691–
705.
Elbers, A.R.W., Holtslag, J.B., Bouma, A.,
Koch, G., 2007. Within-flock mortality
during the high pathogenicity avian
influenza (H7N7) epidemic in The
Netherlands in 2003: implications for an
early detection system. Avian Dis. 51, 304-
308.
Escorcia, M., Carrillo-Sánchez, C., March-
Mifsut, S., Chapa, J., Lucio, E., Nava, G.
Impact of antigenic and genetic drift on the
serologic
surveillance of H5N2 avian influenza
viruses. BMC Veterinary Research 2010,
6:57 available in
http://www.biomedcentral.com/1746-
6148/6/57
Horimoto T., Rivera E., Pearson J., Seene
D., Krauss S., Kawaoka Y., and Webster,
R.G. Origin and Molecular changes
Associated with Emergency of Highly
Pathogenic H5N2 Influenza Virus in
Mexico, 1995.
Kumar S., Stecher G., Tamura K. MEGA7: Molecular Evolutionary Genetics Analysis Version 7.0 for Bigger Datasets., Mol Biol Evol. 2016 Jul;33(7):1870-4. doi: 10.1093/molbev/msw054.
Lee, C-W., Swayne, D., Suarez, D., 2004.
Effect of Vaccine use in the Evolution of
Mexican Lineage H5N2 Avian Influenza
Virus? Journal of Virology, Aug. 2004, p.
8372-8381.
Kumar, S., Stecher, G., and Tamura, K.,
2016. MEGA7 for big data set., Molecular
Evolutionary Genetics Analysis Version 7.0.
Molecular Biology and Evolution, 33(7),
1870-1874.
Lee, C-W., Swayne, D., Linares, J., Senne,
D., Suarez, D., 2005. H5N2 Avian Influenza
outbreak in Texas in 2004: the first Highly
Pathogenic Strain in the United States in 20
years? Journal of Virology, Sept. 2005, p.
11412-11421.
Ming-Chu Cheng, Kosuke Soda, Ming-
Shiuh Lee, Shu-Hwae Lee, Yoshihiro
Sakoda, Hiroshi Kida, and Ching-Ho Wang.
Emergence and Evolution of Avian H5N2
Influenza Viruses in Chickens in Taiwan.
2014, Journal of Virology.
Mo, I.P., Brugh, M., Fletcher, O.J.,
Rowland, G.N. & Swayne, D.E.(1997).
Comparative pathology of chickens
experimentally inoculated with avian
influenza viruses of low and high
pathogenicity. Avian Diseases, 41,
125_136. Cited in Spickler, A. R., Trampel
D. W., Roth J. A., 2008.
25
National Wildlife Health Center Wildlife
Health Bulletin WSGS, Detection of Highly
Pathogenic Avian Influenza Viruses H5N2
and H5N8 in Wild Birds of the United States
http://www.nwhc.usgs.gov/services/
Pasick, J., Berhane Y., Joseph T., Bowes
V., Hisanaga T., Handel K. & Alexandersen
S., 2015. Reassortant Highly pathogenic
Influenza A H5N2 containing Gene
Segments related to Eurasian H5N8 in
British Columbia, Canada, 2014.
Seene, D. A. 2006, Avian Influenza in North
and South America, 2002-2005.
Seene, D. A. 2009, Avian Influenza in North
and South America, the Caribbean and
Australia, 2006-2008.
Spickler, A. R., Trampel D. W., Roth J. A.,
2008. The onset of virus shedding and
clinical signs in chickens infected with high-
pathogenicity and low-pathogenicity avian
influenza viruses. Avian Pathology
(December 2008) 37(6), 555-577.
Swayne, D.E. 1997. Pathobiology of H5N2
Mexican Avian Influenza virus infection of
chickens.
Swayne, D.E., 2008a. Epidemiology of
avian influenza in agricultural and other
man-made systems. Swayne, D.E. (Ed.),
Avian Influenza. Blackwell Publishing,
Ames, Iowa, USA.
Tiensin, T., Nielen, M., Vernooij, H.,
Songserm, T., Kalpravidh, W.,
Chotiprasatintara, S., Chaisingh, A.,
Wongkasemjit, S., Chanachai, K.,
Thanapongtham, W., Srisuvan, T.,
Stegeman, A., 2007. Transmission of the
highly pathogenic avian influenza virus
H5N1 within flocks during the 2004
epidemic in Thailand. J. Infect. Dis. 196,
1679–1684.
Van der Goot, J.A., De Jong, M.C.M., Koch,
G., Van Boven, M. 2003. Comparison of the
transmission characteristics of low and high
pathogenicity avian influenza A virus
(H5N2). Epidemiol. Infect. (2003), 131,
1003–1013. Cambridge University Press
DOI: 10.1017/S0950268803001067
Van der Goot, J.A., Koch, G., de Jong,
M.C.M., Van Boven, M., 2005.
Quantification of the effect of vaccination on
transmission of avian influenza (H7N7) in
chickens. Proceedings of the National
Academy
of Sciences of the United States of America
102, 18141–18146.
Villarreal-Chávez C. and Rivera-Cruz E.,
2002. An Update on Avian Influenza in
Mexico, Avian Diseases 47:1002–1005,
2003.
Villarreal, C. Avian Influenza in Mexico,
2009. Rev. sci. tech. Off. int. Epiz., 2009,
28 (1), 261-265.
Internet resources:
National Wildlife Health Center NWHC
https://www.nwhc.usgs.gov/ Update on
H5N8 and other HPAI viruses in Wild Birds-
Wild Birds HPAI cases in the U.S. (USDA) https://www.aphis.usda.gov/wildlife_damag
e/
World Organization for Animal Health,
http://www.oie.int detection system. Avian
diseases 51, 304–308.
World Organization for Animal Health, WAHIS
http://www.oie.int/wahis_2/public/wahid.php
/Wahidhome/Home
26
Database for the Register of Poultry Production in the Dominican Republic.
Gómez, D.R.,1,2 and Ferreira F.1
1Laboratory of Epidemiology and Biostatistics, Department of Preventive Veterinary Medicine and Animal Health, School of Veterinary Medicine and Animal Science, University of São Paulo., 2General Directorate of Livestock, Ministry of Agriculture Dominican Republic. Abstract
The production of data in the poultry sector is very efficient from the individual point of view of each company, due to the intensity and volume of production systems. At the same time the official sectors deserve to implement an agile mechanism to optimize the use of production data in a general and systematic way, so that they can supply the information and at the same time be used as an epidemiological tool. This model of production of statistics is applicable to animal health based on available production data. The applicability of this source of information is directed to studies of the chain of contacts through networks, spatial distribution and models of disease propagation.
Keywords: Poultry register, data base, degree of affiliation, estimate population, poultry statistics.
Base de dados para o Registro da Produção Avícola na República Dominicana.
Resumo
A produção de dados no setor avícola é muito eficiente do ponto de vista individual de cada empresa, devido à intensidade e volume dos sistemas produtivos. Ao mesmo tempo, os setores oficiais merecem programar um mecanismo ágil para aperfeiçoar o uso dos dados produtivos de forma geral e sistemática, para que eles possam fornecer a informação e ao mesmo tempo ser usado como um instrumento epidemiológico. Este modelo de estatísticas é aplicável à saúde animal com base em dados disponíveis da produção. A aplicabilidade desta fonte de informação é direcionada aos estudos da cadeia de contatos por meio de redes, distribuição espacial e modelos de propagação de doenças. Palavras chave: Registro de aves, base de dados, estimativa da população, grau de afiliação, estatísticas de aves.
27
Base de datos para el Registro de la Producción Avícola en la República Dominicana. Resumen La producción de datos en el sector avícola es muy eficiente desde el punto de vista individual de cada empresa, debido a la intensidad y volumen de los sistemas productivos. Al mismo tiempo, los sectores oficiales merecen implementar un mecanismo ágil para optimizar el uso de los datos productivos de manera general y sistemática, para que puedan suministrar la información y al mismo tiempo ser utilizados como herramienta epidemiológica. Estamos presentando un modelo de producción de estadísticas aplicables a la sanidad animal basado en datos disponibles de la producción. La aplicabilidad de esta fuente de información está dirigida a estudios de la cadena de contactos a través de redes, distribución espacial y modelos de propagación de enfermedades. Palabras clave: Registro avícola, base de datos, estimativa de población, grado de afiliación, estadísticas avícolas. Introduction
The Database for the Register of Poultry Production in the Dominican Republic was created as a model of production of statistics applied to animal health. According the Sectorial Statistical Plan -PES- (acronym in Spanish) in the country it is necessary to know the demand of statistical information on the part of the users, with the purpose of attending them, guaranteeing timely and quality information. The production of health information for years has escaped the study of these needs. There is a gap both in demand and in the production of this type of information, which is essential for generating epidemiological models and identifying the health status of the animal population. The animal health law in force in the Dominican Republic, under the authority of the Ministry of Agriculture, declare of public interest the health defense of the cattle, the control and eradication of epizootic diseases, and the prevention of diseases of animals transmissible to man, protecting the source of wealth represented by the national cattle ranch for the production of food of animal origin, and the serious danger posed by the pests of cattle for public health. The large production capacity of the poultry industry in the Dominican Republic demands the availability of information that is in accordance with the requirements of international trade, Therefore we have outline a Statistical Production Model based on the Poultry Production Register which has relevant information to be applied both to the poultry health and to the animal health in general. The model combines the production of statistics in the productive sector, population dynamics of poultry and health information using analysis tools to favor epidemiological studies, and consequently the adoption of timely measures before health and emergency events, as part of the referrals addressed to the Directorate General of Livestock (DIGEGA) of the Ministry of Agriculture of Dominican Republic.
28
Objective
The main objective is to create a categorized and ordered data bank with information on
poultry production that will serve as a statistical production model applied to animal health.
By means of statistical analysis tools secondary objectives will be achieved: identification of
the chain of contacts in local commerce and affiliation between owners, understand the bird
movement, updating of population figures, optimizing surveillance strategies for prevention
and control of diseases in animals.
The model is based on a data structure that links the production chain according to the
owners, the type of production system, the geographical location of farms and population
distribution, the origin and destination of the production chain as well as the health status of
the birds. Other variables such as the name of the responsible veterinarian, hatchery plants,
food plants, target markets and movement routes can be easily associated in the database.
Materials
As a source of information we used the surveys conducted by the DIGEGA through the
Division of Birds Diseases during the period 2011-2013. The form raises information about
the name of the owner or the company, the existing population and the capacity of the farm,
the geographic coordinates and location, and the purpose or type of production. As a source
of comparative data of the population we use the National Register of Agricultural Producers3
(SEA, 1998), document also contained in the Institutional Programming Office (OIP) of
DIGEGA4; the National Census of Light Laying Hens (CONAPROPE, 2011) 5 and the data of
the Broiler Chickens Study (CONAPROPE 2009)6. In addition we use the list of associated
companies that produce grandmothers, hatcheries, incubators, slaughterhouses, chickens
and eggs, from the Dominican Poultry Association (ADA).
Table 1. References of official data
Indicators Values Reference
Official data*
Population 15.198.865
Censo Agropecuario 1998 (SEA , 2000)
Layers population 6.088.617 CONAPROPE (2011)
Installed capacity in hens units 13.471.029 CONAPROPE (2011)
% Of occupation of installed capacity in hens units 66% CONAPROPE (2011)
Relationship of associated companies ADA** *Data published by institutions of the Dominican State ** Data provided from private poultry sector
29
Methods
Registered population data:
The available information was organized and classified according the owner´s name and the
category of the production as registered in the survey. All the geographical coordinates were
registered and verified through satellite images, duplicates and not related information was
excluded; the farms identified as having the highest production system were verified
according to the list of associates. For ease the data base search we include new variables
in complement to the owner name, first we assign an identifier number to each property, then
we assign a unique owner code that allows to identify companies registered as the same
owner, and based on this code we create an individual code for each farm. According to the
number of farms that each owner owns, we classify the farms in another variable
denominated degree of affiliation. In addition to the code of owner and the code of the farms,
the distribution of farms by provinces, municipal districts and municipalities was classified
according the Territorial Code of the National Office of Statistics7 (ONE). Other variables
whose information was not complete at the time of the survey include the population and the
category of production. Data editing was stored and analyzed in an Excel spreadsheet, finally
statistical and graphic analysis was performed in the language and programming
environment R©.
Unregistered population estimated:
Given the lack of relevant information of the population we determined the importance to
represent the population size by means of estimates. The unregistered population was
estimated by calculating the likely population density through the use of satellite tools. From
data available in the survey we use the mean value of a sample of the population (n=20
farms); this number represents farms in which the installed capacity and the capacity used
was identified. Using the coordinates we represent these 20 farms in the satellite image, we
count the number of sheds, measure the area of each shed excluding the eaves area and
represent the number of birds registered in each of these farms distributed into the sheds.
Dividing the amount of m2 of the shed by the number of birds expected we assume a density
of 10 birds/m2 to estimate unregistered population; this is compatible with the characteristics
of the production system of the country in which the sheds are usually built for ten thousand
birds for broiler system in an equivalent area. We assumed the density of the population on
the farm based on chicken production because compared to the census of layers (see table
1) the largest proportion of layers and layers-integrated had been recorded in the survey (see
table 2). According to studies, the occupancy of the installed capacity in laying hens is 66%
(CONAPROPE, 2011). For the calculation of estimated area of the warehouses we use
image tools CNES Astrium/image Digital Globe, Google earth image 2015, US Dept of State
Geographer 2015 Google, Image Landsat 2009 GeoBasis, Image NASA Digital Globe.
Using these tools we estimate the area to define the population in each of the farm without
registration and proceeded to the verification and re-definition of coordinates in some
establishments facilitating the location and measurement of the geographic distance.
The population was classified according to the number of birds by farm or production unit
and according to the number of farms by owner or affiliated company, the population, the
category of the production
30
Table 2. Results of the registration of poultry production *
Indicators Values Reference
Total number of farms or production units 951 DIGEGA (2011-2013), Gómez (2017)
Farms with population register 500 (52.58%) DIGEGA (2011-2013), Gómez (2017)
Farms without population register 451 (47, 42%) DIGEGA (2011-2013), Gómez (2017)
Farms with categorized production** 519 (54, 57%) DIGEGA (2011-2013), Gómez (2017)
Farms without categorized production 432 (45, 43%) DIGEGA (2011-2013), Gómez (2017)
**Farms with categorized production and known population 434 (83, 62%) DIGEGA (2011-2013), Gómez (2017)
**Farms with categorized production and unknown population 85 (16, 37%) DIGEGA (2011-2013), Gómez (2017)
Classification of the Population
Total registered 17.005.669 DIGEGA (2011-2013), Gómez (2017)
Layers and layer-integrated 4. 295.000 (25, 26%) DIGEGA (2011-2013), Gómez (2017)
Broiler 10. 948.235 (64, 38%) DIGEGA (2011-2013), Gómez (2017)
Grandmothers 70.000 (0, 41%) DIGEGA (2011-2013), Gómez (2017)
Heavy breeders 569.000 (3, 35%) DIGEGA (2011-2013), Gómez (2017)
Light breeding 130. 000 (0, 76%) DIGEGA (2011-2013), Gómez (2017)
Not identified the category 993.434 (5, 84%) DIGEGA (2011-2013), Gómez (2017) Classification of the farms with known population according to category
Layer farms 101 (19, 46%) DIGEGA (2011-2013), Gómez (2017)
Broiler farms 319 (61, 46%) DIGEGA (2011-2013), Gómez (2017)
Grandmothers 2 (0, 39%) DIGEGA (2011-2013), Gómez (2017)
Heavy breeders 8 (1, 54%) DIGEGA (2011-2013), Gómez (2017)
Light breeding 2 (0, 39%) DIGEGA (2011-2013), Gómez (2017)
Integrated 3 (0, 58%) DIGEGA (2011-2013), Gómez (2017)
Not identified population 84 (16, 18%) DIGEGA (2011-2013), Gómez (2017)
* Purpose of this study
Results
To represent the model, the analysis of the results was performed using 15 variables of
interest for epidemiological research (not shown). The farms were classified according the
population and according the category of production; the farms were classified by number
according the category of production in the farms with known population.
31
According to the population, from the 951 farms registered, 52.58% (500/951) record a
population of de 17, 005,669 birds; the remaining 47.42% (451/951) does not have a
population register.
According to the category or purpose of production, in 54.57% (519/951) the category was
registered; in the remaining 45.43% (432/951) was not registered. 83.62% of the farms in
which the category of production was registered (434/519) the population was registered. In
the remain 16.37% of the farms (85/519) that register the category, the population was not
registered.
Size of the farms and population
According the number of birds the size of the farms was distributed within a range of 50 to
1,500,000 birds. Small units considered family-owned were included in the survey.
Table 3. Registered population
Size of the farms Number of farms % of farms Population % of population
50-1.000 19 3,8 10.250 0,06
1.001-4.000 80 16 224.100 1,32
4.001-9.000 84 16,8 499.300 2,94
9.001-20.000 129 25,8 1.783.369 10,49
20.001-50.000 111 22,2 3.658.100 21,51
50.001-100.000 50 10 3.657.000 21,5
100.001-240.000 18 3,6 2.843.500 16,72
240.001-1.500.000 9 1,8 4.330.050 25,46
TOTAL 500 100% 17.005.669 100%
Affiliations
We represent a degree of affiliation that represents number of farms registered in the name
of the same owner or company. According to this, 58.99% of the farms (561/951) have
degree 1, which means that it is not affiliated with another; 41.01% (390/951) ranging from 2
to 37 farms by owner, distributed among 108 owners (see table 4). In all the affiliated farms
the name of the owner or company was identified. On non-affiliated farms 9.63% (54/561)
appear without owner registration, 85.19% of which (46/54) population was not registered,
been that only in 14.81% (8/54) population and category was registered.
The proportion of affiliated owners with degree two represent 6.72% (64/951); degree three
1.79% (17/951); degree four 0.95% (9/951); degree five 0.63% (6/951); degree six 0.32
(3/951); degree eight 0.10% (1/951); degree nine 0.10% (1/951); degree 10, 0.31%
(3/951); degree 13, 0.10% (1/951); degree 15, 0.21% (2/951); the largest number of affiliate
records, 37 farms belongs to a single company, it represents 0.10% (1/951).
32
Table 4. Distribution of the affiliation
Degree of affiliation
Number of owners
Number of farms
1 561 561
2 64 128
3 17 51
4 9 36
5 6 30
6 3 18
8 1 8
9 1 9
10 3 30
13 1 13
15 2 30
37 1 37
Range 1-37 669 951
Population estimates
In the farms that had no registered population, the estimate was 13, 670,700 which added to
the population registered at the moment of the survey result in a total estimate of 30,
676,369.
If we compare the data of population reported in 1998 and the population registered in the
survey there is an increase of 111.88%; comparing the total of the population, estimated and
recorded, the increase result in 201.83%.
Comparing the layers recorded and the population of laying hens published by
CONAPROPE, 2011, we can conclude that 70.54% of the layers and layers-integrated were
recorded in the survey. The population for cage production was not considered due to lack
of information. The integrated category includes farms that integrate different systems of
production as breeding and laying, or inclusive grandmothers and hatcheries.
In the projections the different categories of local production were considered, grandmothers,
breeding, broiler chickens, layers and integrated (CONAPROPE, 2009, 2011; DIGEGA,
2011-2013).
According to the size of the population the largest number of farms registers 9,001 to 20,000
birds, followed by the group 20,001 to 50,000 birds. Both groups represent 48% of the
registered population.
33
Table 5. Results of the estimates of the total population
Indicators* Values Reference
Population estimated (not registered) 13.670.700 Gómez ( 2017)
Total population (estimated and registered)
30.676.369 Gómez ( 2017)
Total estimates of Layers 4.653.000 Gómez ( 2017)
Total estimates of chickens 17.139.435 Gómez ( 2017)
Total estimates of heavy breeders 1.350.000 Gómez ( 2017)
Total estimates of light breeding 130.000 Gómez ( 2017)
Distribution of farms and population by province
The largest number of farms is located in the Espaillat province representing 47.84% of the
total followed by the provinces La Vega (15, 88) and Santiago (14, 62). Espaillat also has the
largest registered population followed by La Vega, Santo Domingo San Pedro de Macorís
and Santiago surpassing one million birds. In Elias Piña and Hato Mayor only one small farm
was registered in each province. Therefore, in the order of estimated population varies as
follows, Espaillat, Santo Domingo, La Vega, Santiago and San Pedro de Macorís followed by
other provinces with a lower population.
Figure 1. Map of the Dominican Republic the showing the poultry farms distribution; the red triangles
represent the population registered in a survey and green circles population estimated in this study.
34
Table 6. Distribution of farms and population by province
Province Farms
% of farms Registered population
Total Estimated population
Dajabón 18 1,89 129.000 253.700
Elias Piña 1 0,11 0 2.000
Espaillat 455 47,84 5.930.689 7.598.189
Hato Mayor 1 0,11 0 4.000
Hermanas Mirabal 6 0,63 79.000 79.000
La Vega 151 15,88 2.894.150 6.384.900
Monte Plata 5 0,53 245.000 310.000
Peravia 20 2,10 425.500 468.500
Puerto Plata 14 1,47 59.000 98.600
San Cristóbal 6 0,63 56.000 96.050
San Pedro de Macorís 8 0,84 2.182.000 2.326.000
Santiago 139 14,62 1.171.000 5.115.100
Santiago Rodríguez 54 5,68 619.830 835.830
Santo Domingo 51 5,36 2.770.000 6.650.500
Valverde 22 2,31 444.500 454.000
TOTAL 951 100 17.005.669 30.676.369 *Total estimated population sum registered and estimated population
The province Espaillat concentrates the largest number of farms, followed by La Vega and Santiago. The largest
bird population is recorded in the Espaillat province, followed by the provinces La Vega, Santo Domingo and
San Pedro de Macorís.
Distribution and comparison of population by region
We have compared the results of the different population data in the different regions, the
data of the census of 1998, the data of the 2013 survey registered population and the data
of the estimated population resulting from this study. When compare the population
registered in 2013, represented only in 52.58% of the farms, this proportion exceeded the
population registered in 1998, this is to be expected given the growth of the population over
the years. When compare population by region, in all cases the largest population is located
in the regions North, Central and North central, showing lower values in the central region
according the census of 1998, as well as a considerable increase in the population registered
and estimated in the east and northwest regions. Even though these results cannot be
compared in their entirety, they represent a well-founded basis for gathering information in an
upcoming survey.
35
Table 7. Distribution of the poultry by region
Poultry by region North Northeastern Northwest Norcentral Central South Southeast East Total
Poultry registered 2013* 7.160.689 - 1.193.330 2.973.150 3.496.500 - - 2.182.000 17.005.669
Poultry estimated 2017** 5.651.200 - 350.200 3.490.750 4.028.550 - 2.000 148.000 13.670.700
Poultry total estimates 2017*** 12.811.889 - 1.543.530 6.463.900 7.525.050 - 2.000 2.330.000 30.676.369
Poultry census 1998 5.346.300 64.363 214.647 2.514.607 6.884.610 199 7.078 167.051 15.198.855
* This study
**52.58% of registered farms
*** registered and estimated
Conclusions
The final record yielded a total of 951 farms or commercial or small-scale production units,
and new records could be incorporated. The study had a real population and an estimated
(simulated) population; a quantitative method that validly compares stocks is not applicable.
The results showed that poultry sector produce enough information to be used both for
epidemiological studies and poultry production studies; we propose this model of data base
as a basic tool for the establishment and actualization of the poultry census in the Dominican
Republic and other countries. The analysis of the data led to substantial results, proving to
be a useful platform and easy to apply. Once you have organized the information and
registered the owners and the location of the farms is very easy to complement the rest of
the information. The analysis of the information allowed to correct inaccuracies in the data,
repetitions, duplication of records and geographical location and to complement some lack
information. The comparison of the results of the survey with the existing official information
provided more conclusive data.
The generation of statistics applied to animal health contributes greatly to the expansion of
health programs. The utility of the data allows us to represent a model of poultry movement
network. With this resource it result more easy implement the guidelines for the control of
bird traffic and for represent a model of movement of birds in real time.
We conclude that this model database can be used to apply to different areas while it can be
used in epidemiological studies focused on disease surveillance and control, it can also be
used by different institutions and universities in targeted studies.
36
Acknowledges
The information collected is part of the efforts of the General Directorate of Livestock of the
Ministry of Agriculture of the Dominican Republic, the Division of Bird Diseases and the
Avian Influenza Surveillance Program. The sponsorship of the World Bank (WB), the Pan
American Health Organization (PAHO) and Panaftosa is recognized, so as the Inter-
American Institute of Cooperation for the Agriculture (IICA)* collaboration. We recognize the
support provided by the Dominican poultry producers through the Consejo de Instituciones
Pecuarias Dominicana (IPD)*, being the pillar of this result, all this together with the official
veterinarians and field technicians. The National Council of Livestock Production
(CONAPROPE)* and the Technical Sub-Secretariat of Planning, SEA (MA)* were the
statistical sources of reference for this work.
REFERENCES*
1. República Dominicana, Consejo Nacional de la Producción Pecuaria, Censo Nacional de Gallinas Ponedoras y Reproductoras Livianas, CONAPROPE 2011.
2. República Dominicana, Consejo Nacional de la Producción Pecuaria. Estudio de pollos de Engorde, CONAPROPE 2009. 3. República Dominicana, Dirección General de Ganadería., Oficina Institucional de Programación, referencias del Censo Agropecuario 1998.
4. República Dominicana. G. O. No. 7793, Ley No. 4030, enero 19, 1955,
5. República Dominicana, Ministerio de Agricultura. Memorias de la Dirección General de Ganadería, 2012.
6. República Dominicana, Ministerio de Agricultura. Registro Nacional de Productores Agropecuarios del año 1998, Sub-Secretaría Técnica de Planificación, SEA 2000. 7. República Dominicana, Oficina Nacional de Estadística (ONE). Plan Estadístico Sectorial Agropecuario 2013-2016.
8. República Dominicana, Oficina Nacional de Estadística (ONE). División Territorial 2010.
*Acronyms and references in Spanish.
37
Contact networks in poultry productions systems for surveillance and control of avian diseases
Gómez, D.R.,1,2 Ferreira F.,1 Amaku, M.,1 Grisi-Filho, J.H.H.,1 and Ossada, R. 1
1Laboratory of Epidemiology and Biostatistics, Department of Preventive Veterinary Medicine and Animal Health, School of Veterinary Medicine and Animal Science, University of São Paulo., 2General Directorate of Livestock, Ministry of Agriculture Dominican Republic. Abstract
Understanding the dynamics of infection within a host population is essential for the surveillance and control of diseases. Contact networks are commonly used to represent different human infections. In most animal diseases the mechanism of transmission in the field as well as the infection pathways are well known, however, disease spread through contact networks has not yet been represented in all species of production animals. Understand the dynamic movement of livestock and representing it with networks has contributed to surveillance and control of animal diseases, such as Foot and Mouth Disease. Modern systems of poultry production encompass complex mechanism of interaction between the diverse scales of the population involving many partners in the commerce chain. Given the worldwide importance of poultry industry, the use of networks is crucial to furthering research on the transmission and spread of certain diseases, such as avian influenza. In our description of a poultry network each node represents a farm and edges represent the contact between farms. The diverse correlation and distribution between partners and neighbors generates different individual networks that link together resulting a complex dependent-network. The study contributes to the detailed description of a network in a real poultry population. Keywords: Poultry-network, animal models, Individual-agent models, Dependent-network, Eepidemic.
Redes de contato em sistemas de produção de aves para vigilância e controle de doenças aviárias.
Resumo
Entender a dinâmica da infecção dentro de uma população hospedeira é fundamental para a vigilância e o controle das doenças. As redes de contato são comumente usadas para representar diferentes infecções humanas. Na maioria das doenças animais, o mecanismo de transmissão em campo é bem conhecido, bem como as vias de infecção, mas a propagação através de redes de contacto ainda não foi representada para todas as espécies de animais de produção. Compreender o movimento dinâmico dos animais e representá-lo por redes tem contribuído para a vigilância e controle de doenças animais, como a febre aftosa. Os sistemas modernos de produção avícola implicam um complexo mecanismo de interação entre as diversas escalas da população envolvendo muitos parceiros na cadeia do comércio. Dada à importância mundial da indústria avícola resulta de grande relevância a investigação sobre a transmissão e propagação de certas doenças, como a gripe aviária. Na rede avícola que descrevemos cada nó representa uma fazenda e as arestas representam o contato entre as fazendas. A diversa correlação e distribuição entre parceiros e vizinhos geram diferentes redes individuais que ligadas resultam em uma rede complexa dependente. O estudo contribui para a descrição detalhada de uma rede em uma população real de aves de curral.
38
Palavras chave: Rede de aves, modelos em animais, modelo de agentes individuais, rede
dependente, epidemia.
Introduction
Poultry network have not been yet described
profoundly as an animal-based networks
model. In modeling of human infectious
diseases, many examples have been used to
represent contact between individuals and
partnerships as Random, Spatial, Scale free,
Lattice, Small world and individual-based
network models (Keeling and Rohani 2008;
Vynnycky and White 2010; Newman 2010). In
animals, disease dynamics using individual-
based and explicitly spatial models, were used
in the 2001 foot-and-mouth epidemic in the
United Kingdom, (Keeling et al. 2001b; Morris
et al. 2001), based on the known location of
the farms (Keeling and Rohani, 2008). In
spatial network individuals are probabilistically
connected based upon the distance between
them; the probability is given by a connection
kernel which usually decays with distance such
that connections are predominantly localized
(Danon et al, 2011).
In individual-agent models based on animal
diseases it is of great importance to represent
a realistic situation of the agent, so as in
emergent animal diseases. Some animal
diseases affect many species making the
contact between individuals susceptible and
infected difficult to represent through models.
Usually the transmission route is known, so
that is used to represent the infection time
step. Frequently, the population number and
their distribution in unknown, and there are no
records of contact chain by commerce,
affiliation, movement and dynamics between
farms and/or from farms to markets.
Nickbakhsh et al., (2013), gained insights of
the implications of the dynamics of network
links between premises using empirical data
from a major catching company in England.
They show how particular assumptions for
within-farm dynamics have implications for the
pathogen spread at the population-level
demonstrating the importance of cross-scale
interactions for HPAI in commercial poultry and
on the control measures at the farm level.
Leibler et al., (2010), used company affiliation
and social contacts to estimate risk of avian
influenza transmission between farms. Spatial
factors and locational data of farms were not
explicitly on the model and contact network are
not mentioned. Lockhart et. al., (2010) used
social network analysis to describe the
topology of contacts resulting of a cross-
sectional survey between 58% of the members
of the New Zealand poultry industry
association. They represented the contact
structure created from the movement of feed,
live bird and hatching eggs, table eggs, and
manure and waste litter structure of the
networks.
To represent more realistic epidemic models in
animals in addition to the population itself, it is
important to consider the dynamic of that
specific animal population, including the
location of the farms and the interactions
between farms or at least most of them. We
are describing a network model in a realistic
poultry population which can be applied to an
agent-based model such as Avian Influenza or
Newcastle Disease, and to individual-based
simulations network models (Vinnycky and
White, 2010), since it explains in detail the
network of individuals and their partnerships in
poultry.
Methodology
We performed a comprehensive data analysis
to demonstrate the complexity of the contact
and the interactions in poultry populations. The
poultry network describes different structures
(farms) illustrated in graphs by nodes showing
the different levels of production according
39
their contacts. The model represents the
contact network formed by different structures
in which the principal nodes are connected on
a large scale. The structure gives rise to the
entire production chain involving the complex
production system, from the origin of the
progeny to the end of the chain of production,
including partners, affiliated and neighbors. In
fact, the whole structure is not be described as
we excluded in the commercialization phase,
slaughterhouses, incubators and markets, due
to the lack of this information. Our poultry
network describes exclusively the location and
interaction between poultry farms.
This poultry network model is a dynamic
structure built from the database for the
Register the poultry Production in the
Dominican Republic (Gomez and Ferreira,
2017, unpublished thesis chapter). To create
this network it is necessary to have a well-
organized data structure codified according to
the property, owner and farm. The farms must
be classified according to the geographical
location, category of production and size of the
population. This structure allows for owners
and properties to be linked as commercial
partners, determining the degree of affiliation
between owners or business relationship.
Based on this information we create the array
of contact forming the network between
affiliated farms, and we construct a matrix
model for creating a commercial network of
contacts between possible partners, according
to the production pyramid.
Data was initially stored in a spreadsheet in an
excel database, as a .csv file; analysis was
performed using R language 3.3.2 statistical
platform; igraph library was used in the graphs
layout. We use the packages devtools and
epinemo for quantitative network analysis, and
the software Gephi 0.9.1. Maps were created
with the software QGis, ArcGis and Google
earth map.
The network was represented based on the
total population and the dynamic. We consider
each farm as an epidemiological unit, obviating
the internal dynamics of the unit, since the
birds in each farm are grouped by lots that in
turn are distributed among a certain number of
sheds of different capacity. Daily movements
between birds are not implicit; the network only
identifies relationships between contacts.
According to the activity of the poultry industry
we referred to the contact between poultry
farms, not among the individuals forming the
population. This contact is very important for
understanding the population dynamics and for
identifying transmission rates of highly
contagious diseases of rapid spread in birds.
Partnerships in dynamic networks may change
over time as individuals enter and leave the
population.
Vynnycky and White (2010), refer to the
importance of small world networks for
understanding the rapid spread of infections
through human populations.
Describing the complexity of the poultry
network is likely to provide a more realistic
identification of where to focus efforts to
reduce the risk and spread of infection.
Networks provide a unified way about the
interaction between individuals or populations
(Keeling and Rohani, 2008). A matrix from all
the interaction strengths specifies all the
connection strengths within a network
expected to be sparse with the majority of
values being zero.
Assuming is a measure of the strength of
interaction between populations, ρij measures
the relative strength of transmission to
subpopulation i from subpopulation j
(Keeling and Rohani 2008). Where i
represents the susceptible and j the infectious
individual.
Networks can be represented as graphs
containing vertices or nodes that are
40
represented by points, and edges or links
represented by lines (Vynnycky, 2010).
The network of contacts is specified by a graph matrix G, where G i j is 1 if individuals i and j are connected, or 0 otherwise (Keeling and Rohani, 2008). Directed network or directed graph is a network in which each edge has a direction, pointing from one vertex to another (Newman, 2010).
The network is defined as undirected when G
is symmetric and infection can pass in both
directions across a contact (Keeling and
Rohani, 2008).
A graph can be formed by different values (n)
of vertices and edges so it may have self
edges, single edges, multi edges and both. A
network with multi edges is called a multi graph
(Newman, 2010).
The degree of a vertex in a network is the
number of vertex attached to it. In undirected
networks, degree is just a single number. In
directed networks on the other hand, vertices
have two different degrees, in-degree and out-
degree equivalent to the number of edges
pointing inward to and outward from those
vertices (Newman, 2010).
Poultry Network structure
In poultry networks each node represents a
farm and the edges represent the contact
between them. Production farms are
composed by houses, and houses in turn have
different populations of birds. Despite the
population distribution we are assuming each
farm as a node. So, each node will be
composed by different number of individuals,
and inclusive, different levels of production
which represent a complex scheme in the
transmission network, based on the etiological
agent. We represented the contact network
based on the type of contact or interaction
between farms. Therefore, a node will have as
many edges as it has contact with other nodes.
According to the graph definition, the links between poultry farms are directed, if the contact between two nodes though the edges occurs only in one direction, and undirected, if the contact between two nodes through the edges occurs in both directions. The type of contact in the network depends on the distribution of the production system, the direction of movements between the different categories of birds from one farm (node) to another, and the degree of affiliation between companies of the same owner. In addition, spatial networks represent neighboring farms that share a common boundary and those that form a cluster; in the poultry network these represent a big cluster based on the density, location and distance between the farms.
According the scale of interaction between
farms we describe three principal structures of
contact in the poultry network: A) Breeding or
genetic farms; B) production farms C) Affiliated
farms.
A) The poultry network is based initially on the
pyramid structure that begins with the
breeding lines. In some developed countries,
the structure of poultry production begins with
the great-grandparent lines and is formed by
two lines, laying-hens and broilers, that give
rise the respective grandparent lines. Our
model starts representing the structure of
broiler grandparent line. The laying
grandparent lines are not represented in the
network because in the country actually there
are no these farms since their origin is
importation. We will describe the three
principal contact structures that involve
breeder farms, which form a direct contact
chain in the pyramid of production, and we use
the terms from-to to refer in to the origin and
course of the contact in these networks:
1. First structure: contact from grandparents
to breeders:
The contact from grandparent farms to
breeding farms involves a big number of
41
partners. Hatcheries are in the middle of this
contact chain. Fertile grandmother-layed eggs
go into incubators, and once they hatch, day-
old chicks are distributed to the different
breeding farms. In most cases, hatcheries are
a separate structure from the grandparent
farms, in some cases they are part of the same
epidemiological unit, which is not
recommended by animal health standards.
Due the complexity of the network, we should
consider hatcheries as part of the network, as
a string contact. Hatcheries could be excluded
in models in which transmission comes from
progeny and not from the hatchery as a
structure in itself; they can be included in risk
models when the origin and destination are
known. The biosecurity and disinfection
measures applied to the eggs during the
incubation process minimize the risk of
transmission of infections. We assume that the
network contact from grandparents to breeding
broiler occurs as direct contact. The
intermediation of incubators is omitted due to
lack on the actual flow between them.
2. Second structure, from breeding (broilers
and laying) to production farms:
a) There is a directed contact from breeding
broiler to chicken farms.
b) There is a directed contact from breeding
laying hens to laying hens.
In these structures hatcheries are also involved
in the contact chain, and may or may not be
included in the contact network.
In these two structures we represent the
contact in the network as directed occurring
movements in a single direction.
3. Third structure, integrated farms in which
breeders are produced in the same area or unit
with other productive categories, for example:
broiler breeders and/or broiler production;
laying-hens breeders and layers; broiler
breeders and laying-hens breeders; broiler
breeders, laying-hens breeders and layers. In
this structure contact can occur from
integrated-to-integrated, from integrated to
broilers and/or from integrated to layers. Due
to the complexity of this structure many cases
these farms often end up forming undirected
networks.
B) The poultry network finally converge in the
structure composed by the production or
commercial farms, made up by the chicken
farms, laying farms, or farms that combine
these two categories. They are involved in the
production of chicken and eggs, and may or
may not be affiliated; they can also represent
self edges, multiedges or both.
C) Affiliated farms representing any A or B
structure that have a degree of interaction
between them. They are characterized by the
fact that the activity occurs specifically
between farms of the same owner with a range
or degree of affiliation greater than two units.
According the type of structure, the contact
between these farms can be represented as a
directed or undirected graph. To represent
contact by affiliation we assume to use the
undirected graph and assign an exponential
Gaussian kernel corresponding to the distance
between the farms.
If the contact occurs by affiliation, the network
can be undirected or directed depending on
the type of productive system and movements
between farms.
The contact with neighbors is determined in A,
B or C by a distance matrix which will depend
on the distance allocated. Clusters are
commonly observed in the nearest neighbors.
The probability of contact between neighbors is
the same; therefore the graph is represented
as undirected.
Adjacency matrix in poultry network
In the poultry network model, the adjacency
matrix is 1 if there is an edge between vertices
i and j, and 0 otherwise. This is true whether
42
the contact happens by affiliation or through
the productive chain.
Neighboring
The contact between neighboring farms is
represented by a distance matrix;
represents the distance between the
susceptible individual i and the infectious
individual j (not shown).
Model of sparse Matrix class “ngCMatrix” resulting from the distribution of non-affiliated and affiliated farms. Single farms appear on the diagonal; affiliation degree two, four and five are shown in the matrix. Diagonal “zero” is observed in affiliation contact (in R language).
Results and discussion
The results show the structure of the poultry
network, and the type of contact between the
different categories that integrate the
productive pyramid; first we describe the
structure of grandparents and breeders which
represent the origins of the progeny, the
principal nodes. We describe their contact
relationship, edges, with the production farms,
the particular integrated system and the
combined system of both. In addition we
involved the productive categories, commercial
layers and chickens, and conclude describing
the affiliation existing between all of them,
representing multi edges. Contact network can
occur in two ways, affiliation or neighboring.
Our results permit us describe the different
networks that make up this complex network
which although it has a small number of nodes,
can be represented in a large number of
contacts:
The poultry network is formed by 951 nodes
represented by the same number of farms,
different forms of contact occur between them,
resulting in a complex network that we
describe in three models:
1) A Spatial network, represented by the
contiguous or neighboring 951 farms that
share common boundary and those which form
a cluster. In spatial networks, a kernel is often
used to calculate the probability of two
individuals being connected depending on the
distance between them (Watts 1999; Read and
Keeling 2003; Keeling 2005a).
2) A Scale-Free network, represented by the
contact between farms that belong to the same
owner according the affiliation. Scale-Free
networks connect individuals with a probability
that is directly proportional to their current
number of partners, distributing according to a
power law (Vynnycky and White 2010).
3) In general we describe the poultry network
as an animal-based network model that we
denominate DEPENDANT NETWORK MODEL
as it depends on the type of contact between
partners. This network represents the
complexity of contacts existing in the poultry
systems. There is a group of individuals that
form a unique population as an internal
condition of each farm with an internal and
particular dynamic between them. Some of
these farms can form clusters or be linked as
neighbors with spatial dependence, and there
may be interactions between farms of the
same owner; likewise, among all of them exist
a general contact by trade relationships.
Throughout the structure, a contact dynamic
converges constantly. This is a simple way to
understand the complex structure of the poultry
network.
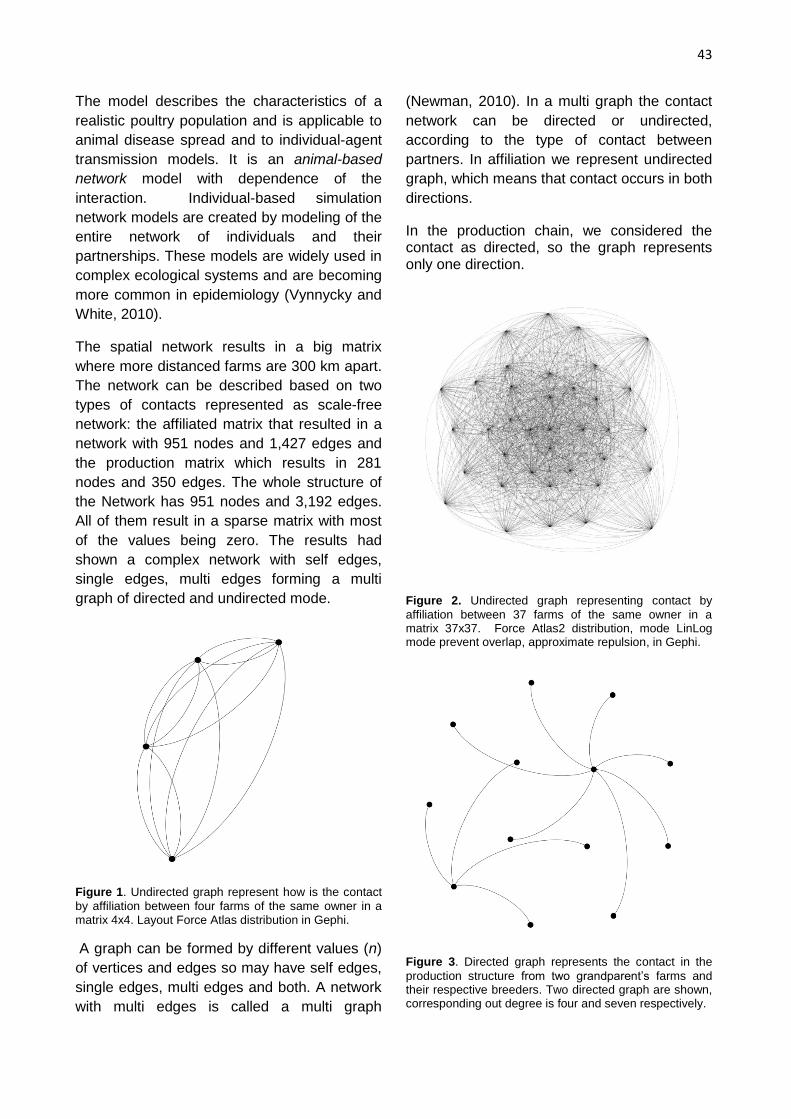
43
The model describes the characteristics of a
realistic poultry population and is applicable to
animal disease spread and to individual-agent
transmission models. It is an animal-based
network model with dependence of the
interaction. Individual-based simulation
network models are created by modeling of the
entire network of individuals and their
partnerships. These models are widely used in
complex ecological systems and are becoming
more common in epidemiology (Vynnycky and
White, 2010).
The spatial network results in a big matrix
where more distanced farms are 300 km apart.
The network can be described based on two
types of contacts represented as scale-free
network: the affiliated matrix that resulted in a
network with 951 nodes and 1,427 edges and
the production matrix which results in 281
nodes and 350 edges. The whole structure of
the Network has 951 nodes and 3,192 edges.
All of them result in a sparse matrix with most
of the values being zero. The results had
shown a complex network with self edges,
single edges, multi edges forming a multi
graph of directed and undirected mode.
Figure 1. Undirected graph represent how is the contact
by affiliation between four farms of the same owner in a matrix 4x4. Layout Force Atlas distribution in Gephi.
A graph can be formed by different values (n)
of vertices and edges so may have self edges,
single edges, multi edges and both. A network
with multi edges is called a multi graph
(Newman, 2010). In a multi graph the contact
network can be directed or undirected,
according to the type of contact between
partners. In affiliation we represent undirected
graph, which means that contact occurs in both
directions.
In the production chain, we considered the contact as directed, so the graph represents only one direction.
Figure 2. Undirected graph representing contact by
affiliation between 37 farms of the same owner in a matrix 37x37. Force Atlas2 distribution, mode LinLog mode prevent overlap, approximate repulsion, in Gephi.
Figure 3. Directed graph represents the contact in the
production structure from two grandparent’s farms and their respective breeders. Two directed graph are shown, corresponding out degree is four and seven respectively.
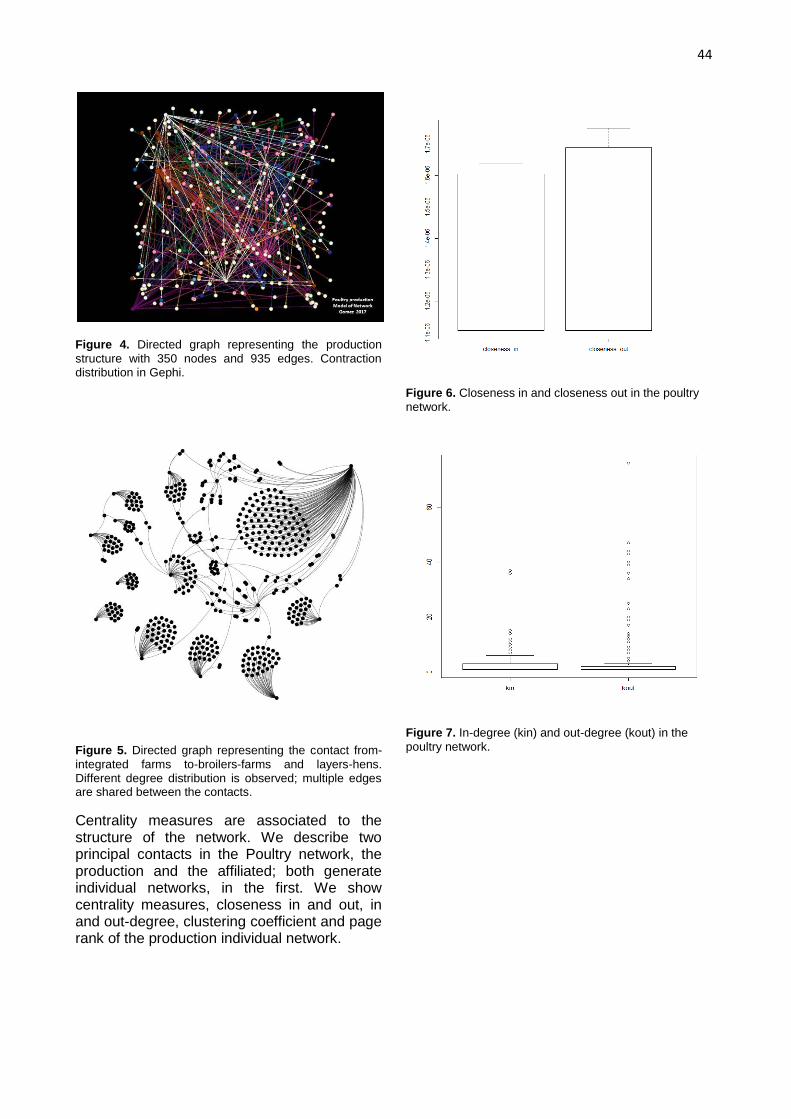
44
Figure 4. Directed graph representing the production
structure with 350 nodes and 935 edges. Contraction distribution in Gephi.
Figure 5. Directed graph representing the contact from-
integrated farms to-broilers-farms and layers-hens. Different degree distribution is observed; multiple edges are shared between the contacts.
Centrality measures are associated to the structure of the network. We describe two principal contacts in the Poultry network, the production and the affiliated; both generate individual networks, in the first. We show centrality measures, closeness in and out, in and out-degree, clustering coefficient and page rank of the production individual network.
Figure 6. Closeness in and closeness out in the poultry
network.
Figure 7. In-degree (kin) and out-degree (kout) in the
poultry network.
45
Figure 8. Clustering coefficient in the poultry network
In degree an out degree helps to understand the relation between degree of entrance and degree of exit in each property representing the contact between partners in the production network. In figure 11 a small number of farms send birds to a big number of farms. The contact represents the breeders to the production system.
Figure 9. Pagerank in the poultry network.
The pagerank is an adjustment of the centrality according to the number of links.
For representing distribution of the population the Pareto principle can be calculated. For demonstrating we compare the distribution in each network, the production and the poultry network.
Figure 10. In the production structure 100% of the birds
sold by the breeders are proportionally distributed in the total of the production according the Pareto principle.
Figure 11. Average degree of neighbors in the poultry
network.
46
Another way to evaluate assortativity is to
calculate the average of the average degree of
neighbors for each grade category.
Conclusions
The main characteristic of the poultry network
is the design of the contact matrix. The
complexity of productive and commercial
activities between farms was explicitly
demonstrated in the graphs. We consider this
to be the first detailed description of a poultry
network in a real population. Other animal
networks have been described without
emphasizing the construction of the data
structure. This network describes interactions
that are not described in other ecological
works. We recommend that future studies
include incubators as an important point of
transmission between the breeders and
production birds. Slaughterhouses and
markets could also be an important reference
for studies of animal and human transmissible
diseases.
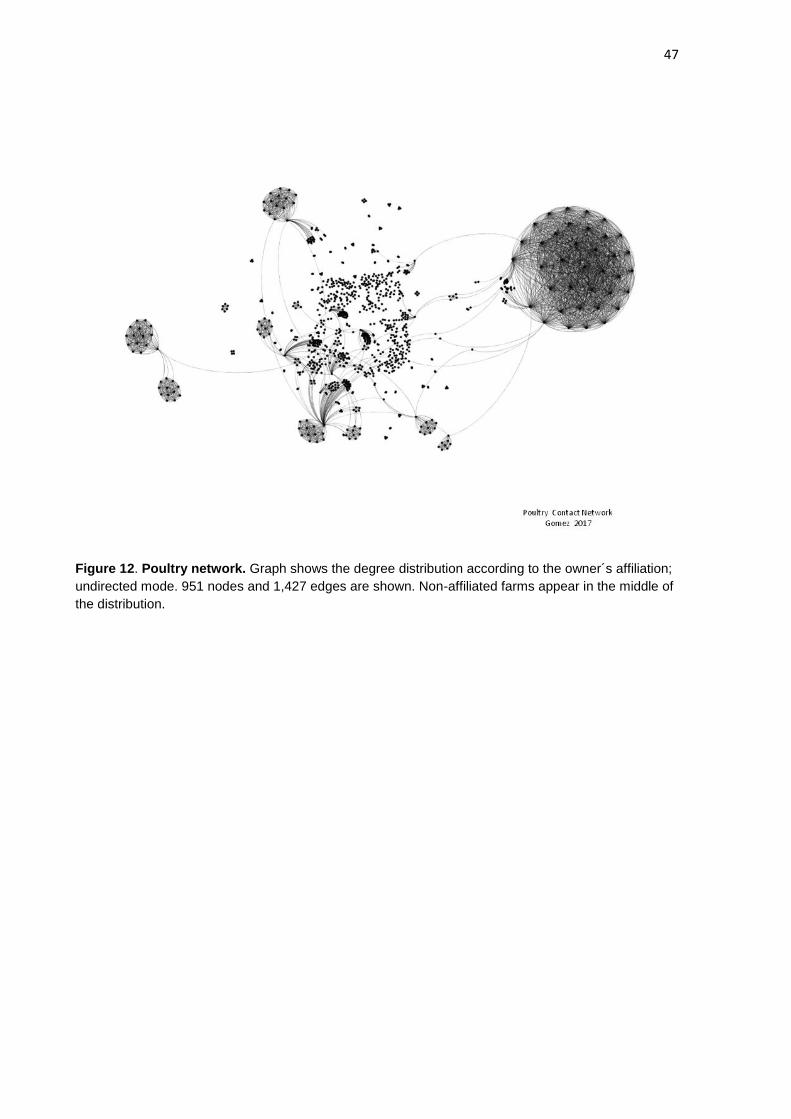
47
Figure 12. Poultry network. Graph shows the degree distribution according to the owner´s affiliation;
undirected mode. 951 nodes and 1,427 edges are shown. Non-affiliated farms appear in the middle of
the distribution.
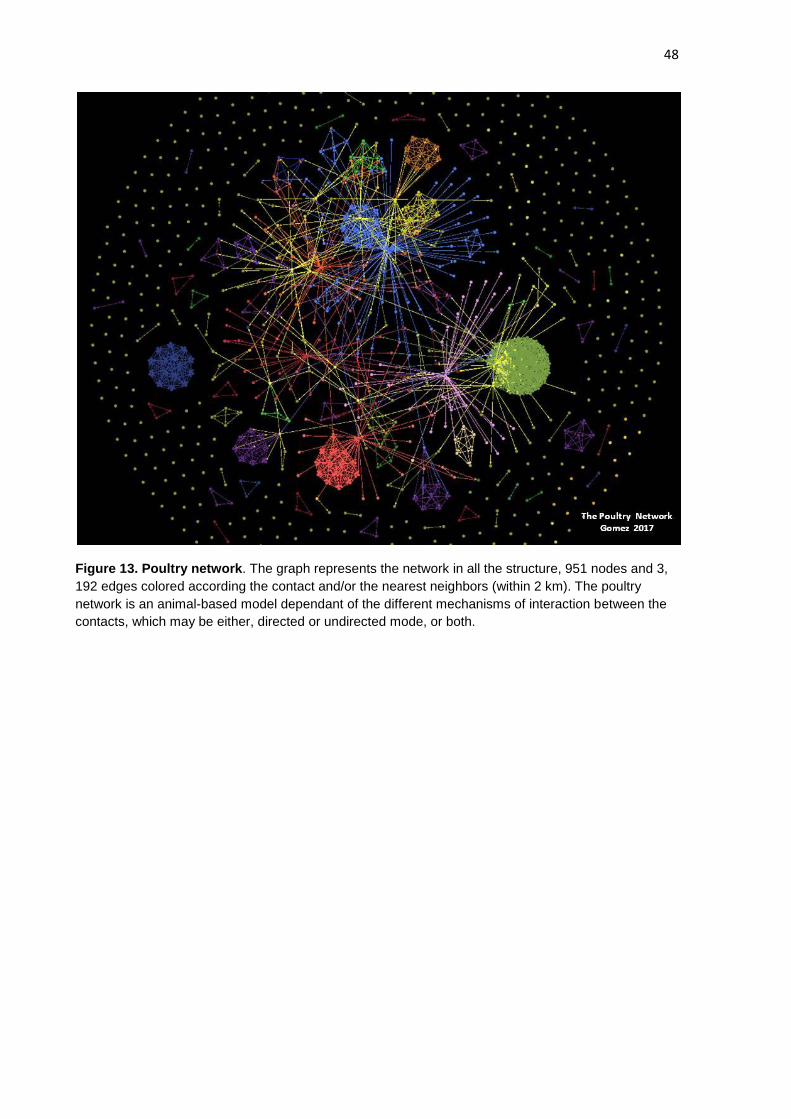
48
Figure 13. Poultry network. The graph represents the network in all the structure, 951 nodes and 3,
192 edges colored according the contact and/or the nearest neighbors (within 2 km). The poultry
network is an animal-based model dependant of the different mechanisms of interaction between the
contacts, which may be either, directed or undirected mode, or both.
49
Figure 14. Map of the Dominican Republic representing the poultry network structure. Blue points and
lines represents nodes and edges of the owner´s affiliation; orange points represents the nodes of
origins of genetic lines, grandparents and breeding farms; orange lines represent the contact from
breeders farms to the production chain; yellow points represent the destination of breeders.
50
Figure 15. Map showing a visualization of the network in the province Espaillat, the greater in
population.
Figure 16. Google earth image showing a visualization of the network in the provinces Espaillat and
Santiago.
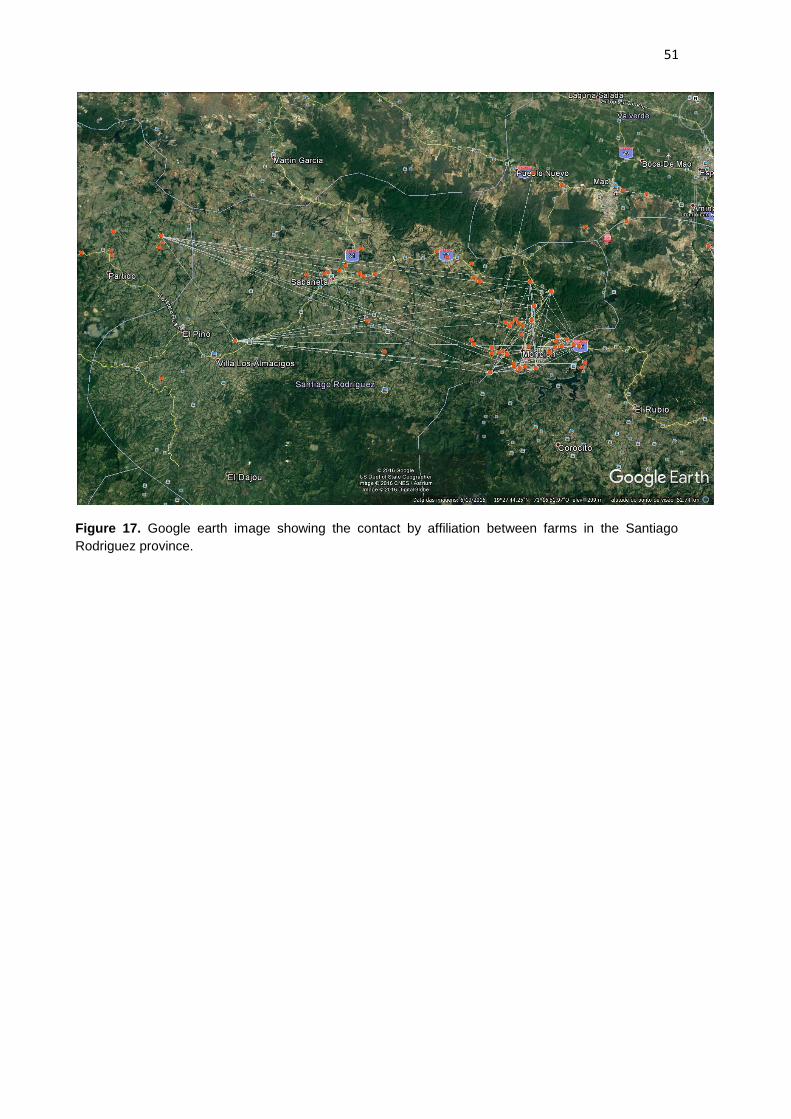
51
Figure 17. Google earth image showing the contact by affiliation between farms in the Santiago
Rodriguez province.
52
REFERENCES
Danon, L., Ford, a. p., House, T., Jewell, C.P., Keeling, M. J., Roberts, G. O., Ross, J. V. and Vernon, M. C. 2011. Networks and the Epidemiology of Infectious Disease. Hindawi Publishing Corporation Interdisciplinary Perspectives on Infectious Diseases. doi:10.1155/2011/284909. Keeling and Rohani, 2008. Modeling Infectious Diseases in Human and Animals, Princeton University Press.
Keeling, M. J. et al. 2001 Dynamics of the 2001 UK foot and mouth epidemic: stochastic dispersal in a heterogeneous landscape. Science 294, 813–817.
Leibler, J. H., Carone, M., Silbergeld, E. K., 2010. Contribution of Company Affiliation and Social Contacts to Risk Estimates of Between-Farm Transmission of Avian Influenza. Plos ONE www.plosone.org march1020, vol. 5.issue 3, e9888.
Lockhart, C.Y., Stevenson, M.A., Rawdon, T.G., Gerber, N., French, N.P., Patterns of contact. Preventive Veterinary Medicine 995 (2010)258-266. www.elsevier.com/locate/prevetmed.
Morris, R. S., Wilesmith, J. W., Stern, M. W., Sanson, R. L. & Stevenson, M. A. 2001 Predictive spatial modelling of alternative control strategies for the foot-
and-mouth disease epidemic in Great Britain, 2001. Vet. Rec. 149, 137–145.
Newman, M. E. J., 2010. Networks An Introduction. University of Michigan and Santa Fe Institute. Oxford University Press.
Nickbakhsh, S., Mattheus, L., Dent, J. E., Innocent, G. T., Arnold, M. E., Reid, S. W. J., Kao, R. R., 2013. Implications of within-farm transmission for network dynamics: Consequences for the spread of avian influenza, Epidemics. http://dx.doi.org/10.1016/j.epidem.2013.03.001
R Development Core Team, 2010. R: A Language and Environment for Statistical Computing. http://www.r-project.org Vynnycky, E. and White R.G, 2010. An introduction to Infectious Disease Modeling, Oxford University Press.
Internet resource:
Google earth image 2015, CNES Astrium/image Digital Globe.
53
Propagation Models of high and low pathogenic Avian Influenza in poultry operations in the Dominican Republic.
Gómez, D.R.,1,2 Amaku, M.,1 Grisi-Filho, J.H.H.,1 Ferreira Neto, J.S., 1 and Ferreira F.1 1Laboratory of Epidemiology and Biostatistics, Department of Preventive Veterinary Medicine and Animal Health, School of Veterinary Medicine and Animal Science, University of São Paulo., 2General Directorate of Livestock, Ministry of Agriculture Dominican Republic.
Abstract
Different subtypes of avian influenza (AI) virus have been circulating in many countries around the world in their pathogenic and non-pathogenic forms. In North America, H5N2 subtypes, emerging from low pathogenic strains have caused important outbreaks in poultry in Canada, United States and Mexico. Strains of low pathogenicity have been reported to cause clinical or sub-clinical signs in birds through the Americas. In 2007 the Dominican Republic reported sub clinical infection with H5N2. More recently the H5 outbreaks in the United States caused by a Eurasian-North American reassortant have led neighboring to establish mechanisms to improve surveillance in poultry and wild birds. Developing a model in a dynamic population is the best way to represent the complex phenomenon of influenza virus spread. By setting up a stochastic SIR model we estimated within-flock transmission in different sizes and levels of the population. We modeled transmission between premises based on a network structure considering the realistic contact between poultry farms and the interaction between different production sectors and owners. We used transmission parameters of experimental infection with low (LP) and high pathogenicity (HP) AI North American lineage H5N2 for modeling propagation. These results represent viral propagation of 6 LPAI and 6 HPAI scenarios through a poultry contact network without the implementation of control strategies for during 100 days. In both LPAI and HPAI scenarios the epidemics peaks at approximately 34 days infecting about 700 farms. Both stages of infection result in large outbreaks in very short time.
Keywords: Avian Influenza, propagation, SIR, transmission, dependent-network model.
Modelos de propagação da gripe aviária em operações de frangos em República Dominicana
Resumo
Diferentes subtipos de vírus de influenza aviária (IA) têm circulado por vários países do mundo em suas formas patogênicas e não patogênicas. Na América do Norte, subtipos H5N2 emergentes de estirpes de baixa patogenicidade têm causado surtos importantes em aves de curral no Canadá, Estados Unidos e México. Muitos outros países nas Américas relataram vírus não patogênicos com sinais clínicos ou subclínicas. República Dominicana em 2007 relatou infecção subclínica por causa de H5N2. Mais recentemente surtos nos Estados Unidos por causa de vírus H5 recombinante linhagem Eurasiática-Norte Americana levou aos de países da região para estabelecer mecanismos para melhorar a vigilância nas aves de produção e selvagens. Desenvolver um modelo em uma população dinâmica é a melhor maneira de representar o complexo fenômeno da propagação do vírus da gripe. Através da criação de um modelo estocástico SIR estimamos transmissão intra-rebanho em diferentes tamanhos e níveis da população. Com base em uma estrutura de rede modelamos a transmissão entre as instalações de aves considerando o contato real entre fazendas e segundo a interação entre diferentes setores da produção e proprietários. Utilizamos parâmetros de transmissão de infecção experimental de vírus BP e AP H5N2 linhagem norte-americana para modelagem da propagação. Os resultados representam a propagação em seis cenários de baixa e seis de alta patogenicidade infetados durante 100 dias através de uma rede de contato de aves sem programar estratégias de controle. Em ambos os cenários a epidemia atinge picos no dia 34 aproximadamente infectando cerca de 700 fazendas. Ambos os estágios da infecção resultaram em grandes surtos em tempo muito curto.
Palavras chave: Gripe aviária, propagação, SIR, transmissão, modelo dependente de rede.
54
INTRODUCTION
Low pathogenic (LP) and highly
pathogenic avian influenza virus (HPAIv)
strains of the H5N2 subtype have been
reported in poultry in the Americas for over
30 years. Some LP strains have been
found to cause sub-clinical signs in poultry
populations, such as the H5N2 virus
isolated in the Dominican Republic in 2007
(OIE). Over the years the odds of
propagation in the poultry industry have
being studied in many countries. Due to
the impact of H5 LPAIV on trade and the
risk for poultry farming, it is crucial to
identify the phylogeny of the virus and
follow preventative measures. Early
detection of subclinical infection with
LPAIV is challenging in poultry
populations. Field morbidity and mortality
rates are important to simulate models of
transmission however they are not readily
available due to lapses in time between
outbreaks or due to lack of information.
Recent outbreaks can offer robust
information, if data is available. Currently,
the most effective method for recognizing
detection of the first occurrence of AIV
infection within a flock is periodic
laboratory testing on the flock, and
immediate testing of ill and dead birds
(Spickler et al. 2008). Compared to
HAPIV, LPAI viruses are considered to be
of lower risk because they are associated
with limited mortality in poultry, but they
may be of risk to humans. Their circulation
in poultry flocks provides a setting for viral
evolution and human exposure (Leibler et
al. 2010). The spread of avian influenza
intra-campus was more often of interest in
modeling studies (Bos et al, 2007, 2009,
2010; Savill et al, 2006b, 2008; Tiensin et
al, 2007).
One of the most important benefits of
models is their ability to analyze complex
subjects. These models then become a
logical structure of the real world
(Vynnycky and White 2010). The number
of mathematical models to predict the
epidemic dynamics is increasing (Keeling
and Rohani 2008).
The objective of the present study is
model propagation of AIV in the poultry
population of the Dominican Republic
using transmission parameters from low
and high pathogenic H5N2 viruses of
North American lineage. Modeling
different stages of infection reveals how
AIV infection can spread within the
population during the first 100 days
without implementing control measures.
MATERIALS AND METHODS
We use data from the Poultry Producers
Register on Dominican Republic (PPR-
DR)* (Unofficial acronym), a Statistical
model of the Avian Diseases Surveillance
Program (ADSP) of the Ministry of
Agriculture (Gomez and Ferreira, 2017, in
course). The data represent the poultry
farms registered in the country, linked
through geographical positioning, owners,
companies, and commerce interactions.
We modeled propagation of infection
between 951 premises with different scale
and types of production through a contact
matrix that represents the connections
within the Poultry Network (Gomez et al,
2017). Two matrixes were used: a
distance matrix and an affiliation matrix.
The distance matrix has a dimension of
951 rows per 951 columns and each cell
stores the geodesic distance between the
properties. The affiliation matrix is a
sparse array of the same size, storing
value 1 in the properties that are in contact
because they belong to the same owner.
Model: The built model considers intra-
property and inter-property transmission.
The population within each property was
divided in three categories: susceptible
(S), infected and infectious (I) and
recovered (R). Disease transmission
55
between susceptible and infected occurs
at a rate of βI / N, where N represents the
total population (N = S + I + R). Once
infected, the individual can die of the
disease at a rate α or recover at a rate δ.
The possibility of loss of immunity was not
considered because the simulations were
performed for periods of 100 days. All
individuals are subject to a natural
mortality rate at the end of the cycle equal
to μ and are replaced by susceptible at
rate . Two different values of μ and for
chickens and reproduction/laying
properties were considered according to
table 1.
The equations below represent the
dynamics of the disease within each
property.
The values of the parameters used are
shown in table 1. The disease dynamics
was simulated using the Gillespie
Stochastic Simulation Algorithm performed
with R language 3.3.2 statistical platform,
we use the packages rgdal, sp, foreach,
Matrix, doMC, ggplot, maptools, rgeos,
geosphere and GillespieSSA.
Transmission between properties was
considered possible by two mechanisms:
(1) due to spatial proximity and (2)
resulting from contacts at greater
distances between properties of the same
owner due to the sharing of inputs, labor,
vehicles, or other.
Spatial proximity transmission was
allowed for distances shorter than two
kilometers. It was considered that the
probability of transmission would drop
exponentially, reaching a negligible
probability, arbitrarily set at 0.00001, for
infected properties 2 km away from
uninfected property. Equation (1) presents
the probability of transmission as a
function of distance (x) in km.
(1)
Thus, each day infected properties were
identified within a 2 km radius of each
susceptible property, and a random
numbering was drawn between zero and
one. If the number drawn was less than or
equal to the transmission probability for
the distance between the properties, the
transmission would occur generating
infection of 10 animals in the susceptible
property (this number was chosen
arbitrarily).
The second mechanism of transmission
between properties states that properties
belonging to the same owner could
contact every 10 days indirectly by trucks,
labor, supply of inputs, etc. Such contact
could result in infection at distances of up
to 200 km. Again, an exponential decay
function was used to estimate the
probability of infection of each contact as a
function of distance. In this case, the
probability of transmission was considered
negligible (0.00001) for contacts between
properties distant 200km. Equation 2
presents this function:
(2)
Six scenarios different scenarios were
simulated twice each, once for HPAIV
infection and once for LPAIV infection.
Twelve simulations were performed total,
56
seven times each. The six scenarios
differed in the property initially infected.
The initial condition was selected with a
different criterion according to the
population, category of production, density
and degree of affiliation between farms.
The infection started in four different
properties, in which ten birds were initially
infected. The rest of the 951 properties
were susceptible individuals; in each
property the population size was obtained
from the Dominican Republic database.
Scenarios criteria:
1. Small farms or backyard: farms with population sizes of less than 100 birds located in provinces with high farms density.
2. Greater farms: With a population size greater than 240,000 birds, different degree of affiliation considering the smallest and the largest range and belongs to different owner.
3. Single units: Farms not affiliated with other farms, with population between sizes between 20,000 and 240,000 and known type of production; we excluded breeders.
4. Affiliated units: Farms from owners with a degree of affiliation equal to two (2), population size less than 20,000, known purpose of production and belonging to different owners.
5. Genetic line: Included grandmothers, breeder-layer and breeder broiler, belonging to different owners.
6. Density zone: We select the province with greater density of farms, and farms with lower degree of affiliation and low population.
Each one was simulated for high and low pathogenic, which result in 12 scenarios.
RESULTS AND CONCLUSIONS
This study characterizes one of the most
thorough network models of AIV to spread
in a realistic poultry population. Figure 1
represents the 12 scenarios; HPAI
infection in scenarios 1 to 6 and LPAI
infection in scenarios 7 to 12.
In the HPAI scenarios, the epidemic curve
is similar in scenarios 1, 2 and 6, with an
increase of infection in days 6 to 10
resulting in proximately 100 farms infected
in scenarios 1 and 6. Then the spread
keeps increasing until 19 to 21 days with
200 farms infected and at day 25 the
number of infected farms is up to 500. The
epidemic reaches its peak approximately
at day 34 infecting almost 700 farms and
decreases at day 100, remaining at about
600 infected farms. The epidemic curve of
the second scenario shows a different
behavior at the beginning, the first ten
days the epidemic is maintained in about
15 farms and thereafter propagates in the
same way as in scenarios 1 and 6. The
initial infected farms in scenarios 1 and 6
were farms with lowest population and or
low degree of affiliation; in scenario 2,
which correspond to largest farms, the
infection remains in those units for the first
10 days before spreading. In scenario 4
the epidemic propagates similar to
scenarios 1 and 6 with certain variations
between 12 to 21 days during which it
infects 350 farms. Initially infected farms
were farms with population below 20,000
birds. In scenarios 3 and 5 the epidemic
curves have a different initial distribution
among infected farms propagating from
day 10 to 38 in the scenario 3 and through
day 60 in the scenario 5. In all HPAIV
scenarios the epidemic reaches its peak,
then decrease.
In LPAIV scenarios the epidemic shows a
similar distribution curve, however the
epidemic is sustained over time after
reaching the peak. The number of initial
infected farms in both scenarios suggests
similar spread conditions.
57
The number of infected and dead birds are
different when we considering viruses of
high and low pathogenicity. It is important
to highlight that birds infected with HPAIV’
die, and as a consequence, the epidemic
curve declines. The peak of the epidemic
is observed about 38 days, extending to
day 50 in stage 3 and day 65 in stage 5.
The LPAIV epidemic curve remains steady
with a slight increase, suggesting that the
virus continues to propagate slowly
throughout populations. None of the two
scenarios contemplated control measures
during the 100 days.
The model uses arbitrary estimates for
some parameters due to the absence of
data in the literature. Despite this
limitation, the model has great potential to
assist in the study of disease dynamics
and the effect of control strategies,
highlighting the effect of long-distance
transmission.
Proper registration and documentation are
becoming increasingly frequent in this
disease. This will allow a more accurate
and precise calculation of the parameters
and thereby improved the accuracy of the
model. There is still a great need for
improvement in the quality of records of
animal populations and records of bird
movements in the Dominican Republic.
We modeled different scenarios of
propagation of low and high pathogenic
avian influenza in the poultry population of
the Dominican Republic. We use
transmission parameters from LP and HP
H5N2 viruses of North American lineage,
according to the origins the LPAI
Dominican strain (Gomez, Brandão and
Ferreira, 2017, unpublished). Our data
shows that infection with both LPAIV and
HPAIV H5N2 can lead large scale
outbreaks in a very short time and remain
within poultry population without rapid
control measures implemented.
The model has the potential to represent
influenza epidemics in the Dominican
Republic and in other countries and may
represent an important tool to assist in the
structuring of surveillance and control
strategies for the disease.
REFERENCES
Alexander, D.J., Parsons, G., Manvell, R.J.,
1986. Experimental assessment of the
pathogenicity of eight
avian influenza A viruses of H5 subtype for
chickens, turkeys, ducks and quail. Avian
Pathol. 15, 647–662.
Bos, M. E. H., Nielen, M., Koch, G., Bouma,
A., de Jong, M. C. M., Stegeman, A., 2009.
Back calculation method shows that within-
flock transmission of highly pathogenic avian
influenza (H7N7) virus in the Netherlands is
not influenced by housing risk factors. Prev.
Vet. Med. 88, 278–285.
Bos, M. E. H., Nielen, M., Toson, M., Comin,
A., Marangon, S., Busani, L., 2010. Within-
flock transmission of H7N1 highly pathogenic
avian influenza virus in turkeys during the
Italian epidemic in 1999-2000. Prev. Vet. Med.
95, 297–300.
Bos, M. E. H., van Boven, M., Nielen, M.,
Bouma, A., Elbers, A. R. W., Nodelijk, G.,
Koch, G., Stegeman, A., de Jong, M. C. M.,
2007. Estimating the day of highly pathogenic
avian influenza (H7N7) virus introduction into a
poultry flock based on mortality data. Vet. Res.
38, 493–504.
Gomez and Ferreira, 2017 MODEL OF
PRODUCTION OF STATISTICS APPLIED TO
ANIMAL HEALTH: Database for the Register
of Poultry Production in the Dominican
Republic, unpublished.
Gomez, Brandão and Ferreira, 2017, Origins
of the A/Chicken/Domin.Rep/2397-7/08 H5N2,
a low pathogenic avian influenza virus from the
Dominican Republic, unpublished, thesis
chapter.
58
Keeling, M. J. and Rohani P. Modeling
Infectious Diseases in Humans and Animals,
Princeton University Press (2007).
Leibler, J. H., Carone, M., Silbergeld, E. K.,
2010. Contribution of Company Affiliation and
Social Contacts to Risk Estimates Between-
Farm Transmission of Avian Influenza. Plos
One, Vol. 5 Issue 3 e9888.
R Development Core Team, 2010. R: A Language and Environment for Statistical Computing. http://www.r-project.org
Savill, N.J., St Rose, S.G., Woolhouse, M.E.J.,
2008. Detection of mortality clusters
associated with highly pathogenic avian
influenza in poultry: a theoretical analysis. J.
R. Soc. Interface5, 1409–1419.
Spickler, A. R., Trampel D. W., Roth J. A.,
2008. The onset of virus shedding and clinical
signs in chickens infected with high-
pathogenicity and low-pathogenicity avian
influenza viruses. Avian Pathology (December
2008) 37(6), 555-577.
Swayne, D.E. 1997. Pathobiology of H5N2
Mexican Avian Influenza virus infection of
chickens. Veterinary Pathology (November
1997) 34(6):557-567
Tiensin, T., Nielen, M., Vernooij, H.,
Songserm, T., Kalpravidh, W.,
Chotiprasatintara, S., Chaisingh, A.,
Wongkasemjit, S., Chanachai, K.,
Thanapongtham, W., Srisuvan, T., Stegeman,
A., 2007. Transmission of the highly
pathogenic avian influenza virus H5N1 within
flocks during the 2004 epidemic in Thailand. J.
Infect. Dis. 196, 1679–1684.
Van der Goot, J.A., De Jong, M.C.M., Koch,
G., Van Boven, M. 2003. Comparison of the
transmission characteristics of low and high
pathogenicity avian influenza A virus (H5N2).
Epidemiol. Infect. (2003), 131, 1003–1013.
Cambridge University Press DOI:
10.1017/S0950268803001067
Vynnycky, E., White, R. G., An introduction to
Infectious Disease Modeling, Oxford University
Press, 2010. pag. 23.
World Organization for Animal Health,
http://www.oie.int detection system. Avian
diseases 51, 304–308.
59
CONCLUSION
This study consists of four parts, each focusing on a different theme, but among all
there is a common point, poultry, which represent an important part of livestock
production worldwide. We use several scenarios for model transmission of avian
influenza involving different epidemiological aspects in the transmissibility in a total
susceptible population. The study was developed using modern mathematical and
computational tools. We modeled different scenarios of propagation for low and high
pathogenic avian influenza represented in the Dominican Republic. We use
parameters from low and high pathogenic H5N2 viruses of North American lineage.
This is a particular model in a realistic population, which has the potential to
represent influenza epidemics in any scenario and could be applied in other
countries as an important tool to assist in the structuring of surveillance and control
strategies for the avian influenza.
We conclude that epidemic can spread in all population if control measures are not
implemented during the first ten days. Results suggest that low and high avian
influenza virus continues to propagate in populations during the 100 days of the
simulation.
60
APÊNDICE
Table 1. Parameters of the model
Total of farms 951 MA, 2017 (Gomez, 2016)
N = Population on farms 50 -1.500.000 Gomez and Ferreira, 2017,
(unpublished)
Time of simulation 100 days *
a= expectancy of life a=Layers/breeders/grandmothers 490 days **
a= chickens and not defined category 42 days μ = Natural mortality rate
μ_Layers/breeders/grandmothers 1/490 days **
μ_chickens 1/42 days **
β = Transmission rate High pathogenic 4.66 van der Goot et al., 2003
Low pathogenic 0.45 van der Goot et al., 2003
Υ = Infectious period in days High and low pathogenic 6.8 van der Goot et al., 2003
α = Mortality rate due to infection High pathogenic 90% Alexander et al, 1986
Low pathogenic 6% Swayne et al, 1997
δ = Survival rate High pathogenic 10% Alexander et al, 1986
Low pathogenic 94% Swayne et al, 1997
Mean death time High pathogenic 5.2 days Alexander et al, 1986
Low pathogenic 7 days Swayne et al, 1997
Number of farms initially infected 4 *
Number of birds that become infected for contact 10 *
Distance between farms as distance matrix *
Maximum distance between affiliated 200 km *
Maximum distance by neighbor contact 2 km *
61
Figure 1. The twelve scenarios showing the development of the epidemic over 100 days. Scenarios 1-6 represent high pathogenic infection; scenarios 7-12 represent low pathogenic infection. All scenarios were simulated seven times. The epidemic curve declines from day 34 because of mortality in HPAI, while it remains in epidemic course in LPAI.
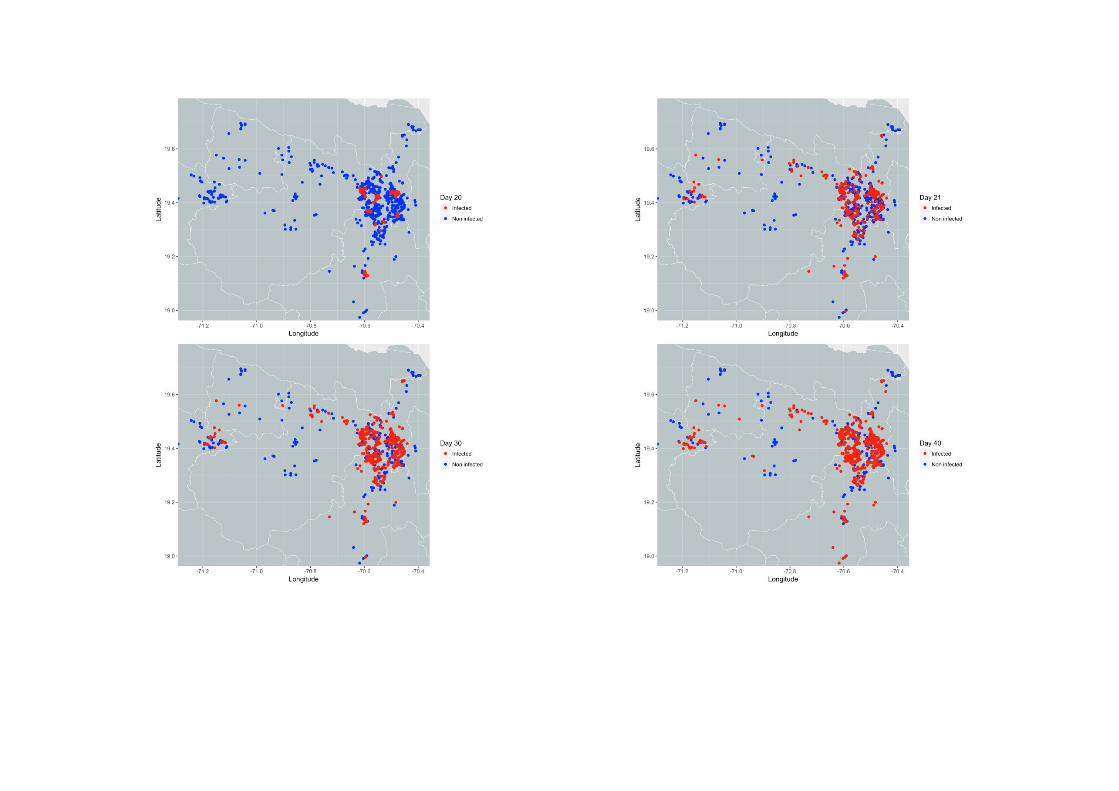
Figure 2. The sequence of images shows in the scenario the development of the epidemic at different days of high pathogenic infection. From days 1 to 10 transmission spread locally; an explosion occurs for other distant farms from day 11. The infection expands locally up to the 20
th day, expanding openly from day 21 to 30 and up to 100 days.
Figure 3. Scenario 7 for low pathogenic at day 1 showing initial conditions.
Figure 4. Scenario 7 for low pathogenic at day 10, the infection spreads locally by neighbor.
Figure 5. Scenario 7 for low pathogenic at day 11. The infection reaches distant farms though contact by affiliation.

Figure 6. Scenarios 7 for low pathogenic at day 20 showing the infection spreading locally in the neighbor of the affiliated recently infected.
Figure 7. Scenario 7 for low pathogenic at day 21, infection continue expanding, a big cluster of infected farms represent the high density province, almost 21% of the farms are infected at this day.
Figure 8. Scenario 7 for low pathogenic. At day 34 infections reaches almost 70% of the farms. Sequence of images show the infection expands openly from 11th until 34th.