Embed Size (px)
Citation preview
Running head: GRAPHIC ORGANIZER AND MORPHEME RECITATION 1
Use of Graphic Organizer (GO) and Comparison of Morpheme Recitation Timings by a University Student with Characteristics of Dyslexia
Undergraduate Research Thesis
Presented in partial fulfillment of the requirements for graduation with research distinction in the Undergraduate colleges of The Ohio State University
by
Jessica Dillow
The Ohio State University December 2014
Project Advisor: Dr. Terri Hessler, Associate Professor, Department of Educational Studies
GRAPHIC ORGANIZER AND MORPHEME RECITATION 2
Abstract
According to recent studies by the International Dyslexia Association (IDA), as many as one in
five individuals has dyslexia (2012). Characteristics of dyslexia include difficulty with word
decoding, spelling, fluency in word recognition, and a deficit in rapid automatic naming
(RAN). Fluency building activities are recommended for most struggling readers; 60-second
timings are often used as a typical measure to gauge success. Due to the lack of research per-
taining to different instructional approaches and timing methods for individuals with dyslexia,
The study poses the following research questions (1) if use of a graphic organizer (GO) im-
proves content knowledge among young adults with dyslexia and (2) whether young adults
with dyslexia produce a higher morpheme- per-second (mps) recitation rate during the first 30-
seconds of a 60-second timing than during the second 30-seconds. Using a single subject A-B
research design, I utilized the graphic organizer and explicit instruction when teaching 30
morphemes to a university student; I then compared the results of two timing segments within
the 60-second timings. These research questions are important within the field of dyslexia re-
search, as many school districts currently use instructional methods and rely on reading as-
sessments that use 60-second timings as 'benchmark' measures. If individuals with dyslexia
perform better during 30- second timings, 60-second timings may cause inaccurate student as-
sessment. Additionally, the type of instruction may be more critical for students with dyslexia.
This study contributes to existing dyslexia research and may also help determine best instruc-
tional practices and testing measures for students with dyslexia.
Keywords: dyslexia, morphemes, timings, university student
GRAPHIC ORGANIZER AND MORPHEME RECITATION 3
Chapter 1: Literature Review
Historical Views of Dyslexia
Dyslexia as a developmental disability has been researched for decades and has grown in
priority within the fields of education, psychology, and linguistics (Maisog et al. 2008). Though
its working definition has developed as research has expanded— with much still unknown about
the learning disability—available knowledge offers insight into the cognitive, behavioral, and
neurological components of the disorder (Lyon et al., 2003). Research from 1994 established the
most detailed definition of dyslexia; today’s definition (and the implication of its components)
functionally explains dyslexia as an anomaly with increasing occurrence among identified chil-
dren and adults (Lyon et al., 2003).
Before 1994, many scholars viewed dyslexia, its causes, and its symptoms as the result of
varying hypotheses; such differing research led to lack of consensus among researchers and the
medical community. For example, one researcher purported that irregularities in eye movement
were correlative to dyslexia among individuals with poor reading skills (Pavlidis, 1985). Another
scholar asserted that there was evidence for two distinguishable types of “language disability”
among language disorders: specific (or hereditary) and symptomatic (or the result of neurological
injuries before, during, or after birth) language disability. The “specific language disability” cat-
egory was then divided into over seven subtypes—all of which were assumed to be transmitted
hereditarily. Dyslexia (included also with “dysgraphia”) was one of these subtypes and was ex-
plained as simply the “reading and writing disability” (Arnold, 1960, p. 114). Dyslexia, as de-
fined in this case, was part of a larger pool of research contributing to general learning disabili-
ties. With such general application, dyslexia later became the term encompassing “any reading
disorder that [was] not the result of organic defect, low intelligence, emotional disturbance, or
GRAPHIC ORGANIZER AND MORPHEME RECITATION 4
environmental deprivation” (White & Miller, 1983, p. 5). To help expand knowledge of dyslexia,
Applebee’s research (1971) has been cited as one of the first to warn against grouping all charac-
teristics of reading disorders homogeneously under dyslexia and anticipating the emergence of
one trait to display the disorder (White & Miller, 1983). In subsequent research, several re-
searchers subcategorized dyslexia into componential parts to better describe the specific deficits
individuals experienced (e.g., Boder, 1971; Dochring & Itoshko, 1977; Ingram et al., 1970;
Mattis et al., 1975). Although these varying subtypes were inconclusive, they addressed the need
for categorization among learning disabilities (White & Miller, 1983). From the plethora of sub-
types emerged two leading categories within the disorder: language-related difficulty and visual-
spatial difficulty (White & Miller, 1983).
A Working Definition
Among varying hypotheses proposed throughout the late 20th century, a more definitive
consensus surfacing by 1994 and has benefitted the study of dyslexia. The work of various re-
searchers contributed to the 1994 definition of dyslexia, which closely resembles the current def-
inition. In summary, the 1994 definition classifies dyslexia as “one of several distinct learning
disabilities,” that is “characterized by difficulties in single-word decoding,” attributable to inac-
curate phonological processing (Lyon et al., 2003, p. 2). Distinct from “generalized developmen-
tal disability or sensory impairment,” dyslexia is often exhibited in reading, writing, and spelling
difficulty but does not necessarily correlate with “other cognitive and academic abilities.” (Lyon
et al., 2003, p. 2). By 2003, the definition had been modified to include the neurobiological na-
ture of dyslexia, along with primary consequences and secondary consequences to expand the
definition by drawing on existing difficulties in reading comprehension. Primary consequences
include the phonological processing of language. Secondary consequences often lead to decreas-
GRAPHIC ORGANIZER AND MORPHEME RECITATION 5
es in vocabulary and contextual knowledge development and can contribute to the lagging pho-
nological improvement in novel learners (Lyon et al., 2003; Maisog et al., 2008).
The implications of a modified definition from 2003 lead to several important points
needing further clarification. First, dyslexia is recognized as one of three categories under “read-
ing disability,” which falls under “specific learning disability” (SLD). Furthermore, “specific
learning disability” is just one of 13 specific categories under a larger “learning disability” (LD)
categorization. Since roughly 80 percent of those with an LD are impacted with “reading disabil-
ity” under SLD, understanding dyslexia as a phonological problem manifest in reading offers
further classification from other reading disorders (e.g., the two others under “reading disability,”
termed “other” and “environment”) (Lyon et al., 2003; Maisog et al., 2008). Similarly, neurobio-
logical aspects of dyslexia should not be overlooked. As a testament to the advancement of sci-
ence, techniques like the usage of fMRI technology in studying dyslexic patients definitively
shows “a failure of left hemisphere posterior brain systems to function properly during reading
[among individuals with dyslexia]” (Lyon et al., 2003, p. 4; Maisog et al., 2008). The neurologi-
cal component of dyslexia offers scientific explanation for the symptomatic causes of dyslexic
impairment that historically have been mistaken for visual issues, below-average intelligence, or
other misdiagnoses. Neurobiologically, the phonological particularities of dyslexia disallow
struggling readers to connect the symbols (i.e., letters) to their sounds or phonologic properties.
Additionally, when letters are paired together orthographically, struggling readers have difficulty
fragmentizing the letter composition into each letter’s basic sound, or phoneme. The disconnect
between accurate phonemic processing and recognizing their corresponding letters can, conse-
quently, have negative impact when processing morphemes (or basic units of meaning). Difficul-
ty in morphemic processing leads to a disconnect between words and their meanings. In sum-
GRAPHIC ORGANIZER AND MORPHEME RECITATION 6
mary, phonemic and morphemic deficiencies challenge individuals with dyslexia in the task of
accurately connecting letters to sounds and interpreting word meaning (Maisog et al., 2008). Be-
cause these two components are critical in reading comprehension, deficits pose inherent and
continual difficulties while learning to read (Maisog et al., 2008).
Characteristics of Dyslexia
There are several noteworthy correlations in behaviors and characteristics among those
diagnosed with dyslexia. Commonly attributed to dyslexia are deficits in reading, writing, and
spelling (Lyon et al., 2003). Additional deficits can manifest in a variety of areas.
Comorbidity. Furthermore, those with dyslexia are often observed having “co-occuring
or comorbid deficits in other cognitive and academic areas” (Lyon et al., 2003, p. 2). These areas
can include “attention, mathematics, and/or spelling and written expression” (Lyon et al., 2003,
p. 3). In recent years, researchers have noticed strong correlation between the symptoms of at-
tention deficit disorders and dyslexia (Rochelle et al., 2009; Wijnants et al., 2012). As with atten-
tion disorder, dyslexia is depicted on a continuum that explains behavioral phenomena. Although
characteristics of dyslexia are prevalent in reading comprehension and other aspects of literacy,
dyslexia co-occurs with other areas of development, such as deficits in both gross and fine motor
skills (Rochelle et al., 2009; Wijnants et al., 2012). Similarities between characteristics of dys-
lexia and of attention disorders have encouraged research of genetic determinants that may pre-
dict the presence of both dyslexia and attention deficit disorder among individuals (Rochelle et
al., 2009). In addition to the possibility of comorbid occurrences between dyslexia and attention
deficits, some research has tested whether speed in individual speech perception affects novice
readers and their reading fluency (Snellings et al., 2010). Because low speeds of speech are cor-
related with phonological deficits, it has been argued that auditory components of language (i.e.,
GRAPHIC ORGANIZER AND MORPHEME RECITATION 7
speech) can be affected by low phonological processing speeds and further affect reading com-
prehension (Snelling et al., 2010).
Structure-of-Language Deficits. Morpheme deficits can act concurrently with phoneme
deficits; combinations of deficits can have adverse effects on reading comprehension (Goodwin
& Ahn, 2010). Because English is a morpho-phonological language in which meaning and sound
work together to form comprehension and word presentation, morphological awareness is gener-
ally thought to correspond with both reading and spelling levels (Goodwin & Ahn, 2010).
Fluency and RAN Deficits. Important characteristics of dyslexia, such as levels of flu-
ency and deficits in rapid automatic naming (RAN), must also be addressed. Reading fluency
involves the usage of perceiving phonemes, morphemes, and graphemes accurately with “the
perceptual and motor processes necessary to read” (Wijnants et al., 2012, p. 100). Since fluency
represents the successful working of processing components and an ability for all components to
work together to produce accurate understanding, poor fluency can indicate poor skills in each
subset (Wijnants et al., 2012). For these reasons, fluency influences reading comprehension and
is commonly related to subsequent performance in writing and spelling (Wijnants et al., 2012).
Like fluency, an assessment of phonological processing is constructed using several features.
Processing determinants include phonological awareness, or the understanding of and ability to
manipulate spoken sounds; memory; and RAN (Thomson et al., 2006). Acceptable levels in all
measures indicate ability to phonologically process information accurately. While fluency and
RAN disorders are more commonly associated with dyslexia, other characteristics are also meas-
ured when testing the effects of dyslexia on reading achievement. These characteristics include
comprehension, morphological awareness, vocabulary levels, decoding, and spelling behaviors
(Goodwin & Ahn, 2010).
GRAPHIC ORGANIZER AND MORPHEME RECITATION 8
Other Characteristics. Altogether, there are many combinations of factors that affect
dyslexia’s manifestation in reading comprehension. Connections between the characteristics of
developmental dyslexia and applicability to other behaviors are nuanced. Often, an individual
may have more than one definitive and succinct learning disability (LD) or specific learning dis-
ability (SLD). As with attention or speech disorders, dyslexia and its characteristics can become
increasingly convoluted with additional symptoms. This convolution is especially important
when considering the misdiagnosis, under-diagnosis, and lack of diagnosis of dyslexia and simi-
larly characterized LDs in the education system and in special education policy.
Effective Instruction
According to IDA (2012), students with dyslexia and its characteristics benefit from “sys-
tematic, explicit, instruction in reading, writing, and language” (p. 1). Explicit instruction for
students at risk of poor reading comprehension is generally accepted by researchers as effective
(Nelson-Walker et al., 2013). Systematic instruction, particularly helpful for students with devel-
opmental disabilities, encourages the repetition of student performance objectives (e.g., under-
standing written content) and structure-of-language instruction that aids literacy advancement
(Schnorr, 2011). Because individuals with dyslexia struggle with fluency, word recognition, and
reading comprehension, instructional methods that address these deficiencies are recommended
(IDA, 2012).
Graphic Organizers. In addition to recommended instructional approaches, research has
shown that the use of the graphic organizer (GO) is a helpful instructional tool (Malmgren and
Trezek, 2009). When used alongside other supplemental instructional tools, graphic organizers
“can be utilized and taught at any age or grade level” (Malmgren and Trezek, 2009, p. 4). While
innovative for introducing content, there is little evidence that graphic organizers are inde-
GRAPHIC ORGANIZER AND MORPHEME RECITATION 9
pendently responsible for student improvement in vocabulary or reading comprehension. Rather,
it is suggested that graphic organizers be used as an instructional aid with other teaching methods
(e.g., monitoring, posing questions, and summarizing information) to improve and expand stu-
dent comprehension (Malmgren and Trezek, 2009). The graphic organizer instructional method
was used in this study; its role will be explained further in the next chapter.
Self-Graphing. Some researchers have begun to advocate for the use of self-graphing in
a variety of educational programs (Kasper-Ferguson and Moxley, 2002). Because self-graphing
is an effective tool for self-monitoring individual progress over time, student progress can focus
on established goals (Kasper-Ferguson and Moxley, 2002). Students can use the self-graphing
procedure to visualize their improvement across the data (Fishley et al., 2012). The self-graphing
technique was also used in this study.
Diagnosis, Intervention, and Treatment of Dyslexia
Diagnosing dyslexia is increasingly difficult, as aspects of reading comprehension and
the individual learner become more nuanced. Alexander and Slinger-Constant note that,
“…although all individuals with dyslexia have a similar problem, namely, difficulty reading,
they have heterogeneous characteristics, and depending on the child's developmental level, the
demands of reading and the required skills are quite different” (2004, p. 745). Generally, the
“coding, storage, and retrieval of stable associations between components of spoken and written
words are the central processes in learning to read” and are agreed upon as necessary for reading
acquisition (Kipp & Mohr, 2008, p. 39). Although the reading process may be more objective,
the classification of a “good reader” is riddled with variation (e.g., reading to find the ‘gist’ of
content or reading to develop the ability of synthesizing multiple contents into a comprehensive
whole) (Alexander & Slinger-Constant, 2004). From this research, it becomes apparent that di-
GRAPHIC ORGANIZER AND MORPHEME RECITATION 10
agnosis should rest on three central foci. First, a working definition of literacy must be formulat-
ed; if a set of specific literacy goals can be determined, then identification and treatment may be
more easily standardized. Second, a systematic plan must be in place than can monitor interven-
tion and treatment of identified students. Third, there must be a measure capable and adaptable
enough to evaluate student progress during and after the intervention and treatment phases.
In general, four factors affect the relative strength of diagnosis: the age of the student
when identified, individual severity, the student’s background, and generalized cognitive opera-
tions (Meyer, 2000). Various identification methods and treatment processes can help determine
future development based on these factors. For example, the age of identification can sometimes
predict (given standard trajectory) the length of time in which students will be classified as dys-
lexic (Meyer, 2000). Deficit severity can impact intervention and treatment output. Relative se-
verity is important, as many students with high severity have been found to experience difficulty
in adulthood—particularly in reading (Meyer, 2000). Environmentally, students with reading and
processing deficits are sometimes thought to have had finite exposure to educational experiences
(i.e. reading with a parent) and activities (Meyer, 2000). Although there is some distinction be-
tween students with deficits and students with underdeveloped educational abilities, student be-
havior can appear similar quantitatively and leads to false causation. For this reason, the back-
ground of the individual represents an important variable to consider when measuring the rela-
tive success of diagnosis and intervention. The final factor determining diagnostic success is the
individual’s cognitive operations. These operations can include morphemic and phonological
processing, RAN, and their correlative importance at different reading stages (Meyer, 2000). In
particular, younger students often employ phonological processing in reading development
whereas older students later utilize RAN and word retrieval abilities in reading tasks (Meyer,
GRAPHIC ORGANIZER AND MORPHEME RECITATION 11
2000). These four factors are generally accepted as the fundamental influences affecting inter-
vention before formal diagnosis takes place.
An estimated 50 percent of identified U.S. children have a learning disability (LD), indi-
cating that LDs compose the largest subpopulation of special education students (Büttner & Has-
selhorn, 2011). A common screening procedure for students with LDs is the “aptitude-
achievement discrepancy,” which represents the cross-analysis of an individual’s intelligence
(measured by IQ) and performance in reading, writing, and mathematics (Büttner & Hasselhorn,
2011). The discrepancy assessment is often composed of intelligence testing and achievement
testing in specified content areas. The assessment leads to diagnosis if independent scores meet a
predetermined requirement in deviation (Büttner & Hasselhorn, 2011). This approach has been
used since the introduction of federally mandated education services to students with LDs in
1968 (Meyer, 2000). The rigidity of the evaluation and the specific deviation requirement has led
to major opposition to the “aptitude-achievement discrepancy” measure. These assessment char-
acteristics can cause struggling students to “fall through the cracks” by not meeting the necessary
quantifications (Büttner & Hasselhorn, 2011). Additionally, ambiguous criteria and unclear
guidelines (including the lack of one national discrepancy score) lead to variation from state to
state. Residence in certain states or relocation can mean that some students do not receive ade-
quate support for their educational needs (Meyer, 2000).
Prior to 2004, the aptitude-achievement discrepancy assessment was a federally mandat-
ed component necessary for identifying students with SLDs (Bradley, Danielson, & Doolittle,
2007). In the 2004 reauthorization of the Individuals with Disabilities Education Act (IDEA),
which is one of many educational provisions for students with disabilities, the discrepancy re-
quirement was repealed. This allowed for alternative modes of identification to be used; another
GRAPHIC ORGANIZER AND MORPHEME RECITATION 12
method is “Response to Intervention” (RtI) (Bradley, Danielson, & Doolittle, 2007). RtI effec-
tively measures individual response to “scientific, research-based intervention” as a means to
evaluate and identify SLD learners (Bradley, Danielson, & Doolittle, 2007, p. 9). Several states
have begun investigating RtI as an identification tool (Bradley, Danielson, & Doolittle, 2007).
RtI involves two prominent approaches: the “problem-solving approach” and the “stand-
ard-protocol approach” (Büttner & Hasselhorn, 2011). The former bases intervention methods
and goals on individual student analysis and specified difficulties; the latter applies research- and
evidence-based intervention practices to individuals or small groups (Büttner & Hasselhorn,
2011). Consequently, RtI is growing in popularity for the same reasons that popularity of the
“aptitude-achievement approach” is declining.
Intervention and treatment among diagnosed students vary in task content, length of time,
and focus areas, along with other factors. Generally, the treatment phase is determined by a neu-
rologic evaluation and assessment of motors skills, testing focused on phonologic skills, and a
speech-language component (Kipp & Mohr, 2008). Attention spans, working memory and other
factors associated with dyslexia may also become part of the treatment (Kipp & Mohr, 2008).
Both children and adults with dyslexia experience deficits in several cognitive processes that are
intricately tied to reading development. Because none of these deficits are caused by relative in-
telligence or individual IQ score, deficits can be mitigated with proper instruction. Common
among interventions is content that develops phonological processing skills. As noted, this de-
velopment is especially important due to the role of phonological and morphological awareness
in reading and writing comprehension (Odegard et al., 2008). While intervention is designed to
impact students in positive ways, not all students benefit from intervention effectively. It is esti-
mated that about two to six percent of children (though other estimates are higher (see Kipp &
GRAPHIC ORGANIZER AND MORPHEME RECITATION 13
Mohr, 2008)), do not respond to intervention (Odegard et al., 2008). Explanations for nonre-
sponse depend on many factors; research by Odegard et al. using fMRI technology asserts the
“pattern of brain activation associated with response to intervention” as influential (2008, p. 10).
Dyslexia in the Education System
Federal Provisions. Federally, there is legislation that mandates and promotes the ser-
vice of individuals with disabilities within the school system. Notable laws include the Rehabili-
tation Act of 1973 (section 504), Americans with Disabilities Act (1990) or ADA, No Child Left
Behind (2001) or NCLB, and the previously mentioned Individuals with Disabilities Education
Act (2004) or IDEA. Section 504 of the Rehabilitation Act of 1973 prohibits discrimination of
disabled individuals in the workplace but also extends protection to students “seeking equal edu-
cational opportunity” (Alexander & Alexander, 1984, p. 289). Similarly, ADA addresses the
prohibition of discrimination and procurement of equal opportunity for individuals with disabili-
ties (ADA, 2009). NCLB of 2001 was instrumental in ensuring that “all children have a fair,
equal, and significant opportunity to obtain a high-quality education and reach, at a minimum,
proficiency on challenging State academic achievement standards and state academic assess-
ments” (Public Law 107-110, 2002, p. 1439). IDEA is said to be the “primary statute that gov-
erns the education of students with disabilities in public schools” established federally (Kaplan,
2010, p. 586). Although much is left open in the state implementation process, these laws have
secured specific rights to students with disabilities in public education.
Standardized Student Performance. It is important to examine the state of the national
public education system to understand dyslexia’s presence in education. According to the 2013
Nation’s Report Card, which measured almost 8,000 schools and over 190,000 students in both
fourth and eighth grades, average reading scores have advanced by five points among fourth
GRAPHIC ORGANIZER AND MORPHEME RECITATION 14
grade students between 1992 and 2013, and eight points among eighth grade students between
1992 and 2013 (with a two-point advancement between 2011 and 2013) (2013, p. 4). More pre-
cisely, the trend in reading scores has remained stagnant among fourth grade students since 2009,
with limited growth and periods of stagnation since 2000. For eighth grade students, average
scores have been increasing steadily since 2007; before this increase, general stagnation and de-
cline began in 1998 (2013, p. 5). The measures used to evaluate students include “basic,” “profi-
cient,” and “advanced,” with a score of “basic” indicating the ability to “locate relevant infor-
mation, make simple inferences…and identify details that support a given conclusion” for fourth
grade students; eighth grade students are expected to do the same, while including the ability to
“state judgments and give some support about content and presentation of content” (2013, p. 6).
In the fourth grade, “proficient” scores are determined by the student’s ability to "integrate and
interpret texts and apply understanding of the text to draw conclusions and make evaluations;”
eighth grade students “should be able to provide relevant information and summarize main ideas
and themes…make and support inferences about a text, connect parts of the text, and analyze
text features…[and] fully substantiate judgments about the content and presentation of content”
(2013, p. 6). Finally, while in fourth grade, “advanced” scores indicate that students “should be
able to make complex inferences and construct and support their inferential understanding of the
text…[and] apply their understanding of a text to make and support a judgment;” eighth grade
students “should be able to make connections within and across texts and to explain causal rela-
tions…evaluate and justify the strength of supporting evidence and the quality of an author’s
presentation…[and] manage the processing demands of analysis and evaluation by stating, ex-
plaining, and justifying” (2013, p. 6). With these terms properly clarified, the results can be ana-
lyzed. In 2013, 32 percent of fourth grade students were “below basic,” 33 percent were “basic,”
GRAPHIC ORGANIZER AND MORPHEME RECITATION 15
and 35 percent were “proficient” or “advanced” (27 and 8, respectively) (2013, p. 7). Eighth
grade students were comprised of 22 percent of students scoring “below basic,” 42 percent
“basic,” and 36 percent “proficient” or “advanced” (32 and 4) (2013, p. 7). These statistics show
that many students, including typical learners, are not performing at or above the “proficient”
level, which is regarded as average.
State Provisions for Students with Dyslexia. While state performance is relatively ho-
mogenous when controlling for geographic location, socioeconomic status, and various subcul-
tural components, state expansion of dyslexia laws, proposed legislation, and pilot programs is
more heterogeneous. Although “consistent and targeted early intervention” can aid students ex-
periencing difficulty from cognitive deficiencies, several states lack explicit guidelines for the
identification and accommodation of students with dyslexia (Youman & Mather, 2013, p. 133).
Because broad understanding of dyslexia is lacking across school districts (many only recognize
characteristics of dyslexia as “reading disabilities” or “Specific Learning Disabilities (SLD)”),
intervention may be designed for SLD treatment and may not suit students with dyslexia
(Youman & Mather, 2013).
Generally, there are four phases where states can enact (or neglect to enact) policies and
programs for students with dyslexia: early screening, identification, intervention, and accommo-
dation. First, early screening consists of pre-identification intervention (unlike later intervention
methods) from staff or educators monitoring student performance. Because student reading pro-
gress is recorded in compliance with NCLB, early screening may vary in consistency (i.e., some
states specifically screen for dyslexia while others provide generalized screening). The early
screening process does not offer determinants for the student’s symptoms, leaving reading diffi-
culty unidentified. Some states have or are in the process of expanding their school programs for
GRAPHIC ORGANIZER AND MORPHEME RECITATION 16
universal dyslexia screening, while others offer comprehensive educational services to parents
and teachers. Second, the process of identification under IDEA (2004) mandates (1) an aptitude-
achievement discrepancy formula, (2) failure of the student to respond to RtI measures, and (3)
use of alternative measures in order to evaluate a student with a suspected SLD (IDEA, 2004).
Generally, most states offer a K-2 screening. If difficulties persist, a formal dyslexia assessment
is conducted for students in some states. In most states, however, a designated “school team”
must determine whether a student meets the SLD criteria. Without this assessment, students may
not receive specialized instruction or accommodations (Youman & Mather, 2013). Third, the in-
tervention process usually begins after the commencement of formal identification. Although
interventions aimed at reading difficulty attempt to develop phonological processing abilities,
states that recognize dyslexia often offer more extensive provisions designed to curb difficulties
among students. Many students are offered an Individualized Education Plan (IEP) or a 504 plan
and utilize intervention methods accordingly. Additionally, some states offer customized educa-
tional services through multi-sensory instruction (MSI), which “combine auditory, visual, and
tactile elements into learning tasks” (Youman & Mather, 2013, p. 142). Fourth, accommodations
may be offered to students for testing and assignments depending on the state’s level of dyslexia
recognition. These accommodations might include oral reading of questions, extended time for
assessments and/or other accommodations for spelling and reading assignments. Implementation
of student accommodations is interpreted and conducted by the classroom teacher in accordance
with the IEP (or 504 plan). Other states may offer “bundled accommodations,” which include
exceptions for state-assessed testing (Youman & Mather, 2013).
Overall, some states fare better than others in identifying, intervening, and accommodat-
ing students with dyslexia. Specifically, California and Texas have passed extensive legislative
GRAPHIC ORGANIZER AND MORPHEME RECITATION 17
provisions for dyslexia programs in schools, the independent recognition of dyslexia as a disabil-
ity, and teacher training. States that currently have pilot programs include Louisiana, Mississippi,
Ohio, Oklahoma, Virginia, and Washington. States with pilot programs pending implementation
(as of 2013) include Illinois, Kansas, and West Virginia. Most states have some provision for
students within the four phases of state involvement (as previously mentioned). Only few have
no provisions (Youman & Mather, 2013).
Teacher Knowledge of Language and Proper Instruction
Questions of teacher preparedness in servicing students with disabilities—specifically
those with dyslexia—have increased in importance among both researchers and educators. With
performance stakes placed higher to provide all students with the most comprehensive instruc-
tion, it is posited that pre-service teacher training programs (e.g., higher education institutions
with education programs) are inadequate for addressing demands placed on general classroom
teachers (Mather, Bos, & Babur, 2001). Furthermore, classroom inclusion now mandates that
general education classroom teachers are handling the instruction of students receiving accom-
modation (although intervention and treatment typically happen outside of the general class-
room). Because accommodated students are increasingly remaining in the classroom, researchers
argue that it is not only enough that an educator “to be literate alone but rather, that teachers need
an explicit understanding of the constructs related to the English language” (i.e., morphemes,
phonemes, etc.) (Washburn et al., 2011, p. 23). Washburn et al. also argue that both teachers and
pre-service teachers are not receiving adequate training and do not hold sufficient knowledge for
properly instructing students with disabilities (2011). After measuring pre-service teachers’
knowledge of various language components, Washburn et al. found that respondents had limited
GRAPHIC ORGANIZER AND MORPHEME RECITATION 18
knowledge of these components. Results lent to the conclusion that many pre-service teachers
are not adequately prepared to teach struggling readers (Washburn et al., 2011).
A later study conducted by Binks-Cantrell et al. also found that among current classroom
teachers, knowledge of basic language constructs was limited (2012). In a survey design similar
to the work of Washburn et al., teacher knowledge was measured based on the “five fundamental
language constructs”—phonological awareness, phonemic awareness, alphabetic principles,
phonics, and morphology (Binks-Cantrell et al., 2012). Results indicate that teachers held limited
knowledge of these components, while over-estimating their relative skill (the ability to perform
tasks involving these components). Based on Binks-Cantrell et al.’s and other studies measuring
teacher training and classroom performance in educating students with disabilities, means of im-
provement could be beneficial for both students and teachers (2012). If improvements are to be
accomplished, program reform must begin at the higher-education level and throughout the train-
ing process for pre-service teachers. For current teachers, professional development opportunities
should be utilized as a remedial effort to improve knowledge of the structure of language and
proper instructional approaches.
The Role of the Study
Although there is much available research about the evolution, characteristics, diagnosis
and intervention process, laws and policies, and teacher knowledge surrounding dyslexia, much
remains unanswered. Research presented herein hopes to contribute to current testing practices
of students with dyslexia and, generally, to offer more information about an increasingly com-
mon disability. In preceding sections, thorough explanation of the research questions and meth-
odology employed throughout the study will be offered. Results and analysis of the research will
also be shared, along with discussion of the findings and concluding statements.
GRAPHIC ORGANIZER AND MORPHEME RECITATION 19
Research Questions
The cruciality of testing is a relevant aspect of current education practices. Due to exist-
ing information about students with dyslexia (i.e., deficits in phonological processing, RAN defi-
cits, and their need for multi-sensory-based and explicit structure-of-language instructional prac-
tices), it is important to develop proper curriculum and testing procedures. Common among
timed tests is the 60-second, or “60-sec,” timing. Used in many capacities, this measure is de-
signed to test student output of knowledge in a concise time frame. Often, students with dyslexia
are given accommodations (according to pre-specified guidelines, as noted in preceding sections)
that allow for additional test time. Although added time may seem effective intuitively, known
deficits in RAN may mean that increased time in testing could be more harmful to students with
dyslexia. With typical learners, the rapid and sequential naming of content (such as colors, num-
bers, letters, etc.) increases over time. The opposite is true for student with dyslexia; RAN defi-
cits among dyslexic learners can cause decreases in rapidity and stamina over time. Consequent-
ly, accommodations that offer increased time may yield less improvement in achievement for
students with RAN deficits. For this reason, two research questions are posed; the first examines
the role of the Graphic Organizer (GO) an as instructional tool, while the second examines dif-
ferences within the first and second 30-second intervals of a 60-sec timing. The first research
question investigates whether the use of the graphic organizer during intervention improves mor-
pheme output. The second research question examines whether students with dyslexia and char-
acteristics of dyslexia perform at increased output levels during the first 30 seconds of 60-sec
timings.
GRAPHIC ORGANIZER AND MORPHEME RECITATION 20
Chapter 2: Method
Participant
The study was conducted using a single-subject A-B research design. The participant is a
23-year-old female university student (ranked as a junior) attending a regional campus of a large,
public university. Though the participant has never been formally diagnosed with dyslexia, both
parents are dyslexic and she displays characteristics of dyslexia. The participant did not have an
IEP throughout primary and secondary education; however, she has received specialized tutoring
prior to entering higher education. Currently, the participant receives accommodation for exams
through the university’s Office for Disability Services. Accommodations include extended test
time, a quiet room, and a reader/scribe when appropriate. The participant’s chosen subject of
study is business; she is an average-performing student across all coursework. In order to take
part in the research, the participant signed a release form granting permission to publish relevant
data while maintaining full confidentiality. The subject received compensation at a rate of $10
per session for her participation in the study.
Setting
Each session was conducted in a private campus office. Pre-Baseline sessions (the first
phase) lasted approximately 60 minutes while Baseline sessions (the second phase) lasted an av-
erage of 17 minutes. Once Intervention (the third phase) commenced, sessions were conducted
over an average of 67 minutes. The three phases of the study were conducted over a total of eight
weeks. Five weeks of the study contained two sessions per week, while three weeks contained
one session per week. The number of sessions per week never exceeded two. Beginning with the
second Intervention session, all previously taught morphemes were reviewed silently by the sub-
ject prior to the instruction of the five new morphemes. No review of morphemes took place out-
GRAPHIC ORGANIZER AND MORPHEME RECITATION 21
side of the sessions to reduce possible confounding variables. To the researcher’s knowledge, the
participant had not received any previous morphemic instruction but had used a technique simi-
lar to the GO and the self-graph with a former tutor.
Procedures
The two research questions are studied by use of morphemic instruction and repeated
timings of learned morphemes. The study was conducted in three distinct phases: Pre-Baseline,
Baseline, and Intervention phase. Within these phases, the design varied slightly. Overall, the
study design was implemented by using a set of predetermined morphemes, specifically involv-
ing various prefixes, suffixes, and lower level Latin root words developed and copyrighted by
Ron Yoshimoto.
Pre-Baseline. The purpose of Pre-Baseline was two-fold: first, Pre-Baseline helped to
ensure internal validity and to remove a major confounding variable of the study (i.e., prior par-
ticipant knowledge of morphemes later taught in the Intervention phase). Second, Pre-Baseline
aided the researcher in determining which morphemes to introduce throughout Intervention
(based on which morphemes were unknown to the participant). Pre-Baseline phase was conduct-
ed over two sessions wherein the participant was shown 277 morphemes. Since no previous in-
struction of these morphemes was given, specified levels of output were unnecessary. After all
unknown morphemes were determined, 33 unknown morphemes were randomly chosen to create
a flashcard deck. All morphemes in the deck were duplicated, which formed a 66-card deck. Du-
plication of morphemes within the deck was necessary to avoid creating a “ceiling” for mor-
pheme output during the 60-sec timings.
Baseline. After Pre-Baseline established unknown morphemes, Baseline phase com-
menced. Baseline phase took place over five sessions and involved the subject silently reading
GRAPHIC ORGANIZER AND MORPHEME RECITATION 22
the morphemes from the deck and either offering the morpheme’s definition or skipping the
morpheme by saying “pass” during the 60-sec timings. Two 60-sec timings were conducted per
session. These timings helped to validate that the morphemes were truly unknown to the subject.
Throughout the timings, the participant held the card deck. As the participant progressed through
the deck, each morpheme card was flipped morpheme-side down toward the researcher. The re-
searcher was responsible for silently reading the definition and assigning each card to the desig-
nated pile (“correct,” “pass,” and “incorrect”) based on the participant’s response. Stabilization
of morpheme output by the participant also served to test the effectiveness of the graphic organ-
izer and later timings in the Intervention phase. Unfortunately, the baseline phase was inadvert-
ently extended, due to statistical oversight errors and confusion in the stabilization process.
Intervention. After the data stabilized in Baseline, the Intervention phase began. Each
Intervention session included the instruction of five different morphemes by use of the graphic
organizer and card deck, review of previously taught morphemes (starting with the second ses-
sion), one 60-sec timing, and the participant’s self-graphing of morpheme identification progres-
sion. Prior to each session, the researcher would shuffle the morpheme deck numerous times and
randomly choose five morphemes (if previously taught morphemes are randomly chosen, they
are placed back into the deck and a different morpheme is chosen). The researcher then chose
two example words that contain the morpheme (words taken from the line provided on the mor-
pheme cards) and used standard dictionary definitions.
Throughout the study, a total of six Intervention sessions were conducted. Each interven-
tion session lasted between 45 and 67 minutes and began by reviewing previous morphemes. Af-
ter all previously taught morphemes were reviewed, the participant was introduced to five mor-
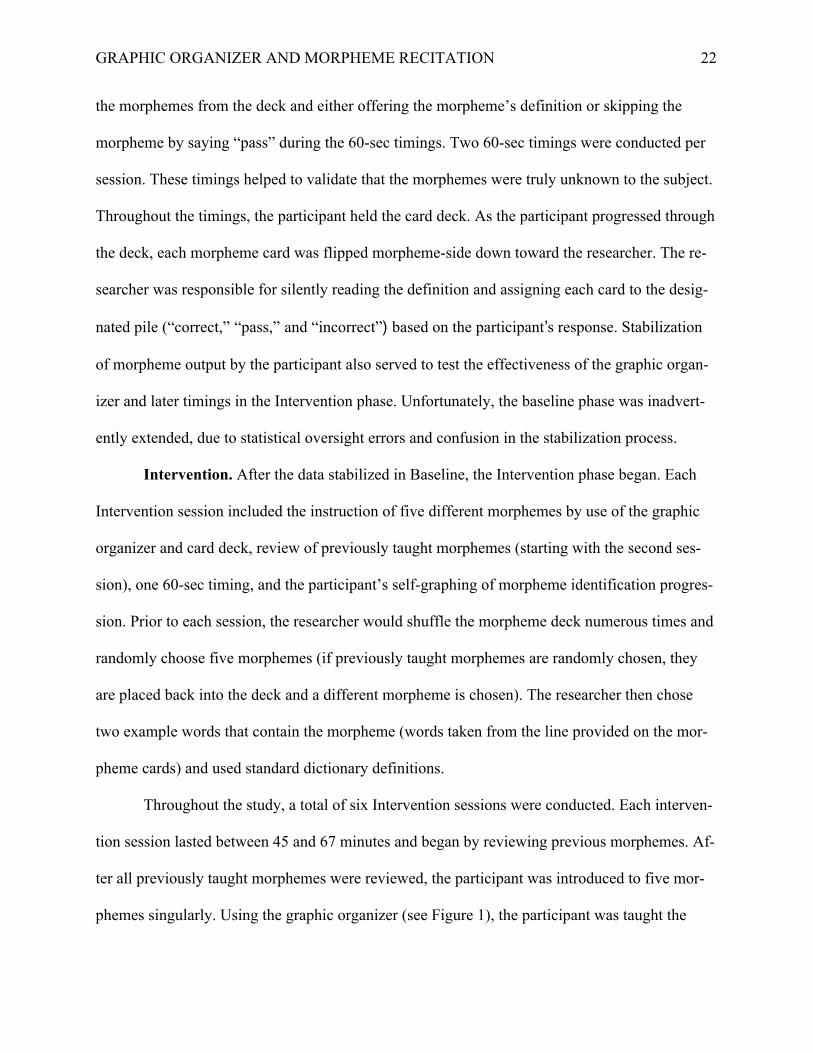
phemes singularly. Using the graphic organizer (see Figure 1), the participant was taught the
GRAPHIC ORGANIZER AND MORPHEME RECITATION 23
morpheme (the researcher read the morpheme aloud and also provided the morpheme card for
visual reference) and was asked to write the morpheme in the center circle while simultaneously
saying it aloud. This component of Intervention offered multi-sensory instruction by stimulating
auditory and visual senses. In the upper-left corner of the graphic organizer, the participant was
given the morpheme’s definition. In the upper-right corner, the two predetermined example
words containing the morpheme and their definitions were written and underlined by the partici-
pant. At the bottom of the graphic organizer, the researcher offered a sentence containing one of
the example words to provide contextualized meaning of the morpheme. For depiction of the
graphic organizer, see Figure 1. Once the graphic organizer was completed, the participant re-
peated the morpheme, its definition, and one of the example words. The participant then turned
the graphic organizer facedown and the researcher showed the morpheme card to the participant.
The participant named the morpheme, stated its definition, and provided an example word. After
the instruction of three morphemes was completed, each was reviewed before introducing the
last two morphemes. After all five morphemes were introduced and reviewed, the morphemes
were placed into the deck, the deck was shuffled (several times to ensure randomization), and the
60-sec timing was completed using the 66-card deck. As in Baseline, the participant would hold
the deck and name as many morphemes as possible in one minute. The participant would flip the
card morpheme-side down, and the researcher would check for the correct definition. In the In-
tervention phase, the cards were also separated into three categories (i.e., “correct,” “pass,” and
“incorrect’”), according to participant responses. To compare the participant’s output perfor-
mance in the first 30-sec and the second 30-sec, the researcher further separated the three catego-
ries into “first 30-sec” and “second 30-sec” piles. After one timing was completed per session,
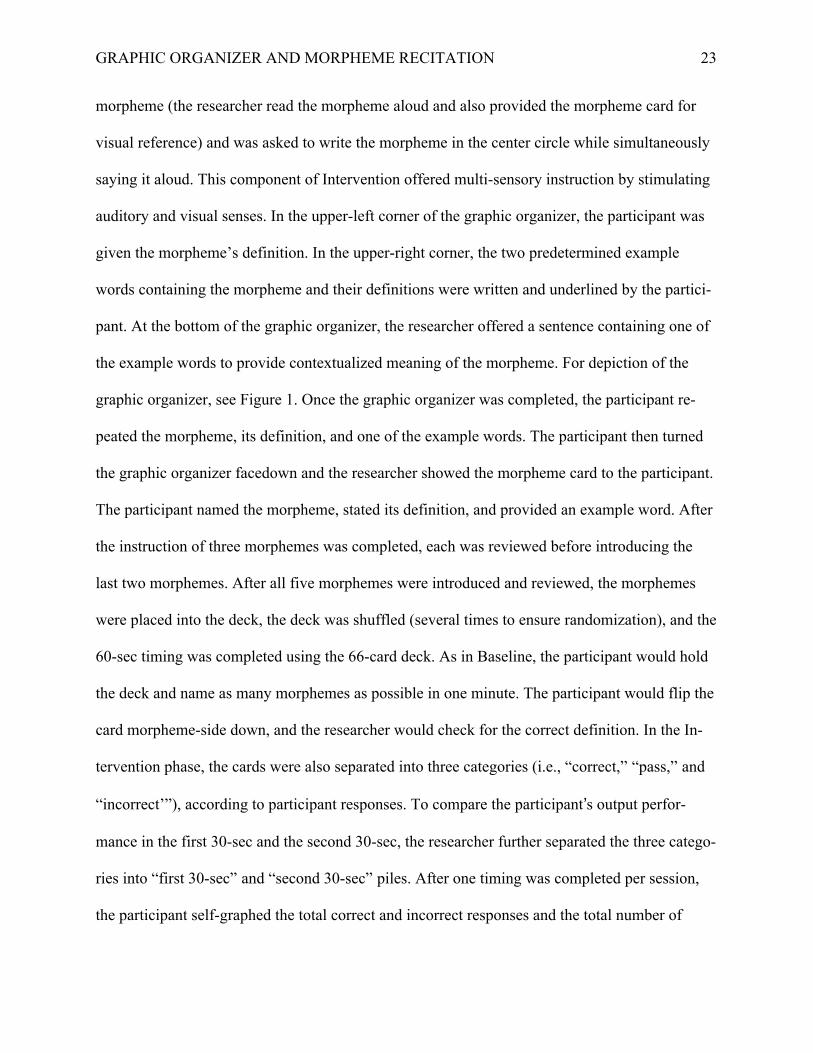
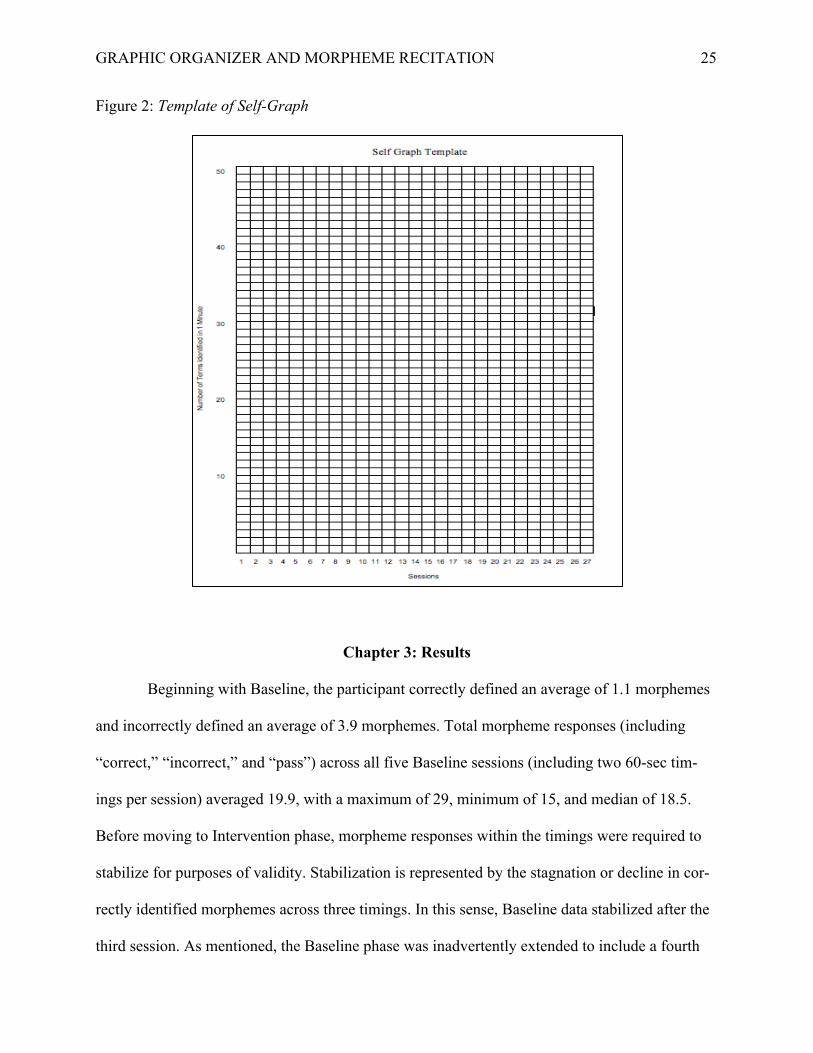
the participant self-graphed the total correct and incorrect responses and the total number of
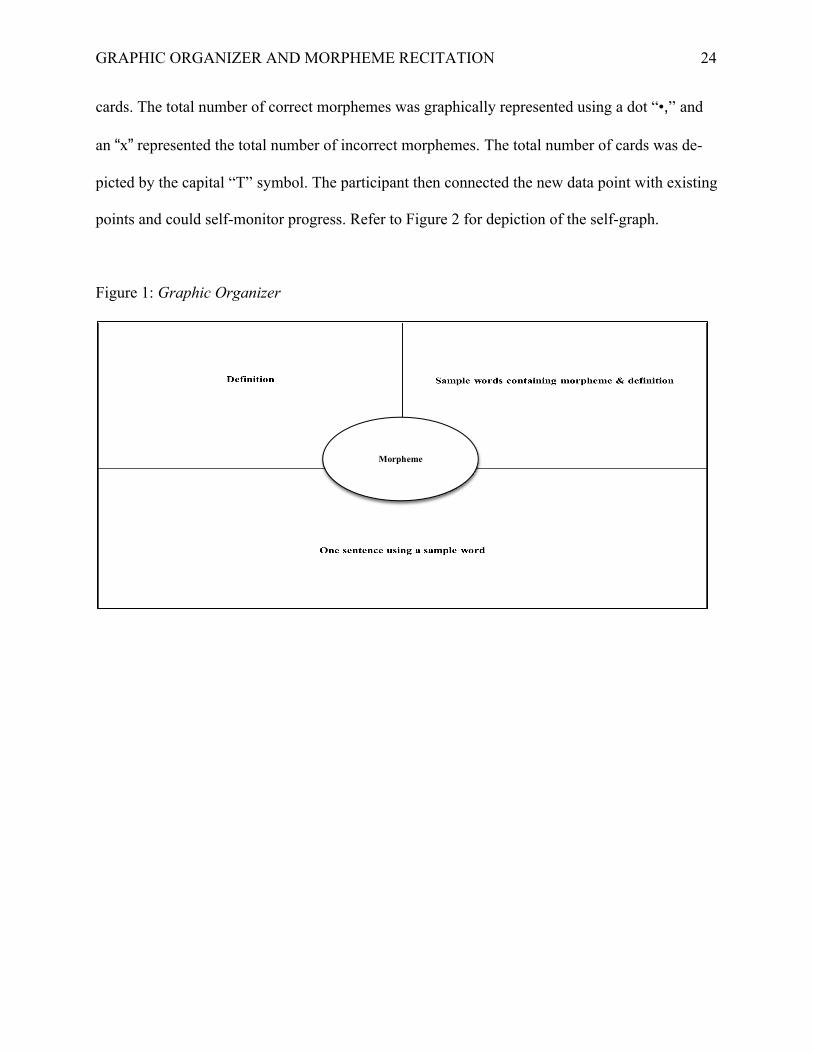
GRAPHIC ORGANIZER AND MORPHEME RECITATION 24
cards. The total number of correct morphemes was graphically represented using a dot “•,” and
an “x” represented the total number of incorrect morphemes. The total number of cards was de-
picted by the capital “T” symbol. The participant then connected the new data point with existing
points and could self-monitor progress. Refer to Figure 2 for depiction of the self-graph.
Figure 1: Graphic Organizer
Morpheme
GRAPHIC ORGANIZER AND MORPHEME RECITATION 25
Figure 2: Template of Self-Graph
Chapter 3: Results
Beginning with Baseline, the participant correctly defined an average of 1.1 morphemes
and incorrectly defined an average of 3.9 morphemes. Total morpheme responses (including
“correct,” “incorrect,” and “pass”) across all five Baseline sessions (including two 60-sec tim-
ings per session) averaged 19.9, with a maximum of 29, minimum of 15, and median of 18.5.
Before moving to Intervention phase, morpheme responses within the timings were required to
stabilize for purposes of validity. Stabilization is represented by the stagnation or decline in cor-
rectly identified morphemes across three timings. In this sense, Baseline data stabilized after the
third session. As mentioned, the Baseline phase was inadvertently extended to include a fourth
GRAPHIC ORGANIZER AND MORPHEME RECITATION 26
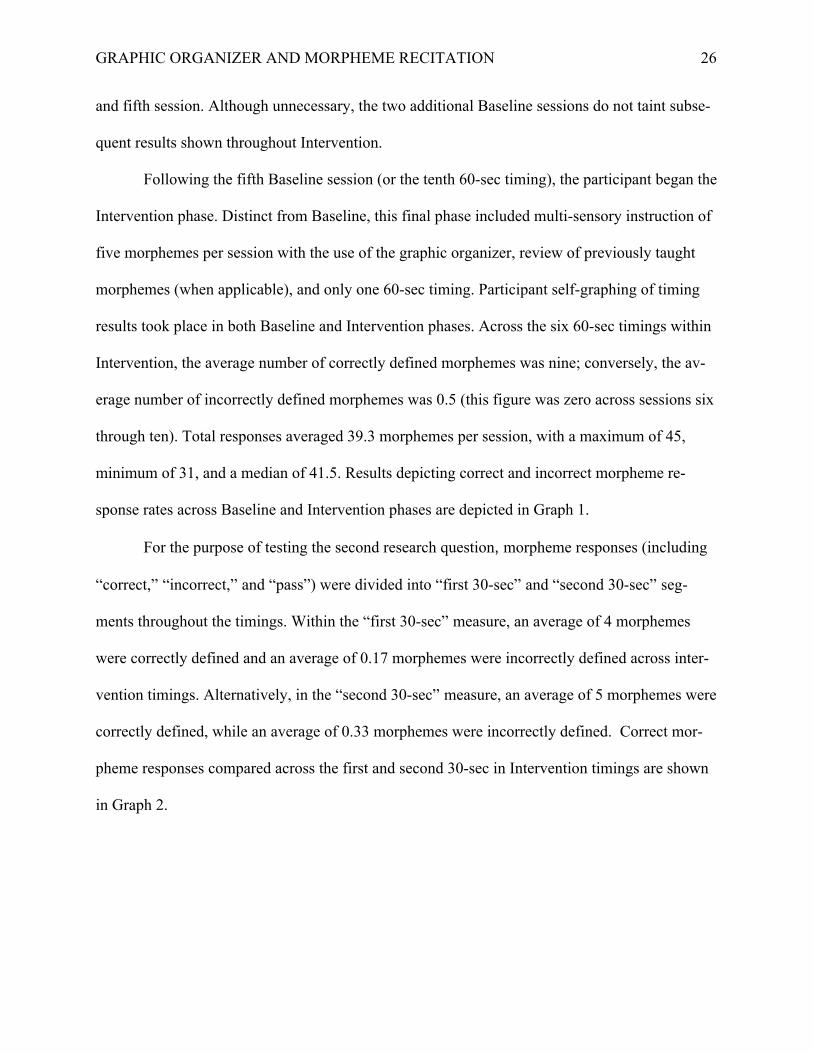
and fifth session. Although unnecessary, the two additional Baseline sessions do not taint subse-
quent results shown throughout Intervention.
Following the fifth Baseline session (or the tenth 60-sec timing), the participant began the
Intervention phase. Distinct from Baseline, this final phase included multi-sensory instruction of
five morphemes per session with the use of the graphic organizer, review of previously taught
morphemes (when applicable), and only one 60-sec timing. Participant self-graphing of timing
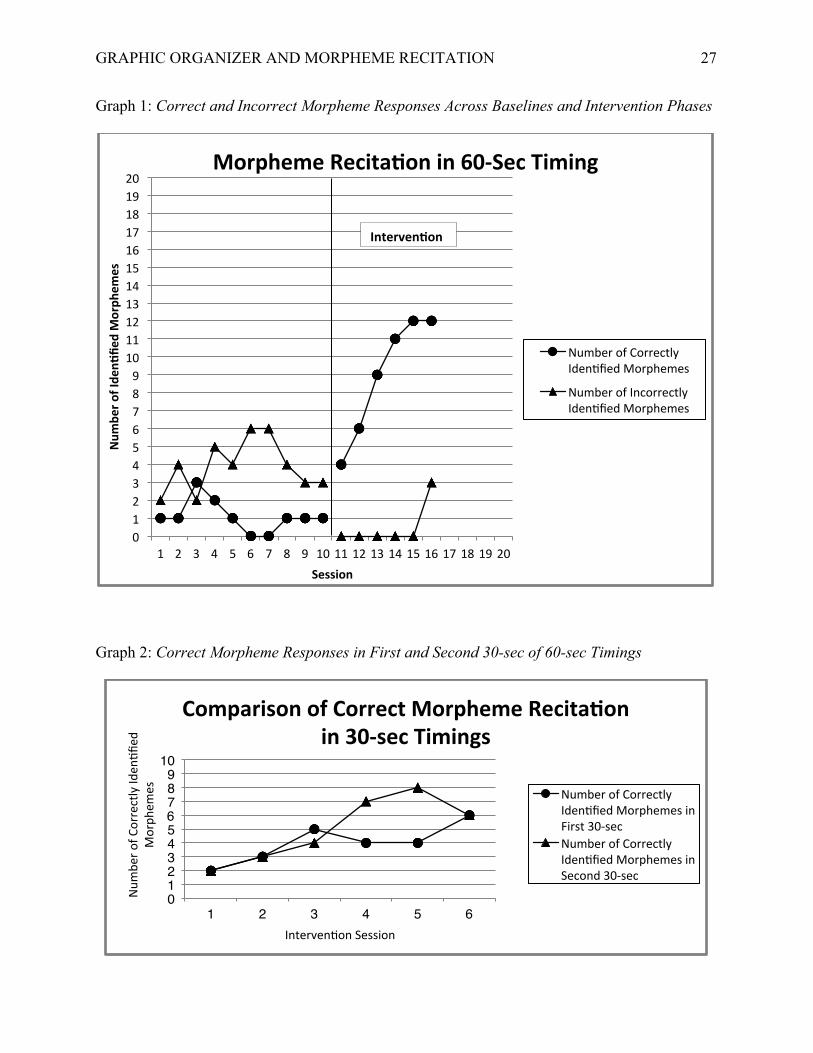
results took place in both Baseline and Intervention phases. Across the six 60-sec timings within
Intervention, the average number of correctly defined morphemes was nine; conversely, the av-
erage number of incorrectly defined morphemes was 0.5 (this figure was zero across sessions six
through ten). Total responses averaged 39.3 morphemes per session, with a maximum of 45,
minimum of 31, and a median of 41.5. Results depicting correct and incorrect morpheme re-
sponse rates across Baseline and Intervention phases are depicted in Graph 1.
For the purpose of testing the second research question, morpheme responses (including
“correct,” “incorrect,” and “pass”) were divided into “first 30-sec” and “second 30-sec” seg-
ments throughout the timings. Within the “first 30-sec” measure, an average of 4 morphemes
were correctly defined and an average of 0.17 morphemes were incorrectly defined across inter-
vention timings. Alternatively, in the “second 30-sec” measure, an average of 5 morphemes were
correctly defined, while an average of 0.33 morphemes were incorrectly defined. Correct mor-
pheme responses compared across the first and second 30-sec in Intervention timings are shown
in Graph 2.
GRAPHIC ORGANIZER AND MORPHEME RECITATION 27
Graph 1: Correct and Incorrect Morpheme Responses Across Baselines and Intervention Phases
Graph 2: Correct Morpheme Responses in First and Second 30-sec of 60-sec Timings
0 1 2 3 4 5 6 7 8 9 10 11 12 13 14 15 16 17 18 19 20
1 2 3 4 5 6 7 8 9 10 11 12 13 14 15 16 17 18 19 20
Num
ber o
f Ide
n-fie
d Morph
emes
Session
Morpheme Recita-on in 60-‐Sec Timing
Number of Correctly Iden<fied Morphemes
Number of Incorrectly Iden<fied Morphemes
Interven-on
0!1!2!3!4!5!6!7!8!9!
10!
1! 2! 3! 4! 5! 6!
Num
ber o
f Correctly Iden
<fied
Morph
emes
Interven<on Session
Comparison of Correct Morpheme Recita-on in 30-‐sec Timings
Number of Correctly Iden<fied Morphemes in First 30-‐sec Number of Correctly Iden<fied Morphemes in Second 30-‐sec
GRAPHIC ORGANIZER AND MORPHEME RECITATION 28
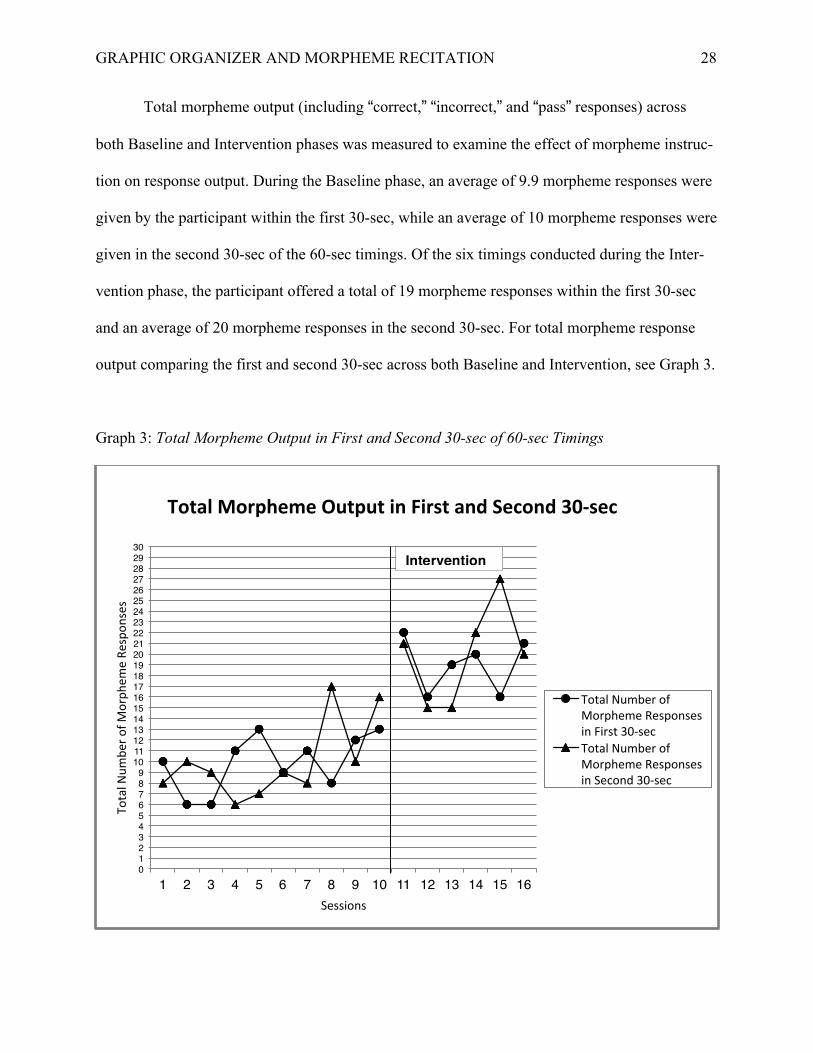
Total morpheme output (including “correct,” “incorrect,” and “pass” responses) across
both Baseline and Intervention phases was measured to examine the effect of morpheme instruc-
tion on response output. During the Baseline phase, an average of 9.9 morpheme responses were
given by the participant within the first 30-sec, while an average of 10 morpheme responses were
given in the second 30-sec of the 60-sec timings. Of the six timings conducted during the Inter-
vention phase, the participant offered a total of 19 morpheme responses within the first 30-sec
and an average of 20 morpheme responses in the second 30-sec. For total morpheme response
output comparing the first and second 30-sec across both Baseline and Intervention, see Graph 3.
Graph 3: Total Morpheme Output in First and Second 30-sec of 60-sec Timings
0!1!2!3!4!5!6!7!8!9!
10!11!12!13!14!15!16!17!18!19!20!21!22!23!24!25!26!27!28!29!30!
1! 2! 3! 4! 5! 6! 7! 8! 9! 10! 11! 12! 13! 14! 15! 16!
Total N
umbe
r of M
orph
eme Re
spon
ses
Sessions
Total Morpheme Output in First and Second 30-‐sec
Total Number of Morpheme Responses in First 30-‐sec Total Number of Morpheme Responses in Second 30-‐sec
Intervention
GRAPHIC ORGANIZER AND MORPHEME RECITATION 29
Chapter 4: Discussion
The data indicate two important patterns for the research questions. First, multi-sensory
and explicit instruction of specified morphemes during Intervention shows increases in both cor-
rect responses and total responses across the data. The data also indicate that as the participant
began to learn and recognize morphemes taught throughout Intervention, the total number of re-
sponses increased. The number of correctly defined morphemes increased, while the number of
incorrectly defined morphemes decreased (from 3.9 to 0.5) across phases. Furthermore, the over-
all number of “pass” responses also increased when moving from Baseline to Intervention. This
suggests that the participant began to quickly distinguish familiar and unfamiliar morphemes.
Using the process of morphemic recognition developed through graphic organizer instruction,
perhaps the participant responded to taught morphemes with the correct definition (or “pass,” if
unable to recall) and reserved the “pass” response for all other unknown morphemes. Altogether,
the type of instruction and techniques used (i.e., the graphic organizer, the timings, and the self-
graphing) indicate the successful development and retention of taught morphemes. These results
are supported by what researchers know to be best instructional practices and effective tech-
niques for students with dyslexia and its characteristics.
The second important pattern detected in the data is the contrariness of the 30-sec timings
to our second research question. Across Baseline, total morpheme output across the first and se-
cond 30-sec do not average equally but are similar (outputs of 9.9 and 10). Contrary to what is
expected from students with RAN deficits, output in the second 30-sec is slightly larger than
output from the first 30-sec. This indicates, among other possibilities, that the participant was, on
average, slightly able to increase the speed of total morpheme responses over the course of the
60-sec timing in Baseline. A similar pattern is detected in the Intervention phase, where total
GRAPHIC ORGANIZER AND MORPHEME RECITATION 30
morpheme output averaged 19 in the first 30-sec and 20 in the second 30-sec. These averages
across the six Intervention timings indicate, as in Baseline, that the participant had slightly faster
morpheme output rates in the second 30-sec.
The results of this study indicate two primary conclusions. First, the dramatic increases of
both correct and total morpheme responses when moving from Baseline to Intervention phase
point to the effectiveness of the graphic organizer and the explicit, systematic instructional tech-
niques. This affirms the first research question posed at the beginning of the study. While other
methods of explicit instruction may also work in the same capacity or have yet to be tested, posi-
tive results from this study show the effectiveness of the graphic organizer, the timed tests, and
the self-graph. Because research points toward the necessity of specialized instruction for stu-
dents with dyslexia and with deficits in RAN and fluency (ADA, 2009; IDA, 2012), this study
affirms the methods that educators can use to instruct students with specialized needs. The ex-
plicit, multi-sensory instruction produced by the graphic organizer is one such way to effectively
teach content at the individual level. Self-graphing encouraged systematic goals and expectations
for the participant. When Fishley et al. (2012) conducted research using the graphic organizer,
timings, and the self-graph in a small-group setting it was similarly successful. There is no obvi-
ous reason why the graphic organizer instructional method could not be generalized to the class-
room, due to success at the individual level and at the small-group level (Fishley et al., 2012). In
the future, research should aim to test how the effectiveness of this instructional method fares in
comparison to similar instructional methods. This method should also be applied to a larger
group of students (i.e., a classroom-sized group) to test large group effectiveness and determine
unpredicted caveats.
GRAPHIC ORGANIZER AND MORPHEME RECITATION 31
The results also suggest that in this particular study, the participant had a slightly lower
average morpheme response rate in the first 30-sec than in the second 30-sec. The second re-
search question asked whether students with dyslexia or characteristics of dyslexia would have
higher output rates in the first 30-sec due to RAN deficits. From the results, it appears that in
both Baseline and Intervention phases, the participant responded with higher average output rates
in the second 30-sec, contrary to what is expected of individuals with RAN deficits. While there
may be individual factors that encouraged these results from the participant (e.g., lack of diagno-
sis, lack of receiving specialized instruction in primary and secondary education, or lack of RAN
deficits), this finding offers an ambiguous answer to the second research question. Because out-
put averages between the first and second 30-sec were very similar, but slightly larger within the
second 30-sec in both phases, the effect of Intervention cannot definitively be determined. Due
to the limited numerical difference between averages, future research should continue to investi-
gate this question. Additional research should expand the research design to use multiple partici-
pants with varying diagnoses, characteristics, and deficits. Studies should also try to conduct
more timings and increase data collection to obtain a fuller understanding of timed-test perfor-
mances by students with RAN deficits.
Conclusion
Students with dyslexia and its characteristics face many challenges within normative ed-
ucational structures. These students often struggle with deficits in RAN and fluency when learn-
ing a variety of subjects. For these reasons, particularized instruction is deemed essential. More
specifically, instruction utilizing an explicit and multi-sensory approach is best for students who
struggle to connect morphemic and phonemic components. This study aimed to replicate and ex-
pand parts of Fishley et al.’s research (2012) by using the graphic organizer, timed tests, and
GRAPHIC ORGANIZER AND MORPHEME RECITATION 32
self-graphing. Prior to conducting research, two research questions were formulated. First,
whether the use of the graphic organizer in morpheme instruction would increase correct mor-
pheme responses within the timings. The second research question asked whether the first 30-sec
segment would show higher rates of morpheme responses than the second 30-sec segment in 60-
sec timings.
The prioritization of effective instructional methods for students with dyslexia and its
characteristics is imperative. Administrators, educators, and parents face crossroads within the
field of dyslexia. Either it must be accepted that growing populations of students with dyslexia
are in need of specialized instruction and that services to students must be secured across all dis-
tricts and states, or that the current status quo for recognitions and services will remain the same.
Many stakeholders have primary roles in expanding educational opportunities and services for
students with dyslexia. Researchers should continue to investigate best instructional practices for
this student group. Administrators and educators should urge for conditions that allow students
with dyslexia to receive the type of instruction necessary for their success. Pre-service teacher
educators should work toward expanding their students’ knowledge of dyslexia by developing
proper training for teachers prior to entering the classroom. Parents and students should encour-
age administrations and school officials to provide materials that detail the characteristics of dys-
lexia, explicit steps toward acquiring services, and up-to-date information about current state leg-
islation. However ambitious, the achievement of these goals by the aforementioned stakeholders
will help to ensure proper educational practices and services are offered to the 20 percent of stu-
dents who need them (IDA, 2012).
GRAPHIC ORGANIZER AND MORPHEME RECITATION 33
References
Alexander, A. W., & Singer-Constant, A. (2004). Current status of treatments for dyslexia: Criti-
cal review. Journal of Child Neurology, 19, 744-758.
Alexander, K., & Alexander, M. D. (1984). The law of schools, students and teachers in a nut
shell. St. Paul, MN: West.
Applebee, A. (1971). Research in reading retardation: Two critical problems. Journal of Child
Psychology and Psychiatry, 12, 91-113.
Arnold, G.E. (1960). Congenital language disability as a study model of evolution in communi-
cation. Language and Speech, 4(1): 113-132.
Binks-Cantrell, E., Joshi R. M., & Washburn E. K. (2012). Validation of an instrument for as-
sessing teacher knowledge of basic language constructs of literacy. Annals of Dyslexia,
62, 153-171.
Boder, E. (1971). Developmental Dyslexia. Prevailing diagnostic concepts in a new diagnostic
approach. In H. R. Myklebust (Ed.), Progress in learning disabilities. (Vol. 2). New York:
Grune & Stratton.
Bradley, R., Danielson, L., & Doolittle, J. (2007). Responsiveness to Intervention: 1997 to 2007.
Teaching Exceptional Children, 39(5): 8-12.
Büttner, G., & Hasselhorn, M. (2011). Learning disabilities: Debates on definitions, causes, sub-
types, and responses. Journal of Disability, Development and Education, 58(1): 75-87.
Dochring, D. G., & Itoshko, I. M. (1977). Classification of reading problems by the Q-technique
of factor analysis. Cortex, 13, 281-294.
GRAPHIC ORGANIZER AND MORPHEME RECITATION 34
Fishley, K.M., Konrad, M., Hessler, T., & Keesey, S. (2012). Effects of GO FASTER on mor-
pheme definition fluency for high school students with high-incidence disabilities. Learn-
ing Disabilities Research and Practice, 27(3), 104-115.
Goodwin, A.P., & Ahn, S. (2010). A meta-analysis of morphological interventions: Effects on
literacy achievement of children with literacy difficulties. Annals of Dyslexia, 60, 183-
208.
Ingram, T., Mason, A., & Blackburn, I. (1970). A retrospective study of 82 children with reading
disability. Developmental Medicine and Child Neurology, 12, 271-281.
International Dyslexia Association. (2012). Dyslexia Basics [Data file]. Retrieved from
http://www.interdys.org/ewebeditpro5/upload/DyslexiaBasicsREVMay2012.pdf
Kasper-Ferguson S., & Moxley, R. (2002). Developing a writing package with student graphing
of fluency. Education and Treatment of Children, 25(2): 249-267.
Kaplan, A. Harm without recourse: The need for a private right of action in federal restraint and
seclusion legislation. (2010). Cardozo Law Review, 32(2): 581-614.
Kipp, K. H., & Mohr, G. (2008). Remediation of developmental dyslexia: Tackling a basic
memory deficit. Cognitive Neuropsychology, 25(10): 38-55.
Lyon, G.R., Shaywitz, S.E., & Shaywitz, B.E. (2003). Part I: Defining dyslexia, comorbidity,
teachers’ knowledge of language and reading. Annals of Dyslexia, 53, 1-14.
Maisog, J. M., Einbinder, E. R., Flowers, D. L., Turkeltaub, P. E., & Eden, G. F. (2008). A meta-
analysis of functional neuroimaging studies of dyslexia. Annals of the New York Academy
of Sciences, 1145, 237-259.
Malmgren, K. W., & Trevek, B. J. (2009). Literacy instruction for secondary students with disa-
bilities. Focus on Exceptional Children, 41(6): 2-12.
GRAPHIC ORGANIZER AND MORPHEME RECITATION 35
Mather, N., Bos, C., & Babur, N. (2001). Perceptions and knowledge of preservice and inservice
teachers about early literacy instruction. Journal of Learning Disabilities, 34(5): 472-482.
Mattis, S., French, J., & Rapin, I. (1975). Dyslexia in children and young adults: Three inde-
pendent neuropsychological syndromes. Developmental Medicine and Child Neurology,
17, 150-163.
Meyer, M. S. (2000). The ability-achievement discrepancy: Does it contribute to an understand-
ing of learning disabilities? Educational Psychology Review, 12(3): 315-337.
Nelson-Walker, N. J., Fien, H., Kosty, D. B., Smolkowski, K., Smith, J. L. M., & Baker, S., K.
(2013). Evaluating the effects of a systemic intervention on first-grade teachers’ explicit
reading instruction. Learning Disability Quarterly 36(4): 215-230.
Odegard, T. N., Ring, J., Smith, S., Biggan, J., & Black, J. (2008). Differentiating the neural re-
sponse to intervention in children with developmental dyslexia. Annals of Dyslexia, 58,
1-14.
Pavlidis, G.T. (1985). Eye movements in dyslexia: Their diagnostic significance. Journal of
Learning Disabilities, 18 (1): 42-50.
Rochelle, K. S. H., Witton, C., & Talcott, J. B. (2009). Symptoms of hyperactivity and inatten-
tion can mediate deficits of postural stability in developmental dyslexia. Experimental
Brain Research, 192, 627-633.
Schnorr, T. F. (2011). Intensive reading instruction for learners with developmental disabilities.
The Reading Teacher, 65(1): 35-45.
Snellings P., Van der Leij, A., Blok, H., & De Jong, P. F. (2010). Reading fluency and speech
perception speed of beginning readers with persistent reading problems: The perception
of initial stop consonants and consonant clusters. Annals of Dyslexia, 60, 151-174.
GRAPHIC ORGANIZER AND MORPHEME RECITATION 36
Thomson, B., Crewther, D. P., & Crewther, S. G. (2006). Wots that Werd? Pseudowords (non-
words) may be a misleading measure of phonological skills in learner readers. Dyslexia,
12, 289-299.
United States Department of Education, Law and Guidance. (2014). PUBLIC LAW 107–110—
JAN. 8, 2002 [Data file]. Retrieved from
http://www2.ed.gov/policy/elsec/leg/esea02/107-110.pdf.
United States Department of Education, National Center for Education Statistics. (2013). A First
Look: 2013 Mathematics and Reading [Data file]. Retrieved from
http://nces.ed.gov/nationsreportcard/subject/publications/main2013/pdf/2014451.pdf.
United States Department of Justice, Civil Rights Division. (2009). Americans with Disabilities
Act of 1990, as Amended [Data file]. Retrieved from
http://www.ada.gov/pubs/adastatute08.pdf.
Washburn, E. K., Joshi, R. M., & Binks-Cantrell, E. (2011). Are preservice teachers prepared to
teach struggling readers? Annals of Dyslexia,61, 21-43.
White, M., & Miller, S.R. (1983). Dyslexia: A term in search of a definition. The Journal of Spe-
cial Education, 17(1): 5-10.
Wijnants, M. L., Hasselman, F., Cox, R. F. A.,Bosman, A. M. T., & Van Orden, G. (2012). An
interaction-dominant perspective on reading fluency and dyslexia. Annals of Dyslexia,
62, 100-119.
Youman, M., & Mather, N. (2013). Dyslexia laws in the USA. Annals of Dyslexia, 63, 133-153.