Embed Size (px)
Citation preview
Department of Geoinformatics & Surveying University of Nigeria, Enugu Campus
(08036864777) [email protected]@unn.edu.ng
*
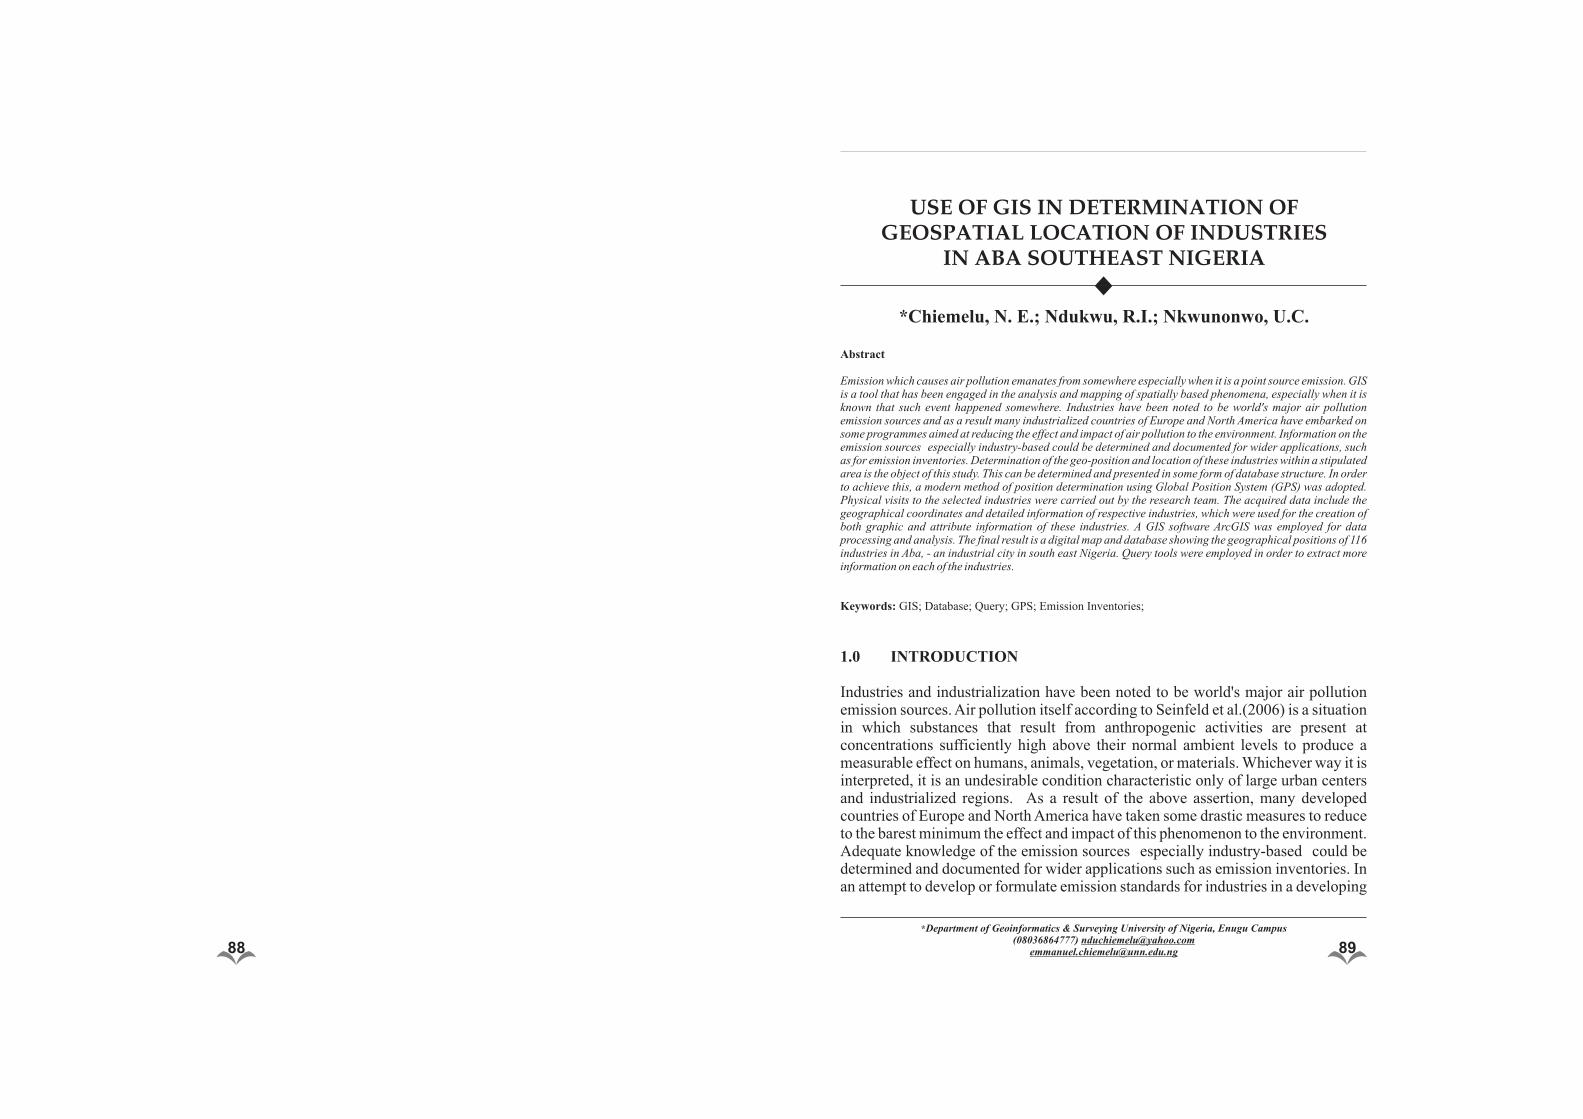
USE OF GIS IN DETERMINATION OF GEOSPATIAL LOCATION OF INDUSTRIES
IN ABA SOUTHEAST NIGERIA
Abstract
Emission which causes air pollution emanates from somewhere especially when it is a point source emission. GIS is a tool that has been engaged in the analysis and mapping of spatially based phenomena, especially when it is known that such event happened somewhere. Industries have been noted to be world's major air pollution emission sources and as a result many industrialized countries of Europe and North America have embarked on some programmes aimed at reducing the effect and impact of air pollution to the environment. Information on the emission sources especially industry-based could be determined and documented for wider applications, such as for emission inventories. Determination of the geo-position and location of these industries within a stipulated area is the object of this study. This can be determined and presented in some form of database structure. In order to achieve this, a modern method of position determination using Global Position System (GPS) was adopted. Physical visits to the selected industries were carried out by the research team. The acquired data include the geographical coordinates and detailed information of respective industries, which were used for the creation of both graphic and attribute information of these industries. A GIS software ArcGIS was employed for data processing and analysis. The final result is a digital map and database showing the geographical positions of 116 industries in Aba, - an industrial city in south east Nigeria. Query tools were employed in order to extract more information on each of the industries.
Keywords: GIS; Database; Query; GPS; Emission Inventories;
*Chiemelu, N. E.; Ndukwu, R.I.; Nkwunonwo, U.C.
1.0 INTRODUCTION
Industries and industrialization have been noted to be world's major air pollution emission sources. Air pollution itself according to Seinfeld et al.(2006) is a situation in which substances that result from anthropogenic activities are present at concentrations sufficiently high above their normal ambient levels to produce a measurable effect on humans, animals, vegetation, or materials. Whichever way it is interpreted, it is an undesirable condition characteristic only of large urban centers and industrialized regions. As a result of the above assertion, many developed countries of Europe and North America have taken some drastic measures to reduce to the barest minimum the effect and impact of this phenomenon to the environment. Adequate knowledge of the emission sources especially industry-based could be determined and documented for wider applications such as emission inventories. In an attempt to develop or formulate emission standards for industries in a developing
88 89
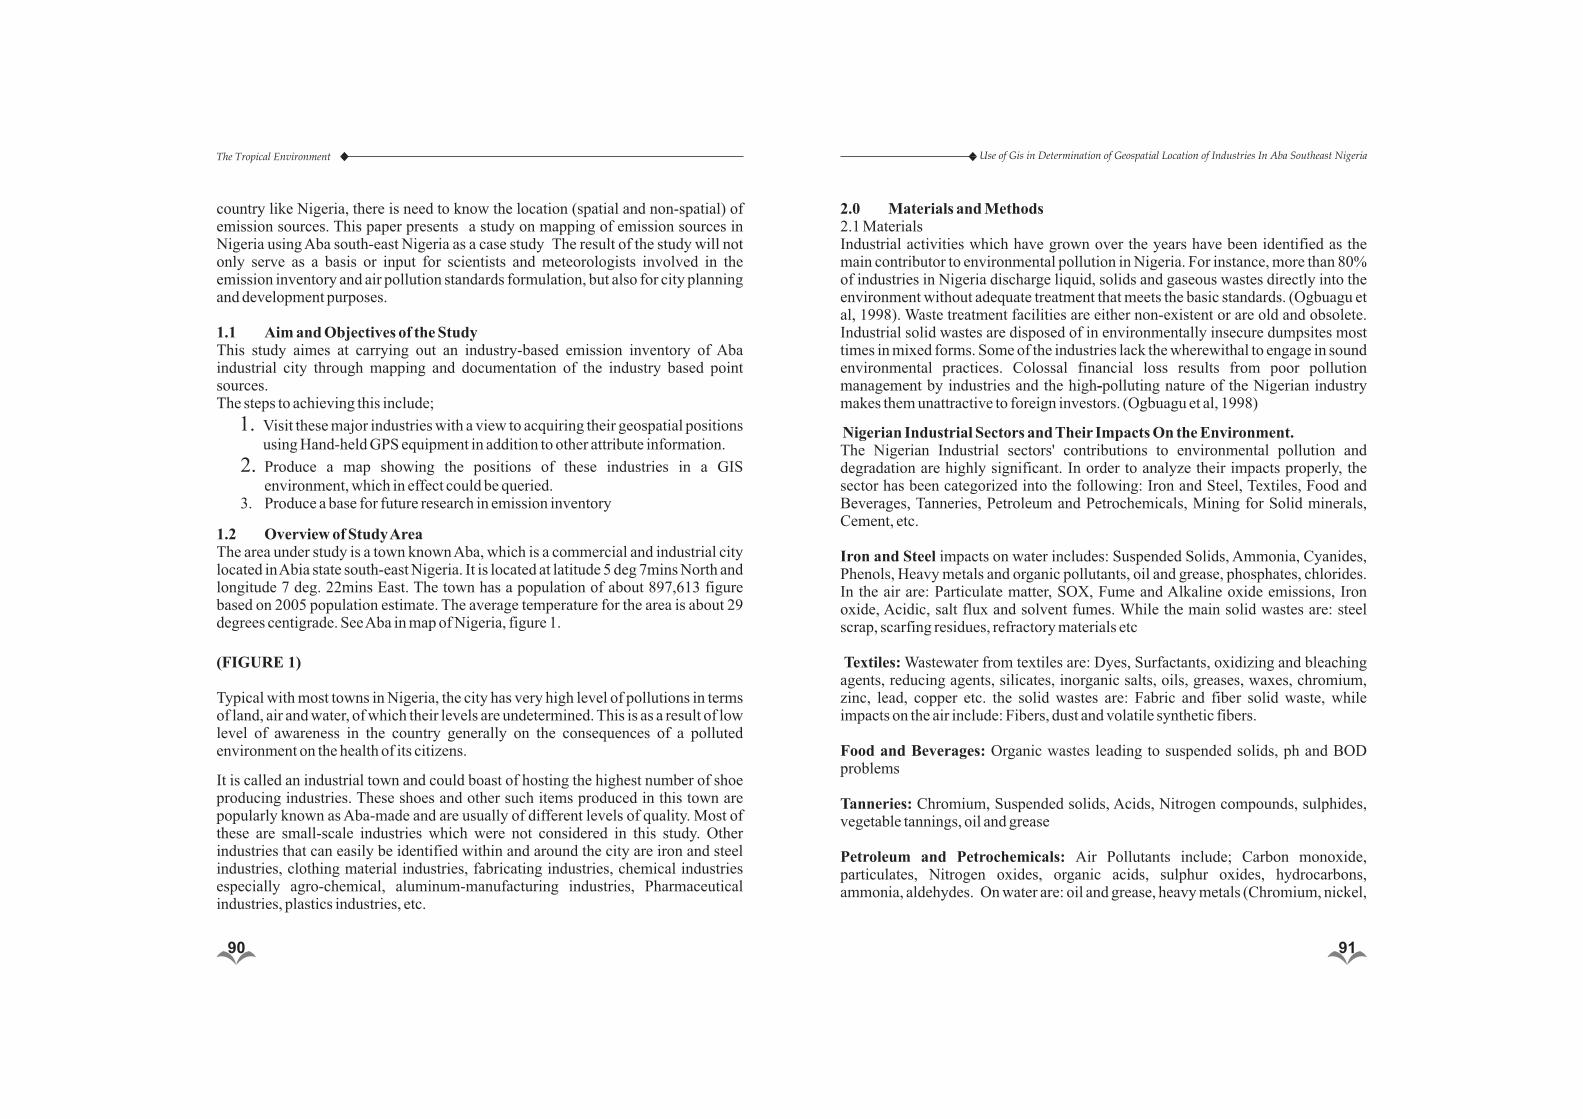
country like Nigeria, there is need to know the location (spatial and non-spatial) of emission sources. This paper presents a study on mapping of emission sources in Nigeria using Aba south-east Nigeria as a case study The result of the study will not only serve as a basis or input for scientists and meteorologists involved in the emission inventory and air pollution standards formulation, but also for city planning and development purposes. 1.1 Aim and Objectives of the StudyThis study aimes at carrying out an industry-based emission inventory of Aba industrial city through mapping and documentation of the industry based point sources.The steps to achieving this include;
1. Visit these major industries with a view to acquiring their geospatial positions using Hand-held GPS equipment in addition to other attribute information.
2. Produce a map showing the positions of these industries in a GIS environment, which in effect could be queried.
3. Produce a base for future research in emission inventory
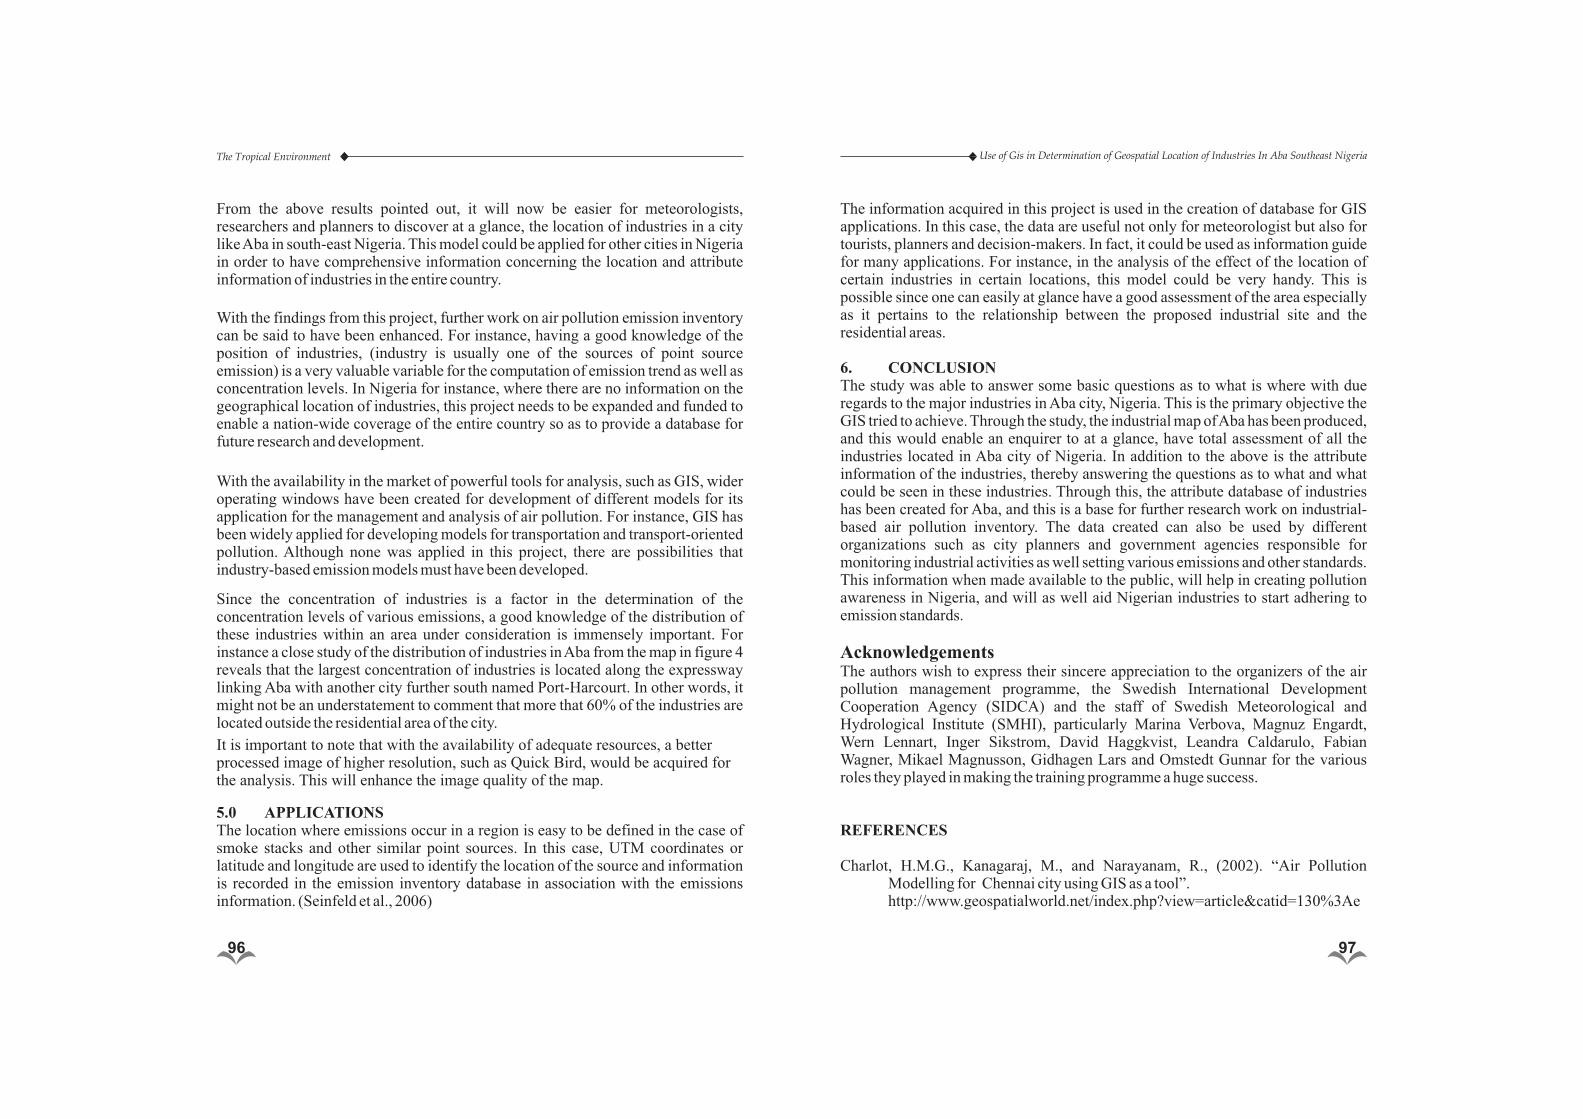
1.2 Overview of Study AreaThe area under study is a town known Aba, which is a commercial and industrial city located in Abia state south-east Nigeria. It is located at latitude 5 deg 7mins North and longitude 7 deg. 22mins East. The town has a population of about 897,613 figure based on 2005 population estimate. The average temperature for the area is about 29 degrees centigrade. See Aba in map of Nigeria, figure 1.
(FIGURE 1)
Typical with most towns in Nigeria, the city has very high level of pollutions in terms of land, air and water, of which their levels are undetermined. This is as a result of low level of awareness in the country generally on the consequences of a polluted environment on the health of its citizens.
It is called an industrial town and could boast of hosting the highest number of shoe producing industries. These shoes and other such items produced in this town are popularly known as Aba-made and are usually of different levels of quality. Most of these are small-scale industries which were not considered in this study. Other industries that can easily be identified within and around the city are iron and steel industries, clothing material industries, fabricating industries, chemical industries especially agro-chemical, aluminum-manufacturing industries, Pharmaceutical industries, plastics industries, etc.
2.0 Materials and Methods2.1 MaterialsIndustrial activities which have grown over the years have been identified as the main contributor to environmental pollution in Nigeria. For instance, more than 80% of industries in Nigeria discharge liquid, solids and gaseous wastes directly into the environment without adequate treatment that meets the basic standards. (Ogbuagu et al, 1998). Waste treatment facilities are either non-existent or are old and obsolete. Industrial solid wastes are disposed of in environmentally insecure dumpsites most times in mixed forms. Some of the industries lack the wherewithal to engage in sound environmental practices. Colossal financial loss results from poor pollution management by industries and the high-polluting nature of the Nigerian industry makes them unattractive to foreign investors. (Ogbuagu et al, 1998)
Nigerian Industrial Sectors and Their Impacts On the Environment.The Nigerian Industrial sectors' contributions to environmental pollution and degradation are highly significant. In order to analyze their impacts properly, the sector has been categorized into the following: Iron and Steel, Textiles, Food and Beverages, Tanneries, Petroleum and Petrochemicals, Mining for Solid minerals, Cement, etc. Iron and Steel impacts on water includes: Suspended Solids, Ammonia, Cyanides, Phenols, Heavy metals and organic pollutants, oil and grease, phosphates, chlorides. In the air are: Particulate matter, SOX, Fume and Alkaline oxide emissions, Iron oxide, Acidic, salt flux and solvent fumes. While the main solid wastes are: steel scrap, scarfing residues, refractory materials etc
Textiles: Wastewater from textiles are: Dyes, Surfactants, oxidizing and bleaching agents, reducing agents, silicates, inorganic salts, oils, greases, waxes, chromium, zinc, lead, copper etc. the solid wastes are: Fabric and fiber solid waste, while impacts on the air include: Fibers, dust and volatile synthetic fibers.
Food and Beverages: Organic wastes leading to suspended solids, ph and BOD problems
Tanneries: Chromium, Suspended solids, Acids, Nitrogen compounds, sulphides, vegetable tannings, oil and grease
Petroleum and Petrochemicals: Air Pollutants include; Carbon monoxide, particulates, Nitrogen oxides, organic acids, sulphur oxides, hydrocarbons, ammonia, aldehydes. On water are: oil and grease, heavy metals (Chromium, nickel,
The Tropical Environment Use of Gis in Determination of Geospatial Location of Industries In Aba Southeast Nigeria
90 91
cadmium, copper)
Cement: Impacts mostly on air are in the form of Cément kiln dust, particulates (Ogbuagu et al, 1998).
Concept of Geographic Information System and Air Pollution Management:The What GIS is all about:
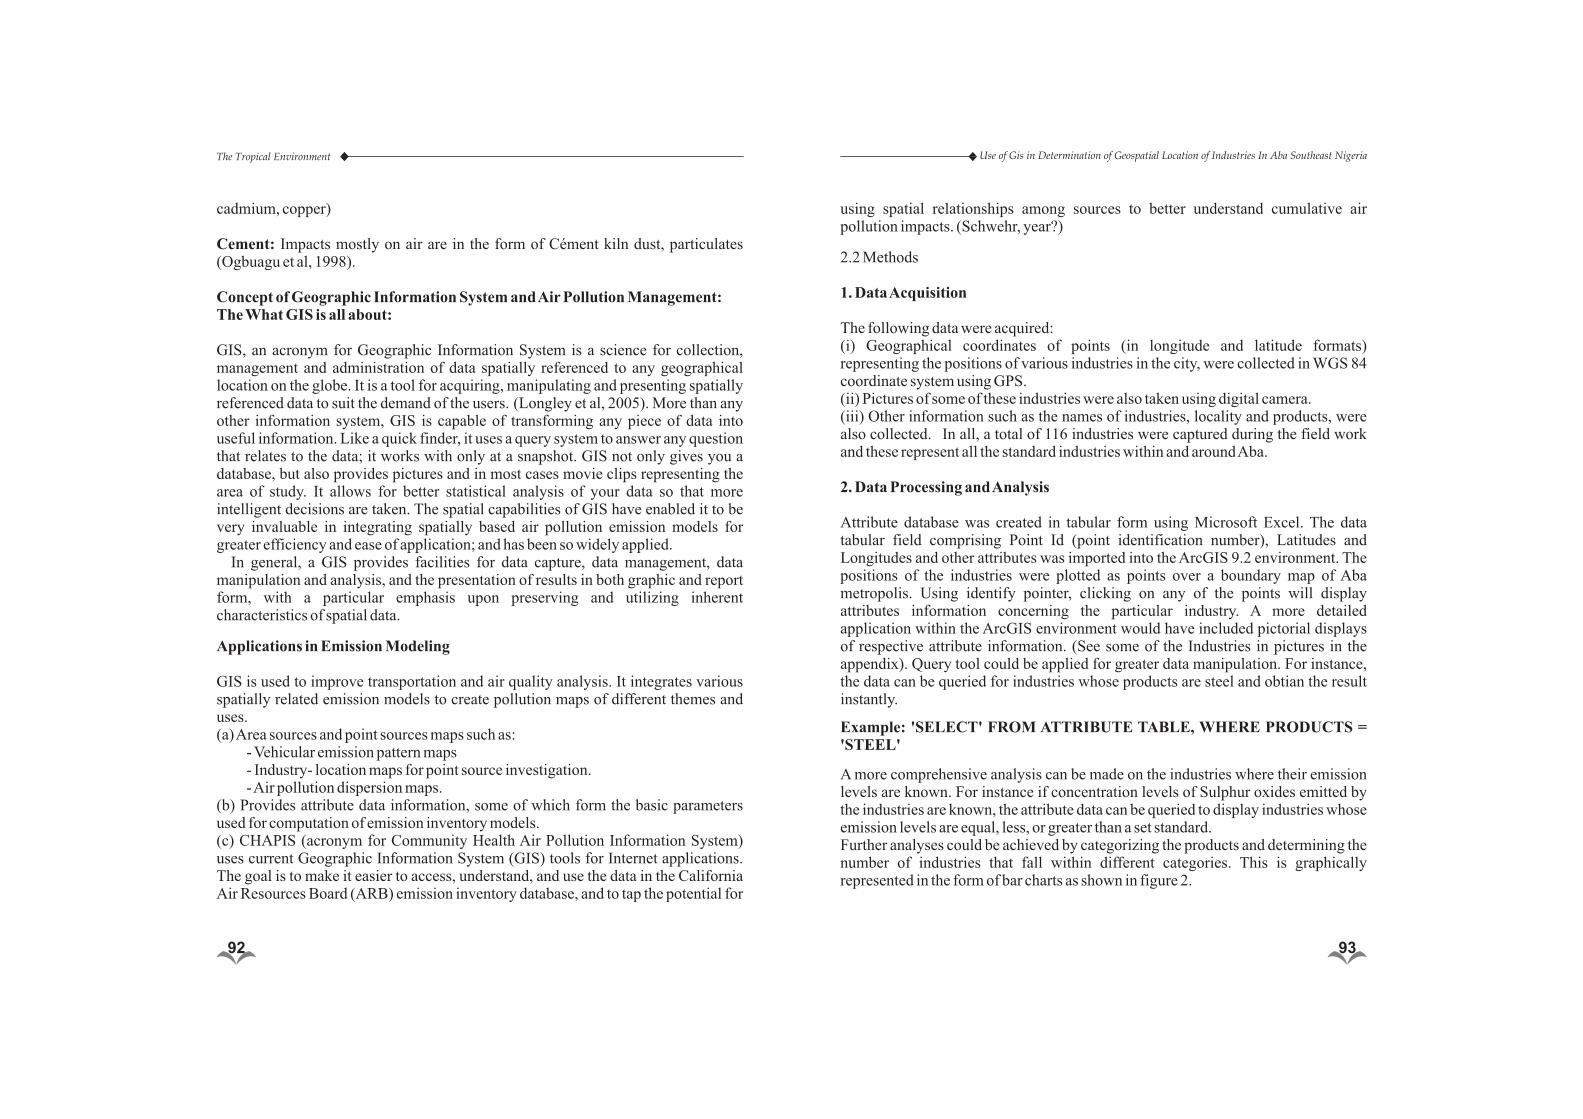
GIS, an acronym for Geographic Information System is a science for collection, management and administration of data spatially referenced to any geographical location on the globe. It is a tool for acquiring, manipulating and presenting spatially referenced data to suit the demand of the users. (Longley et al, 2005). More than any other information system, GIS is capable of transforming any piece of data into useful information. Like a quick finder, it uses a query system to answer any question that relates to the data; it works with only at a snapshot. GIS not only gives you a database, but also provides pictures and in most cases movie clips representing the area of study. It allows for better statistical analysis of your data so that more intelligent decisions are taken. The spatial capabilities of GIS have enabled it to be very invaluable in integrating spatially based air pollution emission models for greater efficiency and ease of application; and has been so widely applied. In general, a GIS provides facilities for data capture, data management, data manipulation and analysis, and the presentation of results in both graphic and report form, with a particular emphasis upon preserving and utilizing inherent characteristics of spatial data.
Applications in Emission Modeling
GIS is used to improve transportation and air quality analysis. It integrates various spatially related emission models to create pollution maps of different themes and uses.(a) Area sources and point sources maps such as:
- Vehicular emission pattern maps- Industry- location maps for point source investigation.- Air pollution dispersion maps.
(b) Provides attribute data information, some of which form the basic parameters used for computation of emission inventory models.(c) CHAPIS (acronym for Community Health Air Pollution Information System) uses current Geographic Information System (GIS) tools for Internet applications. The goal is to make it easier to access, understand, and use the data in the California Air Resources Board (ARB) emission inventory database, and to tap the potential for
using spatial relationships among sources to better understand cumulative air pollution impacts. (Schwehr, year?)
2.2 Methods
1. Data Acquisition
The following data were acquired:(i) Geographical coordinates of points (in longitude and latitude formats) representing the positions of various industries in the city, were collected in WGS 84 coordinate system using GPS.(ii) Pictures of some of these industries were also taken using digital camera.(iii) Other information such as the names of industries, locality and products, were also collected. In all, a total of 116 industries were captured during the field work and these represent all the standard industries within and around Aba.
2. Data Processing and Analysis
Attribute database was created in tabular form using Microsoft Excel. The data tabular field comprising Point Id (point identification number), Latitudes and Longitudes and other attributes was imported into the ArcGIS 9.2 environment. The positions of the industries were plotted as points over a boundary map of Aba metropolis. Using identify pointer, clicking on any of the points will display attributes information concerning the particular industry. A more detailed application within the ArcGIS environment would have included pictorial displays of respective attribute information. (See some of the Industries in pictures in the appendix). Query tool could be applied for greater data manipulation. For instance, the data can be queried for industries whose products are steel and obtian the result instantly.
Example: 'SELECT' FROM ATTRIBUTE TABLE, WHERE PRODUCTS = 'STEEL'
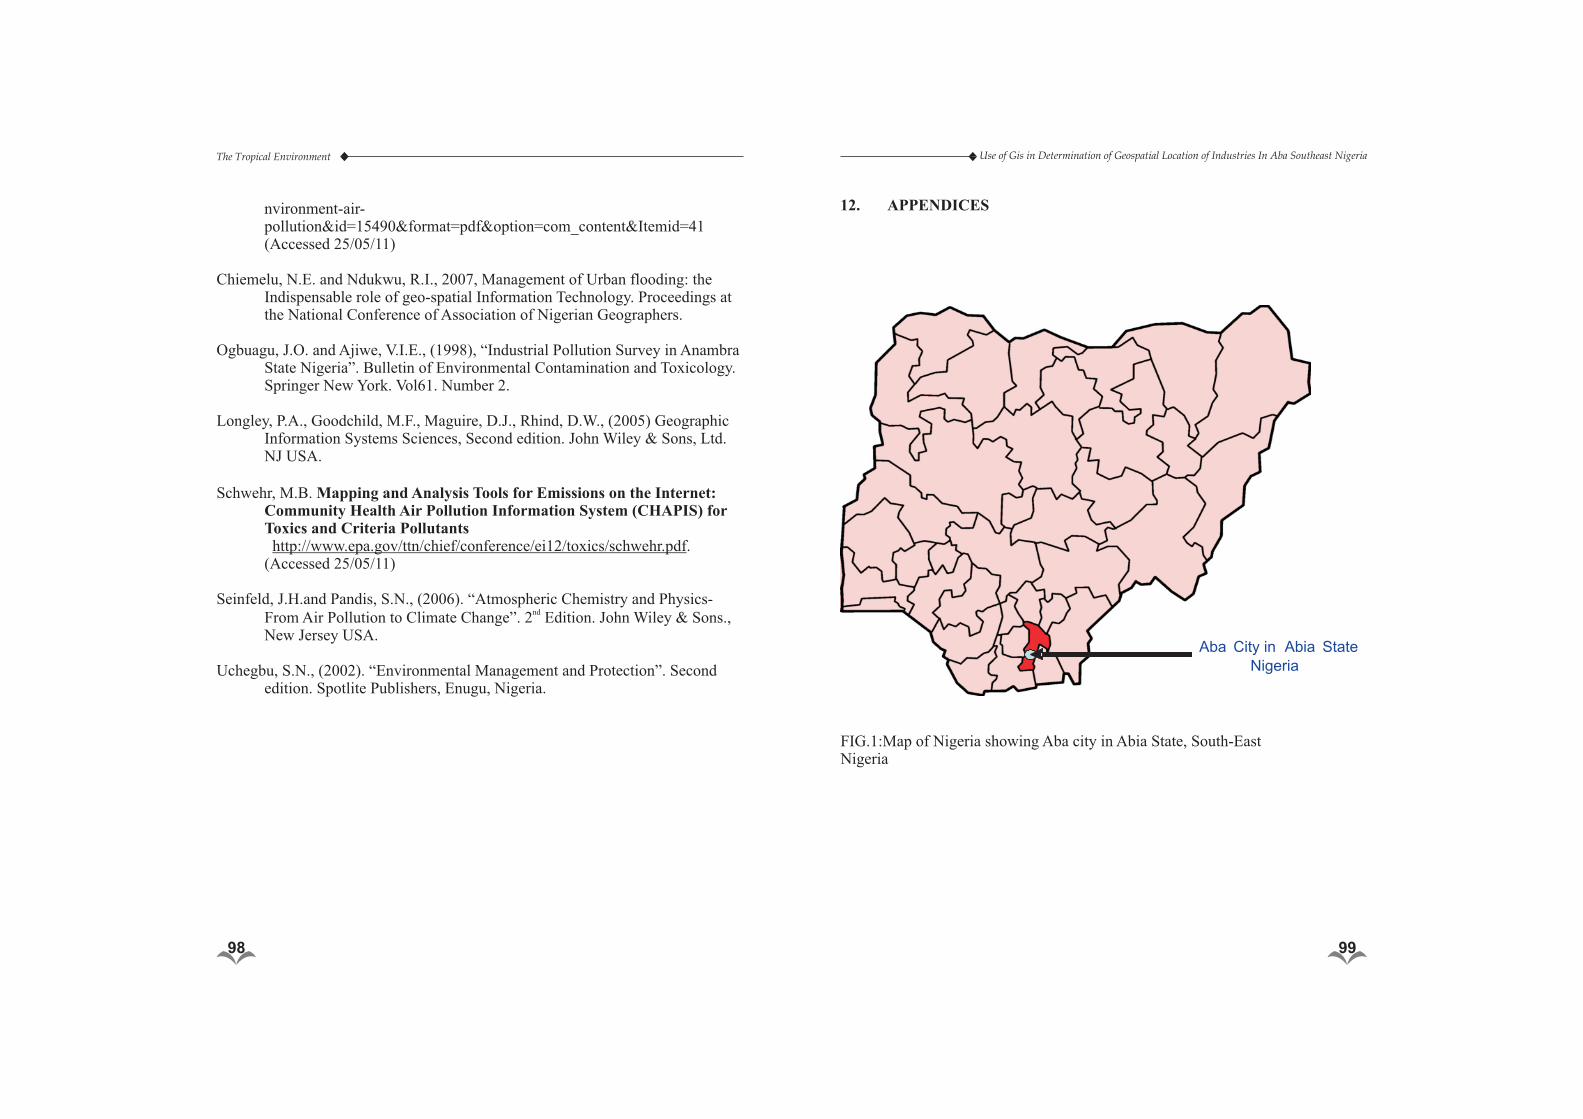
A more comprehensive analysis can be made on the industries where their emission levels are known. For instance if concentration levels of Sulphur oxides emitted by the industries are known, the attribute data can be queried to display industries whose emission levels are equal, less, or greater than a set standard.Further analyses could be achieved by categorizing the products and determining the number of industries that fall within different categories. This is graphically represented in the form of bar charts as shown in figure 2.
The Tropical Environment Use of Gis in Determination of Geospatial Location of Industries In Aba Southeast Nigeria
92 93
(FIGURE 2)When the map of the city showing the location of the industries was merged with a satellite image of the same area together, the resultant composite map shows the relationship between the ‘industries’ positions and the residential areas. The result of this analysis can be used by planners and development control in the area of decision making.
3. Data Presentation
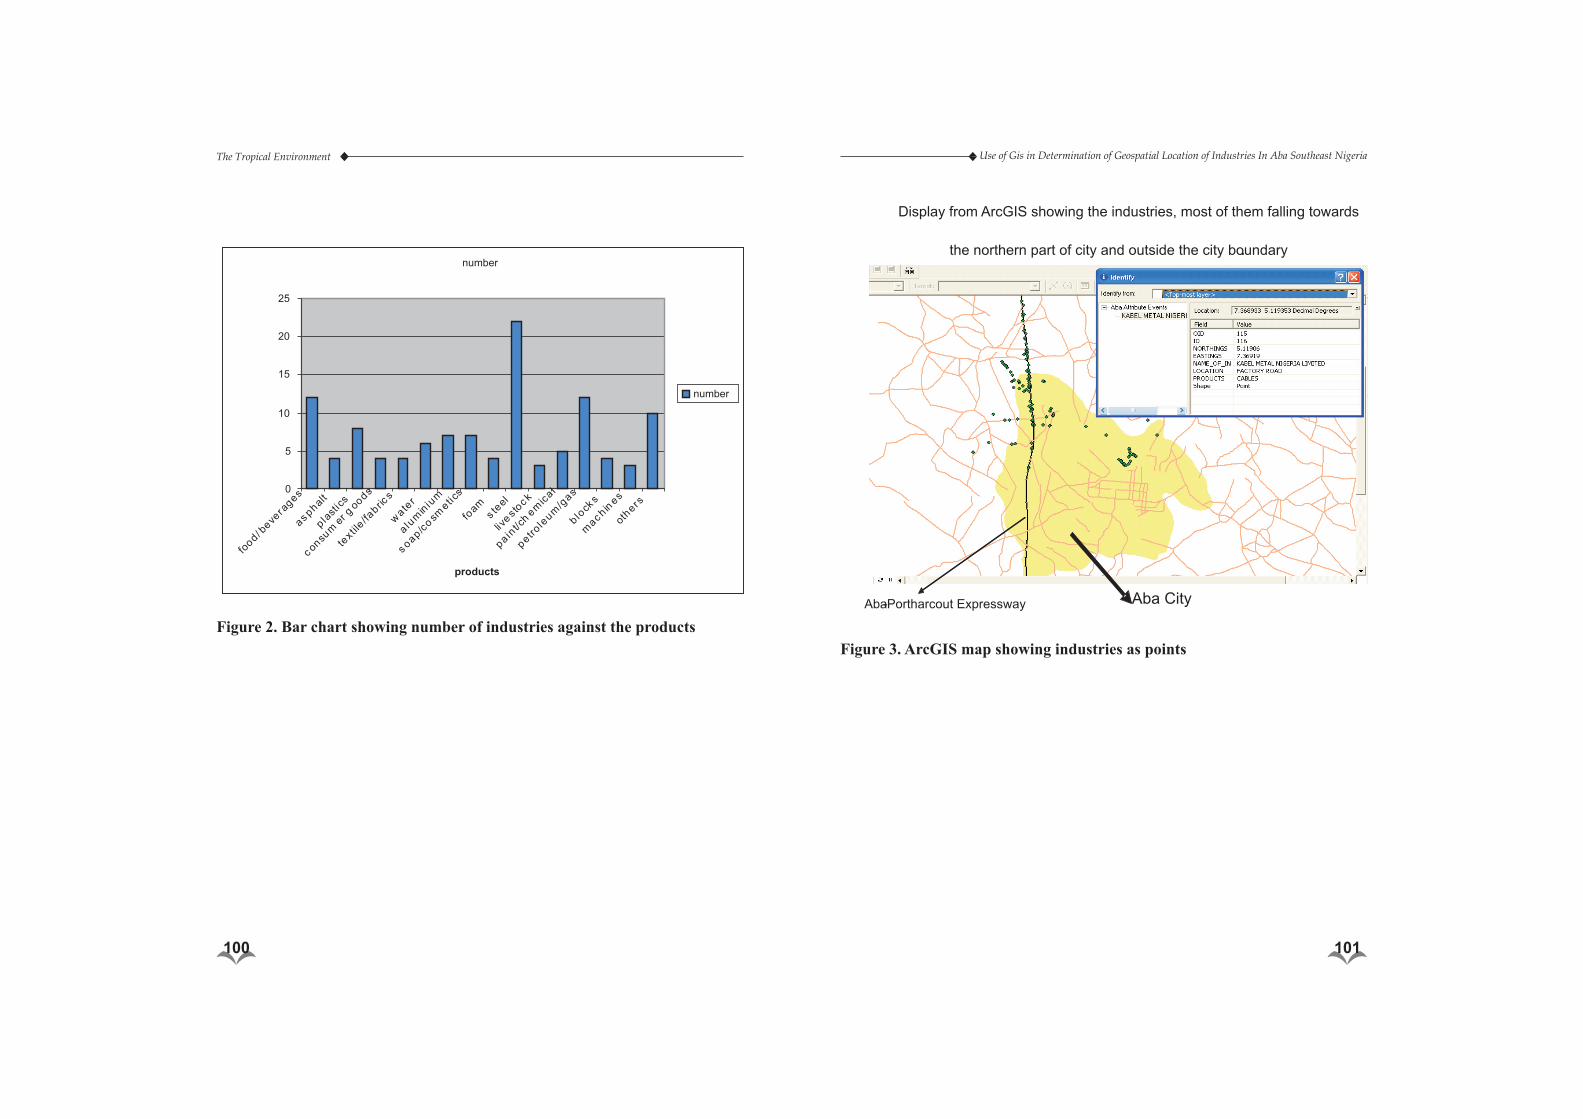
The data was presented in both graphical form showing maps and charts and the tabular form showing attribute information. See figures 2 and 4(FIGURE 3)(FIGURE 4)3.0 RESULTSThe final presentations are as follows:1. A map showing the positions of the industries in Aba industrial city. Figure 3.2. A composite map consisting of the industry locations, map of the city road network, and the satellite image of the city. Figure 53. Attribute database showing the latitude and longitude coordinates of the industries as well as other information. See attribute database in figure 4 4. Display from ArcGIS showing the industries, most of them falling towards the northern part of city and outside the city boundary. Figure 3 5. Display showing query that selected products steel from the attribute database6. Image of Aba merged with the industry map and Aba boundary map all geo-referenced.
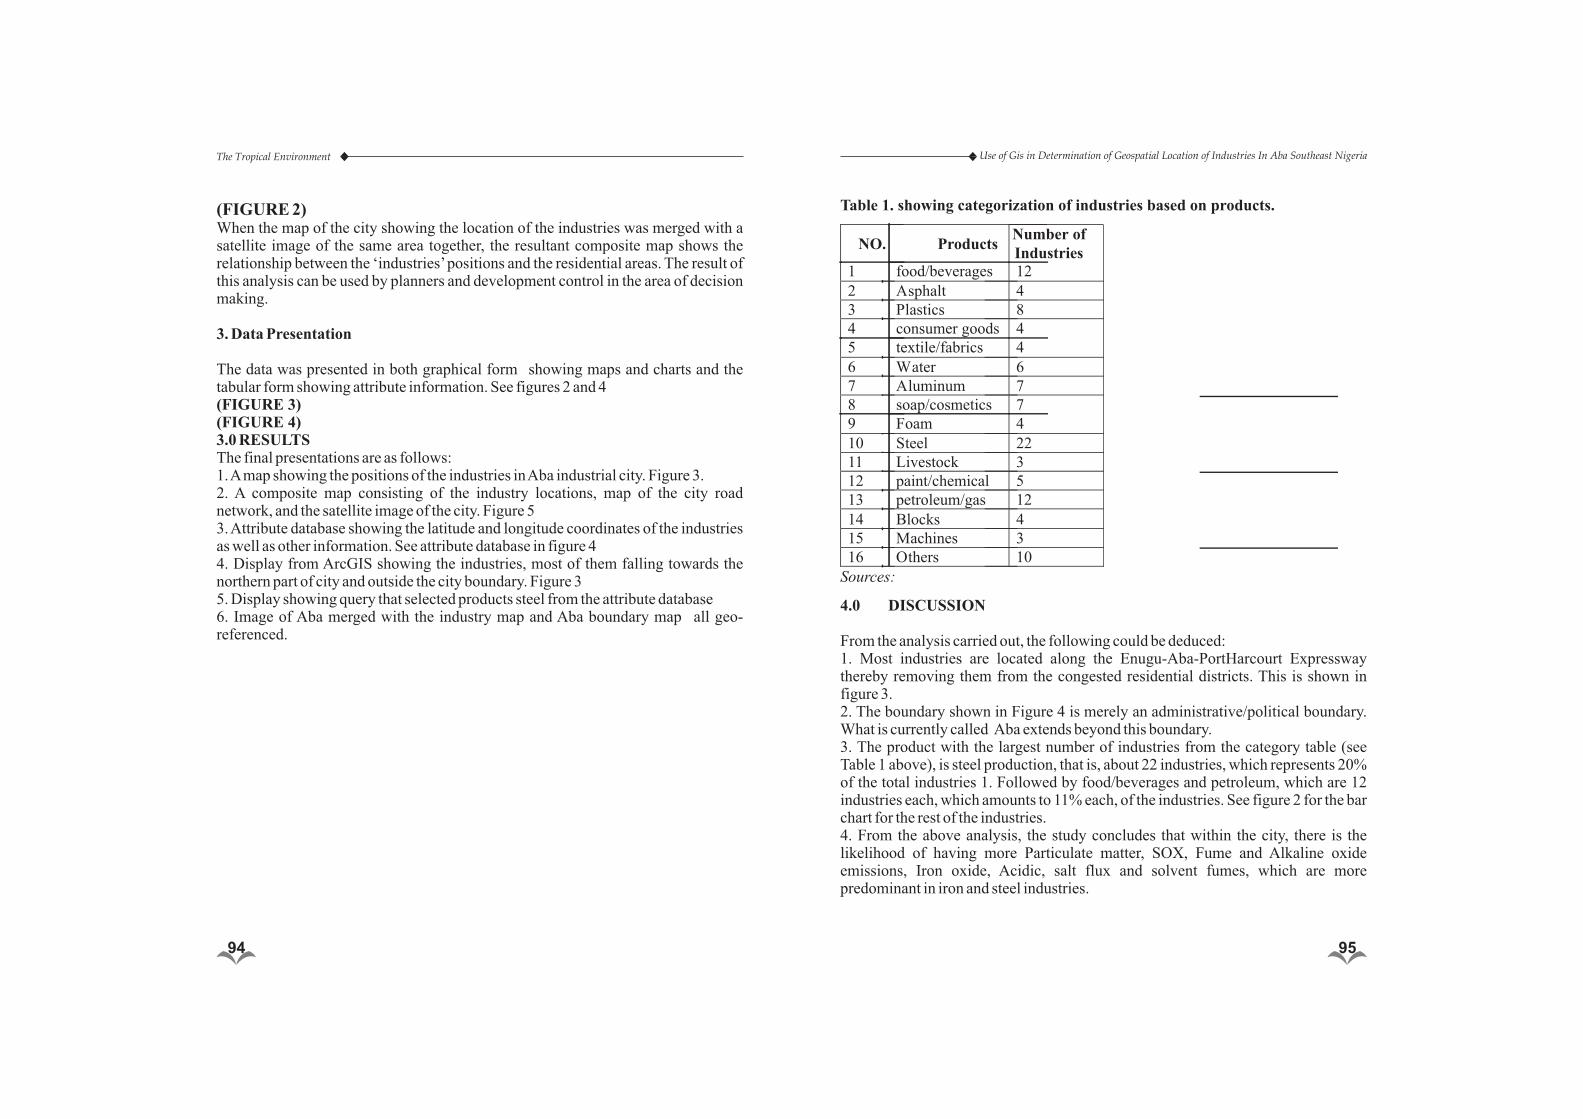
NO. Products Number of Industries
1 food/beverages 12 2 Asphalt 4 3 Plastics 8 4 consumer goods 4 5 textile/fabrics 4 6 Water 6 7 Aluminum 7 8 soap/cosmetics 7 9 Foam 4 10 Steel 22 11 Livestock 3 12 paint/chemical 5 13 petroleum/gas 12 14 Blocks 4 15 Machines 3 16 Others 10
Table 1. showing categorization of industries based on products.
4.0 DISCUSSION
From the analysis carried out, the following could be deduced:1. Most industries are located along the Enugu-Aba-PortHarcourt Expressway thereby removing them from the congested residential districts. This is shown in figure 3.2. The boundary shown in Figure 4 is merely an administrative/political boundary. What is currently called Aba extends beyond this boundary. 3. The product with the largest number of industries from the category table (see Table 1 above), is steel production, that is, about 22 industries, which represents 20% of the total industries 1. Followed by food/beverages and petroleum, which are 12 industries each, which amounts to 11% each, of the industries. See figure 2 for the bar chart for the rest of the industries.4. From the above analysis, the study concludes that within the city, there is the likelihood of having more Particulate matter, SOX, Fume and Alkaline oxide emissions, Iron oxide, Acidic, salt flux and solvent fumes, which are more predominant in iron and steel industries.
The Tropical Environment Use of Gis in Determination of Geospatial Location of Industries In Aba Southeast Nigeria
94 95
Sources:
From the above results pointed out, it will now be easier for meteorologists, researchers and planners to discover at a glance, the location of industries in a city like Aba in south-east Nigeria. This model could be applied for other cities in Nigeria in order to have comprehensive information concerning the location and attribute information of industries in the entire country.
With the findings from this project, further work on air pollution emission inventory can be said to have been enhanced. For instance, having a good knowledge of the position of industries, (industry is usually one of the sources of point source emission) is a very valuable variable for the computation of emission trend as well as concentration levels. In Nigeria for instance, where there are no information on the geographical location of industries, this project needs to be expanded and funded to enable a nation-wide coverage of the entire country so as to provide a database for future research and development.
With the availability in the market of powerful tools for analysis, such as GIS, wider operating windows have been created for development of different models for its application for the management and analysis of air pollution. For instance, GIS has been widely applied for developing models for transportation and transport-oriented pollution. Although none was applied in this project, there are possibilities that industry-based emission models must have been developed.
Since the concentration of industries is a factor in the determination of the concentration levels of various emissions, a good knowledge of the distribution of these industries within an area under consideration is immensely important. For instance a close study of the distribution of industries in Aba from the map in figure 4 reveals that the largest concentration of industries is located along the expressway linking Aba with another city further south named Port-Harcourt. In other words, it might not be an understatement to comment that more that 60% of the industries are located outside the residential area of the city.
It is important to note that with the availability of adequate resources, a better processed image of higher resolution, such as Quick Bird, would be acquired for the analysis. This will enhance the image quality of the map.
5.0 APPLICATIONSThe location where emissions occur in a region is easy to be defined in the case of smoke stacks and other similar point sources. In this case, UTM coordinates or latitude and longitude are used to identify the location of the source and information is recorded in the emission inventory database in association with the emissions information. (Seinfeld et al., 2006)
The information acquired in this project is used in the creation of database for GIS applications. In this case, the data are useful not only for meteorologist but also for tourists, planners and decision-makers. In fact, it could be used as information guide for many applications. For instance, in the analysis of the effect of the location of certain industries in certain locations, this model could be very handy. This is possible since one can easily at glance have a good assessment of the area especially as it pertains to the relationship between the proposed industrial site and the residential areas.
6. CONCLUSIONThe study was able to answer some basic questions as to what is where with due regards to the major industries in Aba city, Nigeria. This is the primary objective the GIS tried to achieve. Through the study, the industrial map of Aba has been produced, and this would enable an enquirer to at a glance, have total assessment of all the industries located in Aba city of Nigeria. In addition to the above is the attribute information of the industries, thereby answering the questions as to what and what could be seen in these industries. Through this, the attribute database of industries has been created for Aba, and this is a base for further research work on industrial-based air pollution inventory. The data created can also be used by different organizations such as city planners and government agencies responsible for monitoring industrial activities as well setting various emissions and other standards. This information when made available to the public, will help in creating pollution awareness in Nigeria, and will as well aid Nigerian industries to start adhering to emission standards.
AcknowledgementsThe authors wish to express their sincere appreciation to the organizers of the air pollution management programme, the Swedish International Development Cooperation Agency (SIDCA) and the staff of Swedish Meteorological and Hydrological Institute (SMHI), particularly Marina Verbova, Magnuz Engardt, Wern Lennart, Inger Sikstrom, David Haggkvist, Leandra Caldarulo, Fabian Wagner, Mikael Magnusson, Gidhagen Lars and Omstedt Gunnar for the various roles they played in making the training programme a huge success.
REFERENCES
Charlot, H.M.G., Kanagaraj, M., and Narayanam, R., (2002). “Air Pollution Modelling for Chennai city using GIS as a tool”. http://www.geospatialworld.net/index.php?view=article&catid=130%3Ae
The Tropical Environment Use of Gis in Determination of Geospatial Location of Industries In Aba Southeast Nigeria
96 97
nvironment-air-pollution&id=15490&format=pdf&option=com_content&Itemid=41 (Accessed 25/05/11)
Chiemelu, N.E. and Ndukwu, R.I., 2007, Management of Urban flooding: the Indispensable role of geo-spatial Information Technology. Proceedings at the National Conference of Association of Nigerian Geographers.
Ogbuagu, J.O. and Ajiwe, V.I.E., (1998), “Industrial Pollution Survey in Anambra State Nigeria”. Bulletin of Environmental Contamination and Toxicology. Springer New York. Vol61. Number 2.
Longley, P.A., Goodchild, M.F., Maguire, D.J., Rhind, D.W., (2005) Geographic Information Systems Sciences, Second edition. John Wiley & Sons, Ltd. NJ USA.
Schwehr, M.B. Mapping and Analysis Tools for Emissions on the Internet: Community Health Air Pollution Information System (CHAPIS) for Toxics and Criteria Pollutants
http://www.epa.gov/ttn/chief/conference/ei12/toxics/schwehr.pdf. (Accessed 25/05/11)
Seinfeld, J.H.and Pandis, S.N., (2006). “Atmospheric Chemistry and Physics- ndFrom Air Pollution to Climate Change”. 2 Edition. John Wiley & Sons.,
New Jersey USA.
Uchegbu, S.N., (2002). “Environmental Management and Protection”. Second edition. Spotlite Publishers, Enugu, Nigeria.
12. APPENDICES
Aba City in Abia StateNigeria
The Tropical Environment Use of Gis in Determination of Geospatial Location of Industries In Aba Southeast Nigeria
98 99
FIG.1:Map of Nigeria showing Aba city in Abia State, South-EastNigeria
number
0
5
10
15
20
25
food/ b
evera
ges
as phalt
p last
ics
c onsum
er goods
textil
e /fabric
s
wate
r
a lum
iniu
m
soap/cosm
etics
foam
s teel
livesto
c k
paint/c
hem
ica l
petro le
um/g
as
block
s
machin
es
others
products
number
Figure 2. Bar chart showing number of industries against the products
Display from ArcGIS showing the industries, most of them falling towards
the northern part of city and outside the city boundary.
Aba CityAba-Portharcout Expressway
Figure 3. ArcGIS map showing industries as points
The Tropical Environment Use of Gis in Determination of Geospatial Location of Industries In Aba Southeast Nigeria
100 101
Display showing query that selected products steel from the attribute database
Figure 4. Query selecting industries that produce steel
Image of Aba merged with the industry map and boundary map all geo-referenced.
Figure 5. Showing overlay of image of Aba
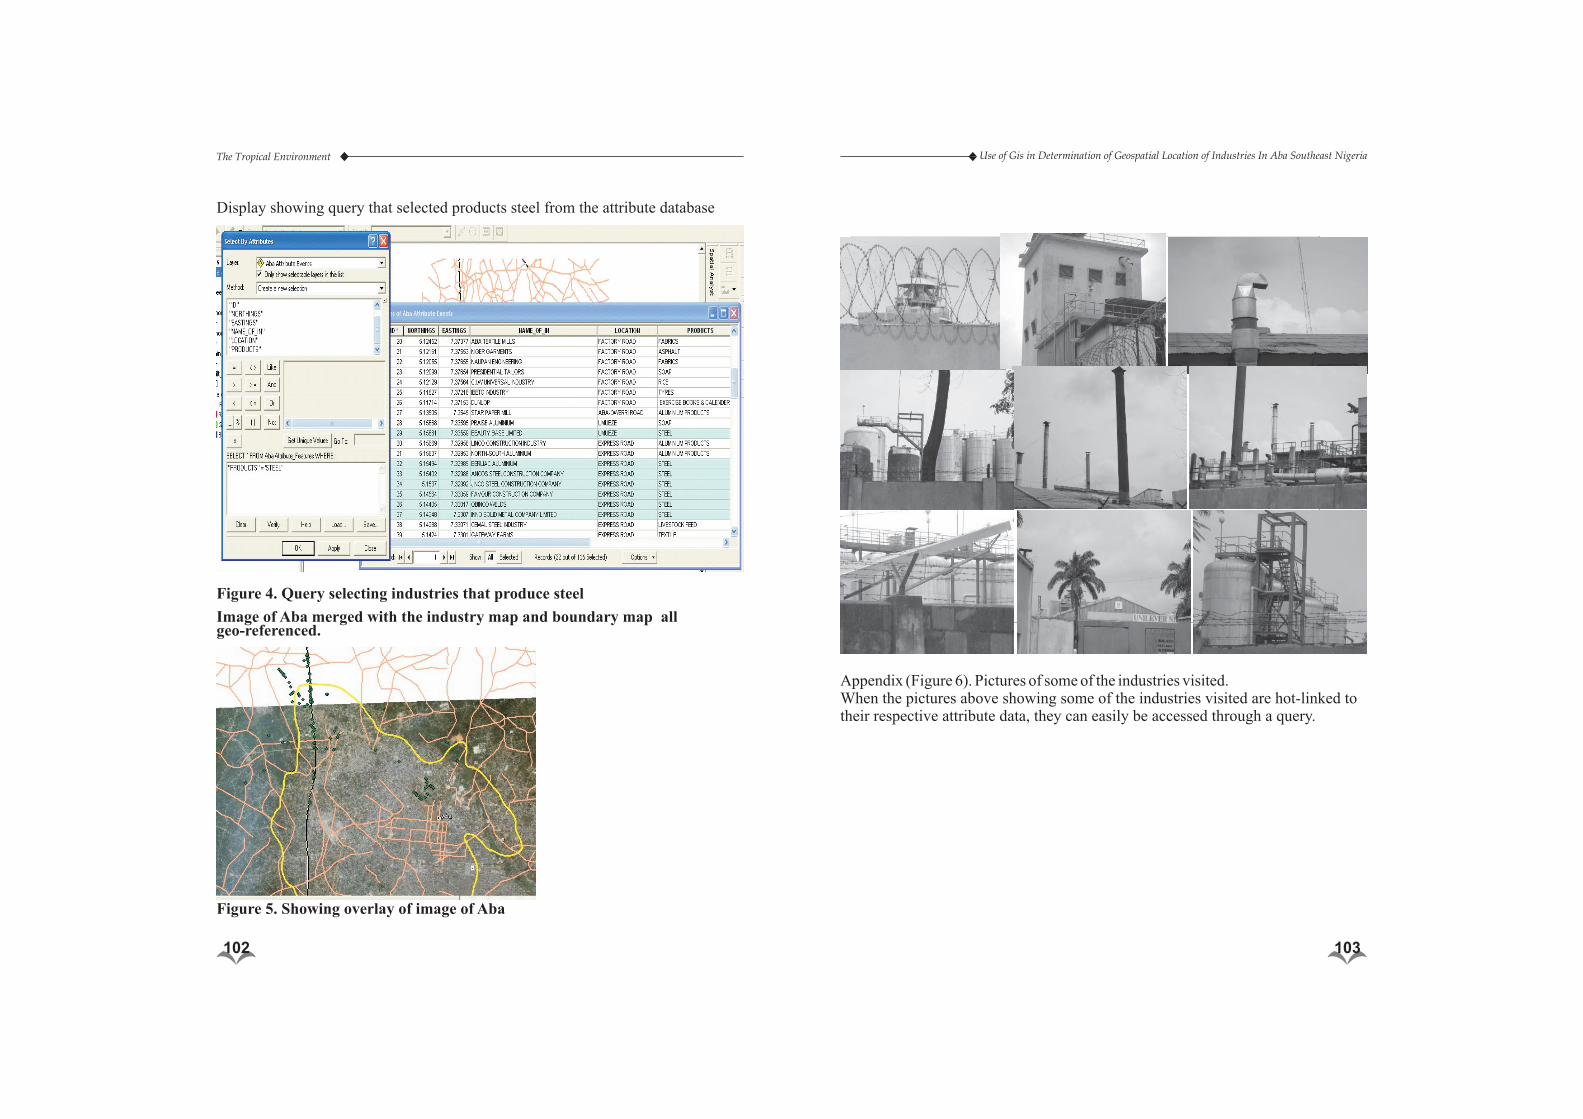
Appendix (Figure 6). Pictures of some of the industries visited.When the pictures above showing some of the industries visited are hot-linked to their respective attribute data, they can easily be accessed through a query.
The Tropical Environment Use of Gis in Determination of Geospatial Location of Industries In Aba Southeast Nigeria
102 103