Embed Size (px)
Citation preview

I NIVKRSITY OF NAIROBI
USE OF GEOGRAPHICAL INFORMATION SYSTEM (GIS) IN
MANAGING UTILITY INCIDENCES.
A Case Study o f Kenya Power Company, Roysambu Area in Nairobi County
By
kariuki John Wanyagia F56/63271/2010
Research Project Report submitted in partial ridfiluienl of the requirement
for the award o f Degree in Master o f Science in Geographic Information
Systems at the University o f Nairobi.
Department of Geospatial and Space Technology. School id' Engineering
Ju n e 2012
Unwm* d wuacei -«i~y

Declaration
lliis is my original work and has not been presented for a degree in any other University.
Signature.......... J g S ' ............................. Date. ̂ 2 1 ^ . .....John Wanyngia Kariuki
This project report has been submitted for the examination with my approval as the University Supervisor.
Signature.Dr. Ing. I'.N. KaraTtja
.Date.
ii

DEDICATION
I o my Family. Parents and Friends who gave me the support I required.

ACKNOW LEIK. KM ENT
My heartfelt thank you to the Almighty Lord for making this Journey a success.
My appreciation goes to my supervisor Dr. -Ing F.N. Karanja for the priceless guidance given throughout the project.
Mr. rx*nis Ndxviga of Partcchs Limited thanks for all the guidance accorded to me in designing the spatial web based system.
l o my Beloved Wife Loisc for her support and understanding.
tv

a b s t r a c t
In pursuance of an effective incidence management within utility line of business, the businesses
should ensure that spatial details and web based system arc utilized in managing the incidences.
At present the Kenya Power company, docs not utilize spuliul details and there is no web based
system utilized in incidence management.The aim of the project was to demonstrate the a>lc of GIS in managing utility services incidences
using Kenya power as a case study.A spatial web based system was developed and tested to address customer's location
consideration and a web based solution when managing power outage incidences at Roysumbu
Area. Nairobi. Kenya. The system will be hosted and managed at Kenya Power company
premises.It was not possible to host the system online, and thus impossible to demonstrate use of smart
phones used by Held personnel’s.The project should be adopted by Kenya Power Company to enhance its incidence service
management.I he method used in this project is potentially applicable in other utility industries as well as other
investments not necessarily on utility line of business.
v
TABLE OF CONTENTS PAGE
DECLARATION............................................................................................................ ii
DEDICATION............................................................................................................... iiiACKNOWLEDGEMENT............................................................................................ iv
ABSTRACT....................................................................................................................v
TABLE OF CONTENTS.............................................................................................. vi
LIST OF FIGURES........................................................................................................ ix
LIS T OF TABLES........................................................................................................... xABBREVIATIONS.........................................................................................................xi
CHAPTER 1: INTRODUC TION.................................................................................... I
l.t Background.................................................................................................................I1.2 Problem Statement..................................................................................................... 21.3 Research objective......................................................................................................31.3.1 Overall Objective.................................................................................................... 31.3.2 Specific Objectives..................................................................................................31.4 Research questions..................................................................................................... 31.5 Scope and Limitation of the study.............................................................................. 41.6 Justification of the study............................................................................................ 41.7 Organization of the Report..........................................................................................5
CHAPTER 2: LITERATURE REVIEW.......................................................................... 6
2.1.1 Electricity Generation..............................................................................................62.1.2 Other generating Sources.........................................................................................82.1.3 Electric Power Transmission................................................................................... 82.1 Kenya Power Company.............................................................................................92.1.1 Sources of Power.................................................................................................... 92.1.2 Transmission and Distribution.................................................................................92.1.3 Company Quality Policy........................................................................................ 102.2 GIS For Utility Industries....................................................................................... 102.2.1 GIS For Electric Industries.................................................................................. . 112.2.2 Case Study: Application of GIS in Utility industry.................................................12a) Improving REMC Outage Response with Mobile GIS............................................... 12hi ki MG Challenge........................................................................................................13
vi
c) REMC Solution......................................................................................................... 13d) REMC Results...........................................................................................................142.2.3 Critique.................................................................................................................I 52.2.3 Research Gap........................................................................................................15
CHAPTER 3: METHODS............................................................................................. 16
3.1 Study Area...............................................................................................................163.2 Data and Tools.........................................................................................................1 83.2.1 Data Sources................................................................................ - ......................>83.2.2 Tools..................................................................................................................... 183.3 Developing GIS hased incidence system for power outage.................................... I‘>3.3.1 Conceptual framework.........................................................................................193.3.2 Data Collection.................................................................................................... 203.3.3 Data presentation................................................................................................. 203.3.3 GIS database development.................................................................................... 213.3.4 Web based system development........................................................................... 24
CHAPTER 4: RESULTS AND DISCUSSION............................................................. 25
4.1 W'cb based system................................................................................................. 254.1.1 Creating meters.................................................................................................... 294.1.2 Raising a ticket..................................................................................................... 334.1.3 Customers............................................................................................................ 384.1.4 Distribution points............................................................................................... 394.1.5 Users list..............................................................................................................404.1.6 Ticket status......................................................................................................... 414.1.7 Ticket Escalation.................................................................................................. 414.2 Spatial Database......................................................................................................424.3 Incidence reports..................................................................................................... 464.4 System Comparison............................................................................................... 464.5 Discussions of the results........................................................................................ 49
PAGE
VII

CHAPTER 5: C ONCLUSIONS AND RECOMMENDATIONSPAGE ...... 50
5 1 Conclusions........5.2 Recomendations.
Ri FI RENCES
a ppe n d ix 54
, 1ST OF FIGURES PAGEFigure l.l Structure of this Report..........................................................................5Figure 2.1 Color-coding Facilities.......................................................................... MFigure 3.1 Maps of the area of study......................................................................17Figure 3.3 Conceptual Framework......................................................................... 19Figure 3.4 Database classes....................................................................................22Figure 3.5 Database Schema..................................................................................23Figure 4.1 System display page.............................................................................25Figure 4.2 System login page................................................................................26Figure 4.3 Residential meter location on the Utility Mapper system.....................27
Figure 4.4 Transformer locations on the Utility Mapper System...........................28
figure 4.5 Creating customer meter selecting satellite option on google map.......29
Figure 4.6 How to create customer meter selecting map option on google map....30
Figure 4.7 location of a specific residential power meter.....................................31
Figure 4.8 Location of a specific commercial meter............................................. 32
Figure 4.9 How to create a ticket...........................................................................33f igure 4.10 Numbers of active tickets and total tickets..........................................34
Figure 4 .11 Number of tickets and spatial details of a specific transformer.......... 35
Figure 4.12 Power outage ticket displaying location, number & username..........36
Figure 4.13 List of tickets..................................................................................... 37
Figure 4.14 List of power customers...................................................................38
Figure 4.15 List of distribution points...................................................................39
Figure 4.16 Showing a list of users.......................................................................40Figure 4.171 low to query ticket number to get the reported incidence status.......4 1
Figure 4.18 Spatial database documents................................................................43
Figure 4.19 Spatial database Collections...............................................................44figure 4.20 Sputial Dutubasc - Meters data details.............................................. 45
f igure 4.21 Spatial Database - Customers data details........................................ 45
Figure 4.22 Systems type comparison...................................................................47
Figure 4.23 Customer location comparisons.........................................................48

1.1ST OF TABLES PAGE
fable 3.1 Data Sources 18
x

ABBREVIATIONS
GIS Geographical Information Systems
KENGLN Kenya Electricity Generating Company
CCK Communication Commission of Kenya
IP Internet Protocol
ra pd rp Restructured-Accelerated Power Development and Reforms
Programme
I-SRI Environmental Systems Research Institute
IMS Incidence Management System
USIU United States International University
PAC Pan Africa Christian University
MISC Moi International Sports Centre
RAM Read Access Memory
GB Gigabyte
KNUS Kenya National Bureau of Statistics
REMC Rural Electric Membership Corporation
API Application Programming Interface
REST Rl presentational Stale Transfer
REMC Rural Electric Membership Corporation
xi

1: INTRODUCTION
l.l BackgroundWithin the Kenyan government, performance contracting policy, its duty of citizens to
-demand excellent Service as your right". (Public Sector Reforms & Performance
Contracting, 2012)Customers arc always demanding for quality and excellent services from the public offices,
including the utility industries. Prompt, efficient and effective incident management within
the utility industries will ensure excellent service provision. Ibis has lead to utility
companies to align their visions to customers’ needs and satisfaction e.g. "To provide
world class power that delights our customers." (Kenya Power, 2012), "Satisfaction of all
our customers with water and sewerage services.” (Nairobi City Water and Sewerage
Company, 2012) and ulso the utility companies have aligned one of their core values to
customer focus e.g. “Customer first" (Kenya Power. 2012). "Customer Focus" (Nairobi
City Water and Sewerage Company, 2012).
The high competition existing in today’s Business world, coupled by contract based and job
performance evaluation done frequently have made utility companies including Kenya
Power. Nairobi City water and sewerage Company . Kenya Pipeline Company Limited etc.
to strive to offer timely, efficient and effective services to its customers.
I he current procedure at the company is whereby a customer calls to report the problem,
which is received by the company customer care stall', who then logs in the details of the
problem to the system which generates a work order. I he work order is allocated to the
field team personnel with the accompanying customer details. In most cases the work
orders arc given out in the morning and the field team dispatched, all other upcoming issues
after this arc sometimes left pending until the following morning which causes delay on
service delivery. (Kenya Power. 2012)
The field team personnel use the customer details as per the work order to try and locate the
exact customer location address including the road, street, house number, plot. etc.
In most cases the field team personnel repeatedly call the customer to trace the exact
location, which itself is not an effective way of undertaking the task
Moreover, when the field personnel solves the issue there is no way of updating the status
of work order until they arc back in the office and upload the details to update the work
order status. The customers have no access of knowing and verifying the status of their
issue. It’s also difficult to update f ield team |>ersonnel of new work order w hile in field.
Chapter
Page 1 of 60

(ilS systems have shown potential to address the above shorteomings (CyberSWIFT,
2012), (FSRI, 2012). through spatial web based system it is possible to display a map
clearly showing the specific physical address of the customers including the name of the
road, street, plot and house number, etc.
The customers can be able to view the status of their issues through logging in to the
system. Through this system the field personnel will also be able to receive upcoming work
orders while on the field, and also submit the report promptly upon completion of their
work or for escalation making it easier for their supervisors to know their progress and lor
company and customers get the current status of the work order promptly.
Ihc company will be able to inform and update the customers on incidence progress or
other issues through short message services. The customer can freely interact with the
system through a voice call, through short message service, through web bused system or
by walk in to the company offices to report the incidences.
1.2 Problem Statement
Quality, effective and efficient customer service is a major driver for business continuity,
winning trust and confidence of the customers. Customer satisfaction is the key to success.
Getting your customers to tell you what's good about your products or services, and where
you need improvement, helps you to ensure that your business measures up to their
expectations. (SMKToolkit. 2012). Businesses all over the world are coming up with means
and methods of ensuring utmost customer satisfaction. Companies arc conducting
researches on customer satisfaction, investing in modern technologies with the aim of
achieving ways of retaining and attracting more customers which will translate to more
business opportunities and hence more revenues.
The utility companies have also embarked on various ways and methods to ensure quality,
timely and efficient Incidences resolutions.
I hc current procedure of solving incidences in utility industry, with emphasis on Kenya
Power have a gap in that there is no consideration for spatial aspects and web based
solution in addressing the incidences. Location based technologies and web based solutions
have iwt been utilized to cope with increasing customer incidences. The field team
personnel relics on the information keyed in by the customer care when the customer was
reporting the incidence, they do not have a mechanism of locating the customer location at
a glance .direction to the customer location, plot number, etc. (Kenya Power, 2012)
Page 2 of 60

Ihe proposed system have a spatial database and it's web based, it will maintain the
customer data including spatial details and attributes data. Held team will be able to use
smart phones to receive and update work orders, company will be able to inform and
interact with their customers through short message services and customers will have a
portal where they can log key in their incidences and also track the status of the reported
incidences.
Research objective
1.3.1 Overall ObjectiveI he overall objective of the study was to demonstrate the role of'GIS in managing utility
services incidences using Kenya power as a ease study.
1.3.2 Specific ObjectivesIhe specific objectives of the proposed research included:
i. To review the current system used to address utility services incidences.
ii. To identify requirements for an efficient system.
iii. To design a spatial web based incidence management system.
iv. Implement the incidence management system.
v. Evaluate the potential of system to improve efficiency in incidence resolutions.
vi. To compare between new system and current system.
1.4 Research questions
Ihe research questions to be addressed include the following:
i. What's the current system in use in management of power utility incidences in Kenya?
ii. What encompasses an efficient system in management of power utility incidences in
Kenya?
•ii. What will be the requirement lor a spatial web based system in management of power
utility incidences in Kenya?
•v. What are the requirements to implement the new system ?
v. What arc the improvements and challenges brought about by the new system?
vi. What are the indicators to apply for systems comparison?
Page 3 of 60
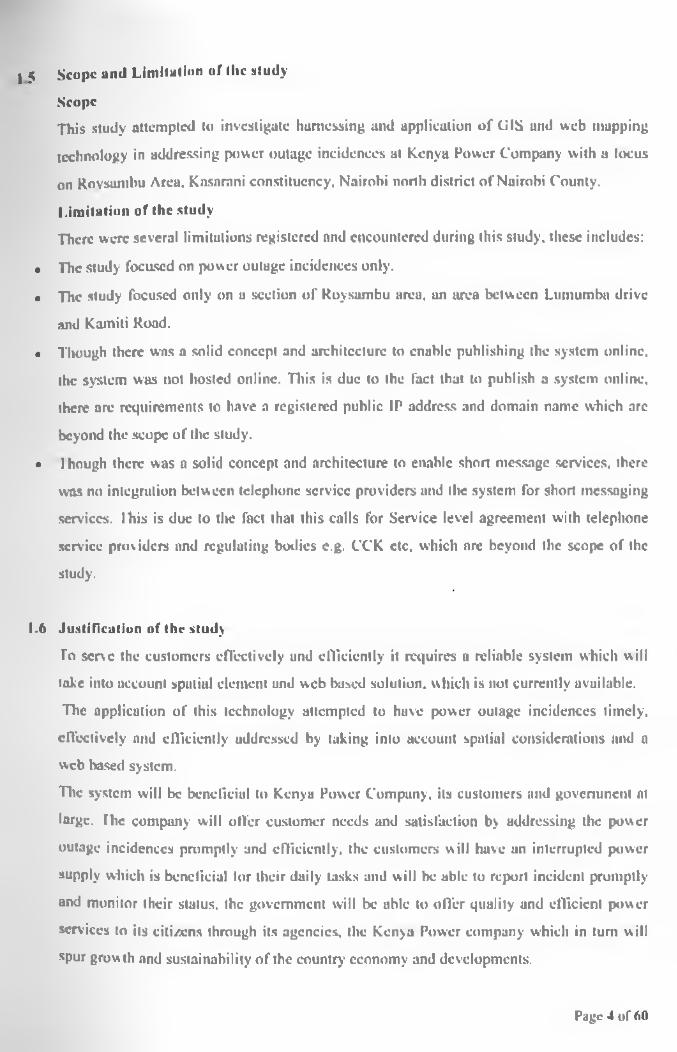
I 5 Scope and Limitation of (lie study
Scope
This study attempted to investigate harnessing and application of (J1S and web mapping
technology in addressing power outage incidences at Kenya Power Company with a locus
on Rovsumbu Area. Kasamni constituency, Nairobi north district of Nairobi County.
I.im itation of the study
There were several limitations registered and encountered during this study, these includes:
• The study focused on power outage incidences only.
• The study focused only on a section of Roysambu area, an area between Lumumba drive
and Kamili Road.
• Tltough there was a solid concept and architecture to enable publishing the system online,
the system was not hosted online. This is due to the fact that to publish a system online,
there arc requirements to have a registered public IP address and domain name which arc
beyond the scope of the study.
• I hough there was a solid concept and architecture to enable short message services, there
was no integration between telephone service providers and the system for short messaging
services. Ibis is due to tlte fact that this calls for Service level agreement with telephone
service providers and regulating bodies c.g. CC'K etc, which are beyond the scope of the
study.
1.6 Justification of the study
To serve the customers effectively and efficiently it requires a reliable system which will
take into account spatial element and web based solution, which is not currently available.
The application of this technology attempted to have power outage incidences timely,
effectively and efficiently addressed by taking into account spatial considerations and a
web based system.
The system will be beneficial to Kenya Power Company, its customers and government at
large. The company will offer customer needs and satisfaction by addressing the power
outage incidences promptly and efficiently, the customers will have an interrupted power
supply which is beneficial lor their daily tasks and will be able to report incident promptly
and monitor their status, the government will be able to offer quality and efficient power
services to its citizens through its agencies, the Kenya Power company which in turn will
spur grow th and sustainability of the country economy and developments.
Page 4 of 60
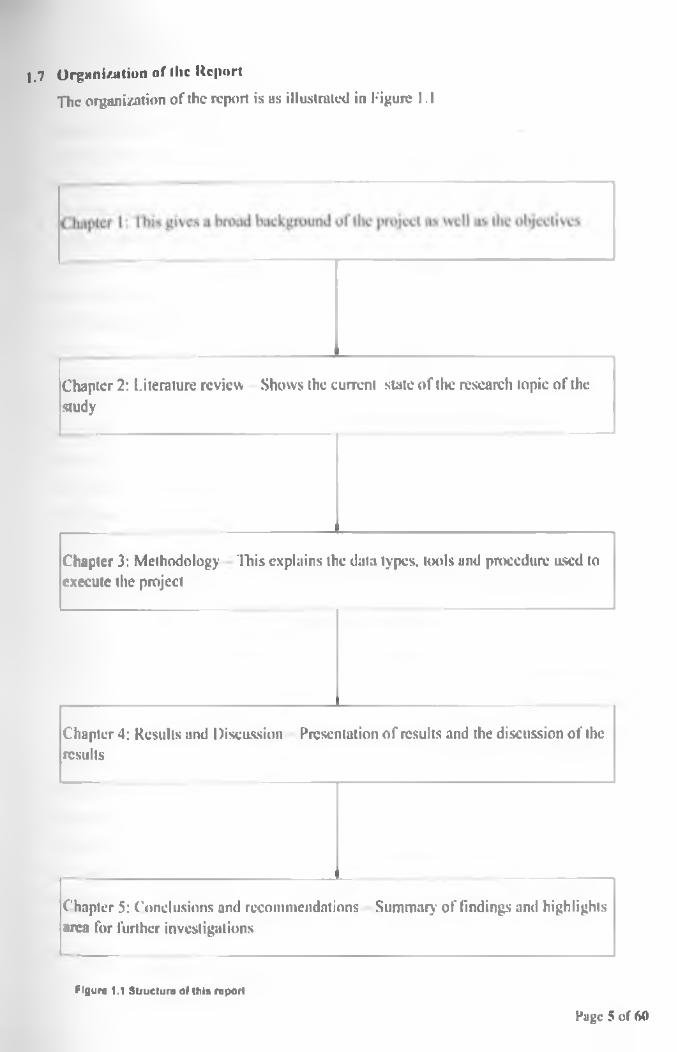
1.7 Organi/Jition of ilic Report
The organization of the report is as illustrated in Figure 1.1
Chapter 2: Literature review Shows the current state of the research topic of the study
Chapter 3: Methodology This explains the data types, tools and procedure used to execute the project
Chapter 4: Results and Discussion Presentation of results and the discussion of the results
Chapter 5: Conclusions and recommendations Summary of findings and highlights area for further investigations
Figure 1.1 Structure ol this report
Page 5 of 60

Chapter 2: LITERATURE REV IEW
2.1 Introduction
Electrical power is the backbone of modern industrial society, and is expected to remain so
for the foreseeable future. (Jones. D.A. 1991)
Electric power can refer to a quantity of electrical potential energy or to electrical energy
per time that is provided commercially, by the electrical power industry. Electricity may be
used to mean “wired for electricity" which means a working connection to an electric
power station. Such a connection grants the user of electricity access to the electric field
present in electrical wiring, and thus to electric power. (Wikipedia.org, 2012)
Electrical phenomena have been studied since antiquity, though advances in the science
were not made until the seventeenth and eighteenth centuries. Practical applications for
electricity however remained few. and it would not be until the late nineteenth century that
engineers were able to put it to industrial and residential use. The rapid expansion in
electrical technology ut this time transformed industry and society. Electricity's
extraordinary versatility as a means of providing energy means it can be put to an almost
limitless set of applications which include transport, heating, lighting, communications, and
computation. (Inventors. 2012)
2.1.1 Electricity Generation
An electric generator is a device for converting mechanical energy into electrical energy.
I he process is based on the relationship between magnetism and electricity. When a wire or
any other electrically conductive material moves across a magnetic field, an electric current
occurs in the wire. The large generators used by the electric utility industry have a
stationary conductor. A magnet attached to the end of a rotating shaft is positioned inside a
stationary conducting ring that is wrapped with a long, continuous piece of wire. When the
magnet rotates, it induces a small electric current in each section of wire as it passes. Each
section of wire constitutes a small, separate electric conductor. All the small currents of
individual sections add up to one current of considerable size. I his current is what is used
for electric power.
An electric utility power station uses either turbine, engine, water wheel, or other similar
machine to drive an electric generator or a device that converts mechanical or chemical
energy to electricity. Steam turbines, internal-combustion engines, gas combustion
Page 6 of 60

turbines, water turbines, and wind turbines arc the most common methods to generate
electricity.
Most of the electricity in the United Stales is produced in steam turbines. A turbine
converts the kinetic energy of a moving lluid (liquid or gas) to mechanical energy.
Steam turbines have a series of blades mounted on a shaft against which steam is forced,
thus rotating the shall connected to the generator. In a fossil-fueled steam turbine, the fuel
is burned in a furnace to heat water in u boiler to produce steam.
Coal, petroleum (oil), and natural gas are burned in large furnaces to heat water to make
steam that in turn pushes on the blades of a turbine. Coal is the largest single primary
source of energy used to generate electricity in the United States.
Natural gas. in addition to being burned to heat water for steam, can also be burned to
produce hot combustion gases that pass directly through a turbine, spinning the blades of
the turbine to generate electricity, tias turbines are commonly used when electricity utility
usage is in high demand. In 1998, 15% of the nation's electricity was fueled by natural gas.
(Inventors, 2012)
Petroleum ean also be used to make steam to turn a turbine. Residual fuel oil, a product
refined from crude oil, is often the petroleum product used in electric plants that use
petroleum to make steam. Petroleum was used to generate less than three percent (3%) of
all electricity generated in U.S. electricity plants in 1998. (Inventors. 2012)
Nuclear power is a method in which steam is produced by heating water through a process
called nuclear fission. In a nuclear power plant, a reactor contains a core of nuclear fuel,
primarily enriched uranium. When atoms of uranium fuel are hit by neutrons they fission
(split), releasing heat and more neutrons. Under controlled conditions, these other neutrons
can strike more uranium atoms, splitting more atoms, and so on. I hereby, continuous
fission can take place, forming a chain reaction releasing heat The heat is used to turn
water into steam, which, in turn, spins a turbine that generates electricity.
- Hydropower, the source for 9% of U.S. electricity generation, is a process in which
flowing water is used to spin a turbine connected to a generator. There are two basic types
of hydroelectric systems that produce electricity. In the first system, flowing water
accumulates in reservoirs created by flic use of dams. The water falls through a pipe called
a penstock and applies pressure against the turbine blades to drive the generator to produce
electricity. In the second system, called run-of-river. the force of the river current (rather
titan falling water) applies pressure to the turbine blades to produce electricity. (Inventors,
2012 )
Page 7 of 60
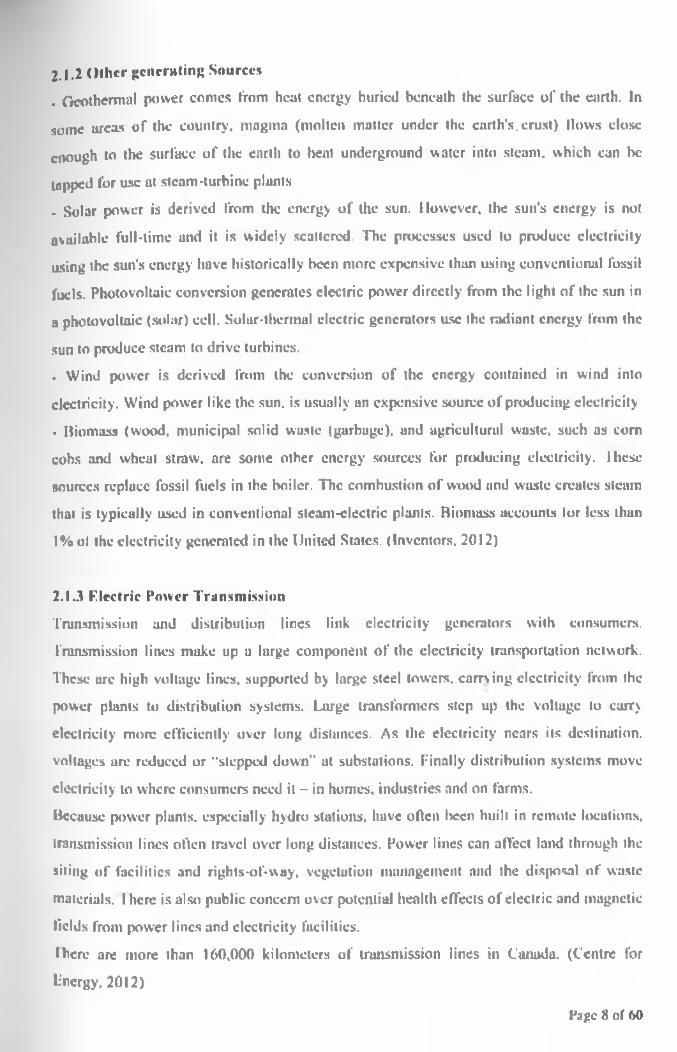
2.1.2 Other generating Sources. Geothermal power comes from heat energy buried beneath the surface o f the earth. In
some ureas of the country, magma (molten matter under the earth's.crust) llows close
enough to the surface of the earth to heat underground water into steam, which can be
tupped for use at steam-turbine plants
- Solar power is derived from the energy of the sun. However, the sun's energy is not
available full-time and it is widely scattered. The processes used to produce electricity
using the sun's energy have historically been more expensive than using conventional fossil
fuels. Photovoltaic conversion generates electric power directly from the light of the sun in
a photovoltaic (solar) cell. Solar-thermal electric generators use the radiant energy from the
sun to produce steam to drive turbines.
- Wind power is derived from the conversion of the energy contained in wind into
electricity. Wind power like the sun. is usually an expensive source of producing electricity
• Biomass (wood, municipal solid waste (garbage), and agricultural waste, such as com
cobs and wheat straw, are some other energy sources for producing electricity. These
sources replace fossil fuels in the boiler. The combustion of wood and waste creates steam
that is typically used in conventional steam-electric plants. Biomass accounts lor less than
I % ol the electricity generated in the United States. (Inventors. 2012)
2.1.3 F.lectric Power Transmission
Transmission and distribution lines link electricity generators with consumers.
Transmission lines make up a large component of the electricity transportation network.
These are high voltage lines, supported by large steel towers, earn ing electricity from the
power plants to distribution systems. Large transformers step up the voltage to carry
electricity more efficiently over long distances. As the electricity nears its destination,
voltages are reduced or "stepped down" at substations. Finally distribution systems move
electricity to where consumers need it - in homes, industries and on farms.
Because power plants, especially hydro stations, have often been built in remote locations,
transmission lines often travel over long distances. Power lines can affect land through the
siting of facilities and rights-of-way, vegetation management and the disposal of waste
materials. I here is also public concern over potential health effects of electric and magnetic
Helds from power lines and electricity facilities.
There are more than 160,000 kilometers of transmission lines in Canada. (Centre for
Lnergy. 2012)
Page 8 of 60

2.1 Kenya Power CompanyKenya Power is a limited liability company which transmits, distributes and retails
electricity to customers throughout Kenya. Kenya Power is a public company and is listed
at the Nairobi Stock lixchangc (NSL).
Kenya Power was formed in the Year 2011 after rebranding of Kenya Power and l ighting
Company to Kenya Power. (Kenya Power, 2012)
2.1.1 Sources of PowerIn Kenya, electricity is mainly generated from hydro, thermal and geothermal sources.
Wind generation accounts for less titan six megawatts of the installed capacity.
Currently, hydro power comprises over 60 percent of the installed capacity in Kenya and is
sourced from various stations managed by the Kenya Electricity Generating Company
(KenGen). Hydro power is generated by a process whereby mechanical energy produced by
falling water is transformed into electrical energy. Kenya Electricity Generating Company
Limited, (KenGen) is the leading electric power generation company in Kenya, producing
about 80 percent of electricity consumed in the country. The company utilizes various
sources to generate electricity ranging from hydro, geothermal, thermal and wind. Hydro is
the leading source, with an installed capacity of 766.88MW. which is 64.9 percent o f the
company’s installed eupucily.
Thermal electricity is produced by the burning of fuel (fossil, nuclear, biomass etc) to
produce steam or gas which turns turbines that produce electricity. Geothermal electricity is
generated from underground steam that is used to drive a conventional turbine to generate
electricity. (Kenya Power, 2012)
2.1.2 Transm ission and Distribution
Kenya Power is responsible for ensuring that there is adequate line capacity to maintain
supply and quality of electricity across the country- I he interconnected network of
transmission and distribution lines covers about 41 .-186 kilometers. (Kenya Power. 2012)
• .National grid
Hie national grid is operated its an integral network linked by a 220 kV and 142 k V
transmission network. There is a limited length of 66 kV transmission lines. The national
grid impacts on the future growth of the energy sector because any new generation capacity
must take into consideration the existing network and its capacity to handle new loads.
(Kenya Power. 2012)
Page 9 of 60
. ExpansionKciiyii Power reinforces the power transmission and distribution network by constructing
additional lines and substations.
. EfficiencyEfficiency o f the transmission and distribution network continues to be enhanced in both
technical and non-technical aspects.
Technical improvements include re-conductoring of lines, installation of capacitors, and
construction of additional feeders and substations.
Non-technical improvements include introduction of electronic meters, improvement of
meter reading accuracy, fraud control and resolution of billing anomalies.
• Supply and Demand of Electricity
Kenya Power has more than 1,500.000 customers who consumed over 5.432
Gigawatt hours of electricity in the financial year 2008/9. During the year, the maximum
daily electricity peak demand recorded wax 1.072 MW. (Kenya Power. 2012)
2.1.3 Company Duality PolicyKenya Power is committed to providing high quality customer service by efficiently
transmitting and distributing high quality electricity that is safe, adequate and reliable
at cost effective tariffs. I he Hoard. Management and staff of Kenya Power arc committed
toelTective implementation and continual improvement of the Quality Management System
that complies with ISO 9001:2008 in Older to consistently meet its customers and other
stakeholder’s requirements and expectations. (Kenya Power. 2012)
2.2 GIS For Utility Industries
A Geographic Information System integrates hardware, software, and data for capturing,
managing, analyzing, and displaying all forms of geographically referenced information.
CilS allows us to view, understand, question, interpret, and visualize data in many ways that
reveal relationships, patterns, und trends in the form of maps, globes. re|>orts. and charts.
A GIS helps one answer questions and solve problems by analyzing and visualizing data in
a way that is quickly understood and easily shared.GIS are now widely accepted as
powerful and integrated tools for storing, visualizing, and analyzing spatial data.
(Area. Alkan. Bayik nnd Sckcr, 2012)
GIS technology can be integrated into any enterprise information system framework.
Page 10 ol60
, ■» | GIS For Electric IndustriesAs an electric utility professional, one recognizes the value of good data. When that is
linked to a geographic location on a map. one can visualize the big picture which gives a
powerful decision-making tool.
GIS provides an efficient platform for data management, planning and analysis, workforce
automation, and situational awareness (F.SRI, 2012). Any utility company can leverage
these capabilities since they can easily integrate GIS with the existing information
technology infrastructure.
GIS has been employed in Flcetric industries with industry focus on Electric distribution.
Electric Transmission, Electric distribution, etc
A real life case scenario for GIS for electric industries application includes the RAPDRP
project launched in 2008 by the Government of India (CybcrSWIFT, 2012)
x) GIS in Electric Distribution
GIS ties together all the pieces of the electric distribution system for improved customer
service, better management of assets and outages, and increased accuracy of data. Large
and small distribution utilities around the world rely on GIS technology us the platform lor
network operations and asset management.
GIS touches on all aspects of electric distribution, including Smart GridAssel management.
Outage management. Workforce automation. Renewable energy. Regulatory compliance
and Joint l Jae
Use of (ilS in electrical distribution can be manifested as applied by Kootenai
Electric, the member-owned cooperative bused in Hayden. Idaho (Wyland. 2009)
b) GIS in Electric Transmission
transmission utilities rely on GIS for modeling, management, and eommunieation. With
GIS. you can model routes and determine rights-of-way that respect the land and
landowners. You can also manage assets and vegetation while ensuring regulatory
compliance.
Because one can easily link data within GIS to location, one can communicate accurate
information across all departments in the organization and externally to generation and
distribution companies.
Page 11 of 60
(j|S touches all aspects of electric transmission, including Asset Management. Field
Maintenance and Inspection. Vegetation Management, transmission Network Design and
Regulator)' C ompliancc
(}|S has been applied in electric transmission, case point as in Vermont Hlectric Power
Company (VELCO), employed geographic information system (CIS) technology from
ESR1 to create an innovative solution called the Vegetation Inventory Program (VIP). I he
solution enabled VEI.CO to facilitate the creation of map books of the entire system,
deliver ortho-photographs and Held data and make information seamlessly accessible to
workers in the field and the office. (ESRI. 2012)
CIS in Electric Generation
Developers and operators of electric generation plants rely on CIS for almost all tasks
ranging from site selection to operations management. GIS enable consolidation of multiple
data sources into one map-based platform to determine land suitability, including proximity
to resources and transportation. Once the site is up and running, one etui rely on GIS
technology to meet licensing requirements and maintain infrastructure.
GIS touches all aspects of electric generation, including Renewable Energy. Generation
Site Selection, l icensing and Environmental Analysis.
A real life case scenario on application of GIS in electrical generation can be depicted as in
Danish Energy (DONG Energy) company. (Hornann, 2012)
Case Study: Application of GIS in Utility industry.
A case scenario of GIS utilization in Northeastern Rural Electric Membership Corporation
(REMC), Indiana. USA describes a real scenario how GIS can be utilized in Utility
industries. (ESRI. 2012)
a) Improving REMC Outage Response with Mobile GIS
REMC” is a consumer-owned utility that supplies electric power to members in
northeastern Indiana. More than 26.000 households and businesses receive power from
Northeastern REMC. Utility linemen have traditionally navigated the serv ice territories by
memory, armed with a handful of paper maps. I lowever. over the years, the once sparsely
populated service territory has become heavily populated suburbia.
Page 12 of 60
I,) RKMC Challenge
Northeastern RFMC field crews were working with outdated paper maps ot' the service
territory, and the company had not yet mapped a single meter. The utility needed to create
accurate, digital maps of its entire network, lo satisfy the needs of its growing suburban
customer base. Northeastern RFMC was also tasked with enabling field crews to improve
outage response time. I o keep its customers and staff better informed, the utility had to
improve network data accuracy as well.
Northeastern REMC needed to create digital maps of its entire network, to enable field
crews to respond more quickly to outages, and improve network data accuracy to keep
customers and staff informed.
c) RKMC Solution
Northeastern RKMC selected CHS technology from ESRI. Using CIS. the utility company
was able to map the entire network. Field crews would then have access to digital maps,
up-to-date data, and new routing functionality. Mobile CIS would enable updates from the
office and the field to ensure that customers and staff members would have the most
accurate data.
To remap its entire service territory, including every customer meter, the utility took its
CilS to the field. A mobile CIS application allowed die utility to transfer data to and from
the field, keeping information updated throughout the organization. To ensure that CIS data$
is automatically updated to the mobile application, the utility deployed GO! Sync
Mapbook by 1C Technology.
To speed field crew response during outages. Northeastern RKMC employed new routing
functionality with road centerline data from local counties. Utility field crews now use a
GPS device built into their laptops to search for facilities or equipment and generate the
optimal driving route.
Page 13 of Ml
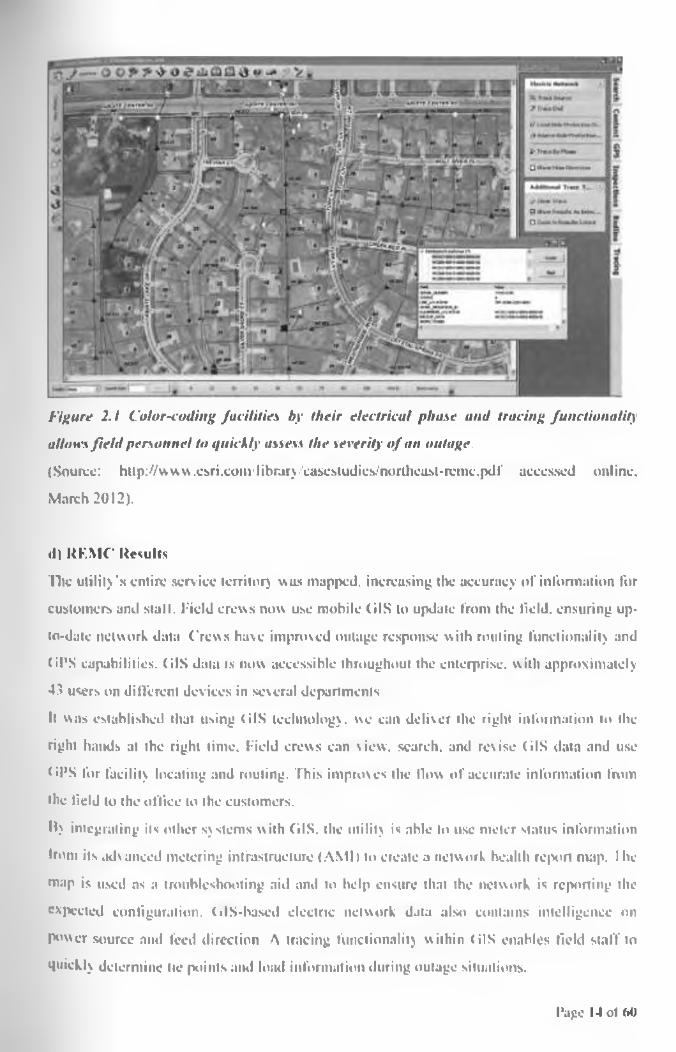
Figure 2.1 Color-coding facilities by their electrical phase and tracing functionality
allows field personnel to quickly assess the severity o f an outage.
(Source: hltp://w ww .csri.com/library/cascsiudics/northcusi-rcmc.pdf accessed online,
March 2012).
(I) RF.MC liesults
The utility's entire service territory was mapped, increasing the accuracy of information for
customers and stall. Field crews now use mobile CilS to update from the field, ensuring up-
to-date network data. Crews have improved outage response with routing functionality and
til’S capabilities. (ilS data is now accessible throughout the enterprise, with approximately
43 users on different devices in several departments
It was established that using tilS technology, we can deliver the right information to the
right hands at the right time. Field crews can view, search, and revise CilS data and use
til’S for facility locating and routing. This improves the How of accurate information from
the field to the office to the customers.
My integrating its other systems with CilS. the utility is able to use meter status information
Irom its advanced metering infrastructure (AMI) to create a network health report map. I he
map is used as a troubleshooting aid and to help ensure that the network is reporting the
expected configuration. (ilS-based electric network data also contains intelligence on
power source and feed direction A tracing functionality within <iIS enables field staff to
quickly determine tie points ami load information during outage situations.
I’age 14 ot 60

2.2.3 CritiqueAt Indiana case study they apply CHS technology which enabled its field crews to improve
outage response time, keep its customers and staff better informed.
Likewise this research endeavours to apply the same idea and address the existing gap to
bring efficiency at Kenya power in addressing power outage incidences.
2.2.3 K ocarch C apHydro generated electricity is the main source of power in Kenya.(Kenya Power. 2012).
However it highly prone to vagaries of weather especially the droughts that lowers the
generation capacity. The Kenya Power company is overwhelmed by many emergency
responses to manage power outages. However, to locate the locations where response is
needed, the field personnel's relies on phone culls made to the customers. This delays the
response time and waste other resources like fuel. There is need to design efficient tool that
will facilitate fast response and proper allocation of resources (personnel and materials).
Although the potential of CIS in improving efficiency in utility management lias been
demonstrated mostly in developed countries, such tools has not been developed or tested in
Kenya. This research therefore designs and evaluates the efficiency of a CHS and web-
based application tool for power outages response management. The potential of a web-
based CIS system in efficient management of power response operations is evaluated.
The research gaps that this study attempted to fill were lack of location based
considerations and web based solution when addressing power outage incidences, which
can be achieved by application of CIS and web mapping technology at Kenya Power
Company, to address spatial consideration as well as web based solution when addressing
power outages.
This will ensure reliable system is in place which will ensure timely, efficient and effective
power outage incidences resolutions have a portal where the company will interact with
their customers and a system which can be used for report generations to aid in decision
making during addressing power outages.
rhe system will be of beneficial to Kenya Power company, its customers and Kenyan
government as customers will have steady power supply, be able to timely and efficiently
report incidences and track their status, the company will be able to meet customer needs
ond satisfaction which will translate to growth and sustainability ol the country economy.
Page 15 ot 60
hapterJ: METHODSThe methodology used included creation of spatial web based system which makes use of
ASP-NETMvc4 web framework and RavcnDD database as described in section 3.3.
The system included details about customer's, customer locations, a web based solution to
display customer's location and other information and also ways to customize the sy stem.
The web displayed maps were used to show the customers location, the direction to
customer locations among others.
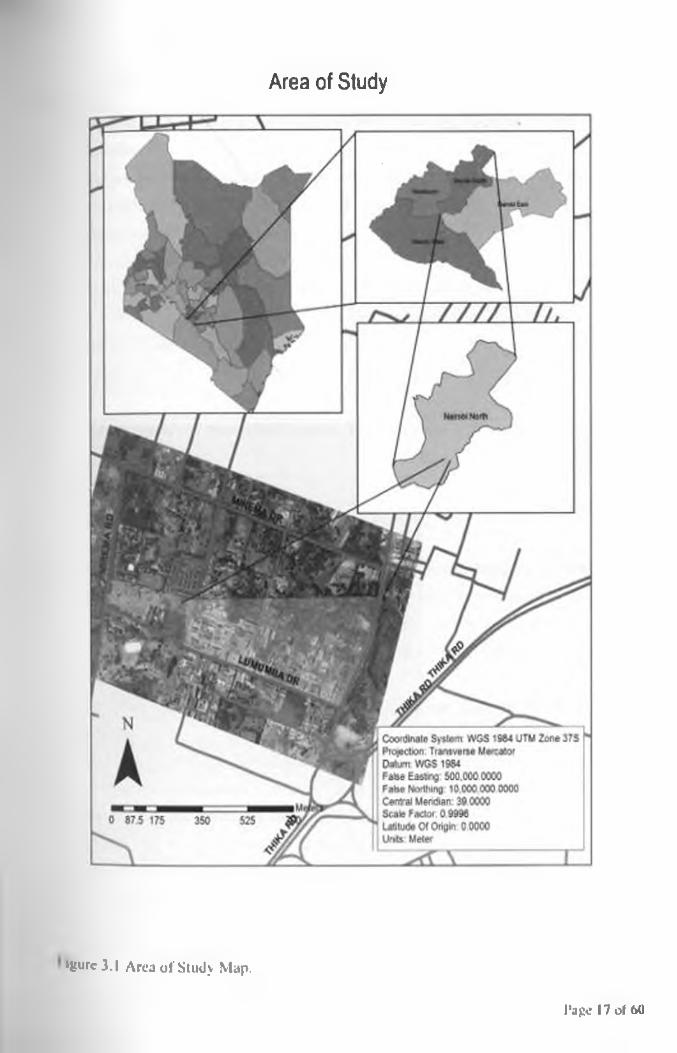
3.1 Study Areaflic study focused on a section of Roysambu area. Kasarani constituency.Nairobi North
district, in Nairobi County, an area between Lumumba Drive and kamili Road. I he study
area lies between latitude 1° 12' 50" S and 1° 13* 0" S and longitude 36° 53* 10" E and 36°
53’ 30“ S.
Nairobi North district had a population of 1.062,086 as per Kenya population census of
200*). (KNUS. 2012)
I'he Kasarani area encompasses an urban residential area. International stadium (MISC
Kasarani), Various industries including central glass industries and others .various schools
and universities including US1U. I*AC and others, various hotels including Safari park and
others. Various businesses, etc.
Kenya Power has both three-phase and single-phase electrical power connection in this
area, they also have a power substation located at Roysambu area.
I he study urea was selected due to proximity to Roysambu power sub-station and
knowledge of the area.
The study area is us shown in figure 3.1
Page 16 of 60
Area of Study
*gurc3.l Area of Study Map.
Page 17 of 60
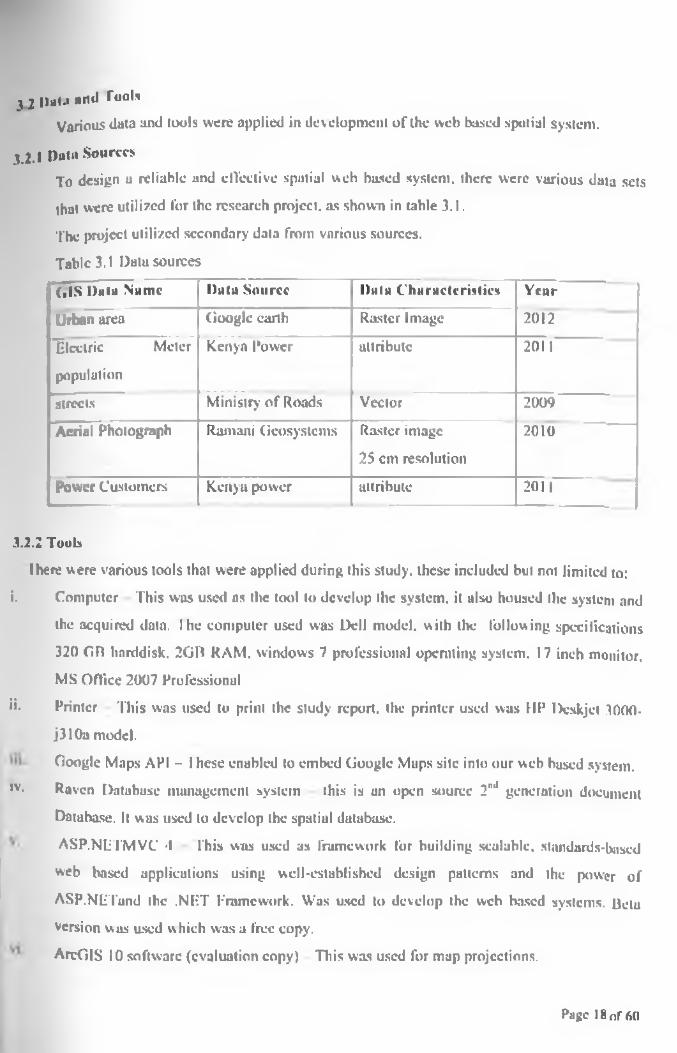
y l |) a l . i and r °ols
Various data and tools were applied in dev elopment of the web based spatial system.
.U .l Data SourcesTo design u reliable and elVective spatial web based system, there were various data sets
that were utilized for the research project, as shown in table 3.1.
The project utilized secondary data from various sources.
Table 3.1 Data sources
(•IS Data Name Data Source Data Characteristics Year
Urban area Google earth Raster Image 2012
Electric Meter
population
Kenya Power attribute 2011
streets Ministry of Roads Vector 2009
Aerial Photograph Ramani Geosystcms Raster image
25 cm resolution
2010
Power Customers Kenya power attribute 2011
3.2.2 Tools
I here were various tools that were applied during this study, these included but not limited to:
i. Computer This was used as the tool to develop the system, it also housed the system and
the acquired data. I he computer used was Dell model, with the following specifications
320 GR harddisk, 2013 RAM, windows 7 professional operating system. 17 inch monitor,
MS Office 2007 Professional
ii. Printer This was used to print the study report, the printer used was HP Dcskjct 3000-
j310a model.
Google Maps API - I hese enabled to embed Google Maps site into our web based system.
,v- Raven Database management system this is an open source 2"J generation document
Database. It was used to develop the spatial database.
ASP.NIiTMVC -I This was used as framework for building scalable, stundards-based
web based applications using well-established design patterns and the power of
ASP.Nli'I'and the .NET Framework. Was used to develop the web based systems. Uclu
Version was used which was a free copy.
ArcGIS 10 software (evaluation copy) This was used for map projections.
Page 18 of 60
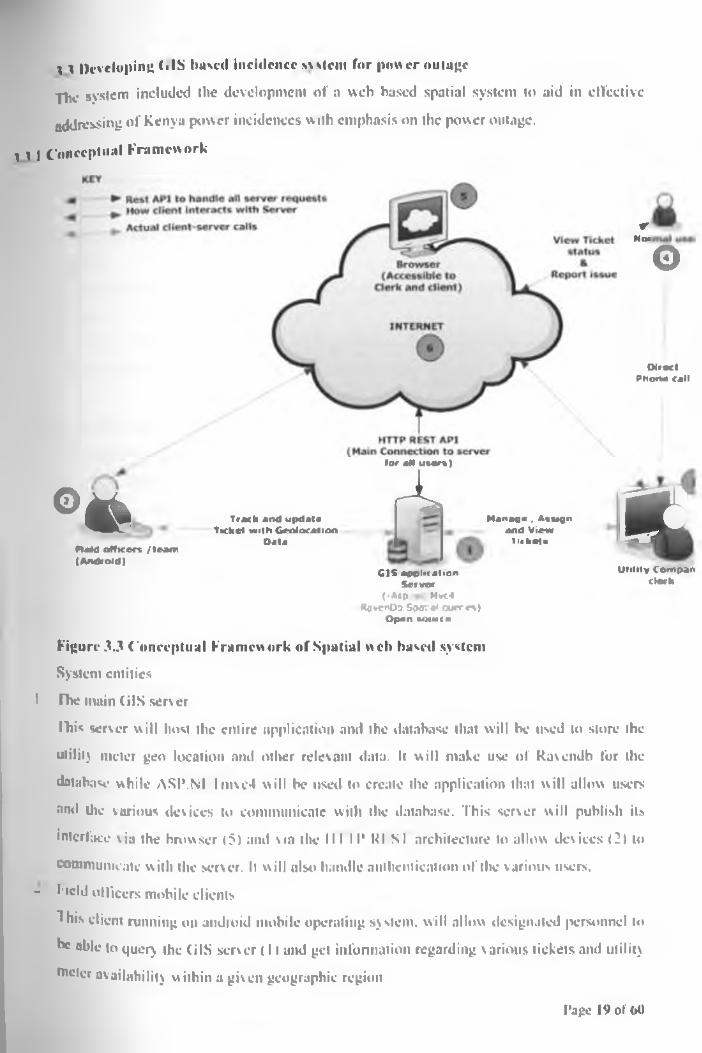
\ \ Developing (.IS based Incidence svstem for power outage
The system included the development of a web based spatial system to aid in effective
addressing of Kenya power incidences with emphasis on the power outage.
\ \ I Conceptual Framework
rNo.
Direct Phone call
% *Field officer* /team (A n d ro id )
Tra ck and o p d »t* Ticket w ith Geolocation
Data
for alt u * o r«)
LM a n a g e . A iu g n
and V iew ticket*
C IS application Server
(•Alp M*c4 Ra*enD9 Spat e< curres)
O pen M H M ir
C i
U tility C om pan c le rk
Figure 3.3 Conceptual Framework of.Spatial web based system
System entities
I Hie main (ilS server
Ibis server will host the entire application and the database that will be used to store the
utility meter geo location and other relevant data. It will make use of Ravcndb for the
database- while ASIVNI Imvc4 will be used to create the application that will allow users
ami the various devices to communicate with the database. This server will publish its
interface via the browser (5) and via the III II* KI SI architecture to allow devices (2> to
communicate with the server. It will also handle authentication of the various users.
- field officers mobile clients
Ibis client running on android mobile operating system, will allow designated personnel to
be able to query the (ilS server ( 11 and get information regarding various tickets and utility
meter availability within a given geographic region
Page 19 of 60
•
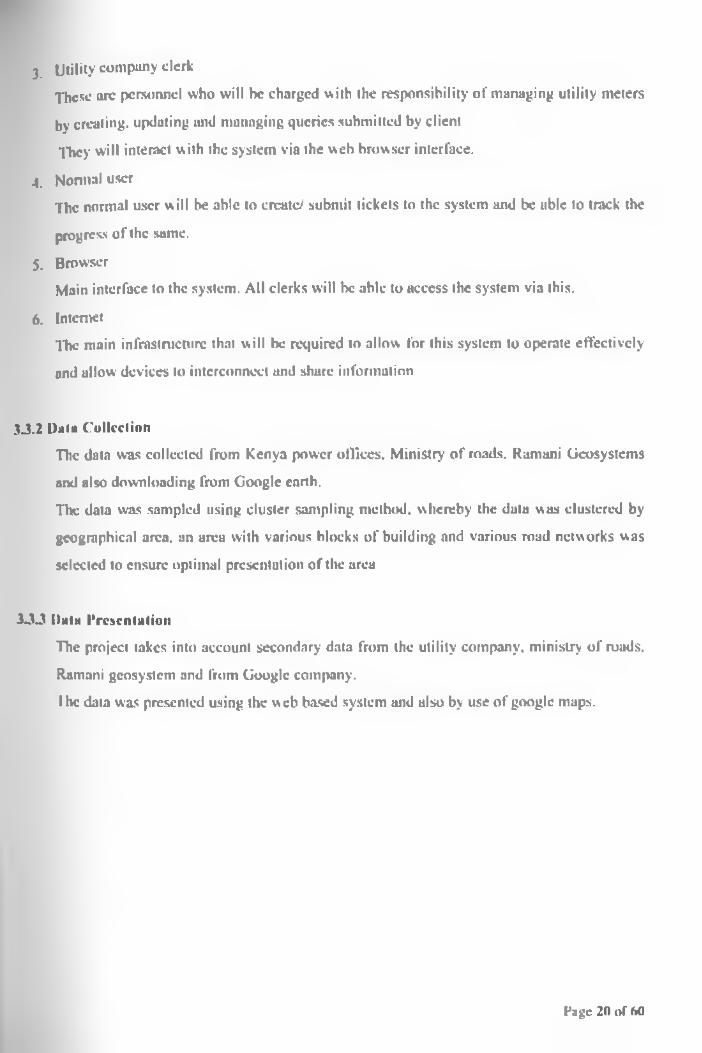
3. Utility company clerkThese are personnel who will be charged with the responsibility of managing utility meters
by creating, updating and managing queries submitted by client
They will interact with the system via the web browser interface.
4. Normal userThe normal user will be able to create/ submit tickets to the system and be able to track the
progress of the same.
$. Browser
Main interface to the system. All clerks will be able to access the system via this.
6. InternetThe main infrastructure that will be required to allow for this system to operate effectively
und allow devices to interconnect and share information
3.3.2 Data CollectionThe data was collected from Kenya power offices. Ministry of roads. Kamani Gcosystems
and ulso downloading from Google earth.
The data was sampled using cluster sampling method, whereby the data was clustered by
geographical area, an area with various blocks of building and various road networks was
selected to ensure optimal presentation of the urea
3JJ Data Presentation
The project takes into account secondary data from the utility company, ministry of roads.
Ramani geosystem and from Google company.
I he data was presented using the w eb based system and also by use of google maps.
Page 20 of 60
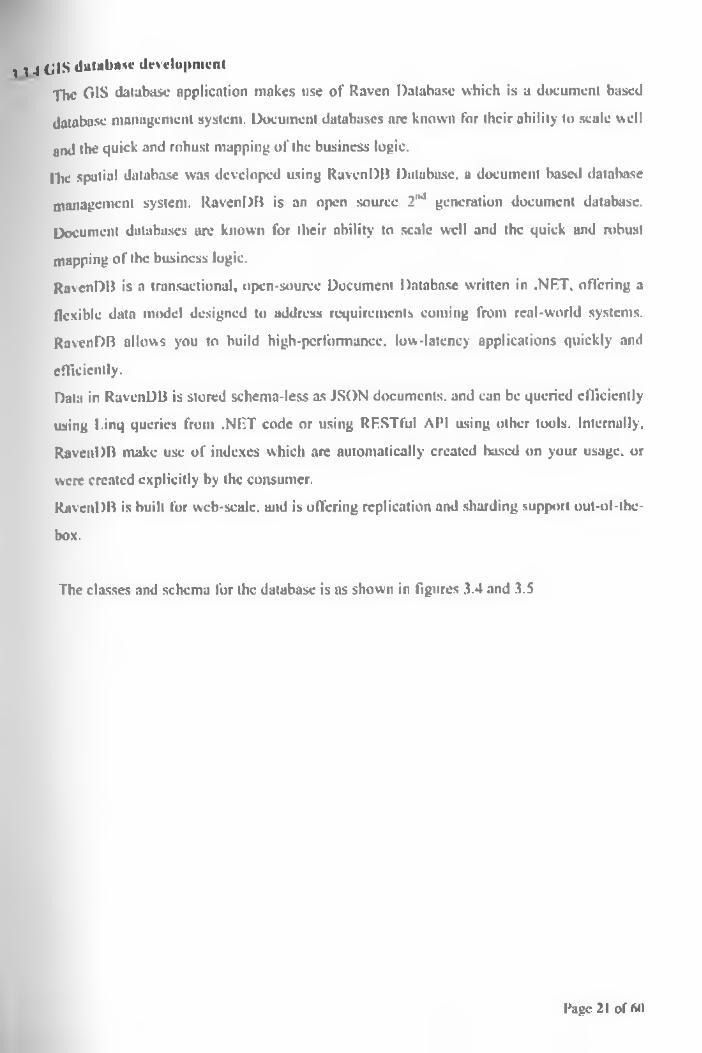
; * 4 (JIS database developmentThe G1S database application makes use of Raven Database which is a document based
database management system. Document databases are known for their ability to scale well
ami the quick and robust mapping of the business logic.
Hie spatial database was developed using RavenDB Database, a document based database
management system. RavenDB is an open source I 1"1 generation document database.
Document databases are known for their ability to scale well and the quick and robust
mapping of the business logic.
RavenDU is a transactional, open-source Document Database written in .NRT. offering a
flexible data model designed to address requirements coming front real-world systems.
RavenDB allows you to build high-performance, low-latency applications quickly and
efficiently.
Data in RavenDB is stored schema-less as JSON documents, and can be queried efficiently
using l.inq queries from .NET code or using RFSTful API using other tools. Internally.
RavenDB make use of indexes which are automatically created based on your usage, or
were created explicitly by the consumer.
RavenDB is built for web-scale, mid is offering replication and sharding support out-ol-lhe-
box.
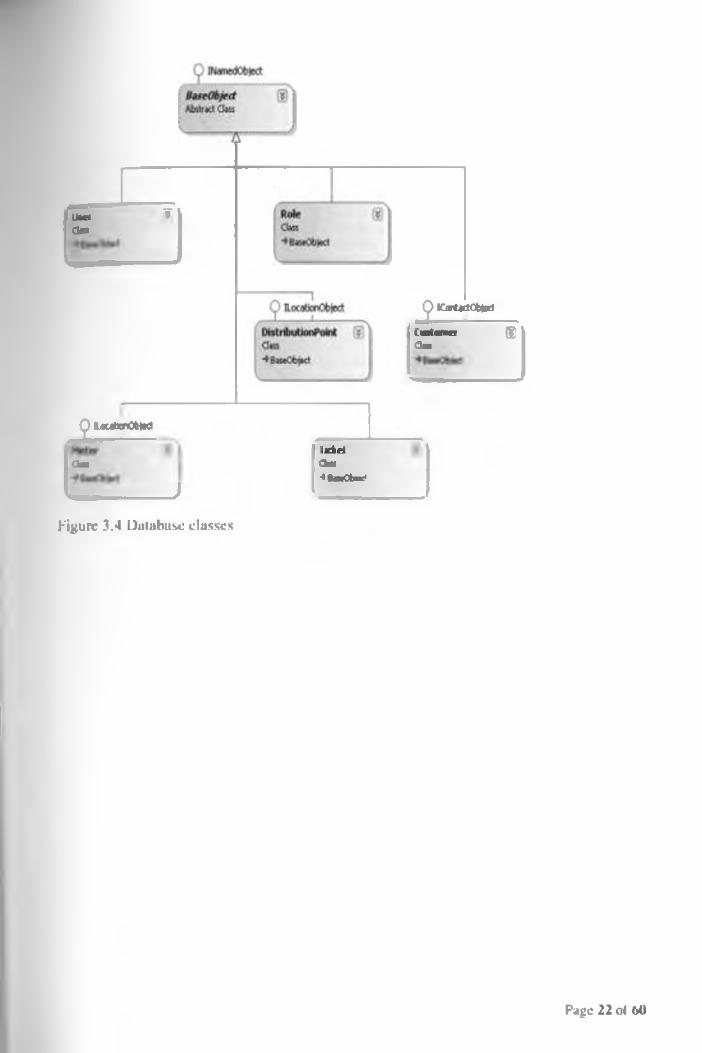
The classes and schema for the database is as shown in figures 3.4 and 3.5
Page 21 of W>
IHcf *Omt
.2ICort«ctC*#d
C u lt o n e r »d m
2 loubon06»K»t ic k e t
Om Qm*B««CtnK*
L _______ _____________ )
tfgure 3.4 Database classes
Page 22 of 60
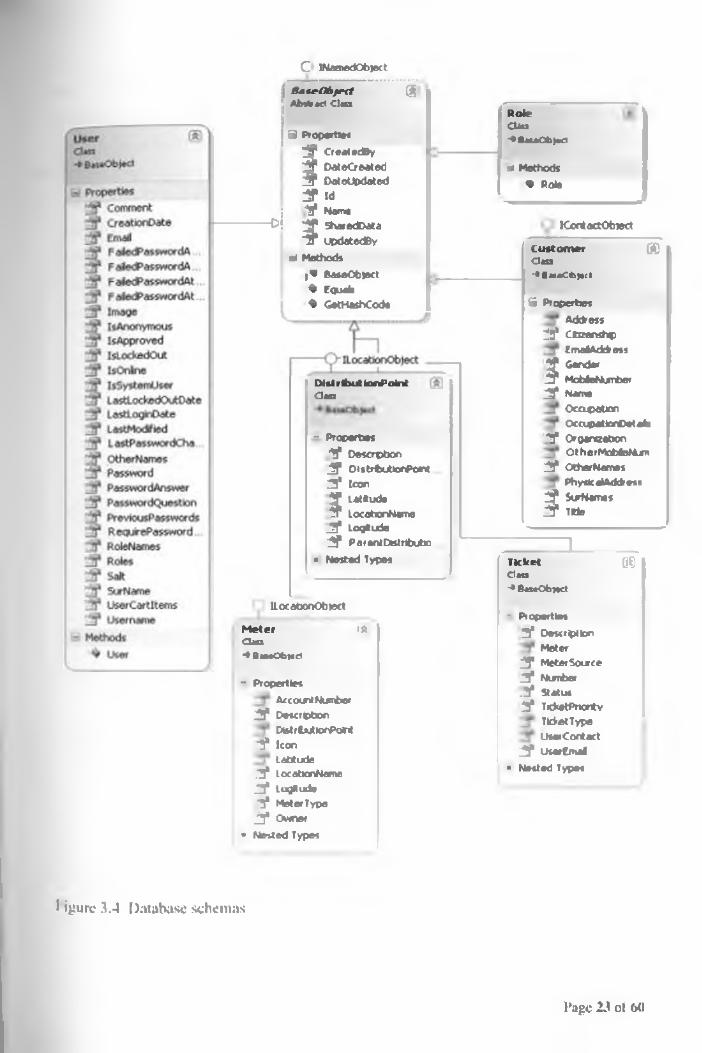
-oi
C lNamedObiect
B a * r06 / e t tAbtkKl Clut
5 Propertiet
f OeatedBy DateOeated Datotpdated
3P m■‘5* Marne 2 SharedData T* UpdatedBy
ai Methods?v BasaObtect % Equafc ♦ GatHashCode
(SRoleCUu-*BM«06)*ri
=i Methods* Role
lContactObwct
Diet rftwt ionPointO ta
- Properties*5* Descrpbon _3* DiitributlonPorit J3* Icon
t l* #u*T locationName
_3* Logltude 3j* Paronttfcstnbubo
• Nested Types
C u s to m e rClass-•BMaCtopct
*
S Properties Address
^3* Ctuenstep Ema4Adckess
^ Gender .T MoMeNun-fcer J3* Name
Occupation OccupettonOetalt
*3* Organization OtherMobfcM^n
3!* Other Names Phytic alAddr ess
if f SurNames 2P Tide
lLocadonOtoiect
M eterCUu••BewObHCt
( f t
- PropertiesAccount Number
J5* Desctipdon DttftNUorPalr*
-3* Icon ladtude
."3* LocaUcnName J3* lugRude "3* Meter Type
j * Omar ♦ Nested Types
1TicketCl M l-♦BastObKct
- Properties3 * Oescrpllon
Metery Meter Soiree 13* Ncmber .3* Stetut 3* TtdetPnontv
TldiatType UserCorttaet
;3* Usertmal * Nested Types
00
I igurc 3.4 Database schemas
Page 23 ol 60

x 5 Web bused system developmentThe system made use of ASP.NFT Mvc4 web framework to publish data which is made
available via a REST API for all mobile clients to access and via the web interface to allow
for user access to the system functionality. The REST API will allow the ability to enable
plugin and add new clients without basing to modify the existing core e.g. it makes it
possible to add mobile phone application which can be used in smart phones e.g. Android
phones upps.
This design allows for decoupling and hence easier extensibility of the application core.
The system can Ik* used in different platforms including the smart phones applications
Page 24 of 64)
Cfcapicr4: RESULTS AND DISCUSSION
In (his chapter outputs of the spatial web based system arc discussed.
4 .1 Web based systemThe Utility Mapper System, a spatial web based solution comprising of a spatial database
and web based system to address spatial considerations and web based solutions for
addressing power outage incidences was developed and tested.
The system uses ASP.NL I Mvc4 web framework to publish data which is made available
via a REST API lor all mobile clients to access and v ia the web interface to allow for user
access to the system functionality.
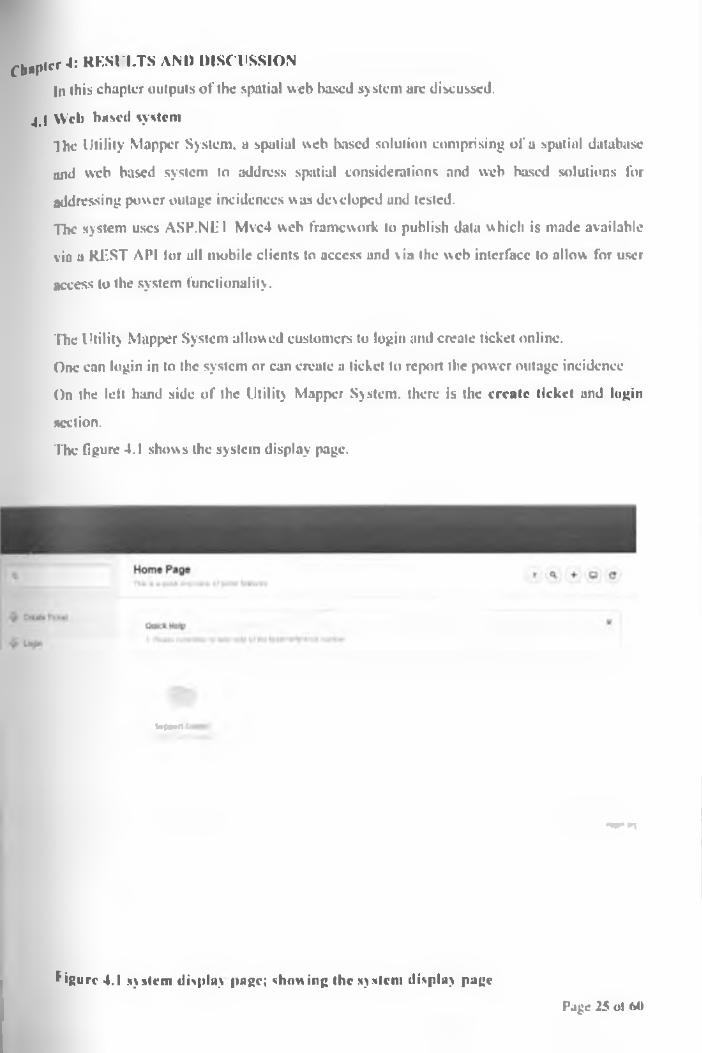
The Utility Mapper System allowed customers to login and create ticket online.
One can login in to the system or can create a ticket to report the power outage incidence
On the left hand side of the Utility Mapper System, there is the create ticket and login
section.
The figure 4 .1 shows the system display page.
Iwfwn i
*«***»n
figure 4.1 system display page; showing the system display pagePage 25 of 60
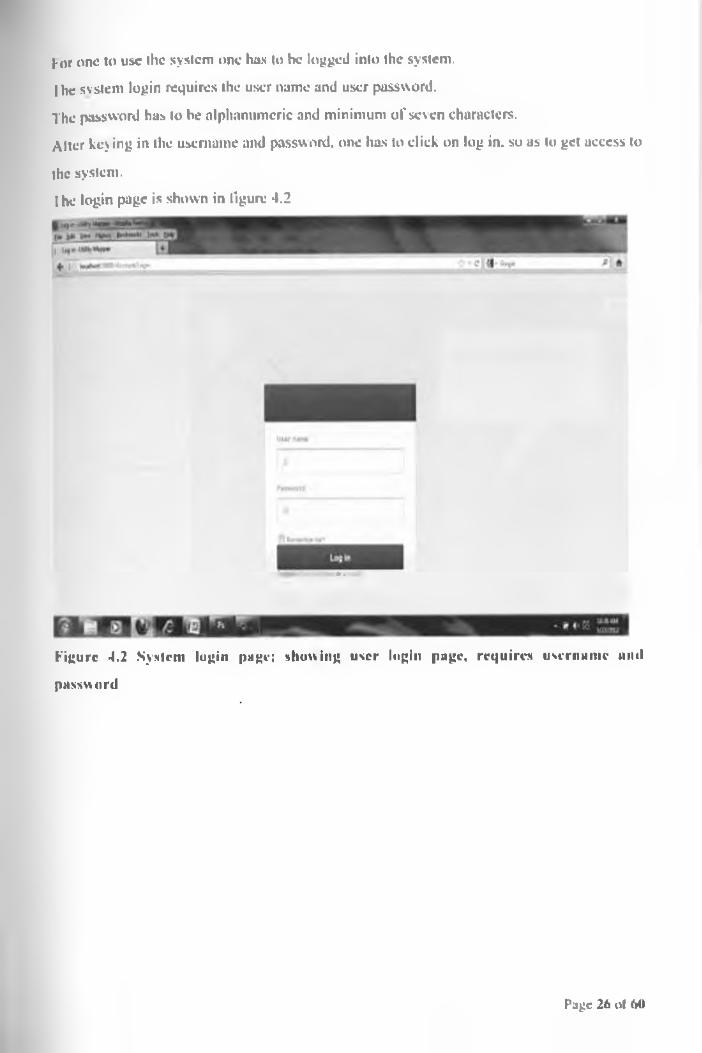
j-or one to use the system one has to be logged into the system.
I he system login requires the user name and user password.
The password has to be alphanumeric and minimum of seven characters.
Alter key ing in the username and password, one has to click on log in. so as to get access to
the system.
I he login page is shown in figure 4.2
r ■
Figure 4.2 System login page; showing user login page, requires username and
password
Page 26 ot 60
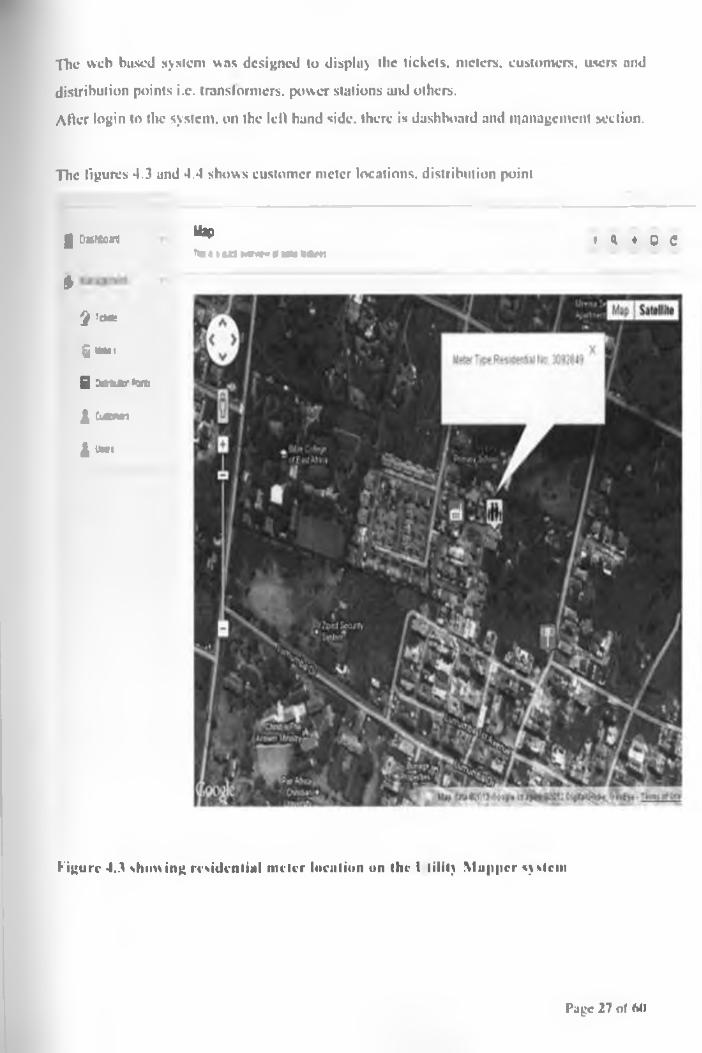
The web based system was designed to display the tickets, meters, customers, users and
distribution points i.c. transformers, power stations and others.
After login to the system, on the left hand side, there is dashboard and management section.
The figures 4.3 and 4.4 shows customer meter locations, distribution point
g Dorcoal
j ,
^ ’CMC
Q*-<
B twtxcrtvti
A Cuttran
i M i
Map% « i M3 wwr* * tern tto n
» * ♦ 9 C
VJOM
fig u re 4.3 showing residential m eter luculiun on the ( tility M apper system
Page 27 of 641
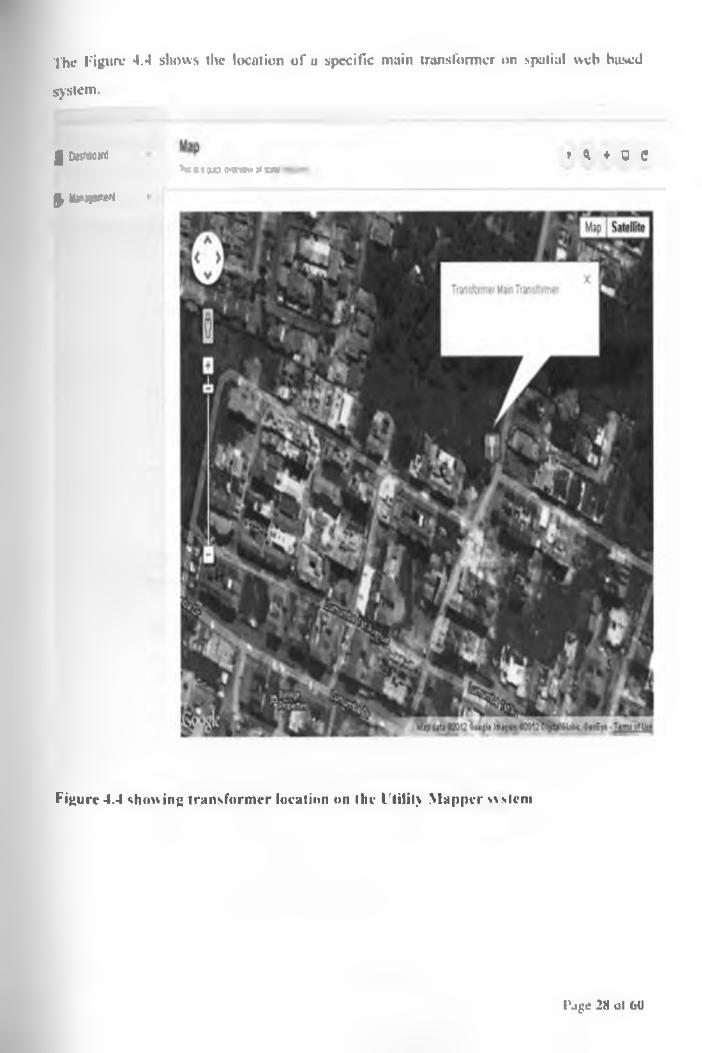
The Figure 4.4 shows the location of a specific main transformer on spatial web based
system.
£ Ditftoirt
> Uthw retl
i U 5 J■>*«• «> vwmi j» aw
Figure 4.4 show ing transformer location on the Utility Mapper s\ stem
Page 28 ot 60
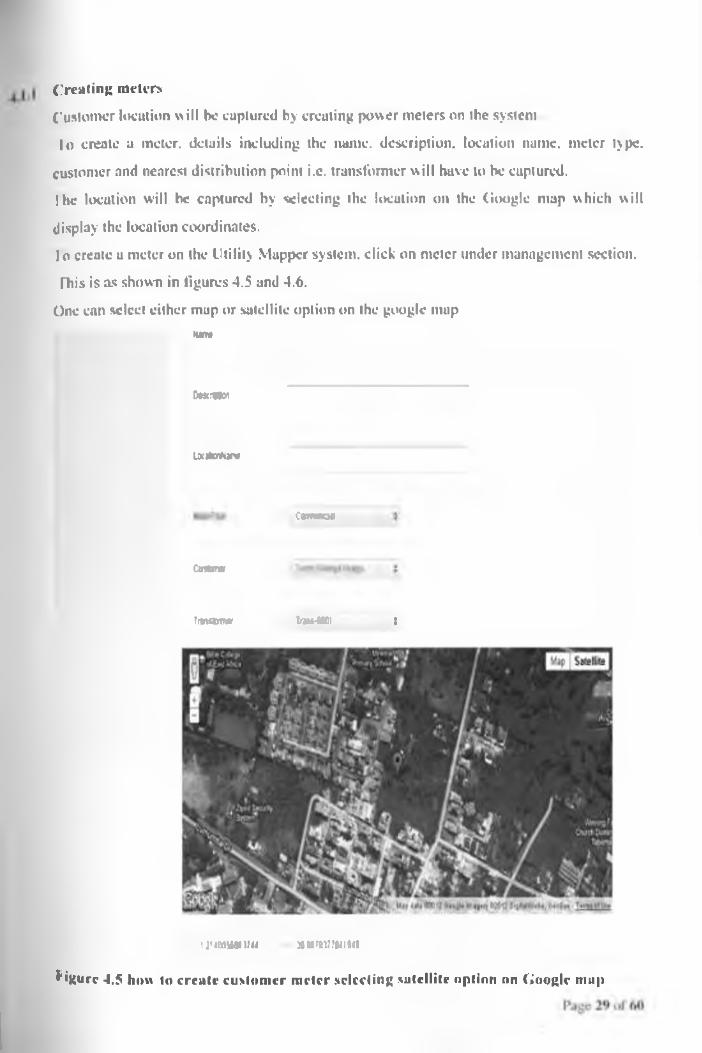
Creating meters
Customer locution will be captured by creating power meters on the system
lo create a meter, details including the name, description, location name, meter type.
Customer and nearest distribution point i.c. transformer will have to be captured.
Ihe location will be captured by selecting the location on the (iooglc map which will
display the location coordinates.
| o create a meter on the Utility Mapper system, click on meter under management section.
This is as shown in figures 4.5 and 4.6.
One can select either map or satellite option on the google map t u r n
OtKtWoi
LMtottar*
Cornwall
Cuarm
rm ttm r Tnat-ittl S
t j ' l t n w t V U x u w . v t w
figure 4.5 how to create customer meter selecting satellite option on Google map
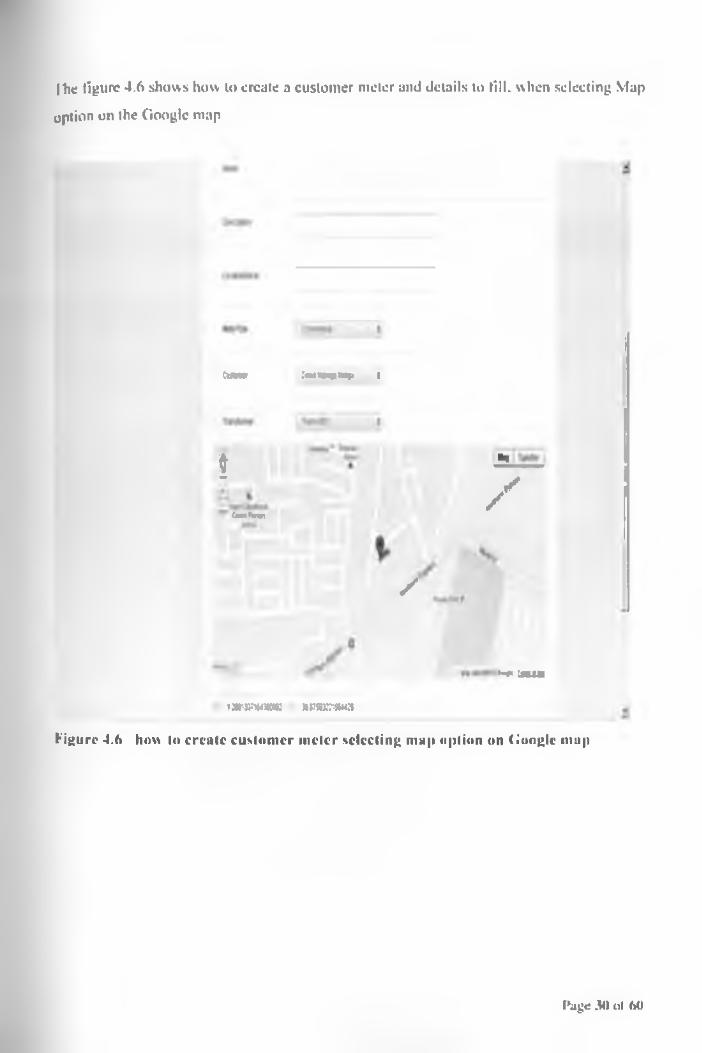
|he figure 4.6 shows how lo create a customer meter and details to fill, when selecting Map
option on the Google map
(M W .'mKXpiMf, I
gC»w»nr
h,
/
/
i-t* m
i •UBwtnwwR xesn^wa
Figure 4.6 how lo create customer meter selecting map option on Google map
Page 30 ol 60
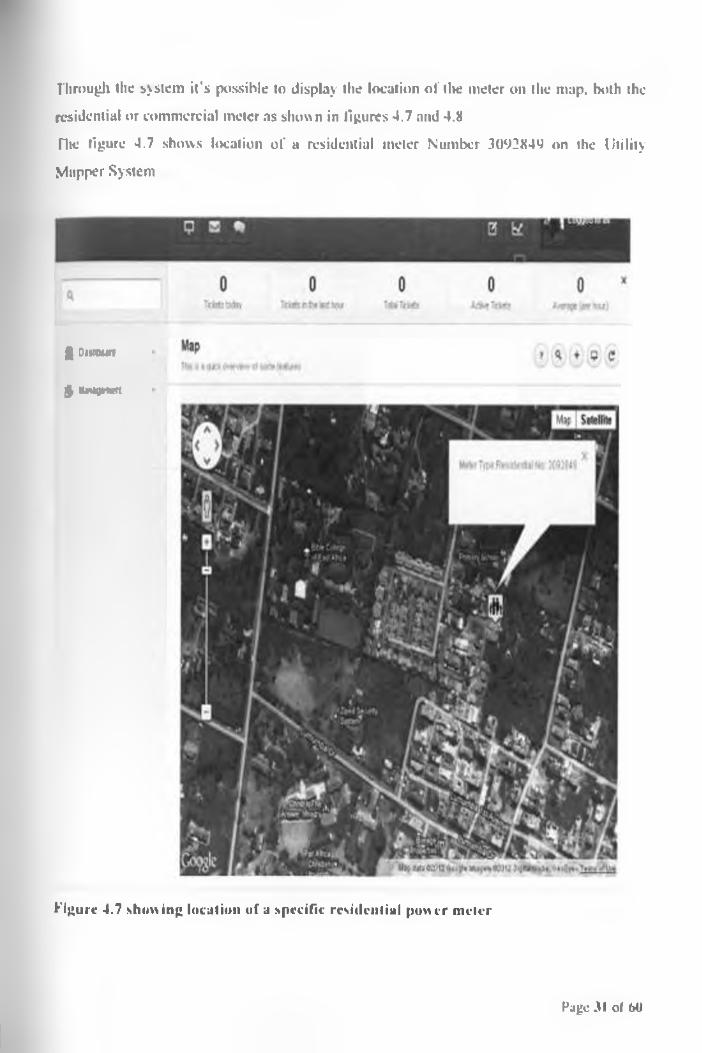
Hi rough the system it’s possible to display the location ol'the meter on the map. both the
residential or commercial meter as shown in figures 4.7 and 4.8
Hie figure 4.7 shows location of a residential meter Number 3092X49 on the Utility
Mapper System
g Diinutt
> NNpIMft
figu re 4.7 showing location of a specific residential power m eter
Page 31 of 60
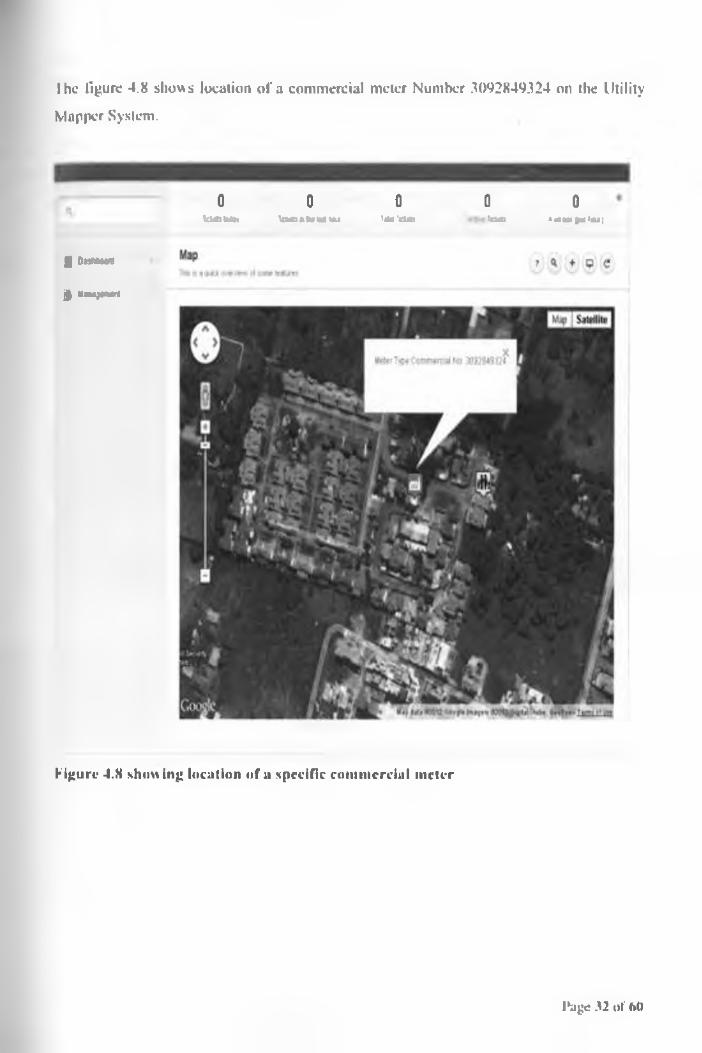
I he figure 4.8 shows location of a commercial meter Number 3092849324 on the Utility
Mapper System.
0 0 0VMiMti Utor.MMtu 'M 'lim
0 0llUtl >«U>)HlcU|
9 Oh M mri
> Hirtpr+rt
figure 4.8 showing location of a specific commercial meter
Page 32 of 60
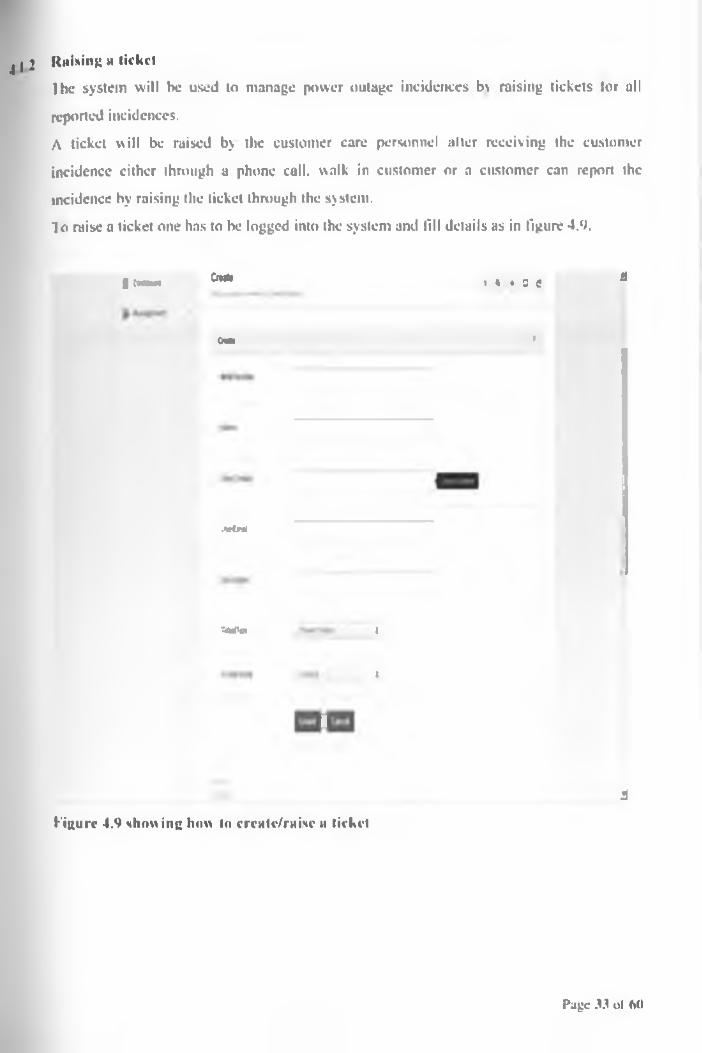
j I 2 Raising a ticketIhe system will be used to manage power outage incidences In raising tickets tor all
reported incidences,
A ticket will be raised by the customer care personnel alter receiving the customer
incidence cither through a phone call, walk in customer or a customer can report the
incidence by raising the ticket through the system.
lo raise a ticket one has to he logged into the system and lill details as in figure 4.9.
| t«MU« Cfut*
ON
* * ♦ = e n
»
•hK f*
TiW T« i
I
I
figu re 4.9 showing how lo crcatc/raisc a ticket
i
Page .t.t ol 60
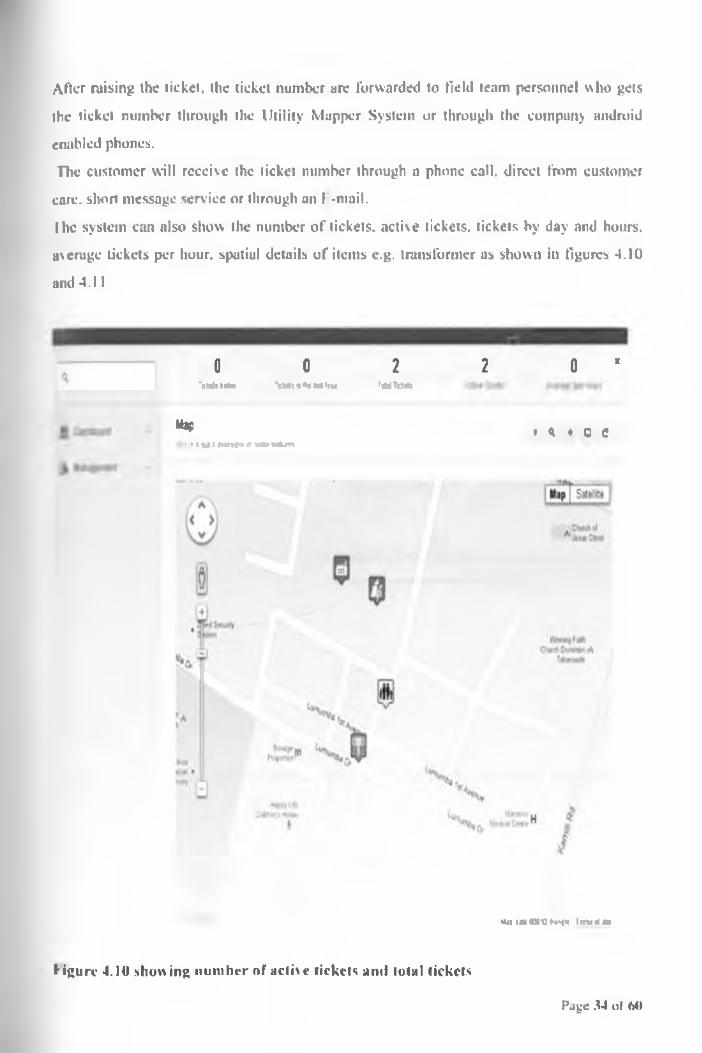
After raising the ticket, the ticket number are forwarded to field team personnel who gets
the ticket number through the Utility Mapper System or through the company android
enabled phones.
The customer will receive the ticket number through a phone call, direct from customer
care, short message service or through an I -mail.
Ihe system can also show the number of tickets, active tickets, tickets by day and hours,
average tickets per hour, spatial details of items e.g. transformer as shown in figures 4.10
and 4 .11
0 0 2'ttrfitrtn fcM, n *t M *>w tiMToitt
2 0 *
MaplittiuiMiMofnrMm » * ♦ o c
Uii irtCSC (■+*(■« I m il! in
f igure 4.10 showing number of active tickets ami total tickets
Page 34 of 60
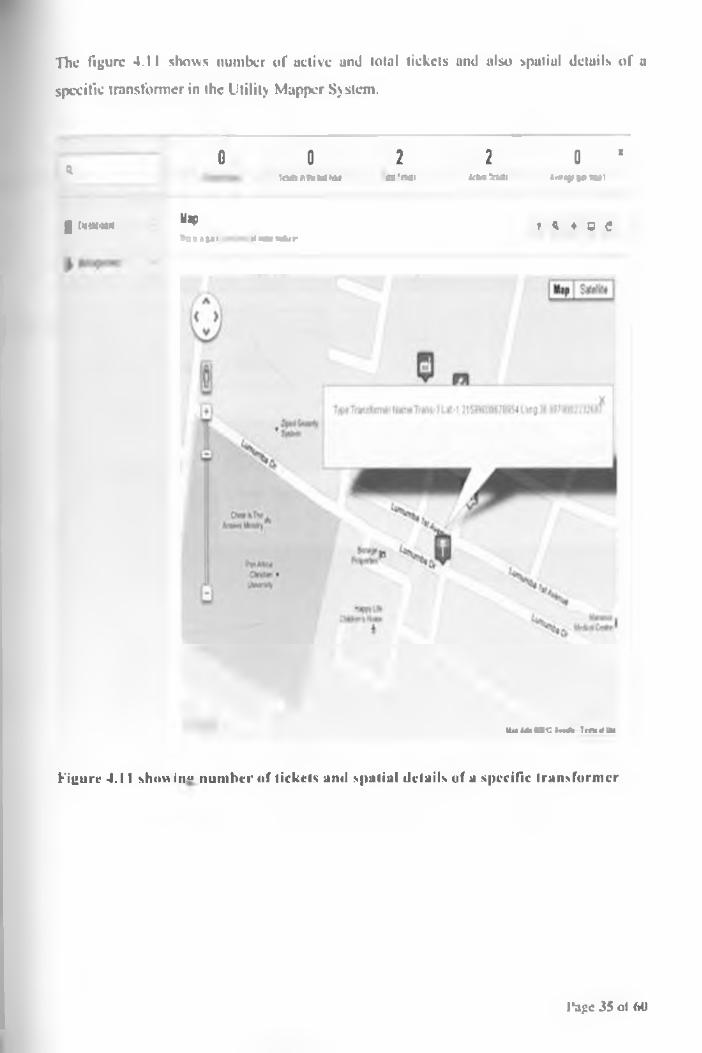
The figure 4.11 shows number of active and total tickets and also spatial details of a
specific transformer in the Utility Mapper System.
4
| ruiu-Mi
0 0 2toCMwaitoi u ‘Oft!
Map
» » 111)11 i! mm * * jr
2 0 *
feiwtaAl *■»«* J» «U>
t 4 ♦ 0 C
lamMCtw* Imam
figure 4.11 show in» number of tickets ami spatial details of a specific transformer
l ’a g c 3 5 o t M i
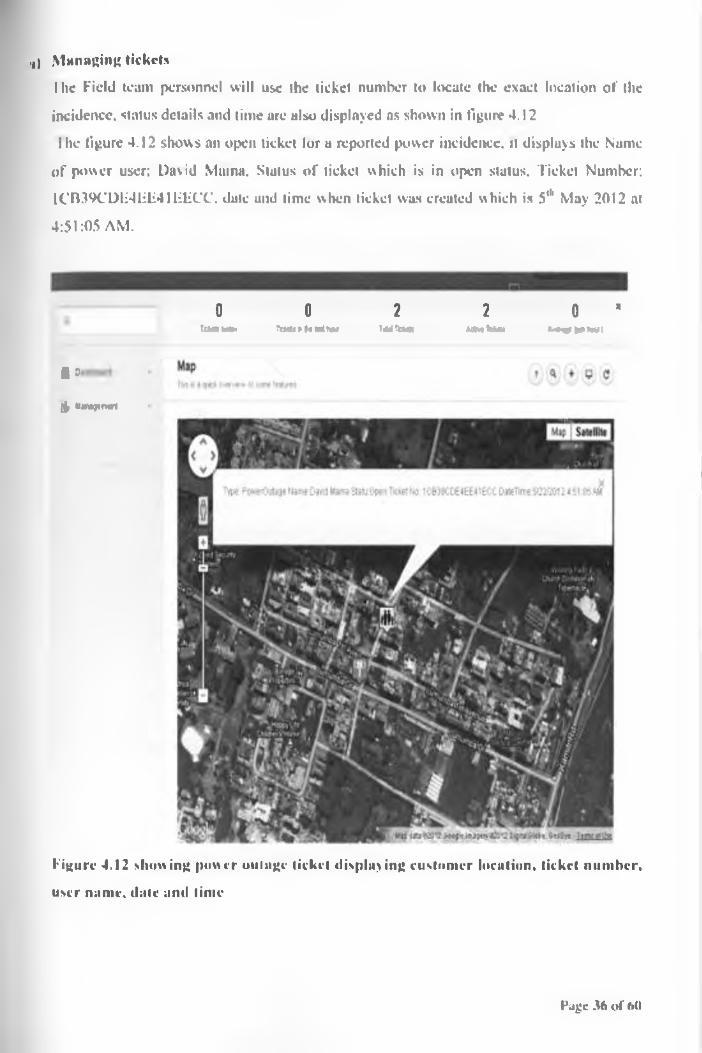
,,) Managing tickets
i lie Field team personnel will use the ticket number to locate the exact location of the
incidence, status details and time are also displayed as shown in figure 4.12
I hc figure 4.12 shows an open ticket lor a reported power incidence, it displays the Name
of power user; David Minna. Status of ticket which is in open status. Ticket Number;
lCB39CDU4l£l£411il£CC. date and time when ticket was created which is 5°' May 2012 at
4:51:05 AM.
0 0 2 2 0 "TcUbWJr R tttlM lM fiM TiWTkMl U M U M M n v p O w iI
g :
J, nnit)trmi
Figure 4.12 showing power milage ticket displaying customer location, ticket number,
user name, date and lime
Page 36 of 60
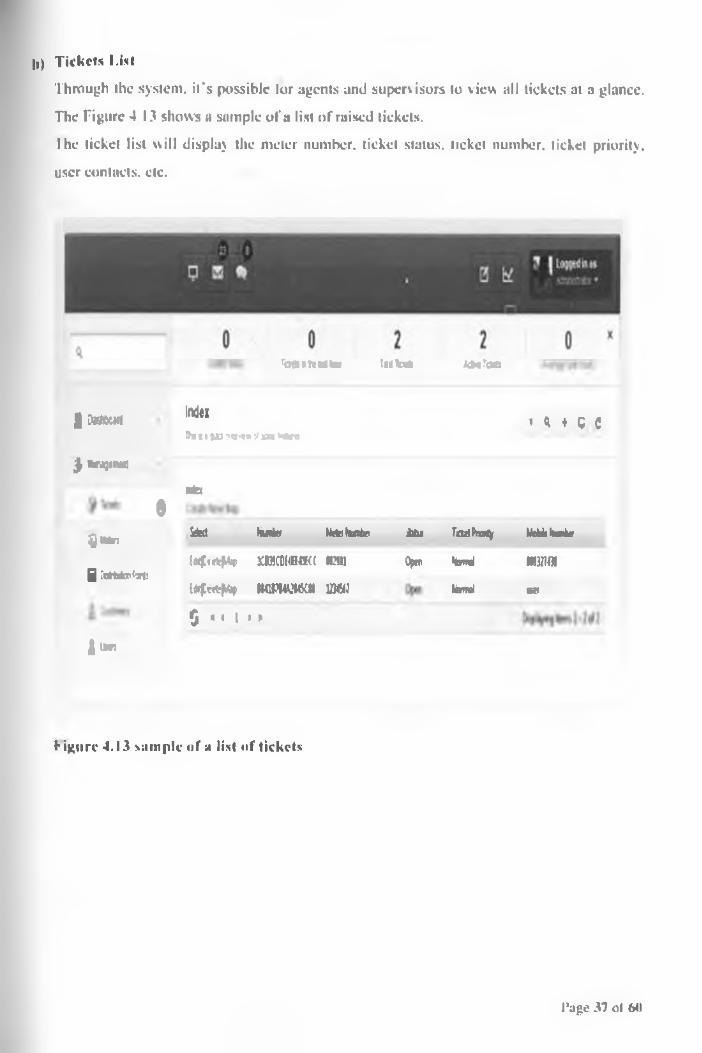
It) Tickets l.ist
Through the system, it's possible lor agents and supervisors to view all tickets at a glance.
The Figure 4 13 shows a sample of a list of raised tickets.
Ihe ticket list will display the meter number, ticket status, tieket number, ticket priority,
user contacts, etc.
riMmnutar hlVt* fcMfoe
S O t t N * Index!»e 11 w ? » •» » :•* x r* v * /r :
' u c c
> KtrJJfTlHt
0n f c
« » > *Sdcct Sw »tr WftoNurtet jb tu TittitPnony W c t t tM ii r
( w f i r t f i t * H B M u e : ; B S tl 0 * •tem d m mf l CchJicr>£*t:
E i j t a f e f t y w h w u w c m m i V rn jl ati
5 * ' i * «
| \jur.
f igure 4.13 sample of a list of tickets
I‘age 37 o! 60
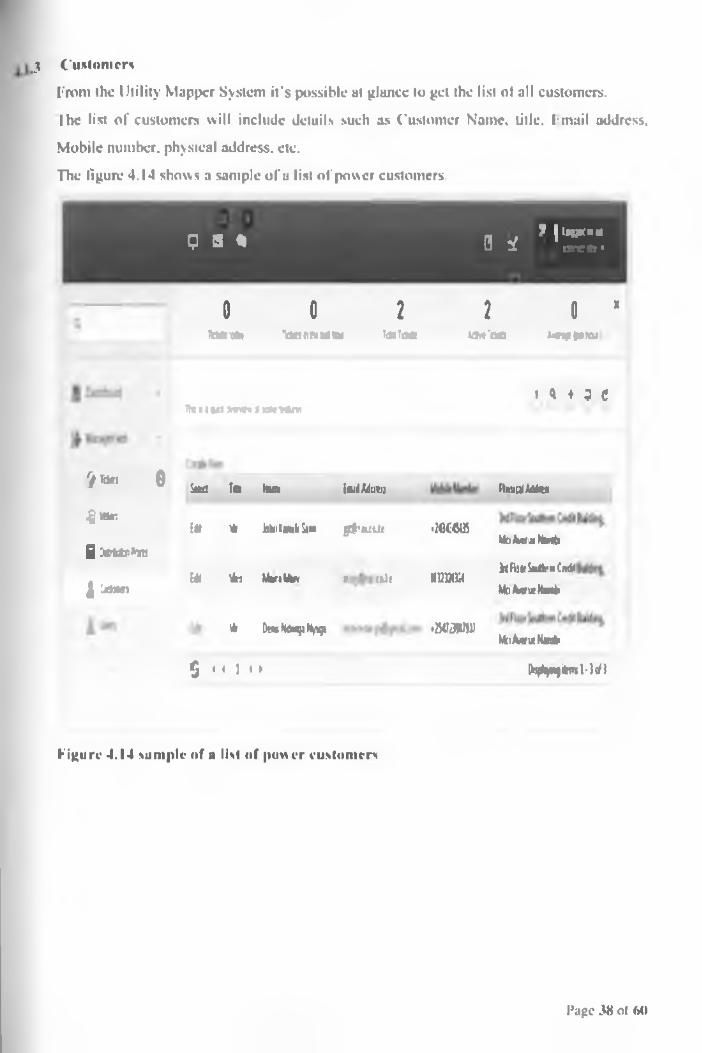
j Customer*
From the Utility Mapper System it's possible at glance to get the list of all customers.
The list o f customers will include details such as Customer Name, title. I-mail address.
Mobile number, physical address, etc.
The figure 4.14 shows a sample ofu list of power customers.
Q Z % 0 *? I i n ) K i H
. D IT T O *
o 0 2 2 0 *M f c t t r 'd o r r » « e * < Ida t o e Uht'Oti ******
fctivisirww Jxmttfti» * ♦ 5 C
>Tttf! Q
£’Kto*.
i :m > ni
| C4M1
Sett fit* Kim iu tM o u i ftMtulAoitei
m 6 bN iK m hk* g f ’ t t t te •M C W \k>k«»*r.b
i* Mo Manlfcv r (tie ■HWW3WHjm SoUten Cndi
KfcifctrtxKmki
* D wSoapNp* • B O MKiAwutNwbi
o << 1 • » B qfcyiq ikm M ofl
Figure 4.14 sample of a list of power customers
Page 38 ot 60
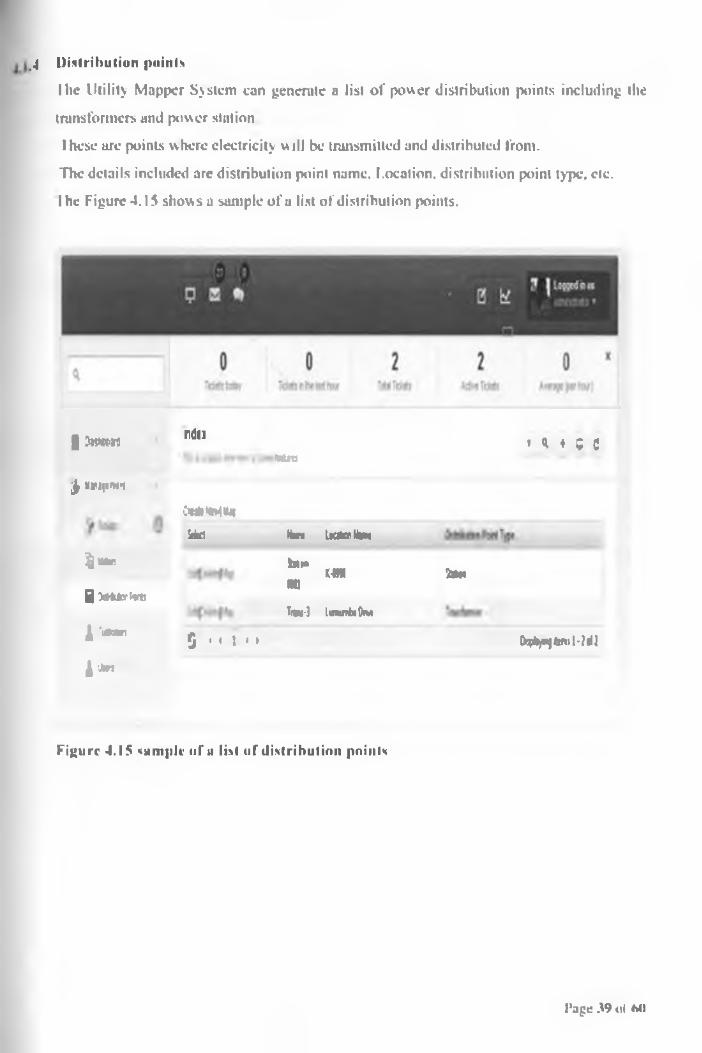
.4 Distribution points
I he Utility Mapper System can generate a list of power distribution points including the
transformers and power station
these arc points where electricity will be transmitted and distributed front.
The details included are distribution point name. Location, distribution point type. etc.
I he Figure 4.15 show s a sample of a list of distribution points.
| to w n 'ndei• u c e
Jr uriji'U’i
Win
I*i»t*H**Meet Hm UotviMm
$**! intom tom
| fetor taliMt
| ‘ rrmnTw-5 l«TU?t»Dn*
o • < i • > OqfcpitouMrf]
A * 1
Figure 4.15 sample of a list of distribution points
Page 39 oi 60
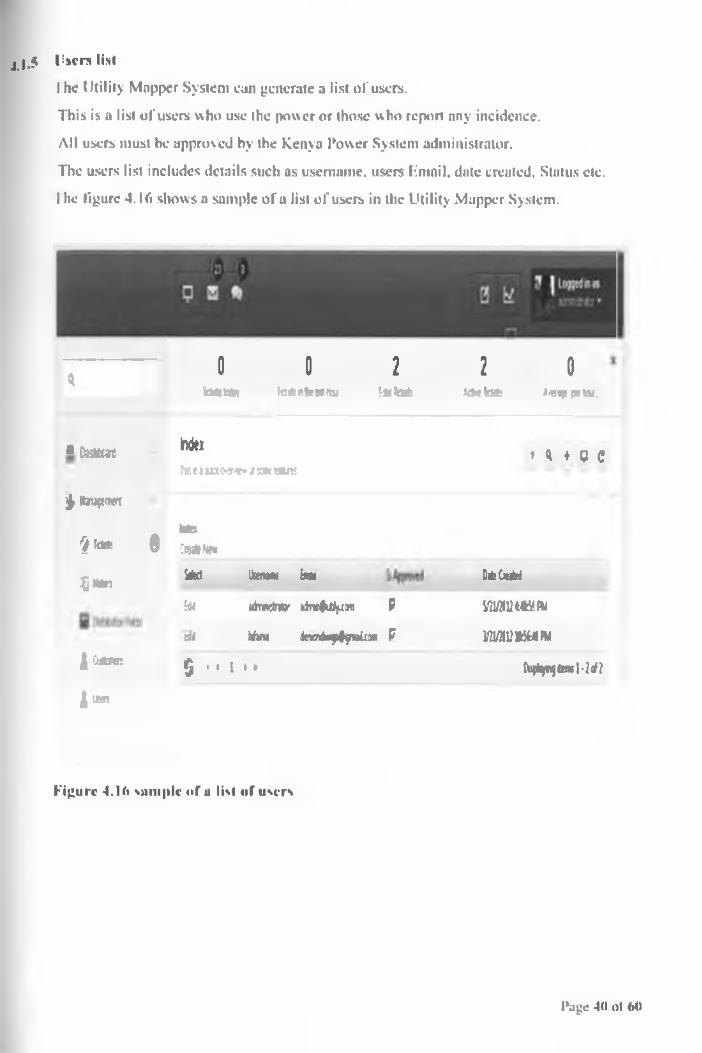
4.1.5 Users list
I he Utility Mapper System can generate a list of users.
This is a list of users who use the pow er or those w ho report any incidence.
All users must be approved by the Kenya Power System administrator.
The users list includes details such as username, users Email, date created. Status etc.
I he figure 4.16 shows a sample ofu list of users in the Utility Mapper System.
% 0 0 2 2 0kttitakr fotfjrfrtaK u f e t a * ta*bUH A-etjjprVM}
■ feature M nte«aanc4r*w«aKKlttS t l * 9 C
jf fcwjtwrt
£ rc u b 0M nQMHHw
5 N r Met UsernsK It* DfcCwtrd
&tdt
)M n M r u to fu ty a n P Wwi A nm M yfjm iaa P
msmpummiMtu
J O iOrtr. 5 • • i » i to ffcp ijtw I-M1 tan
Figure 4.16 sample of a list of users
Page 40 ol 60
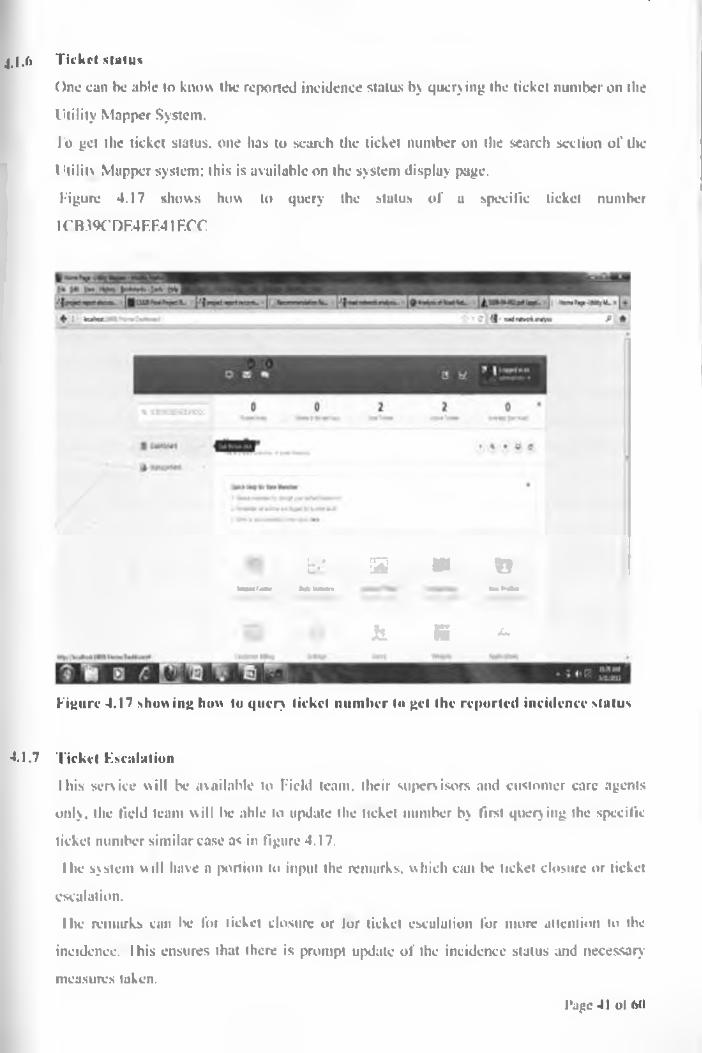
4.1.6 Ticket status
One can be able to know the reported incidence status by querying the tieket number on the
Utility Mapper System.
I b get the ticket status, one has to search the ticket number on the search section of the
l !tilit\ Mapper system; this is available on the system display page,
figure 4.17 shows how to query the status of a specific tieket number
I CB39CDF.4F.F.41ECC
b/ a m »taix'Mr M M n taNhi
JbL ■ A
figure 4.17 showing how to query ticket number to get the reported Incidence status
4.1.7 Ticket Escalation
I his service will lx* available to Field team, their supervisors and customer care agents
only, the field team will lx* able to update the ticket number by first querying the specific
ticket number similar case as in figure 4.17.
I he system will have a portion to input the remarks, which can he ticket closure or ticket
escalation.
I he remarks can lx* for ticket closure or lor ticket escalation for more attention to the
incidence. I his ensures that there is prompt update of the incidence status and necessary
measures taken.Page 41 ol 60
4.2 Spatial Database
I he project task was to develop a web based solution tlial included a spatial database to
address spatial consideration for addressing power outage incidences. The spatial database
was accessed through the Utility Mapper System.
The database will be hosted and managed at Kenya Power company premises. Best practise
methods will be applied to ensure there is training done, backups ure done, system
redundancy, business continuity and disaster recovery techniques arc put in place by the
company, though these are not preserve of this project.
The spatial database was developed using RavenDB Database which is a document based
database management system. RavenDB is an open source 2IK1 generation document
database. Document databases are known for their ability to scale well and the quick and
robust mapping of the business logic.
RavenDB is a transactional, open-source Document Database written in .NUT. offering a
flexible data model designed to address requirements coming from real-world systems.
RavenDB allows you to build high-performance, low-latency applications quickly and
efficiently.
Data in RavenDB is stored schema-less as JSON documents, and can be queried efficiently
using Linq queries from .NIST code or using RBSTful API using other tools. Internally,
RavenDB make use of indexes which are automatically created based on your usage, or
were created explicitly by the consumer.
RavenDB is built for web-scale, and is offering replication and sharding support out-of-thc-
box.
The RavenDB database will be used to store both the spatial and attributes details.
Page 42 ot 60
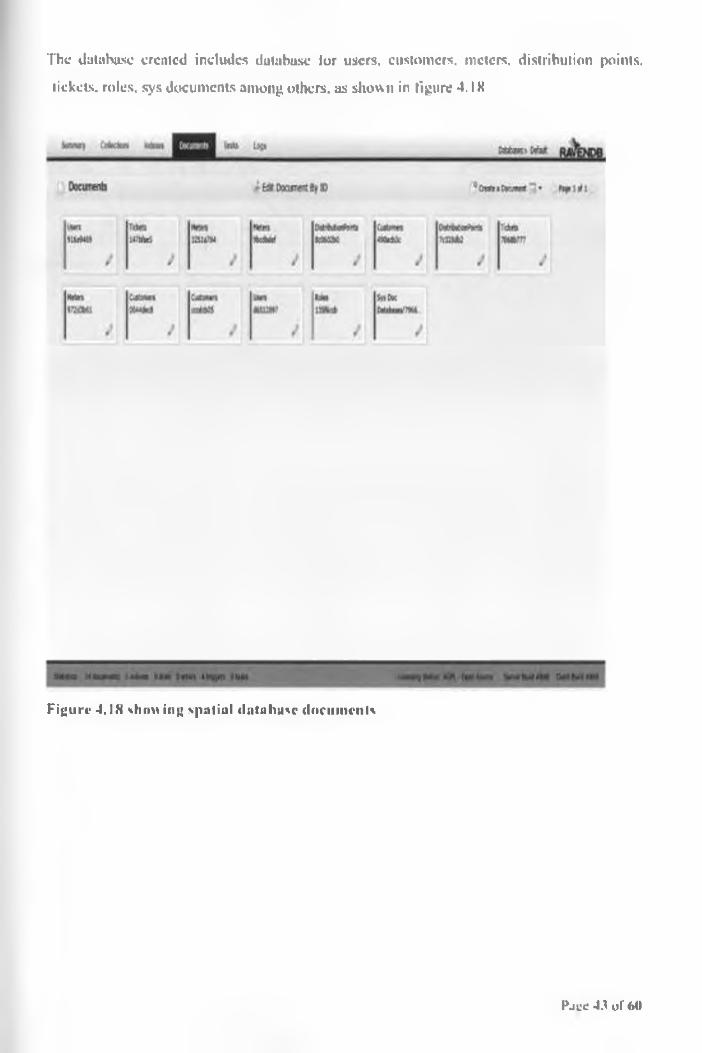
The daluha.se created includes database lor users, customers, meters, distribution points,
tickets, roles, sys documents among others, as shown in figure 4 .1S
Figure 4.18 showing spatial database documents
Pace 4.1 of 60
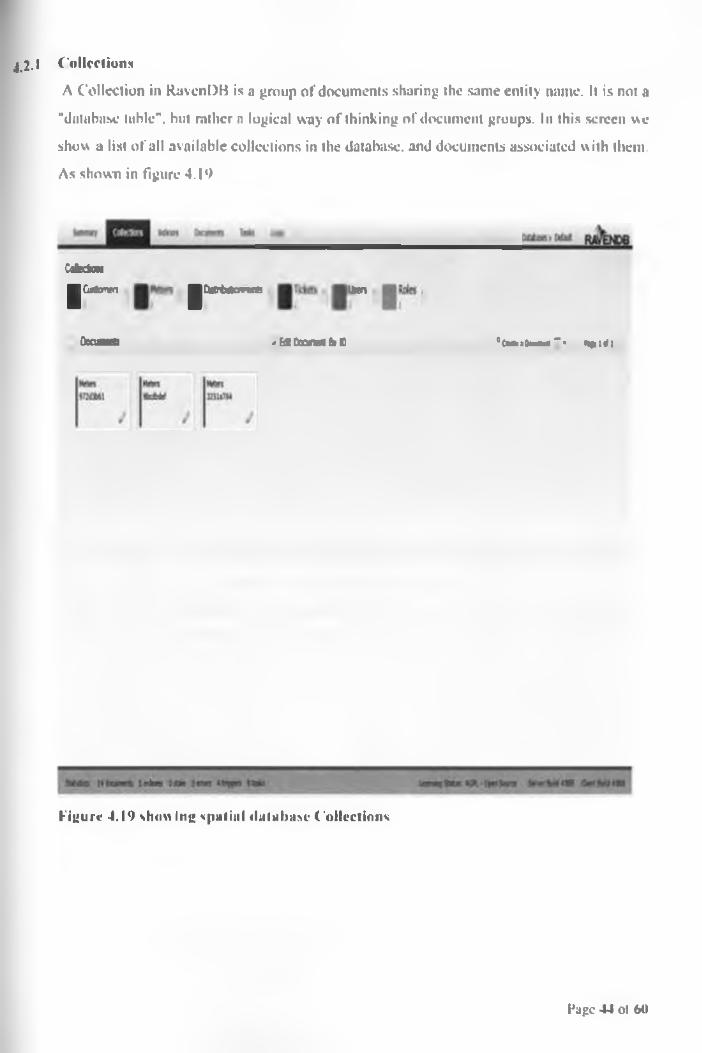
4.2.1 Collections
A Collection in RavenDB is a group of documents sharing the same entity name. It is not a
"database table", but rather a logical way of thinking of document groups. In this screen we
show a list of all available collections in the database, and documents associated w ith them.
As shown in figure 4.19
Cefcctc*
JCu'fcnri
Dotuneta
I Cwrb/avcrtj
'EdtDoanrtbilO
Uim
• tw iO o w * - ftplrfl
figure 4.19 show ing spatial database Collections
Page 44 ot 60
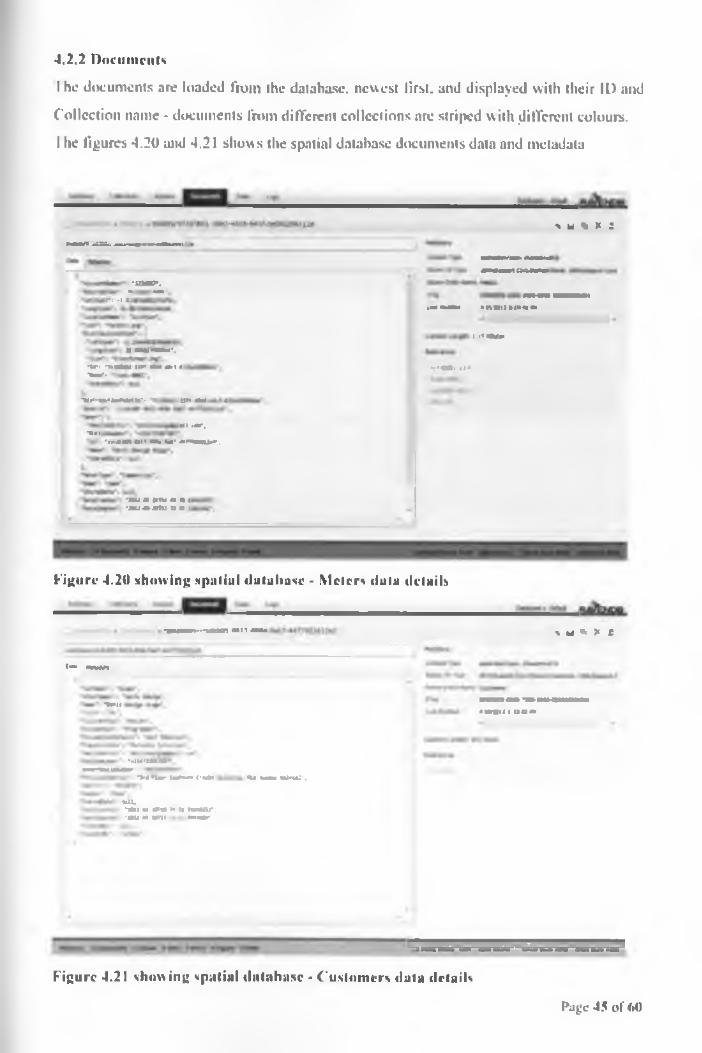
4.2.2 Documents
I he documents are loaded from the database, newest first, and displayed with their IL) and
Collection name - documents from different collections are striped with .different colours.
I he figures 4.20 and 4.21 shows the spatial database documents data and metadata
% m % x ;
-inter,A- ■*■!r: -l.ll
» mhomu*,
immt m t kn*Rimkii»
• i >'«**•.
ir. nmmi iw* m+ *■» «•Wt MJMi ili«
■w *•*!•*• *++**“' w m* fMl tmr,**■»-n*mm u\s «•» !«• MHiMWir,
'NURItni H IM ‘Mi-m-UM 11: k;
Figure 4.20 showing spatial database - Meters data details
»iif* % m «> * e
C<M mMg
'V-ti • M«(i 4 l»M*
vj*iimm*>« 'l*- imt+r* C'WIt HA mm HHiroi*.
*U.m m A N ii ttw iiu r. -»W M wn» — *ar .
Figure 4.21 showing spatial database - Customers data details
Page 45 of 60

4.3 Incidence reports
I he system database captures all reported incidences, time taken to solve the incidence,
recurring incidences, how they were solved, etc.
As this information is stored in a reliable system, it can he harnessed to generate incidence
reports. These reports can include:
- Recurring incidences per locations
- l ime taken to solve an incidence by locations
• Most problematic areas per location
l ime and month of year when there are many incidences, etc
These will help in making of informed decision on best way to manage eases of power
outage incidences.
4.4 System Comparison
Kenya Power Company currently has an Incidence Management System (IMS) in place for
handling power outage issues, through the system they receive all power related
issuc/cotnplainis. keyed in by agents and generate a work order.
The IMS system operation is similar to the proposed utility mapping system with the only
difference in that the IMS system do not take into consideration spatial elements when
handling customer complaints and it’s not web based while the proposed system is a web
based system and lakes into consideration spatial factors when addressing customer’s
incidences.
IMS is used lor the all Kenya Power Regions and for all complaints while the proposed
system covers only a small area anti dealing only with power outage incidences.
The figures 4.22 and 4.23 show comparison between current Kenya Power system and the
proposed Utility Mapper System.
Page 46 of 60
Loral based system v» Web based System
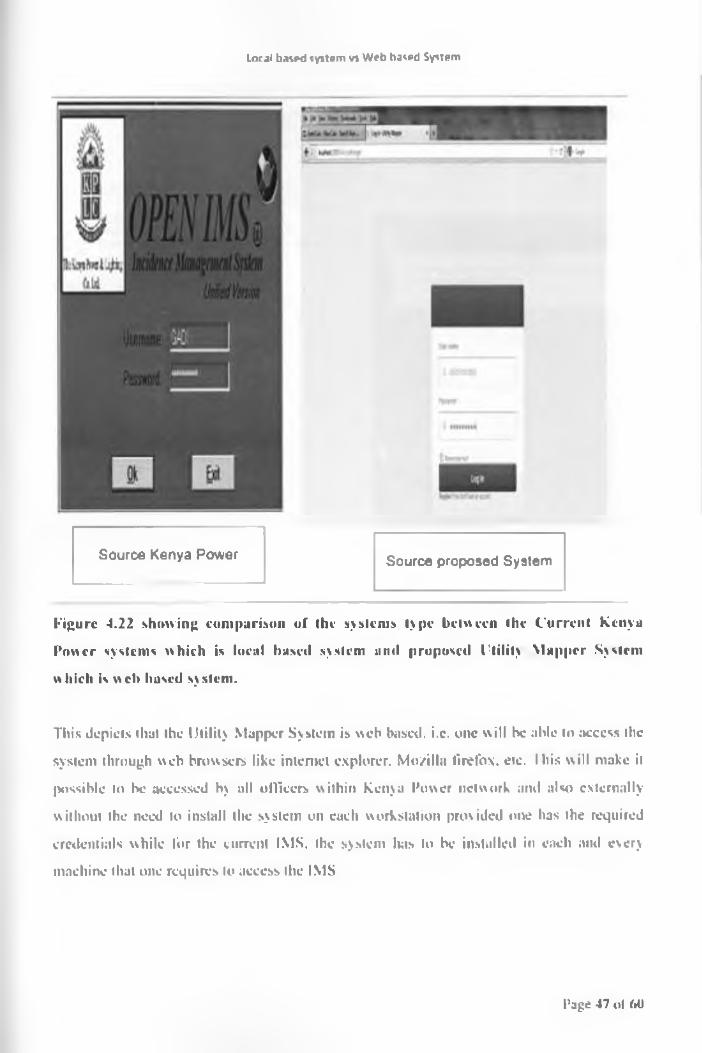
Source Kenya Power Source proposed System
Figure 4.22 showing comparison of the systems type between the Current Kenya
Power systems which is local based system and proposed Utility Mapper System
which is web based system.
This depicts that the Utility Mapper System is web based, i.e. one will be able to access the
system through web browsers like internet explorer. Mozilla lirelbx. etc. I his will make it
possible to be accessed by all officers within Kenya Power network and also externally
without the need to inslall the system on each workstation provided one has the required
credentials while for the current IMS. the system has to be installed in each and every
machine that one requires to access the IMS
Page 47 ol 00
luxtawa UUimw lot**" Mhmx'U
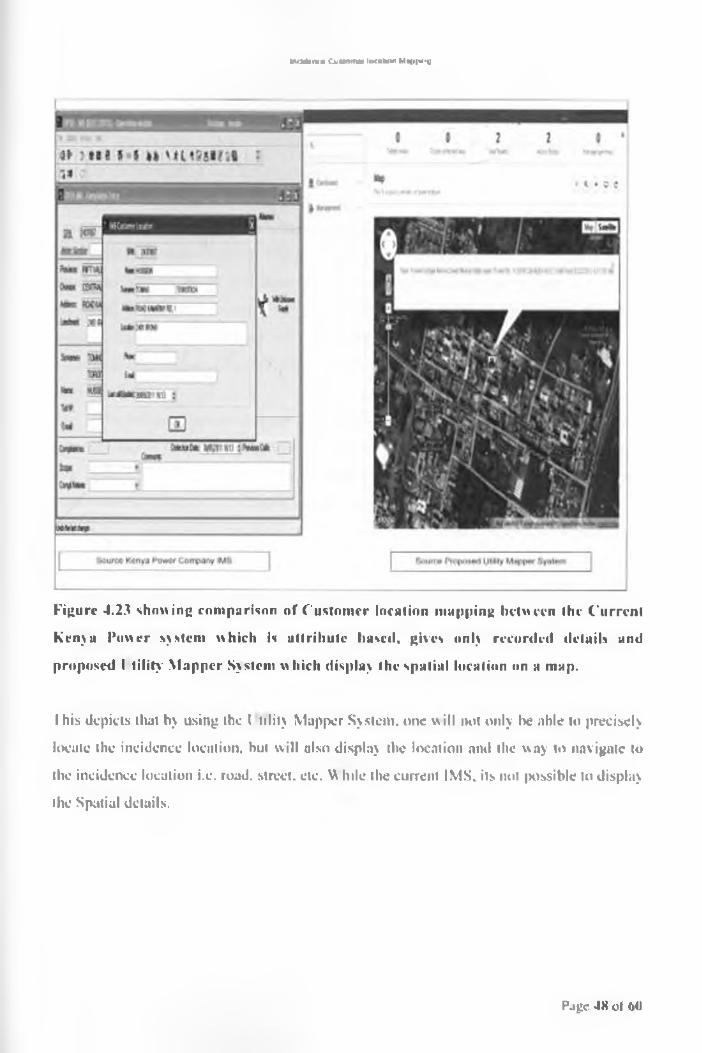
Figure 4.23 showing comparison of Customer location mopping between the Current
Kenya Power system which is attribute based, gives only recorded details and
proposed l tilify Mapper System w hich display the spatial location on a map.
I his depicts that by using the I tility Mapper System, one will not only be able to precisely
locate the incidence location, but will also display the location and the way to navigate to
the incidence location i.e. road, street, etc. \\ bile the current IMS. its not possible to display
the Spatial details.
Page 4X of 60
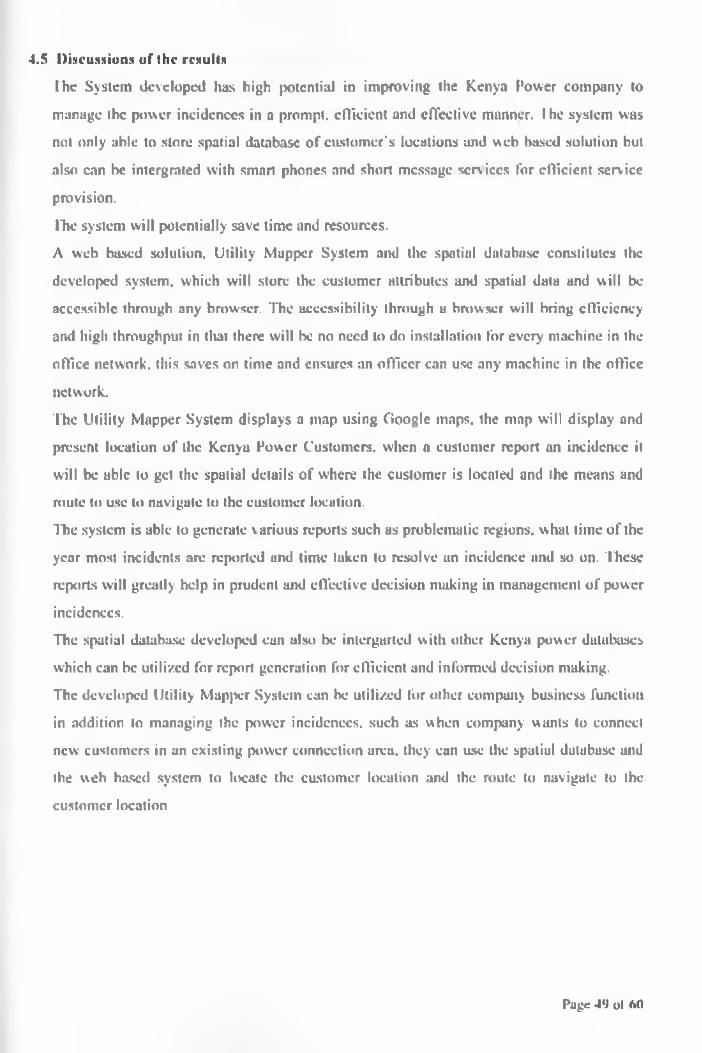
4.5 Discussions of the results
I he System developed has high potential in improving the Kenya Power company to
manage the power incidences in a prompt, efficient and effective manner. I hc system was
not only able to store spatial database of customer's locations and web based solution but
also can be integrated with smart phones and short message serv ices for efficient service
provision.
rhe system will potentially save lime and resources.
A web bused solution, Utility Mapper System and the spatial database constitutes the
developed system, which will store the customer attributes and spatial data and will be
accessible through any browser. The accessibility through a browser will bring efficiency
and high throughput in tltat there will be no need to do installation for every machine in the
office network, this saves on time and ensures an officer can use any machine in the office
network.
The Utility Mapper System displays a map using Google maps, the map will display and
present location of the Kenya Power Customers, when a customer report an incidence it
will be able to get the spatial details of where the customer is located and the means and
route to use to navigate to the customer location.
The system is able to generate v arious reports such as problematic regions, what lime of the
year most incidents are reported and time taken to resolve an incidence and so on. These
reports will greatly help in prudent and effective decision making in management of power
incidences.
The spatial database developed can also be inlcrgarlcd with other Kenya power databases
which can be utilized for report generation for efficient and informed decision making.
The developed Utility Mapper System can be utilized for other company business function
in addition to managing the power incidences, such as when company wants to connect
new customers in an existing power connection urea, they can use the spatial database and
the web based system to locate the customer location and the route to navigate to the
customer location
Page 49 ol 60
C'hiiptcr 5: CONCLUSIONS AND RECOMMENDATIONS
5.1 Conclusion!!
The objective of the study was achieved in that a spatial web based system was developed
and tested to address customer's location consideration and web based solution when
managing power outage incidences at Roysamhu. Nairobi. Kenya.
As depicted in this project the Kenya Power Company already has a working incident
management system, which should be positively enhanced by applying (US and web
mapping technology to bridge the spatial consideration und web based solution gap.
The data used in this project was secondary in that it was collected by other organization.
This can serve as a launching pad in harnessing o f CIS to address location consideration in
utility industries.
During execution of this project there were various limitations encountered. Ihe major
problem was acquisition of data required for system development.
It was not possible to host the system online, and thus impossible to demonstrate use of
smart phones used by field personnel's for incidences resolutions.
The CIS technology is more informative and efficient in managing power outage
incidences as depicted in this project.
Page 50 of 60
5.2 Ki'coitH'mliitions
This study has shown use of GIS technology will have positive impact, cost effective and
long lasting solutions in management of power outage incidences which will be both
beneficial to Kenya Power Company. its customers and Kenyan Government.
The researcher recommends the following to be done to upscale the system:
i. Tlic project should be adopted by Kenya Power Company to enhance incidence
service management.
ii. lire web based system should be hosted online to enable usage of smart phones.
iii. ITic web based system should be integrated with telephone providers to enable short
messaging services.
iv. Further study should be done to incorporate road network analysis to calculate and
display the shortest route to the incidence area.
v. Further system development can be done to enable the system to generate an
automatic response ticket if the power goes off.
vi. ITtc system can be enhanced further by extending it to address all customer
complaints for the entire country.
vii. The System should be extended to map and be incorporated with all other business
functions which will greatly aid in effective and informed decision making.
the method used in developing the Utility Mapper System is potentially applicable in other
utility industries ns well as other investments not necessarily on utility line of business.
Page 5 1 of 60
REFERENCES
1. Area D .. Alkan M .. Uayik C. and Seker D.Z.. (2012), Web Based GISfarSa/ranbolu
Historical City available online at
http://www.lig.nct/puh/fig20l2/papcrs/ts09c/TS09C area alkan ct al 6090.pdf accessed
on February 2012.
2. Centre for Energy"", (2012), transporting electricity, available online at
htlp://www.ccnlreforcncrgy.com/AboutEncrgy/Hydro/Environment.asp?page=l2 accessed on March 2012.
3. CyberSWIFT, (2012), Restructured-.-1 cede rated Rower Development and Reforms
Programme, available online at http://www.cyber-swifl.eom/gis-utilitic.s.hlinl accessed on
March 2012.
4. F.SRI, (2012(a)). Improving Outage Response with Mobile (US available online at
http://www.esri.com/library/eascsludies/northeasi-rcinc.pdl accessed on February 2012.
5. ESRI. (2012(b)). Mobile (US Delivers Environmental and Efficiency Renejits for
Transmission Utility available online at htlp://w ww.esri.com/library/casestudies/vermont-
clcclric.pdf; accessed on March 2012.
R Homann R., (2012), Danish Energy Company Focuses on Smart Grid, available online ut
htip://www.csri.com/ncws/arcncws/winter1112articles/danish-energy-company-focuses-on- smart-grid.html accessed on March 2012.
i) Inventors. (2012), what is electricity, available online at
http://invcntors.aboui.eom/library/inventors/lilelectricl.htm#what%20is%20electricily accessed on March 2012.
10 Jones, D.A. (1991). "Electrical engineering: the backbone of society". Proceedings o f the
I EE: Science, Measurement and Technology 138 (1): 1-10. lX)I:10.1049/ip-a-
3.1991.0001
11 Kenya Power, (2012(a)). About Kenya Power, available online ut
http://www.kplc.co.ke/index.php7id 55 accessed on February 2012.
12 Kenya Power, (2012(b)), What We Do, available online at
http://www.kplc.co.ke/index.php7id 58 accessed on February 2012
13 KNBS. (2012). Kenya Census 2009. 2009 Population A Housing Census Results
available online at
http://www.knbs.or.kc/docs/PrescntationbyMinistcrforPlanningreviscd.pdfacccsscd on
February 2012.
Page 52 of 60

14 Nairobi City Water and Sewerage Company, (2012), Improving reliability, available online
at http://www.nairobiwaicr.co.kc accessed on February 2012.
15 SMF.ToolKit. (2012). Customer Satisfaction Survey Form, available online at
http://kenya.sinctoolkii.org/kenya/cn/contcnt/en/40l/Customer-Satisfaction-Survcy-Fonn
accessed on February 2012
16 Wyland J,(2009), AMR and CIS combine to close outage tickets, available online at
http://www.esri .com/library/newslettcrs/encrgycurrcnts/cncrgysummer2000.pd0|(pagc= 14
accessed on March 2012
Page 53 ot 60
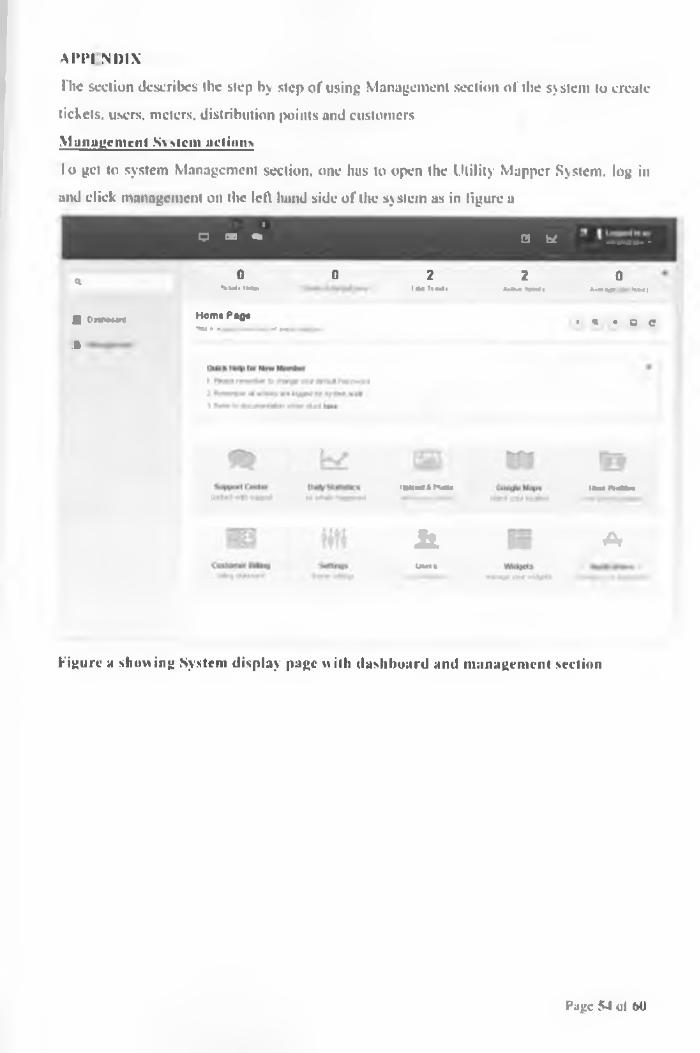
AI TI NDI X
Hie section describes the step by step of using Management section of the system to create
tickets, users, meters, distribution points and customers
Management System actions
lo get to system Management section, one has to open the Utility Mapper System, log in
and click management on the left hand side of the sy stem as in figure a»
a = «* a he •*«***• •
a 0'•Ml. IM*.
0 2l u l l *
2*ifw HMi
0A*««p IlMI
• DWIMM Horn* Pag*•H* m ■ +* M ' s ♦ o ©
.6
IM a O lld a UMUMM
J s .
Uwt»A
Figure a showing System display page with dashboard and management section
Page 54 ol 60
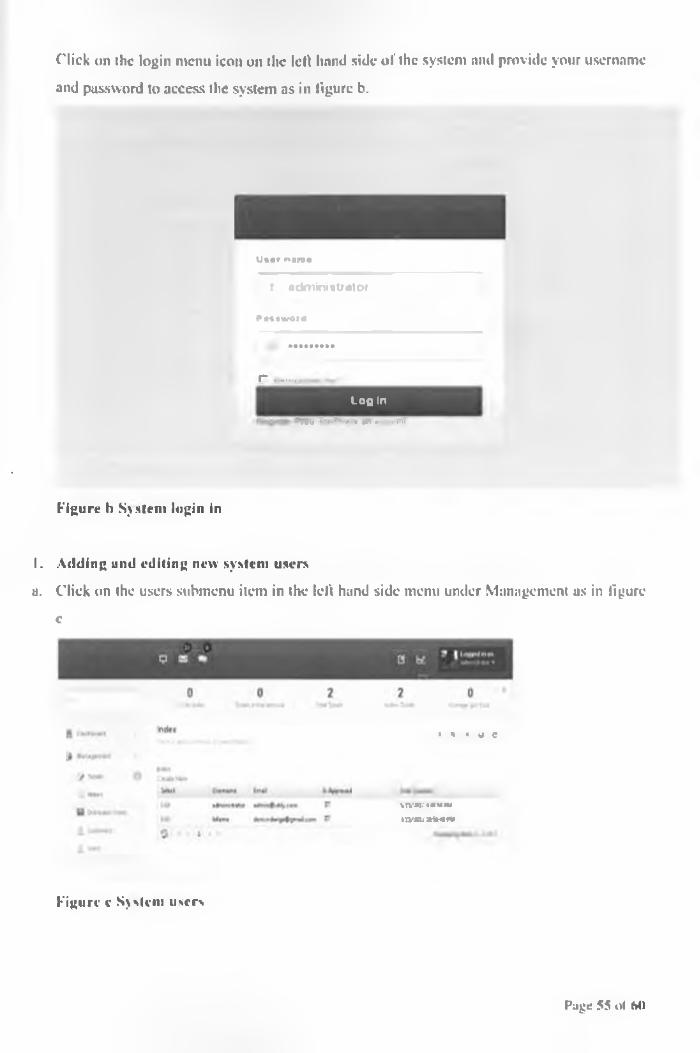
Click on the login menu icon on the left hand side of the system and provide your username
and password to access the system as in figure b.
U ** f » i m
X adm inistrator
rniM tr
r U»n,.rL o g I n
* n \i dan^ntu* tn m to jM
Figure b System login in
I. Adding and editing new system users
a. Click on the users submenu item in the left hand side menu under Management as in figure
c
• * • « e
V!V» !.'••'««« la W M M N
Figure c System users
Page 55 ol Ml
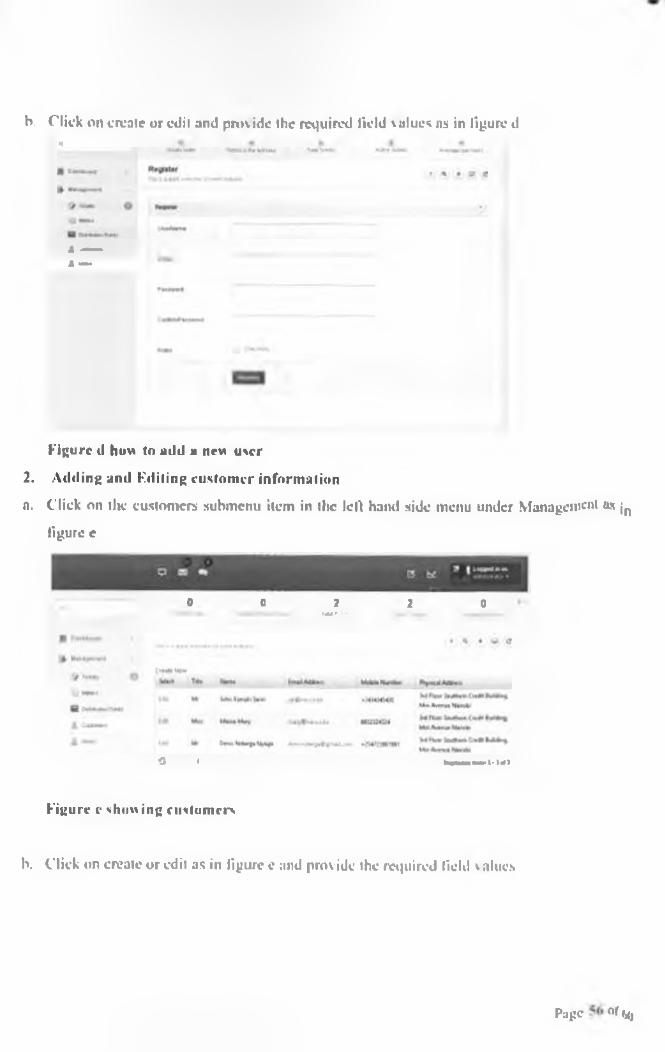
K Click on create or edit and provide the required field values as in figure dH
A —— A —
Figure d how to add a new user
2. Adding and Fdiling customer information
n. Click on tin.* customers submenu item in the left hand side menu under Management as jn
figure e
o o 2 2 ota iw i
S • • • • • l n t M t W i l - X I
Figure e showing customers
b. Click on create or edit as in figure e and provide the required field \ alues
Page of ()(J
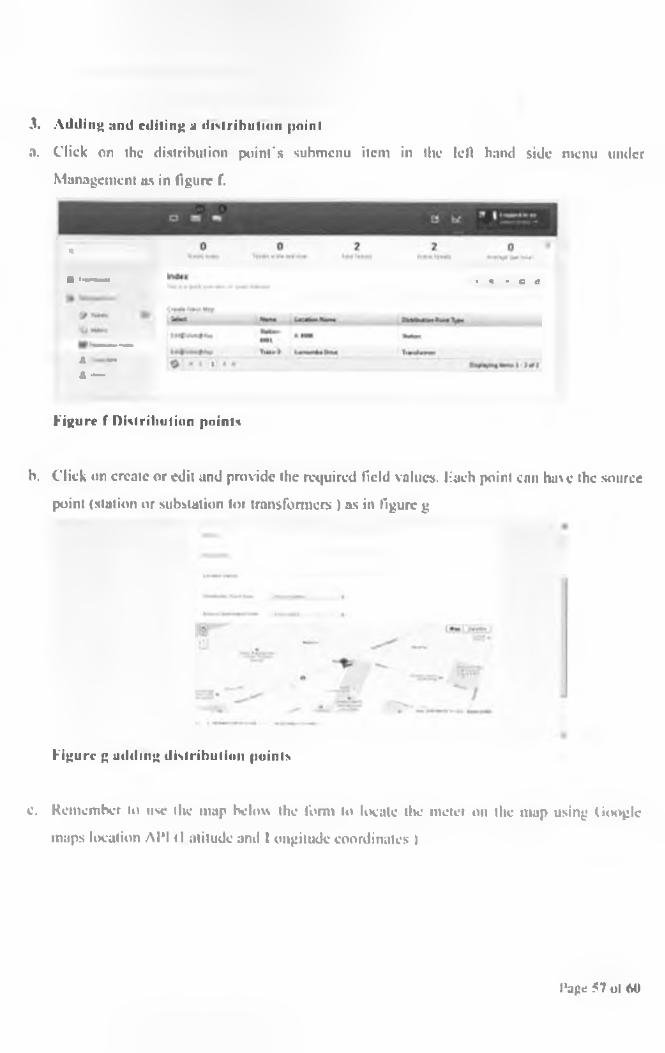
a.
3. Adding and editing a distribution point
Click on the distribution point's submenu item in the left band side menu under
Management as in figure f.
*
■ I W M
* —
A —
• « • o <?
Figure f Distribution points
b. Click on create or edit and provide the required Held values, liach point can base the source point (station or substation tor transformers ) as in figure g
Figure g adding distribution points
e. Remember to use the map below the form to locate the meter on the map using (iooglc
maps location AIM (I atitudeand longitude coordinates )
I'age 57 ot 60
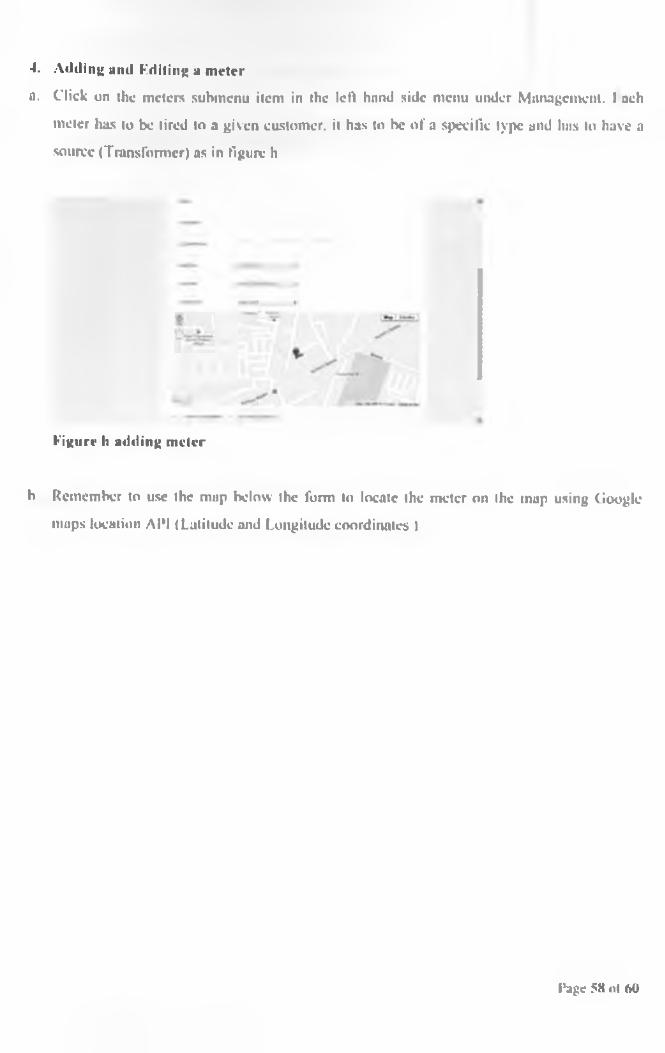
4. Adding and fditing a meter
a. Click on the meters submenu item in the led hand side menu under Management. I ueh
meter has to be tired to a given customer, it has to be of a specific type and has to have a
source (Transformer) as in figure h
figure It adding meter
b Remember to use the map below the form to locate the meter on the map using Google
maps location AIM (Latitude and Longitude coordinates >
Page 58 ot 60
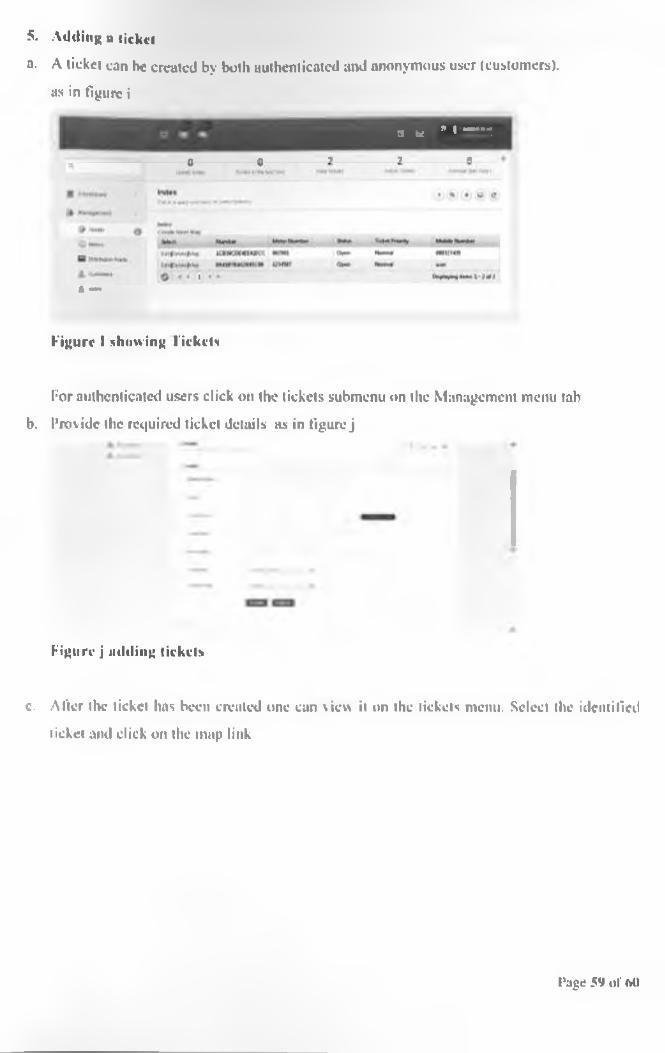
5. Adding a ticket
a. A ticket can he created by both authenticated and anonymous user (customers), as in figure j
a * ” »•——.n n 7 7 0
A — •
Figure I showing Tickets
For authenticated users click on the tickets submenu on the Management menu tab
b. Provide the required ticket details as in figure j
Figure j adding tickets
c. After the ticket has been created one can view it on the tickets menu. Select the identified
ticket and click on the map link
Page 59 of 60
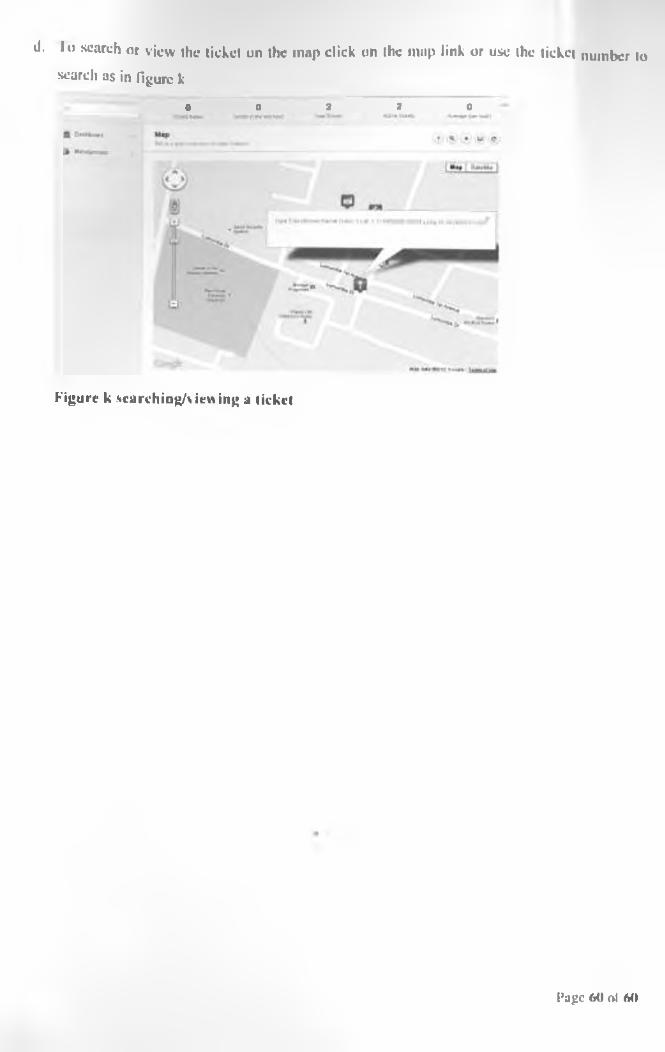
d. in search or view the ticket on the map click on the mup link or use the ticket number to search as in figure k
0 0 7 7 0
Figure k scarching/viewing a ticket
Page 60 ol 60