Embed Size (px)
Citation preview
J Sci Food Agric 1998, 76, 263È269
Use of Fourier Transform Infrared Spectroscopyand Partial Least Squares Regression for theDetection of Adulteration of Strawberry Pure� es
J K Holland, E K Kemsley and R H Wilson*
Institute of Food Research, Norwich Laboratory, Norwich Research Park, Colney, Norwich, NR4 7UA, UK
(Received 21 August 1996 ; revised version received 27 January 1997 ; accepted 24 June 1997)
Abstract : Fourier transform infrared (FT-IR) spectroscopy and chemometricshave been combined to detect adulteration in strawberry pure� es. The mid-IRspectra of 983 fruit pure� es were used as the data for a partial least squares regres-sion on to a binary dummy variable, that represents two sample types, straw-berry or non-strawberry. Three hundred and seventy of the spectra were used asan independent test set, of which 94É3% were correctly assigned by the model.Strawberry pure� es mixed with certain adulterants were included in the databaseto demonstrate that the detection of these adulterants was possible using thistechnique. The potential long-term stability of the model, developed with 1993and 1994 fruit, was illustrated by analysing the spectra of fruit harvested in 1995,of which 96É6% were correctly assigned. A “blind testÏ of the model was carriedout with a set of 23 fruit pure� e samples prepared by an industrial collaborator.Twenty two of these samples were classiÐed in accordance with the description ofthe samples provided by the company. 1998 SCI.(
J Sci Food Agric 76, 263È269 (1998)
Key words : infrared ; spectroscopy ; fruit ; pure� es ; adulteration ; partial leastsquares regression
INTRODUCTION
When purchasing fruit pure� es or juices, the potentialproblem of adulteration has to be considered. The prac-tice of adulteration arises for two main reasons : Ðrstly itcan be proÐtable, as certain fruits command premiumprices ; and secondly adulterants can be easily mixedinto a pure� e or juice, and are subsequently difficult todetect. To counter this problem manufacturers subjecttheir raw fruit ingredients to a series of quality controls,which includes high-performance liquid chromato-graphy (HPLC), thin layer chromatography (TLC),enzymatic tests (eg for sorbitol) and physical tests such
* To whom correspondence should be addressed.
as measurements of pH and ¡Brix (Robards and Antol-ovich 1995), to establish their authenticity and henceguarantee the quality of the products manufacturedfrom them.
Although such quality controls are desirable, theextensive chemical analyses employed can be slow andexpensive, which means that they are not ideal forroutine use. Therefore, industry is seeking alternativemethods of analysis that are better suited to routineapplications. Spectroscopic techniques o†er a practicalalternative as the analyses are rapid and capable ofdetecting a range of adulterants. Previous work hasshown that Fourier transform infrared (FT-IR) spec-troscopy has been useful in the screening of a range offood products (Lai et al 1994 ; Briandet et al 1996). Of
2631998 SCI. J Sci Food Agric 0022-5142/98/$17.50. Printed in Great Britain(

264 J K Holland, E K Kemsley, R H W ilson
particular relevance to fruit products has been the clas-siÐcation of pure� es according to fruit species using mid-infrared spectra (Defernez et al 1995).
The work presented here has concentrated ondeveloping a method for detecting adulteration instrawberry pure� es. The technique combines FT-IR spec-troscopy with a partial least squares (PLS) regression(Geladi and Kowalski 1986) onto a binary dummy vari-able, which represents sample class. For this applicationthe classes deÐned are strawberry and non-strawberry,the latter including the adulterated strawberry pure� es.The PLS regression was developed using 983 spectra offruit pure� es and determined a relationship between thevalue of the dummy variable and the spectrum of apure� e. The model was used to predict the value of thedummy variable for the spectra of “testÏ samples and soassign its class. A sample was accepted as authentic,when its predicted value of the dummy variable fellwithin the range of values deÐned by the predictions forthe authentic samples in the database.
The minimal sample preparation required, combinedwith the speed of the spectrum collection and analysiswith the model, means that the time needed to screen asample for adulterants is about 15 min. This makes it acomparatively rapid technique and thus it has greatpotential for use as a routine screening method. As theultimate aim of this work is to develop a means forscreening commercial samples, the technique was usedin a “blind testÏ of fruit pure� e samples, prepared by anindustrial collaborator to be close in form to actualcommercial samples. The results showed evidence thatthe method could be applied successfully to commercialfruit pure� es.
EXPERIMENTAL
The mid-IR spectra of the fruit pure� es were collected ona Spectra-Tech (Applied Systems Inc, Stamford CT,USA) MonitIR FT-IR spectrometer, described pre-viously (Defernez and Wilson 1995). A nominalresolution of 8 cm~1 was used, and 256 interferogramswere co-added prior to Fourier transformation. Thesingle-beam spectra of the pure� es were ratioed to back-ground spectra of water and then converted intoabsorbance units. The spectral range was truncated to899È1802 cm~1 (235 data points) to remove thoseregions unnecessary for the analysis. A single pointbaseline correction was applied at 1802 cm~1, and thenthe spectra were normalised on the integrated spectralarea over the range 899È1802 cm~1.
To ensure their authenticity, the pure� es were pre-pared in the laboratory from whole fresh or freeze-thawed fruit, which were harvested between 1993 and1995. For each sample a small number of fruit weretaken from a particular batch and either pushed
through a Ðne metal sieve or blended in a mixer (BraunMultiquick 300). Mixtures were made by taking thepure pure� e and adding an appropriate amount of adul-terant.
Owing to practical limitations, an exhaustive range ofadulterants could not be included in the database, socertain potential adulterants were studied. These wereapple, plum, sugar solutions, red grape juice andrhubarb compote. Sets of four strawberry pure� es wereeach adulterated with 10, 30, 50, 70 and 90% (w/w)apple, while two other strawberry pure� es had additionsof apple at the 10 and 50% (w/w) levels. Plum pure� ewas added to two sets of strawberry pure� es, each givingmixtures with 10, 30, 50, 70 and 90% (w/w) plum.
Glucose and sucrose solutions were prepared to haveapproximately 9¡Brix, which roughly matched theaverage ¡Brix of the fruit pulps. The matching of the¡Brix was thought necessary to avoid any dilutione†ects in the pure� e, which could be easily detected usinga refractometer. Additions of the sugar solutions weremade to cover a range around the expected detectionlimit. The precise levels will not be disclosed as it ishoped to apply this technique for the screening of com-mercial samples and it would not be appropriate toreveal these detection limits. Red grape juice (“Waitroseown brandÏ) and rhubarb compote (“Bonne MamanÏ :80% rhubarb, 20% sugar) were also used as adulterants.Each was added by weight to pure strawberry pure� es toform two series of adulterated samples spanning theexpected detection limit for this technique. Again theselevels will not be speciÐed.
The spectra of 983 fruit pure� es (Table 1) were dividedinto three roughly equal sub-sets and used to train, tuneand test the PLS regression. The vast majority of thesesamples were prepared from 1993 and 1994 fruit,although 53 of them, in the form of adulterated samples,were made from 1995 fruits.
TABLE 1Composition of the training, tuning and test sets
Sample type Number of Samples in
T raining T uning T est setset set
Strawberry 119 117 115Adulterated strawberry 36 35 34Raspberry 55 53 51Adulterated raspberry 62 62 62Apple 24 24 23Blackcurrant 12 11 10Blackberry 9 9 8Plum 8 8 6Cherry 9 7 7Apricot 2 2 1Grape juice 1 1

Use of FT -IR for the detection of adulteration of strawberry pure� es 265
Model construction and testing
The purpose of the model was to distinguish the spectraof pure strawberry pure� es from those of adulteratedsamples or other fruits. Due to the multi-variate natureof the spectra, a chemometric technique was employedto process the data. PLS regression onto a dummy vari-able, representing fruit type, was found to be a suc-cessful approach. The PLS regression was based on theNIPALS algorithm for orthogonalised PLS with onedependent variable (Martens and 1989). The dataN~sprocessing was implemented using MATLAB (TheMath Works Inc, Natick, MA, USA) on a personalcomputer. Macros for the PLS regression were writtenin house.
The dummy dependent variable used to designatesample type, was coded 1 for strawberry pure� es and 0for non-strawberry and adulterated samples. It was con-structed as a column vector with one entry, either 1 or0, for each observation, n in total. The spectra formedthe rows of a matrix, and were arranged to correspondto the entries in the dummy variable. The number ofdata points in each spectrum was d, so the matrix hadthe dimensions of (n ] d). Both the dummy variablevector and the matrix of spectra were mean-centred, theresults of which will be referred to as y and X, respec-tively.
The process of relating X to y with the PLS regres-sion followed these steps. A set of PLS loadings werecalculated for the data set deÐned by X and y. The load-ings can be expressed as a matrix having the dimen-W
rsions (d ] r), where r signiÐes the number of PLS
loadings calculated and takes a maximum value ofr \ d. The mean-centred spectra were projected ontothe PLS loadings to obtain r PLS scores, for eachZ
r,
spectrum:
Zr\ XW
rThe transfer to PLS space is made because the numberof dimensions, r, required to represent the essentialinformation is much less than in the original space. Thisproduces and efficient data reduction, which is a greatadvantage in the subsequent manipulation of the data.Finally, a multiple linear regression (Beebe andKowalski 1987) of y on the (n ] r) matrix of PLS scores,
yields a set of coefficientsZr
pr:
y\ Zrpr
The vector of coefficients, can be multiplied with thepr,
scores of an unknown sample to predict its value of y,so indicating the sample type.
The actual development of the model was carried outin three distinct stages ; training to build the model,tuning to optimise its parameters and testing to inde-pendently validate it. The proper implementation of thisprocess requires the use of a separate data set for eachphase. Therefore, the 983 spectra available in the data-base were grouped as follows ; 337 for the training set,329 for the tuning set and 317 for the test set. Fulldetails are provided in Table 1. The Ðrst group ofspectra, the training set, is shown in Fig 1. An exami-nation of the data by eye reveals that no obvious fea-tures distinguish the pure strawberry spectra (samplenumbers 65È89, 98È135, 182È227 and 248È257) from the
Fig 1. Baseline corrected and area-normalised spectra of the samples that form the training set. Data point 1 corresponds to899 cm~1 and point 235 to 1802 cm~1.

266 J K Holland, E K Kemsley, R H W ilson
Fig 2. Plot of the standard deviation of the elements of the vector against the number of scores used in the PLS(ytune
Èyütune
)regression (r). The Ðrst minimum value in the standard deviation corresponds to the optimum value of r.
other sample types. This demonstrates the need to use achemometric technique to perform the classiÐcations.
The training set was used to construct the model andobtain the coefficients for r up to 40, as outlinedp
rabove. The second group of spectra, the tuning set,determined the optimum value of r, the number of PLSscores required to represent the spectra. The matrix
was formed by mean-centring the tuning setXtune
spectra with the mean of the raw training set data. Aseries of regressions with increasing r, up to r \ 40, wereapplied to the data, to obtain the predictionsX
tuneyütune
,of the value of the dummy variable. The performance ofthe regression at each value of r was judged by calcu-lating a vector of residuals and evaluating(y
tuneÈyü
tune)
the standard deviation of its elements. When the stan-dard deviation is plotted against r, a minimum occurs atthe optimum value of r for the regression, as shown inFig 2 for the series of regressions applied to the tuningset. A local minimum occurs at a value of r \ 11, butthe lowest value in this region corresponds to r \ 14,which was taken as the optimum value for the remain-der of this work. Although standard deviations of asimilar value were obtained for higher values of r,models with lower values of r are preferred as theyshould be the more robust.
A sample was assigned to the strawberry group, whenits predicted value of y fell within the 95% conÐdenceinterval around the mean of the predictions for the purestrawberry samples in the training and tuning sets. Thismean was found to be k \ 0É85 and the correspondingstandard deviation p \ 0É18. The 95% conÐdence limitsare given by the expression (k ^ 1É96p) and were calcu-lated as being 1É20 and 0É50 for this model. Therefore,any sample producing a predicted y value within thisrange was classiÐed as being pure strawberry. Samplesyielding other values for the prediction were assigned asnon-strawberry. Using this method of classiÐcation,there is a 5% chance that a genuine strawberry pure� ewill be rejected.
This classiÐcation criterion was applied to the yvalues output by the PLS regression for each of thesamples in the training and tuning sets. The class pre-dicted for each sample was compared to its known classto establish the success of a prediction. The model cor-rectly predicted 96É1% of the training and 93É6% of thetuning set samples. A breakdown of the results for eachset are presented in Table 2. Another way of presentingthese results is to plot the predicted y value for eachsample onto a graph showing the “strawberry accep-tance regionÏ, deÐned by the 95% conÐdence limits
TABLE 2Results of the predictions for the training, tuning and test sets using the PLS regression for
the optimum value of r \ 14
Incorrect classiÐcations % Correct classiÐcations
Strawberry Non-strawberry Strawberry Non-strawberry Overall
Training 3 (of 119) 10 (of 218) 97É5 95É4 96É5Tuning 8 (of 117) 13 (of 212) 93É2 93É8 93É5Test 6 (of 115) 12 (of 202) 94É8 94É1 94É3
Use of FT -IR for the detection of adulteration of strawberry pure� es 267
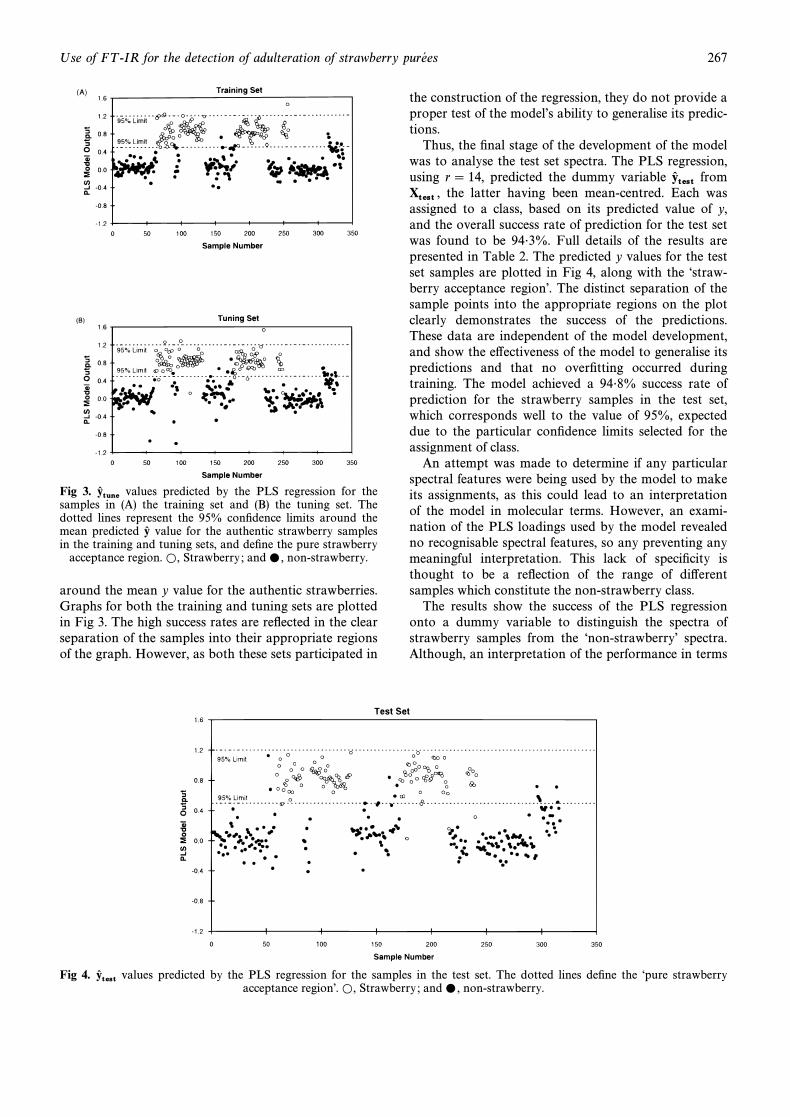
Fig values predicted by the PLS regression for the3. yütunesamples in (A) the training set and (B) the tuning set. The
dotted lines represent the 95% conÐdence limits around themean predicted yü value for the authentic strawberry samplesin the training and tuning sets, and deÐne the pure strawberry
acceptance region. Strawberry ; and non-strawberry.L, …,
around the mean y value for the authentic strawberries.Graphs for both the training and tuning sets are plottedin Fig 3. The high success rates are reÑected in the clearseparation of the samples into their appropriate regionsof the graph. However, as both these sets participated in
the construction of the regression, they do not provide aproper test of the modelÏs ability to generalise its predic-tions.
Thus, the Ðnal stage of the development of the modelwas to analyse the test set spectra. The PLS regression,using r \ 14, predicted the dummy variable fromyü
testthe latter having been mean-centred. Each wasX
test,
assigned to a class, based on its predicted value of y,and the overall success rate of prediction for the test setwas found to be 94É3%. Full details of the results arepresented in Table 2. The predicted y values for the testset samples are plotted in Fig 4, along with the “straw-berry acceptance regionÏ. The distinct separation of thesample points into the appropriate regions on the plotclearly demonstrates the success of the predictions.These data are independent of the model development,and show the e†ectiveness of the model to generalise itspredictions and that no overÐtting occurred duringtraining. The model achieved a 94É8% success rate ofprediction for the strawberry samples in the test set,which corresponds well to the value of 95%, expecteddue to the particular conÐdence limits selected for theassignment of class.
An attempt was made to determine if any particularspectral features were being used by the model to makeits assignments, as this could lead to an interpretationof the model in molecular terms. However, an exami-nation of the PLS loadings used by the model revealedno recognisable spectral features, so any preventing anymeaningful interpretation. This lack of speciÐcity isthought to be a reÑection of the range of di†erentsamples which constitute the non-strawberry class.
The results show the success of the PLS regressiononto a dummy variable to distinguish the spectra ofstrawberry samples from the “non-strawberryÏ spectra.Although, an interpretation of the performance in terms
Fig values predicted by the PLS regression for the samples in the test set. The dotted lines deÐne the “pure strawberry4. yütest acceptance regionÏ. Strawberry ; and non-strawberry.L, …,

268 J K Holland, E K Kemsley, R H W ilson
TABLE 3Results of the “blind testÏ of the PLS regression with the fruit pure� es prepared
by RHM Technology
Description of sample No of samples No of correctpredictions
Pure strawberry pure� e 1 1Sulphited pure strawberry pure� e 4 4Sulphited adulterated strawberry pure� e 4 3
Pure raspberry pure� e 8 8Adulterated raspberry pure� e 1 1Sulphited pure raspberry pure� e 3 3Sulphited adulterated raspberry pure� e 2 2
of the spectral features has not been possible, the vali-dation with a large test set demonstrates the modelÏsability to generalise its predictions beyond the samplesused to construct it.
Detection of adulterants
Series of strawberry pure� es containing adulterants at arange of inclusion levels were incorporated into thedatabase of samples, to provide a practical demonstra-tion that the presence of these adulterants could bedetected. The mixtures were prepared in the laboratory,and the levels of adulterants added to cover a range ofvalues to allow the detection limits to be determined.The test set samples corresponding to each particularadulterant are as follows : apple 152, 153 and 162È168,plum 169È171, glucose solution 322È325, sucrose solu-tion 334È337, red grape juice 315È321 and rhubarbcompote 328È333. The detection limits will not bereported here, as it is hoped to employ this technique asa commercial screening test and so it would not beprudent to reveal them. However, the PLS model wasable to detect the presence of all these adulterants atlevels which could be considered as commercially sens-ible for adulterations. Thus, the detection limitsachieved for the adulterants studied should provide apractical method for screening. This Ðnding was sup-ported by the results obtained from the “blind testÏ, seelater section, arranged with an industrial collaborator,who prepared samples similar to their commercial ones.
The last non-strawberry samples, about 20, in each ofthe training tuning and test sets, see Figs 3 and 4,appear to have a higher proportion of misclassiÐcationsthan would be suggested by the overall success ratesquoted for the technique. This anomaly is explained bythe fact that this group comprises the strawberrysamples adulterated with the sugar solutions, red grapejuice and rhubarb compote, that were prepared toevaluate the detection limits of the PLS regression. Thehigh rate of misclassiÐcation in this group, arises from
the number of samples with low levels of adulteration,which fell below the detection limits.
Analysis of 1995 fruit pure� es
An important factor a†ecting the use of this method forroutine screening is its stability over time, as instrumentdrift and seasonal variations of the fruit can inÑuencethe results. To consider this problem, the model, con-structed with samples harvested during 1993 and 1994,was used to analyse the spectra of pure� es from the 1995season. The results would indicate if the model waslimited to the analysis of fruits from the seasons con-tained in its database or if it could be applied to fruitcollected in subsequent seasons.
The 1995 data set consisted of the spectra of 56 purestrawberry pure� es and 61 pure raspberry pure� es. Whenthe 56 strawberry spectra were analysed with the PLSregression, a 92É9% success rate was obtained. This highdegree of success would suggest that the model could beapplied to the analysis of fruit grown after the modelwas developed.
The spectra of the 1995 raspberry pure� es were alsoanalysed with the PLS regression, all of them wererejected as being non-strawberry. This analysis has beenincluded because it is important to show that the modelcan also reliably reject spectra of non-strawberrysamples as well. An overall success rate of 96É6% wasobtained for the 1995 samples analysed by the model.Thus, a new model need not to be constructed for eachyearÏs fruit, which makes the technique a practical pro-position for the routine screening of strawberry pure� esover extended periods of time.
“Blind testÏ of PLS regression model
A “blind testÏ of the PLS regression was conducted in acollaboration with RHM Technology. This companyprovided a set of fruit pure� e samples, which had beensupplied speciÐcally for this test, in a form as close as

Use of FT -IR for the detection of adulteration of strawberry pure� es 269
possible to that of actual commercial samples. The setof 23 samples nominally comprised of 9 strawberry and14 raspberry pure� es.
The spectra of the pure� es were collected and thenanalysed by the PLS regression to predict the class ofeach. Only after the analysis were the actual sampledescriptions provided by RHM Technology (see Table3) and compared to the predictions. From this compari-son, eight out of nine strawberry samples were assignedcorrectly, as were all 14 raspberry samples. Overall, 22out of 23 correct assignments were made, which corre-sponds to a success rate of 95É6%. Of the nine straw-berry samples provided, four were adulterated (Table 3),and the PLS modelÏs prediction identiÐed three of themas being non-strawberry samples. All Ðve of the purestrawberry samples were predicted as being authentic.These results demonstrate that the model can correctlyidentify both pure and adulterated strawberry samples,as well as being able to reject other fruit types.
These results show that the model can be applied tothe analysis of the type of samples used in industry. TheidentiÐcation of the adulterated samples is evidence thatthe sensitivity of the model is good enough to be ofpractical use in the screening of products. However,more extensive trials need to be carried out to fully testthe modelÏs compatibility with commercial samples.
CONCLUSION
A PLS regression onto a dummy variable has been suc-cessful in identifying pure strawberry pure� es and fordetecting strawberry samples containing adulterants. Anindependent test set of 317 spectra was analysed by themodel, which correctly predicted the class of 94É3% ofthem. Included in this set were series of strawberrypure� es adulterated with either apple, plum, glucosesolution, sucrose solution, red grape juice or rhubarbcompote. The PLS regression was able to detect thepresence of all of these adulterants down to levels thatwould be expected for commercially sensible adulter-ation levels. Therefore, this technique has potential inthe screening of commercial samples for adulteration.
The potential long-term stability of the model, devel-oped with 1993 and 1994 fruit, was assessed by using itto analyse the spectra of the 1995 fruit. As the seasonalvariation of the fruit and the instrumental changes aremajor factors limiting the long-term stability of themodel, this data was seen as a good test. The 96É6%
success rate of prediction for the 1995 samples showsthat these variations were not large enough to perturbthe performance of the model. This suggests that themodel can be applied to the analysis of the fruit of sub-sequent years, making it a potential technique for theroutine screening of fruit over extended periods of time.
The “blind testÏ of the model with the fruit pure� esamples prepared by RHM Technology yielded 22 outof 23 correct assignments. As these samples were closein form to those of commercial pure� es, this is evidencethat the model developed can be applied to the analysisof commercial fruit pure� e samples.
ACKNOWLEDGEMENTS
The authors would like to thank RHM Technology forpreparing the fruit pure� e samples used in the “blind testÏof the model. Thanks also to the other members of theUK Preserves ManufacturersÏ Association (UKPMA)for supplying some of the samples used to construct thedatabase. The funding provided by MAFF, BBSRC,UKPMA and the European Union via ConcertedAction “Food Authenticity Issues and MethodologiesÏ(FAIM) is acknowledged.
REFERENCES
Beebe K R, Kowalski B R 1987 An introduction to multi-variate calibration and analysis. Anal Chem 59 1007AÈ1017A.
Briandet R, Kemsley E K, Wilson R H 1996 Discrimination ofarabica and robusta in instant co†ee by Fourier transforminfrared spectroscopy and chemometrics. J Agric FoodChem 44 170È174.
Defernez M, Kemsley E K, Wilson R H 1995 Use of infraredspectroscopy and chemometrics for the authentication offruit pure� es. J Agric Food Chem 43 109È113.
Defernez M, Wilson R H 1995 Mid-infrared spectroscopy andchemometrics for determining the type of fruit used in jam.J Sci Food Agric 67 461È467.
Geladi P, Kowalski B 1986 Partial least squares regression : atutorial. Anal Chim Acta 185 1È17.
Lai Y W, Kemsley E K, Wilson R H 1994 Potential of Fouriertransform infrared spectroscopy for the authentication ofvegetable oils. J Agric Food Chem 42 1154È1159.
Martens H, T 1989 Multivariate Calibration. Wiley,N~sChichester, UK.
Robards K, Antolovich M 1995 Methods for assessing theauthenticity of orange juice. A review. Analyst 120 1È28.


![Food Adulteration[1]](https://img.pdfslide.us/doc/110x75/577d260e1a28ab4e1ea02b30/food-adulteration1.jpg)