Embed Size (px)
Citation preview
Use of Economic Analysis toInform SPS-relatedDecision-Making
Standards and Trade Development Facility
The Standards and Trade Development Facility (STDF) is a global programme in capacity building and technical cooperation established by the Food and Agriculture Organization of the United Nations (FAO), the World Organisation for Animal Health (OIE), the World Bank, the World Health Organization (WHO) and the World Trade Organization (WTO). More information is available at: www.standardsfacility.org Printed by the WTO Secretariat
November 2011
Standards and Trade Development Facility
USE OF ECONOMIC ANALYSIS TO INFORM SPS-RELATED DECISION-MAKING
Spencer Henson Professor
University of Guelph (Canada) and
Professorial Fellow Institute of Development Studies (UK)
Oliver Masakure
Assistant Professor Wilfred Laurier University (Canada)
November 2011
ii
Disclaimer The findings, interpretations, and conclusions expressed in this paper are entirely those of the authors. They do not necessarily represent the view of the Standards and Trade Development Facility (STDF) or any of its partner agencies or donors. A draft of this document was presented by Spencer Henson at the STDF workshop on the use of economic analysis to inform SPS decision-making, in Geneva on 30 October 2009. Further information about this workshop, including background papers, podcasts and copies of all the presentations delivered, is available on the STDF website (www.standardsfacility.org/en/TAEcoAnalysis.htm). For additional information, contact the Standards and Trade Development Facility ([email protected]).
iii
TABLE OF CONTENTS
1. INTRODUCTION ................................................................................................................. 1
2. EXPERIENCES IN THE USE OF ECONOMIC ANALYSIS IN THE SPS AREA: AN OVERVIEW OF
METHODOLOGIES AND THEIR USE IN PRACTICE........................................................................ 2
2.1 Cost-Benefit Analysis ..................................................................................................... 2
2.1.1 Food safety........................................................................................................ 4
2.1.2 Animal health .................................................................................................... 6
2.1.3 Plant Health....................................................................................................... 8
2.1.4 Cross-cutting analyses........................................................................................ 9
2.1.5 Synthesis ......................................................................................................... 10
2.2 Cost-Effectiveness Analysis .......................................................................................... 12
2.2.1 Applications to food safety, animal health and plant health ............................. 13
2.2.2 Synthesis ......................................................................................................... 14
2.2.3 Multi-Criteria Decision Analysis ........................................................................ 15
2.3 Observations and General Findings .............................................................................. 17
3. USING ECONOMIC ANALYSIS TO INFORM SPS-RELATED DECISIONS: GUIDANCE FOR
DEVELOPING COUNTRIES .................................................................................................. 18
3.1 General Context .......................................................................................................... 18
3.2 Benefits from the Use of Economic Analysis................................................................. 19
3.3 Requirements for the Use of Economic Analysis ........................................................... 21
3.4 Which Types of Economic Analysis to use Where? ....................................................... 22
3.5 A Framework for Prioritisation on the Basis of Multiple Criteria.................................... 23
3.5.1 Stage 1: Define choice set............................................................................... 25
3.5.2 Stage 2: Compile information cards ................................................................ 28
3.5.3 Stage 3: Construct spider diagrams................................................................. 34
3.5.4 Stage 4: Use of multi-criteria decision analysis................................................. 37
4. CONCLUSIONS AND RECOMMENDATIONS ............................................................................ 43
iv
ACRONYMS
BAHA Belize Agricultural Health Authority
CBA Cost-benefit analysis
CEA Cost-effectiveness analysis
CGE Computable general equilibrium
DALY Disability Adjusted Life Years
EU European Union
FAO Food and Agriculture Organization of the United Nations
FMD Foot and Mouth Disease
HACCP Hazard Analysis and Critical Control Point
HPAI Highly Pathogenic Avian Influenza
IRR Internal Rate of Return
IPPC International Plant Protection Convention
LDC Least Developed Country
MAUT Multi-attribute Utility Theory
MAVT Multi-attribute Value Theory
MCDA Multi-criteria decision analysis
OECD Organisation for Economic Co-operation and Development
OIE World Organisation for Animal Health
OIRSA International Regional Organization for Plant and Animal Health
PRA Pest Risk Assessment
QALY Quality Adjusted Life Years
RMFFP Regional Management of Fruit Fly in the Pacific
SAM Social Accounting Model
SPS Sanitary and Phytosanitary
STDF Standards and Trade Development Facility
US United States
WHO World Health Organization
WTO World Trade Organization
v
EXECUTIVE SUMMARY
1. Many developing countries face seemingly formidable demands for the enhancement of sanitary and phytosanitary (SPS) capacity, directed at domestic policy objectives and in particular boosting agri-food export performance. Certainly, the available resources from national budgets and donors are insufficient to meet all of these needs and inevitably priorities have to be made between competing capacity building options. In this context, economic analysis appears to offer a structured framework that can help decision-makers establish priorities in a manner that is objective and accountable, and that helps to ensure resources are used in an efficient manner.
2. This report reviews experiences with the use of economic analysis to guide priority-setting for SPS capacity building in developing countries, highlights the challenges faced in using such methods and provides general guidance to decision-makers on which economic analysis approaches are best suited to particular decision scenarios. In preparing the report the existing literature has been reviewed and practitioners of economic analysis consulted on their experiences. A framework is proposed for establishing priorities between SPS capacity building options across the broad areas of food safety, animal health and plant health that can take account of varied and multiple decision criteria.
3. Cost-benefit analysis (CBA) and, to a lesser extent, cost-effectiveness analysis (CEA) have been applied quite widely to the analysis of SPS capacity building in both high-income and developing countries. Most of these applications have focused on specific aspects of food safety, animal health or plant health capacity, for example controls on foot and mouth disease (FMD) or fruit fly, rather than the broad comparison of SPS capacity building needs. They variously examine the impacts of past or on-going investments ex post, or the anticipated impacts of prospective investments ex ante, although rarely in a true decision-making context. There is little evidence that either of these techniques is used on a routine basis in developing countries or by donors, except at a rather rudimentary level. Both of these techniques, however, are evidently useful ways in which to compare and contrast the costs and benefits of specific capacity building options on the basis of a relatively small set of impacts that can be measured in broadly comparable units.
4. Previous applications of CBA and CEA illustrate the challenges with undertaking economic analysis in a developing country context. Often there is a limited supply of data and/or concerns about the quality of data that are available. This often requires uncomfortable compromises in the scope or depth of the analysis, such as the adoption of methods that are relatively simplistic or extrapolating data and making assumptions where impacts are difficult to discern and/or quantify. Indeed, practitioners see data as one of the primary constraints to the successful use of economic analysis to help guide priority-setting for SPS capacity building in a developing country context. At the same time, these challenges mean that the results of CBA and CEA must be treated with some caution, with varying accusations that CBA (in particular) routinely under- or over-estimates costs and/or benefits.
5. Multi-criteria decision analysis (MCDA) is presented as a useful alternative to CBA and CEA. MCDA enables capacity building options to be prioritised based on a wide range of decision criteria (for example value of exports, impacts on small-scale producers, improvements in domestic public health and/or agricultural productivity and consequences for women and vulnerable areas) that are not necessarily measured (or even measurable) using the same metrics. While MCDA approaches have been widely applied to decision-making in other areas, such as natural resource management, to date they have been little used in the area of SPS capacity building.
vi
6. A structured and multi-stage MCDA framework is proposed to support the establishment of priorities across broad areas of SPS capacity. It involves the following steps:
(a) Definition of the set of capacity building options to be considered.
(b) Collection and assembly of information on pertinent decision criteria in the form of information cards.
(c) Translation of measurements on decision criteria, individually or in broad categories, into spider diagrams1 that illustrate the key areas in which each of the capacity building options perform relatively well/badly.
(d) Derivation of a numerical prioritisation of the options being considered.
7. Ideally, the separate elements and formats used to present data on the set of capacity building options should be considered side-by-side to make the nature of the decision process, and the associated trade-offs between decision criteria, as clear as possible.
8. The use of economic analysis, while offering potentially considerable improvements to decision processes in terms of objectivity, transparency and accountability, changes the very nature of decision-making. It tends to put more focus on "hard numbers" and more time and resources are generally needed to make decisions. It is vital that personnel at all levels of the decision process "buy in" to the use of economic analysis and commit to providing the necessary support and resources. At the same time, since the initial learning curve is inevitably rather "steep", there is a need for technical assistance to develop the necessary expertise and experience.
9. The STDF could play a key role in developing the necessary training materials for MCDA in SPS-related decision-making and promoting its use. As a first step, the STDF is testing the MCDA framework in selected countries in order to examine how well it works in practice and to develop a user guide.
1 A spider or radar diagram shows the value of three or more indicators on axes that start from
the same central point. This is a useful way of showing the relative position of each capacity building option across the spectrum of decision criteria.
1
1. INTRODUCTION
1. Sanitary and phytosanitary (SPS) measures are applied by nations, and agro-food value chain actors therein, to control food safety, plant health and animal health risks, and to prevent incursions of exotic pests and diseases. In turn, such measures act to protect human health, promote agricultural productivity and facilitate the international marketability of agricultural and food products. It is recognised, however, that SPS measures can also impede trade, through their illegitimate application and/or limitations in exporting country capacity. The World Trade Organization (WTO) Agreement on the Application of SPS Measures (SPS Agreement) aims to prevent the discriminate use of SPS measures and to facilitate flows of technical assistance that support capacity building efforts in developing countries.
2. The SPS Agreement and allied institutions and facilities, such as the Standards and Trade Development Facility (STDF), have served to heighten recognition of the need for developing countries to augment their SPS capacity, both within the public sector and along agro-food value chains. In low and lower-middle income countries in particular this task is onerous and there is a recognised need for technical assistance. While there is some evidence that flows of technical assistance towards the development of SPS capacity have increased over time, such assistance is often uncoordinated and supply-driven. All too frequently there is duplication of capacity building efforts in some areas, while other elements of capacity attract little or no attention. There is an evident need for developing countries to define prioritised actions plans towards the development of SPS capacity, that contribute to enhanced efficiency in allocating both scarce domestic resources and technical assistance, and a shift towards demand-driven modes of assistance.
3. While the principle of defining prioritised national action plans for the enhancement of SPS capacity is good in principle, developing these plans in practice is not an easy task. In this context, there is interest in the role of economic analysis, including techniques such as cost-benefit analysis (CBA), cost-effectiveness analysis (CEA) and multi-criteria decision analysis (MCDA). These techniques aim to ensure that specific investments are efficient, for example that the benefits of the associated investments exceed the costs, and enable decision-makers to prioritise investments from among a multitude of options. There are often significant challenges in applying these methods in a developing country context, however, due predominantly to data limitations and a scarcity of relevant analytical skills in the multiple agencies charged with the management of SPS capacity building.
4. The aim of this paper is to:
(a) Provide a broad reflection on experiences with applying economic analysis to SPS capacity building in developing countries.
(b) Identify the key challenges with applying economic analysis techniques in a developing country context, both generally and specifically to SPS capacity building.
(c) Provide some general guidance to decision-makers in developing countries on applying economic analysis to SPS capacity building.
5. In preparing this paper, the authors consulted with a number of practitioners who have applied economic analysis techniques to the costs and/or benefits of enhanced food safety, animal health and/or plant health controls. The authors also reflected on their own experiences with economic analysis of SPS capacity building in a number of developing countries.
2
6. The guidelines presented in this paper reflect a difficult but pragmatic trade-off between the complexity of the costs and benefits associated with improvements in SPS capacity, the needs of decision-makers and the reality "on the ground" in many developing countries. A large element of these guidelines focuses on assembling available information and organizing and presenting this information in a manner that makes the consequences of decisions more apparent and transparent to stakeholders. The idea here is that better management of this information, in and of itself, can make a significant contribution to improved decision-making in the area of SPS capacity building. With respect to economic analysis specifically, the guidelines focus on and recommend the use of an MCDA approach that enables the multiple and varied consequences of improvements in SPS capacity to be incorporated into decisions in a manner that is flexible given data availability, uncertainties over the likely flow of benefits, etc. It is recognised that such an approach has not been widely applied in the area of SPS capacity building and that it would need to be tested through a series of trial applications. The use of MCDA across a wide range of other decision-making contexts, however, provides significant credence to its use in such contexts.
2. EXPERIENCES IN THE USE OF ECONOMIC ANALYSIS IN THE SPS AREA: AN OVERVIEW OF METHODOLOGIES AND THEIR USE IN PRACTICE
7. There are a range of economic analysis techniques aimed at supporting decision-making where resources are scarce and where the relative costs and benefits of the options under consideration are not immediately apparent (Department for Communities and Local Government, 2009; Fabrycky et al., 1997; Haddix and Shaffer, 1996). In such contexts, it is argued that a closer look at the economic consequences of the options under consideration can help to guide decision-makers towards choices that are more efficient and yield the greatest flow of benefits over time given a particular level of investment. However, while the utility of economic analysis is evident in principle, applying such techniques in practice is far from easy, especially in the context of developing countries where there are inevitable data availability and quality issues. This begs the question, can and do economic analysis techniques assist decision-makers in choosing between the various options available for enhancing SPS capacity?
8. There are instances where economic analysis techniques have been employed to assess the costs and benefits of enhancements in food safety, animal health and/or plant health controls, in both high-income and developing countries. However, it should be recognised that the specific forms taken by these analyses and their rigour varies widely and, as a consequence, it is not easy to piece together a general picture of how well they perform in practice. This section reviews alternative economic analysis methods, in terms of their basic principles and with a particular focus on previous applications to SPS capacity in developing countries. Specifically, it examines: 1) cost-benefit analysis (CBA); 2) cost-effectiveness analysis (CEA); and 3) multi-criteria decision analysis (MCDA). It aims to bring out the problems faced in applying these techniques, but also the ways in which they have or could be used to support investment decisions in the area of SPS capacity building.
2.1 Cost-Benefit Analysis
9. CBA is a long-standing approach to decision support in economics (Layard and Glaister, 1994; Nas, 1996). The standard approach to CBA is to compute and then compare the costs and benefits of the options under consideration, in this case investments in SPS capacity building. In general, CBA compares the scenario where a particular intervention is made to a baseline that reflects the state of the world should the intervention not be pursued. The measured difference between these two scenarios is taken to reflect the impact of the intervention, for example in terms of environmental protection or human health (Haddix and Shaffer, 1996). Because the costs and benefits of interventions are frequently realised at
3
different points in time, CBA uses discounting in linking present and future costs. Further, where the costs and/or benefits of an intervention are not certain, probabilities can be assigned to the various potential outcomes and expected costs/benefits computed.
10. The results of CBA can be expressed in terms of the benefits per dollar spent, often presented as a benefit-cost ratio, or as a net benefit with the flow of costs over time deducted from the flow of benefits. Options with a negative net benefit are rejected outright. The ordering of options with a positive net benefit is on the magnitude of the computed net benefit. Thus, CBA can be used to undertake the initial "weeding" of "bad" from "good" options, and also to guide the choice between those options that are considered feasible a priori. Of course, this information can be used not only to make a straight choice between the options under consideration, but also to adjust options, reducing their costs and/or enhancing the benefits so as to improve their impacts.
11. The costs of SPS capacity enhancement can be divided into four categories: 1) real-resource costs; 2) social welfare losses; 3) transitional costs; and 4) regulatory costs (Morgenstern and de Civita, 2006). Real resource costs are associated with the technological and human capital investments and permanent changes in production processes required to achieve and maintain enhancements in SPS capacity. Some of these costs are non-recurring (one-off), while others are recurring (on-going) due to the changes brought about by specific capacity enhancement options. Account must be taken of the fact that more immediate and/or visible direct resource costs may be offset (at least in part) by longer-term efficiency gains; for example, limiting lead in drinking water may be good for human health but also lessens mineral deposit in pipes, reducing maintenance costs. Further, these costs also include resources that have opportunity costs, such as administration, although these can be difficult to quantify in practice. Social welfare losses are changes in consumer or producer surpluses associated with the rise in price and/or decrease in output of goods and services that occur as a result of an enhancement in SPS capacity; for example, stricter controls on the use of pesticides in production of fresh fruit and vegetables. More specifically, these costs reflect the losses generated due to diverting resources from other activities and are expressed through changes in production costs, market prices, etc. Transitional costs are the adjustment impacts, including lost productivity or closure of firms, because of the changes and/or investments needed to enhance SPS capacity. For example, firms with old processing facilities may find it too costly to upgrade to meet higher food safety standards. Finally, government "regulatory" costs are associated with the monitoring, administration and enforcement actions from new SPS controls including food safety regulations, controls on plant pests and/or animal diseases, etc.
12. In practice, CBA can focus on direct or partial equilibrium costs at the industry level or derive economy-wide welfare measures using general equilibrium models to reflect net burdens on society once all goods and factor markets have been adjusted. The former of these is more common. Data on direct costs can be derived in three ways (Antle, 1999): 1) engineering analysis approach; 2) accounting approach; and 3) econometric estimation approach. The engineering approach uses technical and economic data to estimate cost functions, for example corresponding to the food safety characteristics of goods (Jensen and Unnevehr, 2000). While this approach is generally efficient and provides good quality data, it has limited external validity and cost data can be difficult to obtain in practice (Krieger et al., 2007). The econometric approach generally uses existing databases to estimate cost functions that capture industry-wide behaviour associated with the enhancement of SPS capacity (Antle, 1999). However, it has been shown that these data generally exhibit large variations across industries (Morgenstern and de Civita, 2006), much of which is driven by a relatively small number of under or over-performing outliers.
4
13. The accounting approach is the most common source of cost information in CBA studies. These data are generally derived from industry surveys, expert opinion and/or extrapolations from previous cost studies. There are, however, problems in using these data. For example, surveys may focus on the investments made by firms as a direct result of a regulation, but determining an appropriate baseline (what these firms would have done if the regulation had not been in place) is difficult (Morgenstern and de Civita, 2006). Even without regulation, firms engage in investments to enhance their capacity due to market demands, pressure from shareholders, etc. This raises questions over whether such costs should be included or excluded from the analysis. In addition, by its nature capacity enhancement is an ongoing process and decision-makers find it hard to assign capital expenditures to specific "events".
14. In CBA, benefits are measured in terms of the net present value of the flow of positive impacts of enhanced capacity. These benefits can include the direct and immediate target of the interventions under consideration, for example reductions in levels of pesticides in fresh fruit and vegetables, eradication and maintenance of pest-free status for fruit fly or reductions in levels of foot and mouth disease (FMD) in cattle. However, they also include the less direct and wider impacts on the volume and/or value of exports, agricultural productivity, food safety in domestic and/or export markets, livelihoods of producers, level of environmental protection, etc. Many of these indirect benefits are difficult to measure; for example, they may not be immediately expressed in monetary units, as is the case with reductions in human illness due to improvements in food safety (Antle, 1999; Krieger et al., 2007). It can be difficult to derive reliable and generally acceptable estimates of the monetary value of many of these benefits, such that analysts may choose to focus on a narrower range of benefits that are more amenable to monetary valuation, for example the value of exports.
15. Below we consider the use of CBA in the analysis of capacity enhancement for food safety, animal health and plant health in turn, examining the approach and data employed and nature of the results. The aim here is not to be exhaustive, but rather to provide illustrative examples of the types and range of studies as a means to identify how and where CBA has been employed.
2.1.1 Food safety
16. There are a number of documented applications of CBA to food safety capacity building, most of which have been in high-income countries. We observe a range of ex ante and ex post studies that aim to quantify the costs and benefits of implementing enhanced food safety controls such as Hazard Analysis And Critical Control Point (HACCP) (see for example the various papers in Unnevehr, 2000) as well as food safety improvements more generally (see for example Ivanek et al., 2004), predominantly in the United States. There are also examples of economic analysis being applied to regulatory options, again notably in the United States (FDA, 1995; FSIS, 1995; FSIS, 1996). Most of these studies focus on estimating the economic value of improvements in human health and apply varying assumptions with respect to key inputs to the analysis, for example discount rates, value of human life, etc. Thus, estimates tend to be highly variable and sensitive to the choice of key parameter values. We review a selection of illustrative studies below.
17. Crutchfield et al., (1997) estimate the costs and benefits of HACCP implementation in the US meat and poultry processing sector under a new regulatory rule and inspection programme. Following previous studies, it is assumed that the pathogen reductions associated with HACCP will begin to accrue starting in year five of the programme, with costs and benefits being examined over a 20 year period. The benefits are estimated under different combinations of assumptions with respect to effectiveness and discount rates, and using alternative valuation
5
techniques for the economic value of improvements in human health, including cost-of-illness and willingness-to-pay. The benefits estimates vary widely, from US$1.9 billion to US$171.8 billion, although under all assumptions HACCP is expected to generate considerable social savings in terms of lower human illness costs associated with food-borne pathogens. Cost estimates are derived from previously published studies. These costs range from US$1.1 billion to US$1.3 billion over 20 years, suggesting an appreciable benefit from the implementation of HACCP under most scenarios.
18. The level and distribution of the costs and benefits of HACCP implementation in the US meat and poultry sector taking account of economy-wide effects are estimated by Golan et al. (2000) using a social accounting matrix (SAM) model. This type of analysis provides information on who ultimately benefits from improved health outcomes and who ultimately pays the costs of HACCP implementation under regulatory rules. Two sets of simulations are conducted. One set examines the benefits of reduced food-borne illness and the other the cost of implementing HACCP. On the benefit side, the simulations examine the economy-wide benefits of reduced premature deaths and medical expenses. The SAM multiplier model indicates that every dollar of income saved by preventing premature deaths from food-borne illness results in an economy-wide income gain of US$1.92. Conversely, savings in medical expenses by households result in an economy-wide income loss of US$0.27; presumably, the use of medical goods and services caused by food-borne illness triggers more economic activity than the consumption activities households would have otherwise enjoyed. The simulations further indicate that every dollar spent on HACCP implementation results in an economy-wide income loss of US$0.35. This result occurs because the increased costs of beef and poultry production due to HACCP implementation are passed on to consumers, so that households incur a reduction in real income. When nominal income is held constant, however, economy-wide income rises by US$0.65 for every dollar spent on HACCP.
19. Ivanek et al. (2004) estimate the costs and benefits of Listeria monocytogenes controls with the aim of determining the economic optimum level of food safety measures. Essentially, estimates are derived from published sources that use various economic valuation approaches including willingness-to-pay, cost-of-illness, cost function and event study methods. The estimated annual benefits and costs of Listeria Monocytogenes controls range from US$2.3 billion to US$22 billion and from US$.01 billion to US$2.4 billion, respectively. The estimated marginal benefits exceed the estimated marginal costs, suggesting that the current level of investment in controls on Listeria monocytogenes is below the optimum.
20. The relatively few CBA studies undertaken on food safety controls in developing countries to date have tended to employ rather rudimentary methods. Predominantly, these focus on the upgrading of controls aimed at overcoming restrictions in export markets due to non-compliance with food safety regulations. For example, Cato and Limos dos Santos (2000) and Cato and Subasinghe (2004) estimate the ex post costs of upgrading hygiene controls and implementing HACCP in the Bangladeshi and Nicaraguan shrimp processing sectors. Based on firm-level interviews and consultation with government and industry officials, the costs incurred by Bangladeshi fish processors to comply with EU and US regulatory requirements is estimated to have been US$18 million, with subsequent annual costs of maintaining the established food-safety controls of US$2.4 million. Because Nicaraguan factories were relatively new and modern, only modest incremental investments were needed; these are estimated to have cost only US$560,000, with annual maintenance costs of US$290,000. In both countries these costs are estimated to represent a relatively small proportion of the value of exports, suggesting an appreciable net benefit in terms of continued market access; in at least one case there had been continued problems with border detentions and a ban because of violations of regulatory requirements in the EU and US. For example, investments made by the Bangladeshi shrimp-processing sector were equal to 2.3 percent of the total value of shrimp exports over the period
6
1996–1998. Further, the costs of annual maintenance of HACCP and associated regulatory systems are equivalent to only 1.1 percent of exports.
21. A similar study was undertaken by Henson et al. (2004) that estimates the costs and benefits of improvements in hygiene in the Keralan shrimp sector aimed at compliance with EU food safety regulations, including government controls and upgrading of processing facilities. A survey was undertaken of processing facilities and interviews held with government officials. Among the surveyed plants the non-recurring costs of compliance range from US$51,400 to US$514,300, with a weighted mean (by volume of production) of US$265,492. As a proportion of company turnover in 1997–1998 these costs ranged from 2.5 percent to 22.5 percent, with a weighted mean of 7.6 percent. In 2001 there were 51 EU-approved facilities in Kerala, suggesting sector-wide non-recurring costs of US$13,540,092, representing around 1.7 percent of the value of exports from Kerala over the three years prior to the initial implementation of these investments.
2.1.2 Animal health
22. CBA has been applied widely to analysis of the costs and benefits of controls on animal disease, notably those that are transmissible and of significance to international trade, for example FMD. These applications arguably include some of the most rigorous analyses, including econometric analysis to assess the welfare impacts of reductions in the prevalence of animal disease. Approaches that have been employed include traditional CBA, input-output and social accounting (SAM) models, linear programming, partial equilibrium single or multi-sectoral models and computable general equilibrium (CGE) models (Rich et al., 2005a; Rich et al., 2005b). Most applications have been in industrialised countries, while estimates for developing countries have tended to focus on a relatively small sub-set of countries (Otte et al., 2004). In many cases, economic models aimed at estimating costs and benefits/welfare effects are combined with epidemiological models. While more traditional applications of CBA typically focus on farm or herd level impacts of animal diseases, with the benefits of controls expressed in terms of reductions in the associated disease costs, econometric modelling generally takes the market as the unit of analysis and measures impacts at the level of producers and consumers in aggregate. While it is recognised that the secondary economic impacts of animal diseases (for example in terms of income and employment) can be significant for diseases that are of importance to trade, development and validation of sectoral or economy-wide econometric models in a developing country context can be a major undertaking (Randolph et al., 2000). Some examples of previous animal disease control studies are provided as illustration below.
23. Tambi et al (2006) estimate the economic costs of Contagious Bovine Pleuropneumonia (CBPP) and the benefits of associated control measures for 12 sub-Saharan African countries. A spreadsheet economic model is developed and epidemiological and economic data used to estimate the impact of CBPP under endemic conditions. Epidemiological data are derived from published studies conducted in Central, East and West Africa and from a model of the dynamics of CBPP transmission in East Africa. Data on production and reproduction parameters (for example calving rate, milk and beef production, herd composition, etc.) and economic parameters are obtained from the existing literature and through expert opinion. The economic impact of control measures is estimated in terms of reductions in the economic cost of disease (at the country and regional level), including the direct and indirect production losses resulting from animal mortality and morbidity, and avoided control costs. Morbidity losses are measured in terms of reductions in milk production and mortality losses as the rate of premature death of milk, beef and draft animals valued at market prices. Indirect losses, for example though reduced fertility, loss of market opportunities due to trade bans, quarantine costs and delayed marketing are not considered because of data limitations. On the cost side of the equation, the

7
analysis considers the expenditures associated with vaccination and antibiotic treatment of CBPP. The results suggest that CBPP control using vaccination and antibiotic treatment has a benefit-cost ratio ranging from 1.61 in Ghana to 2.56 in Kenya.
24. Partial equilibrium model are estimates of the economic impacts of animal disease outbreaks and policy responses in seven ASEAN countries are provided by Thorpe et al (2007). The study focuses on the direct effects of disease on national livestock, with disease management modelled under conditions of uncertainty using dynamic optimisation. It is assumed that open markets exist in the ASEAN region and that countries would respond to an outbreak of disease by imposing a ban on trade. Data on meat and livestock prices, stock numbers in national herds, numbers of animals slaughtered and meat produced, consumed and traded are derived from trade reports, government statistics and local markets. A number of policy responses to animal disease are considered, namely "prevention", "control" and "adaptation", with "no action" as the base scenario. The results provide detailed estimates of the economic effects at the country and regional level. For example, Thailand's poultry industry is estimated to save US$1.3 billion if it acts quickly to contain and eradicate a disease outbreak and achieves the lifting of an export ban after one year, compared to a policy of inaction and a resultant indefinite ban on exports. The study does not consider the indirect effects of production losses on consumers, input suppliers and other economy-wide effects, although it is recognised that such impacts could be greater than the potential direct losses that are estimated.
25. The economic impacts of the control and eradication of FMD in the Philippines are estimated ex ante by Randolph et al (2002). An epidemiological model captures the impact of alternative control measures on the risk of FMD and the consequent effects on livestock productivity. In turn, an economic model estimates the relative costs and benefits of alternative control strategies and their distributional consequences. Data are derived from government statistics, results of disease monitoring surveys, previous studies, etc. The options considered are eradication by the end of 2004, end of 2006 and end of 2010, with the historic trend in cases as the baseline. Estimated benefit-cost ratios range from 1.6, with eradication in 2010 and no exports, to 12.0 with eradication in 2004 and exports of 5,000 tonnes each of low and high-value products annually. It is acknowledged that the indirect economic impacts of the eradication scenarios are likely to be significant, although these are not estimated.
26. A framework for assessing the costs and benefits of trans-boundary animal diseases is developed for the OIE by Civic Consulting (2007). The framework focuses on the economic impacts of prevention versus control measures including outbreak costs, indirect effects on prices and on up-down-stream actors in supply chains, and spill-over effects on tourism, etc. A simple accounting approach in Excel is employed with data drawn from previous studies and estimates by the authors. It is recognised that in many cases the data are weak and that the estimates derived are highly dependent on the underlying assumptions. Case studies are undertaken, applying the framework to FMD and/or Highly Pathogenic Avian Influenza (HPAI) in Argentina, Vietnam, Nigeria and Romania. On the basis of data from these case studies and other sources, global estimates of prevention versus outbreak costs are derived under the scenarios of "most likely", "low impact" and "high impact" whereby the duration and intensity of disease spread within countries varies. Under the "most likely" scenario, the direct costs alone of HPAI in developing countries are estimated at US$11.7 billion annually. The indirect costs in terms of domestic and export market losses are estimated at US$10.6 billion and US$7.5 billion, respectively.
8
2.1.3 Plant Health
27. A number of CBA studies have been undertaken of interventions aimed at the control of plant pests and diseases, predominantly with a view to achieving access to export markets from which they are currently excluded due to quarantine controls. Many of these studies are ex post evaluations of existing projects, although often with estimates of on-going flows of costs and benefits, aimed at justifying continued investments. Most employ relatively simple analytical frameworks; for example, there is generally no attempt to model the spread of plant pests or diseases. Further, these studies generally focus on the direct impacts of control measures, while recognising that the wider economic benefits may be significant. An interesting observation from these studies is that, while ex ante returns to investments in controls on plant pests and diseases are highly unpredictable, ex post assessments of these benefits are extremely variable (Lindner and McLeod, 2008), suggesting that caution is needed in interpreting the results from either type of study.
28. A series of ex ante and ex post cost-benefit assessments are available on the Regional Management of Fruit Fly in the Pacific (RMFFP) project launched in 1990 (McGregor, 1996; McGregor, 2007). The aim of this project is to ameliorate fruit fly in the region, initially to develop export markets for locally-grown produce through upgrading local knowledge, reducing fly damage and overcoming quarantine restrictions. An initial analysis of achieved and impacts for the period 1993 to 2002 undertaken in 1996 indicates a net benefit of US$24.5 million, with an internal rate of return (IRR) of 37 percent.2 These estimates are based on the limited ex ante impact of the project to 1996 and anticipated benefits considered "likely" over the next five years or "possible" over the next 10 years. A share of the benefits in each of these categories is apportioned to the RMFFP. Updated estimates in 1999 extend the ex ante analysis to the period 1993 to 1998. The estimated benefits of the project are 40 percent lower at US$12.6 million, with an IRR of 19 percent. As a result of these revised estimates, suggestions are made for changes to the RMFFP, in particular the need to focus on domestic losses and not just the potential for exports. A third CBA undertaken in 2007 attempts to estimate the benefits in terms of domestic production and local market sales, including improved nutrition and food security. Much of this analysis is qualitative on the basis of damage assessments and surveys and other data on domestic consumption.
29. Using a similar methodology to the assessment of the RMFFP, McGregor (2000) undertakes an ex ante CBA of a proposed eradication programme for oriental fruit fly and breadfruit fly in Palau. The costs are derived from a previous study and benefits based on a range of assumptions about likely impacts on exports, sales of fruit to tourists, etc. The estimated net benefit is US$4.0 million, with an IRR of 26 percent.
30. McGregor (2007) undertakes a CBA of the Hawaii Fruit Fly Area-Wide Pest Management (AWPM) Programme, again using a similar methodology to that employed to the assessment of the RMFFP. The program, which started in 2000 and was ongoing at the time of the assessment, focuses on controlling fruit fly in mango, citrus, courgettes, cucumber dragon fruit, persimmon and tomatoes. A total of US$14.37 million had been allocated to the project by 2007. The costs of the programme are detailed by fruit on a per acre basis and classified into private costs (encountered by participating farmers and households) of monitoring, sanitation, bait spraying and male annihilation, and public costs of rearing the biological control agent, distribution to farmers and educational programmes. The future benefits are estimated assuming continued funding of US$250,000 per year. Benefits in terms of prevented crop
2 The internal rate of return (IRR) of an investment is the interest rate at which the costs of the
investment just equal the benefits. This means that all gains from the investment relate to the time value of money and that, at this interest rate, the investment has a zero net present value.
9
losses less control costs are categorised into "achieved", "likely" and "possible", with an assumed probability of occurrence of the latter two categories of 70 percent and 20 percent, respectively. These are estimated on the basis of the results of field trials, market prices, etc. The estimated net present value (NPV) of the net benefits is US$13 million over a 14 year programme, with an IRR of 32 percent.3
31. A more rigorous CBA of fruit fly controls in the Pacific and other regions of Asia (namely Bhutan, Papua New Guinea (PNG), Malaysia, Thailand, Vietnam and Indonesia) is provided by Linder and McLeod (2008). The assessment covers projects funded by the Australian Centre for International Agricultural Research (ACIAR) over the period 1984 to 2007. The present value of total investments by ACIAR over this period is AU$22.87 million, with a total investment by ACIAR and its partners of AU$33.48 million. Project benefits attributable to the projects are sub-divided into realised benefits and prospective benefits. Benefits include market access, improved biosecurity, field control of fruit fly, etc. In the case of prospective future exports, for example, projections are made on the basis of the established trend over the period 1994 to 2005. Biosecurity benefits are estimated on the basis of an existing analytical framework based on the principles of pest risk assessment (PRA). The estimated NPV of the net benefits from the projects is estimated at A$258.83 million including the beneficiary countries and Australia, and A$212.63 million in the beneficiary countries alone. The estimated IRR is 33 percent. The authors acknowledge the problems of attributing the defined benefits to the research projects under examination and perform a series of sensitivity analyses to explore the impact of the assumptions made on the benefit-cost estimates. Further, in a number of cases, for example where insufficient data are available, no estimates are attempted.
32. The Belize Agricultural Health Authority (BAHA) has undertaken a CBA of its biological control programme for Pink Hibiscus Mealybug (BAHA, 2003). This programme was initiated in 1999 and involves surveillance and the production and distribution of a biological control agent. The CBA focuses on funding by the International Regional Organization for Plant and Animal Health (OIRSA) over the period 2000 to 2002, separating out the associated investments form contributions by other donors. Laboratory and field operation costs are included on the basis of actual expenditures, with the benefits in terms of impacts of crop losses on domestic consumption and exports derived through extrapolation of data from other Caribbean countries. The baseline for the assessment is "doing nothing". The NPV of the programme is estimated at US$48.8 million.
2.1.4 Cross-cutting analyses
33. As can be seen above, most previous CBA studies are confined to quite specific investments in SPS capacity and do not attempt economic analysis across areas of SPS control, namely food safety, animal health and plant health. One exception, however, is the cost-benefit assessment framework developed under an STDF project (STDF 20) by Agra CEAS (2006) that is aimed at guiding the design of national action plans for SPS capacity-development.4 The framework provides a structured mechanism to identify areas where SPS requirements impede exports and related weaknesses in SPS capacity, and to estimate the costs of capacity
3 The net present value (NPV) of an investment is the total present value of a series of monetary
flows over time, taking account of the time value of money through use of discounting. The discount rate employed to collapse a series of monetary flows over time generally reflects the return that could have been achieved with an investment with a comparable level of risk.
4 The resulting capacity building action plan for Peru is available on the STDF website: http://www.standardsfacility.org/files/Project_documents/Project_Grants/STDF_20_Peru_Cost_benefit_analysis.pdf.
10
enhancement and the resultant benefits in terms of export growth. It is applied to two pilot countries, namely Peru (Agra CEAS, 2008) and Uganda (Agra CEAS, 2006b).
34. In the case of Peru, for example, the trial application of the framework focuses on fish and asparagus exports. Compliance costs are divided between fixed and variable and estimated over a five year period on the basis of consultation with private and public sector stakeholders. Only the direct benefits in terms of growth in value of exports are estimated. These are derived by projecting future exports on the basis of various scenarios, including the established growth rate. Sensitivity analysis is undertaken to assess the variance in the estimated costs and benefits with changes in assumptions. For asparagus the total fixed costs range from US$14 million to US$42 million and annual costs of compliance from US$2.8 million to US$8.5 million. The estimated benefits range from US$1.9 billion to US$2.5 billion for asparagus, suggesting a significant net benefit and IRR. It should be noted, however, that the total value of future exports is attributed entirely to the defined investments in SPS capacity enhancement, implicitly assuming that these would be zero if the investments were not to be made. This likely represents a significant over-estimation of the marginal benefits of these investments. Conversely, they do not estimate the indirect benefits, thus under-estimating the marginal benefits of the investments.
2.1.5 Synthesis
35. While CBA in principle provides a relatively simple and coherent framework for assessing the costs and benefits of options for enhancing SPS capacity, and in turn the ranking of these options, applying this framework in practice is far from easy. This is reflected, perhaps, in the fact that relatively few applications of CBA in a developing country context exist. The limited applications of CBA that are observed tend to be highly context-specific (for example FMD controls in the Philippines) or employ a relatively simple analytical framework to ex ante and/or ex post analysis of a more general SPS issue across multiple countries (for example fruit fly in the islands of the South Pacific). There is little evidence that CBA is employed on a consistent basis by governments or major donors in choosing between SPS (or other) capacity building options. Perhaps the major exception is the World Bank, which undertakes a fairly rudimentary CBA of its projects. Generally, however, SPS capacity building is part of a much larger and broader project which is assessed as a whole, and with little or no explicit comparison of alternative SPS capacity building options.5 To provide the broader context at this point it is interesting to note that, where CBA is routinely employed more generally to regulatory or policy decisions, as with regulatory impact analysis (RIA) in OECD countries (OECD, 1997), there is very wide variation in the methods employed and a tendency towards less rigorous and semi-quantitative or qualitative analysis. There are few instances of routine RIA in developing countries (Rodrigo, 2005).
36. The choice of approach to CBA has a critical impact on the accuracy with which the costs and benefits are captured and/or measured. Modelling supply and demand behaviour is conceptually challenging and time and resource intensive. Further, identifying and capturing the varying impacts of particular capacity building options in terms of the flow of costs and benefits over time can be problematic, especially in the context of ex ante analysis where
5 With a small number of exceptions, namely where projects are specifically focused on
enhancing SPS capacity. One example is a prospective loan to Brazil for an animal and plant health project on which a CBA was undertaken in 1999 (World Bank, 1999). Most other projects that specifically focus on SPS issues are emergency initiatives on which economic analysis is not required. Good examples are provided by the numerous World Bank projects on Avian influenza. The second phases of these projects are non-emergency initiatives and require economic analysis, although a recent example employs CEA rather than CBA, as discussed in Section 2.2.
11
existing SPS capacity is weak. Thus Rich et al (2005a) highlight how, despite an increase in the overall level of sophistication over time, the choice of economic modelling of controls on animal diseases reflects a balance between desired outputs and applying a feasible model and should be driven by what questions need answering. At the same time, any move towards a simplified and/or narrower analysis involves an implicit compromise in terms of rigour and completeness. The key question here is whether an imperfect analysis is better than no analysis at all? On the one hand, perhaps it is better to have "some" information than no information. Conversely, highly inaccurate benefit-cost assessments can very easily steer the decision-maker off course.
37. It should be recognised that the sample of cost-benefit analyses reviewed above provides a rather selective and even biased view of the feasibility of undertaking CBA of SPS capacity building. Thus, we do not see any studies that failed for whatever reason, or even studies that demonstrate net costs (or marginal net benefits) from investments in capacity enhancement. Indeed, the studies that are available paint a rather positive picture of the returns to investments in SPS capacity enhancement. Thus, Otte et al (2004) report that studies of trans-boundary animal disease controls in developing countries almost always show a net benefit, and often significantly so. Many of these studies, however, downplay the data issues in deriving such estimates, for example in estimating the economic losses associated with disease, incorporating the secondary effects, externalities and adaptations associated with control measures, etc. Further, most published studies, especially in the area of animal health (Agra CEAS, 2007), focus on very large-scale investments while little attention is given to marginal changes in capacity and/or smaller-scale projects.
38. A key problem in many developing countries is the availability and/or quality of data.6 This can be a significant constraint not only on the ability to employ CBA, but also the scope of the analysis and rigour of the eventual benefit-cost estimates. Analysts often have to "plug" data gaps by extrapolating data from other contexts, consulting expert opinion or resorting to "educated guesses". Numerous examples are seen in the studies reviewed above. It needs to be recognised, however, that generalising or extrapolating results across SPS issues and/or countries is problematic. For example, while some SPS requirements are absolute (for example being free of FMD) others are gradated (for example levels of pesticide residues), and the associated flow of costs and benefits will be distinct. Likewise the costs and benefits of capacity enhancement in one country, where the disease of interest is widespread and/or existing controls are weak, will be quite different to another country, where the disease is less prevalent and/or there are at least some basic controls in place. Certainly statistical techniques can help overcome data problems, although the estimates these provide are also often open to question (Agra CEAS, 2006; Agra CEAS, 2007; Thorpe et al., 2007). It should also be noted that, even where data are available, the potential data problems are not over. For example, often these data are ex post; they reflect the impact of past instances of enhancements of capacity. Clearly, the costs and/or benefits of past investments may be a relatively inaccurate guide to the impacts of future investments in SPS capacity building ex ante.
39. In assessing the scope for CBA to inform decisions between SPS capacity building options it is important to recognise the perennial problems and weaknesses of this mode of analysis; that is consider how CBA generally performs in practice rather than what is theoretically possible. Unfortunately, there is a lack of consistent guidance on this. For example, some analysts argue that costs are routinely over-estimated in CBA, while others claim that under-estimations are the norm (Morgenstern and de Civita, 2006). Routine over-estimation (under-estimation) of costs has the effect of making potential investments appear
6 This is an evident area where technical assistance could play a key role, both in plugging gaps in
the available data and, more fundamentally, enhancing capacities to collect and gather information that is pertinent to SPS-related decision-making.
12
more (less) costly and will skew decision-makers towards (away) from these options. The basis for arguing that costs are underestimated is that ex ante estimates do not include important indirect and longer-term impacts, for example on investment behaviour and the opportunity cost of distractions to business decisions. Analysts claiming that CBA routinely over-estimates costs tend to focus on the direct investments required, often at the firm or farm level.
40. In the same way that costs may not be fully or accurately captured ex ante by CBA, not all factors that can and should influence judgments on the social worth of an investment in SPS capacity enhancement are captured under the costs. Most studies reviewed above consider the key or first order effects of interventions, notably on export sales (Agra CEAS, 2006a; Agra CEAS, 2008; Tambi et al., 2006; Thorpe et al., 2007) when it is apparent that the indirect or long-term impacts are far greater (Civic Consulting, 2007). Quantification of benefits is particularly difficult with multidimensional outcomes that are not amenable to aggregation into unitary terms. There are also a range of intangibles, such as reputation, risk of losing market access, changes in culture and attitudes and start-up learning costs, which cannot be captured by CBA (Irz, 2008; Romano et al., 2004). This requires a more comprehensive notion of benefits, which is generally beyond the scope of CBA.
2.2 Cost-Effectiveness Analysis
41. With CEA the costs of alternative capacity building options are compared with the benefits, the latter being measured in physical numbers. The ratio of dollar costs to physical benefits is expressed as the cost per physical benefit, and the programme with the lowest cost is ranked as the most cost-effective (Kuchler and Golan, 1999). The benefits can be expressed in absolute numbers (for example numbers of cases of animal disease) or as a percentage change (for example 10 percent increase in the value of exports). When comparisons are made between interventions that have identical benefits, CEA results in a cardinal ranking of the options. The option with the lowest cost-effectiveness can then act as a baseline against which all other option are considered and provides a measure of the sacrifice (in terms of efficiency) should the most cost-effective not be chosen.
42. CEA is generally used where it is difficult to assign a monetary value to the stream of benefits associated with an investment (Mushkin, 1979). It is also an almost obvious choice when a decision has been taken to enhance a particular aspect of SPS capacity, for example obtaining access to a particular market that is currently subject to quarantine restrictions, but where there are various options available to achieve this. In such contexts, CEA can be used as a guide to minimise costs. In general, CEA is a less costly and burdensome technique than CBA, making it attractive to decision-makers faced with time and/or resource constraints. It cannot be used, however, where the range of options for capacity building have varying impacts, both qualitatively and quantitatively. It is also important to recognise that CEA does not indicate whether a particular option yields a net benefit, since no attempt is made to value the benefit side of the equation.
43. There are variants of the "standard" approach to CEA which simply estimates the ratio of the direct costs of an intervention to a count of the stream of benefits in whichever unit these are measured (Kuchler and Golan, 1999). For example, in many healthcare contexts the direct costs of the intervention are adjusted by the reductions in illness-related costs that result from the intervention, such that net costs are compared to the flow of benefits, usually measured in terms of adverse health outcomes averted. Such an approach could quite easily be applied to most SPS capacity building scenarios, although it approaches CBA in terms of data requirements and complexity (Haddix and Shaffer, 1996).
13
2.2.1 Applications to food safety, animal health and plant health
44. CEA is most widely applied in the analysis of medical interventions (see for example Cobiac et al., 2009; Moodie et al., 2008). We do observe a limited number of studies that have employed CEA to food safety and animal health interventions in high-income countries which generally are based on sophisticated modelling. We did not identify any CEA studies on SPS capacity building in developing countries. Some key examples are reviewed below.
45. Jensen and Unnevehr (2000) use data from input suppliers, pig slaughtering firms and previous meat science studies to determine the cost function for pathogen reduction in pork processing. An economic optimisation model is used to explore the trade-offs in achieving specified and multiple pathogen reduction targets. The data indicate that costs of individual pathogen-reduction technologies are in the range of US$0.03 to US$0.20 per carcass, and that the optimal combination of technologies may cost as much as US$0.47 per carcass. The cost estimates for specific interventions show that electricity, water and labour costs are key influencing factors. The estimated costs of pathogen reduction measures represent less than two percent of average slaughter costs.
46. To evaluate options for the control of pathogens in cattle slaughtering facilities, Malcolm et al. (2004) estimate a probabilistic risk analysis model based on typical slaughterhouse practices linked to a decision model to evaluate the cost-effectiveness of seven combinations of pathogen-reducing technologies. The likely comparative advantage of different strategies for large versus small slaughterhouses is examined. Risk is compared for two cases with the same mean risk to illustrate the importance of correct model specification. The risk model is derived from a previous study and other parameters derived from previous studies, expert opinion and industry consultation. The results provide the cost of each pathogen reduction option per unit weight of meat. It is found, for example, that every choice containing improved de-hiding lies on the frontier, as do some choices containing irradiation. There are also significant synergies in combining steam pasteurization with improved de-hiding procedures, suggesting the need for multiple rather than a single control measure.
47. Van der Gaag et al., (2004) estimate the cost-effectiveness of different control measures for Salmonella in the Dutch pork supply chain. A number of scenarios are simulated using an epidemiological stochastic model and a deterministic model for the economic variables, both at each level of the supply chain and for the chain as a whole. Data are derived from previous studies and government statics. The cost effectiveness of each intervention is expressed as the ratio of change in impact (such as reduction in the prevalence of Salmonella at the end of the chain) relative to the change in costs associated with a pre-determined package of interventions. The results show that the most cost-effective strategy is to implement interventions in slaughterhouses and on finishing farms. Cost-effectiveness is reduced if not all farms/firms at a particular stage in the supply chain cooperate to reduce the prevalence of Salmonella.
48. The cost-effectiveness of strategies for attaining improvements in food safety in the Dutch dairy supply chain is assessed by Valeeva et al (2006). The costs of alternative control measures are calculated throughout the chain using a partial budgeting approach, with budgets being estimated separately for each level of the chain. Costs are compared to a base scenario corresponding to the lowest required level of food safety controls in order to calculate the incremental costs from changes in controls at a certain action point. Firm-level cost data are derived from interviews with feed and dairy processing companies and the regulatory authority for the animal feed sector, and farm-level costs from the literature. The most cost-effective control measures are then identified using linear programming. The results show, for example,
14
that simultaneously improving chemical and microbiological food safety in the chain costs €44.37 per tonne of milk relative to the base scenario.
49. CEA has also been applied to controls on Campylobacter in the Dutch broiler chicken sector (Havelaar et al., 2006). A mathematical model is employed with risk analysis, epidemiological and economic modules for the farm, processing, distribution, preparation and consumption stages of the supply chain, and for disease outcomes. Data are derived from the literature, expert opinion and surveys. The model predicts the number of cases of illness as a result of consuming cross-contaminated chicken based on a dose-response relation for infection and a constant-probability model for illness given infection. The year 2000 is used as the baseline. The predicted reductions in disease incidence are then used to calculate the reduction in disease burden (averted DALYs) and reduction in costs of illness, including direct health care costs and both direct and indirect non-health care costs. These values are compared to the direct costs of implementing the intervention under the assumption of no demand and supply changes to calculate cost-effectiveness (or maybe more accurately utility) ratios; the ratio between the net costs of an intervention (the costs of implementation minus the monetary costs of averted illness) and the averted disease burden in DALYs.
50. Among the limited applications of CEA to animal health, Benedictus et al. (2009) assess the cost-effectiveness of alternative BSE control strategies on the Dutch dairy cattle sector, namely: 1) incineration and disposal of infected animals and materials; 2) post-mortem testing and removal of BSE infected animals; and 3) culling of age cohorts of BSE cases. The baseline is the situation of non-intervention. Cost-effectiveness is measured in terms of the cost per human life year saved as a result of each control measure. The data come from EU annual reports on rates of BSE, UK and Dutch government and the published literature. Data on the costs of each control measure are derived from industry estimates, although are considered to be of dubious reliability. The analysis is undertaken using a stochastic model with Monte Carlo simulation followed by sensitivity analysis for the period 2002 to 2005. The results show that the risk in the baseline scenario declines from 16.98 lost life years in 2002 to 2.69 lost life years in 2005. As a result, the cost-effectiveness of BSE control decreases from €4.3 million per life year saved in 2002 to €19.2 million per life year saved in 2005. Cohort culling is estimated to have the largest decrease in cost-effectiveness over the study period, from €3.8 million per life year saved in 2002 to €12.1 million per life year saved in 2005.
2.2.2 Synthesis
51. The limited applications of CEA to the economic analysis of SPS capacity building reviewed above perhaps reveal the limitations of this approach. Whereas CBA can indicate whether a particular capacity building option yields a net benefit, and permits comparison of a range of options that differ in the flow of benefits, CEA is restricted to scenarios where outcomes share a common impact. Thus, whereas CBA can help decision-makers decide what to do, CEA can only help choose how to do it and especially to select the least cost option to achieve a desired result (Kuchler and Golan, 1999).
52. The limitations of CEA, however, can be overstated. Thus, where the flow of benefits from a range of capacity building options differ, it may be possible to convert these into the same unit of measurement. In the case of food safety where outcomes of an intervention may be observed in terms of changes in mortality and morbidity, for example, a more general measure of health outcomes (such as DALYs or QALYs) can be employed (Havelaar et al., 2006; Kuchler and Golan, 1999). At the same time more rigorous instances of CEA, such as those focused on food safety controls that are reviewed above, involve rather complicated modelling exercises that do not differ markedly from CBA. Indeed, like CBA these studies are dependent on data quality and are essentially driven by underlying assumptions (Havelaar et al., 2006; van
15
der Gaag et al., 2004). Here the applications of CBA versus CEA may simply reflect what level of analysis is considered possible in a particular context.
53. To some extent CBA and CEA can be considered complimentary approaches to economic analysis, notably when considering quite specific capacity building needs but where multiple approaches are available that vary widely in their costs. Here these two techniques might be employed in sequence, with CBA used first to determine which options pass a defined threshold in terms of minimum net benefit and then CEA employed to choose between the remaining options in terms of cost-effectiveness. This is illustrated well by a relatively recent economic assessment of a proposed World Bank project for the control of Avian and human influenza in Vietnam (World Bank, 2007). The project is intended to increase the effectiveness of government services in Vietnam to reduce the risk to poultry and humans from Highly Pathogenic Avian influenza (HPAI). An initial CBA suggests that there is a substantial net benefit from controls on HPAI given the very significant scale of the costs in terms of human health, losses to the poultry sector, reduced tourism, etc. However, it is recognised that the control and eradication of HPAI is a complicated task that can only be achieved using a combination of measures, with any single measure unlikely to be appropriate and effective. Further, the composition of measures must be chosen and adapted according to the conditions in the country and its disease status, and must therefore be phased. Thus, the aim is to ensure a minimum cost composition of control measures to achieve the current status of no disease in the country, which is evidently a problem that is well suited to CEA.
2.2.3 Multi-Criteria Decision Analysis
54. The fact that decision-makers often face options that have a plurality of impacts and whose choices are driven by multiple objectives has driven the development of a range of multi-criteria decision analysis (MCDA) tools. Broadly, MCDA can be considered an extension of CBA in that it enables decision-makers to consider simultaneously a range of factors which are themselves multidimensional, for example market-level impacts, public health outcomes, etc. One of the chief benefits of this approach, however, is it that it is capable of producing a range of information outputs which allow decision-makers to prioritise actions along different dimensions (Caswell, 2008; Henson et al., 2007). Unlike CBA, the most satisfactory and efficient solution is non-dominating or Pareto optimal; it is not possible to improve the performance of any objective without reducing the performance of at least one objective.
55. There are two broad classes of MCDA models: 1) multiple objective decision-making (MODM); and 2) multi-attribute decision-making (MADM). The former is applied when there is a large set of options and is driven by the decision criteria, while the latter is applicable to situations where there is a finite and small set of alternatives and is driven by the attributes of the various options. It is the latter of these contexts that is applicable to choices between SPS capacity building options.
56. MCDA models share the common purpose of enabling options to be evaluated and choices made on the basis of multiple criteria using systematic analysis. They differ, however, in their theoretic basis and in the mechanisms they employ. Some methods rank options, some identify a single optimal alternative, some provide an incomplete ranking and others differentiate between acceptable and unacceptable alternatives (Linkov et al., 2004). It is possible to discern three basic types:
(a) Optimisation models employ numerical scores to represent the merits of one option in comparison with another on a single scale. Scores are developed from the performance of alternatives with respect to an individual criterion and then aggregated across criteria into an overall score. Individual scores may be added
16
or averaged, or a weighting mechanism used to represent the differing importance of the various decision criteria. Typically, good performance on one criterion can compensate for poor performance on another. Optimisation models are most applicable when objectives are narrow, clearly defined and easily measured and aggregated. Examples include multi-attribute utility theory (MAUT)/multi-attribute value theory (MAVT) (Dyer, 2005) and the analytical hierarchy process (AHP)/analytic network process (ANP) (Saaty, 2005).
(b) Goal aspiration, reference level or threshold models rely on establishing desirable or satisfactory levels of achievement for each of the decision criteria. These processes seek to discover options that are closest to achieving these thresholds. When it is impossible to achieve all stated thresholds a model can be cast in the form of an optimization problem in which the decision-maker attempts to minimise the shortfalls. Over performance on one criterion may not compensate for underperformance on another. Alternatively, the decision-maker may seek to satisfy as many of the goals as possible and ignore the fact that some performance metrics may be far from the target levels. Goal models are most useful when all of the relevant goals of a project cannot be met at once. The most widely applied goal aspiration approaches are the various goal programming methods (Loken, 2007).
(c) Outranking models compare the performance of two or more options at a time, initially in terms of each criterion, to identify the extent to which a preference for one over the other can be asserted. In aggregating preference information across all the decision criteria the outranking model seeks to establish the strength of evidence favouring one option over another. Outranking models are appropriate when criteria metrics are not easily aggregated, measurement scales vary over wide ranges and units are incommensurate or incomparable. The two variants of outranking are the ELECTRE (Roy, 1990) and PROMOTHEE (Brans and Vincke, 1985) methods (see below), both of which are partially compensatory.
57. MCDA has been employed to a wide variety of decision contexts including natural resource management, water management and energy planning (see for example Gupta et al., 2000; Kangas et al., 2001; Loken, 2007; Pohekar and Ramachandran, 2004). Conversely, there is little evidence that MCDA has been applied to decisions relating to food safety, animal health and/or plant health in general, and SPS capacity building in particular. It is recognised, however, that MCDA could be a powerful tool for supporting choices between SPS capacity building options, most notably relating to food safety, and some efforts have been made to develop frameworks that facilitate the application of MCDA techniques in this context (Caswell, 2008; Henson et al., 2007; Krieger et al., 2007).
58. Krieger et al., (2007) propose the use of MCDA, and specifically MAUT, to guide decisions with respect to the enhancement of food safety and quality management systems in the agri-food sector. As well as proposing a basic framework, an illustrative example of the implementation of ISO 9000 and EurepGAP/GlobalGAP, individually or collectively, is provided. This analysis includes the costs of compliance with these standards, notably capital investments and changes in on-going operating costs. The benefits include access to markets, product liability, cross-compliance, process quality, product quality and food safety, traceability, trust, environmental impacts and transaction support. In order to estimate the costs and benefits of compliance, non-monetary benefits are converted into monetary values. It is determined that the greatest net benefit comes from compliance with ISO 9000 and EurepGAP/GlobalGAP
17
simultaneously, although this scenario also has the highest compliance costs. The major sources of benefits are market access and product liability.
59. A multi-factorial risk prioritisation framework for food-borne pathogens is developed by Henson et al. (2007). This ranks pathogen-food combinations in terms of public health, market impacts, consumer perceptions and social sensitivity using the PROMOTHEE approach. Each of these four decision criteria itself has multiple dimensions. A trial application of the framework is undertaken with six case study food-pathogen combinations using government statistics from Canada and the US, existing literature, etc (Ruzante et al., 2009). None of the six food-pathogen combinations dominates with respect to all four of the dimensions. Campylobacter in chicken and Salmonella in chicken are ranked the highest risks on the public health and market impact dimensions, while Escherichia Coli 0157 in spinach and Listeria Monocytogenes in ready-to-eat meats have high values for consumer perceptions and social sensitivity. This trial application illustrates the complexity of ranking and comparing microbial risk with different dimensions, a task which cannot be performed using CBA or CEA.
2.3 Observations and General Findings
60. From the review of applications of economic analysis to SPS capacity building and consultation with practitioners that have used these methods, we can make a number of general observations:
(a) The most widely employed technique is CBA, especially in the areas of animal and plant health, with relatively few applications of CEA and (especially) MCDA.
(b) Economic analysis has variously been applied to ex ante and ex post analysis of the costs and benefits of improvements in SPS capacity, although ex post analysis of defined action plans is probably more common. These two broad categories of analysis face both common and distinct challenges.
(c) Most applications of economic analysis have focused on quite specific capacity within the broad areas of food safety, animal health or plant health. There are almost no instances of economic analysis being applied to the comparison of SPS capacity building options more generally. Most analyses have not been undertaken in the context of real investment decisions, but rather to support broader policy debates and dialogue on capacity building in specific SPS areas.
(d) Most analyses have focused on a relatively narrow set of decision criteria, predominantly ones that can be expressed in monetary units. At the same time, the need to examine the wider impacts of capacity building options is recognised by analysts. This suggests the need to make more use of techniques that can cope with multiple decision criteria and/or criteria that are not conducive to measurement in monetary units.
(e) A variety of approaches to CBA have been employed that vary widely in their approach, scope and rigour. In almost all of the studies we have reviewed the analysis is constrained (to varying degree) by the availability and/or quality of data. Indeed, all of the practitioners consulted highlighted data as one of the foremost challenges in applying economic analysis to SPS capacity building, suggesting the need to focus technical assistance on enhancing data collection and analysis capacities that have direct relevance to SPS-related decision-making.
18
(f) Reflecting the data problems faced by analysts, most studies are based on assumptions that, at times, are dubious at best. These reflect not only the complexity of the economic impacts of capacity building investments, that modelling approaches to CBA at least try to capture, but considerable uncertainties over the scale, scope and magnitude of these impacts.
(g) All of the studies reviewed indicate a significant net benefit from the options under consideration. This reflects the fact that they represent a rather select sample; analyses that suggest that any or all of the options should not be pursued are unlikely to be published. At the same time it is recognised that the results of economic analysis need to be interpreted with some caution, with various "accusations" that CBA, for example, under or over-estimates the costs and/or benefits of capacity building options.
(h) There is little evidence of routine economic analysis of SPS capacity building options in a developing country context, at least which is available in the public domain. Where applied, for example by the World Bank, the analysis tends to be rather rudimentary.
61. The above observations broadly reflect the fact that economic analysis, both generally and specifically in developing countries and/or applied to SPS capacity building, is "not easy". This suggests that we need to adopt a rather pragmatic view in assessing where economic analysis can and should be done, and in assessing the quality of its outputs. At the same time, there is evident scope for economic analysis to be applied across a far wider spectrum of decision-making contexts, beyond choices between rather narrow sub-sets of options in specific areas of SPS capacity. We explore options for this below.
3. USING ECONOMIC ANALYSIS TO INFORM SPS-RELATED DECISIONS: GUIDANCE FOR DEVELOPING COUNTRIES
3.1 General Context
62. In thinking about what a framework for the economic analysis of options for SPS capacity building might look like it is instructive to consider the choice variables that decision-makers are likely to have to consider (Henson, 2008). Clearly, they may need to decide between investments in distinct areas of SPS management capacity, for example controls on food-borne pathogens or pesticide residues, or on plant pests. In turn, they may face choices between alternative ways of addressing a particular SPS problem. Take fumigation requirements in export markets for fresh vegetables because of an endemic plant pest. Here, investments could be made to establish pest-free areas or to construct cost-effective and efficient fumigation facilities. There may be options to enhance such capacities in the public and/or private sectors. If the focus is on boosting exports, choices may need to be made between SPS capacities that are specific to, or have the greatest impact on, particular product exports. For any one product, choices may have to be made over which elements of SPS capacity to address first. These scenarios are not meant to be exhaustive, but merely to illustrate the complexity of decision-making in the area of SPS capacity enhancement that an analytical framework must address in order to be of utility in the establishment of coherent and prioritised national actions plans in a world of constrained resources.
63. In order to support prioritised decisions regarding SPS capacity building, the framework needs to provide a coherent approach to "making sense" of identified weaknesses in SPS capacity, the costs of "plugging" the identified gaps in capacity and to linkages with identified impacts. The impacts of interest may vary from the more immediate, for example changes in
19
export flows, to eventual effects on incomes and employment. This requires answers to a series of questions:
(a) What weaknesses exist in SPS capacities that have a conceivable or identifiable impact on export performance and other impacts of interest, notably on the basis of established evaluation tools?
(b) What alternative investments would act to curtail these identified weaknesses in SPS capacity?
(c) What are the costs of these alternative investments?
(d) What is the likely flow of benefits from these investments?
(e) How do we reconcile the flow of costs and benefits from the investments being considered?
64. While on the face of it these may seem rather straightforward questions, the decision-maker is faced with the often rather daunting problems of identifying the distinct impact of various investment options on the flow of costs and benefits over time relative to a plausible counterfactual, and to confining the scope of the analysis such that it is achievable given available resources, but incorporates the main decision criteria. For example, how to separate out the impact of enhancements in SPS capacity on exports flows from other plausible influencing factors, for example transport costs or shifts in world market prices. Further, how to deal with wider spill-over effects that may be a significant part of the cost-benefit calculus, for example impacts on small-scale producers or the environment.
65. In this context, it is important to recognise that the aim of the framework is to support decisions rather than to explore the costs and/or benefits of enhancements in SPS capacity per se. This requires that the framework be both flexible and practicable. It must be applicable to a wide range of SPS capacity building situations and be employable where data are of varying quantity and/or quality. It should also consider the major impacts of the options under consideration, while recognising that a rigorous analysis of each of these options is likely to be prohibitive in terms of time and resources. In order to feel comfortable with such compromises, it is worthwhile recognising that any form of economic analysis is likely to be a significant improvement on how decisions are currently made.
3.2 Benefits from the Use of Economic Analysis
66. In the foregoing discussion it is almost taken as given that the use of economic analysis to support decisions in the realm of SPS capacity building is a "good thing". It is important to reflect, however, on the benefits that economic analysis brings, both in general and in the specific context of SPS capacity building. Remember that decision-makers may be sceptical of the utility of economic analysis approaches, and indeed may even be threatened by them. If economic analysis is to be employed successfully, there needs to be "buy in" at all levels of the decision process:
(a) Economic efficiency: The primary benefit from the use of economic analysis is that it drives decisions towards options that provide the greater returns on investments in capacity building; that is having the greatest economic efficiency. In the context of severe resource constraints on capacity building options this is key. Of course, how these returns are defined and measured is open to question and will be reflected in the choice of the specific method to be

20
employed and the decision criteria that are incorporated into the resultant analytical model. This emphasises that, while these approaches can assist in choosing between the options available, it is the decision-maker that defines the parameters under which such choices are made.
(b) Objectivity: Regardless of the type of economic analysis employed, a key benefit is that the decision-maker is forced to lay out the key elements of the options under consideration and the weightings given to each of these elements in the decision process. This tends to render decisions more objective, in that the drivers of the decision and the trade-off between flows of costs and benefits over time are explicit and are defined in clear and quantifiable terms.
(c) Transparency and accountability: The fact that economic analysis requires that the components of the decision problems are specified explicitly tends to enhance the transparency of decision processes. In turn, decision-makers need to be able to justify the way in which decisions are made, rendering the process more accountable.
(d) Inclusiveness: The greater transparency of decision-making processes, in turn, tends to enhance inclusiveness on the part of stakeholders. Because the choice criteria employed are explicit, it is difficult to "bury" particular interests without due justification; that is why a low weight has been assigned to these interests in the decision-making process. Thus, a broader range of stakeholders will tend to be drawn into the decision process; if their interests are to be included, there is a need to gather information on probable impacts of the various options being considered.
(e) Appreciation of risk and uncertainty: A key component of most economic analysis methods is the use of sensitivity analysis to explore the influence of particular assumptions and/or data uncertainties on the ranking of capacity building options. The analytical framework can also be employed to explore the impact of varying scenarios on the choice between options, maybe including situations that have not been explicitly included in the decision process. Both of these processes tend to enhance recognition on the part of decision-makers of the inherent risks and uncertainties in choosing between alternative capacity building options. In less formal decision processes there is the opportunity, and often also the inclination, for decision-makers to underestimate the tenuousness of the choices they make.
67. While there is a compelling case that economic analysis improves the nature of decisions regarding SPS capacity building, it also changes the way in which decisions are made. Thus, decisions will tend to be made in a more structured manner that is driven by choice criteria that can be specified as "hard numbers", sometimes to the exclusion of criteria for which there is a paucity of quantitative data or that are inherently qualitative. This problem is overcome by some approaches to MCDA, for example outranking, that enable variables to be incorporated for which only qualitative data are available. More broadly, economic analysis frameworks point decision-makers away from making decisions on the basis of "what feels right" and towards actions that are supported "by the numbers". This may be quite different to how decisions have historically been made.
68. It should be emphasised, however, that economic analysis frameworks are designed to support rather than make decisions. Thus, the results of such analyses should be considered alongside other pertinent information. While there can be a tendency to put heavy weights on
21
the quantitative information provided by CBA and the like, it is important that options to be pursued are economically feasible and politically acceptable. Otherwise, it may be difficult to get "buy in" from more senior decision-makers and/or sustaining any capacity that is enhanced can be a challenge.
3.3 Requirements for the Use of Economic Analysis
69. While there are undoubtedly substantial benefits from employing economic analysis to support decisions over SPS capacity building options, it is important to recognise the resources, skills and expertise needed in order to apply such methods successfully. Not only does economic analysis imply a change in the way decisions are taken, but there is also often a "steep learning curve" on the part of those charged with undertaking the analysis and those who will use the results in the decision-making process itself. It is important that those contemplating the application of economic analysis to SPS capacity building recognise that there can be initial "teething problems" and that, while decision-making processes are likely to be enhanced as a result, this is not a costless exercise.
70. In order to employ economic analysis to the assessment of options for SPS capacity building there clearly needs to be personnel that have the required grounding in at least basic welfare economics, the core concepts of economic evaluation and the "nut and bolts" of the technique(s) to be employed. Given that a number of departments or agencies may be involved in making SPS-related capacity-building decisions, this can be a considerable challenge.7 It is sensible that initial attempts at economic analysis in this context start simple, maybe employing rather rudimentary assumptions, and are gradually refined as experience is gained. In some cases, skills in the use of specialised decision software (for example D-Sight or Decision Lab 2000 in the case of outranking) or statistical software (for example some forms of CBA that employ econometric analysis) may be required. Again, the recommendation is to "start simple" and begin to use the more sophisticated functions of this software as the analyst grows in experience and confidence.
71. Data on costs and benefits are the key input to all economic analysis methods. In many developing countries this can be a significant constraint and may require that any analysis is rather narrow in its focus; for example, just examining the direct costs and benefits rather than economy-wide welfare effects. CBA is particularly demanding in its data requirements given that all variables essentially have to be specified in monetary terms. For many applications (see below), this may not be a problem provided at least rudimentary data are available. However, where there is a desire to incorporate the multi-faceted and wider impacts of enhancements in SPS capacity, and where data is extremely limited, a MCDA approach is probably more productive. Below we develop a framework that can be employed in such contexts, specifically using outranking, that enables the costs and benefits of investment options measured using a variety of potentially inconsistent metrics to be incorporated into a common analytical framework.
72. More broadly, one of the most fundamental requirements (and challenges) faced by developing countries attempting to employ economic analysis to SPS capacity building is the need for political "buy-in". Among the practitioners consulted for this study there was a
7 To get over this problem, a centralised support unit might be established that can provide
guidance to departments or units looking to use economic analysis methods to improve capacity-building decisions. This centralised unit might be responsible for coordinating the undertaking of economic analysis across the various departments and agencies. However, care must be taken to not "distance" the economic analysis process from those who have relevant expertise and experience in specific areas of SPS capacity, and also most interest in the outcome of the economic analysis process itself.
22
widespread view that considerable "lip service" was paid to the need for economic analysis, but there was limited use of such approaches in practice: "When asked, they recognise the role of economic analysis, but the results tend to be way down the list of considerations when decisions are actually made". Clearly, without "buy-in", not only are the resources required to undertake economic analysis unlikely to be available, but the results will have little bearing on the choices made by decision-makers, rendering the process largely cosmetic. Conversely, the application of economic analysis can serve to move SPS-related capacity-building higher up the political agenda, especially in a broader context where economic analysis is not routinely used. This reflects the considerable power of "hard numbers" in petitioning for resources, notably in the context of acute resource scarcity.
3.4 Which Types of Economic Analysis to use Where?
73. The choice whether to undertake economic analysis and, if so, the most appropriate method will depend on the decision-making context, for example in terms of number of options to be considered, degree to which there is real leverage over the investments to be made, etc. Some of the key contexts likely to be faced, and the approach(s) to economic analysis that are likely to be most applicable, are as follows:
(a) Ex post analysis of existing capacity building efforts: The first scenario is where investments have already been made in the enhancement of a particular SPS capacity and the impending decision is whether to continue making investments and/or to extend these to related areas of capacity. In the previous analyses reviewed above the CBAs of controls on fruit fly in the South Pacific are examples (McGregor, 2007). Here there generally exists a relatively narrowly and clearly defined option and the focus is at least partly on the benefits that have flowed from these investments to date. The most appropriate approach to economic analysis in this context is CBA. No real options are being considered rather than a yes/no decision with respect to future funding and so the focus is on whether a net benefit has been achieved or whether the internal rate of return (IRR) of these investments is deemed acceptable, probably with reference to other potential capacity building efforts.
(b) Analysis of large-scale capacity interventions: Where large-scale capacity building projects have been designed, often with considerable support and/or leadership from donors, and no real alternative options are being considered, again the decision is essentially of the yes/no variety. While CBA is generally the best option in this context, the information set on which such analysis is based can be more challenging than the above scenario. The analysis is ex ante and, as such, the inherent uncertainties over the magnitude of impacts tend to be greater. Thus, we generally see less formal CBA, as is generally used by the World Bank (see for example World Bank, 1999), often with a rather narrow focus on a particular impact (for example the value of exports) that can be collapsed onto a NPV and the IRR calculated. Within such projects, choices between alternatives approaches that have passed an acceptable cost-benefit threshold may be guided by CEA.
(c) "Demonstration" analysis of controls on SPS risk and/or enhancements in capacity: In the review of previous economic analyses we observed a number of studies that are not tied to immediate and/or specific plans for investments in capacity building, but which demonstrate the likely benefits from enhancements in capacity. The studies reviewed on FMD and other animal diseases provide good examples (for example Randolph et al., 2002). Economic analysis in such
23
cases is amenable to more in-depth CBA, including welfare-based analyses that employ econometric modelling. Of course, such analysis is ex ante and is prone to the same uncertainties and data problems as discussed above.
(d) Choices between multiple capacity building options: Arguably, the context in which economic analyses is of greatest utility to developing countries is choosing between multiple capacity building options, within and/or across the broad areas of food safety, animal health and/or plant health. Because SPS capacity in many developing countries has numerous inherent weaknesses, governments and donors face multiple competing demands for investments. For example, a simple examination of the various needs assessments by FAO, OIE, IPPC and various bilateral and multilateral donors provides an almost daunting array of areas where capacity enhancements can conceivably result in considerable benefits in terms of exports, domestic public health, agricultural productivity improvement, etc. Moving beyond a rather narrow focus, for example on the value of exports risks, can open up a "can of worms" in terms of the scope of the analysis. In this context, MCDA provides a structured and flexible framework that can be employed where there are weaknesses in the available data and decisions are driven by an array of criteria that are, almost by necessity, measured in differing ways. As a result, these guidelines focus on defining a MCDA framework for SPS capacity building decisions.
74. The foregoing discussion suggests that there is no "right way" to undertake economic analysis of SPS capacity building and often inevitable compromises have to be made in the scope and/or rigour of the analysis. Rather, the choice between alternative approaches will be fundamentally driven by the specific decision-making context. At the same time, in choosing an approach the analyst needs to be cognisant of the associated data requirements, ability to deal with uncertainties, treatment of trade-offs in strengths and weaknesses across decision criteria, etc. Alternative approaches also differ in the technical skills required of the analyst, the time taken to set up the analytical framework and/or produce results, time and financial resources involved, etc. Note, however, that the choice is not simply between CBA and MCDA, for example, but also over the depth and rigour of the analysis pursued given the approach that is chosen.
3.5 A Framework for Prioritisation on the Basis of Multiple Criteria8
75. As we have seen above, there have been numerous applications of economic analysis methods to the costs and benefits of improvements in food safety, animal health and plant health controls. Relatively little attention has been given, however, to the practical day-to-day application of these methods for the assessment and prioritisation of alternatives for SPS capacity building (exceptions include Kolstad and Wiig, 2002; Krieger et al., 2007), most notably in the context of developing countries. Here we provide a framework for broad-based comparisons of capacity building options on the basis of multiple criteria, which might include trade impacts, consequences for domestic agricultural productivity and/or food safety, effects on small-scale producers, etc. The framework not only focuses on the most appropriate economic analysis method in such situations, but also how to assemble the required information in a manner that addresses data limitations and provides a visual platform for the comparison of alternative investments. The framework we present is broadly based on the
8 Based on the recommendations in a pre-final version of this publication, the MCDA framework
presented here is being further developed and improved based on applications at the country level. For more information on this work, and the resulting "Guide to Multi-Criteria Decision-Making", see the STDF website (www.standardsfacility.org/en/TAEcoAnalysis.htm).
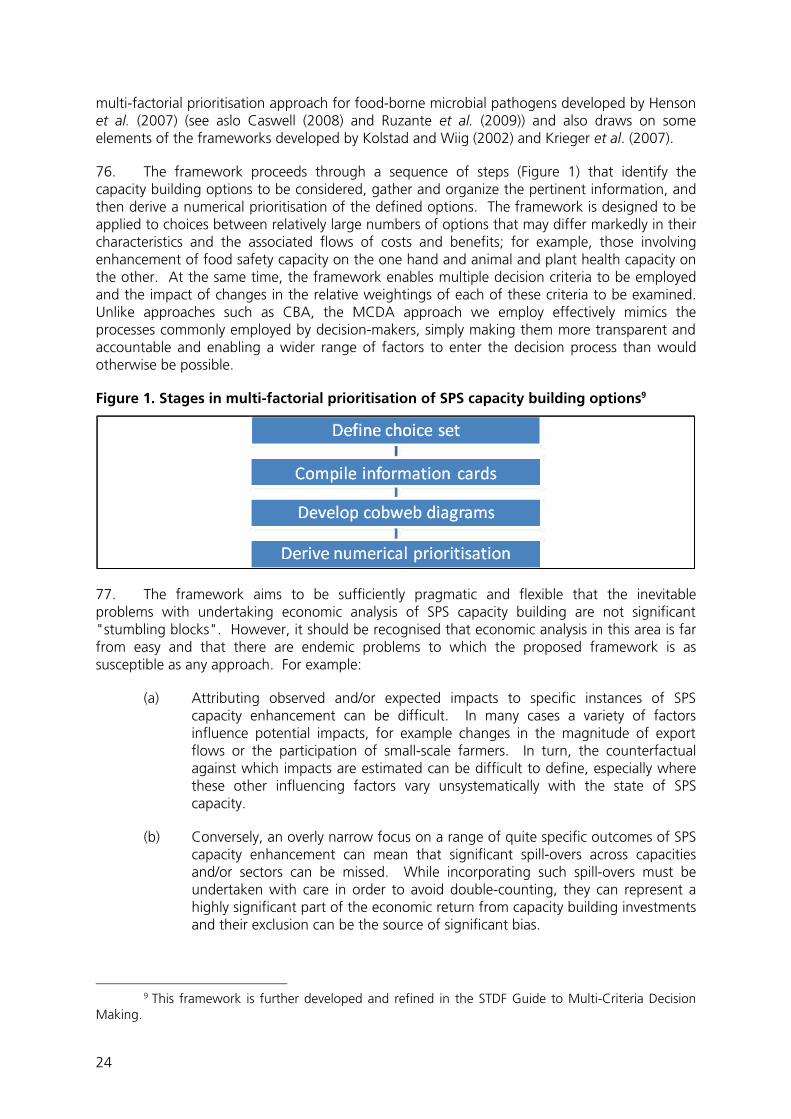
24
multi-factorial prioritisation approach for food-borne microbial pathogens developed by Henson et al. (2007) (see aslo Caswell (2008) and Ruzante et al. (2009)) and also draws on some elements of the frameworks developed by Kolstad and Wiig (2002) and Krieger et al. (2007).
76. The framework proceeds through a sequence of steps (Figure 1) that identify the capacity building options to be considered, gather and organize the pertinent information, and then derive a numerical prioritisation of the defined options. The framework is designed to be applied to choices between relatively large numbers of options that may differ markedly in their characteristics and the associated flows of costs and benefits; for example, those involving enhancement of food safety capacity on the one hand and animal and plant health capacity on the other. At the same time, the framework enables multiple decision criteria to be employed and the impact of changes in the relative weightings of each of these criteria to be examined. Unlike approaches such as CBA, the MCDA approach we employ effectively mimics the processes commonly employed by decision-makers, simply making them more transparent and accountable and enabling a wider range of factors to enter the decision process than would otherwise be possible.
Figure 1. Stages in multi-factorial prioritisation of SPS capacity building options9
77. The framework aims to be sufficiently pragmatic and flexible that the inevitable problems with undertaking economic analysis of SPS capacity building are not significant "stumbling blocks". However, it should be recognised that economic analysis in this area is far from easy and that there are endemic problems to which the proposed framework is as susceptible as any approach. For example:
(a) Attributing observed and/or expected impacts to specific instances of SPS capacity enhancement can be difficult. In many cases a variety of factors influence potential impacts, for example changes in the magnitude of export flows or the participation of small-scale farmers. In turn, the counterfactual against which impacts are estimated can be difficult to define, especially where these other influencing factors vary unsystematically with the state of SPS capacity.
(b) Conversely, an overly narrow focus on a range of quite specific outcomes of SPS capacity enhancement can mean that significant spill-overs across capacities and/or sectors can be missed. While incorporating such spill-overs must be undertaken with care in order to avoid double-counting, they can represent a highly significant part of the economic return from capacity building investments and their exclusion can be the source of significant bias.
9 This framework is further developed and refined in the STDF Guide to Multi-Criteria Decision
Making.
25
(c) It can be extremely difficult to derive reliable estimates of the economic costs associated with implementing particular SPS capacity building options. The economy-wide adjustments, for example through market price changes and attendant resource reallocations, have been discussed above. More pragmatically, however, in many developing countries the required investments are often innovative and there may be few directly comparable previous cases on which to base cost estimates.
(d) Any instance of SPS capacity building is undertaken in the context of a dynamic economic, biological and political environment. Thus, the intended and/or expected impacts of a particular option may not be borne out in the future. At the same time, basing estimates of costs and benefits on current economic conditions, for example market prices, can introduce bias into the analysis. Of course, the analyst may have little notion of how the world is likely to change in the future, in which case they must simply be mindful of the simplifying assumptions that are being employed.
(e) Assessments of likely impacts, both in terms of their likelihood of occurrence and magnitude, are susceptible to significant subjectivities that can vary systematically across observers. In part this can be overcome through the involvement of multiple stakeholders. Perhaps more important, however, is to recognise that such subjectivities exist and to reflect on them at all stages of the modelling process.
78. Some of these inherent problems are discussed below to alert the reader and identify the stage(s) of the framework at which they are likely to be most pertinent.
79. The remainder of this section examines each of the four stages of the multi-criteria decision-making framework in turn.
3.5.1 Stage 1: Define choice set
80. Whatever approach to economic analysis is employed, the first step is to define the set of options to be considered (Kolstad and Wiig, 2002). This set will vary in the number and breadth of options according to the scope of the decision-making process. Thus, if the focus is on which broad elements of SPS control to focus capacity building efforts - that is within and across the broad categories of food safety, animal health and plant health - a relatively large number of quite diverse and broadly-defined options are likely to be included. Conversely, if the focus is on decisions between alternative ways in which to enhance a particular element of SPS capacity - for example controls on a particular plant pest or improvements in laboratory testing facilities for pesticides - the choice set will likely contain a small number of specifically-defined options. The main focus of these guidelines is on the former of these choice scenarios.
81. The choice of options to be considered defines the parameters of the economic analysis; no information will be provided by the analysis on any option that is excluded from the choice set. At the same time, the more options that are included the more onerous and costly will be the analysis. This suggests that the choice set should not be "thrown together", but should be defined on the basis of clearly defined indicators and criteria, such that the initial "sifting" of options is undertaken in an objective and transparent manner. Some potential indicators are outlined in Table 1, which distinguishes three broad categories:
(a) Capacity-based indicators focus directly on weaknesses in SPS controls, either in the broad areas of food safety, animal health and plant health, or with respect
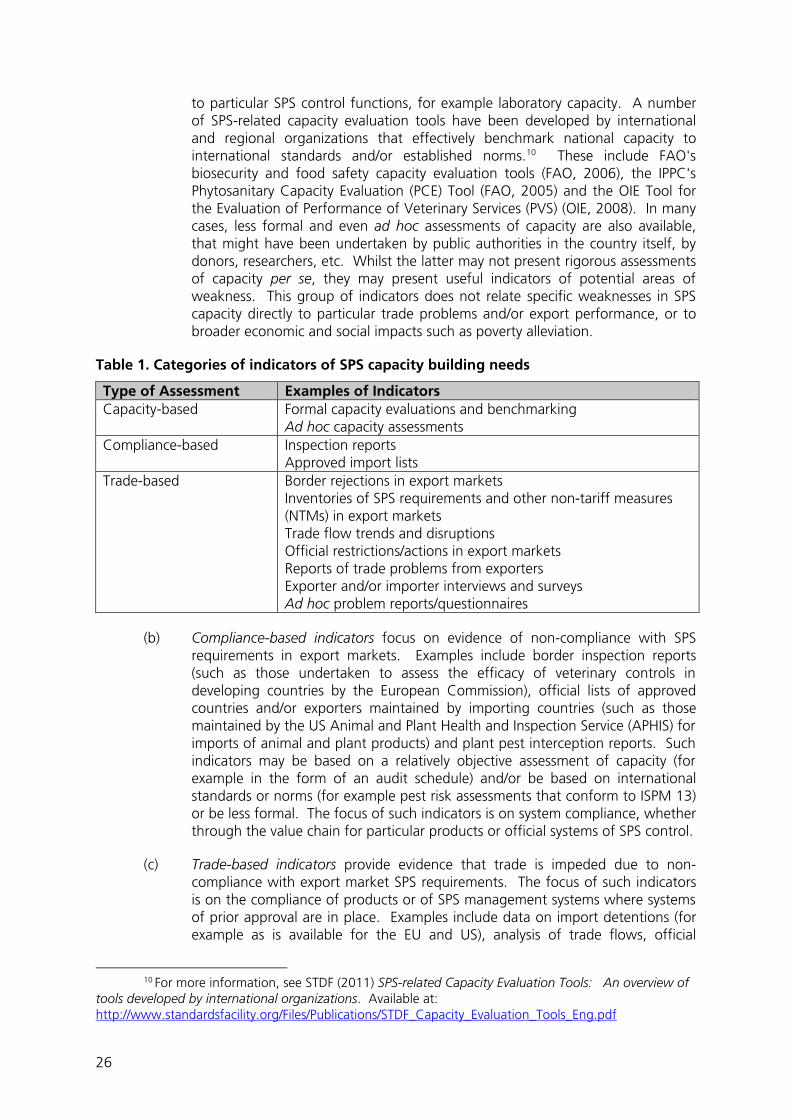
26
to particular SPS control functions, for example laboratory capacity. A number of SPS-related capacity evaluation tools have been developed by international and regional organizations that effectively benchmark national capacity to international standards and/or established norms.10 These include FAO's biosecurity and food safety capacity evaluation tools (FAO, 2006), the IPPC's Phytosanitary Capacity Evaluation (PCE) Tool (FAO, 2005) and the OIE Tool for the Evaluation of Performance of Veterinary Services (PVS) (OIE, 2008). In many cases, less formal and even ad hoc assessments of capacity are also available, that might have been undertaken by public authorities in the country itself, by donors, researchers, etc. Whilst the latter may not present rigorous assessments of capacity per se, they may present useful indicators of potential areas of weakness. This group of indicators does not relate specific weaknesses in SPS capacity directly to particular trade problems and/or export performance, or to broader economic and social impacts such as poverty alleviation.
Table 1. Categories of indicators of SPS capacity building needs
Type of Assessment Examples of Indicators Capacity-based Formal capacity evaluations and benchmarking
Ad hoc capacity assessments Compliance-based Inspection reports
Approved import lists Trade-based Border rejections in export markets
Inventories of SPS requirements and other non-tariff measures (NTMs) in export markets Trade flow trends and disruptions Official restrictions/actions in export markets Reports of trade problems from exporters Exporter and/or importer interviews and surveys Ad hoc problem reports/questionnaires
(b) Compliance-based indicators focus on evidence of non-compliance with SPS requirements in export markets. Examples include border inspection reports (such as those undertaken to assess the efficacy of veterinary controls in developing countries by the European Commission), official lists of approved countries and/or exporters maintained by importing countries (such as those maintained by the US Animal and Plant Health and Inspection Service (APHIS) for imports of animal and plant products) and plant pest interception reports. Such indicators may be based on a relatively objective assessment of capacity (for example in the form of an audit schedule) and/or be based on international standards or norms (for example pest risk assessments that conform to ISPM 13) or be less formal. The focus of such indicators is on system compliance, whether through the value chain for particular products or official systems of SPS control.
(c) Trade-based indicators provide evidence that trade is impeded due to non-compliance with export market SPS requirements. The focus of such indicators is on the compliance of products or of SPS management systems where systems of prior approval are in place. Examples include data on import detentions (for example as is available for the EU and US), analysis of trade flows, official
10 For more information, see STDF (2011) SPS-related Capacity Evaluation Tools: An overview of
tools developed by international organizations. Available at: http://www.standardsfacility.org/Files/Publications/STDF_Capacity_Evaluation_Tools_Eng.pdf
27
restrictions/actions in export markets (for example bans), reports from exporters of import problems, etc. A key challenge with some of these indicators, however, is isolating the impact of SPS compliance issues from other trade impediments. Thus, it may be necessary to consider a number of these potential indicators side-by-side; for example trade flows alongside inventories of SPS requirements and other non-tariff measures, such as those being developed by the International Trade Centre (ITC) or available through UNCTAD's TRAINS database. In some cases, for example trends in border detentions, care must also be taken in interpretation because of uncertainties over the direction of causality.
82. Many of the compliance- and trade-based indicators in Table 1 are readily available for countries that engage in trade, for example with the EU and/or US. Most developing countries, however, do not systematically gather and analyse this information. While there are capacity-based indicators for many developing countries, predominantly these remain ad hoc and have employed inconsistent methods. The initiatives of FAO, OIE and IPPC in establishing a common framework for such assessments is a major improvement in this regard, although inconsistencies across these frameworks require that care is needed in comparing and contrasting the resulting needs assessments.
83. Many of the indicators in Table 1 are ex post pointers to weaknesses in SPS capacity, while developing countries are largely passive in directing what information is or is not gathered. Certainly, there is a need for more ex ante information, such as is provided by capacity-based indicators; clearly, it is better to identify and address capacity weaknesses before trade problems begin to arise. Further, developing countries need to be more active themselves in gathering information on capacity needs in a proactive manner, for example by undertaking regular consultations with exporters, either individually or through trade associations. With proactivity tends to come a greater voice in relations with bilateral and multilateral donors (Henson and Jaffee, 2008), such that technical assistance can be more demand rather than supply driven.
84. The challenge in defining the choice set of potential SPS capacity building needs is to gather and interpret the information provided by the various indicators. A key principle in using this information is to employ triangulation; ensure that multiple indicators point to the same capacity needs in order to avoid being driven by false information and to offset the weaknesses of individual indicators. Broadly, a decision-maker can be confident that a substantive capacity need exists if this is highlighted by indicators within and across the three broad categories in Table 1. Use of multiple indicators helps to prevent the definition of the choice set from being driven excessively by interest groups that are more vocal and/or politically influential. It also guards against perceptual bias on the part of the observer (Kolstad and Wiig, 2002); for example, perspectives on priorities for SPS capacity building will be quite different between a microbiologist and an entomologist, or between a government official and an exporter.
85. Both the compliance and trade-based indicators in Table 1 will generally be missing for countries that do not have established exports of a particular commodity, but do have aspirations of becoming an exporter. Thus, for example, detention data is only created when a product consignment is exported and fails an instance of border inspection. While capacity-based indicators may be available for such cases, it can be difficult to relate these to potential export performance; latent exports can be constrained by a multitude of factors, including transport infrastructure, production efficiency and SPS capacity, and care must be taken not to over-attribute potential exports to SPS issues.
28
86. Too often the tendency of SPS needs assessment exercises is to produce lengthy "shopping lists" of capacity building requirements, or at least identify needs that exceed available resources. While the choice set defined prior to economic analysis should aim to include all potentially feasible capacity building options, very quickly many forms of economic analysis can become unwieldy if a large number of options are presented. In such instances, either a form of economic analysis that can handle large numbers of option should be employed, such as MCDA, or the initial choice set may need to be "sifted" and/or prioritised in order to define a more limited number of options that is amenable to analysis using, for example, CBA.
3.5.2 Stage 2: Compile information cards
87. Having identified the SPS capacity building options to be considered, the next stage is to define the criteria against which these options will be compared and the compilation of this information on cards. In economic analysis, as we have seen above, it is normal to delineate the costs and benefits of each option. For each criterion measurements then need to be derived with respect to each option relative to a defined "calculation base" (Krieger et al., 2007). This "calculation base" should reflect the "state of the world" over time given that a particular option is not undertaken, reflecting the fact that change is likely to happen regardless of whether the option is implemented or not. The challenge here is to separate out the impact of each option on a particular criterion from all other influences, such that over-attribution is avoided. For example, exports from a particular developing country might expand even in the absence of investments in SPS capacity enhancement. In the event that such investments are made, care needs to be taken to identify the incremental impact of enhanced SPS capacity on observed export growth. Attributing all of the observed export growth to the enhancement of SPS capacity would over-estimate its impact.
88. The costs associated with planning, implementing, operating and maintaining a particular enhancement in SPS capacity include non-recurring investments and recurring costs (Wilson and Henson, 2002). In order to identify these costs it is necessary to examine the specific nature of the SPS capacity that is being created or enhanced, or alternatively the gaps in current capacity that are being "plugged" and which might have been defined by a published needs assessment (see above). Key elements of capacity building include the following (Kolstad and Wiig, 2002; Wilson and Henson, 2002):
(a) Institutional/administrative structures: Regulations and rules reflecting current scientific understanding and international commitments, a system of enforcement with sanctions for non-compliance, clearly delineated administrative responsibilities between separate departments and agencies of government, effective communication and coordination of efforts between departments and agencies, transparency in the processes by which regulations and rules are developed, implemented and enforced.
(b) Regulatory controls: Systems for registration and control of the production, distribution and use of agricultural inputs that pose a risk to food safety or plant and animal health. Systems for verifying and certifying the status of food and agricultural products and the origin, nature and quality of biological materials. Capacity for tracing products through the supply chain, diagnosing pests and diseases and appropriate quarantine and eradication procedures.
(c) Technical infrastructure: Includes laboratory facilities for testing, surveillance and research activities, production and processing establishments for which
29
hygienic controls can be implemented effectively, coordinated and well-functioning supply chains, computer facilities and access to the Internet.
(d) Human capital: Includes scientific and technical expertise and experience in methods of surveillance, testing and control, risk assessment and other elements of risk analysis, and methods of hygienic control, research capabilities, and the legal and administrative knowledge to implement and enforce regulations and other rules. In turn, this requires appropriate teaching, training and research capacity.
(e) Information dissemination: Procedures for utilizing epidemiological information in decision making with respect to SPS controls in domestic production.
(f) Surveillance and monitoring: Epidemiological surveillance and monitoring of new and emerging hazards.
89. In turn, the specific actions and investments necessary to achieve the desired SPS capacity need to be identified and the associated costs quantified to the extent possible. Figure 2 provides a very simple framework to aid this process (World Bank, 2002).
90. In undertaking this process of cost assessment various sources of information can be employed from educated guesses, ad hoc consultations or surveys of national and/or international experts, extrapolations from published studies, firm/farm-level surveys and/or econometric modelling. In many developing countries there is a paucity of data, while the collection and analysis of new data is a costly and time-intensive process. This may require that the precision and/or reliability of cost estimates have to be compromised, for example due to local resource constraints. Certainly, before engaging in costly exercises to derive more rigorous cost estimates, for example using relatively complicated econometric modelling, it is worth proceeding with a first round of economic analysis to ascertain the extent to which the derived ranking of capacity building options is sensitive to the level of compliance costs; if one option is so dominant, perhaps because of the magnitude of the associated benefits, more precise cost estimates may have little or no impact on the eventual ranking.
91. The cost of each capacity building option can conceivably be measured using a variety of metrics (see below), which will reflect in turn the level and precision of information available. It must be recognised, however, that CBA, CEA and the various forms of MCDA vary in their ability to cope with particular types of data, and with variation in forms of measurement across decision criteria. Broadly, CBA is the least flexible of these methods; it essentially requires that both costs and benefits are specified in continuous monetary terms. At the other extreme, some forms of MCDA (such as outranking) are able to deal simultaneously with a range of data types, even including discrete variables. The implication is that choices at this stage in the analysis as to how the cost and/or benefit criteria are measured will constrain which economic analysis approach is employed.
92. Broadly, the identification of benefits and their quantification can follow the same approach as described for costs above. From the outset, however, it is important to define the scope of the analysis. Taking a narrow view, the analysis could focus on the effects on export performance of options for improvements in SPS capacity, for example as proposed in the framework developed by Kolstad and Wiig (2002). Given that changes in export flows are generally specified in monetary units, CBA can be applied in such instances with relative ease. If the focus is broader and includes both the direct (for example changes in export performance) and indirect (for example effects on the livelihood of small-scale producers) impacts of SPS
30
capacity improvements, as focused on here, a MCDA framework is needed. This reflects the fact that differing impacts will necessarily have to be measured using distinct metrics, aside from the limitations of data availability and quality discussed above. For example, many of these impacts are not conducive to measurement in monetary terms (for example changes in the numbers of small-scale producers). The only way around this problem using CBA is to measure impacts in welfare terms using econometric modelling (see for example (Randolph et al., 2002). While welfare-based analysis provides arguably the best overall picture of the economic impacts of improvements in SPS capacity, it is highly data intensive and the results are often not immediately intuitive to decision-makers.
93. Table 2 itemises the main benefits/impacts of improvements in SPS capacity within the broad categories of trade impacts, direct domestic impacts and livelihood impacts. Some indicators relate to the absolute magnitude of the sectors impacted, number of producers etc., while others relate to expected changes brought about through capacity building. Table 2 can be used as a checklist to guide thinking as to the likely impacts of specific improvements in SPS capacity, but at the same time thought needs to be given to other impacts that might be significant in specific contexts. In assessing the potential impacts, care needs to be taken both to avoid over-attribution and to include spill-over effects. For example, numerous factors may explain future export flows and these factors must be taken into account when predicting the impact of a particular improvement in SPS capacity. At the same time, while a particular investment may be focused on a rather specific weakness in SPS capacity (for example pesticide residue analysis for fresh fruits and vegetables), the associated infrastructure may be of benefit more widely (for example for pesticide residue analysis in cereal products and/or analysis of other chemical contaminants in a range of food products). It can be difficult to envisage some of these spill-over effects ex ante, and certainly the temptation to over-estimate in order "to be safe" should be avoided. At the minimum, the potential for over-attribution and/or under-estimation of spill-over effects should be noted and taken into consideration when interpreting the final results.
94. Given the potentially broad range of cost and benefits incorporated into the analysis, it is important to contextualize the various measurement instruments that might be used. There are four main categories: discrete variables; ordinal scales; count data; and continuous measures (Henson et al., 2007). Each is described in turn below.
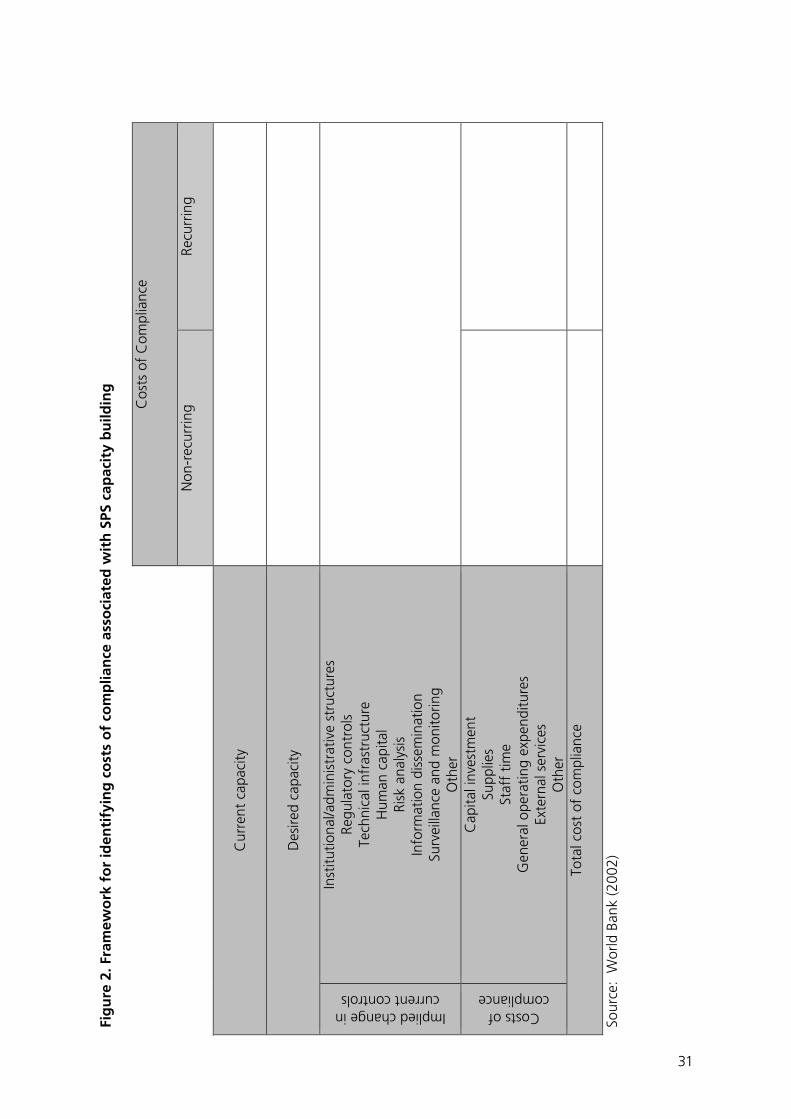
31
Fig
ure
2. F
ram
ewo
rk f
or
iden
tify
ing
co
sts
of
com
plia
nce
ass
oci
ated
wit
h S
PS c
apac
ity
bu
ildin
g
Cos
ts o
f C
ompl
ianc
e
Non
-rec
urrin
g
Recu
rrin
g
C
urre
nt c
apac
ity
D
esire
d ca
paci
ty
Implied change in current controls
Inst
itutio
nal/a
dmin
istr
ativ
e st
ruct
ures
Re
gula
tory
con
trol
s Te
chni
cal i
nfra
stru
ctur
e H
uman
cap
ital
Risk
ana
lysi
s In
form
atio
n di
ssem
inat
ion
Surv
eilla
nce
and
mon
itorin
g O
ther
Costs of compliance
Cap
ital i
nves
tmen
t Su
pplie
s St
aff
time
Gen
eral
ope
ratin
g ex
pend
iture
s Ex
tern
al s
ervi
ces
Oth
er
Tota
l cos
t of
com
plia
nce
Sour
ce:
Wor
ld B
ank
(200
2)
31
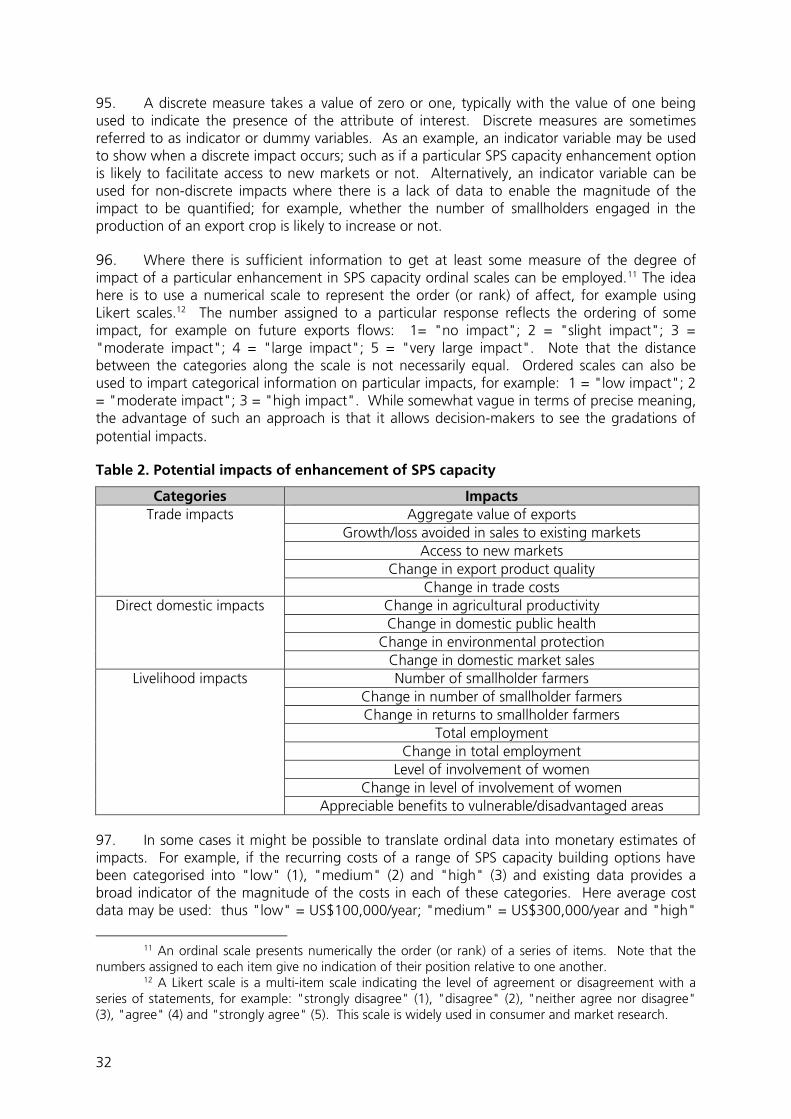
32
95. A discrete measure takes a value of zero or one, typically with the value of one being used to indicate the presence of the attribute of interest. Discrete measures are sometimes referred to as indicator or dummy variables. As an example, an indicator variable may be used to show when a discrete impact occurs; such as if a particular SPS capacity enhancement option is likely to facilitate access to new markets or not. Alternatively, an indicator variable can be used for non-discrete impacts where there is a lack of data to enable the magnitude of the impact to be quantified; for example, whether the number of smallholders engaged in the production of an export crop is likely to increase or not.
96. Where there is sufficient information to get at least some measure of the degree of impact of a particular enhancement in SPS capacity ordinal scales can be employed.11 The idea here is to use a numerical scale to represent the order (or rank) of affect, for example using Likert scales.12 The number assigned to a particular response reflects the ordering of some impact, for example on future exports flows: 1= "no impact"; 2 = "slight impact"; 3 = "moderate impact"; 4 = "large impact"; 5 = "very large impact". Note that the distance between the categories along the scale is not necessarily equal. Ordered scales can also be used to impart categorical information on particular impacts, for example: 1 = "low impact"; 2 = "moderate impact"; 3 = "high impact". While somewhat vague in terms of precise meaning, the advantage of such an approach is that it allows decision-makers to see the gradations of potential impacts.
Table 2. Potential impacts of enhancement of SPS capacity
Categories Impacts Aggregate value of exports
Growth/loss avoided in sales to existing markets Access to new markets
Change in export product quality
Trade impacts
Change in trade costs Change in agricultural productivity Change in domestic public health
Change in environmental protection
Direct domestic impacts
Change in domestic market sales Number of smallholder farmers
Change in number of smallholder farmers Change in returns to smallholder farmers
Total employment Change in total employment
Level of involvement of women Change in level of involvement of women
Livelihood impacts
Appreciable benefits to vulnerable/disadvantaged areas
97. In some cases it might be possible to translate ordinal data into monetary estimates of impacts. For example, if the recurring costs of a range of SPS capacity building options have been categorised into "low" (1), "medium" (2) and "high" (3) and existing data provides a broad indicator of the magnitude of the costs in each of these categories. Here average cost data may be used: thus "low" = US$100,000/year; "medium" = US$300,000/year and "high"
11 An ordinal scale presents numerically the order (or rank) of a series of items. Note that the
numbers assigned to each item give no indication of their position relative to one another. 12 A Likert scale is a multi-item scale indicating the level of agreement or disagreement with a
series of statements, for example: "strongly disagree" (1), "disagree" (2), "neither agree nor disagree" (3), "agree" (4) and "strongly agree" (5). This scale is widely used in consumer and market research.
33
= US$1, 000,000/year. Alternatively, where quite detailed information on non-recurring costs exists a probability distribution function of costs or their measures of distribution (namely the expected value combined with the variance or the standard deviation) can be employed (Krieger et al., 2007). This would allow the determination of probabilities for ranges of non-recurring costs.
98. The third category of measurement of the impacts of options for SPS capacity building is count data. Examples include the number of small-scale producers and the number of persons employed in associated value chains.
99. Finally, continuous measures can be used to capture measures such as value, volume, ratios, percentage changes, etc. Examples include the estimated non-recurring and/or recurring costs of SPS capacity enhancements, absolute value or percentage changes in predicted export flows and the average change in producers incomes engaged in associated value chains. Where costs and/or benefits are expressed in monetary units flow over time, these can (and should) be collapsed to a single net present value (NPV) using an appropriate discount rate.13
100. While analytically count and continuous data are most desirable, in an attempt to make the framework easier to use and/or communicate, counts or continuous variables can be mapped onto ordinal scales. For example, rather than report the absolute value of predicted increases in exports to existing markets, one might take this value and develop three levels, for example low, medium and high. Indeed, development of such categorical maps makes it much easier to make comparison across options where there are appreciable differences in the available information on which to appraise costs and benefits.
101. Having compiled information on the costs and impacts of each of the capacity building options under consideration, given the chosen scope of the analysis to be undertaken, these data should be compiled onto a series of information cards (as described in Henson et al. (2007). One card should be prepared for each of the options under consideration such that all of the pertinent data are brought together in a manner that enables a relatively quick scan of its characteristics to be undertaken. The information on these cards is not analysed or processed in any way, and no attempt is made to aggregate across the decision criteria. At this stage, decision-makers may choose to exclude certain options because they violate a particular acceptance threshold. For example, the non-recurring costs may exceed available resources. Thus, the information cards bring together information on all of the decision criteria into one place and on a "level playing field", striving to increase the consistency with which each of the criteria are internalised and considered by decision-makers (Henson et al., 2007). However, in and of themselves the information cards do not facilitate trade-offs between decision criteria except on the basis of "gut instinct" or simple "rules of thumb".
102. Table 3 provides an illustrative example of four SPS capacity building options with measures of the costs and impacts that variously employ the four types of data described above:
(a) Option 1: Low-cost intervention that is predicted to have a small to moderate impact on sales to existing export markets and not to facilitate exports to new markets, but is anticipated to increase substantially the number of small-scale producers engaged in the supply of the target commodity and have a significant impact on poverty. Produces appreciable benefits in vulnerable/disadvantaged areas.
13 The discount rate is used to reflect the time value of a flow of money at various points over
time, for example in calculating the NPV (see previous footnote).
34
(b) Option 2: A low to medium-cost intervention that is expected to have a relatively small impact on exports to existing markets and does not facilitate access to new markets. Has a moderate impact on poverty through sizeable increases in the number of smallholders and through employment. Of all the options, this one has the greatest impact on the involvement of women. Boosts domestic public health through improvements in food safety and has appreciable benefits in vulnerable/disadvantaged areas.
(c) Option 3: A moderate-cost intervention that has little impact on sales to existing export markets but does open up access to new markets. Has the least impact on poverty of all of the options, reflected in the fact that there is no change in the level of employment and negligible growth in numbers of smallholders engaged in the supply of the target commodity.
(d) Option 4: A high-cost intervention that is expected to result in significant increases in sales to existing export markets and to facilitate access to new markets. Boosts domestic agricultural productivity and has a moderate impact on poverty, predominantly through employment. Of all the options, this has the greatest impact on domestic sales.
103. In describing later stages of the economic evaluation process below, these data are employed to provide worked examples.
3.5.3 Stage 3: Construct spider diagrams
104. To provide a more visual characterisation of differences in the costs and benefits of each of the capacity building options, the data on the information cards is next mapped onto spider diagrams. These diagrams present a graphical profile of each of the options with respect to the individual decision criteria. In turn, this provides a mechanism to consider, visualise and better compare the costs and benefits of each of the options under consideration.
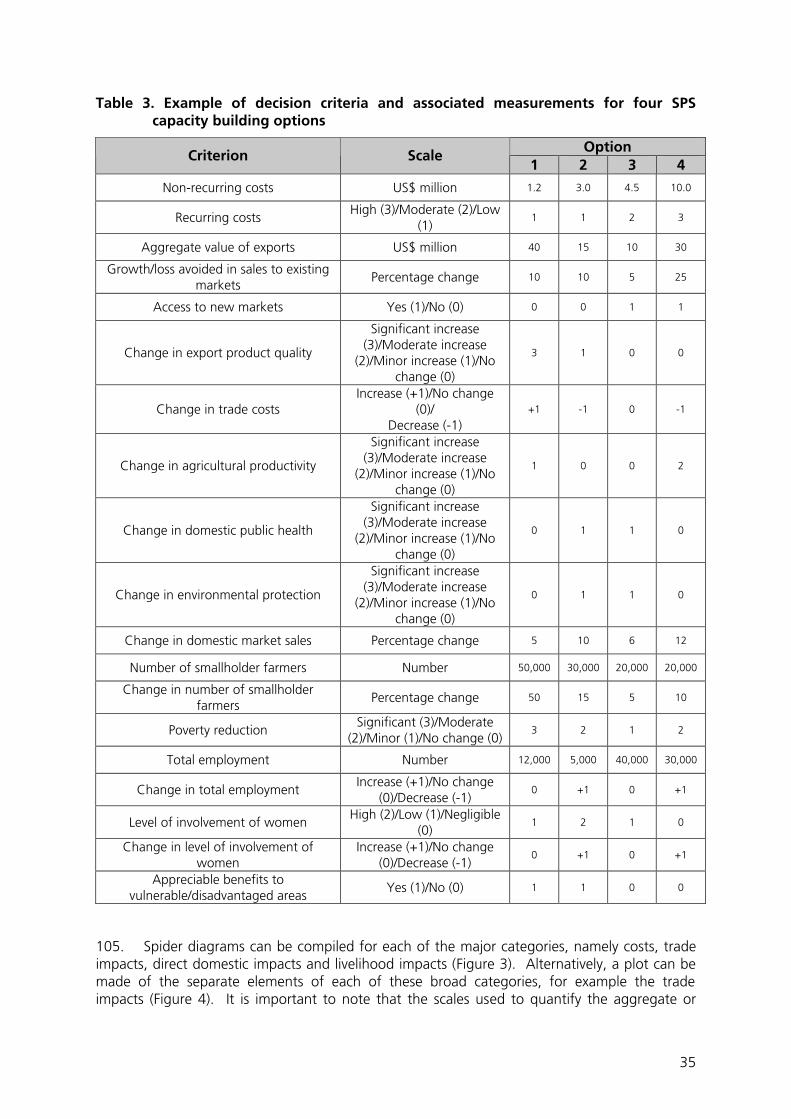
35
Table 3. Example of decision criteria and associated measurements for four SPS capacity building options
Option Criterion Scale
1 2 3 4
Non-recurring costs US$ million 1.2 3.0 4.5 10.0
Recurring costs High (3)/Moderate (2)/Low
(1) 1 1 2 3
Aggregate value of exports US$ million 40 15 10 30
Growth/loss avoided in sales to existing markets
Percentage change 10 10 5 25
Access to new markets Yes (1)/No (0) 0 0 1 1
Change in export product quality
Significant increase (3)/Moderate increase
(2)/Minor increase (1)/No change (0)
3 1 0 0
Change in trade costs Increase (+1)/No change
(0)/ Decrease (-1)
+1 -1 0 -1
Change in agricultural productivity
Significant increase (3)/Moderate increase
(2)/Minor increase (1)/No change (0)
1 0 0 2
Change in domestic public health
Significant increase (3)/Moderate increase
(2)/Minor increase (1)/No change (0)
0 1 1 0
Change in environmental protection
Significant increase (3)/Moderate increase
(2)/Minor increase (1)/No change (0)
0 1 1 0
Change in domestic market sales Percentage change 5 10 6 12
Number of smallholder farmers Number 50,000 30,000 20,000 20,000
Change in number of smallholder farmers
Percentage change 50 15 5 10
Poverty reduction Significant (3)/Moderate
(2)/Minor (1)/No change (0) 3 2 1 2
Total employment Number 12,000 5,000 40,000 30,000
Change in total employment Increase (+1)/No change
(0)/Decrease (-1) 0 +1 0 +1
Level of involvement of women High (2)/Low (1)/Negligible
(0) 1 2 1 0
Change in level of involvement of women
Increase (+1)/No change (0)/Decrease (-1)
0 +1 0 +1
Appreciable benefits to vulnerable/disadvantaged areas
Yes (1)/No (0) 1 1 0 0
105. Spider diagrams can be compiled for each of the major categories, namely costs, trade impacts, direct domestic impacts and livelihood impacts (Figure 3). Alternatively, a plot can be made of the separate elements of each of these broad categories, for example the trade impacts (Figure 4). It is important to note that the scales used to quantify the aggregate or
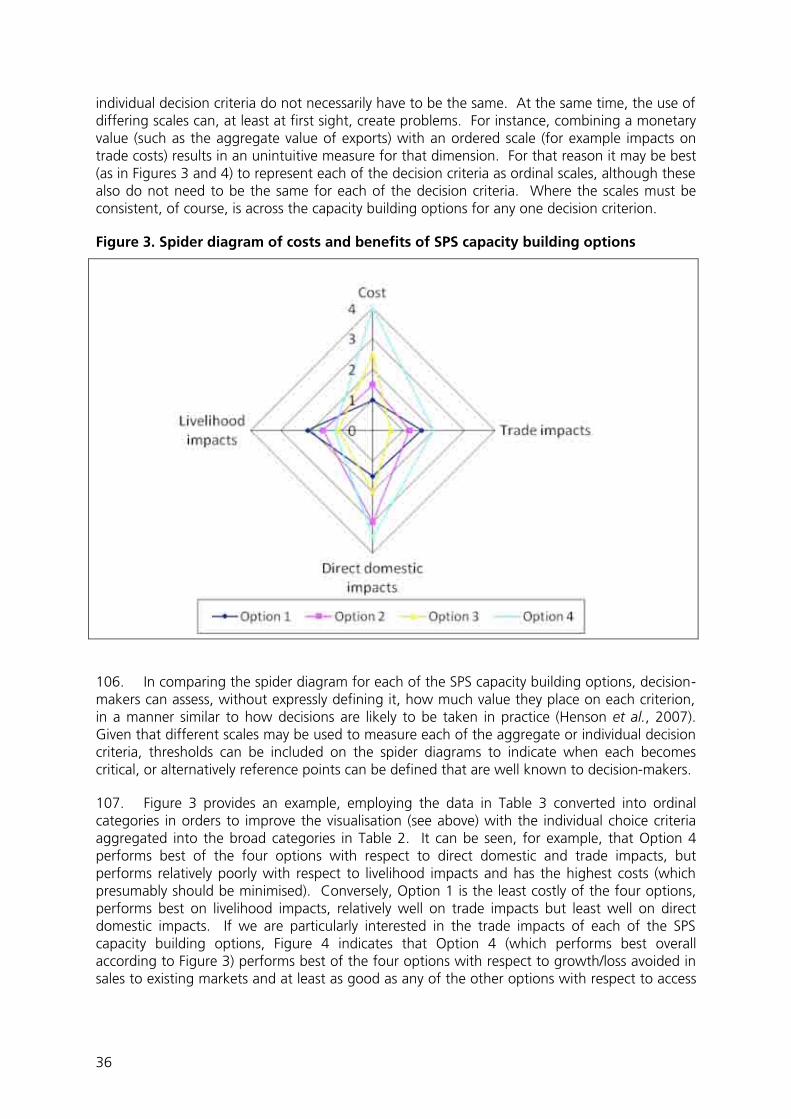
36
individual decision criteria do not necessarily have to be the same. At the same time, the use of differing scales can, at least at first sight, create problems. For instance, combining a monetary value (such as the aggregate value of exports) with an ordered scale (for example impacts on trade costs) results in an unintuitive measure for that dimension. For that reason it may be best (as in Figures 3 and 4) to represent each of the decision criteria as ordinal scales, although these also do not need to be the same for each of the decision criteria. Where the scales must be consistent, of course, is across the capacity building options for any one decision criterion.
Figure 3. Spider diagram of costs and benefits of SPS capacity building options
106. In comparing the spider diagram for each of the SPS capacity building options, decision-makers can assess, without expressly defining it, how much value they place on each criterion, in a manner similar to how decisions are likely to be taken in practice (Henson et al., 2007). Given that different scales may be used to measure each of the aggregate or individual decision criteria, thresholds can be included on the spider diagrams to indicate when each becomes critical, or alternatively reference points can be defined that are well known to decision-makers.
107. Figure 3 provides an example, employing the data in Table 3 converted into ordinal categories in orders to improve the visualisation (see above) with the individual choice criteria aggregated into the broad categories in Table 2. It can be seen, for example, that Option 4 performs best of the four options with respect to direct domestic and trade impacts, but performs relatively poorly with respect to livelihood impacts and has the highest costs (which presumably should be minimised). Conversely, Option 1 is the least costly of the four options, performs best on livelihood impacts, relatively well on trade impacts but least well on direct domestic impacts. If we are particularly interested in the trade impacts of each of the SPS capacity building options, Figure 4 indicates that Option 4 (which performs best overall according to Figure 3) performs best of the four options with respect to growth/loss avoided in sales to existing markets and at least as good as any of the other options with respect to access
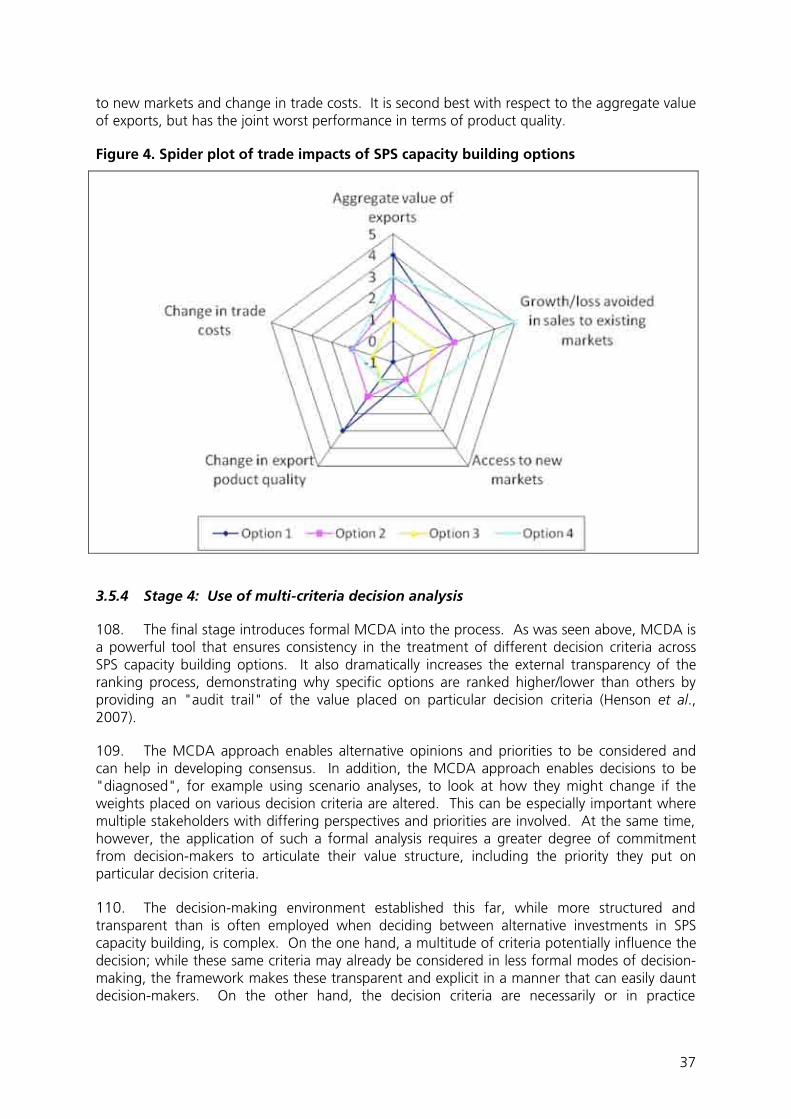
37
to new markets and change in trade costs. It is second best with respect to the aggregate value of exports, but has the joint worst performance in terms of product quality.
Figure 4. Spider plot of trade impacts of SPS capacity building options
3.5.4 Stage 4: Use of multi-criteria decision analysis
108. The final stage introduces formal MCDA into the process. As was seen above, MCDA is a powerful tool that ensures consistency in the treatment of different decision criteria across SPS capacity building options. It also dramatically increases the external transparency of the ranking process, demonstrating why specific options are ranked higher/lower than others by providing an "audit trail" of the value placed on particular decision criteria (Henson et al., 2007).
109. The MCDA approach enables alternative opinions and priorities to be considered and can help in developing consensus. In addition, the MCDA approach enables decisions to be "diagnosed", for example using scenario analyses, to look at how they might change if the weights placed on various decision criteria are altered. This can be especially important where multiple stakeholders with differing perspectives and priorities are involved. At the same time, however, the application of such a formal analysis requires a greater degree of commitment from decision-makers to articulate their value structure, including the priority they put on particular decision criteria.
110. The decision-making environment established this far, while more structured and transparent than is often employed when deciding between alternative investments in SPS capacity building, is complex. On the one hand, a multitude of criteria potentially influence the decision; while these same criteria may already be considered in less formal modes of decision-making, the framework makes these transparent and explicit in a manner that can easily daunt decision-makers. On the other hand, the decision criteria are necessarily or in practice
38
measured in different units, as we have seen above. This means that developing a single measure or metric to use in prioritising the capacity building options under consideration, as with CBA for example, is problematic. At the same time, while no single metric is clearly preferred, the results could be sensitive to the metric that is chosen.
111. Different MCDA methods have been developed to contend with these problems (Baker et al., 2001). Here two methods that appear particularly useful in this context are considered, namely multi-attribute utility theory (MAUT) and outranking analysis, both of which are discussed below drawing on Henson et al. (2007).
Method 1: MAUT
112. MAUT is a convenient means to aggregate across different decision criteria in a MCDA setting and especially useful when the criteria are measured in different units or dimensions. Broadly, MAUT consists of the following steps:
(a) Determine the set of criteria that affect the decision.
(b) Determine the weight to be assigned to each decision factor. These can be thought of as importance weights and will be the same for any criterion across all options being considered.
(c) Develop a utility function for each criterion, for example from published information, stakeholder consultations and/or surveys. Each criterion's utility function transforms the criterion's value (however it is measured) into a utility score bound between zero and one. Utility functions can be increasing or decreasing in the value of the relevant factor.
(d) For each option, calculate each criterion's utility score based on its value for the respective option.
(e) Use the weights defined in Step 2 to calculate an overall utility score for each option as a weighted sum over each criterion's individual utility score.
(f) Compare the options and choose that with the highest score.
113. MAUT can be applied when there are many different criteria and options to consider, as is the case with broad assessments of SPS capacity building needs. Moreover, the weights and shape of the utility function can be constructed to reflect objective information and subjectively held information/beliefs. It should be noted, however, where the data are uncertain and/or ordinal use of MAUT can be problematic (Kangas et al., 2001) and in these instances methods such as outranking are arguably more applicable.
Method 2: Outranking methods
114. Outranking methods (Brans et al., 1986; Roy, 1996) represent a different school of thought with respect to MCDA. These methods are based on the principles of pair-wise comparison. Unlike MAUT, they do not try to develop an overall utility function. Rather the performance of each option with respect to a particular criterion is compared to the other options under consideration using the particular scale applied to that criterion. It should be noted that, given the pair-wise comparison nature of the approach, outranking is most suited to problems with discrete choices. Thus, in the context of SPS capacity building, it is best employed to simple yes/no decisions with respect to the various options being considered.
39
115. With outranking methods an alternative "a" outranks another alternative "b" if, taking into account the preferences of the decision-maker and the performance of "a" across all of the defined criteria, there is a strong enough argument that "a" is at least as good as "b" and no strong argument to the contrary. There are two main families of outranking methods, namely ELECTRE (Roy, 1990) and PROMETHEE (Brans and Vincke, 1985). The primary difference between the two is in their incorporation of decision-maker preferences into the problem and the synthesis of the individual outranking relationships across all the criteria in order to provide a measure of the strength of the argument in favour of one option versus another.
116. Outranking approaches have an advantage over other MCDA methods in that they more closely resemble actual decision-making processes and, as a result, are generally easier to operationalise within a community of decision-makers that is not well accustomed to formal decision analysis approaches. For example, outranking methods do not force the translation of the different scales and units of measurement employed for separate decision criteria into a single common (utility) measure for the purposes of comparing the options. Rather, outranking approaches focus on comparing options within each criterion.
117. The development of utility functions that apply across criteria, which is central to MAUT, can be difficult to achieve in practice. Conversely, outranking approaches (and PROMETHEE in particular) requires the decision-maker to articulate only their preferences with respect to each of the criteria used to compare the options. Further, outranking approaches are not compensatory; unlike MAUT they do not allow particularly poor performance in one criterion to be compensated for by exceptionally strong performance in another criterion.
118. There are several distinct steps to implementation of the PROMETHEE approach:
(a) Identify the set of options to be considered.
(b) Define the criteria against which the options will be compared.
(c) Describe and score the expected performance of each option with respect to each criterion.
(d) Determine the preference relationships. First, how much better an option has to be with respect to a particular certain criteria in order for it to be considered "better" than an alternative. Second, the importance of each of the criteria in the particular decision context.
(e) Assign weights to each of the decision criteria to reflect their relative importance in the decision.
(f) Rank the alternatives by conducting pair-wise comparisons within the criteria and producing the overall ranking across the entire matrix by applying the appropriate algorithms.
119. In practice, employing the PROMOTHEE approach where there are a number of criteria and options is laborious. However, software packages are available that are relatively easy to use and can quickly provide a ranking of options as well as comparative information on the performance of each option with respect to the individual decision criteria.
120. Below we apply the hypothetical four options described above (see Table 3) to demonstrate the utility of the PROMETHEE method to aid decision-making in the context of SPS
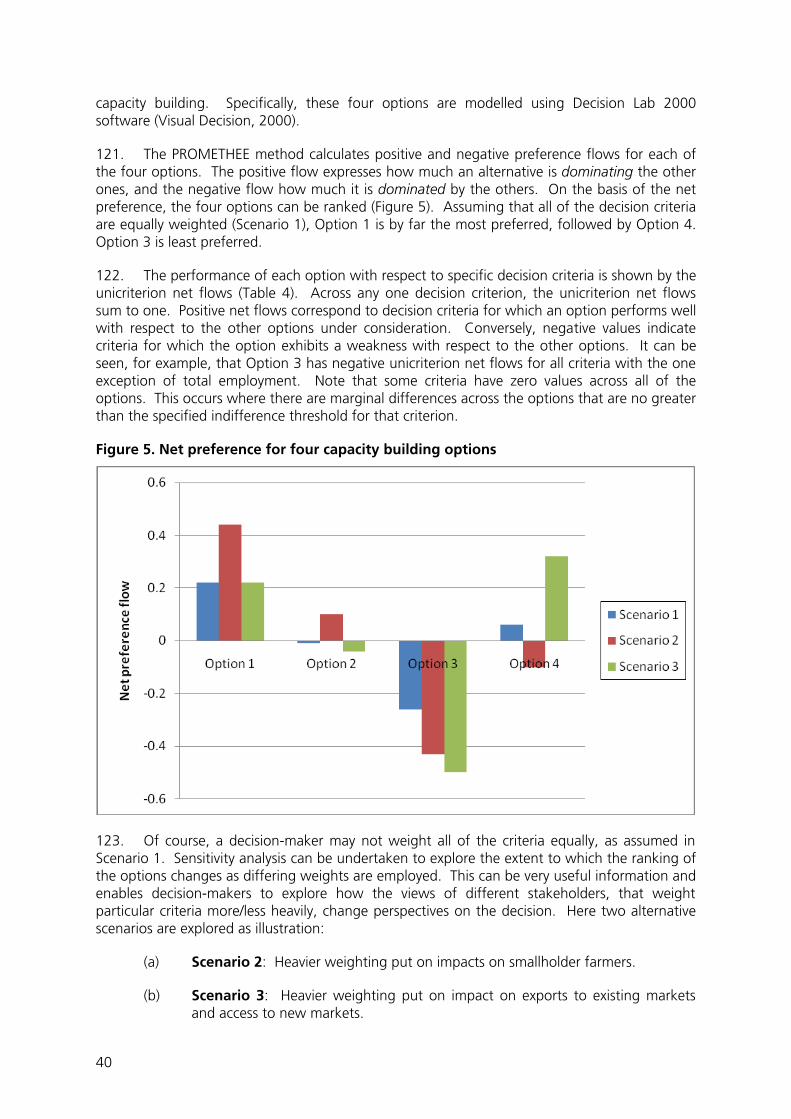
40
capacity building. Specifically, these four options are modelled using Decision Lab 2000 software (Visual Decision, 2000).
121. The PROMETHEE method calculates positive and negative preference flows for each of the four options. The positive flow expresses how much an alternative is dominating the other ones, and the negative flow how much it is dominated by the others. On the basis of the net preference, the four options can be ranked (Figure 5). Assuming that all of the decision criteria are equally weighted (Scenario 1), Option 1 is by far the most preferred, followed by Option 4. Option 3 is least preferred.
122. The performance of each option with respect to specific decision criteria is shown by the unicriterion net flows (Table 4). Across any one decision criterion, the unicriterion net flows sum to one. Positive net flows correspond to decision criteria for which an option performs well with respect to the other options under consideration. Conversely, negative values indicate criteria for which the option exhibits a weakness with respect to the other options. It can be seen, for example, that Option 3 has negative unicriterion net flows for all criteria with the one exception of total employment. Note that some criteria have zero values across all of the options. This occurs where there are marginal differences across the options that are no greater than the specified indifference threshold for that criterion.
Figure 5. Net preference for four capacity building options
123. Of course, a decision-maker may not weight all of the criteria equally, as assumed in Scenario 1. Sensitivity analysis can be undertaken to explore the extent to which the ranking of the options changes as differing weights are employed. This can be very useful information and enables decision-makers to explore how the views of different stakeholders, that weight particular criteria more/less heavily, change perspectives on the decision. Here two alternative scenarios are explored as illustration:
(a) Scenario 2: Heavier weighting put on impacts on smallholder farmers.
(b) Scenario 3: Heavier weighting put on impact on exports to existing markets and access to new markets.
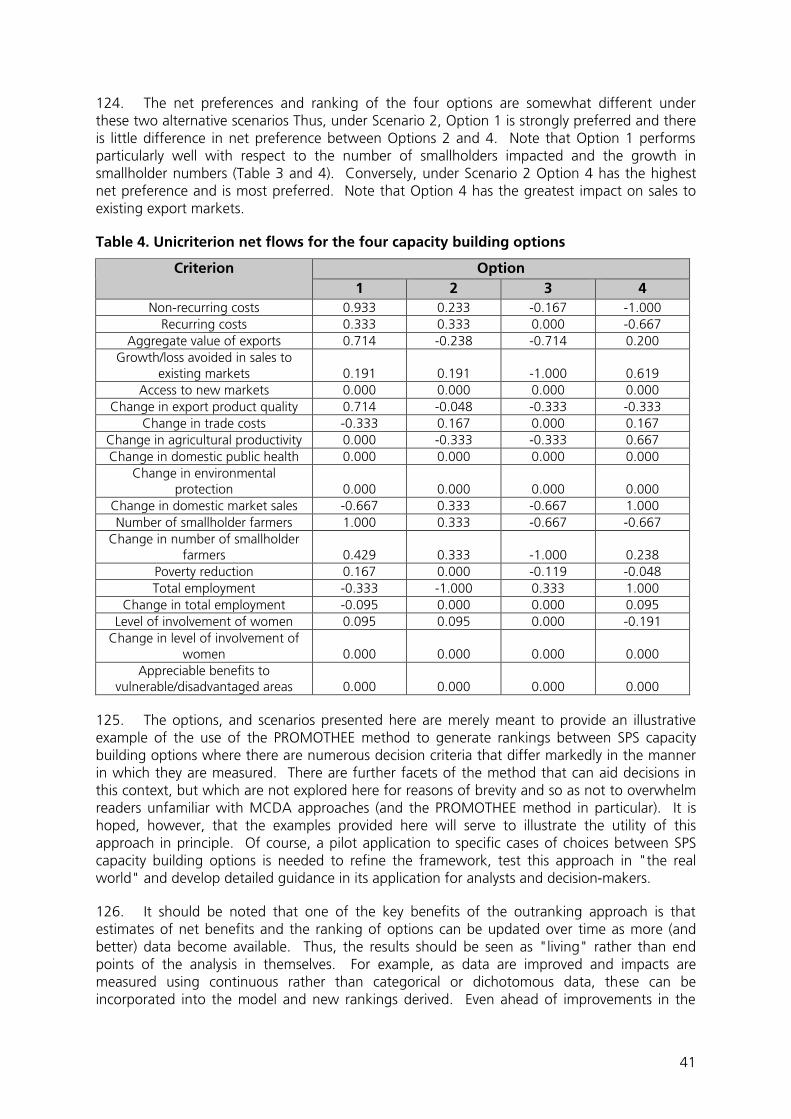
41
124. The net preferences and ranking of the four options are somewhat different under these two alternative scenarios Thus, under Scenario 2, Option 1 is strongly preferred and there is little difference in net preference between Options 2 and 4. Note that Option 1 performs particularly well with respect to the number of smallholders impacted and the growth in smallholder numbers (Table 3 and 4). Conversely, under Scenario 2 Option 4 has the highest net preference and is most preferred. Note that Option 4 has the greatest impact on sales to existing export markets.
Table 4. Unicriterion net flows for the four capacity building options
Option Criterion 1 2 3 4
Non-recurring costs 0.933 0.233 -0.167 -1.000 Recurring costs 0.333 0.333 0.000 -0.667
Aggregate value of exports 0.714 -0.238 -0.714 0.200 Growth/loss avoided in sales to
existing markets 0.191 0.191 -1.000 0.619 Access to new markets 0.000 0.000 0.000 0.000
Change in export product quality 0.714 -0.048 -0.333 -0.333 Change in trade costs -0.333 0.167 0.000 0.167
Change in agricultural productivity 0.000 -0.333 -0.333 0.667 Change in domestic public health 0.000 0.000 0.000 0.000
Change in environmental protection 0.000 0.000 0.000 0.000
Change in domestic market sales -0.667 0.333 -0.667 1.000 Number of smallholder farmers 1.000 0.333 -0.667 -0.667
Change in number of smallholder farmers 0.429 0.333 -1.000 0.238
Poverty reduction 0.167 0.000 -0.119 -0.048 Total employment -0.333 -1.000 0.333 1.000
Change in total employment -0.095 0.000 0.000 0.095 Level of involvement of women 0.095 0.095 0.000 -0.191
Change in level of involvement of women 0.000 0.000 0.000 0.000
Appreciable benefits to vulnerable/disadvantaged areas 0.000 0.000 0.000 0.000
125. The options, and scenarios presented here are merely meant to provide an illustrative example of the use of the PROMOTHEE method to generate rankings between SPS capacity building options where there are numerous decision criteria that differ markedly in the manner in which they are measured. There are further facets of the method that can aid decisions in this context, but which are not explored here for reasons of brevity and so as not to overwhelm readers unfamiliar with MCDA approaches (and the PROMOTHEE method in particular). It is hoped, however, that the examples provided here will serve to illustrate the utility of this approach in principle. Of course, a pilot application to specific cases of choices between SPS capacity building options is needed to refine the framework, test this approach in "the real world" and develop detailed guidance in its application for analysts and decision-makers.
126. It should be noted that one of the key benefits of the outranking approach is that estimates of net benefits and the ranking of options can be updated over time as more (and better) data become available. Thus, the results should be seen as "living" rather than end points of the analysis in themselves. For example, as data are improved and impacts are measured using continuous rather than categorical or dichotomous data, these can be incorporated into the model and new rankings derived. Even ahead of improvements in the
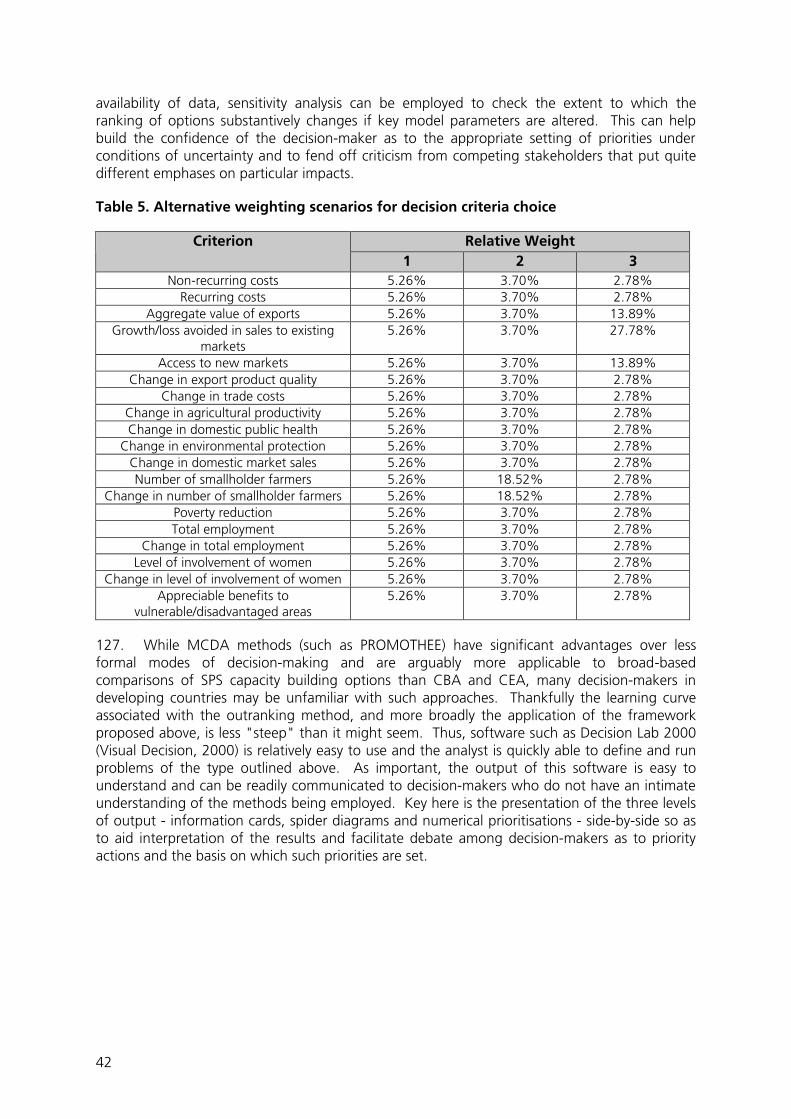
42
availability of data, sensitivity analysis can be employed to check the extent to which the ranking of options substantively changes if key model parameters are altered. This can help build the confidence of the decision-maker as to the appropriate setting of priorities under conditions of uncertainty and to fend off criticism from competing stakeholders that put quite different emphases on particular impacts.
Table 5. Alternative weighting scenarios for decision criteria choice
Relative Weight Criterion 1 2 3
Non-recurring costs 5.26% 3.70% 2.78% Recurring costs 5.26% 3.70% 2.78%
Aggregate value of exports 5.26% 3.70% 13.89% Growth/loss avoided in sales to existing
markets 5.26% 3.70% 27.78%
Access to new markets 5.26% 3.70% 13.89% Change in export product quality 5.26% 3.70% 2.78%
Change in trade costs 5.26% 3.70% 2.78% Change in agricultural productivity 5.26% 3.70% 2.78% Change in domestic public health 5.26% 3.70% 2.78%
Change in environmental protection 5.26% 3.70% 2.78% Change in domestic market sales 5.26% 3.70% 2.78% Number of smallholder farmers 5.26% 18.52% 2.78%
Change in number of smallholder farmers 5.26% 18.52% 2.78% Poverty reduction 5.26% 3.70% 2.78% Total employment 5.26% 3.70% 2.78%
Change in total employment 5.26% 3.70% 2.78% Level of involvement of women 5.26% 3.70% 2.78%
Change in level of involvement of women 5.26% 3.70% 2.78% Appreciable benefits to
vulnerable/disadvantaged areas 5.26% 3.70% 2.78%
127. While MCDA methods (such as PROMOTHEE) have significant advantages over less formal modes of decision-making and are arguably more applicable to broad-based comparisons of SPS capacity building options than CBA and CEA, many decision-makers in developing countries may be unfamiliar with such approaches. Thankfully the learning curve associated with the outranking method, and more broadly the application of the framework proposed above, is less "steep" than it might seem. Thus, software such as Decision Lab 2000 (Visual Decision, 2000) is relatively easy to use and the analyst is quickly able to define and run problems of the type outlined above. As important, the output of this software is easy to understand and can be readily communicated to decision-makers who do not have an intimate understanding of the methods being employed. Key here is the presentation of the three levels of output - information cards, spider diagrams and numerical prioritisations - side-by-side so as to aid interpretation of the results and facilitate debate among decision-makers as to priority actions and the basis on which such priorities are set.
43
4. CONCLUSIONS AND RECOMMENDATIONS
128. Developing country governments and donors face a formidable challenge in prioritising the seemingly unending SPS capacity building needs associated with obtaining, maintaining and/or enhancing access to export markets in the face of increasingly stringent food safety, animal health and/or plant health regulations and standards. Clearly, national and/or donor resources to support the enhancement of capacity are limited, and likely will become more so in the future given the global economic downturn, meaning that there is increasing pressure to use these limited resources in the most effective and efficient manner possible. It is perhaps not surprising therefore, that attention has focused on the potential use of economic analysis methods to aid resource allocation decisions.
129. CBA and, to a lesser extent, CEA have been applied quite widely to assess the costs and benefits of enhancements in food safety, animal health and/or plant health capacity in both high-income and developing countries. These applications demonstrate the often considerable challenges faced in capturing the full range of associated costs and/or benefits and obtaining reliable measures in a manner that is conducive to economic analysis. These challenges are endemic to economic analysis in the area of SPS capacity, but are particularly acute in developing countries where there is typically a paucity of data and/or available data are of dubious quality. Thus, analysts are often faced with difficult compromises in terms of the scope and/or depth of their analysis.
130. Most applications of CBA and CEA have not been undertaken in the context of actual resource allocation decisions, but rather are designed to contribute to on-going policy debates and dialogues regarding the returns from the enhancement of capacity in particular SPS areas, for example controls on FMD or on fruit fly, or to demonstrate that past or on-going investments are providing an acceptable return. While these applications provide convincing evidence that economic analysis is feasible and worthwhile, they raise questions about the application of approaches, such as CBA and CEA, to choices between multiple capacity building needs across diverse SPS areas. Such questions include the likely formidable challenges of assembling and synthesising the required data and permitting analysis in a timely manner in view of the inevitable resource constraints faced by decision-makers.
131. The challenges for economic analysis in the area of SPS capacity enhancement is further enhanced by the fact that, while the preservation and/or enhancement of exports is often the most direct objective, decision-makers also need to consider wider and less direct impacts, for example on agricultural productivity, domestic public health, environmental protection and livelihoods, especially of small farmers, women and other disadvantaged groups. Focusing on changes in the value of exports alone, while tempting because of the associated analytical simplicity, may fail to capture many of the more "subtle" but significant impacts on producers and/or consumers. This is illustrated, for example, by some of the more rigorous cost-benefit studies of improvements in animal health that are reviewed above. At the same time, implicitly or explicitly, decision-makers may trade-off the competing benefits of improvements in SPS capacity; for example, favouring investments that may have more marginal impacts on exports but that facilitate the inclusion of large numbers of small-scale producers in pertinent value chains over investments that boost exports significantly but compromise the participation of smallholders.
132. Extending the scope of economic analysis to multiple and varying capacity building options and to multiple impacts requires that a more flexible approach to economic analysis is employed than CBA and CEA. It is proposed that MCDA is a more appropriate approach, notably in a developing country context where data and analytical resources are limited. Specifically, it is suggested that outranking provides a framework in which multiple impacts can
44
be considered, but that does not require that these impacts are measured in common monetary or non-monetary units. Thus, outranking can be employed where impacts naturally vary in their unit of measurements; for example the value of exports (in monetary units) and numbers of small-scale producers (as a simple count). It can also cope with situations where, while impacts may be measurable in continuous (monetary) units in principle, lack of data means that they can only be captured using categorical scales or counts.
133. The use of outranking to derive numerical prioritisations could make an appreciable contribution towards objective, transparent and accountable priority-setting in the area of SPS capacity building. However, it is further proposed that this approach is embedded in a structured framework for the collection and assembly of pertinent information on the costs and benefits of the various options under consideration. This framework not only reduces the time and effort required of analysts and helps to ensure consistency in the collection and analysis of data over time, but also enhances the information set of decision-makers ahead of the formal prioritisation process. Thus, it is proposed that the data are assembled in standard information cards and also presented in the form of spider diagrams that indicate the key dimensions on which each of the options performs relatively well/badly. Such formats should be presented alongside the output of the outranking process.
134. While MCDA has not been widely applied to food safety, animal health and/or plant health, it is widely used in a number of other resource allocation contexts. Further, some analysts of SPS capacity building have begun to recognise that such an approach could be of great utility. There is a clear need, however, for the framework that is proposed above to be tested in countries that differ in the amount and/or quality of available data and across varying capacity building areas. While the hypothetical scenarios used above to demonstrate the mechanics of the framework and outranking method are probably broadly representative of the options decision-makers have to contend with, such hypothetical and stylistic examples cannot replace a real-life application. At the same time, such an application would enable a more detailed "user guide" to be elaborated that provides detailed guidance to analysts and decision-makers.
135. The framework that is proposed will hopefully be enticing to decision-makers in developing countries, although its application in practice may appear to involve a rather steep "learning curve". Inevitably, the application of the framework would require that technical assistance be provided to developing countries, as well as on-going support. This might include an internet-based "help line" whereby decisions-makers could post problems as and when they are encountered, to be addressed by an expert support person or by analysts in other countries that have experienced similar issues. Most users will be surprised, however, at how quickly they are able to specify a decision problem within the framework and even to undertake basic outranking analysis using software (such as D-Sight or Decision Lab 2000). Hopefully, early adopters of the framework would provide an important demonstration effect in this regard. The STDF could play a key role here in promoting the use of the framework, gathering experiences, developing support materials and holding training workshops.
136. Beyond the technical difficulties of applying a MCDA framework to priority-setting of SPS capacity building options, the chief challenge is obtaining the "buy-in" at all levels of the decision-making process. Use of economic analysis generally, and of MCDA in particular, involves the reframing of decisions and may require wider changes in institutional processes. Further, the decision-making process will likely become more time and resource intensive, especially in earlier stages. To avoid these wider implications from impeding the application of the framework, more senior officials need to be convinced of its utility. The challenge here is that, whilst resource allocation decisions may ultimately improve, such benefits will only be
45
observed in the medium to long term. Again, the demonstration effect from early adopters is likely to be important.
137. While it is proposed that the MCDA approach could provide a useful framework in which to assess broad-based SPS capacity building options, there are other contexts in which CBA and/or CEA still have a role to play. For example, CBA is an entirely appropriate method to assess the costs and benefits, in the wider sense, of large-scale and specific capacity building interventions; for example, the implementation of controls on specific animal diseases. Likewise, if a decision has been taken to enhance a particular element of SPS capacity, CEA is a useful way in which to choose between the various options to achieve this enhancement; for example, to achieve pest-free status for a particular plant pest. Thus, the MCDA framework that is proposed should be seen as adding to rather than replacing the existing "arsenal" of economic analysis methods. Decision-makers should consider the range of alternative approaches and apply the one which is best suited to the particular context of their decision.
138. The choice of approach to economic analysis of SPS capacity building options involves an inevitable compromise in terms of the scope and depth of the assessment and quantification of the costs and benefits associated with the various options under consideration. It is important that decision-makers recognise and are explicit about the compromises they make in choosing a particular approach. Thus, while CBA can provide an in-depth and rigorous assessment of the impacts of particular capacity building investments, it is difficult to operationalise across a wide range of very different options. Indeed, once the focus moves to varied and/or multi-criteria decisions, potentially the analysis opens up a "can of worms" and more flexible approaches are needed. However, while CEA and (especially) MCDA are arguably applicable to a much wider range of decision contexts than CBA, they will not tell the decision-maker if a particular investment yields a net benefit in monetary terms. The challenge is to employ the most appropriate approach given the questions being asked and given the context in which it is being asked.
46
REFERENCES
Agra CEAS (2006a). Country-Based plans for SPS development, Wye: Agra CEAS Consulting. Agra CEAS (2006b). Country-Based plans for SPS Development: Uganda Field Study Cost-
Benefit Analysis, Wye: Agra CEAS Consulting. Agra CEAS (2008). Country-Based Plans for SPS development: Peruvian Field Study Cost-
Benefit Analysis, Wye: Agra CEAS Consulting. Antle, J. M. (1999). "Benefits and Costs of Food Safety Regulation", Food Policy, vol. 24(6), pp.
605-623. BAHA (2003). Cost/Benefit Analysis: Pink Hibiscus Mealybug Bbiological Control Programme,
Belmopan: Belize Agricultural Health Authority. Baker, D., D. Bridges, R. Hunter, G. Johnson, J. Krupa, J. Murphy and K. Sorenson (2001).
Guidebook to Decision-Making Methods, Washington DC: US Department of Energy. Benedictus, A., H. Hogeveen and B. R. Berends (2009). "The Price of the Precautionary
Principle: Cost-Effectiveness of BSE Intervention Strategies in the Netherlands", Preventive Veterinary Medicine, vol. 89, pp. 212-222.
Brans, J. P. and P. Vincke (1985). "A Preference Ranking Organization Methods: The
PROMOTHEE Method fro MCDM", Management Science, vol 31(6), pp. 647-656. Brans, J. P., P. Vincke and B. Mareschal (1986). "How to Select and How to Rank Projects: The
PROMOTHEE Method", European Journal of Operations Research, vol. 24, pp 228-238. Caswell, J. A. (2008). Expanding the Focus of Cost-Benefit Analysis for Food Safety: A Multi-
Factorial Risk Prioritization Approach. Amherst MA: Department of Resource Economics , University of Massachusetts.
Cato, J. and C. Limos dos Santos (2000). "Costs to Upgrade the Bangladesh Frozen Shrimp-
Processing Sector to Adequate Technical and Safety Standards and to Maintain a HACCP Program", in Unnevehr, L. Ed., The Economics of HACCP: Studies of Costs and Benefits, pp. 235-250, St Pauls MN: Eagen Press.
Cato, J. and S. Subasinghe (2004). An Overview of the Bangladesh Shrimp Industry with
Emphasis on the Safety and Quality of Exported Products, Washington DC: World Bank. Civic Consulting (2007). Prevention and Control of Animal diseases World-wide. Economic
analysis- prevention versus outbreaks. Final Report. Prepared for the World Organization for Animal Health (OIE), Berlin: Civic Consulting.
Cobiac, L., T. Vos and J. J. Barendregt (2009). "Cost-Effectiveness of Interventions to Promote
Physical Activity: A Modelling Study", PLOS Medicine, vol. 6(7), pp. 1-11. Crutchfield, S. R., J. C. Buzby, T. Roberts, M. Ollinger and C. T. Jordan Lin (1997). Economic
Assessment of Food Safety Regulations: The New Approach to Meat and Poultry Inspection, Washington DC: Economic Research Service, US Department of Agriculture.
47
Department for Communities and Local Government (2009). Multi-Criteria Analysis: A Manual, London: Department of Communities and Local Government.
Dyer, J. (2005). "MAUT - Multiattribute Utility Theory", in Figueira, J., Salvatore, G. and
Ehgrott, M. Eds, Multiple Criteria Decision Analysis: State of the Art Surveys, pp. 265-292, New York: Springer.
Fabrycky, W. J., G. J. Thuesen and D. Verma (1997). Economic Decision Analysis. New York:
Prentice Hall. FAO (2005). Phytosanitary Capacity Evaluation (PCE) Tool, Rome: Food and Agriculture
Organization. FAO (2006). Strengthening National Food Control Systems: Guidelines to Assess Capacity
Building Needs, Rome: Food and Agriculture Organization. FDA (1995). Final Regulatory Impact Analysis (FRIA) of the Regulations to Establish Procedures
for the Safe and Sanitary Processing and Importing of Fish and Fishery Products, Washington DC: US Food and Drugs Administration.
FSIS (1995). "Pathogen Reduction: Hazard Analysis and Critical Control Points (HACCP)
Systems; Proposed Rule", Federal Register, vol. 60(23), pp. 6774-6889. FSIS (1996). Pathogen reduction; Hazard analysis and Critical Control Points (HACCP) Systems;
Final Rule, Supplement-final Regulatory Impact Assessment for Docket No. 93-016F, Washington DC: Food Safety and Inspection Service, US Department of Agriculture.
Golan, E. H., S. J. Vogel, P. F. Frenzen and K. L. Ralston (2000). Tracing the Costs and Benefits
of Improvements in Food Safety: The Case of the Hazard Analysis and Critical Control Point Program for Meat and Poultry, Washington DC: Economic Research Service, US Department of Agriculture.
Gupta, A. P., R. Harboe and M. T. Tabucanon (2000). "Fuzzy Multiple Criteria Decision Making
for Crop Area Planning in Narmada River Basin", Agricultural Systems, vol. 63, pp. 1-18. Haddix, A. C. and P. A. Shaffer (1996). "Cost-Effectiveness Analysis", in Haddix, A.C., Teutsch,
S.M., Shaffer, P.A. and Dunet, D.O. Eds., Prevention Effectiveness: A Guide to Decision Analysis and Economic Evaluation Book, pp. 56-80, New York: Oxford University Press.
Havelaar, A. H., M.-J. Mangen, J., A. A. de Koeijer, M.-J. Bogaardt, E. G. Evers, W. F. Jacobs-
Reitsma, W. van Pelt, J. A. Wagenaar, G. A. deWit, H. van der Zee and M. J. Nauta (2006). "Effectiveness and Efficiency of Controlling Campylobacter on Broiler Chicken Meat", Risk Analysis, vol. 27(4), pp. 831-844.
Henson, S. J. (2008). Ex-Post Evaluation of STDF Project 20: Country-Based Plans for SPS
Development, Geneva, Standards and Trade Development Facility, World Trade Organization.
Henson, S. J., J. A. Caswell, J. A. L. Cranfield, A. F. Fazil, V. J. Davidson, S. M. Anders and C.
Schmidt (2007). A Multi-Factorial Risk Prioritisation Framework for Food-Borne Pathogens, Amherst MA: Department of Resource Economics, University of Massachusetts.
48
Henson, S. J. and S. Jaffee (2008). "Understanding Developing Country Strategic Responses to
the Enhancement of Food Safety Standards", World Economy, vol. 31(1), pp. 1-15. Henson, S. J., M. Saqib and D. Rajasenan (2004). Impact of Sanitary Measures on Exports of
Fishery Products From India: The Case of Kerala, Washington DC: World Bank. Irz, X. (2008). "The cost-benefit analysis of Food safety policies: Is it useful?", Innovation: The
European Journal of Social Science Research, vol. 21(2), pp. 159-164. Ivanek, R., Y. T. Grohn, L. W. Tauer and M. Wiedmann (2004). "The Cost and Benefit of
Listeria Monocytogenes Food Safety Measures ", Critical Reviews in Food Science and Nutrition, vol. 44, pp. 513-523.
Jensen, H. and L. Unnevehr (2000). HACCP in Pork Processing: Costs and Benefits, Ames:
Center for Agricultural and Rural Development, Iowa State University. Kangas, A., J. Kangas and J. Pykalainen (2001a). "Outranking Methods as Tools in Strategic
Natural Resource Planning", Silva Fennica, vol. 35(2), pp. 215-227. Kolstad, I. and A. Wiig (2002). A Cost-Benefit Framework for Allocating SPS-related Technical
Assistance, R 2002: 19, Bergen: Chr. Michelsen Institute. Krieger, S., G. Schiefer and C. A. da Silva (2007). Costs and Benefits in Food Quality Systems:
Concepts and a Multi-criteria Evaluation Approach, Rome: Food and Agriculture Organization.
Kuchler, F. and E. Golan (1999). Assigning Values to Life: Comparing Methods for Valuing
Health Risks. , Washington DC: Economic Research Service, US Department of Agriculture.
Layard, R. and S. Glaister (eds.) (1994). Cost-Benefit Analysis, Cambridge: Cambridge
University Press. Lindner, B. and P. McLeod (2008). A Review and Impact Assessment of ACIAR"s Fruit Fly
Research Partnerships, 1984-2007, Canberra: ACIAR. Linkov, I., A. Varghese, S. Jamil, T. P. Seager, G. Kiker and T. Bridges (2004). "Multi-Criteria
Decision Analysis: A Framework for Structuring Remedial Decisions at Contaminated Sites", in Linkov, I. And Ramadan, A. Eds., Comparative Risk Assessment and Environmental Decision Making, pp. 15-54, Dordrecht: Kluwer Acadaemic Publishers.
Loken, E. (2007). "Use of Multicriteria Decision Analysis Methods for Energy Planning
Problems", Renewable and Sustainable energy Reviews, vol. 11, pp. 1584–1595. Malcolm, S. A., C. Narrod, T. Roberts and M. Ollinger (2004). "Evaluating the Economic
Effectiveness of Pathogen Reduction Technologies in Cattle Slaughter Plants", Agribusiness, vol. 20(1), pp. 109-123.
McGregor, A. (1996). "An Economic Evaluation of Fruit Fly Research in the South Pacific", in
Allwood, A.J. and Drew, R.A. Eds., Management of Fruit Fly in the Pacific, pp. 212-221, Canberra: ACIAR.
49
McGregor, A. (2000). A Feasibility Study of the Eradication of Oriental Fruit Fly (B. dorslais) and
Breadfruit Fly (B. umbrosa) from the Republic of Palau., Nourmea: Secretariat of the Pacific Community.
McGregor, A. (2007). A Socio-Economic Evaluation of the Regional Fruit Fly Projects, Nourmea,
Secretariat of the Pacific Community. Moodie, M., M. Haby, M. Wake, L. Gold and R. Carter (2008). "Cost-Effectiveness of a Family-
based GP-mediated Intervention Targeting Overweight and Moderately Obese Children", Economics and Human Biology, vol. 6, pp. 363-376).
Morgenstern, R. D. and P. de Civita (2006). Regulatory Costing: An Overview, Ottawa: Policy
Research Initiative, Government of Canada. Mushkin, S. J. (1979). Biomedical Research: Costs and Benefits, Cambridge MA: Ballinger
Publishing Company. Nas, T. F. (1996). Cost-Benefit Analysis: Theory and Application, Thousand Oaks: Sage
Publications. OECD (1997). Regulatory Impact Analysis: Best practices in OECD countries, Paris:
Organisation for Economic Cooperation and Development. OIE (2008). OIE Tool for the Evaluation of Performance of Veterinary Services (OIE PVS Tool),
Paris: World Organisation for Animal Health. Otte, M. J., R. Nugent and A. McLeod (2004). Transboundary Animal Diseases: Assessment of
Socio-Economic Impacts and Institutional Responses, Rome: Food and Agriculture Organization.
Pohekar, S. D. and M. Ramachandran (2004). "Application of Multicriteria-Decision Making to
Sustainable Energy Planning: A review", Renewable and Sustainable energy Reviews, vol. 8, pp. 365-381.
Randolph, T. F., B. D. Perry, C. C. Beningo, I. J. Santos, A. L. Agbayani, P. Coleman, R. Webb
and L. J. Gleeson (2002). "The Economic Impact of Foot and Mouth Disease Control and Erradication in the Philippines", Revue Scientifique etTechnique de l'Office International des Epizooties, vol. 21(3), pp. 645-661.
Randolph, T. F., B. D. Perry, H. S. Horst, A. L. Agbayani, C. Benigno, W. Kalpravidh and L. J.
Gleason (2000). Improving the economic analysis of control interventions for diseases of trade: Lessons from two case studies of FMD control in East Asia. Nairobi: International Livestock Research Institute.
Rich, K. M., G. Y. Miller and A. Winter-Nelson (2005a). "A Review of Economic Tools for the
Assessment of Animal Disease Outbreaks", Revue Scientifique etTechnique de l'Office International des Epizooties, vol. 24(3), pp. 833-845.
Rich, K. M., A. Winter-Nelson and G. Y. Miller (2005b). "Enhancing Economic Models for the
Analysis of Animal Disease", Revue Scientifique etTechnique de l'Office International des Epizooties, vol. 24(3), pp. 847-856.
50
Rodrigo, D. (2005). Regulatory imapct analysis in OECD countries: Challenges for developing
countries. South Asian High Level Investment Roundtable, Paris: Organistaion for Economic Coopertaion and Development.
Romano, D., A. Cavicchi, B. Rocchi and G. Stefani (2004). Costs and Benefits of Compliance for
HACCP Regulation in the Italian Meat and Dairy Sector, Florence: Department of Agricultural and Resource Economics, University of Florence.
Roy, B. (1990). "The Outranking Approach and the Foundations of the ELECTRE Method", in
Costa, B. Ed. Readings in Multiple Criteria Decision Aid, pp. 101-120, Berlin: Springer-Verlag.
Roy, B. (1996). Multicriteria Methodology for Decision Aiding, Dordrecht: Kluwer Academic
Publishers. Ruzante, J. M., V. J. Davidson, J. A. Caswell, A. F. Fazil, J. A. L. Cranfield, S. J. Henson, S. M.
Anders, C. Schmidt and J. M. Farber (2009). "A Multifactorial Risk Prioritization Framework for Foodborne Pathogens", Risk Analysis.
Saaty, T. (2005). "The Analytic Hierarchy and Analytic Network Processes for the Measurement
of Intangible Criteria and for Decision-Making" in Figueira, J., Salvatore, G. and Ehgrott, M. Eds, Multiple Criteria Decision Analysis: State of the Art Surveys, pp. 345-405, New York: Springer.
Tambi, N. E., W. O. Maina and C. Ndi (2006). "An Estimation of the Economic Impact of
Xontagious Bovine Pleuropneumonia in Africa", Revue Scientifique et Technique de l'Office International des Epizooties, vol. 25(3), pp. 999-1012.
Thorpe, S., S. Warr and N. Andrews (2007). Barriers to ASEAN Meat Exports: Economic
Impacts of Disease Outbreaks and Policy Responses, Canberra: Australian Bureau of Agricultural and Resource economics.
Unnevehr, L. (ed.) (2000). The Economics of HACCP: Costs and Benefits, St Paul MN: Eagan
Press. Valeeva, N. A., M. Meuwissen, A. O. Lansink and R. Huirne (2006). "Cost Implications of
Improving Food Safety in the Dutch Dairy Chain.", European Review of Agricultural Economics, vol. 33(4), pp. 511-554
van der Gaag, M. A., H. W. Saatkamp, G. C. Backus., P. van Beek and R. B. M. Huirne (2004).
"Cost-Effectiveness of Controlling Salmonella in the Pork Chain", Food Control, vol. 15, pp. 173-180.
Visual Decision (2000). Decision Lab Executive Edition Getting Started Guide, Montreal: Visual
Decision Inc. Wilson, J. S. and S. J. Henson (2002). Sanitary and Phytosanitary Measures and Agricultural
Trade: A Primer and Background Readings, Washington DC: World Bank.

51
World Bank (1999). Project appraisal document on a proposed loan in the amount of US$ 44.0 million to the Federative Republic of Brazil for an animal and plant health protection project., Washington DC: World Bank.
World Bank (2002). Sanitary and Phytosanitary Requirements and Developing Country
Agricultural and Food Exports: Methodological Guidelines for Country and Product Assessment, Washington DC, World Bank.
World Bank (2007). Technical Annex on a proposed credit to the Socialist Republic of Vietnam
for a Vietnam Avian and Human Influenza Control and Preparedness Project No T7686-VN, Washington DC: World Bank.

Use of Economic Analysis toInform SPS-relatedDecision-Making
Standards and Trade Development Facility
The Standards and Trade Development Facility (STDF) is a global programme in capacity building and technical cooperation established by the Food and Agriculture Organization of the United Nations (FAO), the World Organisation for Animal Health (OIE), the World Bank, the World Health Organization (WHO) and the World Trade Organization (WTO). More information is available at: www.standardsfacility.org Printed by the WTO Secretariat
November 2011