Embed Size (px)
Citation preview
Journal of Counseling Psychology Copyright 1987 by the American Psychological Association, Inc. 1987, Vol. 34, No. 4, 393~,O3 0022-0167/87/$00.75
Use of Discriminant Analysis in Counseling Psychology Research
Nancy E. Betz Ohio State University
Discriminant analysis is a technique for the multivariate study of group differences. More specifically, it provides a method of examining the extent to which multiple predictor variables are related to a categorical criterion, that is, group membership. Situations in which the technique is particularly useful include those in which the researcher wishes to assess which of a number of continuous variables best differentiates groups of individuals or in which he or she wishes to predict group membership on the basis of the discriminant function (analogous to a multiple regression equation) yielded by the analysis. The method is also useful as a follow-up to a significant analysis of variance. In this article, I describe the method of discriminant analysis, including the concept of discriminant function, discriminant score, group centroid, and discrim- inant weights and Ioadings. I discuss methods for testing the statistical significance of a function, methods of using the function in classification, and the concept of rotating functions. The use of discriminant analysis in both the two-group case and the multigroup case is illustrated. Finally, I provide a number of illustrative examples of use of the method in the counseling literature. I conclude with cautions regarding the use of the method and with the provision of resources for further study.
The technique ofdiscr iminant analysis, developed by R. A. Fisher (1936), is one method for the multivariate study of group differences. When used for explanatory purposes, dis- criminant analysis is particularly appropriate when one wishes (a) to describe, summarize, and understand the differences between or among groups, (b) to determine which of a set of continuous variables best captures or characterizes group differences, (c) to describe the dimensionality of group differ- ences (much like factor analysis describes the dimensionality of a set of continuous variables), (d) to test theories that use stage concepts or taxonomies, and (e) to examine the nature of group differences following a multivariate analysis of vari- ance (MANOVA; Borgen & Seling, 1978).
Probably the most frequent applications of discriminant analysis are for predictive purposes, that is, for situations in which it is necessary or desirable to classify subjects into groups or categories. The results of a discriminant analysis allow the prediction of group membership based on the best linear composite or combination of predictor scores. Discrim- inant analysis is analogous to multiple regression in that both involve prediction from a set of continuous predictor variables (sometimes designated independent variables) to a criterion. The major difference between them is that multiple regression predicts to a continuous criterion variable (sometimes desig- nated the dependent variable), whereas discriminant analysis predicts to a categorical criterion, that is, group membership. Thus, given multiple predictor variables, multiple regression would be the appropriate method of analysis if the dependent variable were continuous, and discriminant analysis would be appropriate if the dependent variable were categorical, with two or more levels.
Correspondence concerning this article should be addressed to Nancy E. Betz, Department of Psychology, Ohio State University, 137 Townshend Hall, Columbus, Ohio 43210-1222.
Some examples of research questions that would be appro- pilate for the application of discriminant analysis in the educational or vocational area include the following: (a) the major variables that distinguish successful and unsuccessful employees in a work setting or organization; (b) the differen- tial characterization of students who do and those who do not successfully complete a given education program, for exam- ple, a PhD program in Counseling Psychology; and (c) the characteristics of women who pursue careers in traditionally male-dominated fields versus those who pursue careers in traditionally female-dominated areas.
In other areas of counseling research, discilminant analysis might be an appropriate method for comparing premature terminators in counseling with those who complete counsel- ing, suicide-prone individuals who do with those who do not ultimately attempt suicide, participants in cigarette-smoking cessation programs who do with those who do not suffer relapses after completing a treatment program, and partici- pants in marriage counseling who do with those who do not stay married after completion of counseling.
Discriminant analysis has also been suggested as a follow- up to MANOVA, which is a method used to examine group differences on a set of dependent variables. In contrast to the use of multiple t tests, the use of MANOVA provides a test of the existence of group differences across all dependent vari- ables simultaneously. A statistically significant multivariate F indicates the likely presence of group differences, but follow- up analyses are necessary to discern the nature or sources of the differences.
Typically, researchers use separate univariate F tests as a follow-up to a significant MANOVA, but some investigators (Borgen & Seling, 1978; Bray & Maxwell, 1982; Huberty, 1975a; Tatsuoka, ! 97 l) suggest that discriminant analysis may have some advantages over separate F tests. One advan- tage of discriminant analysis as a follow-up to MANOVA is that
393

394 NANCY E. BETZ
it makes it possible for researchers to avoid the experiment- wise error inherent in repeated univariate tests by providing for simultaneous examination of the variables. Further, it provides information concerning the dimensionality of group differences and may thus provide a more parsimonious expla- nation of the data. More specifically, assume that univariate tests indicated that the groups differed significantly on 6 of the 10 variables studied; discriminant analysis might yield two meaningful discriminant functions, each of which in- cluded 3 of the 6 significant dependent variables. In a case like this, the use of two functions versus the use of six variables would lead to more parsimonious description of group differ- ences.
There are problems with the use of discriminant analysis for this purpose, particularly when the variables are more highly intercorrelated; these problems and their solution are discussed in more detail in the subsequent section on inter- preting the results of a discriminant analysis. For a detailed discussion of the use of discriminant analysis as a follow-up to MANOVA, see Bray and Maxwell (1982).
Notice that each of the above uses of discriminant analysis would yield information of both theoretical and applied in- terest. That is, discriminant analysis can contribute to the understanding of the nature and extent of group differences and thus to an understanding of the dynamics of behavior and behavior change. In addition, it results in an equation, known as the discriminant function, by which group mem- bership can be predicted. This information might be used in new samples to identify high-risk individuals for whom special interventions might be warranted. For example, the predictive function could be used to identify those at high risk for premature termination of counseling, to predict dropout from an educational program, or to predict relapse after a smoking- cessation program. (Again note the similarity of this applica- tion of discriminant analysis to the predictive uses of a mul- tiple regression equation. The close relation between discrim- inant analysis and linear multiple regression is discussed below.)
Before the method and results of a discriminant analysis are described, it may be useful to compare the discriminant analysis with other approaches to similar research problems. Discriminant analysis is related to a whole class of methods, including regression and MANOVA, that are based on the general multivariate linear model (see Bock, 1975; Borgen & Seling~ 1978). Distinctions among the methods concern the research questions they address, the number and types of variables for which they are appropriate, and their special USES.
A first major type of research question is whether or not groups differ on variables of interest. In the univariate case, group differences are examined with t tests or one-way anal- yses of variance (^NOVAS). In the multivariate case, group differences are best examined with the related methods of Hotelling's T 2 statistic, MANOVA, or discriminant analysis. All three of these methods are preferable to the use of multiple t tests or multiple ANOVAS because they control the experi- mentwise error rate, that is, the overall risk of Type I error. Use of these methods allows us to answer the question of whether or not there are significant multivariate differences
between two or more groups (although it should be noted that use of Hotelling's T 2 statistic is only appropriate in the two- group case). The need for the use of discriminant analysis as a follow-up to MANOVA was emphasized in the previous section, but MANOVA should also be viewed as one of several methods for the multivariate study of group differences. In relation to the other methods, discriminant analysis is unique in its provision of information concerning the dimensionality of group differences, but it has the disadvantage, like multiple regression, of being a maximization procedure (to be dis- cussed subsequently).
An understanding of discriminant analysis can probably best be conveyed by a discussion of its conceptual and math- ematical similarity to multiple regression. Discriminant analy- sis, like multiple regression, provides the researcher with a linear equation with beta weights indicating the relative im- portance of each variable in predicting the criterion. In mul- tiple regression the criterion is a continuous variable, whereas in discriminant analysis group membership is the criterion. In both cases, the weights are determined mathematically to maximize predictability of the criterion. In discriminant analysis the weights yielded are those that maximally differ- entiate or separate the groups. The limitations ofdiscriminant analysis resulting from its maximizing characteristic will be discussed later, but the reader's knowledge of the limitations of multiple regression should provide useful background.
Data Analysis and Interpretation
Nature of the Data
The data used in a discriminant analysis include scores on two or more variables for two or more groups. The groups can be formed on the basis of demographic characteristics (e.g., sex, race, marital status), intellectual or personality attributes (e.g., Holland interest types, gifted vs. average in- telligence groups), or actual behavior (e.g., being successful vs. being unsuccessful in school, work, or a treatment pro- gram, continuing vs. dropping out from counseling). The variables are those the researcher views as potentially impor- tant in understanding the nature of group differences; usually they are measured as continuous variables, but discrete vari- ables may also be used on occasion. The variables are called discriminant or discriminator variables (e.g., Brown & Tinsley, 1983), but they are equivalent to predictor variables or independent variables when used for the prediction of group membership.
A variety of computer programs are available for the data analysis, including the Statistical Package for the Social Sci- ences (SPSS) program DISCRIMINANT (Nie, Hull, Jenkins, Steinbrenner, & Bent, 1975), Statistical Analysis System SAS DISCRIM (SAS, Inc., 1985), and Biomedical Data Package (BMDP)'s program for stepwise discriminant analysis (Dixon, 1985). Although the programs yield similar types of infor- mation, there are minor variations in the types of statistics provided. As in the case when multiple regression is used, the researcher must decide on the strategy by which variables are to be entered into the predictive equation; options usually include forward selection and stepwise selection.
DISCRIMINANT ANALYSIS 395
Discriminant Function
Discussion of the mathematical computations of a discrim- inant analysis is beyond the scope of this article, but can be found in Morrison (1976) or Tatsuoka (- 1971 ). A discriminant analysis is designed to enable the researcher to search for the linear equation that will maximize differences between the groups. Recall the general form of a linear equation, Y = bX + a, and the form in linear multiple regression:
~" = blXl + b2X2 + . . . bpXp + a, (1)
where the bs are the weights applied to the variables X, the a is a constant (reflecting the Y-intercept of the regression line) and the Y is the continuous variable to be predicted. On the basis of the familiar principle of least squares, the weights are selected so as to minimize the sum of squared errors, that is, the squared errors in the prediction of Y from Y. Similarly, the linear equation that is the basis of discriminant analysis is called a discriminant function and takes the following analogous form:
as the original variables. Multiplication of standard scores by standardized weights would yield discriminant scores in stan- dard score units. Application of Equation 2 to the calculation of the standardized discriminant score' for the ?h individual would result in the following:
Di = blXli + b2 X2i + b3X3i + . . . bpXpi. (3)
(Note that in the calculation of standardized scores, the con- stant drops out. Subsequent formulas assume that standard- ized discriminant scores and centroids, rather than their un- standardized equivalents, are being calculated.)
In order to understand the concept of a centroid, consider the fact thai the distribution of discriminant scores of mem- bers of a group, like any set of continuous scores, would have a certain distribution with a mean and standard deviation. The mean of discriminant scores within a group is known as the group centroid. The group centroid is calculated by apply- ing the discriminant weights t6 the group means on each variable. Equation 4 would be the formula for calculating the centroid of Group A:
D = b l X l + b2X2 + . . . bpXp + a, (2) /~A = bl-~lA + b2-~ZA + . . . beXeA (4)
where D is the categorical variable to be predicted, specifically group membership. The objective of the use of the discrimi- nant analysis is to form a linear equation for each group that maximizes the differences between the weighted group means, the Ds, also called group centroids (see subsequent discussion). Another way of describing this, for those more comfortable with the ANOVA Paradigm, is that the weights are chosen to maximize the ratio of the between-groups sum of squares to the within-groups sum of squares. In effect, variables on which the groups differ are generally weighted more heavily, and those variables on which the groups are similar receive smaller weights. Note that the technique emphasizes group differences and deemphasizes group similarities.
A discriminant analysis thus results in a discriminant func- tion, or set of beta weights to be applied to the variables, in which the weights indicate the importance of each variable in contributing to group differences. The method also provides information regarding the statistical significance of the func- tion as a whole and of the individual variable weights (statis- tical significance is described in the section on interpreting a discriminant function). A statistically significant function, and its associated beta weights, are used for explanatory purposes, that is, to enhance understanding of the nature of group differences. For predictive purposes, discriminant scores are calculated for each individual and compared with group centroids to determine probabilities of group member- ship. These concepts are discussed in the next section.
Just as a multiple regression equation can be used to calculate a predicted score on the criterion for each subject, a discriminant function can be used to calculate an individual 's discriminant score. Again, on the basis of the general formula for a linear equation ( Y = bX + a), the individual 's scores on each variable are multiplied by the corresponding discrimi- nant weight. Multiplication of raw scores by unstandardized weights would result in a discriminant score in the same units
As mentioned previously, the discriminant function yielded is that which maximizes the difference between group cen- troids and which therefore also minimizes overlap between the distributions of scores for the groups. The most important use of discriminant scores and centroids is in the prediction of group membership for individuals, in other words, for classification.
Classification
A discriminant analysis enables the investigator to make a prediction of group membership for each individual in the sample. Classification is based on the concepts of the discrim- inant score and the group centroid, as discussed previously; very simply, classification of an individual ease involves cal- culation of the individual 's discriminant score and compari- son of it with the centroid of each group studied. The centroid to which the individual 's score is closest is the group to which he or she is predicted to belong.
The reader may note that predicted group membership can be compared with actual group membership in the sample in which the function was calculated. The percentage of concct predictions based on the function can be compared with the percentage that can be predicted correctly with other strate- gies; if no other alternatives are available, the percentage correctly classified can be compared with the percentage of correct predictions expected on the basis of chance.
If the groups are equal in size, the percentage of correct predictions based on chance is equal to l/k, where k is the number of groups. For example, if we have three equal-sized groups, the chances of correctly classifying any given individ- ual are .333. When sample sizes are unequal, there are two ways of estimating the percentage that could be correctly classified by chance. The first, which assumes that all correct predictions are equal in value, is to use the formula n/N,
396 NANCY E. BETZ
where n is the size of the largest group and N is the total sample size. For example, assume that we have 300 successes and 100 failures in a job training program. If we make a prediction of success for every individual, we will be correct 75% of the time, that is, 300/400 = .75 by using the above formula. However, predicting success for all 400 cases doesn't help with the problem at hand, which is to predict in advance those individuals who will fail. An alternative formula that assumes a comparable rate of error across groups is
P~a~ + p2a2 + p3a3+ . . . + p^-ah-. (5)
In the formula, the p values refer to the proportion of cases in the sample belonging to each group, the values of a refer to the proportion actually classified as belonging to that group, and k is the number of groups. Assume that in the earlier example, the discriminant function led to the prediction of 60% successes and 40% failures. By inserting these values into the formula we would have a chance rate of correct prediction of(.75) (.60) + (.25) (.40) = .55. Note that the latter value is considerably less than the value of .75 that was based on the prediction of success for all cases.
The actual percentage of correct predictions can be com- pared statistically to that expected on the basis of chance by using the z test for the difference between proportions (Glass & Stanley, 1970). Thus. the ability o f a discriminant function to make a statistically significant improvement in the accuracy of classification can be assessed. It is essential to note that cross-validation is absolutely necessary if the investigator wishes to apply the function to the prediction of group mem- bership in subsequent samples of individuals (versus those in the sample in which the function was originally developed). As has already been mentioned, discriminant analysis is a maximization procedure, which means that it capitalizes on sample-specific error. In order to assess the probability of correct classification in any new group, the discriminant weights must be applied in a new sample and the actual percentage of correct predictions determined. This new per- centage is a better approximation of the long-term predictive accuracy of the function. (Methods of cross-validation are discussed below.)
This discussion provides a somewhat simplified but con- ceptually meaningful explanation of how a discriminant score is assigned to a group in discriminant analysis. For complete accuracy, it should be noted that the actual statistical proce- dure derives a probability of group membership and takes into account other information, including information re- garding base rates (also called prior or unconditional proba- bilities of group membership) and conditional probabilities, which are used in the formula for Bayes's theorem (e.g., see Hays, 1981) to yield a posterior probability, that is, the probability of membership in a given group for an individual with score X. A case is classified, on the basis of its discrimi- nant score, in the group for which the posterior probability is largest; in other words, a case is assigned to the most likely group on the basis of its discriminant score.
In cases in which the prior probabilities of correct classifi- cation (base rates) diverge greatly from 50%, it may be more difficult to improve upon the accuracy of classification pos-
sible through classification of every individual into the largest group. Assume, for example, a population in which past history shows that 90% of the people are successful; i fa guess of success for each new member is made, the guess will be correct 90% of the time. It will be difficult to achieve greater accuracy in the prediction of success than that which is possible by using base rates alone, although the function may still considerably increase our accuracy in predicting failures. The example that follows provides an example of this situa- tion. See Brown and Tinsley (1983), Cronbach and Gleser (1965), Meehl and Rosen (1955), Taylor and Weiss (1972), and Wiggins (1973) for more extensive discussions of these and other issues involved in classification.
If the discriminant function is to be used for predictive purposes in new populations, it is essential that the sample specificity of the discriminant analysis, and thus its tendency to overestimate the accuracy of classification, be considered. There are several methods of cross validation, including the following (Dillon & Goldstein, 1984; Brown & Tinsley, 1983): (a) cross-validation using a holdout sample; (b) double cross- validation; and (c) what has been called the jackknife, U- method, or "leaving-one-out" method.
In the holdout method of cross-validation, the sample is split in two. One part, usually at least half the group of subjects, is used to derive the initial discriminant function, and the weights are then applied to the classification of the subjects in the second or holdout sample. Although this represents an unbiased method of estimating the true mis- classification rate, it requires large sample sizes if reasonably sound initial discriminant functions are to be derived. In double cross-validation, the total sample is divided in half. Separate discriminant analyses are performed on each sample, and the results are cross-validated on the other sample.
In the third method, one observation at a time is held out, the discriminant function is estimated on the basis of the remaining observations, and that discriminant function is used to classify the held-out observation. This process is repeated until all observations have been classified. Error rates can be determined on the basis of the cumulative findings. The jackknife method is available on BMDP, and discussions of its use are offered by Efron (1983) and Dillon and Goldstein (1984).
Examples
In order to illustrate the ideas presented up to this point, as well as to introduce the idea of statistical significance of a discriminant function, results from a study of predictors of students' continuation in college mathematics studies are presented. This study illustrates the use ofdiscriminant analy- sis with a dichotomous criterion variable, that is, a criterion consisting of two groups. An example presented later illus- trates use of the method with a polychotomous criterion, that is, one with three or more groups.
Mathematics has been called the "critical filter" of career development (Sells, 1982; Sherman, 1982, p. 428) because lack of high school and college mathematics serves to filter people out from many potentially interesting career possibil- ities. Thus, it is important to understand the factors that
DISCRIMINANT ANALYSIS 397
influence individuals' plans to continue math studies in both high school and college because of the important role that knowledge of mathematics plays in making a range of edu- cational and career options available to them. As part of a larger study of the correlates of math anxiety in college students (Bander & Betz, 1981; N. E. Betz, 1978), a discrim- inant analysis of predictors of intent to continue in college mathematics was performed.
The dependent or predictor variables used in the analysis were variables, including sex, math anxiety, math ability, prior math background, and interest in choosing a major in one of the sciences, postulated to be related to the extent to which college students continued to study mathematics. The inde- pendent or grouping variable was intent to continue math studies. The subjects were students enrolled in freshman math courses. The results of this analysis are described below.
Interpretation: Significance testing. Table 1 shows the dis- criminant weights or coefficients which, when multiplied by the individual 's scores on the variables or by the group means, will yield the discriminant score or group centroid, respec- tively. However, in order to interpret the results of a discrim- inant analysis, the investigator's first concern should be that of the statistical significance of the function yielded.
There are several methods of testing the significance of a discriminant function. One common method, based on the familiar concepts of between-groups, within-groups, and total sums of squares, tests the null hypothesis that the weighted group means (centroids) are equal by using Wilks's lambda statistic. Wilks's lambda is the ratio of within-groups variance to total variance (sum of squares) and is therefore the per- centage of variance in discriminant scores not explained by group membership. It is useful to transform the variance ratio into lambda, because lambda can be transformed into a
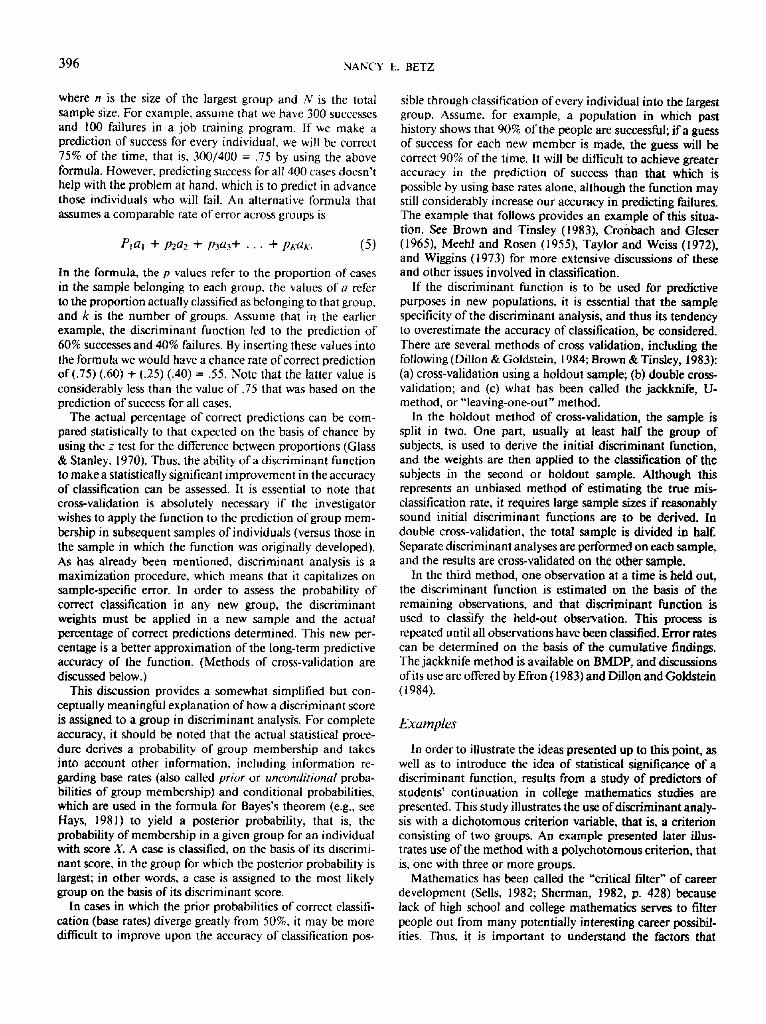
Table 1 Results of Discriminant Analysis of Variables Related to Intent to Continue Mathematics Coursework Among College Freshmen (N = 376)
Standardized discriminant
function Wilks's Predictor variable coefficient lambda F(I, 374)
Sex -.75 .953 18.6** Relative freedom
from math anxiety .58 .980 7.5* ACT math s~ore -.51 .999 0.13 Amount of high
school math -.04 .997 1.17 Interest in a science
major .35 .986 5.40*
Note. In interpreting the direction of the weights, it may be noted that intent to take more math was coded 2, whereas plans to discon- tinue math were coded 1. For sex, male was coded I, female 2. Higher scores on the math anxiety scale were indicative of less anxiety (more positive attitudes) and are, thus, shown as "freedom from math anxiety" to facilitate interpretation. For the function as a whole, Wilks's lambda -- .91, distributed as a x 2 statistic with 5 degrees of freedom and equal to 33.6, p < .001, the eigenvalue = .09, and R = .29. Group centroids were. 14 and - .60 for continuers and noncon- tinuers, respectively. ACT = American College Test. *p<.OI **p<.O01.
statistic that has a chi-square distribution. As shown in the note at the bottom of the table, the value of Wilks's lambda for the function calculated was .91, distributed as a x2(5,N = 376) = 33.6, p < .00t. This is interpreted as indicating that the null hypothesis of equality of group means can be rejected at the .001 level.
An eigenvalue can also be calculated; the eigenvalue is the ratio of between-groups to within-groups sum of squares, so that large eigenvalues indicate good functions. The canonical correlation Rc is a measure of the degree o f association between the discriminant scores and group membership, and is equivalent to the eta derivable from ANOVA (Klecka, 1975). In the two-group case, the canonical correlation is equal to a point-biserial correlation between the continuously distrib- uted discriminant scores and dichotomous group membership (Klecka; Thorndike, 1978).
As is the case with other statistical methods, statistical significance may not always lead to practical significance, particularly when sample sizes are large. The present case provides a good example of this because the actual values of Wilks's lambda, although statistically significant (the N was 376), are unimpressive. Further, the eigenvalue of .09 and the Rc of .29 (see the note to Table 1) indicate that the actual percentage of variance accounted for by the function is un- impressive even though the group centroids differ signifi- cantly. In such cases, the usefulness of the function for p r a ~ tical purposes may rest on its ability to classify individuals into groups (see discussion later in this section.)
If the overall function is statistically significant, then the weights, the contributions o f the individual variables to the differentiation of the groups, can be evaluated for significance. Methods of testing the significance of the discriminant weights include a univariate F calculated for each variable (equal to the value of F for a one-way ANOVA with the same number of groups) and Wilks's lambda for the univariate case. When variables are considered individually, lambda is the ratio of within-groups to total sum of squares. A lambda of I occurs when all group means are equal, but values closer to 0 indicate that most of the total variability can be attributed to between- groups differences. Thus, smaller values of Wilks's lambda indicate variables that better differentiate the groups.
From an examination of the weights shown in Table 1, it is evident that smaller values of Wilks's lambda correspond to the same variables for which the F is statistically significant. Specifically, the weights corresponding to sex, math anxiety, and interest in a major in science were statistically significant, indicating that these variables make significant contributions to the prediction of intent to continue studies in math. Sub- stantive interpretation of the direction of weights can be performed by using the tables of group means and standard deviations (which should always be provided in studies re- porting the findings of a discriminant analysis) and by using information about the direction of coding of categorical vari- ables and of scoring of continuous variables. (The reader should note that it is always necessary to provide numerical values for categorical values, e.g., by coding continuers 2 and noncontinuers 1. The analysis can be done only ifall variables have numerical values, even though these values are not meaningful in a numerical sense. This is often referred to in
398 NANCY E. BETZ
computer manuals and elsewhere as dummy coding.) In the present case, positive coefficients are associated with students' intention to take more math courses, and negative coefficients with their intention to discontinue their study of math. The negative value for sex indicates the association of being a male (coded 1) versus being a female (coded 2) with the intention to continue studies in math. Thus, the conditions of being a male, being less math-anxious, and planning to major in science significantly differentiated students who did from those who did not plan to continue studies in math.
Although statistically significant weights indicate variables that contribute significantly to group differences, intercorre- lations among variables reduce the extent to which the weights and their statistical significance can be considered unambig- uous. Discriminant coefficents are equivalent to partial regres- sion coefficients. Thus, if the predictors are interco~elated, one predictor may have received most of the weight, whereas another may have received little weight (see Bock, 1975, pp. 417-420 for examples; see also Bray & Maxwell, 1982, p. 345). Further, only the standardized weights can be compared in absolute size, because the magnitude of the unstandardized weights varies with different units of measurement of the variables.
In addition to its usefulness in interpreting the variables contributing to the understanding of group differences, dis- criminant analysis can also be used for classification, as illustrated in this example. As was mentioned earlier, the discriminant weights, when multiplied by an individual's standard scores on each variable, yield a discriminant score, and when multiplied by the score means for a group, yield the group centroid. The function used to calculate the stand- ardized discriminant score for the ith individual would be as follows:
Di = - . 75 (Sex)i + .58 (Math Anxiety)~ - .51 (American College Test [ACT] Math Score)~ - . 0 4
(Amount of High School Math) /+ .35 (Science Major Plans)/
Similarly, the group centroid for the continuers would involve multiplying the weights by the group means on the variables.
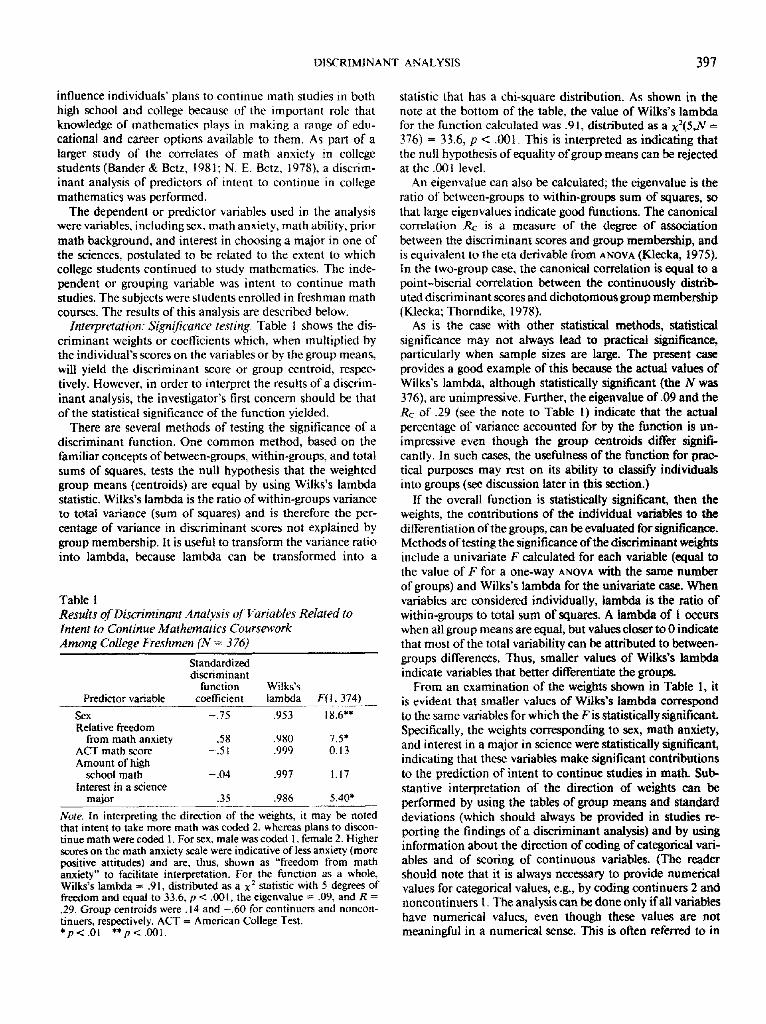
In the present case, the group centroids were .14 for the continuers and - .60 for the noncontinuers.
Figure 1 shows the distribution of individual scores around their own group centroid. Assume, for example, that two subjects, A and B, are selected at random from the sample, without the experimenter's knowledge of the group to which each belongs. The discriminant score for Subject A is calcu- lated as .30 and that for Subject B as -.90. The discriminant score for Subject A is closer to the centroid of the continuers and that for Subject B is closer to that of the centroid of the noncontinuers. Accordingly, we would predict that Subject A would continue and Subject B would not continue studies in math. For further information about the geometric represen- tation of individual discriminant scores around their group centroids and the relation of that to classification, see Tat- suoka ( 1971).
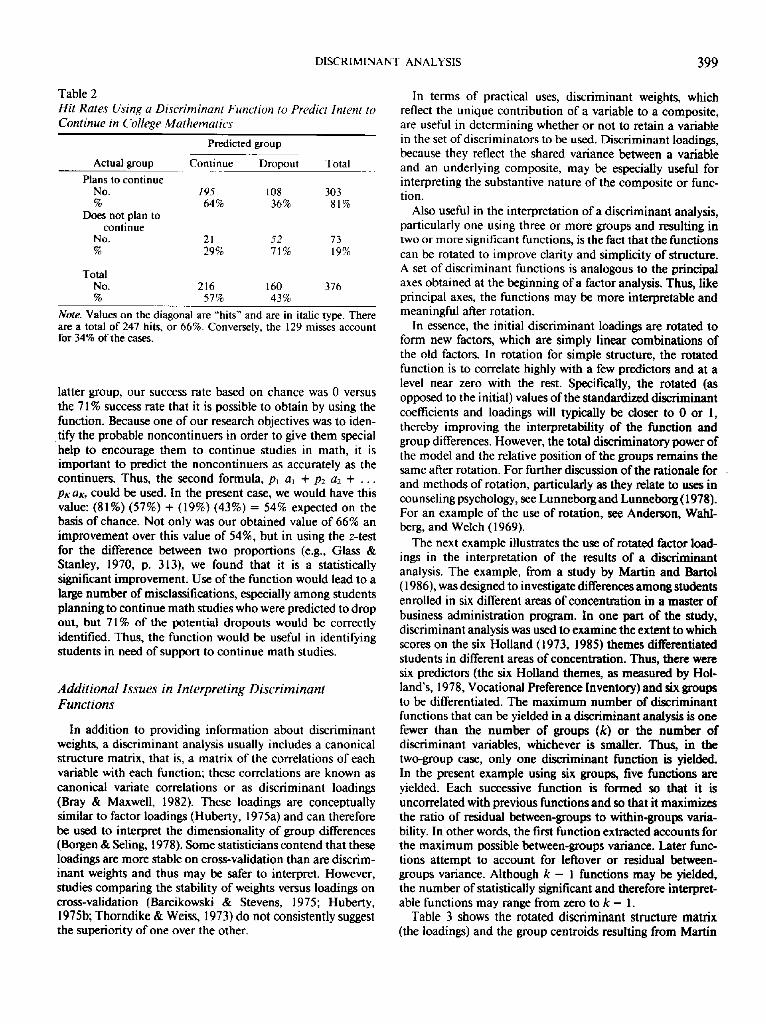
Results concerning the accuracy of the discriminant func- tion in classifying continuers and noncontinuers in math studies are presented by the cross-tabulation shown in Table 2. As shown in the table, the function resulted in correct predictions being made for 66% of the subjects; 64% of the continuers and 71% of the noncontinuers were correctly classified. As was mentioned previously, this percentage may be compared to the percentage of correct predictions that would be possible if alternative strategies were used. If it is assumed that our only alternative strategy is chance predic- tion, this study shows that the two methods of determining the percentage of correct predictions on the basis of chance will yield different conclusions regarding the usefulness of the function in classification.
Because of the disparate size of the two groups, the largest percentage of correct classifications based on chance would be obtained by assigning every individual to the continuer group. In accordance with the formula n/N, where n is the size of the largest group and N is the total sample size, the result was 303/376, or 81%. Clearly our obtained value of 66% is inferior to the result obtained by the latter method of calculating chance accuracy. However, consider the fact that although we correctly predicted 81% of the total number of cases, by predicting that all subjects would be in the continuer group we misclassified all 73 noncontinuers. Thus, for the
Figure 1. Plot of centroids for students planning to continue studies in college math versus those not planning to continue and discriminant scores for Sttbjects A and B.
DISCRIMINANT ANALYSIS 399
Table 2 Hit Rates Using a Discriminant Function to Predict Intent to Continue in College Mathematics
Predicted group
Actual group Continue Dropout Total
Plans to continue No. 195 108 303 % 64% 36% 81%
Does not plan to continue
No. 21 52 73 % 29% 71% 19%
Total No. 216 160 % 57% 43%
376
Note. Values on the diagonal are "hits" and are in italic type. There are a total of 247 hits, or 66%. Conversely, the 129 misses account for 34% of the cases.
latter group, our success rate based on chance was 0 versus the 71% success rate that it is possible to obtain by using the function. Because one of our research objectives was to iden-
t i fy the probable noncontinuers in order to give them special help to encourage them to continue studies in math, it is important to predict the noncontinuers as accurately as the continuers. Thus, the second formula, p, a~ + P2 a2 + . . . pxax, could be used. In the present case, we would have this value: (81%) (57%) + (19%) (43%) = 54% expected on the basis of chance. Not only was our obtained value of 66% an improvement over this value of 54%, but in using the z-test for the difference between two proportions (e.g., Glass & Stanley, 1970, p. 313), we found that it is a statistically significant improvement. Use of the function would lead to a large number of misclassifications, especially among students planning to continue math studies who were predicted to drop out, but 71% of the potential dropouts would be correctly identified. Thus, the function would be useful in identifying students in need of support to continue math studies.
Additional Issues in Interpreting Discriminant Functions
In addition to providing information about discriminant weights, a discriminant analysis usually includes a canonical structure matrix, that is, a matrix of the correlations of each variable with each function; these correlations are known as canonical variate correlations or as discriminant loadings (Bray & Maxwell, 1982). These Ioadings are conceptually similar to factor loadings (Huberty, 1975a) and can therefore be used to interpret the dimensionality of group differences (Borgen & Seling, 1978). Some statisticians contend that these loadings are more stable on cross-validation than are discrim- inant weights and thus may be safer to interpret. However, studies comparing the stability of weights versus Ioadings on cross-validation (Barcikowski & Stevens, 1975; Huberty, 1975b; Thorndike & Weiss, 1973) do not consistently suggest the superiority of one over the other.
In terms of practical uses, discriminant weights, which reflect the unique contribution of a variable to a composite, are useful in determining whether or not to retain a variable in the set of discriminators to be used. Discriminant loadings, because they reflect the shared variance between a variable and an underlying composite, may be especially useful for interpreting the substantive nature of the composite or func- tion.
Also useful in the interpretation of a discriminant analysis, particularly one using three or more groups and resulting in two or more significant functions, is the fact that the functions can be rotated to improve clarity and simplicity of structure. A set of discriminant functions is analogous to the principal axes obtained at the beginning of a factor analysis. Thus, like principal axes, the functions may be more interpretable and meaningful after rotation.
In essence, the initial discriminant loadings are rotated to form new factors, which are simply linear combinations of the old factors. In rotation for simple structure, the rotated function is to correlate highly with a few predictors and at a level near zero with the rest. Specifically, the rotated (as opposed to the initial) values of the standardized discriminant coefficients and loadings will typically be closer to 0 or 1, thereby improving the interpretability of the function and group differences. However, the total discriminatory power of the model and the relative position of the groups remains the same after rotation. For further discussion of the rationale for and methods of rotation, particularly as they relate to uses in counseling psychology, see Lunneborg and Lunneborg (1978). For an example of the use of rotation, see Anderson, Wahl- berg, and Welch (1969).
The next example illustrates the use of rotated factor load- ings in the interpretation of the results of a discdminant analysis. The example, from a study by Martin and Bartol (1986), was designed to investigate differences among students enrolled in six different areas of concentration in a master of business administration program. In one part of the study, discriminant analysis was used to examine the extent to which scores on the six Holland (1973, 1985) themes differentiated students in different areas of concentration. Thus, there were six predictors (the six Holland themes, as measured by Hol- land's, 1978, Vocational Preference Inventory) and six groups to be differentiated. The maximum number of discriminant functions that can be yielded in a discriminant analysis is one fewer than the number of groups (k) or the number of discriminant variables, whichever is smaller. Thus, in the two-group case, only one discriminant function is yielded. In the present example using six groups, five functions are yielded. Each successive function is formed so that it is uncorrelated with previous functions and so that it maximizes the ratio of residual between-groups to within-groups varia- bility. In other words, the first function extracted accounts for the maximum possible between-groups variance. Later func- tions attempt to account for leftover or residual between- groups variance. Although k - 1 functions may be yielded, the number of statistically significant and therefore interpret- able functions may range from zero to k - 1.
Table 3 shows the rotated discriminant structure matrix (the loadings) and the group centroids resulting from Martin
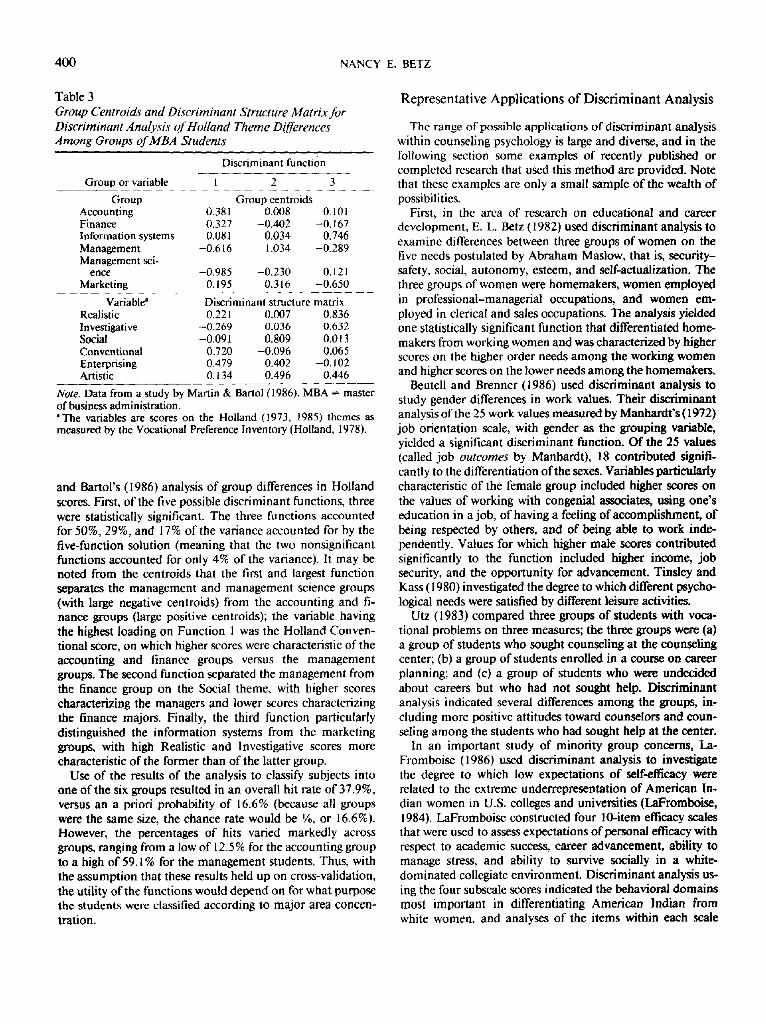
400 NANCY E. BETZ
Table 3 Group Centroids and Discriminant Structure Matrix for Discriminant Analysis of Holland Theme Differences Among Groups of MBA Students
Discriminant function
Group or variable I 2 3
Group Group centroids Accounting 0.381 0.008 0.101 Finance 0.327 -0.402 -0.167 Information systems 0.081 0.034 0.746 Management -0.616 1.034 -0.289 Management sci-
ence -0.985 -0.230 0.121 Marketing 0.195 0.316 -0.650
Variable a Discriminant structure matrix Realistic 0.221 0.007 0.836 Investigative -0.269 0.036 0.632 Social -0.091 0.809 0.013 Conventional 0.720 -0.096 0.065 Enterprising 0.479 0.402 -0.102 Artistic 0.134 0.496 0.446
Note. Data from a study by Martin & Bartol (1986). MBA = master of business administration. "The variables are scores on the Holland (1973, 1985) themes as measured by the Vocational Preference Inventory (Holland, 1978).
and Bartol's (1986) analysis of group differences in Holland scores. First, of the five possible discriminant functions, three were statistically significant. The three functions accounted for 50%, 29%, and 17% of the variance accounted for by the five-function solution (meaning that the two nonsignificant functions accounted for only 4% of the variance). It may be noted from the centroids that the first and largest function separates the management and management science groups (with large negative centroids) from the accounting and fi- nance groups (large positive centroids); the variable having the highest loading on Function l was the Holland Conven- tional score, on which higher scores were characteristic of the accounting and finance groups versus the management groups. The second function separated the management from the finance group on the Social theme, with higher scores characterizing the managers and lower scores characterizing the finance majors. Finally, the third function particularly distinguished the information systems from the marketing groups, with high Realistic and Investigative scores more characteristic of the former than of the latter group.
Use of the results of the analysis to classify subjects into one of the six groups resulted in an overall hit rate of 37.9%, versus an a priori probability of 16.6% (because all groups were the same size, the chance rate would be %, or 16.6%). However, the percentages of hits varied markedly across groups, ranging from a low of 12.5% for the accounting group to a high of 59. 1% for the management students. Thus, with the assumption that these results held up on cross-validation, the utility of the functions would depend on for what purpose the students were classified according to major area concen- tration.
Representat ive Appl ica t ions o f Disc r iminant Analysis
The range of possible applications of discriminant analysis within counseling psychology is large and diverse, and in the following section some examples of recently published or completed research that used this method are provided. Note that these examples are only a small sample of the wealth of possibilities.
First, in the area of research on educational and career development, E. L. Betz (1982) used discriminant analysis to examine differences between three groups of women on the five needs postulated by Abraham Maslow, that is, security- safety, social, autonomy, esteem, and self-actualization. The three groups of women were homemakers, women employed in professional-managerial occupations, and women em- ployed in clerical and sales occupations. The analysis fielded one statistically significant function that differentiated home- makers from working women and was characterized by higher scores on the higher order needs among the working women and higher scores on the lower needs among the homemakers.
Beutell and Brenner (1986) used discriminant analysis to study gender differences in work values. Their discriminant analysis of the 25 work values measured by Manhardt's (1972) job orientation scale, with gender as the grouping variable, yielded a significant discriminant function. Of the 25 values (called job outcomes by Manhardt), 18 contributed signifi- cantly to the differentiation of the sexes. Variables particularly characteristic of the female group included higher scores on the values of working with congenial associates, using one's education in a job, of having a feeling of accomplishment, of being respected by others, and of being able to work inde- pendently. Values for which higher male scores contributed significantly to the function included higher income, job security, and the opportunity for advancement. Tinsley and Kass (1980) investigated the degree to which different psycho- logical needs were satisfied by different leisure activities.
Utz (1983) compared three groups of students with voca- tional problems on three measures; the three groups were (a) a group of students who sought counseling at the counseling center; (b) a group of students enrolled in a course on career planning; and (c) a group of students who were undecided about careers but who had not sought help. Discriminant analysis indicated several differences among the groups, in- cluding more positive attitudes toward counselors and coun- seling among the students who had sought help at the center.
In an important study of minority group concerns, La- Fromboise (1986) used discriminant analysis to investigate the degree to which low expectations of self-efficacy were related to the extreme underrepresentation of American In- dian women in U.S. colleges and universities (LaFromboise, 1984). LaFromboise constructed four 10-item efficacy scales that were used to assess expectations of personal efficacy with respect to academic success, career advancement, ability to manage stress, and ability to survive socially in a white- dominated collegiate environment. Discriminant analysis us- ing the four subscale scores indicated the behavioral domains most important in differentiating American Indian from white women, and analyses of the items within each scale
DISCRIMINANT ANALYSIS 401
indicated the areas of perceived deficit versus competence characterizing each group.
Note the utility of LaFromboise's study in both understand- ing the obstacles faced by American Indian women and in the design of interventions targeted toward those areas of behavioral performance in which the efficacy expectations of American Indians are particularly low relative to those of Anglo women. LaFromboise also notes that discriminant analysis is especially useful in the study of cross-cultural issues because of the diagnostic information it provides when sub- jects are misclassified. Exploration of the background and experience of American Indians whose diseriminant scores were more similar to the Anglo centroid could contribute to attempts to assist American Indian women.
In the therapeutic area, Sloat, Leonard, and Gutsch (1983) compared drug users and nonusers on the scales of the 16 Personality Factor Questionnaire. The discriminant analysis indicated that 8 of the 16 scales significantly differentiated users from nonusers. Not only do these findings contribute to the understanding of the personality correlates of drug abuse, but the classification methods of discriminant analysis could be used to compare the discriminant scores of individuals in high risk populations with user and nonuser centroid scores to derive a predicted group membership, thus identifying individuals at risk for abuse.
Discriminant analysis can be very useful in some types of theory testing and explication. For example, the E. L. Betz (1982) study described earlier used the method to examine the applicability of Maslow's need theory to women's career development. Other stage theories, for example those of Super, Perry, Chickering, Erikson, or Kohlberg, could be further explicated by examination of the degree to which various individual difference variables differentiated individ- uals at various stages postulated by the theory. Discriminant analysis is one useful method for the study of individual and group differences and, as was mentioned earlier, is useful as a follow-up examination of the univariate effects contributing to a significant multivariate F. Finally, the research studies used as examples at the beginning of this article all represent areas for the fruitful application of discriminant analytic techniques.
Discussion and Summary
Cautions in the Use of Discriminant Analysis
In order to use any statistical method, it is necessary to understand the mathematical and distributional assumptions inherent in the technique and to ensure that the characteristics of the data do not violate these assumptions. In the case of discriminant analysis, it is assumed (a) that there is linearity in the relation between predictors, (b) that the continuous variables come from a multivariate normal population, and (c) that the covariance matrices for the groups are equal. Therefore, the researcher should first check the distributions of the individual variables for significant departures from normality and the bivariate scatterplots for deviations from
linearity. (Normality of the individual distributions is a nec- essary though not sufficient requirement for multivariate normality.) The equality of group covariance matrices can be tested by using Box's M test (cf. Norusis, 1985), which tests the null hypothesis of equality of the matrices.
Recently several new approaches to checking the assump- tions of multivariate normality and homoscedasticity have been developed, for example, Hawkins's (198 l) procedure, which is available on the BMDP and SAS software packages. The effects of violation of these assumptions, which include reductions in the accuracy of prediction and decreased stabil- ity in discriminant weights, are reviewed in detail by Dillon and Goldstein (1984). Dillon and Goldstein also discuss meth- ods of handling cases in which some of the predictors are discrete rather than continuous.
Discriminant analysis, like multiple regression, is a max- imization procedure; that is, it locates the set of weights (the linear equation) that maximizes the correlation between the predictor set and group membership. All maximization pro- cedures capitalize on sample-specific covariation, and dis- criminant analysis is no exception. Note that to ensure that a discriminant function is valid and generalizable beyond the sample in which it was initially derived, it should be cross- validated to determine the stability of the weights and the actual predictive accuracy of the equation. Thorndike (1978) provides an example of how the size of discriminant loadings and of the canonical correlation can shrink dramatically atter cross-validation.
In order to minimize the capitalization on sample-specific error, it is useful to perform an a priori test for profile separation by using Hotelling's T 2 (see Harris, 1975; Morri- son, 1976). Although a statistically significant value of T 2 cannot be considered unambiguous, because this statistic is susceptible to sample-specific error, performance of further discriminant analyses after obtaining a nonsignificant T 2 test result is likely to extract sample-specific rather than general- izable group differences.
A final caution arises from the conceptual basis ofdiscrim- inant analysis, specifically its emphasis on difference and its deemphasis on similarity. Thus, the method exacerbates a sometimes unfortunate tendency to emphasize difference rather than similarity in the field of psychology as a whole. For example, findings of gender or racial similarities are almost never viewed as conceptually interesting, yet if they are viewed within the larger context of a society which fosters gender and racial differences, they gain a unique and major import. Thus, the theoretical importance and meaning of human difference versus similarity should be a con,,/ideration of our research.
Resources for Further Study
For readers who would like additional information about discriminant analysis, a variety of references is available. For a readable and informative overview of multivariate methods, including discriminant analysis, see Weiss's chapter in Dun- nette's (1976) Handbook of Industrial and Organizational Psychology. Brown and Tinsley (1983) also provide a readable
402 NANCY E. BETZ
and understandable summary of discriminant analysis, with an emphasis on its use in leisure research. Most major texts on multivariate or correlational methods have chapters on discriminant analysis; some of the more helpful include Tat- suoka's ( 1971 ) Multivariate Analysis, Thorndike's (1978) Cor- relational Procedures for Research, Marascuilo and Levin's (1983) Multivariate Statistics in the Social Sciences, and Dillon and Goldstein's (1984) Multivariate Analysis. Most computer packages are a good source of reviews of the meth- ods available; some of them are quite extensive. See, for example, Norusis's (1985) SPSS Advanced Statistics Guide for a detailed discussion of discriminant analysis and its interpretation. Goldstein and Dillon (1978) review six com- puter programs that are helpful in the performance ofdiscrim- inant analyses.
At a more advanced level are Morrison's (1976, 1983) texts on multivariate methods, Huberty's (1975a) review of dis- criminant analysis, Tatsuoka's (1971) excellent discussion of the geometric representation of the results of discriminant analysis, particularly when there are two or more significant functions, Lunneborg and Lunneborg's (1978) discussion of rotation, Borgen and Seling's (1978) comparison of discrimi- nant analysis to univariate ANOVAS following MANOVA, and Harris's (1975) treatment of Hotelling's T: statistic, including discussion of its use for profile analysis.
Summary
Discriminant analysis provides information that contrib- utes to an increased understanding of the nature, extent, and dimensionality of group differences, as well as to the predic- tion of group membership for purposes of selection, place- ment, and intervention, and for testing stage and taxonomic theories. The utility of this method, like many others, has not been fully appreciated in counseling psychology. It is hoped that this introduction will increase readers' interest in and ability to appropriately use discriminant analysis.
References
Anderson, G. J., Wahlberg, H. J., & Welch, W. W. (1969). Curriculum effects on the social climate of learning: A new representation of discriminant functions. American Educational Research Journal, 6, 315-328.
Bander, R. S., & Betz, N. E. (1981). The relationship of sex and sex role to trait and situationally specific anxiety types. Journal of Research in Personality, 15, 312-322.
Barcikowski, R. S., & Stevens, J. P. (1975). A Monte Carlo study of the stability of canonical correlations, canonical weights, and ca- nonical variate variable correlations. Multivariate Behavioral Re- search, 10, 353-364.
Betz, E. L. (1982). Need fulfillment in the career development of women. Journal of Vocational Behavior, 20, 53-66.
Betz, N. E. (1978). Prevalence and correlates of math anxiety in college students. Journal of Counseling Psychology, 25, 441-448.
Beuteil, N. J., & Brenner, O. C. (1986). Sex differences in work values. Journal of Vocational Behavior. 28, 1-10.
Bock, R. D. (1975). Multivariate statistical methods in behavioral research. New York: McGraw Hill.
Borgen, F. H., & Seling, M. J. (1978). Uses of discriminant analysis following MANOVA: Multivariate statistics for multivariate purposes. Journal of Applied Psychology, 63, 689-697.
Bray, J. H., & Maxwell, S. E. (1982). Analyzing and interpreting significant MANOVA'S. Review of Educational Research, 52, 340- 367.
Brown, M. T., & Tinsley, H. E. A. (1983). Discriminant analysis. Journal of Leisure Research, 15, 290-310.
Cronbach, L. J.. & Gleser, G. C, (1965). Psychological tests and personnel decisions (2nd ed.). Urbana: University of Illinois Press.
Dillon, W. R., & Goldstein, M. (1984). Multivariate analysis. New York: Wiley.
Dixon, W. J. (Chief Ed.). (1985). BMDP Statistical Software Manual. Berkeley: University of California Press.
Efron, B. (1983). Estimating the error rate of a prediction rule: Improvement on cross-validation. Journal of the American Statis- tical Association, 78, 316-33 I.
Fisher, R. A. (1936). The use of multiple measurements in taxonomic problems. Annuals of Eugenics, L 179-188.
Glass, G. V., & Stanley, J. C. (1970) Statistical methods in education and psychology. Englewood Cliffs, N J: Prentice-Hall.
Goldstein, M., & Dillon, W. R. (1978). Discrete discriminant analysis. New York: Wiley.
Harris, R. J. (1975). A primer of multivariate statistics. New York: Academic Press.
Hawkins, D. M. (1981). A new test for multivariate normality and homoscedasticity. Technometrics, 23, 105-110.
Hays, W. E, (1981). Statistics (2rid ed.). New York: Holt, Rinehart, & Winston.
Holland, J. L. (1973). Making vocational choices: A theory of careers. Englewood Cliffs, N J: Prentice-Hall.
Holland, J. L. (1978). Vocational Preference Inventory manual. Palo Alto, CA: Consulting Psychologists Press.
Holland, J. L. (1985). Making vocational choices: A theory of voca- tional personalities and work environments (2nd ed.). Englewood Cliffs, N J: Prentice-Hall.
Huberty, C. J. (1975a). Discriminant analysis. Review of Educational Research, 45, 543-598.
Huberty, C. J. (1975b). The stability of three indices of variable contribution in discriminant analysis. Journal of Experimental Education, 44, 59-64.
Klecka, W. R. (1975). Discriminant analysis. In N. Nie, C. Hull, J. Jenkins, K. Steinbrenner, & D. Bent (Eds.), SPSS (2nd ed.). New York: McGraw-Hill.
LaFromboise, T. D. (1984). Professionalization of American Indian women in postsecondary education. Journal of College Student Personnel, 25, 470-472.
LaFromboise, T. D. (1986). Self-efficacy expectations in Native American and Anglo college women. Unpublished manuscript. Stanford University, Stanford, CA.
Lunneborg, C. E., & Lunneborg, P. W. (1978). Improved counseling information through rotation of discriminant functions. Educa- tional and Psychological Measurement, 38, 737-754.
Manhardt, P, J. (1972). Job orientation among male and female graduates in business. Personnel Psychology, 25, 361-368.
Marascuilo, L. A., & Levin, J. R. (1983). Multivariate statistics in the social sciences: A researcher's guide. Monterey, CA: Brooks/Cole.
Martin, D. C., & Bartol, K. M. (1986). Holland's Vocational Prefer- ence Inventory and the Myers-Briggs Type Indicator as predictors of vocational choice among Master's of Business Administration. Journal of Vocational Behavior, 29, 51-65.
Meehl, P. E., & Rosen, A. (1955). Antecedent probability and the efficiency of psychometric signs, patterns, or cutting scores. Psy- chological Bulletin, 52, 194-216.
DISCRIMINANT ANALYSIS 403
Morrison, D. F. (1976). Multivariate statistical methods. New York: McGraw Hill.
Morrison, D. F. (1983). Applied linear statistical methods. Englewood Cliffs, N J: Prentice-Hall.
Nie, N. H., Hull, C. H., Jenkins, J. G., Steinbrenner, K., & Bent, D. H. (1975). Statistical package for the social sciences (2nd ed.). New York: McGraw-Hill.
Norusis, M. J. (1985). SPSSX advanced statistics guide. New York: McGraw-Hill.
SAS, Inc. (1985). SAS User's Guide: Statistics (Version 5). Cary, NC: Author.
Sells, L. W. (1982). Leverage for equal opportunity through mastery of mathematics. In S. M. Humphries (Ed.), Women and minorities in science (pp. 7-26). Boulder, CO: Westview.
Sherman, J. (1982). Mathematics the critical filter: A look at some residues. Psychology of Women Quarterly. 6, 428-444.
Sloat, D., Leonard, R., & Gutsch, K. U. (1983). Discriminant analysis for measuring psychotherapeutic change. Measurement and Eval- uation in Guidance, 16. 36-42.
Tatsuoka, M. M. (1971). Multivariate analysis. New York: Wiley. Taylor, K. E., & Weiss, D. J. (1972). Prediction of individual job
termination from measured job satisfaction and biographical data.
Journal t f Vocational Behavior, 2, 123-132. Thorndike, R. M. (1978). Correlationalproceduresfor research. New
York: Halstead. Thorndike, R. M., & Weiss, D. J. (1973). A study of the stability of
canonical correlations and canonical components. Educational and Psychological Measurement, 33, 123-134.
Tinsley, H. E. A., & Kass, R. A. (1980). Discriminant validity of the Leisure Activity Questionnaire and the paragraphs about leisure. Educational and Psychological Measurement, 40, 227-233.
Utz, P. W. (1983). A comparison of three groups of vocationally indecisive students. Journal of Counseling Psychology, 30, 262- 266.
Weiss, D. J. (1976). Multivariate methods. In M. D. Dunnette (Ed.), Handbook of industrial and organizational psychology. Chicago: Rand McNally.
Wiggins, J. S. (1973). Personality and prediction. Reading, MA: Addison-Wesley.
Received April 1, 1986 Revision received December 3, 1986
Accepted December 9, 1986 �9
Instructions to Authors
Articles submitted to the Journal of Counseling Psychology should be concisely written in simple, unambiguous language. They should present material in logical order, starting with a statement of purpose and progressing through an analysis of evidence to conclusions and implications, with the conclusions clearly related to the evidence presented.
Authors should prepare manuscripts according to the Publication Manual of the American Psycholog- ical Association (3rd ed.). All manuscripts must include an abstract of 100-150 words typed on a separate sheet of paper. Typing instructions (all copy must be double-spaced) and instructions o n preparing tables, figures, references, metrics, and abstracts appear in the Manual. Also, all manuscripts are subject to editing for sexist language.
APA policy prohibits an author from submitting the same manuscript for concurrent consideration by two or more journals. APA policy also prohibits duplicate publication, that is, publication of a manuscript that has already been published in whole or in substantial part in another publication. Prior and duplicate publication constitutes unethical behavior, and authors have an obligation to consult journal editors if there is any chance or question that the paper might not be suitable for publication in an APA journal. Authors of manuscripts submitted to APA journals are expected to have available their raw data throughout the editorial review process and for at least 5 years after the date of publication.
Authors will be required to state in writing that they have complied with APA ethical standards in the treatment of their sample, human or animal, or to describe the details of treatment. (A copy of the APA Ethical Principles may be obtained from the APA Ethics Office, 1200 17th Street, N.W., Washington, DC 20036.)
Because reviewers have agreed to participate in an anonymous reviewing system, authors submitting manuscripts are requested to include with each copy of the manuscript a cover sheet, which shows the title of the manuscript, the authors' names and institutional affdiations, and the date the manuscript is submitted. The first page of text should omit the authors' names and affiliations but should include the title of the "manuscript and the date it is submitted. Footnotes containing information pertaining to the authors identity or affiliations should be on separate pages. Every effort should be made to see that the manuscript itself contains no clues to the authors' identity.
Manuscripts should be submitted in triplicate. All copies should be clear, readable, a nd o n paper of good quality. A dot matrix or unusual typeface is acceptable only if it is clear and legible. Authors should keep a copy of the manuscript to guard against loss. Mail manuscripts to the Editor-elect, Lenore W. Harmon, University of Illinois at Urbana-Champaign, College of Education, 1310 South Sixth Avenue, Room 210, Champaign, Illinois 61820.