Embed Size (px)
Citation preview

Pittsburg State University Pittsburg State University
Pittsburg State University Digital Commons Pittsburg State University Digital Commons
Electronic Thesis Collection
Spring 5-12-2017
USE OF DECAHYDRODECABORATE AS FLAME RETARDANTS IN USE OF DECAHYDRODECABORATE AS FLAME RETARDANTS IN
POLYURETHANES POLYURETHANES
Austin W. Bailey Pittsburg State University, [email protected]
Follow this and additional works at: https://digitalcommons.pittstate.edu/etd
Part of the Polymer Chemistry Commons
Recommended Citation Recommended Citation Bailey, Austin W., "USE OF DECAHYDRODECABORATE AS FLAME RETARDANTS IN POLYURETHANES" (2017). Electronic Thesis Collection. 205. https://digitalcommons.pittstate.edu/etd/205
This Thesis is brought to you for free and open access by Pittsburg State University Digital Commons. It has been accepted for inclusion in Electronic Thesis Collection by an authorized administrator of Pittsburg State University Digital Commons. For more information, please contact [email protected].
USE OF DECAHYDRODECABORATE AS FLAME RETARDANTS IN
POLYURETHANES
A Thesis Submitted to the Graduate School
in Partial Fulfillment of the Requirements
for the Degree of
Master of Science
Austin Bailey
Pittsburg State University
Pittsburg, Kansas
April, 2017

USE OF DECAHYDRODECABORATE AS FLAME RETARDANTS IN
POLYURETHANES
Austin Bailey
APPROVED:
Thesis Advisor ______________________________________________________
Dr. Charles Neef, Chemistry Department
Committee Member ______________________________________________________
Dr. Petar Dvornic, Chemistry Department
Committee Member ______________________________________________________
Dr. Jeanne Norton, Engineering Technology Department
Committee Member ______________________________________________________
Dr. Tim Dawsey, College of Technology

iii
ACKNOWLEDGEMENTS
I would like to thank my advisor and mentor, Dr. Charles Neef, for his guidance,
instruction, and advice along the path of obtaining this degree. Dr. Neef brought me into
his lab when I only had a spark of interest in chemistry, and allowed me to expand that
spark into a flame. It is due to him bringing me in and allowing me to work in his
laboratory that I decided to stay on to obtain my Master degree at Pittsburg State. He has
always supported me in research, and in classes taken from him.
I appreciate my committee members, Dr. Petar Dvornic, Dr. Tim Dawsey, and Dr.
Jeanne Norton, for being willing to take the time to read, advise, and correct me during
the thesis process.
I would like to thank Pittsburg State University Graduate and Continuing studies
for funding my position as a graduate teaching assistant, as well as the Chemistry
Department for appointing me to it.
I would like to thank Etco Specialty Products, Inc. and Ben Peters for the
continued support through providing the polyurethanes for my research. Ben also
provided troubleshooting advice when it came to the polyurethanes and the flame
retardant incorporation, for which I am thankful.
I would also like to thank the Polymer Chemistry Initiative for funding the repairs
for the cone calorimeter. Along with the repairs the Polymer Chemistry Initiative funded
a specialist to come out and aid in the repairs and to train me in its usage. Without that
funding parts of my research couldn’t have happened.

iv
USE OF DECAHYDRODECABORATE AS FLAME RETARDANTS IN
POLYURETHANES
An Abstract of the Thesis by
Austin Bailey
There is a growing need for non-halogenated flame retardants due to the toxicity
and environmental impacts that are exhibited by current ones. The polyurethane industry
is one that has expressed a need for flame retardants in many of its industrial and
commercial applications. For these reasons, two different decaborate compounds,
tetramethyl and tetrabutyl ammonium decahydrodecaborate, were synthesized and
incorporated into polyurethane films for testing. The compounds were characterized
using Fourier Transform Infrared (FT-IR) spectroscopy, Proton-Nuclear Magnetic
Resonance (1H-NMR) spectroscopy, Carbon-Nuclear Magnetic Resonance (13C-NMR)
spectroscopy, and Boron-Nuclear Magnetic Resonance (11B-NMR) spectroscopy. The
compounds were incorporated into a polyol mixture at various weight percentages, mixed
with methylene diphenyl diisocyanate (MDI), and cast as either thin films on glass plates
or in a fixture for cone calorimetry samples. Thermal stability and flammability of the
films were tested using a standard burn chamber and via thermogravimetric analysis
(TGA) in nitrogen. To investigate potential synergistic effects, the decaborate compounds
were incorporated with triphenylphosphine oxide (TPPO) and tested. These combinations
were tested using the standard burn test chamber, thermal stability in nitrogen, and cone
calorimetry. The cone test provided heat release rates and smoke release rates. Per the
results of these tests, the combination of the new decaborate, and triphenylphosphine
oxide showed potential for flame retardancy at minimal amounts of flame retardant.

v
TABLE OF CONTENTS
CHAPTER PAGE
1. Introduction ................................................................................................................. 1
1.1 Flame Retardants and Environmental Effects ........................................................... 1
1.2 Current Flame Retardants for Polyurethanes ............................................................ 4
1.3 Previous Studies with Boron as a Flame Retardant .................................................. 5
1.4 Polyurethane Synthesis ............................................................................................. 8
1.5 Project Rationale ....................................................................................................... 9
2. Experimental .............................................................................................................. 10
2.1 Materials and Methods ............................................................................................ 10
2.2 Synthesis of Decaborate .......................................................................................... 11
2.3 Casting of Thin Films .............................................................................................. 12
2.4 Casting of Cone Calorimeter Samples .................................................................... 12
2.5 Design of Experiment.............................................................................................. 13
3. Results and Discussion .............................................................................................. 17
3.1 Product Synthesis .................................................................................................... 17
3.2 Product Characterization ......................................................................................... 19
3.3 Thermal Properties .................................................................................................. 25
3.4 Thin Film Burn Test ................................................................................................ 31
3.5 Cone Calorimetry .................................................................................................... 39
4. Conclusion ................................................................................................................. 47
4.1 Future Research ....................................................................................................... 48
REFERENCES ................................................................................................................. 49
APPENDIX A ................................................................................................................... 56
THERMAL STABILITY AND FLAMMABILITY DATA ........................................ 56

vi
LIST OF TABLES:
TABLE PAGE
Table 1: Amounts of Flame Retardant 1 and 2 in Polyurethane Blends. .......................... 14
Table 2: Amounts of Flame Retardant 1 and 2 in Polyurethane Blends. .......................... 15
Table 3: Amounts of Flame Retardant 1 and 2 in Polyurethane Blends. .......................... 16

vii
LIST OF FIGURES
FIGURE PAGE
Figure 1: Boric Acid Structure ............................................................................................ 6
Figure 2: Hexagonal Boron Nitride Structure34 .................................................................. 7
Figure 3: Zinc Borate Structure .......................................................................................... 7
Figure 4: Sodium Borate Decahydrate Structure ................................................................ 8
Figure 5: Structure of [B10H10]2- Anion.......................................................................... 19
Figure 6: FT-IR Spectra of TBAD and TMAD ................................................................ 20
Figure 7: 1H-NMR spectrum for TMAD .......................................................................... 20
Figure 8: 13C-NMR spectrum of TMAD. ......................................................................... 21
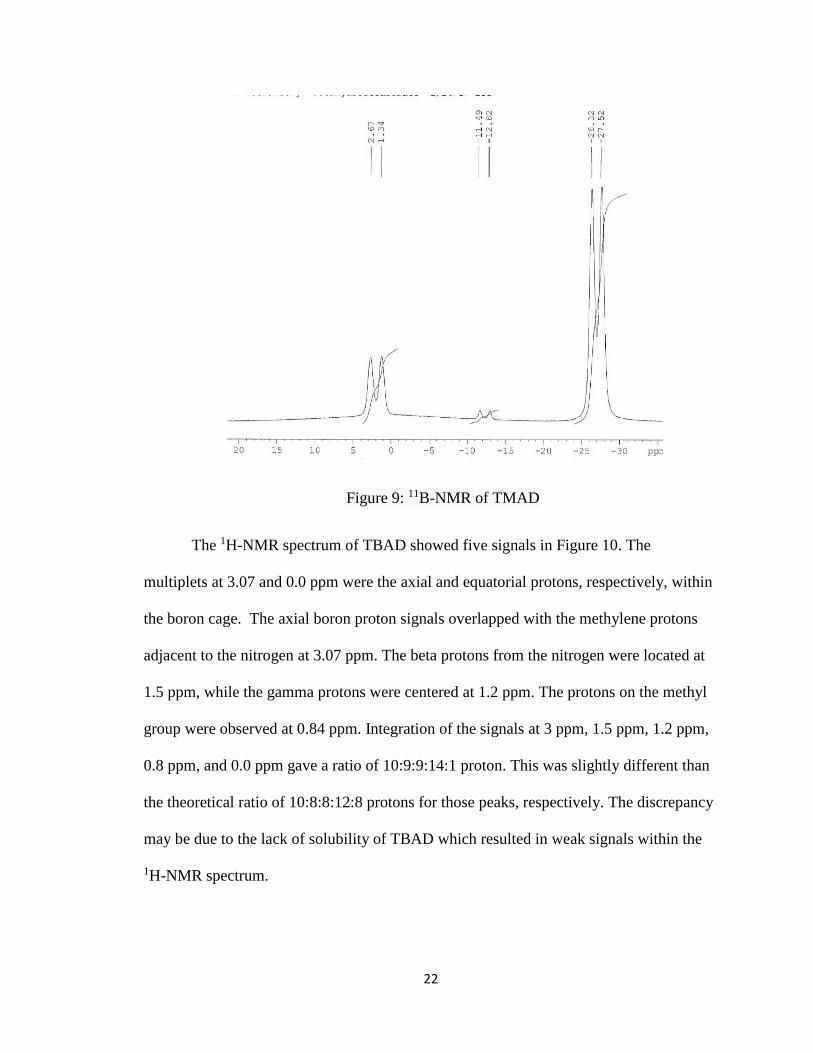
Figure 9: 11B-NMR of TMAD .......................................................................................... 22
Figure 10: 1H-NMR spectrum for TBAD ......................................................................... 23
Figure 11: 13C-NMR for TBAD ........................................................................................ 24
Figure 12: 11B-NMR for TBAD ........................................................................................ 24
Figure 13: TGA of Control Sample .................................................................................. 26
Figure 14: Plot of TGA char yield versus amount of decaborate incorporation ............... 27
Figure 15: Plot of TGA 5% weight loss versus amount of decaborate incorporation ...... 28
Figure 16: Contour plot of char yield in nitrogen vs %TPPO and %TBAD .................... 29
Figure 17: Contour Plot of Char Yield in Nitrogen vs %TPPO and %TMAD................. 29
Figure 18: Contour Plot of 5% Weight Loss Temp for TBAD......................................... 30
Figure 19: Contour Plot of 5% Weight Loss Temp for TMAD ........................................ 31
Figure 20: Plot of burn rate versus amount of decaborate incorporation ......................... 33
Figure 21: Plot of weight loss versus amount of decaborate incorporation ...................... 33
Figure 22: Contour Plot of Burn Rate for TBAD ............................................................. 35
Figure 23: Contour Plot of Weight Loss % for TBAD ..................................................... 35
Figure 24: Contour Plot of Burn Rate for TMAD ............................................................ 36
Figure 25: Contour Plot of Weight Loss % for TMAD .................................................... 36
Figure 26: Contour Plot of Burn Rate vs % TPPO and %TBAD ..................................... 37
Figure 27: Contour Plots of Weight Loss vs %TPPO and %TBAD................................. 38
Figure 28: Contour Plot of Burn Rate vs % TPPO and %TMAD .................................... 38
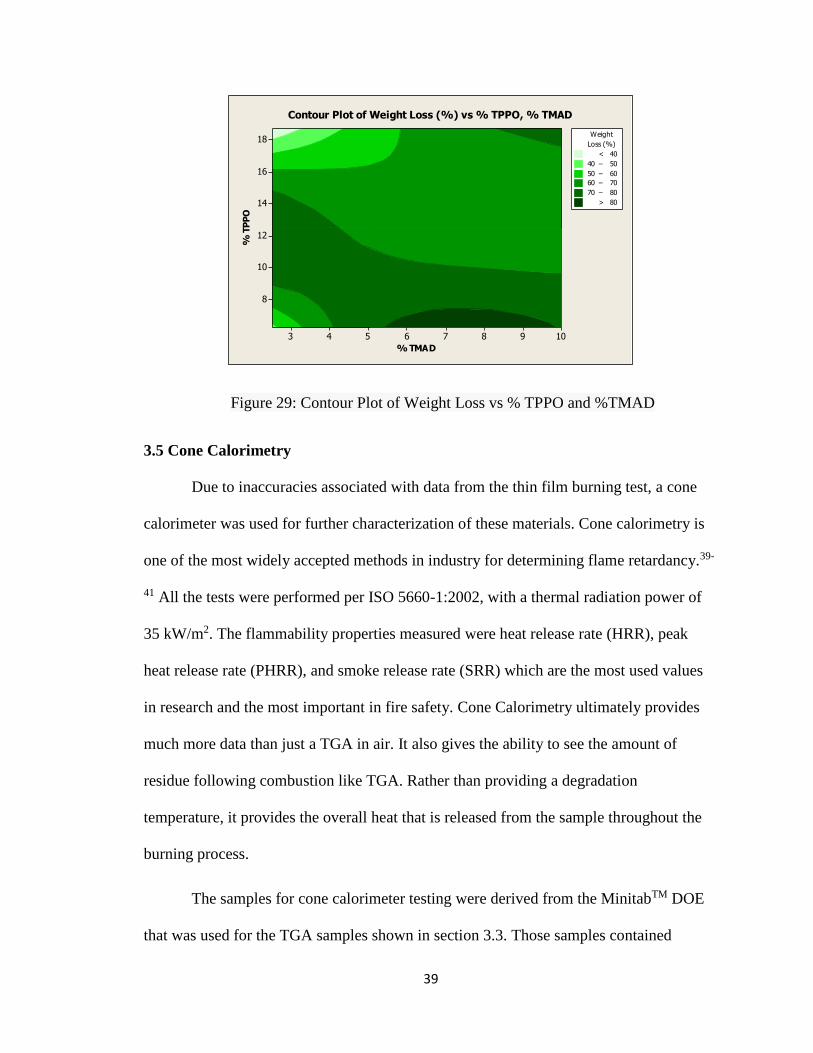
Figure 29: Contour Plot of Weight Loss vs % TPPO and %TMAD ................................ 39
Figure 30: Plot of HRR for TBAD Materials and Base Material ..................................... 41
Figure 31: Contour Plot of PHRR vs %TBAD, %TPPO .................................................. 42
Figure 32: HRR of TMAD and base material ................................................................... 43
Figure 33: Contour Plot of PHRR vs %TMAD, %TPPO ................................................. 44
Figure 34: HRR of Boric Acid, Base and Representative Runs ....................................... 45
Figure 35: Smoke Production Rate for Representative Runs ........................................... 46

viii
LIST OF SCHEMES
SCHEME PAGE
Scheme 1: Reaction of 4-4-MDI with a diol ....................................................................... 8
Scheme 2: Ion Exchange Process ..................................................................................... 17
Scheme 3: Conversion to of Hydronium Decaborate to TMAD or TBAD ...................... 18

ix
LIST OF ABBREVIATIONS
LOI – Limiting oxygen index
MDI – Methylene diphenyl diisocyanate
TGA – Thermogravimetric analysis
TPPO – Triphenylphosphine oxide
DOE- Design of experiment
1-FAT-One factor at a time
TMAD- Tetramethylammonium decahydrodecaborate
TBAD- Tetrabutylammonium decahydrodecaborate
PHRR- Peak Heat Release Rate
SRR- Smoke Release Rate
HRR- Heat Release Rate
FT-IR-Fourier Transform Infrared
1H-NMR-Proton Nuclear Magnetic Resonance
13C-NMR-Carbon Nuclear Magnetic Resonance
11B-NMR-Boron Nuclear Magnetic Resonance
NMR-Nuclear Magnetic Resonance

1
Chapter I
1. Introduction
1.1 Flame Retardants and Environmental Effects
As polymers grow in popularity, there is a need to address the inherent
flammability of some of these materials. This flammability comes from materials that
have lots of carbon present in their chains. Also, there are some polymeric materials that
have anti-flammability properties, however these materials tend to be more expensive
than adding a flame retardant to the commodity materials. To address the inherent
limitation of some polymers, flame retardants are often required. Flame retardants are
used in polymers for a multitude of reasons, depending on the specific application for the
polymer. The flame-retardant properties required vary with the application: clothing
requires the creation of an inert char layer that can protect the wearer, while the
automotive industry is focused on providing time before spreading of the fire to give time
for escape or rescue. In the electronics industry, they are used to prevent ignition inside
the devices, while the construction industry uses them to slow or to stop the spread of the
fire.1-4
Halogenated flame retardants have been used in polymers for years but not
without having environmental and toxicology problems. It is due to those problems that
consumers, governments, and countries have made a push to remove halogenated

2
products.5 Many of these compounds are environmentally persistent and can
bioaccumulate, causing health problems when sufficient quantities are encountered.
Health problems can include causing lower IQ6 and thyroid problems in humans.7
Multiple studies have concluded that halogenated compounds bioaccumulate including
one that studied the accumulation of polychlorinated biphenyls and polybrominated
diphenylethers in snails in the Taihu Lake area of China.8 Also, upon combustion
halogenated materials produce toxic gases and large amounts of smoke which is
problematic. These toxic gases can include brominated furans, dioxins, and hydrogen
chloride gas just to name a few.9 Most of the gases have been found to be carcinogenic as
well.10 To circumvent these problems, non-halogenated materials are needed which are
significantly more environmentally friendly.11 However, the non-halogenated materials
have one major problem in that they have to be designed for specific classes of polymers
unlike the halogens which can be applied to a multitude of applications and polymers.5
With the push for more environmentally friendly fillers and/or additives, there has
been considerable research to develop new flame retardants. Non-halogenated systems that
are typically used include: phosphorous-based12-14, nitrogen-based5, silicon-based15-16,
boron-based17-18, intumescent systems19-21, mineral fillers5, or metal hydroxides.22-24 The
phosphorous-based systems are used in either oxygen or nitrogen containing polymers and
promote the formation of a char layer. Also, the thermal decomposition products for these
materials act in the condensed/vapor phase. Nitrogen containing polymers also behave as
flame retardants by acting in the condensed/vapor phase. The silicon-based flame
retardants are known for substantially improving thermal stability as well as heat
resistance. An important aspect of these flame retardants is that they produce much less

3
toxic gases compared to halogenated flame retardants. Intumescent systems grow and
increase in volume when heat is applied. This is indicated by the formation of an expanded
carbon char layer creating an insulating layer that protects substrates. In addition, mineral
fillers that are used as flame retardants are inorganic compounds and functional fillers.
Metal hydroxides decompose endothermically releasing non-flammable molecules, and
therefore reduce the number of molecules that can ignite.25
In order to understand the use of these materials, the different mechanisms of flame
retardancy must be understood. There are four flame retardant mechanisms that are
observed: poisoning/vapor phase, dilution, char formation, and intumescence. (1) The
poisoning mechanism occurs by interfering with the flame by releasing gases that are
denser then oxygen and thus starving the flame of the oxygen needed to continue. (2) The
dilution mechanism is a combination of mechanisms in that water in the gas phase is
released to cool the overall flame temperature, along with the creation of a char layer to
insulate the specimen. (3) Char formation occurs when there are substances present that
cause the creation of a charring insulating layer. (4) Intumescence occurs when there is a
char that is formed but there is a foaming mechanism that is also present to prevent both
flame and oxygen from reaching what is material underneath the char.5
There are two ways that flame retardants are incorporated into materials, including
additive and reactive means.26 Additive incorporation is through blending of the materials
into a polymer that requires the increased flame retardant characteristics. This method is
advantageous in that it is less expensive than reactive means, but it has the disadvantages
of affecting the mechanical properties, compatibility, as well as leaching from the
polymer. Additive incorporation can vary from 5 wt% up to 70 wt% depending on the

4
type of flame retardant, with the typical range of 15 wt% to 30 wt% incorporation used
the most. The second method of incorporation is when the flame retardant is bound into
the polymer chain. This is accomplished by copolymerization with a monomer that has
flame retardant properties, or through the creation of a new monomer that has flame
retardant properties.
1.2 Current Flame Retardants for Polyurethanes
Polyurethanes are used in a variety of items that are common to everyday life. These
polyurethane materials have a wide variety of applications, including: elastomeric fibers
like SPANDEXTM, foams in furniture, and insulative automotive doors and seats,
elastomers, coatings, and sealants. These materials are organically based and thus
combust with ease and also produce large amounts of smoke upon combustion.27
Polyurethane films have switched to non-halogenated flame retardants in almost all of
those aforementioned applications. However, these materials still vary substantially in
loading and type. As these are designed for use in polyurethane films, they typically do
not work as well with foams as they require different elements of flame retardance.5
Melamine cyanurate, a nitrogen compound, is typically added with other flame retardants
to achieve the desired properties. One such example is a material developed by
ClariantTM that has 15% melamine cyanurate, and 15% of aluminum phosphinate
(EXOLIT OP). These material combinations have also been explored in lower quantities
at 15%, and 6% respectively, and combined with 6% melamine polyphosphate, and 3%
ultra-fine talc to provide synergistic effects.28 BASFTM also has a formulation that
includes 25 wt.% melamine cyanurate with 5 wt.% resorcinol bis-diphenylphosphate.5
5
In contrast, polyurethane foams typically have halogens incorporated into them as
those provide the best overall flame retardancy benefits. For rigid foams, that additive is
tris (chloroisopropyl) phosphate.5 However, non-halogenated materials do provide some
flame retardant effects as well. Bayer has developed an alternative in dimethyl propane
phosphonate (Levagard® DMPP) to replace the halogenated materials in rigid foams.29 In
flexible foams, a non-halogenated material that is used is a slightly different formulation
of EXOLIT OP; that is used specifically for automotive applications.30 ICL Industrial
Products has produced an alkylphosphate oligomer that has 19% phosphorous content
called FyrolTM PNX.31
1.3 Previous Studies with Boron as a Flame Retardant
Boron-based flame retardants have a wide variety of uses including the promotion of
a char layer and preventing dripping in some polymers. One major advantage of these
flame retardants is that they have shown synergistic effects with nitrogen, phosphorus,
and silicon compounds in fire test performances. Some of the boron-based compounds
even help to stabilize the polymer package during processing.5
A boron-based flame retardant that is currently used in industry due to its lower
environmental effects is boric acid. Even though boric acid provides flame-retardant
effects it has several disadvantages. Being that it is an acidic compound; it can corrode
metal substrates. Also, boric acid is not recommended for incorporation into non-polar
hydrocarbon polymers since it is highly likely to migrate to the polymer surface.5
Researchers in Malaysia showed that varying levels of boric acid in epoxy could provide
increased flame retardance, and that while boric acid decreased the amount of expansion
of the intumescent char layer, it provided increased attachment of the polymer to the
6
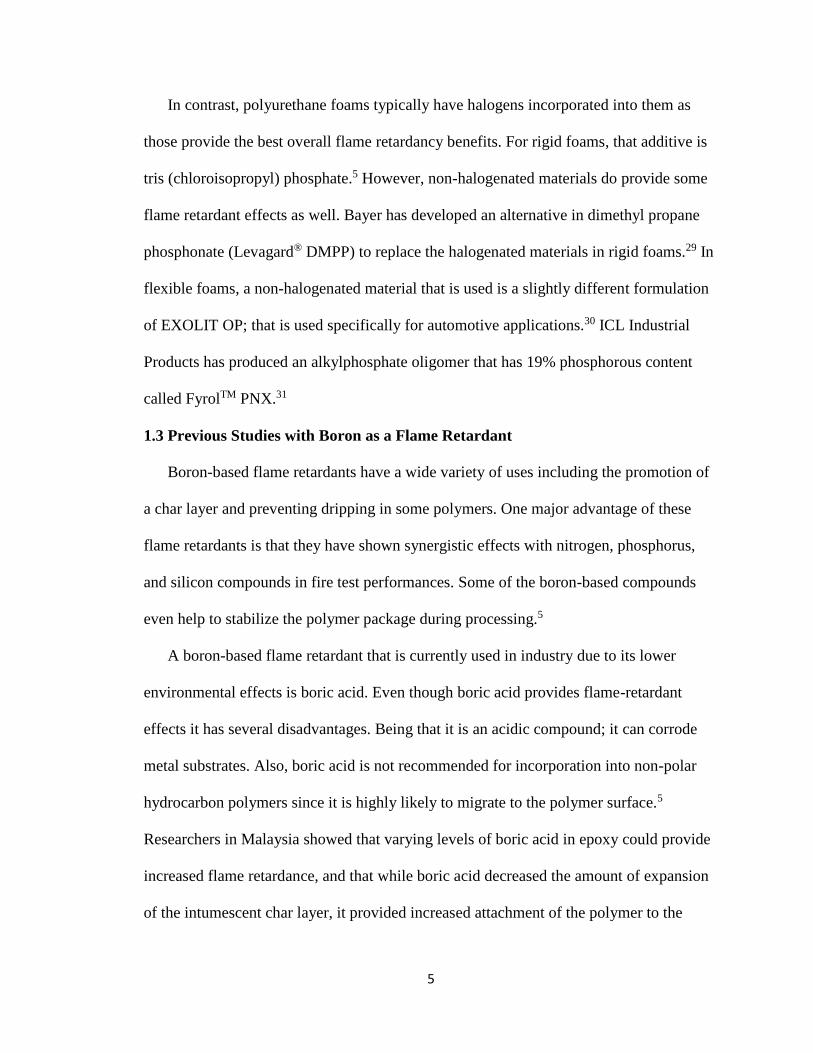
substrate, as well as prevented cracking. Thus, boric acid was able to protect the polymer
substrate underneath the char layer, and this effect subsequently increased as the content
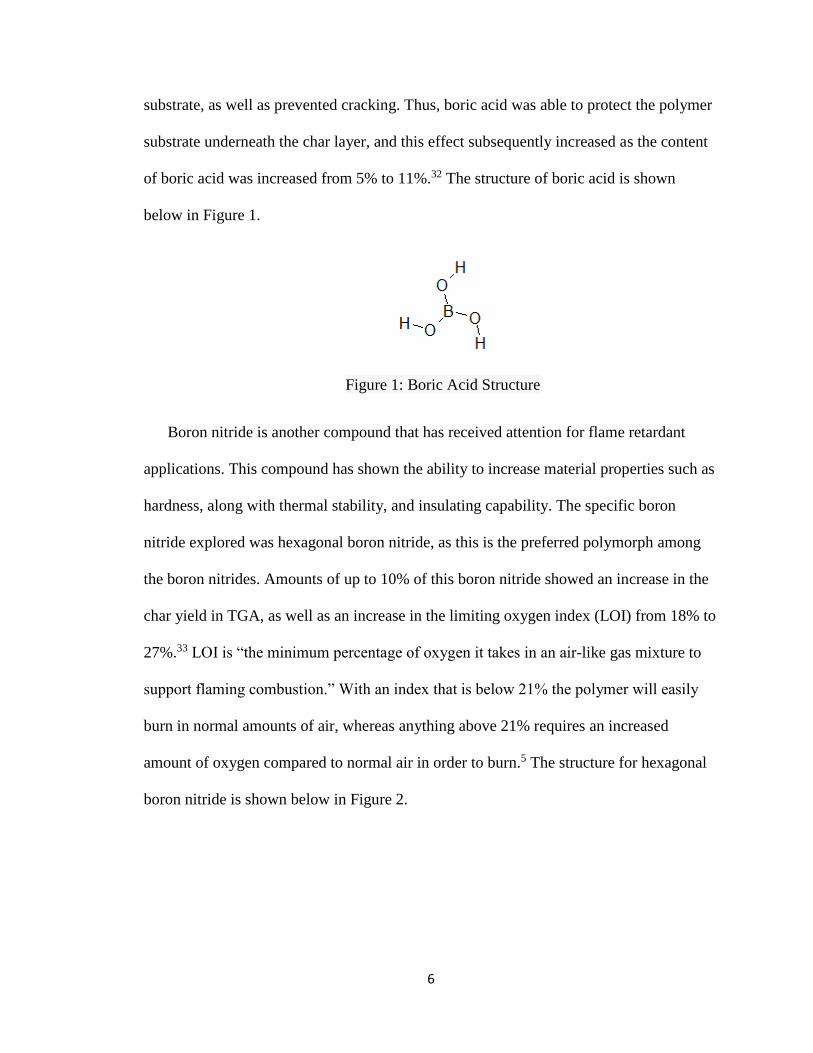
of boric acid was increased from 5% to 11%.32 The structure of boric acid is shown
below in Figure 1.
Figure 1: Boric Acid Structure
Boron nitride is another compound that has received attention for flame retardant
applications. This compound has shown the ability to increase material properties such as
hardness, along with thermal stability, and insulating capability. The specific boron
nitride explored was hexagonal boron nitride, as this is the preferred polymorph among
the boron nitrides. Amounts of up to 10% of this boron nitride showed an increase in the
char yield in TGA, as well as an increase in the limiting oxygen index (LOI) from 18% to
27%.33 LOI is “the minimum percentage of oxygen it takes in an air-like gas mixture to
support flaming combustion.” With an index that is below 21% the polymer will easily
burn in normal amounts of air, whereas anything above 21% requires an increased
amount of oxygen compared to normal air in order to burn.5 The structure for hexagonal
boron nitride is shown below in Figure 2.

7
Figure 2: Hexagonal Boron Nitride Structure34
Metal hydroxides are prevalent in use for flame retardant polymers, and one boron-
based material that is of interest in this category is zinc borate. Even though these
materials are prevalent, they are used with caution as they can reduce the overall
mechanical properties of the polymer. When zinc borate is added in small amounts (15g
in approximately 300g of sample), the LOI increases from 18.4% for the base compound
to 25.3% for the compound with zinc borate. This increase is likely due to the release of
steam upon heating of the material from the crystal water in the chemical structure of the
zinc borate.35 The structure for zinc borate is shown below in Figure 3.
Figure 3: Zinc Borate Structure
Sodium borate decahydrate has also been studied for incorporation into cotton fabrics
to improve flame retardant properties. This material was applied as a non-durable finish

8
on 100% cotton fabric. Using a vertical flame test, at only 4% of incorporation into the
cotton, the incorporated borate resulted in a sample that flamed out and only burned when
directly exposed to the flame. Even at lower levels of up to 1% of borate, there was char
promotion and smoldering.36 The structure for sodium borate decahydrate is shown below
in Figure 4.
Figure 4: Sodium Borate Decahydrate Structure
1.4 Polyurethane Synthesis
The polyurethane used in this work was prepared from a polyol mixture and
methylene diphenyl diisocyanate (4-4-MDI) as shown below in Scheme 1.
Scheme 1: Reaction of 4-4-MDI with a diol
This generalized reaction scheme shows the formation of urethane linkage (-NH-
C(O)O-) by the addition of polyol reacting with an isocyanate and elimination of the
water byproduct. The R-group is used in the scheme because the exact composition of the
polyol mixture was not known to us, being proprietary unavailable information. During

9
the polymerization reaction, there is the potential for water to react with isocyanate,
which would lead to the formation of urea linkages rather than urethane.
1.5 Project Rationale
Halogenated flame retardants have shown extensive use in most applications but
suffer from bioaccumulation and toxic byproducts upon burning. As a replacement,
borates have been extensively employed, but they suffer from drawbacks such as acidity
and limited general use. Thus, the goal of the research was to incorporate novel
decaborate compounds (tetramethylammonium decahydrodecaborate and
tetrabutylammonium decahydrodecaborate) into a standard polyurethane film and
determine their potential use as flame retardants. In addition, triphenylphosphine oxide
was also added to determine potential synergistic effects with decaborate.

10
Chapter II
2. Experimental
2.1 Materials and Methods
Bis(triethylammonium) decahydrodecaborate was supplied by 3M.
Triphenylphosphine oxide, tetramethyl and tetrabutyl ammonium hydroxide were
obtained from Acros Organics. Acetonitrile was obtained from Sigma Aldrich. Boric acid
was obtained from the Fisher Scientific Company. Polyol mixture and methylene
diphenyl diisocyanate (MDI) for polyurethane films were provided by ETCO-Specialty
Products Inc. in Girard, Kansas.
Characterization of the monomer products was achieved using a Bruker
Ultrashield™ 300MHz Nuclear Magnetic Resonance (NMR) spectrometer for 13C, 11B,
and 1H spectra. Infrared spectra were taken on a Perkin-Elmer Spectrum Two™ Fourier
Transform Infrared (FT-IR) L1600400 spectrometer. For the polymer films,
thermogravimetric analysis (TGA) was performed on a TGA-Q50, a product of TA™
Instruments. Standard burn tests were performed in an SDL-Atlas™ vertical flame
chamber, M223M. Cone calorimetry was performed on a Fire Testing Technology,
Limited Cone Calorimeter.

11
2.2 Synthesis of Decaborate
An ion exchange column was prepared by rinsing with 1M sulfuric acid followed
by deionized water until a pH of 7.0 was achieved. Bis(triethylammonium)
decahydrodecaborate (10g) was dissolved in water (500 mL) and added to the column.
Water was added and the aqueous solution was collected until a pH of 7.0 was measured.
The collected solution was titrated with tetramethyl or tetrabutylammonium hydroxide
until the solution was at a pH of 7.0. The tetrabutyl derivative (TBAD) was collected by
vacuum filtration and the tetramethyl derivative (TMAD) had the water removed using a
rotary evaporator. Both compounds were dried in a vacuum oven at 80oC for 12 hours.
TMAD: 1H-NMR (D2O, δ. ppm): 4.69, (2H and Methyl) 3.07, (5H from triethyl) 1.11,
(8H) 0.5--0.5. 13C-NMR (D2O, δ. ppm): (C on Me) 55.285, (C on residual triethyl) 46.78,
and 8.33. 11B-NMR (2B) 2.86, (8B) -26, (Residual B12) -12. IR (solid, cm-1): 2957 (C-H),
2437 (B-H), 1479 (CH3), 1455 (C-N), 1380 (C-H), 1004 (B-B), 882 (B-H deformation),
738 (B-H deformation). TBAD: 1H-NMR (D2O, δ. ppm): 4.72 and 4.69, (2H of B10H10
and 2H of methylene closest to nitrogen) 3.07, (2H of 2nd methylene group from nitrogen)
1.52, (2H of 3rd methylene group from nitrogen) 1.2, (3H of methyl group) 0.8, (8H of
B10H10) -0.5 to 0.3. 13C-NMR (D20, δ. ppm): (CH2 closest to nitrogen) 58.12, (3rd carbon
from nitrogen) 23.18, (2nd carbon from nitrogen) 19.26, (Methyl groups) 12.95. 11B NMR
(D2O, δ. ppm): (B-B) 3.0172 and 1.5194, (Residual B12) -11.3542 and -12.8236, (B-B) -
26.36 and -27.69. IR (solid, cm-1) 3023 (C-H), 2446 (B-H), 1484 (CH3), 1448 (C-N),
1010 (B-B), 948 (B-B), 662 (B-H deformation).

12
2.3 Casting of Thin Films
Polyurethane films for control samples were cast with an 8:2 ratio (w/w) of polyol
mixture (Part A) to MDI (Part B). For polyurethane films containing decaborate, the
amount of MDI was determined based upon the amount of polyol (8:2 ratio (w/w) of
polyol mixture to MDI) and the amount of decaborate (as determined by DOE setup). For
the decaborate containing films, a spatula was used to grind the compound prior to
mixing. In cases where triphenylphosphine oxide (TPPO) was incorporated, TPPO
amounts were determined using a design of experiment (DOE) and varied from 5 wt% to
12.5 wt%. In tetramethylammonium decahydrodecaborate (TMAD) film preparation
acetonitrile was used to dissolve the solids in an amount equal to the weight of solid
material. All tetrabutylammonium decahydrodecaborate (TBAD) films had an amount of
acetonitrile, equal to one half the weight of solid material. Components of the films were
mixed together without MDI, which was then added to the mixture and stirred for 45-60
seconds. This mixture was then poured onto glass plates and cast using a doctor blade for
consistent thickness, nominally 0.025 inches, and allowed to sit at room temperature for
24 hours. Films were cut to make four films of dimensions 5.5 by 1.5 inches, as well as
excess small pieces for use in thermal testing.
2.4 Casting of Cone Calorimeter Samples
Amounts of decaborate and TPPO for samples to be tested by cone calorimetry
were determined using a DOE and varied from 5 wt% to 12.5 wt% for the decaborate and
from 5 wt% to 12.5 wt% for the phosphonium oxide. The mixture of flame retardants
was dissolved in acetonitrile for ease of mixing in the polyurethane. The dissolved flame
retardants were added to the polyol to give a quantity equal to 80% of the remaining

13
mixture needed to obtain a final weight of 80 grams. Isocyanate was added to the mixture
in an amount equal to the remaining mixture weight needed to obtain 80 grams. The
polyurethane mixture was stirred by hand for 15-20 minutes until the mixture began to
become viscous. The mixture was then poured into a mold at dimensions of 100 x 100 x
7-8mm. The mold was then placed into an oven at 50°C for 24 hours to complete curing.
2.5 Design of Experiment
A design of experiment (DOE) is used as a replacement for the traditional change
one factor at a time (1-FAT) approach. This statistical tool is used to identify critical
parameters, identify interactions, and to create a robust process. Ultimately this provides
the capability to optimize the process. By using a DOE in chemistry time and material
can be saved by testing fewer samples at the changing levels of the factors. One does not
need to have a statistical background to create a DOE either, as there are many computer
programs that have been developed to aid in this process. One advantage of using a DOE
is that, no matter the result, something of value is always learned.37
There were three DOEs used for this work. They were based upon a central
composite design, and created in MinitabTM DOE software. The DOE dictated the
percentages of each component to be incorporated into the thin films and the cone
calorimeter samples. The first DOE was a screening DOE with varying amounts of TPPO
and decaborate at 5 %, 8.75 %, and 12.5% each by weight. The second DOE was a full
DOE with recentered amounts of TPPO at 6.25%, 12.5%, and 18.75%, while the amounts
of decaborate were reduced to 2.5%, 5%, and 10%, all by weight. While the previous two
DOEs were used for the thin film burning, the third DOE was used for the cone
calorimeter samples. The third DOE had varying amounts of TPPO and decaborate at

14
5%, 8.75%, and 12.5% each by weight. DOEs 1 and 2 are for 10 g samples while DOE 3
is for 80 gram samples. Shown below are the three DOEs in Tables 1, 2, and 3.
Table 1: Amounts of Flame Retardant 1 and 2 in Polyurethane Blends.
Sample
No.
Decaborate
(wt%)
TPPO
(wt%)
Part A
(g)
Part B
(g)
1 8.75 8.75 6.6 1.65
2 5 5 7.2 1.8
3 5 12.5 6.6 1.65
4 8.75 8.75 6.6 1.65
5 12.5 5 6.6 1.65
6 12.5 12.5 6 1.5

15
Table 2: Amounts of Flame Retardant 1 and 2 in Polyurethane Blends.
Sample
No.
Decaborate
(wt%)
TPPO
(wt%)
Part A
(g)
Part B
(g)
1 12.5 5 6.6 1.65
2 18.75 2.5 6.3 1.58
3 12.5 2.5 6.8 1.7
4 12.5 5 6.6 1.65
5 12.5 10 6.2 1.55
6 18.75 10 5.7 1.43
7 6.25 5 7.1 1.78
8 12.5 5 6.6 1.65
9 6.25 2.5 7.3 1.83
10 12.5 5 6.6 1.65
11 12.5 5 6.6 1.65
12 6.25 10 6.7 1.68
13 18.75 5 6.1 1.53

16
Table 3: Amounts of Flame Retardant 1 and 2 in Polyurethane Blends.
Sample
No.
Decaborate
(wt%)
TPPO
(wt%)
Part A
(g)
Part B
(g)
1 8.75 8.75 52.8 13.2
2 5 5 57.6 14.4
3 8.75 5 55.2 13.8
4 5 12.5 52.8 13.2
5 8.75 12.5 50.4 12.6
6 8.75 8.75 52.8 13.2
7 8.75 8.75 52.8 13.2
8 5 8.75 55.2 13.8
9 12.5 5 52.8 13.2
10 8.75 8.75 52.8 13.2
11 8.75 8.75 52.8 13.2
12 12.5 12.5 48 12
13 12.5 8.75 50.4 12.6

17
Chapter III
3. Results and Discussion
3.1 Product Synthesis
The synthesis of the TMAD and TBAD was straightforward. Triethylammonium
decahydrodecaborate was converted to the hydronium salt via ion exchange (Scheme 2).
Neutralization of the hydronium decaborate with tetramethylammonium or tetrabutyl
ammonium hydroxide gave TMAD or TBAD, respectively (Scheme 3). The products
were obtained in 72.7% and 56.5% yields for TBAD and TMAD, respectively.
Scheme 2: Ion Exchange Process

18
Scheme 3: Conversion to of Hydronium Decaborate to TMAD or TBAD
The decaborate anion is known to have bi-pyramidal formation.38 This complex
self-bonded network is shown in Figure 5. For characterization, there are two types of
borons and protons shown in the cage structure, axial shown as 1 and 10 in Figure 5, and
the others are considered equatorial.

19
Figure 5: Structure of [B10H10]2- Anion
3.2 Product Characterization
TMAD and TBAD were characterized by FT-IR spectroscopy and the spectra are
shown in Figure 6. The spectra have peaks at approximately 2400 cm-1 indicative of a B-
H stretch and a peak at 1000 cm-1 which was consistent with a B-B stretch. Additional
peaks in the spectra were observed at 2950 cm-1 and 1450 cm-1 which can be attributed to
C-H and C-N stretching respectively.
The 1H-NMR spectrum for TMAD showed three signals in Figure 7. The two
multiplets at approximately 3.10 and 0.0 ppm are the protons that are a part of the boron
cage. The signal at 3.10 ppm is due to the axial protons within the B10H102- anion and the
signal at 0.0 ppm is from the equatorial protons. The triplet at 1.17 ppm was due to
residual triethylammonium. The methyl protons were observed at 3.07 ppm. Integration
of the NMR peaks showed the peak at 3 ppm as 1.00. After removal of the
triethylammonium proton integration, the peaks at 3 ppm and 0 ppm are calculated to
show 16 protons and 7 protons which was close to the anticipated 14 protons and 8
protons, respectively.

20
Figure 6: FT-IR Spectra of TBAD and TMAD
Figure 7: 1H-NMR spectrum for TMAD
82
84
86
88
90
92
94
96
98
100
5001000150020002500300035004000
% t
ranm
issi
on
Wavenumber (cm-1)
TBAD
TMAD

21
The 13C-NMR spectrum for TMAD is shown in Figure 8. The signal at 55ppm
was indicative of the methyl carbons. However, the small peaks at approximately 46ppm
and 8ppm showed residual triethylammonium, which was consistent with the 1H-NMR
spectrum.
Figure 8: 13C-NMR spectrum of TMAD.
11B-NMR was also obtained for this sample and it can be seen in Figure 9. The
doublets that are observed are due to the coupling of the 1H-11B within the boron cage.
The axial and equatorial boron signals were observed at 1 and -27, respectively. The
small doublet at -12 is indicative of residual B12 present in the starting material as an
impurity from the manufacturing of the starting compound.
22
Figure 9: 11B-NMR of TMAD
The 1H-NMR spectrum of TBAD showed five signals in Figure 10. The
multiplets at 3.07 and 0.0 ppm were the axial and equatorial protons, respectively, within
the boron cage. The axial boron proton signals overlapped with the methylene protons
adjacent to the nitrogen at 3.07 ppm. The beta protons from the nitrogen were located at
1.5 ppm, while the gamma protons were centered at 1.2 ppm. The protons on the methyl
group were observed at 0.84 ppm. Integration of the signals at 3 ppm, 1.5 ppm, 1.2 ppm,
0.8 ppm, and 0.0 ppm gave a ratio of 10:9:9:14:1 proton. This was slightly different than
the theoretical ratio of 10:8:8:12:8 protons for those peaks, respectively. The discrepancy
may be due to the lack of solubility of TBAD which resulted in weak signals within the
1H-NMR spectrum.

23
Figure 10: 1H-NMR spectrum for TBAD
Figure 11 shows the 13C-NMR spectrum for TBAD. Four signals were observed
at 58 ppm, 23 ppm, 19 ppm, and 12 ppm in the 13C-NMR of TBAD. The peak at 58 ppm
is indicative of the CH2 group alpha to the nitrogen, while the peak at 23 ppm was from
the carbon beta to the nitrogen. The peak at 19 ppm was from the gamma carbon and the
methyl carbon was located at 12 ppm.
The 11B-NMR spectrum was collected for TBAD and can be seen in Figure 12.
The signals from the axial borons were observed as a doublet at 2.5 ppm and the
equatorial borons were shown at -26 ppm.

24
Figure 11: 13C-NMR for TBAD
Figure 12: 11B-NMR for TBAD

25
The doublets that are observed are due to the coupling of the 1H-11B within the
boron cage. These results were similar to the TMAD 11B-NMR spectrum. However, the
baseline in the TBAD spectrum was inconsistent, presumably due to the limited solubility
of TBAD in D2O. The small doublet at -12 ppm and -11 ppm was indicative of residual
B12 present in the starting material as an impurity from the manufacturing of the starting
compound.
3.3 Thermal Properties
3.3.1 Polyurethanes containing TMAD or TBAD
Initial polyurethane samples containing TMAD and TBAD were tested for
thermal stability in nitrogen using thermogravimetric analysis (TGA). Evaluation of each
sample was determined at 5% weight loss and char yield. The weight loss at 5% was
chosen since it is a typical weight loss analyzed in TGA. The TGA of the control sample
of polyurethane with no additives is shown below in Figure 13. The base polyurethane
showed 5% weight loss at 286oC and a char yield of 16.8%.

26
Figure 13: TGA of Control Sample
Figure 14 shows the trend for char yield in nitrogen for the decaborate samples at
10% and 20% decaborate incorporation along with the neat urethane sample. There was a
steady increase in char yield at 10% of decaborate incorporation into the polymer.
However, there was a slight decrease in char yield at 20% incorporation of TBAD into
the polymer suggesting that the polymer was not as thermo-oxidatively stable at the
higher loadings of TBAD. However, the char yield remained higher than the neat
urethane sample. The TMAD sample at 20% provided a char yield of 40% indicating that
it was having a significant impact on the ability to act as a char promoter and was the
only sample with a char yield greater than that of boric acid.

27
Figure 14: Plot of TGA char yield versus amount of decaborate incorporation
Figure 15 shows the 5% weight loss for decaborate samples, boric acid samples,
and neat urethane. Figure 15 showed that TMAD and TBAD samples have a steady
decrease in thermal stability as compared to the neat urethane sample. Within the two
graphs, the 20% decaborate incorporation reaches the expected weight loss at
approximately the same temperature, respectively for each weight loss, for both TBAD
and TMAD. Overall, a decrease in thermal stability was observed with increasing amount
of TMAD or TBAD, indicating negative effects by the decaborate materials.
0
10
20
30
40
50
0 5 10 15 20 25 30
Ch
ar Y
ield
at
60
0°C
(%
of
ori
gin
al m
ass)
% Decaborate Incorporation
TGA-Char Yield vs %Decaborate
Tetrabutyl Tetramethyl Neat Urethane Boric Acid

28
Figure 15: Plot of TGA 5% weight loss versus amount of decaborate incorporation
3.3.2 Polyurethanes containing TMAD or TBAD with TPPO
Per a DOE created in the MinitabTM DOE software, varying amounts of TPPO
and decaborate were incorporated into polyurethane samples. TPPO and decaborate were
incorporated at varying levels of 5%, 8.75%, and 12.5% each by weight. These samples
were tested using TGA in nitrogen. Figures 16 and 17 show the contour plots of the
results for char yield in nitrogen for TBAD and TMAD respectively. The contour shown
in Figure 16 for the TBAD samples showed a consistent trend that as %TPPO was
decreased and %TBAD was increased there was an increase in the char yield. With the
greatest amount of char produced being at 5-6% of TPPO and 10.5-12%+ of TBAD. For
the samples containing TMAD, an increased in char yield was seen at high levels of
TMAD (9-12%), regardless of the amount of TPPO. All the TMAD samples and most of
the TBAD samples did provide an increased char yield as compared to the base urethane
resin.
0
50
100
150
200
250
300
350
0 5 10 15 20 25 305%
wei
ght
loss
tem
per
atu
re (
°C)
%Decaborate Incorporation
TGA-5% Weight Loss vs %Decaborate
Tetrabutyl Tetramethyl Neat Urethane Boric Acid

29
Figure 16: Contour plot of char yield in nitrogen vs %TPPO and %TBAD
Figure 17: Contour Plot of Char Yield in Nitrogen vs %TPPO and %TMAD
The 5% degradation temperature was recorded and the effects that were seen are
dependent upon the decaborate that was incorporated. Figures 18 and 19 show the 5%
%TBAD
% T
PP
O
12111098765
12
11
10
9
8
7
6
5
>
–
–
–
–
–
< 20
20 21
21 22
22 23
23 24
24 25
25
(%)
Yield
Char
Contour Plot of Char Yield (%) vs % TPPO, % TBAD
%TMAD
% T
PP
O
12111098765
12
11
10
9
8
7
6
5
>
–
–
–
–
< 27
27 30
30 33
33 36
36 39
39
(%)
Yield
Char
Contour Plot of Char Yield (%) vs % TPPO, % TMAD

30
weight loss temperatures for TBAD and TMAD samples, respectively. The contour plot
for TBAD samples showed thermal stability ranging from 245-255oC. These results
indicate that the varying amounts of TBAD and TPPO had little effect on the thermal
stability of the polymer.
Figure 18: Contour Plot of 5% Weight Loss Temp for TBAD
For the TMAD samples, the thermal stability ranged from 250-280oC. The
highest thermal stability was achieved when there was 5-6% of both TPPO and TMAD in
the polyurethane sample. These data indicate an increase in thermal stability with
increasing amounts of TMAD and TPPO.
%TBAD
% T
PP
O
12111098765
12
11
10
9
8
7
6
5
>
–
–
–
–
< 245.0
245.0 247.5
247.5 250.0
250.0 252.5
252.5 255.0
255.0
Loss Temp (°C)
5% Weight
Contour Plot of 5% Weight Loss Temp (°C) vs % TPPO, % TBAD

31
Figure 19: Contour Plot of 5% Weight Loss Temp for TMAD
3.4 Thin Film Burn Test
3.4.1 Polyurethanes containing TMAD or TBAD
Burn tests were performed on thin films 5.5 inches long and 1 inch wide with
varying amounts of decaborate incorporation at 10% and 20% by weight. These tests
consisted of lighting one end of the film with a Bunsen burner and allowing ignition to
continue for 10 seconds. The films were allowed to burn to completion, with burn time
and burn distance both being recorded.
The burn time and weight loss percentage was recorded for two to four samples of
each material and averaged. Figure 20 and 21 show the burn rate and weight loss
percentage for the materials containing TBAD, and TMAD, respectively. The control
film was indicated at the 0% decaborate incorporation.
%TMAD
% T
PP
O
12111098765
12
11
10
9
8
7
6
5
>
–
–
–
–
–
–
< 250
250 255
255 260
260 265
265 270
270 275
275 280
280
(°C)
Loss Temp
5% Weight
Contour Plot of 5% Weight Loss Temp (°C) vs % TPPO, % TMAD

32
Burn rate of the TBAD incorporated films showed an increase as compared to the
neat urethane sample. However, there was a decrease in burn rate as the TBAD was
increased from 10 to 20% with a burn rate much closer to that of the neat urethane
sample. Both samples had a lower weight loss percent than the neat urethane sample.
This was because the TBAD material had an affinity to form char thus reducing the
actual weight loss.
The TMAD sample had a weight loss of about 80% at 10 and 20% loadings which
was similar to the weight loss of the neat urethane. These results seem to contradict the
TGA results, as the TGA results in nitrogen showed both materials with an affinity to
char as compared to the base sample. This contradiction could stem from the difference
of atmospheres of nitrogen vs air for the two techniques; as well as from the
inconsistencies within the thin film burning process. However, TGA data was collected in
nitrogen and will differ from data collected in air. TMAD had an increased burn rate at
both loadings. Even with the burn rate a concern with both samples, the potential for
samples that formed char and reduced the overall weight loss percentage was present.

33
Figure 20: Plot of burn rate versus amount of decaborate incorporation
Figure 21: Plot of weight loss versus amount of decaborate incorporation
The boric acid samples had the highest burn rate at 10% loading, but at 20%
loading they actually had the lowest burn rate at almost one half the burn rate of the
decaborate samples. In the burn testing, the boric acid samples had the lowest weight loss
-2
0
2
4
6
8
10
0 5 10 15 20 25 30
Bu
rn r
ate
X1
00
(in
/s)
% Decaborate Incorporation
Burn Rate vs %Decaborate
Tetrabutyl Tetramethyl Neat Urethane Boric Acid
0
20
40
60
80
100
0 5 10 15 20 25 30
Wei
ght
Loss
(%
)
% Decaborate Incorporation
Weight Loss vs %Decaborate
Tetrabutyl Tetramethyl Neat Urethane Boric Acid

34
% at both loadings. At 10% loading, it was approximately 18%, and at 20% loading, it
was 39% weight loss.
3.4.2 Polyurethanes containing TMAD or TBAD with TPPO
As potential for flame retardancy benefits were seen from the previous results, it
was decided that a screening DOE would be used to test for potential of this flame
retardant with TPPO. This DOE of just six runs would allow the ability to see if there
were some sort of synergistic effect between the two flame retardants, decaborate
compounds, and TPPO. The DOE had varied amounts of TPPO and decaborate both at
5%, 8.75%, and 12.5% each. The results for burn rate and for percent weight loss are
shown in Figures 22 and 23 for TBAD, and in Figures 24 and 25 for TMAD.
The results for the TBAD samples shown in Figures 22 and 23 provide quite
different results when compared to the TMAD samples in Figures 24 and 25. For the
TBAD burn rate, the contour showed that the lowest burn rate of the material was
achieved when only 5-6% of TBAD was used and when there was either 5-6% TPPO, or
12% TPPO. This data was interesting because when taken with the weight loss % data
where the lowest % was trying to be achieved, they contradict. For the weight loss
contour, of TBAD the lowest weight loss was achieved when there was only 5% TPPO,
and 11-12% of the TBAD. One of the interesting parts of research was shown here, in
that when trying to work towards improvement of some properties, others may suffer.
The TMAD samples showed a trend that was consistent for both burn rate and weight
loss. That trend was that an increase in %TPPO will give a reduced weight loss, and a
decreased burn rate. The sample ranges for slowest burn rate from TMAD are 5-6%
TMAD, and 5-6% or 12% TPPO. The samples providing lowest weight loss were at 5%

35
TMAD, and at 12% TPPO. Of note for both TBAD and TMAD is that they have samples
that are as good, if not better, for burn rate when compared to the base urethane sample.
Figure 22: Contour Plot of Burn Rate for TBAD
Figure 23: Contour Plot of Weight Loss % for TBAD
% TBAD
% T
PP
O
12111098765
12
11
10
9
8
7
6
5
>
–
–
–
–
–
–
< 3.00
3.00 3.25
3.25 3.50
3.50 3.75
3.75 4.00
4.00 4.25
4.25 4.50
4.50
x100 (in/s)
Burn Rate
Contour Plot of BURN Rate x 100 (in/s) vs % TPPO, % TBAD
% TBAD
% T
PP
O
12111098765
12
11
10
9
8
7
6
5
>
–
–
–
–
< 77
77 78
78 79
79 80
80 81
81
Loss (%)
Weight
Contour Plot of Weight Loss (%) vs % TPPO, % TBAD

36
Figure 24: Contour Plot of Burn Rate for TMAD
Figure 25: Contour Plot of Weight Loss % for TMAD
Based upon the results for the contours above, it was decided to recenter the DOE
amounts and run a full DOE. The recentered DOE is shown in Table 2 in the
experimental section. The %TPPO was at levels consisting of 6.25%, 12.5%, and
% TMAD
% T
PP
O
12111098765
12
11
10
9
8
7
6
5
>
–
–
–
–
< 2.0
2.0 2.2
2.2 2.4
2.4 2.6
2.6 2.8
2.8
(in/s)
x100
Burn Rate
Contour Plot of Burn Rate x 100 (in/s) vs % TPPO, % TMAD
% TMAD
% T
PP
O
12111098765
12
11
10
9
8
7
6
5
>
–
–
–
–
–
< 30
30 40
40 50
50 60
60 70
70 80
80
Loss (%)
Weight
Contour Plot of Weight Loss (%) vs % TPPO, % TMAD

37
18.75%, while the %TBAD or TMAD was at levels of 2.5%, 5%, and 10%. The full DOE
consisted of 13 runs, at those varying levels. The thin films were burned and data analysis
was performed for burn rate and weight loss %. Those results are shown as contour plots
of burn rate x 100 and weight loss % as a function of %TPPO, and %TBAD in Figures 26
and 27, and as a function of %TPPO and %TMAD in Figures 28 and 29, respectively.
The burn rate contour for TBAD showed that the lowest burn rate was achieved
when there was 3% or less of TBAD, and 10-14% of TPPO. The lowest amount of
weight loss for TBAD was achieved when there was less than 3% TBAD, and 12-18%
TPPO. The burn rate contour for TMAD shown in Figure 28, shows that at 10% TPPO,
and 3% TMAD there was a slower burn rate, and that was also achieved at 14-18%
TPPO, and approximately 3-6% TMAD. The least amount of weight loss from burning
the samples was achieved when 18% of TPPO was used with less than 3% of TMAD. Of
note for both decaborate materials is that they provide a good distinction of several
samples that had burn rates just as good, and better than the neat urethane sample.
Figure 26: Contour Plot of Burn Rate vs % TPPO and %TBAD
% TBAD
% T
PP
O
109876543
18
16
14
12
10
8
>
–
–
–
–
–
< 2.2
2.2 2.4
2.4 2.6
2.6 2.8
2.8 3.0
3.0 3.2
3.2
(in/s)
x 100
Burn Rate
Contour Plot of Burn Rate x 100 (in/s) vs % TPPO, % TBAD

38
Figure 27: Contour Plots of Weight Loss vs %TPPO and %TBAD
Figure 28: Contour Plot of Burn Rate vs % TPPO and %TMAD
% TBAD
% T
PP
O
109876543
18
16
14
12
10
8
>
–
–
–
–
< 60
60 65
65 70
70 75
75 80
80
Loss (%)
Weight
Contour Plot of Weight Loss (%) vs % TPPO, % TBAD
% TMAD
% T
PP
O
109876543
18
16
14
12
10
8
>
–
–
–
< 2.0
2.0 2.4
2.4 2.8
2.8 3.2
3.2
(in/s)
x 100
Burn Rate
Contour Plot of Burn Rate x 100 (in/s) vs % TPPO, % TMAD
39
Figure 29: Contour Plot of Weight Loss vs % TPPO and %TMAD
3.5 Cone Calorimetry
Due to inaccuracies associated with data from the thin film burning test, a cone
calorimeter was used for further characterization of these materials. Cone calorimetry is
one of the most widely accepted methods in industry for determining flame retardancy.39-
41 All the tests were performed per ISO 5660-1:2002, with a thermal radiation power of
35 kW/m2. The flammability properties measured were heat release rate (HRR), peak
heat release rate (PHRR), and smoke release rate (SRR) which are the most used values
in research and the most important in fire safety. Cone Calorimetry ultimately provides
much more data than just a TGA in air. It also gives the ability to see the amount of
residue following combustion like TGA. Rather than providing a degradation
temperature, it provides the overall heat that is released from the sample throughout the
burning process.
The samples for cone calorimeter testing were derived from the MinitabTM DOE
that was used for the TGA samples shown in section 3.3. Those samples contained
% TMAD
% T
PP
O
109876543
18
16
14
12
10
8
>
–
–
–
–
< 40
40 50
50 60
60 70
70 80
80
Loss (%)
Weight
Contour Plot of Weight Loss (%) vs % TPPO, % TMAD

40
varying amounts of TPPO with TMAD or TBAD at levels of 5%, 8.75%, and 12.5%.
Figure 30 shows the cone calorimetry results for heat released for the base material and
the samples that had a lower HRR for TBAD. Compared to the base material, most of
the TBAD samples had a lower PHRR, indicative of flame retardancy potential. Most of
the TBAD compounds have a sharp peak as burning begins followed by a decrease in the
HRR. However, the maximum peak heat release rate was observed by a strong increase
between 300-400 seconds or between 500-600 seconds. The sample with 5% TPPO and
5% TBAD did not level off until about 1000 seconds. The sample containing 8.75%
TBAD and 12.5% TPPO had a PHRR just below that of the base sample but it occurred
over four and a half minutes longer to reach. PHRR occurred at 45 seconds for the 5%
TBAD, 5% TPPO sample but it was 93.56 kW/m2 lower of a PHRR as compared to the
base urethane. The 8.75% TBAD, and 5% TPPO sample had a PHRR lower than the base
urethane by 58.23 kW/m2, but it took nine and a half minutes for that PHRR to be
achieved. Heat release rate is considered as one of the driving forces of a fire and PHRR
represents the point where fire is likely to grow and potentially cause flashover to
occur.42

41
Figure 30: Plot of HRR for TBAD Materials and Base Material
Average HRR were also determined from the graph shown in Figure 30. The 5%
TBAD, 5% TPPO and 8.75% TBAD, 5% TPPO samples had an average HRR of 23.25
kW/m2, and 4.15 kW/m2 less than base urethane, respectively. However, the sample at
8.75% TBAD and 12.5% TPPO had an average HRR of 7.34 kW/m2 greater than the base
urethane. Of note, however, was the differences between the total heat that was released.
There were negligible differences of 8-10 Mj/m2 increases in the total HR as compared to
the base urethane sample for the 5% TBAD, 5% TPPO, and 8.75% TBAD, 5% TPPO
samples. The 8.75% TBAD, 12.5% TPPO sample however released 84 Mj/m2 less of heat
than the base urethane sample, showing that the sample at this loading could potentially
be used as a flame retardant.
Figure 31 shows a contour plot of the PHRR for samples containing TBAD.
Materials with lower amounts of TBAD and phosphine oxide compounds provided the
-50
0
50
100
150
200
250
300
350
400
0 200 400 600 800 1000 1200
Hea
t R
elea
se R
ate
(kW
/m^2
)
Time (s)
HRR of TBAD Compounds and Base Material
base 5% TBAD 5% TPPo 8.75% TBAD 5% TPPO 8.75% TBAD 12.5% TPPO

42
lowest PHRR, with the lowest PHRR at 5% of both materials. If samples contained
greater than 8% of TBAD or TPPO an increase in PHRR was observed. The contour plot
also shows that the highest PHRR occurred at two formulations, when there was 5%
TBAD and 12% phosphine oxide compound, and when there was 12% TBAD and 12%
phosphine oxide compound. This shows that adding more flame retardant did not result in
a decrease to the PHRR.
Figure 31: Contour Plot of PHRR vs %TBAD, %TPPO
Figure 32 shows the HRR differences between the base material and the sample
with the lowest PHRR for TMAD. There was only one sample for TMAD that had a
lower PHRR as compared to the base sample. That was the sample with just 5% of each
flame retardant mixed into the compound. The base material and the TMAD curves from
Figure 32, very closely resembled each other except for the TMAD staying somewhat
%TBAD
%TP
PO
12111098765
12
11
10
9
8
7
6
5
>
–
–
–
–
–
–
< 300
300 350
350 400
400 450
450 500
500 550
550 600
600
(kW/m^2)
PHRR
Contour Plot of PHRR (kW/m^2) vs %TPPO, %TBAD

43
high for heat release rate until about 200 seconds. Both materials decrease and then level
off around 650 seconds.
Figure 32: HRR of TMAD and base material
Figure 33 shows a contour plot of the peak heat release rates based upon the
varying weight percent of TMAD and TPPO. As observed for TBAD, the lowest PHRR
was achieved at lower amounts of flame retardants. The lowest PHRR for TMAD and
TPPO was achieved at 5% of each in the compound. Interestingly there were two areas
on the contour plot where the highest PHRR was observed. One was at 5% TPPO and 9-
12 wt% TMAD and the other area was at 12% of TPPO, and 8-11 wt% TMAD.
-50
0
50
100
150
200
250
300
350
400
0 100 200 300 400 500 600 700 800 900 1000
HR
R (
kW/m
²)
Time (s)
HRR of TMAD Compound and Base Material
base 5% TMAD 5% TPPO

44
Figure 33: Contour Plot of PHRR vs %TMAD, %TPPO
Figure 34 shows the peak heat release rates for boric acid as compared to the trials
of the decaborate compounds with the lowest heat release rates. It can be seen for 5%
boric acid that the peak heat release rate was 302.9 kW/m2, average HRR was 134.16
kW/m2. The time when PHRR was achieved was 85s, in addition the total HR was 132.8
Mj/m2. For the 10% boric acid sample, the peak heat release rate was 318.9 kW/m2 at
165s, an average HRR of 142.56 kW/m2, and a total HR of 139.0 Mj/m2. There was a
PHRR difference of 28.68 kW/m2 between the 5% TBAD, 5% TPPO sample and the 5%
boric acid sample, showing the lowest PHRR of the decaborate samples shown in Figure
34, and the boric acid for peak heat release rate. This indicates that TBAD has potential
for flame retardance applications.
%TMAD
%TP
PO
12111098765
12
11
10
9
8
7
6
5
>
–
–
–
–
–
–
< 350
350 400
400 450
450 500
500 550
550 600
600 650
650
(kW/m^2)
PHRR
Contour Plot of PHRR (kW/m^2) vs %TPPO, %TMAD

45
Figure 34: HRR of Boric Acid, Base and Representative Runs
Figure 35 shows the lowest smoke release rates from the two decaborate compounds
and the boric acid. The peak smoke release rate of TBAD was 0.0483 m2/s and the time
required to reach it was 30 seconds. For TMAD, a peak smoke release rate of 0.0826 m2/s
at time 50 seconds was observed and the base material showed a peak smoke release rate
of 0.0421 m2/s at 245 seconds. For the 5% boric acid sample, the peak smoke release rate
was 0.0342 m2/s at 60 seconds. Comparing the smoke production rates of each material
showed that boric acid provided the lowest amount of smoke production. However,
TBAD had a small difference compared to boric acid of 0.0141 m2/s. This small
difference in smoke production supports the potential use of this material as a flame
retardant.
-50
0
50
100
150
200
250
300
350
400
0 200 400 600 800 1000 1200
HR
R (
kW/m
²)
Time (s)
HRR Boric Acid, Base, and Best Runs
5% TBAD 5% TPPO base 5% boric acid 10% boric acid 5% TMAD 5% TPPO

46
Figure 35: Smoke Production Rate for Representative Runs
-0.02
0
0.02
0.04
0.06
0.08
0.1
0 200 400 600 800 1000 1200 1400
SPR
(m
²/s)
Time (s)
Smoke Production Rate for Material's Best Runs
base boric acid 5% 8.75% TBAD 8.75% TPPO 5% TMAD 5% TPPO

47
Chapter IV
4. Conclusion
Synthesis of the TBAD and TMAD was achieved via an ion exchange process,
replacing the triethylammonium ion with tetrabutyl or tetramethyl ammonium ions. This
was performed using an ion exchange column followed by neutralization with tetrabutyl
or tetramethyl ammonium hydroxide to make TBAD and TMAD, respectively. Both
products were characterized by 1H-NMR, 13C-NMR, 11B-NMR, and FT-IR.
TBAD and TMAD were incorporated into polyurethane films at varying levels
providing a baseline performance for the samples. The thermal stability of these materials
was similar to the neat polyurethane but a significant increase in char formation was
observed. Burning of thin films showed that each sample burned to completion. When
TPPO was incorporated into the polyurethane with the decaborates, self-extinguishing
was observed for some samples under thin film burning conditions. The combination
with TPPO provided some synergistic effects and some additive effects, as indicated by
the contour plots in Section 3.4.1. The combination of TPPO and TBAD or TMAD
provided samples with burn rates that were as good, as the base urethane.
Cone calorimeter testing of polyurethane samples with TMAD/TBAD and TPPO
showed heat release rates similar to, or less than, that of the boric acid samples used for
comparison. The decaborate compound with the lowest PHRR gave a value of 274.22

48
kW/m2. While the decaborate sample with the lowest smoke released was slightly greater
for HRR but had a lower smoke release rate with a value of 0.0483 m2/s. Results from
cone calorimeter testing indicate the potential use of these materials in flame retardant
applications.
4.1 Future Research
Continuing research with these materials should include testing with other
polymer resins. As nonhalogenated flame retardants are typically good for only select
polymers for the ideal properties, testing the flame retardant with other polymers could
find one that it actually works with better than the polyurethanes. Also, if the flame
retardant could be incorporated into a higher volume commercial resin, like
polypropylene or polyethylene, that would open up an opportunity for increased usage.
Specific polymers would be polypropylene, polystyrene, and further exploration of
polyurethanes with foams. Further testing outside of cone calorimetry would include LOI
testing and testing for usage in thermal barrier coatings. Testing for thermal barrier
coatings may be justified as these materials do not exhibit the acidic properties of boric
acid, and with the flame retardants affinity to char, it can protect the item underneath the
coating as well.

49
REFERENCES
1. Horrocks, A.; Price D.; Adances in Fire Retardant Materials; Woodhead
Publishing and Maney Publishing: Cambridge, England, 2008.
2. Digges, K.H.; Gann, R.G.; Grayson, S.J.; Hirschler, M.M.; Lyon, R.E.; Purser,
D.A.; Quintiere, J.G.; Stephenson, R.R.; and Tewarson, A.; Improving
Survivability in Motor Vehicle Fires, 2007,
http://fire.nist.gov/bfrlpubs/fire07/PDF/f07065.pdf (accessed March 26th, 2017).
3. Green Science Policy Institute. Electronics Standards.
http://greensciencepolicy.org/topics/electronics-standards/ (Accessed March 16th,
2017)
4. Simon, R.; Goodman, B.; American Chemistry Council.
https://flameretardants.americanchemistry.com/flameretardants/Building-
Construction/How-Flame-Retardants-Are-Used-in-BC/ (Accessed March 20th,
2017)
5. Morgan, A. B.; Wilkie, C. A. Non-Halogenated Flame Retardant Handbook;
Scrivener Publishing: Beverly, MA, 2014.
6. Preedy, V.; Fluorine: Chemistry, Analysis, Function and Effects. The Royal
Society of Chemistry, Cambridge, UK. 2015.
7. Rotblatt, K. Why Halogens are Dangerous to the Thyroid.
http://www.lotussm.com/blog/why-halogens-are-dangerous-to-the-thyroid
(accessed March 19,2017).
8. Yin, G.; Zhou, Y.; Strid, A.; Zheng, Z.; Bignert, A.; Ma, T.; Athanassiadis, I.;
Qiu, Y.; Spatial distribution and bioaccumulation of polychlorinated biphenyls

50
(PCBs) and polybrominated diphenyl etheres (PBDEs) in snails (Bellamya
aeruginosa) and sediments from Taihu Lake area, China, Environmental Science
and Pollution Research. [Online], 2017.
https://link.springer.com/article/10.1007/s11356-017-8467-x (accessed March 19,
2017)
9. Hurtte, F. Anamet Electrical, Inc. Why chen?
http://www.anacondasealtite.com/pdf/Anamet%20Halogen%20Whitepaper%20.p
df (accessed March 19, 2017).
10. Chen, M.; Shao, Z.; Wang X.; Chen L.; Wang Y.; Halogen-Free Flame-Retardant
Flexibly Polyurethane Foam with a Novel Nitrogen-Phosphorous Flame
Retardant, Industrial & Engineering Chemistry Research [Online] 2012, 51,
9769.
11. Hermansson, A.; Hjertberg T.; Sultan B.; The flame retardant mechanism of
polyolefins modified with chalk and silicone elastomer; Fire Materials., 2003, 27,
51.
12. Alongi J.; Frache A.; Flame retardancy properties of α-zirconium phosphate based
composites; Polym. Deg. Stab., 2010, 95, 1928.
13. Chen D.; Zheng F.; Liu F.; Xu K.; Chen M.; Flame-retardant Polypropylene
Composites based on Magnesium Hydroxide Modified by Phosphorous-
containing Polymers; J. Thermoplas. Comp. Mater., 2010, 23, 175.
14. Singh H.; Jain A.; Sharma T.; Effect of phosphorus-nitrogen additives on fire
retardancy of rigid polyurethane foams; J. Applied Polym. Sci., 2008, 109, 2718.

51
15. Hamdani S.; Longuet C.; Perrin D.; Lopez-Cuesta J.; Ganachaud F.; Flame
Retardancy of silicone-based materials; Polym. Deg. Stab., 2006, 94, 465.
16. Li Q.; Zhong H.; Wei P.; Jian P.; Thermal degradation behaviors of polypropylene
with novel silicon-containing intumescent flame retardant; J. Appl. Polym. Sci.,
2005, 98, 2487.
17. Doga M.; Yilmaz A.; Bayramli E.; Synergistic effect of boron containing
substances on flame retardancy and thermal stability of intumescent
polypropylene composites; Polym. Deg. Stab., 2010, 95, 2584
18. Shen. K.; Kochesfahani S.; Jouffret F.; Zinc borates as multifunctional polymer
additives; Polym. Adv. Technol., 2008, 19, 469.
19. Du B.; Ma H.; Fang Z.; How nano-fillers affect thermal stability and flame
retardancy of intumescent flame retarded polypropylene; Polym. Adv. Technol.,
2011, 22, 1139.
20. Jiao C.; Zhang J.; Zhang F.; Combustion Behavior of Intumescent Flame
Retardant Polypropylene Composites; J. Fire Sci., 2008, 26, 455.
21. Li B.; Xu M.; Effect of a novel charring–foaming agent on flame retardancy and
thermal degradation of intumescent flame retardant polypropylene; Polym. Deg.
Stab., 2006, 91, 1380.
22. Sain M.; Park S.; Suhara F.; Law S.; Flame retardant and mechanical properties of
natural fibre–PP composites containing magnesium hydroxide; Polym. Deg. Stab.,
2004, 83, 363.
23. Lomakin S.; Zaikov G.; Koverzanova E.; Thermal Degradation and
Combustibility of Polypropylene Filled with Magnesium Hydroxide Micro-Filler

52
and Polypropylene Nano-Filled Aluminosilicate Composite; Oxid. Commun.,
2005, 28, 451.
24. Antunes M.; Velasco J.; Haurie L.; Characterization of highly filled magnesium
hydroxide-polypropylene composite foam; J. Cell. Plast., 2011, 47, 17.
25. Realinho V.; Antunes M.; Santana O.; Velasco J.; Halogen-Free Flame Retardant
Polyolefin Foams; SPE Foams Event, 2012.
26. Lu, S.-Y.; Hamerton, I.; Recent Developments in the Chemistry of Halogen-Free
Flame Retardant Polymers; Progress in Polymer Science. 2002, 27, 1661-1712.
27. The Essential Chemical Industry Online.
http://www.essentialchemicalindustry.org/polymers/polyurethane.html (accessed
March 19th, 2017)
28. Clariant.
file:///C:/Users/Austin/Desktop/K2013_Exolit_for_Thermoplastic_Elastomers%2
0(1).pdf (Accessed March 20th, 2017)
29. Lanxess Energizing Chemistry.
http://www.virtualpu.com/uploads/user_product_attachments/user_comp_doc1_2
24.pdf (Accessed March 28th, 2017)
30. Clariant. http://www.clariant.com/en/Solutions/Products/2014/03/18/16/31/Exolit-
OP-560 (Accessed March 18th, 2017)
31. ICL Industrial Products. http://icl-ip.com/products/fyrol-pnx/ (Accessed March
28th, 2017)

53
32. Ullah, S.; Ahmad, F.; Yusoff P.; Effect of Boric Acid and Melamine on the
Intumescent Fire-Retardant Coating Composition for the Fire Protection of
Structural Steel Substrates, J. Applied Polymer Science [Online], 2012, 128, 2983.
33. Madakbas, S.; Cakmakci, E.; Kahraman, M.; Preparation and thermal properties
of polyacrylonitrile/hexagonal boron nitride composites; Thermochimica Acta
[Online], 2012, 552, 1.
34. Kopeliovich, D.; Boron Nitride as Solid Lubricant.
http://www.substech.com/dokuwiki/doku.php?id=boron_nitride_as_solid_lubrica
nt (accessed: April 20, 2017).
35. Ramazani, S.; Rahimi, A.; Frounchi, M,; Radman, S.; Investigation of flame
retardancy and physical-mechanical properties of zinc borate and aluminum
hydroxide propylene composites, Science Direct [Online], 2008, 29, 1051.
36. Motashari, S.; Fayyaz, F.; TG of a Cotoon Impregnated by Sodium Borate
Decahydrate (Na2B4O710H2O) as a Flame-Retardant, J. Thermal Analysis and
Calorimetry [Online] 2008, 93, 933.
37. Del Vecchio, R.J.; Design of Experiments; Hanser/Gardner Publications.;
Cincinnati, Ohio; 1997.
38. Ghaida, F.; Laila, Z.; Ibrahim, G.; Naoufal, D.; Mehdi, A.; New triethoxysilylated
10-vertex closo decaborate clusters. Synthesis and controlled immobilization into
mesoporous silica. Dalton Transactions [Online], 2014, 43, 13087.
39. Zanetti M.; Camino G.; Thomann R.; Mulhaupt R.; Synthesis and thermal
behaviour of layered silicate–EVA nanocomposites; Polym. Papers, 2001, 42
4501.

54
40. Zanetti M.; Kashiwagi T.; Falqui L.; Camino G.; Cone Calorimeter Combustion
and Gasification Studies of Polymer Layered Silicate Nanocomposites; Chem.
Mater. Papers, 2002, 14, 881-887.
41. Gilman J.; Jackson C.; Morgan A.; Harris R.; Mania J.; Giannelis E.; Wuthenow
M.; Hilton D.; Phillips S.; Flammability Properties of Polymer−Layered-Silicate
Nanocomposites. Polypropylene and Polystyrene Nanocomposites; Chem. Mater.
Papers, 2000, 12, 1866-1873.
42. Papaspyrides, C. D.; Kiliaris, P.; Polymer Green Flame Retardants; Elsevier:
Oxford, 2014.

APPENDIX

56
APPENDIX A
THERMAL STABILITY AND FLAMMABILITY DATA

57
A.1 BURN DATA
Table S1: Burn Data from Screening DOE
% TPPO % Decaborate % Loss Burn Rate x 100 (in/s)
12.5 5 TBAD 79.38 2.93
5 5 TBAD 79.08 3.12
8.75 8.75 TBAD 81.02 3.88
8.75 8.75 TBAD 77.91 3.33
5 12.5 TBAD 76.53 4.02
12.5 12.5 TBAD 77.26 4.55
12.5 5 TMAD 22.30 7.33
5 5 TMAD 80.47 2.06
8.75 8.75 TMAD 77.45 2.75
8.75 8.75 TMAD 74.71 2.51
5 12.5 TMAD 75.82 2.78
12.5 12.5 TMAD 72.94 2.99
Table S2: Burn Data from Recentered DOE
% TPPO % Decaborate % Loss Burn Rate x 100 (in/s)
12.5 5 TBAD 82.11 2.55
18.75 2.5 TBAD 61.33 2.94
12.5 2.5 TBAD 55.88 2.09
12.5 5 TBAD 82.37 2.44
12.5 10 TBAD 78.01 3.23

58
18.75 10 TBAD 79.42 3.16
6.25 5 TBAD 76.96 2.70
12.5 5 TBAD 79.03 3.06
6.25 2.5 TBAD 79.29 2.58
12.5 5 TBAD 79.02 2.77
12.5 5 TBAD 79.51 3.03
6.25 10 TBAD 76.67 3.23
18.75 5 TBAD 79.30 2.26
12.5 5 TMAD 77.88 2.50
18.75 2.5 TMAD 30.39 2.00
12.5 2.5 TMAD 78.58 2.07
12.5 5 TMAD 77.35 2.09
12.5 10 TMAD 66.35 2.56
18.75 10 TMAD 72.74 3.38
6.25 5 TMAD 77.64 2.90
12.5 5 TMAD 84.57 2.05
6.25 2.5 TMAD 47.36 1.62
12.5 5 TMAD 44.55 2.00
12.5 5 TMAD 54.18 2.09
6.25 10 TMAD 79.33 2.76
18.75 5 TMAD 54.87 1.80

59
A.2 CONE CALORIMETRY DATA
Table S3: Cone Calorimetry HRR Data for Base Material and TBAD and TMAD
Sample/
Run No.
Peak HRR
(kW/m2)
Time to
Peak (s)
Average
HRR
(kW/m2)
Total HR
(Mj/m2)
Base 367.78 90 181.06 160.2
TBAD 1 299.51 50 123.53 155.6
TBAD 2 274.22 45 157.81 168.1
TBAD 3 309.55 570 176.91 170.8
TBAD 4 292.69 355 109.79 164.1
TBAD 5 366.65 365 188.4 76.2
TBAD 6 288.96 600 156.31 173.5
TBAD 7 328.71 30 75.52 168.5
TBAD 8 331.49 330 137.14 167.3
TBAD 9 636.11 450 248.18 179.9
TBAD 10 298.27 335 175.53 174.7
TBAD 11 337.67 330 187.24 167.6
TBAD 12 590.78 350 244.09 188.0
TBAD 13 411.91 325 230.31 178.5
TMAD 1 556.07 65 189.11 163.6
TMAD 2 330.04 70 180.65 148.1
TMAD 3 675.84 50 220.28 161.9
TMAD 4 533.52 60 221.46 171.6

60
TMAD 5 684.97 60 199.21 176.3
TMAD 6 471.45 70 252.76 183.3
TMAD 7 520.21 65 199.97 164.0
TMAD 8 458.95 70 210.09 170.2
TMAD 9 646.15 385 246.54 152.9
TMAD 10 385.43 425 192.04 145.0
TMAD 11 429.15 440 198.14 145.6
TMAD 12 570.62 75 192.37 141.4
TMAD 13 508.52 85 185.91 142.2
Table S4: SRR results for All Samples
Sample/
Run No.
PSRR
(m2/s)
Time (s)
Base 0.0421 245
Boric Acid
5%
0.0342 60
Boric Acid
10%
0.0417 460
TBAD 1 0.0483 30
TBAD 2 0.0832 605
TBAD 3 0.0733 580
TBAD 4 0.0655 330
TBAD 5 0.0940 355
TBAD 6 0.0925 585
TBAD 7 0.1021 585
TBAD 8 0.0769 315
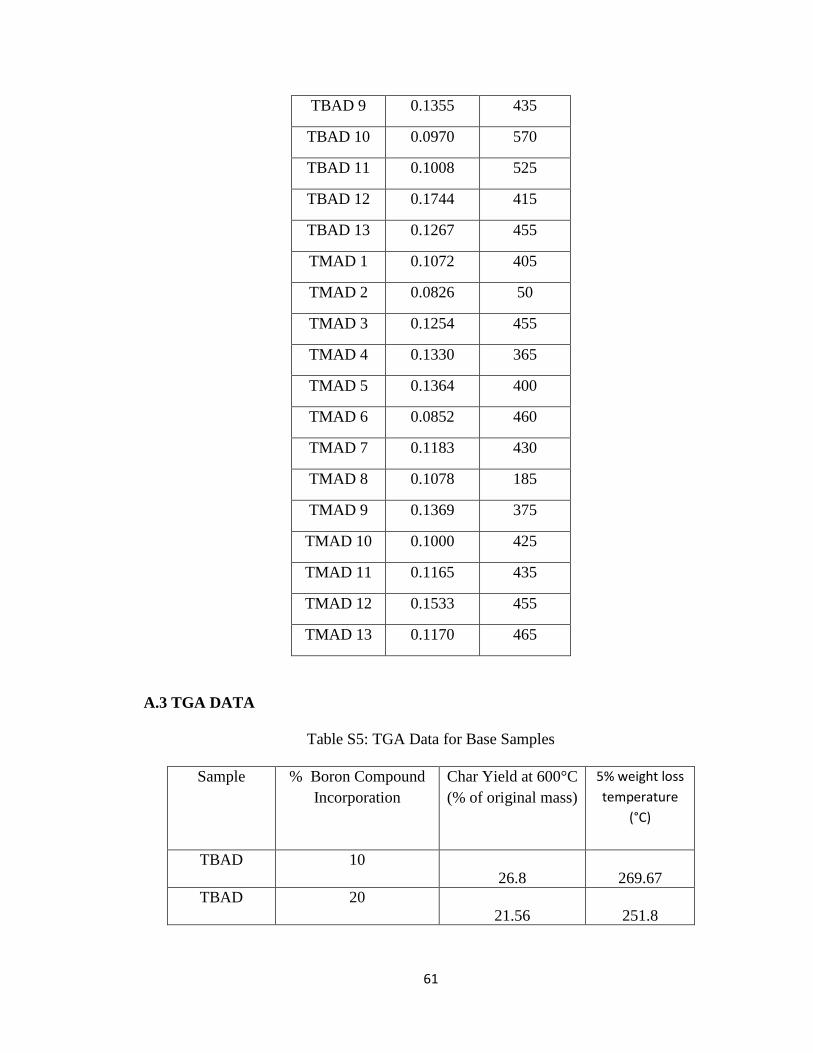
61
TBAD 9 0.1355 435
TBAD 10 0.0970 570
TBAD 11 0.1008 525
TBAD 12 0.1744 415
TBAD 13 0.1267 455
TMAD 1 0.1072 405
TMAD 2 0.0826 50
TMAD 3 0.1254 455
TMAD 4 0.1330 365
TMAD 5 0.1364 400
TMAD 6 0.0852 460
TMAD 7 0.1183 430
TMAD 8 0.1078 185
TMAD 9 0.1369 375
TMAD 10 0.1000 425
TMAD 11 0.1165 435
TMAD 12 0.1533 455
TMAD 13 0.1170 465
A.3 TGA DATA
Table S5: TGA Data for Base Samples
Sample % Boron Compound
Incorporation
Char Yield at 600°C
(% of original mass)
5% weight loss
temperature
(°C)
TBAD 10
26.8 269.67
TBAD 20
21.56 251.8

62
TMAD 10
28.68 286.17
TMAD 20
39.76 254.09
CONTROL 0
17.89 291.67
BORIC ACID 10
24.72 269.67
BORIC ACID 20
27.23 151.44
Table S6: TGA Data for Cone Samples
%TBAD % TPPO 5% Weight Loss Temp (°C) Char Yield (%)
8.75 8.75 249.05 23.59
12.5 5 251.34 25.22
12.5 12.5 245.39 25.02
12.5 8.75 244.47 24.75
8.75 8.75 249.51 24.09
5 12.5 248.59 19.94
8.75 5 255.93 24.46
8.75 12.5 245.84 22.37
5 8.75 255.01 20.44
5 5 245.39 21.94
%TMAD % TPPO 5% Weight Loss Temp (°C) Char Yield (%)
8.75 8.75 269.67 30.72
12.5 5 262.8 38.17
12.5 12.5 246.3 41.27
12.5 8.75 260.97 32.86
8.75 8.75 258.68 45.63
5 12.5 263.72 25.76
8.75 5 266.47 39.5
8.75 12.5 252.26 37.02

63
5 8.75 270.13 29.67
5 5 280.21 29.86