Embed Size (px)
Citation preview

Use of Cutoffs for Mid-Upper Arm Circumference (MUAC) as an Indicator or Predictor of Nutritional and Health- Related Outcomes in Adolescents and Adults: A Systematic Review
Alice M. TangKimberly DongMegan DeitchlerMei ChungZeina Maalouf-ManassehAlison TumilowiczChristine Wanke November 2013
FANTAFHI 3601825 Connecticut Ave., NW Washington, DC 20009-5721Tel: 202-884-8000 Fax: 202-884-8432 [email protected] www.fantaproject.org

Use of Cutoffs for Mid-Upper Arm Circumference (MUAC) as an Indicator or Predictor of Nutritional and Health-Related Outcomes in Adolescents and Adults: A Systematic Review
Alice M. Tang Kimberly Dong Megan Deitchler Mei Chung Zeina Maalouf-Manasseh Alison Tumilowicz Christine Wanke
November 2013
Food and Nutrition Technical Assistance III Project (FANTA) FHI 360 1825 Connecticut Avenue, NW Washington, DC 200009 T (202) 884-8000 F (202) 884-8432 [email protected] www.fantaproject.org

This report is made possible by the generous support of the American people through the support of the Office of Health, Infectious Diseases, and Nutrition and the Office of HIV/AIDS, Bureau for Global Health, U.S. Agency for International Development (USAID), under terms of Cooperative Agreement No. AID-OAA-A-12-00005, through the Food and Nutrition Technical Assistance III Project (FANTA), managed by FHI 360. The contents are the responsibility of FHI 360 and do not necessarily reflect the views of USAID or the United States Government. November 2013
Recommended Citation
Tang, Alice M.; Dong, Kimberly; Deitchler, Megan; Chung, Mei; Maalouf-Manasseh, Zeina; Alison Tumilowicz, Alison; Wanke, Christine. 2013. Use of Cutoffs for Mid-Upper Arm Circumference (MUAC) as an Indicator or Predictor of Nutritional and Health-Related Outcomes in Adolescents and Adults: A Systematic Review. Washington, DC: FHI 360/FANTA.
Contact Information
Food and Nutrition Technical Assistance III Project (FANTA) FHI 360 1825 Connecticut Avenue, NW Washington, DC 20009-5721 T 202-884-8000 F 202-884-8432 [email protected] www.fantaproject.org

Use of Cutoffs for Mid-Upper Arm Circumference (MUAC) as an Indicator or Predictor of Nutritional and Health-Related Outcomes in Adolescents and Adults: A Systematic Review
i
Contents
Abbreviations and Acronyms .................................................................................................................... ii
1 Introduction ......................................................................................................................................... 1
2 Methods ................................................................................................................................................ 2 2.1 Literature Search ........................................................................................................................... 2 2.2 Study Selection and Eligibility Criteria ........................................................................................ 2 2.3 Data Synthesis and Presentation ................................................................................................... 3
3 Results .................................................................................................................................................. 5 3.1 Cross-Sectional Studies................................................................................................................. 6
3.1.1 Adolescents ....................................................................................................................................... 6 3.1.2 Adults ................................................................................................................................................ 6 3.1.3 The Elderly........................................................................................................................................ 6 3.1.4 Pregnant Women ............................................................................................................................... 8
3.2 Longitudinal Studies ..................................................................................................................... 8 3.2.1 Adults ................................................................................................................................................ 8 3.2.2 The Elderly...................................................................................................................................... 10 3.2.3 Pregnant Women ............................................................................................................................. 10
3.3 Diagnostic Test Accuracy of MUAC .......................................................................................... 10
4 Discussion........................................................................................................................................... 12
References .................................................................................................................................................. 15
Annex 1. Supplemental Tables ................................................................................................................. 20
LIST OF TABLES
Table 1. Summary of Study Inclusion and Exclusion Criteria ...................................................................... 2 Supplemental Table 1A. Adolescents ......................................................................................................... 20 Supplemental Table 1B. The Elderly .......................................................................................................... 21 Supplemental Table 1C. Adults .................................................................................................................. 22 Supplemental Table 1D. Pregnant Women ................................................................................................. 26 Supplemental Table 2. Diagnostic Test Accuracy Statistics from Published Studies ................................ 32
LIST OF FIGURES
Figure 1. Literature Search and Study Selection Process ............................................................................. 5 Figure 2. MUAC Cutoffs for Cross-Sectional Studies, Organized by Population and Outcome ................. 7 Figure 3. MUAC Cutoffs for Longitudinal Studies, Organized by Population and Outcome ...................... 9

Use of Cutoffs for Mid-Upper Arm Circumference (MUAC) as an Indicator or Predictor of Nutritional and Health-Related Outcomes in Adolescents and Adults: A Systematic Review
ii
Abbreviations and Acronyms
ART antiretroviral therapy
AUC area under the receiver operating characteristic curve
BMI body mass index
CMAM Community-Based Management of Acute Malnutrition
DIH drug-induced hepatotoxicity
FANTA Food and Nutrition Technical Assistance III Project
HIV human immunodeficiency virus
IMAI Integrated Management of Adult Illness
IMCI Integrated Management of Childhood Illness
LBW low birth weight
MNA mini-nutritional assessment
MUAC mid-upper arm circumference
PLHIV people living with HIV
TB tuberculosis
WHO World Health Organization
USAID U.S. Agency for International Development

Use of Cutoffs for Mid-Upper Arm Circumference (MUAC) as an Indicator or Predictor of Nutritional and Health-Related Outcomes in Adolescents and Adults: A Systematic Review
1
1 Introduction
The use of mid-upper arm circumference (MUAC) has improved the ability of front-line health workers to screen and assess for acute malnutrition among children by increasing the reach and enhancing the quality of Community-Based Management of Acute Malnutrition (CMAM) services (Collins et al. 2006, Brown et al. 2009). In 2009, the World Health Organization (WHO) and UNICEF published updated guidelines recommending a MUAC cutoff of <11.5 cm as one of three screening criteria for identifying and managing severe acute malnutrition in infants and children 6–60 months (WHO and UNICEF 2009). Although an earlier systematic review of the literature showed that children with MUAC measurements <11.0 cm had significantly elevated risk of mortality (Myatt et al. 2006), WHO and UNICEF recommended a slightly higher cutoff to increase sensitivity of the measure, while maintaining high specificity. Largely due to the guidance from WHO and UNICEF on a standardized cutoff, MUAC has become a widely used and successful diagnostic tool for screening children and determining eligibility for services to manage acute malnutrition (Brown et al. 2009, Nyirandutiye et al. 2011).
Increasingly, MUAC is also being used to assess nutritional status and determine eligibility for nutrition support among adolescents and adults in low-resource settings, especially among pregnant women and people living with HIV (PLHIV) who are eligible for antiretroviral therapy (ART) (Bahwere et al. 2011, Tumilowicz 2010, Ververs 2013). As with children, the use of MUAC among adolescents and adults offers the advantages of being a simple and relatively inexpensive measure that can be carried out at both community- and facility-based settings. Measurement of MUAC requires minimal equipment and calculations as compared to weight and height measurements for calculation of body mass index (BMI) (weight [in kg] / height [in meters]2) or other anthropometric measurements, such as skinfold thicknesses.
Numerous studies have shown that MUAC correlates well with BMI in adult populations (Mazicioglu et al. 2010, Martin et al. 2009, Ferro-Luzzi and James 1996, Kaushik et al. 2007, Chakraborty et al. 2009, Collins 1996). However, globally recognized MUAC cutoffs have not been established to classify malnutrition among adolescents and adults. Many countries and programs have established their own MUAC cutoffs to determine eligibility for program services (Republic of Namibia Ministry of Health and Social Services and FANTA-2 2010, Federal Democratic Republic of Ethiopia Ministry of Health and FANTA 2008, FHI 360 and Uganda Regional Centre for Quality of Health Care 2008, Republic of Zambia Ministry of Health and FANTA 2011), but there is limited evidence supporting these cutoffs and it is not known whether the cutoffs are optimal. Patient monitoring guidelines provided by WHO for country adaptation to support the Integrated Management of Adult Illness (IMAI) do not include MUAC, in part because there is no guidance about what MUAC cutoff should trigger further action. In contrast, monitoring forms for Integrated Management of Childhood Illness (IMCI) do include MUAC because standard malnutrition cutoffs exist. Lack of a single, universally accepted, and widely accessible approach to diagnosing and documenting adult malnutrition has impeded accurate estimations of the human and financial burdens associated with prevention and treatment of malnutrition (White et al. 2012). Therefore, the establishment of standardized MUAC cutoffs for malnutrition among adolescents and adults could help expand the reach of community and treatment programs to identify adolescents and adults who are at increased risk of death or poor treatment outcomes due to acute malnutrition, as well as strengthen and harmonize programming in IMAI, HIV, and broader maternal health and nutrition.
This paper compiles and synthesizes currently available research on the association between low MUAC and measures of nutritional status and health-related outcomes among adolescents and adults. Our objective was to determine whether and what cutoffs for low MUAC have been associated with poor health outcomes in the following subpopulations: adolescents, adults, the elderly, and pregnant women.

Use of Cutoffs for Mid-Upper Arm Circumference (MUAC) as an Indicator or Predictor of Nutritional and Health-Related Outcomes in Adolescents and Adults: A Systematic Review
2
2 Methods
2.1 Literature Search We conducted a literature search of the Ovid Medline (1946 to March 2013), CAB Abstracts (1973 to March 2013), and Global Health (1973 to March 2013) electronic databases. Key search terms used were “mid upper arm circumference” or “MUAC” and “nutrition status” or “malnutrition.” We also conducted a separate search using only the terms “mid upper arm circumference” or “MUAC” to include articles examining MUAC with all possible outcomes. We restricted our search to English-language articles. Reference lists of all included articles were manually searched for additional publications that may have been missed, including the reference list of a review article (Ververs et al. 2013) that was referred to us by one co-author (MD) and was published after the March 2013 cutoff date for our literature search.
2.2 Study Selection and Eligibility Criteria Titles and abstracts of all search results were screened independently by two reviewers (KD and AT) to determine the relevance of each study. Abstracts that contained any measurement of MUAC, even if MUAC wasn’t the primary focus of the study, were included. Full-text articles of potentially relevant abstracts were retrieved and screened according to the inclusion and exclusion criteria outlined in Table 1. Cases in which there was disagreement between the reviewers were resolved by discussion and consensus. In brief, only studies that explored a relationship between low MUAC (as defined by a cutoff) and another nutritional or health-related measure among adolescents and/or adults were included in this review.
Table 1. Summary of Study Inclusion and Exclusion Criteria Inclusion Criteria Exclusion Criteria Language English language Non-English language Population • Adolescents
• Adults (men and women) • The elderly • Pregnant women • Lactating women (until 6 months
postpartum) • Combinations of above
• Infants • Children • Individuals with chronic diseases (except HIV
and TB): e.g., cystic fibrosis, acute lymphoblastic leukemia, hemodialysis, inflammatory bowel disease, cancer, stroke, Crohn’s disease, cerebral palsy, type 2 diabetes
• Critically ill patients Setting • All geographic locations
• Community-dwelling • Long-term care facilities or nursing
homes for the elderly
• Intensive care unit or other inpatient hospital setting
MUAC measure
• MUAC analyzed as binary or categorical variable using risk ratios, 95 percent confidence intervals, chi square tests, regression models, or sensitivity/ specificity analyses
• MUAC analyzed as continuous variable • MUAC incorporated into a score • MUAC used to calculate arm muscle
circumference
Outcome variables
• Any measure of nutritional status or health-related outcome
• Sociodemographic variables
Study design
• Cross-sectional (MUAC measured at same time point as outcome)
• Longitudinal (MUAC measured at a point before assessment of outcome)
• Descriptive studies • Randomized control trials or systematic reviews
of the effects of an intervention on MUAC

Use of Cutoffs for Mid-Upper Arm Circumference (MUAC) as an Indicator or Predictor of Nutritional and Health-Related Outcomes in Adolescents and Adults: A Systematic Review
3
Studies that predominantly included infants and children under 10 years were excluded. Studies that included subjects ranging from young children to adolescents but did not present results by age were also excluded. Beyond that, we did not pre-specify age ranges for adolescents, adults, or the elderly, but relied on the studies themselves to define these populations. For example, if a study reported that it focused on adolescents, then we categorized that study as an adolescent study and recorded the age range defined by the authors. As such, different adolescent studies (or elderly studies) in our review may encompass slightly different age ranges. Furthermore, some of the studies of adults might include ages that extend into adolescent or elderly age ranges defined by other studies. Age ranges for each study, when stated by the authors, were recorded.
We excluded studies focused on individuals who were critically ill, were hospitalized, or had chronic debilitating diseases (other than HIV and tuberculosis [TB]) due to the distinct attributes of these populations and, therefore, the inability to generalize the results to the broader population of interest. Elderly people living in long-term care facilities or nursing homes were included.
All studies that assessed associations between MUAC (as a binary or categorical variable) and a health- or nutrition-related outcome using chi-square analyses, regression models, and/or sensitivity/specificity analyses were included. Studies that examined MUAC as a continuous measure or incorporated MUAC as part of a score or in the calculation of arm muscle circumference were excluded because these types of analyses cannot inform what cutoffs for low MUAC have been associated with poor outcomes.
In terms of outcomes, we included other indicators of nutritional status or any health-related outcomes but excluded sociodemographic measures, such as age, gender, or poverty indicators. Other indicators of nutritional status included anthropometric (e.g., BMI, weight gain, low birth weight [LBW] infants), biochemical (e.g., hemoglobin), or summary nutrition measures (e.g., mini-nutritional assessment [MNA]). Health-related outcomes included measures such as mortality, pregnancy outcomes, incidence of infections, or failure to initiate ART.
Study designs that would not lend significant insight into the promise of low MUAC as an indicator of malnutrition or poor health outcomes were excluded, such as studies comparing proportions of people with low MUAC between various demographic groups or against a reference population, and randomized controlled trials or systematic reviews that examined an intervention’s effect on MUAC. Cross-sectional and longitudinal studies meeting the other study eligibility criteria were included.
2.3 Data Synthesis and Presentation Full-text articles from all eligible abstracts were obtained. Study data were extracted by one reviewer (KD) using a standardized data collection form to record key data elements, including first author, date of publication, study location, study design, subject characteristics (sample size, age range or mean age, sex distribution, disease status, other special features), MUAC cutoff(s) analyzed, point during pregnancy when MUAC was measured (if relevant), and outcomes evaluated against the MUAC cutoff(s). Unadjusted risk ratios (odds ratios, relative risks, or hazard ratios comparing risk of poor outcome between low and normal MUAC) and 95 percent confidence intervals were extracted or, if possible, manually calculated from data presented in the articles. If unadjusted risk ratios were not available or calculable, adjusted risk ratios from multivariable regression models were recorded along with the variables that the models were adjusted for. In addition, for articles presenting information on diagnostic test accuracy of MUAC, we recorded sensitivity, specificity, positive predictive value, negative predictive value, and area under the receiver operating characteristic curve (AUC), to the extent this information was available.

Use of Cutoffs for Mid-Upper Arm Circumference (MUAC) as an Indicator or Predictor of Nutritional and Health-Related Outcomes in Adolescents and Adults: A Systematic Review
4
After the initial data extraction, a second reviewer (AT) assessed the extracted information for any gaps or discrepancies. Both reviewers used the selection criteria listed in Table 1 to determine the final studies for inclusion.
For documentation purposes, detailed data from all eligible studies are tabulated by population type (adolescents, elderly, adults, pregnant women) in Supplemental Tables 1A–1D in Annex 1. Within each population type, the studies are organized by study design and then outcome.
Given that different study designs offer different insights into the value of low MUAC as a screening tool, our results are discussed in this paper by study design (cross-sectional vs. longitudinal). Within each study design, studies are presented by population type and outcome. In brief, cross-sectional studies (studies that measure MUAC and outcome at the same point in time) provide insight as to how closely low MUAC is associated with another measure of nutritional or clinical status at the time the MUAC is measured. This is useful if the purpose is to establish low MUAC (a relatively simpler and less expensive measure) as a surrogate marker for another (more complex) measure of nutritional or clinical status, which in turn is predictive of a poor future outcome. Longitudinal studies (studies in which MUAC is measured prior to development of an outcome) provide insight as to how well low MUAC itself predicts a future outcome. This type of study design can also be used to directly compare the predictive ability of low MUAC against other measures of malnutrition. Given the discrepancy in the literature regarding whether and how much MUAC measurements change during pregnancy (Ricalde et al. 1998, Lechtig 1988, Lopez et al. 2011, Dhar and Bhadra 2008, Assefa et al. 2012), we categorized studies on pregnant women in two ways: Studies that measured maternal MUAC during pregnancy and followed the women longitudinally for birth outcomes were classified as longitudinal, while studies that measured maternal MUAC upon labor or after delivery were classified as cross-sectional.
For visual presentation of the MUAC cutoffs used by different studies, we present bubble plots, with the bubble size proportional to the sample size of each study. To compare effect sizes among the two most frequently examined outcomes (BMI <18.5 and infant LBW, respectively), forest plots of risk ratios and 95 percent confidence intervals are shown. In most cases, risk ratios presented were based on the frequency of the outcome occurring in the group below the defined MUAC cutoff compared to the frequency of occurrence in the group above the defined MUAC cutoff. However, when multiple cutoffs were presented, the risk ratios presented in the forest plot represent the frequency of the outcome occurring in the lowest defined MUAC category compared to the reference category noted in a footnote.
Finally, in Supplemental Table 2, which appears in Annex1, we present data from studies that examined the diagnostic test accuracy of MUAC as a screening tool for various outcomes among adolescents and adults.

Use of Cutoffs for Mid-Upper Arm Circumference (MUAC) as an Indicator or Predictor of Nutritional and Health-Related Outcomes in Adolescents and Adults: A Systematic Review
5
3 Results
Figure 1 displays the summary of our literature search and study selection process. The literature search yielded 827 potentially relevant abstracts that were screened, resulting in a total of 78 studies that were considered for data extraction. The full-text articles of these studies were retrieved, along with the review article published after the cutoff date for our literature search (Ververs et al. 2013). An additional 28 studies were identified from review of the reference lists of these papers. Of the total 107 full-text articles that underwent data extraction, 60 were subsequently excluded because they did not meet the eligibility requirements listed in Table 1. The remaining 47 studies are included in this systematic review.
Figure 1. Literature Search and Study Selection Process
Review article referred by co-author
(MD) (n=1)
Articles excluded because study did not meet inclusion
criteria (n=60)
Abstracts identified from search of MEDLINE, CAB
Abstracts, and Global Health electronic
databases (n=827)
Full-text articles retrieved for in-depth screening
(n=78)
Abstracts excluded (n=749)
Articles identified from reference lists of retrieved
articles (n=28)
Studies included (n=47)
Use of Cutoffs for Mid-Upper Arm Circumference (MUAC) as an Indicator or Predictor of Nutritional and Health-Related Outcomes in Adolescents and Adults: A Systematic Review
6
3.1 Cross-Sectional Studies Nineteen cross-sectional studies met our study criteria: one on adolescents (Bulliyya et al. 2007), six on adults (Ferro-Luzzi and James 1996, Chakraborty et al. 2009, Bisai et al. 2009, Gartner et al. 2001, Singla et al. 2010, Lemmer et al. 2011), one on the elderly (Tsai et al. 2010), and 11 on pregnant women (Dhar and Bhadra 2008, Elshibly and Schmalisch 2008, Janjua et al. 2009, Ogbonna et al. 2007, Ojha and Malla 2007, Osman et al. 1995, Sen et al. 2010, Begum et al. 2003, Charles et al. 2010, Verhoeff et al. 1999, Libombo et al. 1994) (Supplemental Tables 1A-1D in Annex 1 and Figure 2). Overall, the cutoffs chosen for low MUAC were relatively consistent among adult populations (ranging from 20 cm to 24 cm) and slightly more variable among studies on pregnant women (ranging from 20.0 cm to 28.9 cm).
3.1.1 Adolescents The only study of adolescents we identified was conducted in India among nearly 2,000 adolescent girls (11–19 years) not attending school (Bulliyya et al. 2007), the vast majority (97 percent) of whom were anemic. The authors reported significantly lower mean hemoglobin levels in those with low MUAC (<22 cm) than those with MUAC ≥22 cm.
3.1.2 Adults Four (Ferro-Luzzi and James 1996, Chakraborty et al. 2009, Bisai et al. 2009, Gartner et al. 2001) of the six adult studies examined the association between low MUAC and BMI <18.5 and found statistically significant unadjusted odds ratios ranging from 13.9 (Gartner et al. 2001) to 28.8 (Ferro-Luzzi and James 1996) (Figure 2). All four studies used a MUAC cutoff of 23 cm, although two studies included 23 cm in the low category (i.e., MUAC ≤23 cm) (Chakraborty et al. 2009, Bisai et al. 2009), while the other two did not (i.e., MUAC <23 cm) (Ferro-Luzzi and James 1996, Gartner et al. 2001). In addition, Ferro-Luzzi and James (1996) analyzed a lower cutoff for women (<22 cm) and found an equally strong association with BMI <18.5 (odds ratio=21.2).
Chakraborty et al. further examined the association between categories of MUAC (≤23.0, 23.1–24.9, ≥25.0) and several other outcomes, including BMI as a continuous measure. A MUAC ≤23 cm was significantly associated with an increased proportion of men reporting illness and lost work days compared to those with MUAC ≥25 cm. However, these measures of morbidity were not different between those with MUAC in the middle range (23.1–24.9 cm) and those with MUAC ≥25 cm. Two studies (Singla et al. 2010, Lemmer et al. 2011) used a case comparison design to examine the association between low MUAC and poor health-related outcomes. Singla et al. (2010) found significantly higher proportions of patients with low MUAC (<20 cm) among 175 TB-treated patients with anti-TB drug-induced hepatotoxicity (DIH) compared to 428 TB-treated patients without anti-TB DIH. In a smaller study, Lemmer et al. (2011) found no difference in proportions of patients with low MUAC (≤24.3 for men, ≤23.2 for women) among HIV patients with and without cardiomyopathy.
3.1.3 The Elderly Tsai et al. was the only cross-sectional study we found on the elderly. The authors reported a significant association between low MUAC (<23.5 for men, <22.0 for women) and the MNA, which is a tool commonly used for screening and classifying nutritional status of the elderly. The MNA classification is based on 18 questions/assessments in four areas: anthropometrics (measures of BMI, MUAC, and calf circumference), dietary intake, global indicators, and self-perception of nutritional and health status.

Use of Cutoffs for Mid-Upper Arm Circumference (MUAC) as an Indicator or Predictor of Nutritional and Health-Related Outcomes in Adolescents and Adults: A Systematic Review
7
Figure 2. MUAC Cutoffs for Cross-Sectional Studies, Organized by Population and Outcome
Bubble plot legend: Size of circle represents relative sample size: Black circles indicate study includes both males and female; dark gray circles indicate study includes females only; light gray circles indicate study includes males only. Triangle around circle indicates findings were not statistically significant (p>.05), Significance based on comparisons above and below MUAC cutoff displayed unless footnoted with +. * = Same reference as above by same author; outcome is different. + = Reference group is ≥25 cm for both MUAC cutoffs displayed.

Use of Cutoffs for Mid-Upper Arm Circumference (MUAC) as an Indicator or Predictor of Nutritional and Health-Related Outcomes in Adolescents and Adults: A Systematic Review
8
3.1.4 Pregnant Women Eight (Dhar and Bhadra 2008, Elshibly and Schmalisch 2008, Janjua et al. 2009, Ogbonna et al. 2007, Ojha and Malla 2007, Osman et al. 1995, Sen et al. 2010, Begum et al. 2003) of the 11 studies on pregnant women examined the association between low MUAC and birth outcomes, while the remaining three (Charles et al. 2010, Verhoeff et al. 1999, Libombo et al. 1994) examined low MUAC in association with measures of maternal health. The vast majority of the studies examining birth outcomes reported significantly higher risk of poor birth outcomes (infant LBW or preterm labor) in those with low vs. normal MUAC as defined by the various cutoffs shown in Figure 2, with risk ratios ranging from 1.6 (Janjua et al. 2009) to 6.0 (Sen et al. 2010). The two studies that did not find a significant association between low MUAC and infant LBW (Dhar and Bhadra 2008, Elshibly and Schmalisch 2008) both based their choice of cutoff (<24 cm and <27 cm, respectively) on what was determined to be optimal (highest sensitivity and specificity) in their study samples. In Pakistan, Janjua et al. (2009) based their relatively high cutoff on the median in their population (≤28.9 cm) and found a significantly elevated risk of infant LBW in those below that cutoff.
In addition to birth outcomes, low MUAC was also significantly associated with poor maternal health outcomes, including anemia (Charles et al. 2010, Verhoeff et al. 1999) and postpartum endometritis-myometritis (Libombo et al. 1994).
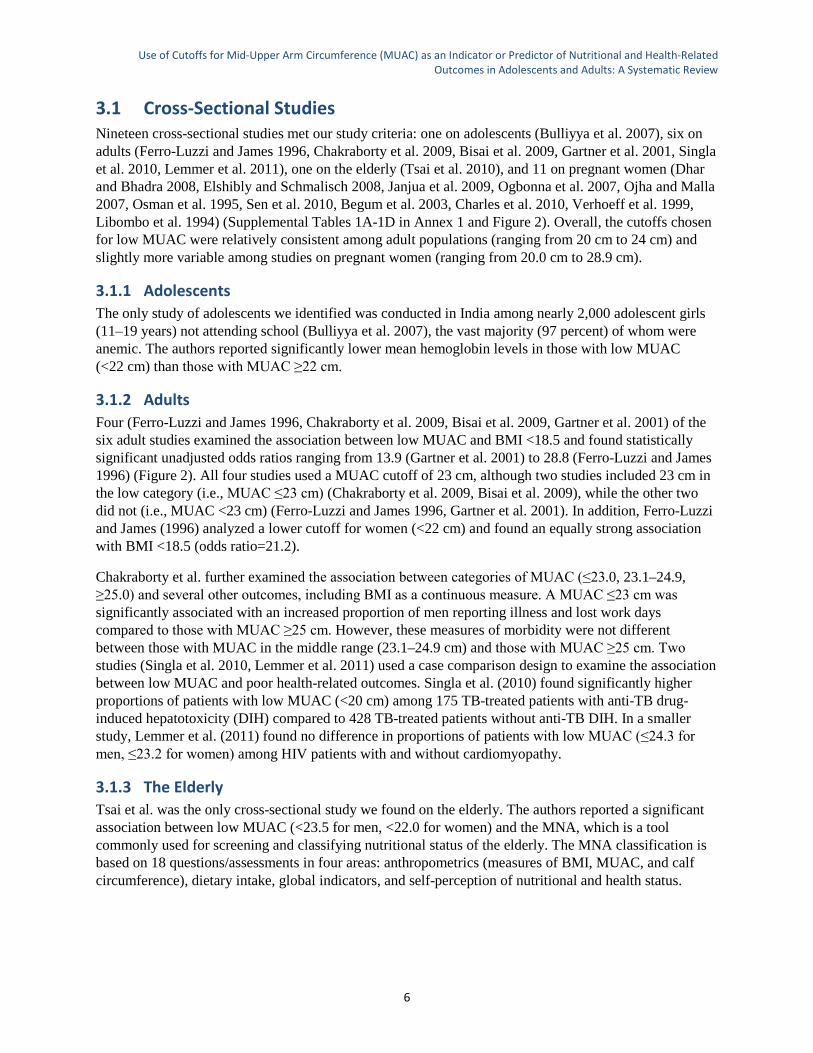
3.2 Longitudinal Studies We identified 20 longitudinal studies that met our study eligibility criteria, none of which were conducted on an adolescent population. Five of the studies were conducted among adult populations (Liu et al. 2011, Oliveira et al. 2012, Gustafson et al. 2007, Gourlay et al. 2012, McGrath et al. 2010), three among the elderly (Wijnhoven et al. 2012, Allard et al. 2004, Sagawa et al. 2011), and 11 among pregnant women (Lechtig 1988, Assefa et al. 2012, Karim and Mascie-Taylor 1997, Mohanty et al. 2006, Rollins et al. 2007, Sebayang et al. 2012, Kalanda et al. 2006, Lee et al. 2009, Achadi et al. 1995, Villamor et al. 2003, Venkatesh et al. 2005). Figure 3 displays the MUAC cutoffs for 19 of these studies. One study could not be displayed in Figure 3 because it did not state the actual cutoff used, only that the cutoff was <80 per-cent of the reference value in Japan (Sagawa et al. 2011).
3.2.1 Adults All of the adult studies were among HIV (HIV-1 or HIV-2) or TB-infected populations (Supplemental Tables 1A–1D). Four of the five studies looked at the association between low MUAC and risk of mortality but over varying time periods. Three of these studies reported significantly increased risk of mortality among those below the defined MUAC cutoff than those above the cutoff (Liu et al. 2011, Oliveira et al. 2012, Gustafson et al. 2007). These studies followed HIV- or TB-infected participants over periods of 3–8 months before and after initiation of treatment. The fourth study looked at the association of low MUAC with long-term mortality (7 years) in an HIV-2-infected population in Guinea-Bissau and found no association (Gourlay et al. 2012).
The fifth study was in HIV patients who were clinically eligible for ART in Malawi. The study found that low MUAC was associated with dropout (defaulting from clinical care) before ART initiation (McGrath et al. 2010). A large proportion of these patients who failed to initiate ART were found to have died, suggesting that low MUAC could be a useful screening tool to identify sicker ART-eligible patients who would benefit from more active outreach to initiate treatment.

Use of Cutoffs for Mid-Upper Arm Circumference (MUAC) as an Indicator or Predictor of Nutritional and Health-Related Outcomes in Adolescents and Adults: A Systematic Review
9
Figure 3. MUAC Cutoffs for Longitudinal Studies, Organized by Population and Outcome
Bubble plot legend: Size of circle represents relative sample size: Black circles indicate study includes both males and female; dark gray circles indicate study includes females only; light gray circles indicate study includes males only. Triangle around circle indicates findings were not statistically significant (p>.05). Significance based on comparisons above and below MUAC cutoff displayed unless footnoted with +. SGA = small for gestational age. * = Same reference as above by same author; outcome is different. + = Reference groups: ≥27 cm (Liu 2011); >29 cm (Allard 2004); ≥29 cm (Achadi 1995)

Use of Cutoffs for Mid-Upper Arm Circumference (MUAC) as an Indicator or Predictor of Nutritional and Health-Related Outcomes in Adolescents and Adults: A Systematic Review
10
3.2.2 The Elderly We found three longitudinal studies specifically among elderly populations. All were conducted in resource-rich countries; two were among elderly people living in a long-term care facility or nursing home (Allard et al. 2004, Sagawa et al. 2011), and the third was in a community-dwelling population (Wijnhoven et al. 2012). Although the cutoff for low MUAC was different in all of the studies, all three found that low MUAC was significantly associated with the outcomes assessed: increased risk of 15-year mortality in community-dwelling elderly people (Wijnhoven et al. 2012), 19-month mortality in the elderly living in a long-term care facility (Allard et al. 2004), and poor immune response to influenza vaccine in a nursing-home population in Japan (Sagawa et al. 2011).
3.2.3 Pregnant Women We identified 12 longitudinal studies reporting the association between low MUAC and birth outcomes among pregnant women. Half of the studies looked at the association between low MUAC and infant LBW (Lechtig 1988, Assefa et al. 2012, Karim and Mascie-Taylor 1997, Mohanty et al. 2006, Rollins et al. 2007, Sebayang et al. 2012), all of which found significantly increased risk among mothers with low MUAC during pregnancy.
Other birth outcomes that were examined in association with low MUAC were disproportionate intrauterine growth (Kalanda et al. 2006), preterm birth/labor (Sebayang et al. 2012, Kalanda et al. 2006), birth asphyxia (Lee et al. 2009), small for gestational age (Sebayang et al. 2012), and neonatal weight and length (Achadi et al. 1995). Longitudinal outcomes occurring in the mother included maternal weight gain (Achadi et al. 1995, Villamor et al. 2003) and TB incidence among HIV-1-infected women in Tanzania (Venkatesh et al. 2005). All of these outcomes, except for neonatal weight and length, were significantly associated with low MUAC.
As depicted in Figure 3, MUAC cutoffs used in studies among pregnant women were wide-ranging (<21.5 cm to ≤27.6 cm), although the majority used cutoffs ranging from 22 cm to 24 cm. In pregnant women in South Africa, Rollins et al. (2007) used the relatively high cutoff of ≤27.6 cm, which was the median in their population.
3.3 Diagnostic Test Accuracy of MUAC While the above studies assessed the strength of association between low MUAC and various measures of poor nutritional status and health outcomes, this section includes studies that presented information on the diagnostic test accuracy of specific MUAC cutoffs against various outcomes. We identified 14 studies that presented results on a range of MUAC cutoffs against a range of diagnostic criteria (outcomes). Two of these studies were conducted on adolescent populations (Mazicioglu et al. 2010, Martin et al. 2009), six in general adult populations (Collins 1996, Oliveira et al. 2012, Gustafson et al. 2007, Rodrigues et al. 1994, Khadivzadeh 2002, Olukoya 1990), and six in pregnant women (Dhar and Bhadra 2008, Elshibly and Schmalisch 2008, Sen et al. 2010, Karim and Mascie-Taylor 1997, Mohanty et al. 2006, Olukoya and Giwa-Osagie 1991).
As shown in Supplemental Table 2, the data presented in these studies are highly variable, making it difficult to synthesize findings across studies. Some studies presented AUC statistics but no data on sensitivity or specificity for any MUAC cutoffs (Mazicioglu et al. 2010, Martin et al. 2009, Elshibly and Schmalisch 2008). Others presented sensitivity data only but no specificity data (Olukoya 1990, Olukoya and Giwa-Osagie 1991). Nearly every study assessed MUAC cutoffs against a different outcome, except for five studies on pregnant women that assessed MUAC cutoffs against infant LBW (Dhar and Bhadra 2008, Elshibly and Schmalisch 2008, Sen et al. 2010, Karim and Mascie-Taylor 1997, Mohanty et al.
Use of Cutoffs for Mid-Upper Arm Circumference (MUAC) as an Indicator or Predictor of Nutritional and Health-Related Outcomes in Adolescents and Adults: A Systematic Review
11
2006) and two studies that assessed MUAC cutoffs against BMI (Rodrigues et al. 1994, Khadivzadeh 2002). None of the five infant LBW studies identified the same MUAC cutoff as optimal based on maximizing sensitivity and specificity in their study samples (Dhar: 24 cm, Elshibly: 27 cm, Karim: 23 cm, Mohanty: 22 cm, and Sen: 21.5 cm). Similarly, sensitivities and specificities varied greatly between the two studies that evaluated MUAC against different BMI cutoffs. In a large population of healthy, non-pregnant, and non-lactating women in Iran, Khadivzadeh et al. (2002) reported high ranges of sensitivity (81%–97%) and specificity (80%–93%) for several MUAC cutoffs (23.5–24.5 cm) against the outcome of BMI <19.8. However, in a similar but smaller population of women in India, Rodrigues et al. (1994) reported much lower ranges of sensitivity (51%–92%) and specificity (50%–85%) for a similar range of MUAC cutoffs against a slightly different outcome (BMI <18.5).

Use of Cutoffs for Mid-Upper Arm Circumference (MUAC) as an Indicator or Predictor of Nutritional and Health-Related Outcomes in Adolescents and Adults: A Systematic Review
12
4 Discussion
The articles presented in this review illustrate a wide range of outcomes that have been associated with low MUAC in a variety of populations. Fewer studies have assessed the sensitivity and specificity of specific MUAC cutoffs against diagnostic criteria, and results of these studies have not been consistent. Taken together, the results suggest that low MUAC can be used to identify individuals at increased risk of adverse outcomes across adolescents, adults, the elderly, and pregnant women, but there is insufficient evidence on which MUAC cutoff optimizes sensitivity and specificity for any particular diagnostic criteria or population.
According to our literature search, the study of low MUAC as a predictor of poor outcome first appeared in the literature in 1988 when Lechtig (1988) published a study comparing the association of several traditionally high-risk anthropometric indicators during pregnancy with risk of having a LBW baby in Guatemala. The results showed that low MUAC (≤23.5 cm) performed just as well as the other measures (weight gain during pregnancy, uterine height, and weight gain as a percentage of weight-for-height) and had several advantages, including simplicity and low cost. Largely based on these results, a simple armband with a cutoff of 23.5 cm was developed and has been used on pregnant women in several countries in South America. Since the publication of that study, the need to identify pregnant women at risk of poor birth outcomes in resource-limited settings has continued to grow, as evidenced by the continuing publication of papers with this focus, including a recently published review article calling for simple and standardized anthropometric indicators (such as low MUAC) to predict acute malnutrition and poor birth outcomes among pregnant women in humanitarian contexts (Ververs et al. 2013). A significant association between low maternal MUAC and risk of a LBW outcome has been consistently shown both cross-sectionally and longitudinally, with only a couple of exceptions (Dhar and Bhadra 2008, Elshibly and Schmalisch 2008).
In 1994, as the evidence base for the utility of low MUAC for identifying pregnant women at risk of poor birth outcomes was increasing, Rodrigues et al. (1994) recognized a similar need for a simpler measure of nutritional status among non-pregnant women in low-resource settings and published a study comparing sensitivities and specificities of different MUAC cutoffs against BMI <18.5 among a population of healthy, non-pregnant women in India. They identified a cutoff of <24 cm to be most appropriate in their population, with sensitivity and specificity of 71.1 percent and 69.6 percent, respectively.
This led to the idea of establishing MUAC cutoffs in the more general adolescent/adult population, which first appeared in the literature in the late 1990s with the need to quickly screen and prioritize large numbers of severely malnourished individuals for special nutritional support in the context of large emergency situations, such as famine, war, or disease outbreaks (Ferro-Luzzi and James 1996, Collins 1996, James et al. 1994). Although low BMI was recognized as a valuable tool for detecting severe malnutrition and predicting increased morbidity and mortality, it was often found to be a difficult measure to use in settings where resources are scarce and demands are high. In their search for a simpler and quicker screening tool, Ferro-Luzzi and James (1996) analyzed data from seven large surveys of adults living in low-resource countries across Africa and Asia and found strong associations between low MUAC (<22 cm for women and <23 cm for men) and low BMI (<18.5).
Since this study was published, there have been only a handful of other studies (Chakraborty et al. 2009, Bisai et al. 2009, Gartner et al. 2001) that have examined the association between low MUAC and low BMI. All found strong and significant associations between MUAC <23 (or ≤23) cm and BMI <18.5. Only one study included both men and women (Ferro-Luzzi and James 1996); the other studies included either only men (Chakraborty et al. 2009) or only women (Bisai et al. 2009, Gartner et al. 2001). More

Use of Cutoffs for Mid-Upper Arm Circumference (MUAC) as an Indicator or Predictor of Nutritional and Health-Related Outcomes in Adolescents and Adults: A Systematic Review
13
and larger diagnostic test accuracy studies need to be done to identify a specific recommended MUAC cutoff as a substitute for BMI criteria. In addition, the BMI criterion also must be standardized, as the current sensitivity and specificity data that are published (Collins 1996, Rodrigues et al. 1994, Khadivzadeh 2002) used not only varying MUAC cutoffs, but different BMI cutoffs as well.
Only 4 of the 47 studies identified in our literature review (all among the elderly) were conducted in resource-rich countries (Tsai et al. 2010, Wijnhoven et al. 2012, Allard et al. 2004, Sagawa et al. 2011); the rest were conducted among populations in resource-poor countries. This is not surprising, as low-resource settings are most in need of nutritional screening tools that are simpler to apply than weight and/or BMI measurements.
A large proportion (60 percent) of studies identified in our literature review were published in the past 5 years (since 2008), and most of the studies on adults were conducted in HIV- and/or TB-infected populations. This may reflect increased access to treatment in low-resource settings and the specific need for treatment programs to identify and prioritize those with acute malnutrition at the start of treatment for additional nutritional support. In HIV treatment settings, low BMI (<16 or <18.5) has consistently been shown to increase risk of early mortality after initiating ART (Koethe et al. 2010, Toure et al. 2008, Calmy et al. 2006).
Few of the studies reviewed here were specifically designed to address the establishment of a low MUAC cutoff for identifying individuals at risk of adverse health outcomes. Instead, most studies were designed to determine whether poor nutritional status (of which low MUAC was just one of several measures) was associated with a particular outcome. Therefore, these studies usually selected only one cutoff for low MUAC and did not consider any other cutoffs. Many studies reported results from both adjusted and unadjusted regression models. Although every study adjusted for a different set of variables, most of the time low MUAC remained an independent predictor of outcome when BMI was not also included in the model. Often the association between low MUAC and clinical outcome would become non-significant after adjusting for BMI, which is not surprising if the two measures are strongly associated. We do not report any adjusted odds ratios from multivariable regression models that included both MUAC and BMI in this review, since our objective was not to determine the additional effect of low MUAC on health outcomes after taking into account another anthropometric measure. Instead, our aim was to determine the association between low MUAC and poor health outcomes in the absence of other anthropometric measures, such as BMI.
As mentioned earlier, conclusions drawn from cross-sectional study designs are useful for establishing low MUAC as an indicator of another nutritional or clinical measure occurring at the same point in time, while longitudinal designs are useful for assessing how well low MUAC predicts a future outcome. Our review identified too few studies with identical outcome measurements to be able to synthesize results across studies. Three exceptions were the cross-sectional associations between low MUAC and BMI <18.5 (four studies), between low maternal MUAC and infant LBW (seven studies), and the longitudinal association between low maternal MUAC and LBW infants (six studies). Our review suggests that: 1) in non-pregnant adults, low MUAC may be a good substitute for BMI <18.5, and 2) in pregnant women, low MUAC at any time during pregnancy is associated with higher risk of having an infant with LBW. While most of these studies chose cutoffs of 22–24 cm and found significant associations with the outcomes, none of the studies adequately explored the optimal MUAC cutoffs associated with these outcomes.
Sample sizes of all the studies included in this review were relatively large, ranging from hundreds to tens of thousands. Only two studies had sample sizes less than 100: one had 90 participants (Collins 1996) and the other had 35 participants (Lemmer et al. 2011). For studies on pregnant women, the point during

Use of Cutoffs for Mid-Upper Arm Circumference (MUAC) as an Indicator or Predictor of Nutritional and Health-Related Outcomes in Adolescents and Adults: A Systematic Review
14
pregnancy when MUAC was measured and the time after birth when the infant was weighed were not standardized across studies. Other design issues that were not standardized across studies include the arm on which MUAC measurements were taken and the age ranges for defining adolescents, adults, and elderly populations. Although some studies did report which arm that was measured (usually the left arm), many others did not. While studies show that handedness does matter and measurements taken on the right arm tend to be larger than those taken on the left, the difference has been shown to be small and therefore not worthy of attention (Martorell et al. 1988). However, given the scarcity of data addressing this issue, studies should state in their methods section the arm on which the measurements are taken.
Our review has several limitations. First, the articles selected for review were limited to published articles indexed in the Medline, CAB abstracts, and Global Health databases. We did not search the gray literature, which could offer some additional insights into the utility of low MUAC in programmatic settings. Second, we were only able to review English-language studies. Third, our search results may be affected by publication bias, as studies that measured MUAC along with other measures of nutritional status may have only reported the nutritional measures that were statistically significant in their abstract. Our abstract review process would have missed articles where MUAC was not included in the abstract because the results were not statistically significant or because MUAC was not the main risk factor of interest in the study. In addition, studies where a significant association between low MUAC and a health outcome were not detected may not have even been published. Unfortunately, we are not able to assess the impact of these potential biases on our findings.
In summary, our review of the literature reveals significant associations between low MUAC (as defined by various cutoffs) and several adverse health outcomes. The most consistent associations were found among pregnant women for the outcome of infant LBW and among adults for the outcome of BMI <18.5. There was not a preponderance of evidence for any of the other health outcomes to draw firm conclusions. There were also too few diagnostic test accuracy studies to be able to recommend an optimum MUAC cutoff for any particular health outcome at this time.
Given the multitude of studies that have collected data on both MUAC and health outcomes across a diverse range of populations (many of which were not included in this review because MUAC was analyzed as a continuous variable) and the increasing demand for the establishment of a standard MUAC cutoff for PLHIV, pregnant women, and populations in crisis, a meta-analysis using individual-patient data would be the most timely and cost-effective next step to answer some of the remaining questions. Issues that would need to be resolved by various stakeholders before taking this next step would be to decide whether there is interest in establishing a low MUAC cutoff solely as a substitute for BMI indicators or whether there is additional need or interest in establishing optimal MUAC cutoffs for predicting other health outcomes. In terms of BMI indicators, the studies that we identified all examined the association between low MUAC and BMI <18.5 (an indicator reflecting mild, moderate, and severe malnutrition), but in many circumstances it may also be useful to establish specific MUAC cutoffs for both moderate malnutrition (defined as BMI ≥16 and <17) and severe malnutrition (defined as BMI <16).
Other issues to be addressed include which health-related outcomes and populations should be prioritized and what levels of sensitivity and specificity should a particular MUAC cutoff have before it can be recommended. Finally, more research is needed to determine whether different standardized cutoffs should be recommended for various subpopulations (e.g., men vs. women, or adolescents vs. adults) or different contexts (e.g., humanitarian aid/famine relief vs. HIV treatment programs).

Use of Cutoffs for Mid-Upper Arm Circumference (MUAC) as an Indicator or Predictor of Nutritional and Health-Related Outcomes in Adolescents and Adults: A Systematic Review
15
References
Achadi, E.L. et al. 1995. “Women’s Nutritional Status, Iron Consumption and Weight Gain during Pregnancy in Relation to Neonatal Weight and Length in West Java, Indonesia.” International Journal of Gynaecology & Obstetrics. 48 Suppl:S103–19.
Allard, J.P. et al. 2004. “Nutrition Risk Factors for Survival in the Elderly Living in Canadian Long-Term Care Facilities.” Journal of the American Geriatrics Society. 52(1):59–65.
Assefa, N.; Berhane, Y.; and Worku, A. 2012. “Wealth Status, Mid Upper Arm Circumference (MUAC) and Antenatal Care (ANC) Are Determinants for Low Birth Weight in Kersa, Ethiopia.” PLoS ONE [electronic resource]. 7(6):e39957.
Bahwere, P. et al. 2011. “Impact of Household Food Insecurity on the Nutritional Status and the Response to Therapeutic Feeding of People Living with Human Immunodeficiency Virus.” Patient Preference & Adherence. 5:619–27.
Begum, F.; Buckshe, K.; and Pande, J.N. 2003. “Risk Factors Associated with Preterm Labour.” Bangladesh Medical Research Council Bulletin. 29(2):59–66.
Bisai, S. et al. 2009. “Undernutrition in the Kora Mudi Tribal Population, West Bengal, India: A Comparison of Body Mass Index and Mid-Upper-Arm Circumference.” Food & Nutrition Bulletin. 30(1):63–7.
Brown, K.H.; Nyirandutiye, D.H.; and Jungjohann, S. 2009. “Management of Children with Acute Malnutrition in Resource-Poor Settings.” Nature Review Endocrinology. 5(11):597–603.
Bulliyya, G. et al. 2007. “Hemoglobin Status of Non-School Going Adolescent Girls in Three Districts of Orissa, India.” International Journal of Adolescent Medicine & Health.19(4):395–406.
Calmy, A. et al. 2006. “Generic Fixed-Dose Combination Antiretroviral Treatment in Resource-Poor Settings: Multicentric Observational Cohort.” AIDS. 20(8):1163–9.
Chakraborty, R. et al. 2009. “Mid-Upper Arm Circumference as a Measure of Nutritional Status among Adult Bengalee Male Slum Dwellers of Kolkata, India: Relationship with Self-Reported Morbidity.” Anthropologischer Anzeiger. 67(2):129–37.
Charles, A.M. et al. 2010. “Predictors of Anemia among Pregnant Women in Westmoreland, Jamaica.” Health Care for Women International. 31(7):585–98.
Collins, S. 1996. “Using Middle Upper Arm Circumference to Assess Severe Adult Malnutrition during Famine.” Journal of the American Medical Association. 276(5):391–5. Collins, S. et al. 2006. “Management of Severe Acute Malnutrition in Children.” Lancet. 368(9551):1992–2000. Dhar, B. and Bhadra, S.K. 2008. “Use of Anthropometric Indicators for Predicting Risk of Delivering Low Birth Weight Babies.” Bangladesh Medical Research Council Bulletin. 34(2):64–6.

Use of Cutoffs for Mid-Upper Arm Circumference (MUAC) as an Indicator or Predictor of Nutritional and Health-Related Outcomes in Adolescents and Adults: A Systematic Review
16
Elshibly, E.M. and Schmalisch, G. 2008. “The Effect of Maternal Anthropometric Characteristics and Social Factors on Gestational Age and Birth Weight in Sudanese Newborn Infants.” BMC Public Health. 8:244. Federal Democratic Republic of Ethiopia Ministry of Health and FANTA. 2008. National Guidelines for HIV/AIDS and Nutrition. Ferro-Luzzi, A. and James, W.P. 1996. “Adult Malnutrition: Simple Assessment Techniques for Use in Emergencies.” British Journal of Nutrition. 75(1):3–10. FHI 360 and Uganda Regional Centre for Quality of Health Care. 2008. Nutrition Care for People Living with HIV and AIDS (PLWHA): Training Manual for Community and Home-Based Care Providers Facilitators Guide. Gartner, A. et al. 2001. “Body Composition Unaltered for African Women Classified as ‘Normal but Vulnerable’ by Body Mass Index and Mid-Upper-Arm-Circumference Criteria.” European Journal of Clinical Nutrition. 55(5):393–9. Gourlay, A.J. et al. 2012. “Clinical Predictors Cannot Replace Biological Predictors in HIV-2 Infection in a Community Setting in West Africa.” International Journal of Infectious Diseases. 16(5):e337–43. Gustafson, P. et al. 2007. “Clinical Predictors for Death in HIV-Positive and HIV-Negative Tuberculosis Patients in Guinea-Bissau.” Infection. 35(2):69–80. James, W.P. et al. 1994. “The Value of Arm Circumference Measurements in Assessing Chronic Energy Deficiency in Third World Adults.” European Journal of Clinical Nutrition. 48(12):883–94. Janjua, N.Z. et al. 2009. “Determinants of Low Birth Weight in Urban Pakistan.” Public Health Nutrition. 12(6):789–98. Kalanda, B.F. et al. 2006. “Adverse Birth Outcomes in a Malarious Area.”(Erratum appears in Epidemiology & Infection. 2007; Aug.;135(6):1056.) Epidemiology & Infection. 134(3):659–66. Karim, E. and Mascie-Taylor, C.G.N. 1997. “The Association between Birthweight, Sociodemographic Variables and Maternal Anthropometry in an Urban Sample from Dhaka, Bangladesh.” Annals of Human Biology. 24(5):387–401. Kaushik, B. et al. 2007. “Relationship of Income with Anthropometric Indicators of Chronic Energy Deficiency among Adult Female Slum Dwellers of Midnapore Town.” Journal of Human Ecology. 22(2):171–176. Khadivzadeh, T. 2002. “Mid Upper Arm and Calf Circumferences as Indicators of Nutritional Status in Women of Reproductive Age.” Eastern Mediterranean Health Journal. 8(4–5):612–8. Koethe, J.R. et al. 2010. “Association between Weight Gain and Clinical Outcomes among Malnourished Adults Initiating Antiretroviral Therapy in Lusaka, Zambia.” JAIDS: Journal of Acquired Immune Deficiency Syndromes. 53(4):507–13. Lechtig, A. 1988. “Predicting Risk of Delivering Low Birthweight Babies: Which Indicator is Better?” Journal of Tropical Pediatrics. 34:34–41.

Use of Cutoffs for Mid-Upper Arm Circumference (MUAC) as an Indicator or Predictor of Nutritional and Health-Related Outcomes in Adolescents and Adults: A Systematic Review
17
Lee, A.C.C. et al. 2009. “Maternal-Fetal Disproportion and Birth Asphyxia in Rural Sarlahi, Nepal.” Archives of Pediatrics & Adolescent Medicine. 163(7):616–623. Lemmer, C.E. et al. 2011. “A Lower Body Mass Index Is Associated with Cardiomyopathy in People with HIV Infection: Evidence from a Case Comparison Study.” South African Medical Journal Suid-Afrikaanse Tydskrif Vir Geneeskunde. 101(2):119–21. Libombo, A.; Folgosa, E.; and Bergstrom, S. 1994. “Risk Factors in Puerperal Endometritis-Myometritis. An Incident Case-Referent Study.” Gynecologic & Obstetric Investigation. 38(3):198–205. Liu, E. et al. 2011. “Nutritional Status and Mortality among HIV-Infected Patients Receiving Antiretroviral Therapy in Tanzania.” Journal of Infectious Diseases. 204(2):282–90. Lopez, L.B. et al. 2011. “Changes in skinfolds and mid-upper arm circumference during pregnancy in Argentine women.” Maternal & Child Nutrition. 7(3):253–62. Martin, A.C. et al. 2009. “Monitoring nutritional status accurately and reliably in adolescents with anorexia nervosa.” Journal of Paediatrics & Child Health. 45(1–2):53–7. Martorell, R. et al. 1988. “Which Side to Measure: Right or Left?” In Anthropometric Reference Standardization Manual. Lohman, T.G.; Roche, A.F.; and Martorell, R. (eds.). pp. 87–91. Champaign, IL: Human Kinetics Pub.
Mazicioglu, M.M. et al. 2010. “Anthropometric Risk Factors for Elevated Blood Pressure in Adolescents in Turkey Aged 11–17.” Pediatric Nephrology. 25(11):2327–34. McGrath, N. et al. 2010. “What Happens to ART-Eligible Patients Who Do Not Start ART? Dropout between Screening and ART Initiation: A Cohort Study in Karonga, Malawi.” BMC Public Health. 10:601. Mohanty, C. et al. 2006. “Maternal Anthropometry as Predictors of Low Birth Weight.” Journal of Tropical Pediatrics. 52(1):24–9. Myatt, M.; Khara, T.; and Collins, S. 2006. “A Review of Methods to Detect Cases of Severely Malnourished Children in the Community for Their Admission into Community-Based Therapeutic Care Programs.” Food and Nutrition Bulletin. 27(3 Suppl):S7–23. Nyirandutiye, D.H. et al. 2011. “Screening for Acute Childhood Malnutrition during the National Nutrition Week in Mali Increases Treatment Referrals.” PLoS ONE [electronic resource]. 6(6):e14818. Ogbonna, C. et al. 2007. “Maternal Mid-Arm Circumference and Other Anthropometric Measures of Adiposity in Relation to Infant Birth Size among Zimbabwean Women.” Acta Obstetricia et Gynecologica. 86:26–32. Ojha, N. and Malla, D.S. 2007. “Low Birth Weight at Term: Relationship with Maternal Anthropometry.” Journal of the Nepal Medical Association. 46(166):52–6. Oliveira, I. et al. 2012. “Assessment of Simple Risk Markers for Early Mortality among HIV-Infected Patients in Guinea-Bissau: A Cohort Study.” BMJ Open. 2(6).

Use of Cutoffs for Mid-Upper Arm Circumference (MUAC) as an Indicator or Predictor of Nutritional and Health-Related Outcomes in Adolescents and Adults: A Systematic Review
18
Olukoya, A.A. 1990. “Identification of Underweight Women by Measurement of the Arm Circumference.” International Journal of Gynaecology & Obstetrics 31:231–235. Olukoya, A.A. and Giwa-Osagie, O.F. 1991. “Maternal Weight and Weight Gain during Pregnancy—Can the Arm Circumference Be Used as Surrogate?” African Journal of Medicine and Medical Sciences. 20:155–162. Osman, N.B.; Folgosa, E.; and Bergstrom, S. 1995. “An Incident Case-Referent Study of Threatening Preterm Birth and Genital Infection.” Journal of Tropical Pediatrics. 41(5):267–72. Republic of Namibia Ministry of Health and Social Services and FANTA. 2010. Nutrition Assessment, Counselling and Support for PLHIV: Operational Guidelines. Republic of Zambia Ministry of Health and FANTA. 2011. Nutrition Guidelines for Care and Support of People Living with HIV and AIDS. Ricalde, A.E. et al. 1998. “Mid-Upper Arm Circumference in Pregnant Women and Its Relation to Birth Weight.” Revista de Saude Publica. 32(2):112–7. Rodrigues, V.C.; Rao, R.S.; and Lena, A. 1994. “Utility of Arm Circumference as a Screening Instrument to Identify Women at Nutritional Risk.” Tropical Doctor. 24(4):164–6. Rollins, N.C. et al. 2007. “Pregnancy Outcomes in HIV-Infected and Uninfected Women in Rural and Urban South Africa.” JAIDS: Journal of Acquired Immune Deficiency Syndromes. 44(3):321–8. Sagawa, M. et al. 2011. “Immune Response to Influenza Vaccine in the Elderly: Association with Nutritional and Physical Status.” Geriatrics & Gerontology International. 11(1):63–8. Sebayang, S.K. et al. 2012. “Determinants of Low Birthweight, Small-for-Gestational-Age and Preterm Birth in Lombok, Indonesia: Analyses of the Birthweight Cohort of the SUMMIT Trial.” Tropical Medicine & International Health. 17(8):938–50. Sen, J. et al. 2010. “Association of Maternal Nutritional Status, Body Composition and Socio-Economic Variables with Low Birth Weight in India.” Journal of Tropical Pediatrics. 56(4):254–9. Singla, R. et al. 2010. “Evaluation of Risk Factors for Antituberculosis Treatment Induced Hepatotoxicity.” Indian Journal of Medical Research. 132:81–6. Toure, S. et al. 2008. “Rapid Scaling-Up of Antiretroviral Therapy in 10,000 Adults in Cote d’Ivoire: 2-Year Outcomes and Determinants.” AIDS. 22(7):873–82. Tsai, A.C. et al. 2010. “A Modified Mini Nutritional Assessment Without BMI Predicts Nutritional Status of Community-Living Elderly in Taiwan.” Journal of Nutrition, Health & Aging. 14(3):183–9. Tumilowicz, A. 2010. “Guide to Screening for Food and Nutrition Services Among Adolescents and Adults Living with HIV.” http://www.fantaproject.org/sites/default/files/resources/ Nutrition_Interventions_Screening_Guide_Final.pdf. Venkatesh, P.A. et al. 2005. “Predictors of Incident Tuberculosis among HIV-1-Infected Women in Tanzania.” International Journal of Tuberculosis & Lung Disease. 9(10):1105–11.
Use of Cutoffs for Mid-Upper Arm Circumference (MUAC) as an Indicator or Predictor of Nutritional and Health-Related Outcomes in Adolescents and Adults: A Systematic Review
19
Verhoeff, F.H. et al. 1999. “An Analysis of the Determinants of Anaemia in Pregnant Women in Rural Malawi—A Basis For Action.” Annals of Tropical Medicine & Parasitology. 93(2):119–33. Ververs, M. et al. 2013. “Which Anthropometric Indicators Identify a Pregnant Woman as Acutely Malnourished and Predict Adverse Birth Outcomes in the Humanitarian Context?” PLOS Current Disasters. Edition 1. doi: 10.1371/currents.dis.54a8b618c1bc031ea140e3f2934599c8. Villamor, E. et al. 2003. “Pattern and Predictors of Weight Gain during Pregnancy among HIV-1-Infected Women from Tanzania.” JAIDS: Journal of Acquired Immune Deficiency Syndromes. 32(5):560–9. White, J.V. et al. 2012. “Consensus statement of the Academy of Nutrition and Dietetics/American Society for Parenteral and Enteral Nutrition: Characteristics Recommended for the Identification and Documentation of Adult Malnutrition (Undernutrition).” Journal of the Academy of Nutrition and Dietetics. 112(5):730–8. Wijnhoven, H.A.H. et al. 2012. “Development and Validation of Criteria for Determining Undernutrition in Community-Dwelling Older Men and Women: The Short Nutritional Assessment Questionnaire 65+.” Clinical Nutrition. 31(3):351–8. WHO and UNICEF. 2009. “WHO Child Growth Standards and the Identification of Severe Acute Malnutrition in Infants and Children. A Joint Statement by the World Health Organization and the United Nations Children’s Fund.” http://www.who.int/nutrition/publications/severemalnutrition/9789241598163/ en/.

Use of Cutoffs for Mid-Upper Arm Circumference (MUAC) as an Indicator or Predictor of Nutritional and Health-Related Outcomes in Adolescents and Adults: A Systematic Review
20
Annex 1. Supplemental Tables
Supplemental Table 1A. Adolescents
Additional Total N, % Ages Population MUAC
Author, Year Country Female (F) (years) Characteristics Cutoff (cm) Outcome Results Cross-Sectional Studies Bulliyya, 2007 India 1,937, 100% F 11–19 Not attending <22 Hemoglobin Mean hemoglobin levels significantly
school levels lower in those with MUAC <22 vs. ≥22 (continuous)

Use of Cutoffs for Mid-Upper Arm Circumference (MUAC) as an Indicator or Predictor of Nutritional and Health-Related Outcomes in Adolescents and Adults: A Systematic Review
21
Supplemental Table 1B. The Elderly
Author, Year Country Total N, % Female (F)
Ages (years)
Additional Population Characteristics
MUAC Cutoff (cm) Outcome Results
Cross-Sectional Studies Tsai, 2010 Taiwan 301, 54% F ≥65 No acute
health conditions
<23.5 men <22 women
MNA OR=8.65 (95% CI=2.10-35.64) Men and women with low MUAC are 8.7 times more likely to have low MNA than those above the MUAC cutoff.
Longitudinal Studies Allard, 2004 Canada 408, 67% F ≥60 Long-term
care facility 1. <26 vs. >29 2. 26–29 vs. >29
Mortality, 19-month
1. HR=4.2 (95% CI=2.5–7.3) 2. HR=2.9 (95% CI=1.6–5.2) Those with MUAC <26 have a 4-fold increased risk of mortality vs. those with MUAC >29. Those with MUAC 26–29 have a 3-fold increased risk of mortality vs. those with MUAC >29.
Sagawa, 2011 Japan 203, 78% F ≥65 Nursing home <80% of reference value (Japan)
≥4-fold rise in titer after influenza vaccine
OR=0.45 (95% CI=0.21–0.97) Those in the lower 80th percentile of MUAC are 35% less likely to have adequate immune response to influenza vaccine than those in the top 20th percentile.
Wijnhoven, 2012 Netherlands 1,687, 50% F ≥55 Community dwelling
<25 Mortality, 15-year
Those with MUAC <25 have 4.7 times increased risk of mortality vs. those with MUAC ≥25.

Use of Cutoffs for Mid-Upper Arm Circumference (MUAC) as an Indicator or Predictor of Nutritional and Health-Related Outcomes in Adolescents and Adults: A Systematic Review
22
Supplemental Table 1C. Adults
Author, Year Country Total N, % Female (F) Ages (years)
Additional Population Characteristics
MUAC Cutoff (cm) Outcome Results
Cross-Sectional Studies Singla, 2010 India 606, 50% F 16–65 TB <20 Anti-TB drug-
induced hepatotoxicity (DIH)
Adj OR=2.56, 95% CI=1.58–4.15 Those with anti-TB DIH are 2.6 times more likely to have low MUAC vs. those w/o anti-TB DIH, after adjusting for age >35 years and serum albumin <3.5g/dL.
Bisai, 2009 India 123, 100% F Mean (SD): 34.8 (15.2)
Non-pregnant, Non-lactating
<23 BMI <18.5 OR=22.5 (95%CI=6.3–80.2) Women with MUAC <23 are 22.5 times more likely to have BMI <18.5 vs. women with MUAC ≥23.
Ferro-Luzzi, 1996 China, India, Ethiopia, Zimbabwe, Mali, Somalia, Papua New Guinea
5,669, 57% F Not stated <23 men <22 women
BMI <18.5 Men: OR=28.8 (95%CI=21.0–39.5) Women: OR=21.2 (95%CI=16.2–27.9) Men with MUAC <23 are 28.8 times more likely to have BMI <18.5 vs. men with MUAC ≥23. Women with MUAC <22 are 21.2 times more likely to have BMI <18.5 vs. women with MUAC ≥23.
Chakraborty, 2009
India 474, 0% F >18 Urban slum dwellers
≤23 BMI <18.5 OR=28.4 (95%CI=15.9–50.5) Men with MUAC ≤23 are 28.4 times more likely to have BMI <18.5 vs. men with MUAC >23.
Gartner, 2001 Democratic Republic of Congo
544, 100% F 18–60 <23 BMI <18.5 OR=13.9 (95%CI=7.8–24.9) Women with MUAC <23 are 13.9 times more likely to have BMI <18.5 vs. women with MUAC ≥23.
Chakraborty, 2009*
India 474, 0% F >18 Urban slum dwellers
≤23, 23.1–24.9, ≥25
BMI (continuous)
F test p-value <.001 Mean BMI is lower with lower levels of MUAC.

Use of Cutoffs for Mid-Upper Arm Circumference (MUAC) as an Indicator or Predictor of Nutritional and Health-Related Outcomes in Adolescents and Adults: A Systematic Review
23
Author, Year Country Total N, % Female (F) Ages (years)
Additional Population Characteristics
MUAC Cutoff (cm) Outcome Results
Lemmer, 2011 South Africa
35, 40% F Median (IQR): 34.5 (29.2–45.8) for CM and 36 (31–42) for no CM
HIV M: ≤24.3 F: ≤23.2
Cardiomyopathy (CM)
Low MUAC is not associated with CM in final multivariate logistic regression model.
Chakraborty, 2009*
India 474, 0% F >18 Urban slum dwellers
1. ≤23 vs. ≥25 2. 23.1–24.9 vs. ≥25
Self-reported lost work days
1. OR=2.6 (95% CI=1.4–4.6) 2. OR=1.7 (95% CI=0.95–3.1) Men with MUAC ≤23cm are 2.6 times more likely to report lost work days vs. men with MUAC ≥25. There is no difference in reports of lost work days between men with MUAC 23.1–24.9 and men with MUAC ≥25.
Longitudinal Studies McGrath, 2010 Malawi 632, 58% F 21.7% <30 HIV (ART
eligible) M: <23 F: <22
Dropping out before ART initiation
HR=2.0 (95% CI=1.3–3.2) Those with MUAC below the cutoffs were 2 times more likely to drop out before ART initiation vs. those with MUAC above the cutoffs.
Liu, 2011 Tanzania 18,271, 65% F ≥15 HIV, initiating ART
1. <20 2. 20–21.9 3. 22–24.9 4. 25–26.9 5. ≥27
Mortality, 3 months (post-ART initiation)
1 vs. 5: RR=10.2 (95% CI=8.4–12.5) 2 vs. 5: RR=5.1 (95% CI=4.1–6.3) 3 vs. 5: RR=2.6 (95% CI=2.1–3.1) 4 vs. 5: RR=1.4 (95% CI=1.1–1.8) (p for trend=<.001) Risk of mortality decreases with increasing level of MUAC (reference is MUAC ≥27 for each RR).

Use of Cutoffs for Mid-Upper Arm Circumference (MUAC) as an Indicator or Predictor of Nutritional and Health-Related Outcomes in Adolescents and Adults: A Systematic Review
24
Author, Year Oliveira, 2012
Oliveira, 2012*
Gustafson, 2007
Gustafson, 2007*
Gustafson, 2007*
Country Total N, % Female (F) Ages (years)
Additional Population Characteristics
MUAC Cutoff (cm) Outcome Results
Guinea-Bissau
1,054, ~70% F ≥15 HIV-1 and/or HIV-2, ART-naïve at baseline
≤25 Mortality, 6 months (post-ART initiation)
HR=3.5 (95% CI=1.7–7.1) Risk of mortality 6 months post-ART initiation is 3.5 times higher in those with MUAC ≤25 vs. those with MUAC >25.
Guinea-Bissau
1,049, ~70% F ≥15 HIV-1 and/or HIV-2, ART-naïve at baseline
≤25 Mortality, 6 months (pre-ART initiation)
HR=7.2 (95% CI= 3.7–13.9) Risk of mortality 6 months pre-ART initiation is 7.2 times higher in those with MUAC ≤25 vs. those with MUAC >25.
Guinea-Bissau
709, 38% F ≥16 Active TB <20 Mortality, 8 months (during TB treatment)
MRR=3.3 (95% CI=2.2–4.9) Among those with active TB, risk of 8-month mortality during TB treatment is 3.3 times higher in those with MUAC <20 vs. those with MUAC ≥20.
Guinea-Bissau
441, 37% F ≥16 Active TB and HIV-negative
<20 Mortality, 8 months (during TB treatment)
HR=2.6 (95% CI=1.7–7.4) Among those with active TB and without HIV infection, risk of 8-month mortality during TB treatment is 2.6 times higher in those with MUAC <20 vs. those with MUAC ≥20.
Guinea-Bissau
243, 41% F ≥16 Active TB with HIV-1 and/or HIV-2
<20 Mortality, 8 months (during TB treatment)
HR=2.5 (95% CI=1.5–4.2) Among those with active TB and with HIV-1 and/or HIV-2 infection, risk of 8-month mortality during TB treatment is 2.5 times higher in those with MUAC <20 vs. those with MUAC ≥20.

Use of Cutoffs for Mid-Upper Arm Circumference (MUAC) as an Indicator or Predictor of Nutritional and Health-Related Outcomes in Adolescents and Adults: A Systematic Review
25
Author, Year Country Total N, % Female (F) Ages (years)
Additional Population Characteristics
MUAC Cutoff (cm) Outcome Results
Gourlay, 2012 Guinea-Bissau
146, 68% F ≥15 HIV-2 M: <24 F: <23
Mortality, 7 years
HR=2.2 (95%CI=0.9-5.3) Risk of mortality is 2.2 times higher in those with MUAC below the stated cutoffs vs. those with MUAC above the cutoffs.
* Same reference as study above by same author. Abbreviations: OR: odds ratio, RR: relative risk, HR: hazard ratio, IQR: interquartile range

Use of Cutoffs for Mid-Upper Arm Circumference (MUAC) as an Indicator or Predictor of Nutritional and Health-Related Outcomes in Adolescents and Adults: A Systematic Review
26
Supplemental Table 1D. Pregnant Women
Author, Year Country N
Age (in years) and Additional Population Characteristics
MUAC Cutoff (cm)
Time of MUAC Measurement Outcome
Time Infant Weighed (LBW only) Results
Cross-Sectional Studies Charles, 2010
Jamaica 204 15% <20 <25 Antenatal care independent of stage of pregnancy
Anemia OR=3.1 (95% CI=1.26-7.71) Women with MUAC <25 were 3.1 times more likely to have anemia vs. women with MUAC ≥25.
Verhoeff, 1999
Malawi 4,104 Mean (SD): 19 (2.8) primagravidae, 27 (5.8) multigravidae, 60% adolescents (≤19 years)
<23 1st antenatal visit
Anemia χ21. Primigravidae: p<0.01 χ2 2. Secundigravidae:
p<0.05 χ2 3. Multigravidae: p>0.05
MUAC <23 is significantly associated with anemia for those that are primigravidae and secundigravidae but not multigravidae.
Dhar, 2008 Bangladesh 316 Age not stated <22 Postpartum LBW infants Not stated, assume close to delivery
OR=1.26 (95%CI=0.47-3.24) Low MUAC is not associated with infant LBW.
Dhar, 2008* Bangladesh 316 Age not stated <24 Postpartum LBW infants Not stated, assume close to delivery
OR=1.71 (95%CI=0.89-3.32) Low MUAC is not associated with infant LBW.
Dhar, 2008* Bangladesh 316 Age not stated <26 Postpartum LBW infants Not stated, assume close to delivery
OR=1.68 (95%CI=0.89-3.52) Low MUAC is not associated with infant LBW.
Elshibly, 2008
Sudan 1,000 16–52 <27 Within 24 hours after delivery
LBW infants Within 24 hours of delivery
RR=1.02 (95%CI=0.63-1.65) Low MUAC is not associated with infant LBW.

Use of Cutoffs for Mid-Upper Arm Circumference (MUAC) as an Indicator or Predictor of Nutritional and Health-Related Outcomes in Adolescents and Adults: A Systematic Review
27
Author, Year Country N
Age (in years) and Additional Population Characteristics
MUAC Cutoff (cm)
Time of MUAC Measurement Outcome
Time Infant Weighed (LBW only) Results
Janjua, 2009
Pakistan 540 Median: 25; 7% <20
≤28.9 After delivery LBW infants Within 12 hours of delivery
PR=1.56 (95% CI=1.09-2.25) Women with MUAC <28.9 were 1.6 times more likely to have an LBW infant vs. women with MUAC ≥28.9.
Ogbonna, 2007
Zimbabwe 498 4% <18 <24 Postpartum LBW infants At birth OR=2.4 (95% CI=1.3-4.2) Women with MUAC <24 were 2.4 times more likely to have an LBW infant vs. women with MUAC ≥24.
Ojha, 2007
Nepal 308 17% <20 <22 Postpartum LBW infants Not stated, assume close to delivery
OR=2.04 (95%CI=1.14-3.63) Women with MUAC <22 were 2 times more likely to have an LBW infant vs. women with MUAC ≥22.
Osman, 1995
Mozambique 102 45% 15–19 <24 During labor LBW infants At birth OR=3.08 (95% CI: 1.23-7.83) Women with LBW infants were 3 times more likely to have MUAC <24 vs. women with normal-weight infants.
Sen, 2010
India 503 16% <20
<22 Within 24 hours after delivery
LBW infants Within 24 hours of delivery
OR=6.0 (95%CI=3.3-10.9) Women with MUAC <22 were 6 times more likely to have an LBW infant vs. women with MUAC ≥22.
Libombo, 1994
Mozambique 102 74% ≤19 <25 After delivery Postpartum endometritis-myometritis (PPEM)
OR=2.66 (95% CI=1.10-6.49) Women with PPEM were 2.7 times more likely to have MUAC <25 vs. women without PPEM.

Use of Cutoffs for Mid-Upper Arm Circumference (MUAC) as an Indicator or Predictor of Nutritional and Health-Related Outcomes in Adolescents and Adults: A Systematic Review
28
Author, Year Country N
Age (in years) and Additional Population Characteristics
MUAC Cutoff (cm)
Time of MUAC Measurement Outcome
Time Infant Weighed (LBW only) Results
Begum, 2003
India 282 Mean (SD): 28.2 (4.5) women with preterm labor 25.8 (4.0) women with at-term labor
<20 After delivery Preterm labor (yes/no)
OR 7.78 (95% CI=3.91-15.62) Women with preterm labor were 7.8 times more likely to have MUAC <20 vs. women with at-term labor.
Longitudinal Studies Lee, 2009
Nepal 3,189 34% <20 <21.5 vs. ≥23
During pregnancy
Birth asphyxia RR=1.3 (95%CI=1.0-1.8) Birth asphyxia is 1.3 times more likely to occur in women with MUAC <21.5 during pregnancy vs. MUAC ≥23.
Kalanda, 2006
Malawi 1,571 19% adolescent, 26% with HIV
<23 1st antenatal visit
Disproportionate intrauterine growth
OR=2.1 (95% CI: 1.1-3.4) Women with MUAC <23 were 2.1 times more likely to have disproportionate growth vs. women with MUAC ≥23.
Verhoeff, 2001
Malawi 1,423 18% ≤19, 26% with HIV
<23 1st antenatal visit
Intra-uterine growth retardation (IUGR)
OR=1.5 (95% CI=1.1-1.9) Women with MUAC <23 were 1.5 times more likely to have IUGR vs. women with MUAC ≥23.
Assefa, 2012 Ethiopia 956 7% <20 <23 During pregnancy
LBW infants Within 24 hours of delivery
OR=1.5 (95% CI=1.14-2.01) Women with MUAC <23 were 1.5 times more likely to have an LBW infant vs. women with MUAC ≥23.

Use of Cutoffs for Mid-Upper Arm Circumference (MUAC) as an Indicator or Predictor of Nutritional and Health-Related Outcomes in Adolescents and Adults: A Systematic Review
29
Author, Year Country N
Age (in years) and Additional Population Characteristics
MUAC Cutoff (cm)
Time of MUAC Measurement Outcome
Time Infant Weighed (LBW only) Results
Karim, 1997
Bangladesh 248 17–35 <22 <23 <24
Close to term and immediately after birth
LBW infants Within 5 days after birth
<22: OR=3.4 (95% CI=1.7-6.8) <23: OR=5.0 (95% CI=1.4-17.9) <24: OR=2.9 (95% CI=1.3-6.6) Women with MUAC below the stated cutoff were significantly more likely to have an LBW infant vs. women with MUAC above the cutoff.
Lechtig, 1988
Guatemala 445 Age not stated ≤23.5 During pregnancy
LBW infants Not stated OR=8.1 (95% CI=4.8-13.5) Women with MUAC ≤23.5 were 8.1 times more likely to have an LBW infant vs. women with MUAC >23.5.
Mohanty, 2006
India 395 Age not stated
≤22.5 1st trimester LBW infants Within 24 hours of delivery
RR=1.67 (95%CI=1.26-2.33) Women with MUAC ≤22.5 were 1.7 times more likely to have an LBW infant vs. women with MUAC >22.5.
Rollins, 2007 South Africa 2,128 Age not stated, ~51% with HIV infection
≤27.6 Antenatal visit LBW infants Within 3 days of delivery
Adj OR=1.77 (p<0.001) Women with MUAC ≤27.6 were 1.8 times more likely to have an LBW infant vs. women with MUAC >27.6, after adjusting for maternal HIV status and gender.

Use of Cutoffs for Mid-Upper Arm Circumference (MUAC) as an Indicator or Predictor of Nutritional and Health-Related Outcomes in Adolescents and Adults: A Systematic Review
30
Author, Year Sebayang, 2012
Achadi, 1995
Villamor, 2003
Achadi, 1995*
Verhoeff, 2001*
Kalanda, 2006*
Country N
Age (in years) and Additional Population Characteristics
MUAC Cutoff (cm)
Time of MUAC Measurement Outcome
Time Infant Weighed (LBW only) Results
Indonesia 14,040 Mean (SD): 25.4 (5.9)
<23.5 Antenatal visit LBW infants Within 1 hour after delivery
OR=1.74 (95% CI=1.57-1.93) Women with MUAC <23.5 were 1.7 times more likely to have an LBW infant vs. women with MUAC ≥23.5.
Indonesia 481 12–49 <24, 24 to <26, 26 to <29, ≥29
Once each trimester
Maternal weight gain
ANOVA p-value <0.001 Mean levels of maternal weight gain are significantly lower with higher levels of MUAC.
Tanzania 957 Age not stated, HIV positive
≤25 Monthly during antenatal visits
Rate of maternal weight gain up to week 27
T-test p-value=.02 Women with MUAC ≤25 had a significantly faster rate of weight gain up to week 27 vs. women with MUAC >25. (no association at week 37, p=.28).
Indonesia 451 12–49 <24, 24 to <26, ≥26
Once each trimester
Neonatal weight and length
ANOVA p-value >0.05 No significant difference in neonatal weight or neonatal length between levels of MUAC.
Malawi 1,423 18% ≤19, 26% with HIV
<23 1st antenatal visit
Preterm birth OR=1.8 (95%CI=1.3-2.3) Women with MUAC <23 were 1.8 times more likely to have a preterm birth vs. women with MUAC ≥23.
Malawi 1,571 19% adolescent, 26% with HIV
<23 1st antenatal visit
Preterm birth OR=2.0 (95% CI: 1.4-2.9) Women with MUAC <23 were 2 times more likely to have a preterm birth vs. women with MUAC ≥23.

Use of Cutoffs for Mid-Upper Arm Circumference (MUAC) as an Indicator or Predictor of Nutritional and Health-Related Outcomes in Adolescents and Adults: A Systematic Review
31
Author, Year Country N
Age (in years) and Additional Population Characteristics
MUAC Cutoff (cm)
Time of MUAC Measurement Outcome
Time Infant Weighed (LBW only) Results
Sebayang, 2012*
Indonesia 13,498 Mean (SD): 25.4 (5.9)
<23.5 Antenatal visit Preterm birth OR=1.13 (95%CI=1.03-1.24) Women with MUAC <23.5 were 1.1 times more likely to have a preterm birth vs. women with MUAC ≥23.5.
Sebayang, 2012*
Indonesia 13,451 Mean (SD): 25.4 (5.9)
<23.5 Antenatal visit Small for gestational age (SGA)
OR=1.47 (95% CI=1.33-1.63) Women with MUAC <23.5 were 1.5 times more likely to have an SGA infant vs. women with MUAC ≥23.5
Venkatesh, 2005
Tanzania 1,008 Median (IQR): 24 (21–28), HIV-positive
<22 During pregnancy
TB incidence HR=2.4 (95% CI=1.24-4.64) Women with MUAC <22 were 2.4 times more likely to have an incident TB infection vs. women with MUAC ≥22.
* Same reference as study above by same author. Abbreviations: OR: odds ratio; RR: relative risk; HR: hazard ratio

Use of Cutoffs for Mid-Upper Arm Circumference (MUAC) as an Indicator or Predictor of Nutritional and Health-Related Outcomes in Adolescents and Adults: A Systematic Review
32
Supplemental Table 2. Diagnostic Test Accuracy Statistics from Published Studies
Ages (in years) and Additional AUC MUAC
Author, Population Total N, % (p- Cutoff Year Location Population Characteristics Female (F) Outcome value) (cm) Sensitivity Specificity PPV NPV Martin, Australia Adolescent Age not stated 55 (411 Hospitalization 0.78 20 29 93 2009 repeated
assessments), 94.6% F
Mazicioglu, Turkey Adolescent 15–17 770, 100% F Hypertension 0.53 24.9 2010 769, 0% F (.5)
0.62 24.6
(.001) 11–14 705, 100% F 0.64 22.5
616, 0% F
(.001) 0.75
21.4
(.001) Oliveira, 2012
Guinea-Bissau
Adult ≥15 years, HIV-1 and/or
625 Mortality, 6 months (pre-
0.75 25 71.9 57.8
HIV-2, ART) ART-naïve at baseline
Rodrigues, India Adult 20–40, 567, 100% F BMI <18.5 21 9.2 97.1 66.7 1994 healthy, non- 22 26.2 93.1 70.4
pregnant 23 50.9 84.5 67.3 24 71.1 69.9 59.4 25 91.7 49.9 53.3
Khadivzadeh, 2002
Iran Adult 15–49, healthy, non-
2,000, 100% F
BMI <19.8 23.5 80.5 92.5 69.5 95.9 23.8 85.7 89.7 68.9 95.9
pregnant, non-lactating 24 93.6 83.9 60.6 98.1
24.5 96.6 80.2 56.5 98.9

Use of Cutoffs for Mid-Upper Arm Circumference (MUAC) as an Indicator or Predictor of Nutritional and Health-Related Outcomes in Adolescents and Adults: A Systematic Review
33
Author, Year Location Population
Ages (in years) and Additional Population Characteristics
Total N, % Female (F) Outcome
AUC (p-value)
MUAC Cutoff (cm) Sensitivity Specificity PPV NPV
Gustafson, 2007
Guinea-Bissau
Adult ≥16 years active TB
709, 38% F Mortality, 8 months (during TB treatment)
21 54 76
Collins, 1996 Sudan Adult Age not stated, severely malnourished inpatients at feeding center during famine
98, 58% F BMI <10 14.5 100 100 100 100 BMI <11 15.5 50 99 88 92 BMI <12 17 71 97 92 86 BMI <13 18.5 83 90 89 85 BMI <14 20 87 78 91 70 BMI <15 21 91 67 95 50 BMI <16 22.5 100 33 96 100
Olukoya, 1990
Nigeria Adult 15-49, non-pregnant, >6 wks postpartum
433, 100% F Weight <45 kg
20 21.3 48.1 23 62.3 44.2 24 75.4 36.8 25 85.2 29.5
Sen, 2010 India Pregnant 16% <20
503, 100% F LBW infants 0.78 21.5 81.3 72.1
Elshibly, 2008
Sudan Pregnant 16–52
1,000, 100% F
LBW infants 0.54 (0.35)
27
Dhar, 2008 Bangladesh Pregnant Age not stated 316, 100% F LBW infants 22 14.6 88.1 18 85.2 24 52.1 61.2 19.4 87.7 26 72.9 38.4 17.5 88.8
Karim, 1997 Bangladesh Pregnant 17–35
248, 100% F LBW infants 22 13.7 96.9 53.8 81.1 23 68.6 55.9 28.9 87.2 24 80.4 41.5 26.5 89
Mohanty, 2006
India Pregnant Age not stated 395, 100% F LBW infants 21.5 44.6 74.8 43.9 75.4 22 57.2 65.7 39.7 75.3

Use of Cutoffs for Mid-Upper Arm Circumference (MUAC) as an Indicator or Predictor of Nutritional and Health-Related Outcomes in Adolescents and Adults: A Systematic Review
34
Ages (in years) and Additional AUC MUAC
Author, Population Total N, % (p- Cutoff Year Location Population Characteristics Female (F) Outcome value) (cm) Sensitivity Specificity PPV NPV
22.5 60.3 58 38.8 76.8 23 65.3 49.3 36.2 76.3 23.5 76.9 40.1 36.2 79.7
Olukoya, Nigeria Pregnant 15–44 1,256, 100% Maternal 23 85.7 54.5 1991 F weight <45 kg,
first trimester 24 85.7 22.2 25 85.7 10.9 26 100 7.6
Abbreviations: PPV: positive predictive value, NPV: negative predictive value