Embed Size (px)
Citation preview

GUIDANCE DOCUMENT Use of Compound-Specific Stable Isotope Analysis
to Distinguish Between Vapor Intrusion and Indoor Sources of VOCs – User’s Guide for CSIA Protocol
ESTCP Project ER-201025
July 2014
Lila Beckley Thomas McHugh GSI Environmental Inc. Tomasz Kuder Paul Philip University of Oklahoma
Distribution Statement A

Standard Form 298 (Rev. 8/98)
REPORT DOCUMENTATION PAGE
Prescribed by ANSI Std. Z39.18
Form Approved OMB No. 0704-0188
The public reporting burden for this collection of information is estimated to average 1 hour per response, including the time for reviewing instructions, searching existing data sources, gathering and maintaining the data needed, and completing and reviewing the collection of information. Send comments regarding this burden estimate or any other aspect of this collection of information, including suggestions for reducing the burden, to the Department of Defense, Executive Services and Communications Directorate (0704-0188). Respondents should be aware that notwithstanding any other provision of law, no person shall be subject to any penalty for failing to comply with a collection of information if it does not display a currently valid OMB control number. PLEASE DO NOT RETURN YOUR FORM TO THE ABOVE ORGANIZATION. 1. REPORT DATE (DD-MM-YYYY) 2. REPORT TYPE 3. DATES COVERED (From - To)
4. TITLE AND SUBTITLE 5a. CONTRACT NUMBER
5b. GRANT NUMBER
5c. PROGRAM ELEMENT NUMBER
5d. PROJECT NUMBER
5e. TASK NUMBER
5f. WORK UNIT NUMBER
6. AUTHOR(S)
7. PERFORMING ORGANIZATION NAME(S) AND ADDRESS(ES) 8. PERFORMING ORGANIZATION REPORT NUMBER
9. SPONSORING/MONITORING AGENCY NAME(S) AND ADDRESS(ES) 10. SPONSOR/MONITOR'S ACRONYM(S)
11. SPONSOR/MONITOR'S REPORT NUMBER(S)
12. DISTRIBUTION/AVAILABILITY STATEMENT
13. SUPPLEMENTARY NOTES
14. ABSTRACT
15. SUBJECT TERMS
16. SECURITY CLASSIFICATION OF: a. REPORT b. ABSTRACT c. THIS PAGE
17. LIMITATION OF ABSTRACT
18. NUMBER OF PAGES
19a. NAME OF RESPONSIBLE PERSON
19b. TELEPHONE NUMBER (Include area code)

CSIA Protocol for Vapor Intrusion Version 2 Investigations July 2014 i
TABLE OF CONTENTS
1.0 INTRODUCTION .............................................................................................................. 1 2.0 APPLICABILITY ............................................................................................................... 1
2.1 Technology Background ......................................................................................... 1 2.2 Application to Vapor Intrusion ............................................................................... 2 2.3 Building-Specific Applicability .............................................................................. 4
2.3.1 Isotope Fingerprint of Subsurface Source ................................................... 4 2.3.2 Building-Specific Considerations ............................................................... 5 2.3.3 Vapor Intrusion COCs ................................................................................ 5
2.4 Use of CSIA with Other Investigation Approaches ................................................ 6 3.0 INVESTIGATION PROTOCOL FOR APPLICATION OF CSIA TO VAPOR
INTRUSION ....................................................................................................................... 6 3.1 PRE-SAMPLING ACTIVITIES ............................................................................ 6 3.2 SUBSURFACE SAMPLING LOCATIONS .......................................................... 7 3.3 INDOOR AIR SAMPLING LOCATIONS ............................................................ 8 3.4 COLLECTION OF WATER SAMPLES ............................................................... 9 3.5 COLLECTION OF VAPOR SAMPLES ................................................................ 9
3.5.1 Required Minimum Sample Volumes ........................................................ 9 3.5.2 Estimation of Sample Point Concentrations ............................................... 9 3.5.3 Recommended Samplers for Vapor Samples ........................................... 10 3.5.4 Collection of Samples Using Summa Canisters ....................................... 10 3.5.5 Collection of Samples Using Sorbent Tubes ............................................ 11
3.6 SAMPLE SHIPMENT AND ANALYSIS ........................................................... 12 3.7 ANALYTICAL LABORATORIES AND COST ................................................ 12
4.0 DATA INTERPRETATION ............................................................................................ 13 5.0 REFERENCES ................................................................................................................. 15 TABLES
Table 1: Sampling Conditions for Fractionation-Free Performance with Carboxen 1016 ............. 2 Table 2: Minimum Mass Required for a Single Isotope Analysis .................................................. 9 Table 3: Example Uncertainty Associated with Concentration Estimation Methods ................... 10 Table 4: Recommended Samplers for Vapor Samples for CSIA ................................................. 10 Table 5: Recommended Number of Sorbent Tubes for Each Isotope Analysis per Single COC
and Single Isotope Ratio ................................................................................................... 11 Table 6: Analytical Costs for CSIA .............................................................................................. 12 Table 7: Likely Range of Isotope Ratios for Indoor Sources of PCE, TCE, and Benzene........... 13 FIGURES
Figure 1: Conceptual Basis for Application of CSIA to Vapor Intrusion ....................................... 3 Figure 2: Site-Specific Applicability of CSIA for Vapor Intrusion Based on Isotope Ratios of
Subsurface Source ............................................................................................................... 5 Figure 3: Advantages and Disadvantages of Sample Locations for Characterization of the
Subsurface VOC Isotope Signature .................................................................................... 8 Figure 4: Interpretation of CSIA Results for Single Isotope ........................................................ 13 Figure 5: Interpretation of CSIA Results for Two Isotopes .......................................................... 14
CSIA Protocol for Vapor Intrusion Version 2 Investigations July 2014 ii
LIST OF ACRONYMS
‰ Per mil (parts per thousand) 1,1-DCE 1,1-Dichloroethene 1,1,1-TCA 1,1,1-Trichloroethane 1,2-DCA (EDC)
1,2-Dichloroethane (Ethylene Dichloride)
AFB Air Force Base bgs Below ground surface cis-1,2-DCE cis-1,2-Dichloroethene COC Constituent of concern CSIA Compound-Specific Stable Isotope
Analysis DoD U.S. Department of Defense δ Delta, an Isotope Ratio Measure ft Feet, foot GC/MS Gas Chromatograph/Mass Spectrometer K thousand MTBE Methyl tert butyl ether N/A Not applicable PCE Tetrachloroethene SMOC Standard Mean Ocean Chloride TAGA Trace Atmospheric Gas Analyzer TCE Trichloroethene USEPA U.S. Environmental Protection Agency V-PDB Vienna - Pee Dee Belemnite V-SMOW Vienna – Standard Mean Ocean Water VI Vapor Intrusion VOA Volatile Organic Analysis VOCs Volatile Organic Compounds

CSIA Protocol for Vapor Intrusion Version 2 Investigations July 2014 1
1.0 INTRODUCTION
Compound-specific stable isotope analysis (CSIA) can be used as a building-specific vapor intrusion investigation tool to augment data from other investigation methods. The primary utility is to provide an independent line of evidence to distinguish between vapor intrusion and indoor sources of VOCs. This CSIA protocol is not a standalone investigation approach. It involves collection of subsurface source (i.e., groundwater) and indoor air samples. Concentrations of target VOCs from these media must be known or estimated to develop CSIA sampling parameters (e.g., sample collection time). This document i) describes the applicability of CSIA for vapor intrusion investigations (Section 2.0), ii) provides a step-by-step procedure for sample collection (Section 3.0), and iii) includes guidelines for data interpretation (Section 4.0). Additional background information on this investigation approach is available in the ESTCP Project ER-201025 Final Report (GSI, 2013a).
2.0 APPLICABILITY
2.1 Technology Background Many elements, such as carbon, occur as different isotope species, differing in their number of neutrons present in the nucleus. For example, 12C, with 6 neutrons, is the most abundant form of carbon. 13C, with 7 neutrons, makes up a small fraction (~1%) of the carbon in the environment. Isotopic ratios (13C/12C) of specific compounds (e.g., TCE) can vary as a result of differences in their source material or compound synthesis or due to transformation in the environment. The change in the ratio of stable isotopes due to transformation is called stable isotope fractionation (USEPA, 2008). These differences in the isotopic ratios measured in organic contaminants present in environmental samples can be used to i) distinguish between different sources of the contaminants and ii) understand biodegradation and other transformation processes occurring in the environment. CSIA measures the carbon, chlorine, and/or hydrogen isotope ratios for individual chemicals. The results, however, are not reported as direct ratios of the isotopes. In order to ensure inter-laboratory comparability and accuracy, the ratios are expressed relative to an international standard1. Measured values are compared to the standard and reported as δ13C, δ37Cl, and δ2H, as illustrated in Equation 1 below for carbon. Results are typically reported in parts per thousand (“per mil” [‰]).
𝛿13𝐶(‰) = �� 𝐶13 𝐶12� �𝑠𝑎𝑚𝑝𝑙𝑒−� 𝐶13 𝐶12� �𝑠𝑡𝑎𝑛𝑑𝑎𝑟𝑑
� 𝐶13 𝐶12� �𝑠𝑡𝑎𝑛𝑑𝑎𝑟𝑑
� 𝑥 1000 (1)
1 Typically Vienna-PeeDee Belemnite (V-PDB) for carbon, Standard Mean Ocean Chloride (SMOC) for chlorine, and Vienna-Standard Mean Ocean Water (V-SMOW) for hydrogen.
CSIA Protocol for Vapor Intrusion Version 2 Investigations July 2014 2
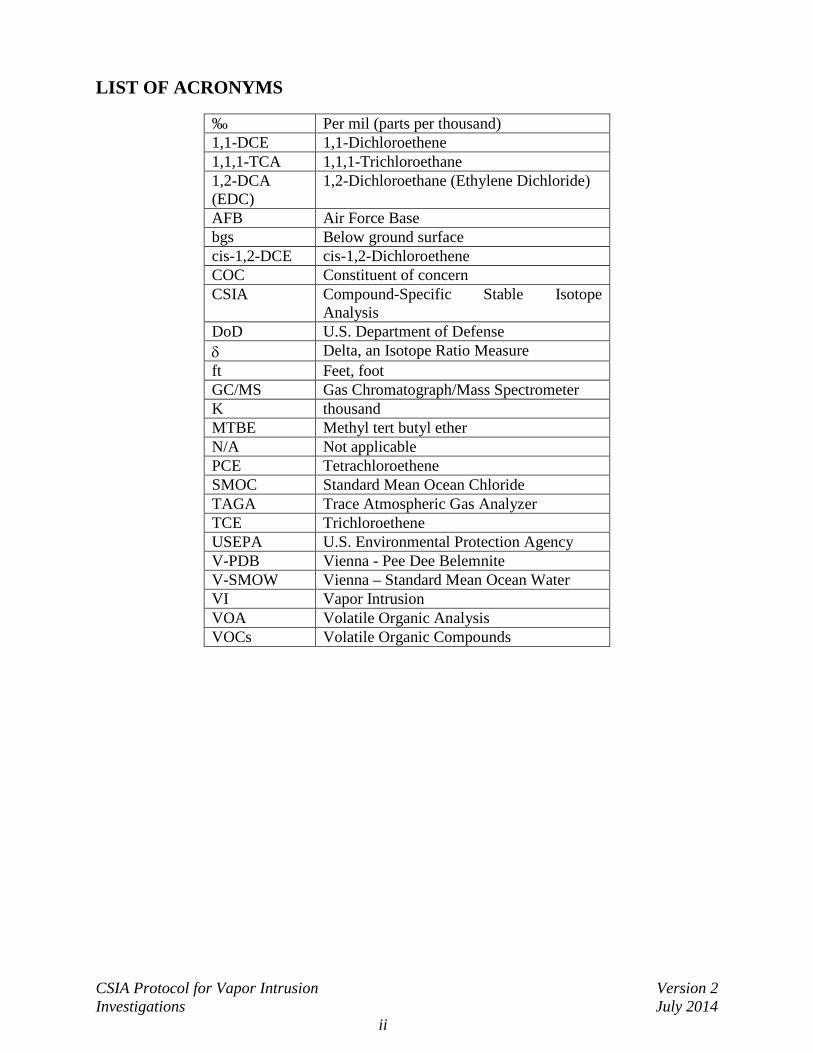
As discussed in Section 3.4, groundwater samples are collected in standard VOA vials. Vapor samples are collected on sorbent tubes (Section 3.5) or in Summa canisters. In an evaluation of commercially-available sorbents, Carboxen 1016 was found to perform best under different sampling conditions (GSI, 2012). The validated sampling conditions are summarized in Table 1.
Table 1: Sampling Conditions for Fractionation-Free Performance with Carboxen 1016 Parameter Validated Range
Target VOCs/isotopes benzene (C, H), TCE (C, Cl), PCE (C, Cl) Sample Volume ≤100 L1 Sample Collection Rate ≤100 mL/min Relative Humidity (at 23oC) 10 % - 90 % Target VOC mass: benzene 30 to 900 ng2
Target VOC mass: TCE, PCE 100 to 2250 ng Non-target VOC mass 0 to 800 ug Sample Holding Time (at 4˚C)3 Up to 4 weeks3 Sample Holding Time (at -10˚C)3 Up to 24 weeks3 1 Laboratory study showed an absence of fractionation for sample volumes up to 200L. However, a 100L sample volume limit is recommended as a conservative measure to ensure an absence of fractionation; 2 A higher minimum sample mass of 1000 ng is required to measure the hydrogen isotope ratio for benzene. Performance for up to 5000 ng was validated; 3 Storage of samples at room temperature is not recommended. Refrigerated tubes can be stored for at least 4 weeks prior to analysis (Klisch et al., 2012). It is recommended that tubes be frozen for holding time longer than 4 weeks, and analyzed within 6 months of collection (see GSI, 2013). The methodology for determination of isotope ratios in VOCs present in air/vapor involves i) recovery and preconcentration of the target volatiles from air/vapor by sample processing by standard methods such as those described in USEPA Methods TO-15 or TO-17 (USEPA 1999a; USEPA 1999b); and ii) analysis of the collected samples for their isotope ratios, using CSIA adapted from the protocols used for analysis of the same VOCs present in groundwater samples (USEPA, 2008).
2.2 Application to Vapor Intrusion Various processes can change the isotope ratios of a compound (so-called isotope fractionation). Molecular bonds containing the lighter isotopes are broken at slightly faster rates than those containing the heavier isotopes. As a result, the isotopic ratio for a compound can change over time as the compound is biodegraded in the subsurface. The parent compound (e.g., TCE) becomes relatively enriched in heavy isotopes (i.e., less negative δ13C and δ37Cl values), while transformation products (e.g., cis-1,2-DCE) end up with less of the heavy isotopes (i.e., more negative δ13C and δ37Cl values). While physical processes such as evaporation and sorption can also cause fractionation at contaminated sites, these processes are often too subtle to have a measurable effect on isotope ratios, except for hydrogen. The CSIA approach involves i) determination of stable isotope ratios of the target VOCs present in the air (13C/12C, 37Cl/35Cl for PCE and TCE; 13C/12C and 2H/1H in the case of benzene) and ii) use of those ratios to differentiate between VOCs sourced from the subsurface (true vapor intrusion) and those sourced from miscellaneous household products. The conceptual basis for application of CSIA to vapor intrusion follows:
CSIA Protocol for Vapor Intrusion Version 2 Investigations July 2014 3
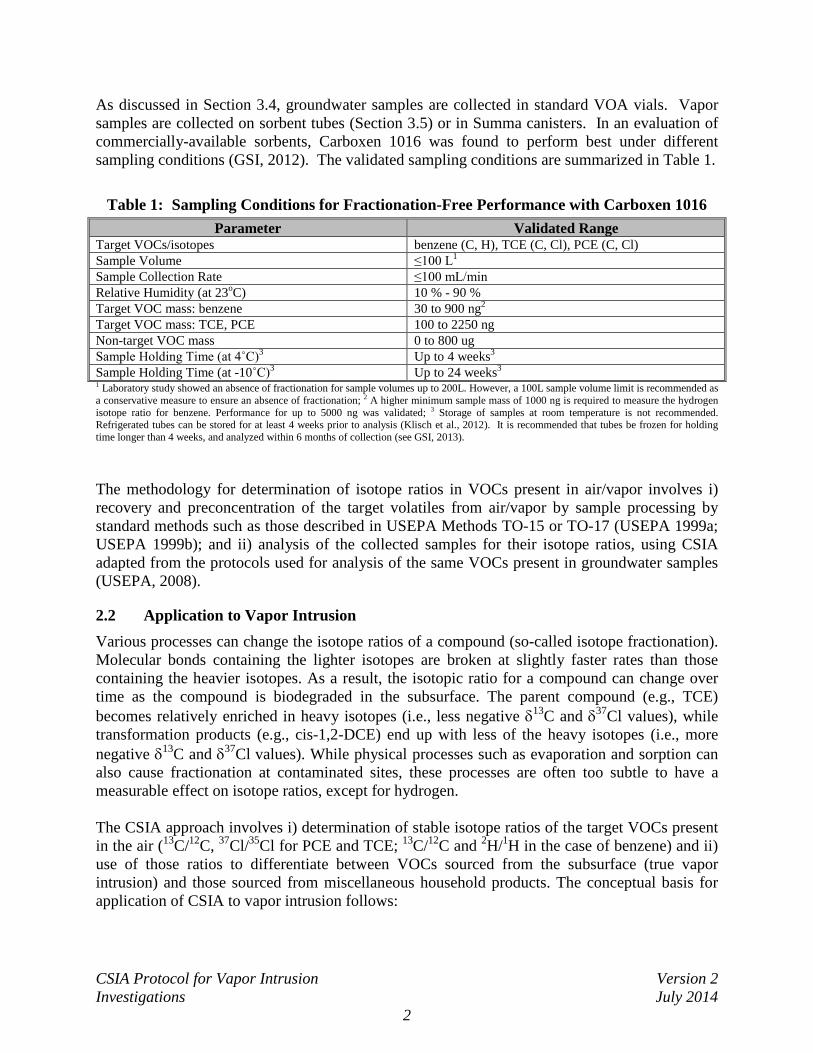
1. Isotope ratios for VOCs originating from different manufactured sources have isotope ratios within a defined range (Figure 1, Panel A). This range is small compared to the range of isotope ratios created by isotope fractionation effects that occur in the subsurface.
2. VOCs originating from subsurface sources commonly undergo biodegradation in groundwater and later in the unsaturated soil prior to entering indoor air. Individual molecules that contain the lighter isotopes are often preferentially biodegraded, resulting in enrichment of the heavier isotope species in the undegraded residue (Figure 1, Panel B). This enrichment process is known as isotope fractionation.
3. The consequence of isotope fractionation is that isotope composition of VOCs originating from the subsurface is often clearly different than that of pristine (undegraded) manufactured products acting as indoor sources of the same VOCs (Figure 1, Panel C).
4. This difference allows the successful differentiation between VOCs from indoor sources and those from true vapor intrusion sources (Figure 1, Panel D).
Figure 1: Conceptual Basis for Application of CSIA to Vapor Intrusion

CSIA Protocol for Vapor Intrusion Version 2 Investigations July 2014 4
Interpretation of the origin of VOCs in indoor air based on CSIA results is relatively straightforward in comparison to traditional vapor intrusion investigation methods. The isotope ratios from VOCs in indoor air are directly compared to those from the subsurface source (groundwater) and those measured in a variety of available consumer products. Isotope ratios dissimilar from the subsurface source but similar to the values characteristic of, for example, TCE present in household products is a strong indication that the latter are responsible for the indoor air contamination (see Figure 1, Panel D, Example A). On the other hand, the isotope ratios of TCE in indoor air can be similar to the subsurface sources and different from indoor sources, confirming the impact of vapor intrusion (Figure 1, Panel D, Example B).
2.3 Building-Specific Applicability Building-specific investigations of vapor intrusion are typically required when VOCs have been detected above applicable screening concentrations within 30 to 100 feet of the buildings and the results of subsurface testing (i.e., groundwater or soil gas) indicate a potential vapor intrusion concern (USEPA, 2002; ITRC, 2007). When a building-specific investigation is required, the CSIA investigation procedure is broadly applicable to a wide variety of building types and COCs. The investigation procedure will be most commonly applied in conjunction with other investigation methods. Specific considerations for the selection of this investigation procedure are discussed below.
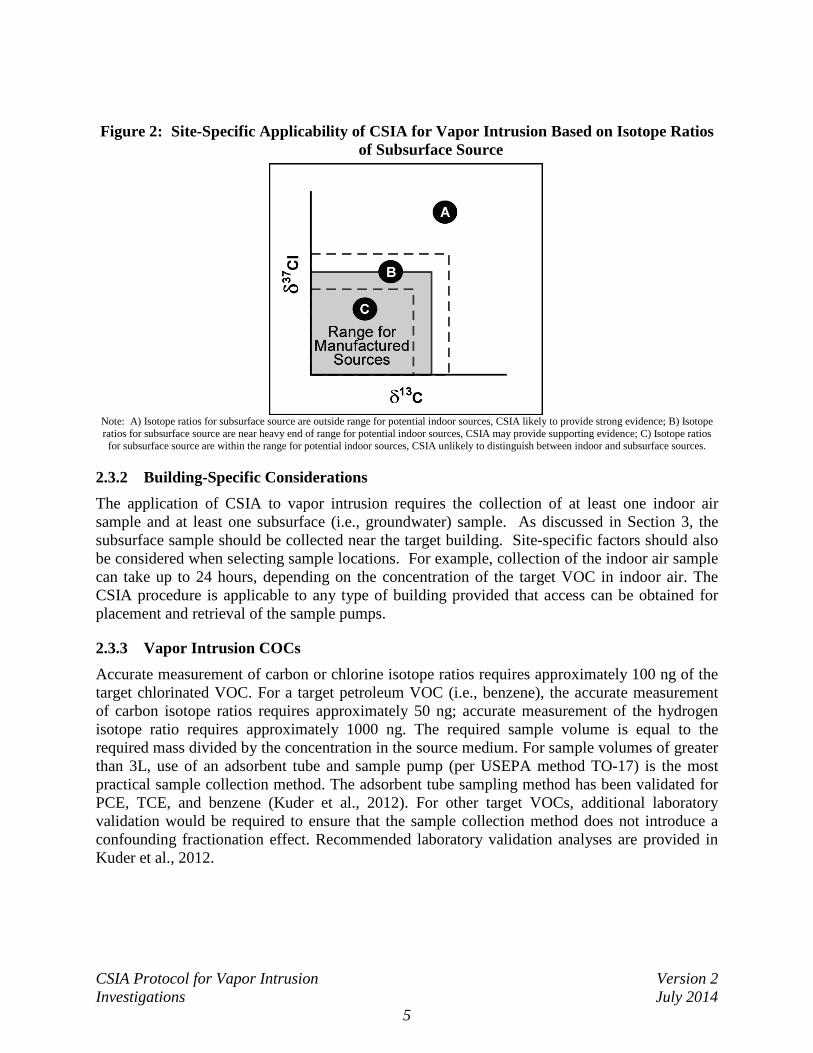
2.3.1 Isotope Fingerprint of Subsurface Source The CSIA procedure relies on differences in the isotope signature between the subsurface VOC source and potential indoor VOC sources in order to determine the origin of VOCs detected in indoor air. As a result, the method is most likely to provide clear results if the isotope fingerprint for the subsurface source is outside the range for potential indoor sources (see Figure 2 “A”). The method may also yield useful supporting evidence if the isotope ratios for the subsurface source are close to the heavy end of the indoor source range (see Figure 2 “B”). In this situation, an indoor air sample with isotope ratios that closely match the subsurface source would provide supporting evidence of vapor intrusion, but this result, alone, would not be definitive because of the potential contribution from indoor sources. Biodegradation of VOCs in the subsurface commonly results in an isotope fractionation effect. Therefore, sites with evidence of biodegradation (e.g., detection of daughter products) are more likely to have subsurface sources with isotope signatures that are distinct from potential indoor sources. 50% biodegradation of TCE should commonly be sufficient for the subsurface source to be distinct from the range of indoor sources. However, for benzene, up to 90% biodegradation could be required and for PCE, more than 90% biodegradation could be required at some sites (GSI, 2012). The isotope signature of the subsurface source should be measured before large scale application of the CSIA procedure at a site. Based on the results of initial isotope fingerprinting, the applicability of CSIA at the site for the evaluation of vapor intrusion should be determined as illustrated in Figure 2. The isotope signature of the subsurface source can be measured prior to the collection of any indoor air samples or in conjunction with the initial sampling of one or two buildings.
CSIA Protocol for Vapor Intrusion Version 2 Investigations July 2014 5
Figure 2: Site-Specific Applicability of CSIA for Vapor Intrusion Based on Isotope Ratios of Subsurface Source
Note: A) Isotope ratios for subsurface source are outside range for potential indoor sources, CSIA likely to provide strong evidence; B) Isotope ratios for subsurface source are near heavy end of range for potential indoor sources, CSIA may provide supporting evidence; C) Isotope ratios
for subsurface source are within the range for potential indoor sources, CSIA unlikely to distinguish between indoor and subsurface sources.
2.3.2 Building-Specific Considerations The application of CSIA to vapor intrusion requires the collection of at least one indoor air sample and at least one subsurface (i.e., groundwater) sample. As discussed in Section 3, the subsurface sample should be collected near the target building. Site-specific factors should also be considered when selecting sample locations. For example, collection of the indoor air sample can take up to 24 hours, depending on the concentration of the target VOC in indoor air. The CSIA procedure is applicable to any type of building provided that access can be obtained for placement and retrieval of the sample pumps.
2.3.3 Vapor Intrusion COCs Accurate measurement of carbon or chlorine isotope ratios requires approximately 100 ng of the target chlorinated VOC. For a target petroleum VOC (i.e., benzene), the accurate measurement of carbon isotope ratios requires approximately 50 ng; accurate measurement of the hydrogen isotope ratio requires approximately 1000 ng. The required sample volume is equal to the required mass divided by the concentration in the source medium. For sample volumes of greater than 3L, use of an adsorbent tube and sample pump (per USEPA method TO-17) is the most practical sample collection method. The adsorbent tube sampling method has been validated for PCE, TCE, and benzene (Kuder et al., 2012). For other target VOCs, additional laboratory validation would be required to ensure that the sample collection method does not introduce a confounding fractionation effect. Recommended laboratory validation analyses are provided in Kuder et al., 2012.

CSIA Protocol for Vapor Intrusion Version 2 Investigations July 2014 6
2.4 Use of CSIA with Other Investigation Approaches The CSIA procedure will most commonly be used in conjunction with other investigation methods such as conventional Summa canister sampling or on-site GC/MS analysis (GSI, 2013b). The CSIA procedure may be used i) as a supplemental tool during an initial investigation at buildings without prior vapor intrusion testing (provided that, at a minimum, screening-quality data are available to estimate target VOC concentrations) or ii) at buildings where preliminary testing of indoor air has identified VOC concentrations near or above regulatory screening values, and there is some uncertainty concerning the source of the VOCs.
3.0 INVESTIGATION PROTOCOL FOR APPLICATION OF CSIA TO VAPOR INTRUSION
3.1 PRE-SAMPLING ACTIVITIES CSIA will most commonly be conducted as part of a larger vapor intrusion sampling program. As a result, the pre-sampling activities discussed here focus only on the additional planning steps required for the collection of samples for CSIA. Basic activities such as obtaining building access are not covered. Pre-sampling, preparatory activities include:
1. Identify Specific Structures for Sampling: Select specific structures to be included in the CSIA program. If prior sampling results are available, this would include buildings with VOCs in indoor air near or above screening levels for which the source is uncertain. If no prior sampling results are available, then this may include all buildings with VI concerns or only the highest priority buildings.
2. Determine Target VOCs: Identify the VOCs for CSIA. The target VOCs should be the one to two vapor intrusion COCs of greatest concern based on consideration of subsurface concentrations, indoor air screening concentrations, and potential for indoor sources. The sorbent sample collection method has been validated for PCE, TCE, and benzene. Additional validation would be required for application of this sample collection method to other VOCs.
3. Estimate Target VOC Concentrations: The collection of indoor air samples for CSIA requires an estimate of the concentration of the target VOC at the sample point in order to determine the proper sample volume. VOC concentrations may be estimated based on results from previous sampling events. Uncertainty is accounted for by collecting additional sample mass (see Section 3.5.2 and 3.5.5). Groundwater concentrations must be estimated as well. Use of historic data is typically sufficient for this purpose.
4. Necessary Equipment: The collection of low concentration vapor samples for CSIA requires use of sorbent tubes and pumps as described in USEPA Method TO-17 (USEPA, 1999b). Higher concentration samples can be collected using a Summa canister (see Section 5.5). If water samples will be collected to characterize the subsurface source, then appropriate equipment will be required.
CSIA Protocol for Vapor Intrusion Version 2 Investigations July 2014 7
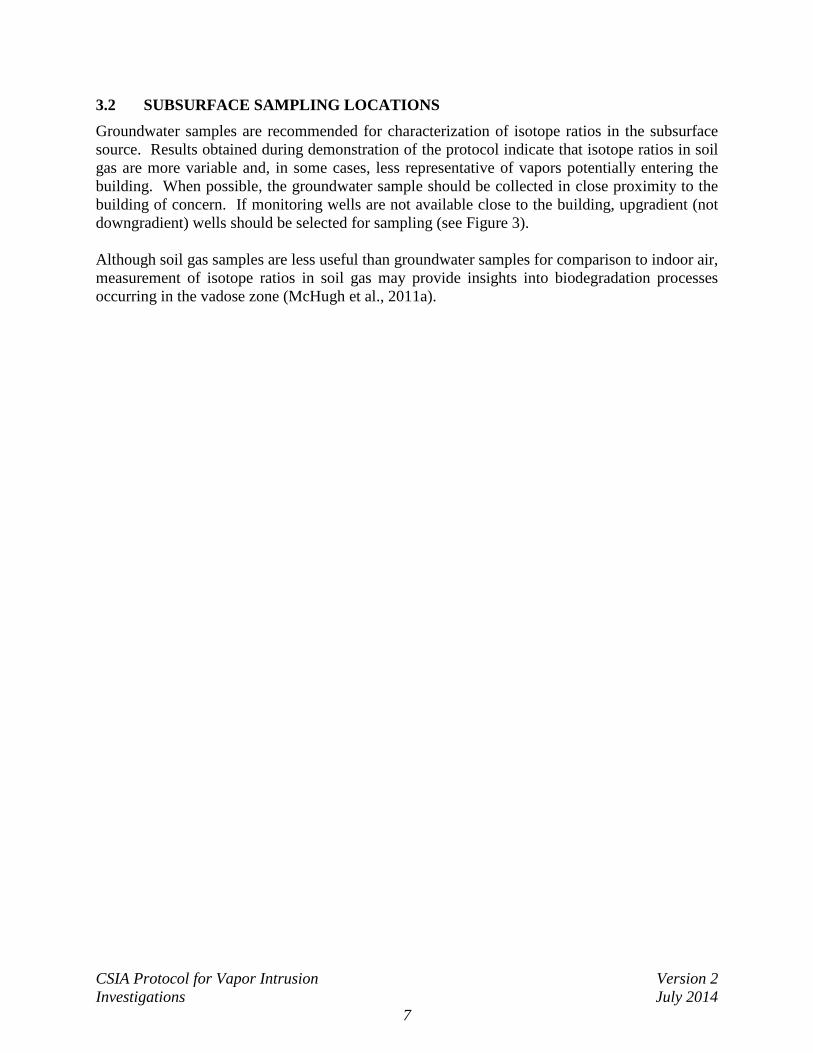
3.2 SUBSURFACE SAMPLING LOCATIONS Groundwater samples are recommended for characterization of isotope ratios in the subsurface source. Results obtained during demonstration of the protocol indicate that isotope ratios in soil gas are more variable and, in some cases, less representative of vapors potentially entering the building. When possible, the groundwater sample should be collected in close proximity to the building of concern. If monitoring wells are not available close to the building, upgradient (not downgradient) wells should be selected for sampling (see Figure 3). Although soil gas samples are less useful than groundwater samples for comparison to indoor air, measurement of isotope ratios in soil gas may provide insights into biodegradation processes occurring in the vadose zone (McHugh et al., 2011a).

CSIA Protocol for Vapor Intrusion Version 2 Investigations July 2014 8
Figure 3: Advantages and Disadvantages of Sample Locations for Characterization of the Subsurface VOC Isotope Signature
Location Advantages Disadvantages A) Upgradient
Groundwater Well (Screened at water table)
• Water sample easier to collect than soil gas sample.
• Easiest sample point if this is the closest existing well to target building.
• Does not account for any additional enrichment that occurs closer to building both within the saturated zone and within the vadose zone.
B) Deep Groundwater Well
• Not recommended • High uncertainty. Isotope ratios may not be representative of VOCs at top of water table.
C) Groundwater Well Close to Target Building (Screened at water table)
• Water sample easier to collect than soil gas sample.
• This water sample will be most representative of VOCs potentially entering building.
• Does not account for any additional enrichment that occurs within vadose zone.
D) Soil Gas Sample from Close to Building
• Not recommended for primary characterization of subsurface source.
• More difficult to collect than water sample.
E) Sub-slab Soil Gas Sample
• Not recommended for primary characterization of subsurface source.
• May contain VOCs originating from within building.
• Sample collection can be a lengthy process, depending on concentration.
F) Downgradient Groundwater Well
• Not recommended • May be more enriched in heavy isotopes than VOCs entering building.
• Could yield false positive determination of indoor source because of greater differentiation between the source and indoor air ratios.
Note: 1) Recommendation based on current understanding of spatial variability in vadose zone. 2) As shown in Figure 2 above, the isotope signature of the subsurface source should be measured before large scale application of the CSIA procedure at a site.
3.3 INDOOR AIR SAMPLING LOCATIONS For most buildings, indoor air can be characterized through the collection and analysis of a single indoor air sample from the area of the building most likely to be impacted by vapor intrusion (e.g., the lowest level of multi-level building). For larger buildings where the air may not be well mixed (e.g., buildings with multiple air handling systems), one sample from each area may be

CSIA Protocol for Vapor Intrusion Version 2 Investigations July 2014 9
warranted. If indoor sources are considered to be more likely within specific portions of the building (e.g., the garage), then an additional sample may be collected from this area.
3.4 COLLECTION OF WATER SAMPLES Water samples for CSIA can be collected using the same sampling procedures used to collect samples to measure VOC concentrations (e.g., in accordance with USEPA, 1996 or ASTM, 2002 for low flow sample collection). Two 40 mL volatile organic analysis (VOA) vials should be collected for analysis of each specific isotope ratio. For example, the analysis of carbon and chlorine isotope of PCE and TCE would require a total of eight 40 mL VOA vials (2 vials x 2 sets of ratios (carbon and chlorine) x 2 compounds (PCE and TCE)). Samples for the analysis of carbon or hydrogen isotopes should be preserved using hydrochloric acid. Samples for the analysis of chlorine isotopes should be preserved using sulfuric acid. Samples should be refrigerated for shipping and stored at 4ºC prior to analysis.
3.5 COLLECTION OF VAPOR SAMPLES Vapor samples for CSIA can be collected using Summa canisters or sorbent tubes. The appropriate sample method is determined based on the sample volume required.
3.5.1 Required Minimum Sample Volumes The sample volume is determined by the minimum mass required for analysis and the sample concentration. The minimum mass required for analysis is provided in Table 2 (Kuder et al., 2012).
Table 2: Minimum Mass Required for a Single Isotope Analysis Target VOC Isotope Minimum Mass Required for Analysis
PCE or TCE Carbon 100 ng PCE or TCE Chlorine 100 ng Benzene Carbon 50 ng Benzene Hydrogen 1000 ng (1)
Note: 1) In most cases, it will be impractical to collect enough sample volume to measure the hydrogen isotope ratio in indoor air. The minimum sample volume is calculated using Equation 1:
Equation 1:
Sample Volume (L) = Minimum Mass (ng) / Sample Concentration (ug/m3) x 1 (L – ug)/(m3 – ng)
Where: Sample Volume = Minimum sample volume for CSIA (L) Minimum Mass = Minimum sample mass for CSIA (ng, see Table 2) Sample Concentration = Estimated or measured concentration of target VOC in sample (ug/m3) 1 (L – ug)/(m3 – ng) = Units conversion factor. 1 ug/m3 = 1 ng/L
3.5.2 Estimation of Sample Point Concentrations Because CSIA requires a minimum sample mass, the sample point concentration must be estimated to determine the required sample volume. The sample point concentration may be

CSIA Protocol for Vapor Intrusion Version 2 Investigations July 2014 10
estimated based on on-site analysis conducted on the same day as the CSIA sampling, analysis conducted prior the CSIA sampling, or based on information other than a direct measurement of the target VOC concentration at the sample point. The uncertainty associated with the estimate will depend on the estimation method (see Table 3).
Table 3: Example Uncertainty Associated with Concentration Estimation Methods Estimation Method Example Uncertainty On-site Concentration Measurement on the Day of CSIA Sample Collection
< 2x
Concentration Measurement on a Prior Day 2 – 4 x Other Estimation Method > 5 – 10 x
Note: 1) The table illustrates the relative uncertainty between different estimation methods. It does not take into account additional factors which may introduce uncertainty (e.g., introduction or removal of indoor VOC sources during normal building operations). When calculating the minimum sample volume using Equation 1, the uncertainty in the estimated sample point concentration should be considered in order to ensure that adequate sample mass is collected.
3.5.3 Recommended Samplers for Vapor Samples The recommended sampler is based on the minimum sample volume as shown in Table 4.
Table 4: Recommended Samplers for Vapor Samples for CSIA Minimum Sample Volume Recommended Sampler
≤250 mL 1L Summa ≤1.5 L 6L Summa > 1.5 L Sorbent Tube
A Summa canister larger than the minimum sample volume (i.e., a 6L Summa for a 1.5L minimum sample volume) is recommended because many laboratories cannot extract the full sample volume from the Summa canister. In addition, it is common practice to provide enough sample for at least two analyses. It is possible to use Summa canisters for somewhat higher minimum sample volumes by collecting two or more Summa canisters for each sample. Summa canisters are recommended for smaller sample volumes because they are easier to use than sorbent tubes. However, sorbent tubes may also be used for lower volume samples. For example, if sorbent tubes are being used at a site to collect samples requiring larger volumes, then the investigator may choose to also collect the lower volume samples using sorbent tubes (i.e., rather than using Summa canisters for some samples and sorbent tubes for others).
3.5.4 Collection of Samples Using Summa Canisters When using a Summa canister to collect a vapor sample for CSIA, the sample can be collected as a grab sample (i.e., without use of a flow controller) if low minimum sample volumes are needed based on the i) estimated concentration and ii) basis of the estimate (grab vs. 24-hour sample). Otherwise, the sample collection should be conducted in accordance with typical guidance on the collection of Summa canister samples for measurement of VOC concentration (e.g., NDEP, 2001
CSIA Protocol for Vapor Intrusion Version 2 Investigations July 2014 11
or similar procedures available from analytical laboratory). Summa canister samples should be stored at room temperature prior to analysis.
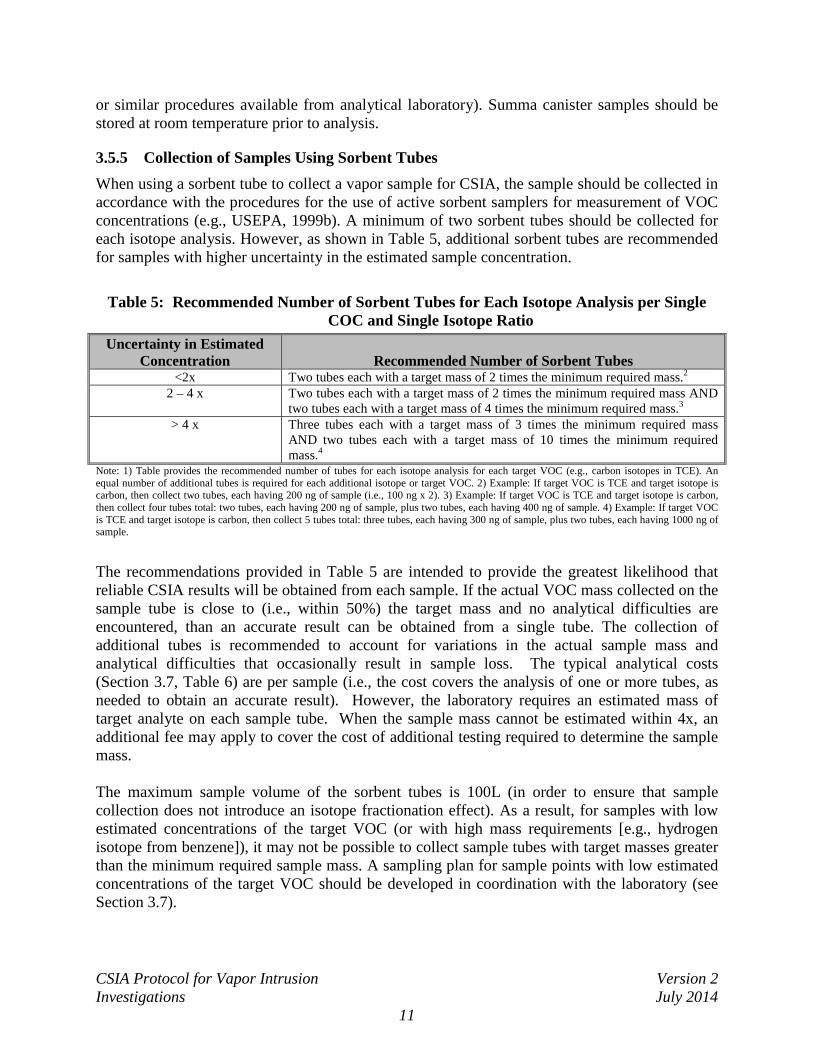
3.5.5 Collection of Samples Using Sorbent Tubes When using a sorbent tube to collect a vapor sample for CSIA, the sample should be collected in accordance with the procedures for the use of active sorbent samplers for measurement of VOC concentrations (e.g., USEPA, 1999b). A minimum of two sorbent tubes should be collected for each isotope analysis. However, as shown in Table 5, additional sorbent tubes are recommended for samples with higher uncertainty in the estimated sample concentration.
Table 5: Recommended Number of Sorbent Tubes for Each Isotope Analysis per Single COC and Single Isotope Ratio
Uncertainty in Estimated Concentration Recommended Number of Sorbent Tubes
<2x Two tubes each with a target mass of 2 times the minimum required mass.2 2 – 4 x Two tubes each with a target mass of 2 times the minimum required mass AND
two tubes each with a target mass of 4 times the minimum required mass.3 > 4 x Three tubes each with a target mass of 3 times the minimum required mass
AND two tubes each with a target mass of 10 times the minimum required mass.4
Note: 1) Table provides the recommended number of tubes for each isotope analysis for each target VOC (e.g., carbon isotopes in TCE). An equal number of additional tubes is required for each additional isotope or target VOC. 2) Example: If target VOC is TCE and target isotope is carbon, then collect two tubes, each having 200 ng of sample (i.e., 100 ng x 2). 3) Example: If target VOC is TCE and target isotope is carbon, then collect four tubes total: two tubes, each having 200 ng of sample, plus two tubes, each having 400 ng of sample. 4) Example: If target VOC is TCE and target isotope is carbon, then collect 5 tubes total: three tubes, each having 300 ng of sample, plus two tubes, each having 1000 ng of sample. The recommendations provided in Table 5 are intended to provide the greatest likelihood that reliable CSIA results will be obtained from each sample. If the actual VOC mass collected on the sample tube is close to (i.e., within 50%) the target mass and no analytical difficulties are encountered, than an accurate result can be obtained from a single tube. The collection of additional tubes is recommended to account for variations in the actual sample mass and analytical difficulties that occasionally result in sample loss. The typical analytical costs (Section 3.7, Table 6) are per sample (i.e., the cost covers the analysis of one or more tubes, as needed to obtain an accurate result). However, the laboratory requires an estimated mass of target analyte on each sample tube. When the sample mass cannot be estimated within 4x, an additional fee may apply to cover the cost of additional testing required to determine the sample mass. The maximum sample volume of the sorbent tubes is 100L (in order to ensure that sample collection does not introduce an isotope fractionation effect). As a result, for samples with low estimated concentrations of the target VOC (or with high mass requirements [e.g., hydrogen isotope from benzene]), it may not be possible to collect sample tubes with target masses greater than the minimum required sample mass. A sampling plan for sample points with low estimated concentrations of the target VOC should be developed in coordination with the laboratory (see Section 3.7).

CSIA Protocol for Vapor Intrusion Version 2 Investigations July 2014 12
Sorbent tube samples should be refrigerated during shipping and stored at 4ºC (or frozen) prior to analysis.
3.6 SAMPLE SHIPMENT AND ANALYSIS Water and vapor samples should be stored and shipped in accordance with manufacturer and laboratory guidelines. Samples collected in sorbent tubes should be stored at 4ºC and shipped to the laboratory ([University of Oklahoma]; see contact information in Section 3.7). Water samples and gas samples collected in Summa canisters can be analyzed at the University of Oklahoma or at another qualified isotope laboratory.
3.7 ANALYTICAL LABORATORIES AND COST Although a number of commercial laboratories provide isotope analysis for water sample or air samples, at present, the University of Oklahoma service laboratory is the only laboratory that can measure compound-specific isotope ratios of VOCs on adsorbent tube samples. Analytical costs are summarized in Table 6.
Table 6: Analytical Costs for CSIA Analyte Carbon Chlorine Hydrogen
Adsorbent Tube Samples PCE/TCE $400/sample $400/sample $350/sample (TCE) Benzene $350/sample N/A $350/sample Water Samples PCE/TCE $350/sample $400/sample $350/sample (TCE) Benzene $350/sample N/A $350/sample
Note: Laboratory requires estimated mass or concentration of target analyte in sample. An additional fee may apply if this information is not provided. Information on the University of Oklahoma service laboratory can be obtained from: University of Oklahoma, Geology Department 100 E. Boyd St; Room A710 Norman OK 73019 Attn: Dr. Paul Philp Email: [email protected] Dr. Paul Philp [email protected] Dr. Tomasz Kuder Phone: 405-325-4469 (Dr. Paul Philp) 405-325-4453 (CSIA laboratory) 405-325-3253 (OU Geology Department, Front Desk)

CSIA Protocol for Vapor Intrusion Version 2 Investigations July 2014 13
4.0 DATA INTERPRETATION
The measured isotope ratios for the subsurface samples and for indoor air can be used to determine the likely source of the target VOC in indoor air, based on i) the similarity of the subsurface and indoor air results, and ii) comparison to isotopic signatures of indoor sources (e.g., manufactured products). The range of likely isotope ratios for indoor sources (Table 7) was determined through literature reviews and laboratory analysis of common consumer products (McHugh et al., 2011b, GSI, 2012).
Table 7: Likely Range of Isotope Ratios for Indoor Sources of PCE, TCE, and Benzene Likely Range VOC Carbon Isotope Ratio (‰) Chlorine Isotope Ratio (‰) PCE -37.4 to -24.0 -4.4 to 1.0 TCE -34.0 to -23.0 -3.2 to 4.7 VOC Carbon Isotope Ratio (‰) Hydrogen Isotope Ratio (‰) Benzene -31.5 to -23.5 -82 to -37
Potential results and interpretations based on a single isotope are illustrated in Figure 4.
Figure 4: Interpretation of CSIA Results for Single Isotope
If two isotope ratios are analyzed, the data interpretation is as follows (Figure 5):
Indoor Source Range
CSIA Protocol for Vapor Intrusion Version 2 Investigations July 2014 14
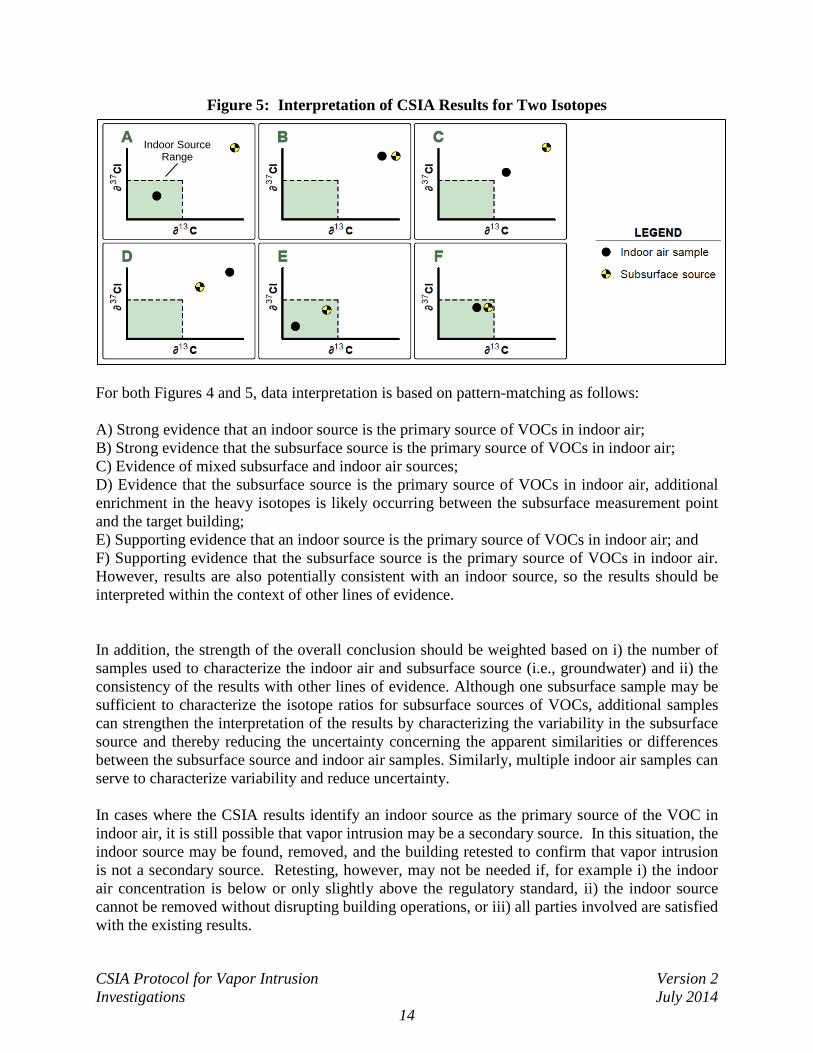
Figure 5: Interpretation of CSIA Results for Two Isotopes
For both Figures 4 and 5, data interpretation is based on pattern-matching as follows: A) Strong evidence that an indoor source is the primary source of VOCs in indoor air; B) Strong evidence that the subsurface source is the primary source of VOCs in indoor air; C) Evidence of mixed subsurface and indoor air sources; D) Evidence that the subsurface source is the primary source of VOCs in indoor air, additional enrichment in the heavy isotopes is likely occurring between the subsurface measurement point and the target building; E) Supporting evidence that an indoor source is the primary source of VOCs in indoor air; and F) Supporting evidence that the subsurface source is the primary source of VOCs in indoor air. However, results are also potentially consistent with an indoor source, so the results should be interpreted within the context of other lines of evidence. In addition, the strength of the overall conclusion should be weighted based on i) the number of samples used to characterize the indoor air and subsurface source (i.e., groundwater) and ii) the consistency of the results with other lines of evidence. Although one subsurface sample may be sufficient to characterize the isotope ratios for subsurface sources of VOCs, additional samples can strengthen the interpretation of the results by characterizing the variability in the subsurface source and thereby reducing the uncertainty concerning the apparent similarities or differences between the subsurface source and indoor air samples. Similarly, multiple indoor air samples can serve to characterize variability and reduce uncertainty. In cases where the CSIA results identify an indoor source as the primary source of the VOC in indoor air, it is still possible that vapor intrusion may be a secondary source. In this situation, the indoor source may be found, removed, and the building retested to confirm that vapor intrusion is not a secondary source. Retesting, however, may not be needed if, for example i) the indoor air concentration is below or only slightly above the regulatory standard, ii) the indoor source cannot be removed without disrupting building operations, or iii) all parties involved are satisfied with the existing results.
Indoor Source Range
CSIA Protocol for Vapor Intrusion Version 2 Investigations July 2014 15
5.0 REFERENCES
ASTM, 2002. ASTM D6771-02 Standard Practice for Low-Flow Purging and Sampling for Wells and Devices Used for Ground-Water Quality Investigations.
GSI Environmental, 2012, ESTCP Project ER-201025 Task 2 Report: Characterization of
Sources and Investigation Protocol, Use of Compound-Specific Stable Isotope Analysis to Distinguish between Vapor Intrusion and Indoor Sources of VOCs (McHugh, Kuder, Philp, Version 2, May 2012).
GSI Environmental, 2013a, Final Report, ESTCP Project ER-201025, Use of Compound-
Specific Isotope Analysis to Distinguish between Vapor Intrusion and Indoor Sources of VOCs (McHugh, Beckley, Kuder, Philp, Version 1, June 2013).
GSI Environmental, 2013b, Final Report, ESTCP Project ER-201119, Use of On-Site GC/MS
Analysis to Distinguish between Vapor Intrusion and Indoor Sources of VOCs (McHugh, Beckley, Gorder, Dettenmaier, Rivera-Duarte, Version 1, June 2013).
ITRC, 2007. Vapor Intrusion Pathway: A Practical Guideline, Interstate Technology &
Regulatory Council Vapor Intrusion Team. January, 2007. Kuder, T., M. Klisch, R. P. Philp, T. McHugh, 2012. Laboratory Study Report: Use of
Compound-Specific Isotope Analysis to Distinguish between Vapor Intrusion and Indoor Sources of VOCs, Version 2, Issued 24 January 2012, ESTCP Project ER-201025.
McHugh, T. E., R. Lee, S. Fiorenza, T. Kuder, P. Philp, H. Lee, 2011a, Validation of New Tools
to Manage Vapor Intrusion Liability, AFCEE BAA Contract 09-C-8016 Project Report, Version 2, 4 March 2011.
McHugh T. E., T. Kuder, S. Fiorenza, K. Gorder, E. Dettenmaier, and P. Philp, 2011b.
Application of CSIA to Distinguish Between Vapor Intrusion and Indoor Sources of VOCs. Environmental Science and Technology, July 15, 2011, 45 (14): 5952-5958.
NDEP, 2001. Summa Canister Sampling, State of Nevada Division of Environmental Protection
Standard Operating Procedure, October 16, 2001. USEPA, 1996. Low-Flow (Minimal Drawdown) Ground-Water Sampling Procedures. EPA
Ground Water Issue EPA/540/S-95/504: Puls, R.W. & Barcelona, M.J. USEPA, 1999a. Compendium Method TO-15, Determination of Volatile Organic Compounds
(VOCs) in Air Collected in Specially-Prepared Canisters and Analyzed by Gas Chromatography/Mass Spectrometry (GC/MS). EPA/625/R-96/010b. January, 1999.
CSIA Protocol for Vapor Intrusion Version 2 Investigations July 2014 16
USEPA, 1999b. Compendium Method TO-17, Determination of Volatile Organic Compounds (VOCs) in Ambient Air Using Active Sampling Onto Sorbent Tubes. EPA/625/R-96/010b. January, 1999.
USEPA, 2002. OSWER Draft Guidance for Evaluating the Vapor Intrusion to Indoor Air
Pathway from Groundwater and Soils (Subsurface Vapor Intrusion Guidance), EPA530-D-02-004. November, 2002.
USEPA, 2008. A Guide for Assessing Biodegradation and Source Identification of Organic
Groundwater Contaminants using Compound Specific Isotope Analysis (CSIA), Office of Research and Development, EPA 600/R-08.148. December, 2008.