Embed Size (px)
Citation preview
Computers & Education 82 (2015) 329e334
Contents lists available at ScienceDirect
Computers & Education
journal homepage: www.elsevier .com/locate /compedu
Use of clickers vs. mobile devices for classroom polling
Jeffrey R. Stowell*
Eastern Illinois University, Department of Psychology, 1151 Physical Sciences, Charleston, IL 61920, USA
a r t i c l e i n f o
Article history:Received 25 September 2014Received in revised form3 December 2014Accepted 4 December 2014Available online 11 December 2014
Keywords:Computer-mediated communicationEvaluation methodologiesImproving classroom teachingInteractive learning environments
* Tel.: þ1 217 581 2279.E-mail address: [email protected].
http://dx.doi.org/10.1016/j.compedu.2014.12.0080360-1315/© 2014 Elsevier Ltd. All rights reserved.
a b s t r a c t
An increasing number of instructors are using mobile devices in place of “clickers” to acquire studentresponses to questions posed by the instructor during class. This exploratory study compared thenumber of correct, incorrect, and missing responses of students who responded to in-class pollingquestions using clickers or mobile devices. In one of two classes, students using mobile devices had agreater number of missing responses and fewer correct responses than students using clickers, but therewere no differences in final grades. In the other class, there were no differences on these measures.Overall, students' attitudes toward using clickers and mobile devices were favorable, but 31% of thosewho reported using a mobile device could not connect to the Internet “sometimes” or “most of the time.”Of those who completed the technology survey, the majority (58%) reported being “never” or “rarely”distracted by other uses of their mobile device during class. Instructors who desire to have students usemobile devices for classroom polling should be aware of the possible differences in missing and correctresponses, and the potential challenges unique to mobile technology.
© 2014 Elsevier Ltd. All rights reserved.
1. Introduction
By the late 1960s, “votingmachines” had arrived in some college classrooms to collect and display students' responses to questions posedby the instructor (Gordon & Becker, 1973; for review see Judson & Sawada, 2002). The next generation of classroom response systems usedhand-held devices affectionately known as “clickers” to fulfill a similar purpose. An emerging generation of classroom response systems isbuilt on the power of mobile devices and the Internet, allowing students to respond to questions in class by text messaging, calling a phonenumber, using designated smartphone polling apps, or using a mobile device's web browser and internet connection.
Smartphones are ubiquitous among U.S. college-age adults with 79% of 18e24-year-old adults reporting owning a smartphone (A. Smith,2013). The prevalence of portable technology (smartphones, tablets, and laptops) has shifted the onus of classroom technology hardwareand its related costs from institutions to students, spawning the phrase “Bring your Own Device (BYOD)” (Johnson et al., 2013). Advances intechnology have positioned teachers who are familiar with using hand-held clickers to consider a transition to mobile device polling, butthere is very little research to indicate if polling responses received through mobile devices differ from those received via clickers, and whatadditional barriers instructors and students may encounter in the process.
Several feasibility studies have demonstrated that clickers and mobile devices can be used side-by-side in the classroom. After someinitial technical difficulty, two instructors at an institution in Hong Kong were able to collect data concurrently from students using mobiledevices or clickers (Lam, Wong, Mohan, Xu, & Lam, 2011). In another study where the polling method varied across lectures (clicker, mobiledevice, and hand-raising), half of the students preferred using a mobile device over the other two response methods (Koppen, Langie, &Bergervoet, 2013). Tao, Clark, Gwyn, and Lim (2010) reported that after responding with clickers and laptops, 40% of nursing studentspreferred the laptop polling over traditional clickers, while 40% had no preference, and 20% preferred clickers. Finally, Sun (2014) comparedfinal grades of graduate students who had used clickers or mobile devices and found that students who used mobile devices had signifi-cantly higher grades in one course, but not another. Although these studies demonstrate the viability of conducting concurrent (or alter-nating) methods of responding, none of these studies determined if the responses received frommobile devices were comparable to thosereceived via clickers in terms of percentage of correct, incorrect, or missing responses.
J.R. Stowell / Computers & Education 82 (2015) 329e334330
The intent of the present studywas not to lay claim to tangible pedagogical benefits of classroom polling, as there are already a number ofstudies published in this area (Caldwell, 2007; Reay, Li, & Bao, 2008; M. K. Smith et al., 2009; Stowell & Nelson, 2007; Stowell, Oldham, &Bennett, 2010). Rather, the main purpose of this study was to compare the responses of students who used clickers to the responses of thosewho used mobile devices when answering the same multiple-choice questions in class. Because there was no prior research uponwhich toform an alternative hypothesis, this was an exploratory study designed to determine if there would be differences between responsemethods in the distribution of correct, incorrect, and missing responses. Furthermore, the author explored potential differences in finalgrades and students' attitudes regarding classroom polling technology.
2. Method
2.1. Participants
Students in two upper-division psychology courses at a regional Midwestern university participated as part of routine assessment ofeducational practice (IRB approval #14-401), including students enrolled in Psychology of Learning (n ¼ 82, Fall 2013) and Biological Psy-chology (n¼ 59, Spring 2014). Both courses were lecture-based andmet for three 50-minute class periods perweek. Themajority of studentswere psychology majors in their junior or senior year, with 36 (26%) men and 105 (74%) women. Ethnicity data were not collected, but thepercentage of undergraduate minority students at the university was 26% at the time of the study.
2.2. Polling participation
To fulfill a course participation requirement that contributed to 6e9% of the final course grade, students were expected to use pollingdevices (clickers or mobile devices) to answer conceptual questions posed periodically by the instructor during lecture. The instructorrecorded students' responses to polling questions on the majority of class days, beginning after the second week of class. Students earnedparticipation credit for the class period if they answered one or more of the polling questions. If a student participated on 70% or more of thedays that the instructor recorded participation, the student earned full participation credit for the course. Participation below this level waspro-rated according to the student's actual participation. The mean number of participation days was 19.5 (range: 3e25 out of 25) forPsychology of Learning and 16.3 (range: 4e20 out of 20) for Biological Psychology. Three students did not respond using either of the responsepolling methods, and two students switched frommobile devices to clickers halfway through the course, resulting in polling data from 136students. Two students who had consistently used a clicker for the majority of the course used a mobile device for three class periods; theirmobile device responses were excluded from the data analyses.
2.3. Polling devices
At the beginning of the semester, the instructor informed students of the course participation requirement and the choice for students toprovide polling responses using a clicker or mobile device. The instructor encouraged students to commit to one option after deciding earlywhich response method they preferred. Many students had previously purchased a clicker for use in a prior or concurrent course, and 57students (41.9%) chose to use a clicker. Students who did not have a clicker could purchase one from the bookstore or they could use theirown mobile device and a polling app subscription purchased by the university's Center for Academic Technology Support as part of a pilotinitiative for mobile device polling on campus. For students who used a mobile device, therewere two options for responding: 1) connect tothe polling session by logging into a website and entering a 6-digit session ID provided by the instructor, or 2) download a free smartphoneapp, then join the polling session as a guest by entering their name (for tracking purposes) and the session ID.
The polling software, TurningPoint® from Turning Technologies, simultaneously received the radio frequency signals from the clickersthrough a USB-receiver connected to the presentation computer, and the mobile device responses through an internet connection to thesame computer. The software tallied all students' responses and displayed them in a histogram chart on the polling slide and on students'mobile device screens after the polling closed.
2.4. Polling questions
Over the course of 15 weeks, the instructor presented 181 polling questions in Psychology of Learning and 128 polling questions inBiological Psychology that were shown on the projected computer screen at the front of the classroom and on students' mobile devices. Mostquestions contained four possible answer choices with one or more correct answers. A number of these questions consisted of opinionquestions or team assignment slides used to create teams for in-class competitions; these questions were not used in the analyses, nor werequestions inwhich less than about 1/3 of the class responded (usually indicative of the instructor choosing to skip over the polling question).Exclusion of these questions resulted in 158 and 102 multiple-choice questions for data analyses. These totals include occasions wherestudents could answer a second time after they had the opportunity to discuss the reasoning for their first choice with other students. Foreach student, the instructor tallied the total number of correct (correct response received), incorrect (incorrect response received) andmissing (no response received) responses across participation days.
2.5. Technology survey
At the conclusion of the course, all students had approximately 2 weeks to provide feedback about their polling experience bycompleting an anonymous online survey prepared in Qualtrics®. Students who did not complete the survey within a few days received tworeminders over the remainder of the survey period. Questions on the survey related to general attitudes about audience polling, preferencesfor polling format, specific technology used, perceived value of classroom polling, and frequency of various technology problems. Responserates for the technology survey were 56% (n ¼ 46) in Psychology of Learning and 68% (n ¼ 40) in Biological Psychology.
J.R. Stowell / Computers & Education 82 (2015) 329e334 331
2.6. Statistical procedure
The potential difference in the distribution of in-class polling responses (correct, incorrect, and missing) was evaluated using a Pearson'sChi-Square test, whereas potential differences between groups on final course grades and attitudes about technology were evaluated usingindependent samples t-tests, with alpha levels set at 0.05.
3. Results
3.1. Classroom performance and grades
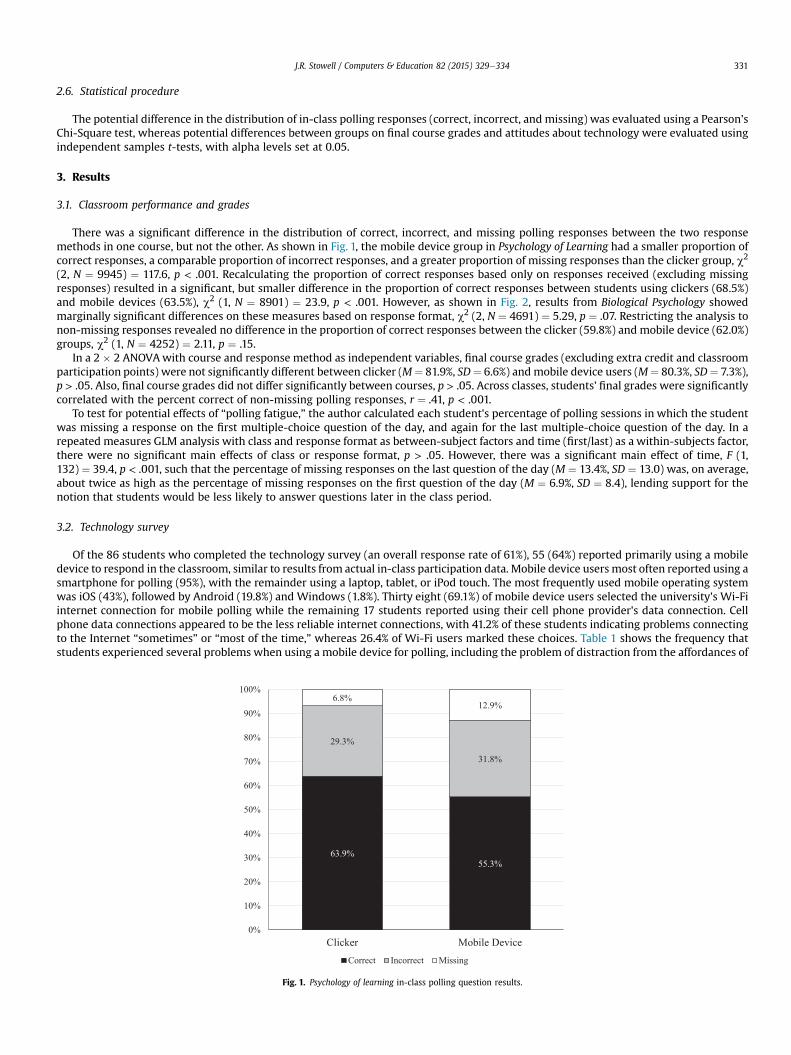
There was a significant difference in the distribution of correct, incorrect, and missing polling responses between the two responsemethods in one course, but not the other. As shown in Fig. 1, the mobile device group in Psychology of Learning had a smaller proportion ofcorrect responses, a comparable proportion of incorrect responses, and a greater proportion of missing responses than the clicker group, c2
(2, N ¼ 9945) ¼ 117.6, p < .001. Recalculating the proportion of correct responses based only on responses received (excluding missingresponses) resulted in a significant, but smaller difference in the proportion of correct responses between students using clickers (68.5%)and mobile devices (63.5%), c2 (1, N ¼ 8901) ¼ 23.9, p < .001. However, as shown in Fig. 2, results from Biological Psychology showedmarginally significant differences on these measures based on response format, c2 (2, N ¼ 4691) ¼ 5.29, p ¼ .07. Restricting the analysis tonon-missing responses revealed no difference in the proportion of correct responses between the clicker (59.8%) and mobile device (62.0%)groups, c2 (1, N ¼ 4252) ¼ 2.11, p ¼ .15.
In a 2 � 2 ANOVAwith course and response method as independent variables, final course grades (excluding extra credit and classroomparticipation points) were not significantly different between clicker (M¼ 81.9%, SD¼ 6.6%) andmobile device users (M¼ 80.3%, SD¼ 7.3%),p > .05. Also, final course grades did not differ significantly between courses, p > .05. Across classes, students' final grades were significantlycorrelated with the percent correct of non-missing polling responses, r ¼ .41, p < .001.
To test for potential effects of “polling fatigue,” the author calculated each student's percentage of polling sessions in which the studentwas missing a response on the first multiple-choice question of the day, and again for the last multiple-choice question of the day. In arepeated measures GLM analysis with class and response format as between-subject factors and time (first/last) as a within-subjects factor,there were no significant main effects of class or response format, p > .05. However, there was a significant main effect of time, F (1,132) ¼ 39.4, p < .001, such that the percentage of missing responses on the last question of the day (M ¼ 13.4%, SD ¼ 13.0) was, on average,about twice as high as the percentage of missing responses on the first question of the day (M ¼ 6.9%, SD ¼ 8.4), lending support for thenotion that students would be less likely to answer questions later in the class period.
3.2. Technology survey
Of the 86 students who completed the technology survey (an overall response rate of 61%), 55 (64%) reported primarily using a mobiledevice to respond in the classroom, similar to results from actual in-class participation data. Mobile device users most often reported using asmartphone for polling (95%), with the remainder using a laptop, tablet, or iPod touch. The most frequently used mobile operating systemwas iOS (43%), followed by Android (19.8%) and Windows (1.8%). Thirty eight (69.1%) of mobile device users selected the university's Wi-Fiinternet connection for mobile polling while the remaining 17 students reported using their cell phone provider's data connection. Cellphone data connections appeared to be the less reliable internet connections, with 41.2% of these students indicating problems connectingto the Internet “sometimes” or “most of the time,” whereas 26.4% of Wi-Fi users marked these choices. Table 1 shows the frequency thatstudents experienced several problems when using a mobile device for polling, including the problem of distraction from the affordances of
Fig. 1. Psychology of learning in-class polling question results.
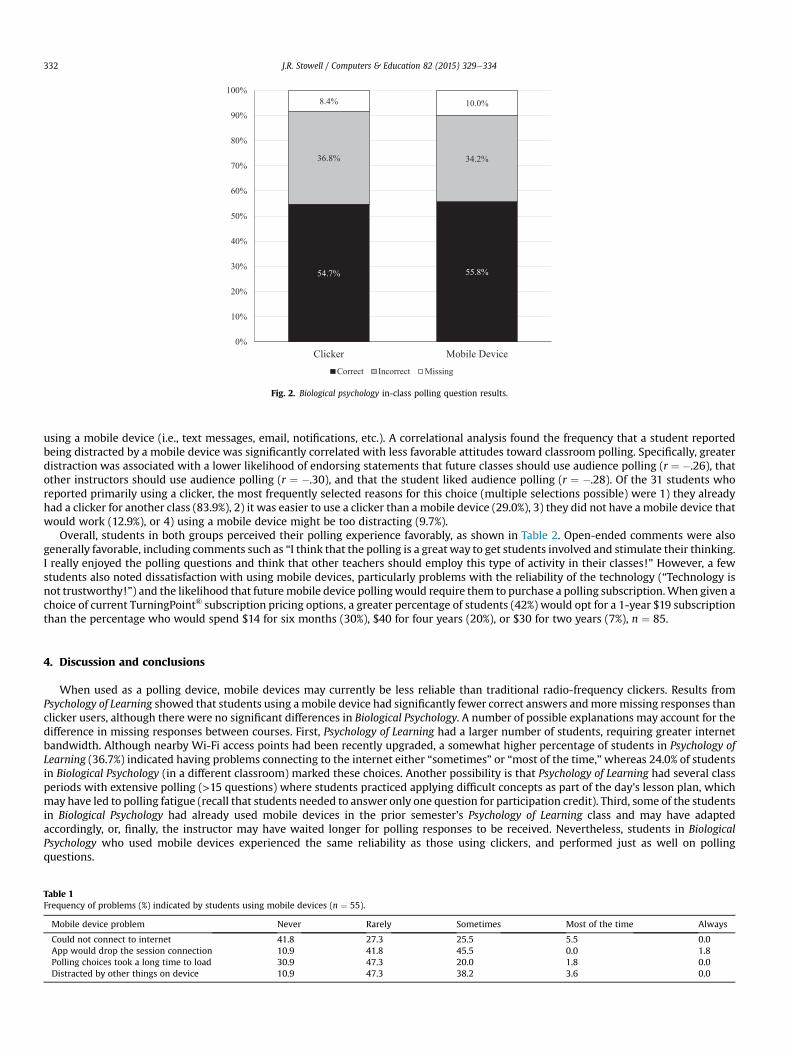
Fig. 2. Biological psychology in-class polling question results.
J.R. Stowell / Computers & Education 82 (2015) 329e334332
using a mobile device (i.e., text messages, email, notifications, etc.). A correlational analysis found the frequency that a student reportedbeing distracted by a mobile device was significantly correlated with less favorable attitudes toward classroom polling. Specifically, greaterdistraction was associated with a lower likelihood of endorsing statements that future classes should use audience polling (r ¼ �.26), thatother instructors should use audience polling (r ¼ �.30), and that the student liked audience polling (r ¼ �.28). Of the 31 students whoreported primarily using a clicker, the most frequently selected reasons for this choice (multiple selections possible) were 1) they alreadyhad a clicker for another class (83.9%), 2) it was easier to use a clicker than a mobile device (29.0%), 3) they did not have a mobile device thatwould work (12.9%), or 4) using a mobile device might be too distracting (9.7%).
Overall, students in both groups perceived their polling experience favorably, as shown in Table 2. Open-ended comments were alsogenerally favorable, including comments such as “I think that the polling is a great way to get students involved and stimulate their thinking.I really enjoyed the polling questions and think that other teachers should employ this type of activity in their classes!” However, a fewstudents also noted dissatisfaction with using mobile devices, particularly problems with the reliability of the technology (“Technology isnot trustworthy!”) and the likelihood that futuremobile device pollingwould require them to purchase a polling subscription.When given achoice of current TurningPoint® subscription pricing options, a greater percentage of students (42%) would opt for a 1-year $19 subscriptionthan the percentage who would spend $14 for six months (30%), $40 for four years (20%), or $30 for two years (7%), n ¼ 85.
4. Discussion and conclusions
When used as a polling device, mobile devices may currently be less reliable than traditional radio-frequency clickers. Results fromPsychology of Learning showed that students using amobile device had significantly fewer correct answers andmoremissing responses thanclicker users, although there were no significant differences in Biological Psychology. A number of possible explanations may account for thedifference in missing responses between courses. First, Psychology of Learning had a larger number of students, requiring greater internetbandwidth. Although nearby Wi-Fi access points had been recently upgraded, a somewhat higher percentage of students in Psychology ofLearning (36.7%) indicated having problems connecting to the internet either “sometimes” or “most of the time,”whereas 24.0% of studentsin Biological Psychology (in a different classroom) marked these choices. Another possibility is that Psychology of Learning had several classperiods with extensive polling (>15 questions) where students practiced applying difficult concepts as part of the day's lesson plan, whichmay have led to polling fatigue (recall that students needed to answer only one question for participation credit). Third, some of the studentsin Biological Psychology had already used mobile devices in the prior semester's Psychology of Learning class and may have adaptedaccordingly, or, finally, the instructor may have waited longer for polling responses to be received. Nevertheless, students in BiologicalPsychology who used mobile devices experienced the same reliability as those using clickers, and performed just as well on pollingquestions.
Table 1Frequency of problems (%) indicated by students using mobile devices (n ¼ 55).
Mobile device problem Never Rarely Sometimes Most of the time Always
Could not connect to internet 41.8 27.3 25.5 5.5 0.0App would drop the session connection 10.9 41.8 45.5 0.0 1.8Polling choices took a long time to load 30.9 47.3 20.0 1.8 0.0Distracted by other things on device 10.9 47.3 38.2 3.6 0.0
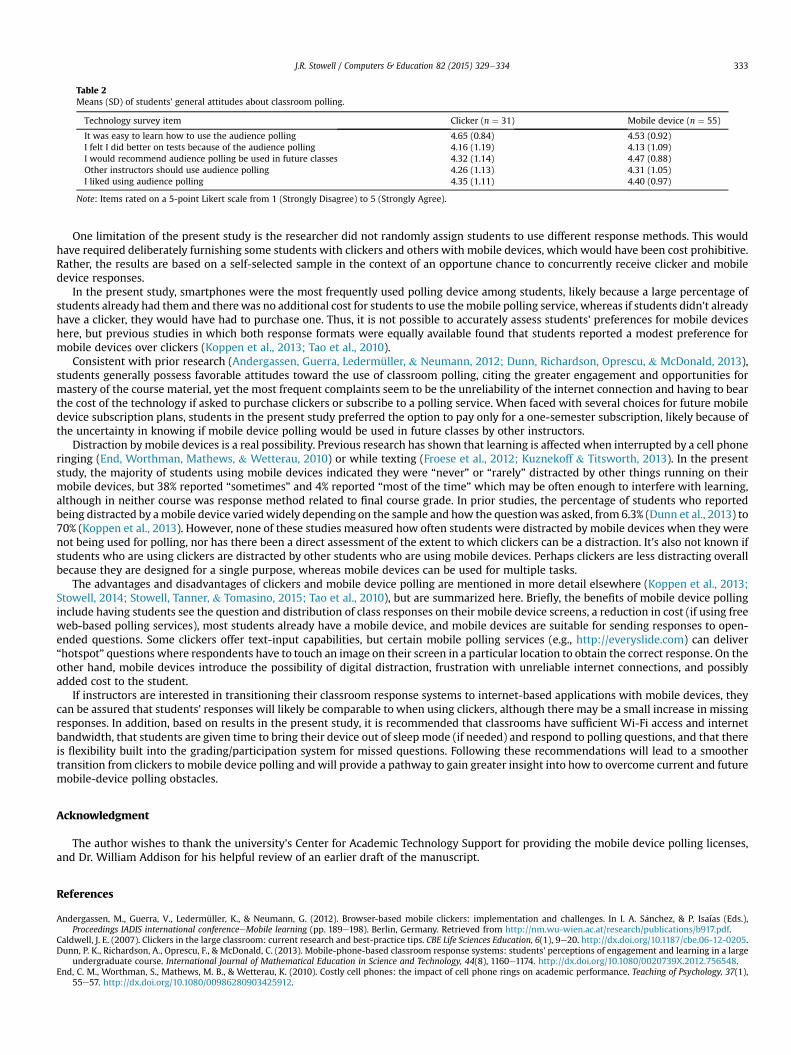
Table 2Means (SD) of students' general attitudes about classroom polling.
Technology survey item Clicker (n ¼ 31) Mobile device (n ¼ 55)
It was easy to learn how to use the audience polling 4.65 (0.84) 4.53 (0.92)I felt I did better on tests because of the audience polling 4.16 (1.19) 4.13 (1.09)I would recommend audience polling be used in future classes 4.32 (1.14) 4.47 (0.88)Other instructors should use audience polling 4.26 (1.13) 4.31 (1.05)I liked using audience polling 4.35 (1.11) 4.40 (0.97)
Note: Items rated on a 5-point Likert scale from 1 (Strongly Disagree) to 5 (Strongly Agree).
J.R. Stowell / Computers & Education 82 (2015) 329e334 333
One limitation of the present study is the researcher did not randomly assign students to use different response methods. This wouldhave required deliberately furnishing some students with clickers and others with mobile devices, which would have been cost prohibitive.Rather, the results are based on a self-selected sample in the context of an opportune chance to concurrently receive clicker and mobiledevice responses.
In the present study, smartphones were the most frequently used polling device among students, likely because a large percentage ofstudents already had them and therewas no additional cost for students to use themobile polling service, whereas if students didn't alreadyhave a clicker, they would have had to purchase one. Thus, it is not possible to accurately assess students' preferences for mobile deviceshere, but previous studies in which both response formats were equally available found that students reported a modest preference formobile devices over clickers (Koppen et al., 2013; Tao et al., 2010).
Consistent with prior research (Andergassen, Guerra, Ledermüller, & Neumann, 2012; Dunn, Richardson, Oprescu, & McDonald, 2013),students generally possess favorable attitudes toward the use of classroom polling, citing the greater engagement and opportunities formastery of the course material, yet the most frequent complaints seem to be the unreliability of the internet connection and having to bearthe cost of the technology if asked to purchase clickers or subscribe to a polling service. When faced with several choices for future mobiledevice subscription plans, students in the present study preferred the option to pay only for a one-semester subscription, likely because ofthe uncertainty in knowing if mobile device polling would be used in future classes by other instructors.
Distraction bymobile devices is a real possibility. Previous research has shown that learning is affected when interrupted by a cell phoneringing (End, Worthman, Mathews, & Wetterau, 2010) or while texting (Froese et al., 2012; Kuznekoff & Titsworth, 2013). In the presentstudy, the majority of students using mobile devices indicated they were “never” or “rarely” distracted by other things running on theirmobile devices, but 38% reported “sometimes” and 4% reported “most of the time” which may be often enough to interfere with learning,although in neither course was response method related to final course grade. In prior studies, the percentage of students who reportedbeing distracted by amobile device variedwidely depending on the sample and how the questionwas asked, from 6.3% (Dunn et al., 2013) to70% (Koppen et al., 2013). However, none of these studies measured how often students were distracted by mobile devices when they werenot being used for polling, nor has there been a direct assessment of the extent to which clickers can be a distraction. It's also not known ifstudents who are using clickers are distracted by other students who are using mobile devices. Perhaps clickers are less distracting overallbecause they are designed for a single purpose, whereas mobile devices can be used for multiple tasks.
The advantages and disadvantages of clickers and mobile device polling are mentioned in more detail elsewhere (Koppen et al., 2013;Stowell, 2014; Stowell, Tanner, & Tomasino, 2015; Tao et al., 2010), but are summarized here. Briefly, the benefits of mobile device pollinginclude having students see the question and distribution of class responses on their mobile device screens, a reduction in cost (if using freeweb-based polling services), most students already have a mobile device, and mobile devices are suitable for sending responses to open-ended questions. Some clickers offer text-input capabilities, but certain mobile polling services (e.g., http://everyslide.com) can deliver“hotspot” questions where respondents have to touch an image on their screen in a particular location to obtain the correct response. On theother hand, mobile devices introduce the possibility of digital distraction, frustration with unreliable internet connections, and possiblyadded cost to the student.
If instructors are interested in transitioning their classroom response systems to internet-based applications with mobile devices, theycan be assured that students' responses will likely be comparable to when using clickers, although there may be a small increase in missingresponses. In addition, based on results in the present study, it is recommended that classrooms have sufficient Wi-Fi access and internetbandwidth, that students are given time to bring their device out of sleep mode (if needed) and respond to polling questions, and that thereis flexibility built into the grading/participation system for missed questions. Following these recommendations will lead to a smoothertransition from clickers tomobile device polling and will provide a pathway to gain greater insight into how to overcome current and futuremobile-device polling obstacles.
Acknowledgment
The author wishes to thank the university's Center for Academic Technology Support for providing the mobile device polling licenses,and Dr. William Addison for his helpful review of an earlier draft of the manuscript.
References
Andergassen, M., Guerra, V., Ledermüller, K., & Neumann, G. (2012). Browser-based mobile clickers: implementation and challenges. In I. A. S�anchez, & P. Isaías (Eds.),Proceedings IADIS international conferenceeMobile learning (pp. 189e198). Berlin, Germany. Retrieved from http://nm.wu-wien.ac.at/research/publications/b917.pdf.
Caldwell, J. E. (2007). Clickers in the large classroom: current research and best-practice tips. CBE Life Sciences Education, 6(1), 9e20. http://dx.doi.org/10.1187/cbe.06-12-0205.Dunn, P. K., Richardson, A., Oprescu, F., & McDonald, C. (2013). Mobile-phone-based classroom response systems: students' perceptions of engagement and learning in a large
undergraduate course. International Journal of Mathematical Education in Science and Technology, 44(8), 1160e1174. http://dx.doi.org/10.1080/0020739X.2012.756548.End, C. M., Worthman, S., Mathews, M. B., & Wetterau, K. (2010). Costly cell phones: the impact of cell phone rings on academic performance. Teaching of Psychology, 37(1),
55e57. http://dx.doi.org/10.1080/00986280903425912.
J.R. Stowell / Computers & Education 82 (2015) 329e334334
Froese, A., Carpenter, C., Inman, D., Schooley, J., Barnes, R., Brecht, P., et al. (2012). Effects of classroom cell phone use on expected and actual learning. College Student Journal,46(2), 323e333.
Gordon, T., & Becker, H. (1973, October 16). Voting machine. United States. Retrieved from http://www.google.com/patents/US3766541.Johnson, L., Adams Becker, S., Cummins, M., Estrada, V., Freeman, A., & Ludgate, H. (2013). NMC horizon report: 2013 higher education edition. Austin, Texas. Retrieved from
http://www.nmc.org/pdf/2013-horizon-report-HE.pdf.Judson, E., & Sawada, D. (2002). Learning from past and present: electronic response systems in college lecture halls. Journal of Computers in Mathematics and Science Teaching,
21(2), 167e181. Retrieved from http://www.thefreelibrary.com/_/print/PrintArticle.aspx?id¼91487242.Koppen, E., Langie, G., & Bergervoet, B. (2013). Replacement of a clicker system by a mobile device audience response system. In Proceeding of the 41st SEFI Conference. Leuven,
Belgium. Retrieved from http://www.kuleuven.be/communicatie/congresbureau/congres/sefi2013/eproceedings/28.pdf.Kuznekoff, J. H., & Titsworth, S. (2013). The impact of mobile phone usage on student learning. Communication Education, 62(3), 233e252. http://dx.doi.org/10.1080/
03634523.2013.767917.Lam, S., Wong, K., Mohan, J., Xu, D., & Lam, P. (2011). Classroom communication on mobile phonesefirst experiences with web-based “clicker”system. In ASCILITE-Australian
Society for Computers in Learning in Tertiary Education Annual Conference (pp. 763e777). Retrieved from http://www.leishman-associates.com.au/ascilite2011/downloads/papers/Lam-full.pdf.
Reay, N. W., Li, P., & Bao, L. (2008). Testing a new voting machine question methodology. American Journal of Physics, 76(2), 171e178. http://dx.doi.org/10.1119/1.2820392.Smith, A. (2013). Smartphone ownership d2013 update. Retrieved from http://pewinternet.org/~/media//Files/Reports/2013/PIP_Smartphone_adoption_2013_PDF.pdf.Smith, M. K., Wood, W. B., Adams, W. K., Wieman, C., Knight, J. K., Guild, N., et al. (2009). Why peer discussion improves student performance on in-class concept questions.
Science, 323(5910), 122e124. http://dx.doi.org/10.1126/science.1165919.Stowell, J. R., & Nelson, J. M. (2007). Benefits of electronic audience response systems on student participation, learning, and emotion. Teaching of Psychology, 34(4), 253e258.
http://dx.doi.org/10.1080/00986280701700391.Stowell, J. R. (2014). Using technology effectively in the psychology classroom. In D. S. Dunn (Ed.), The Oxford Handbook of Undergraduate Psychology Education. New York:
Oxford University Press. http://dx.doi.org/10.1093/oxfordhb/9780199933815.013.021.Stowell, J. R., Oldham, T., & Bennett, D. (2010). Using student response systems (“clickers”) to combat conformity and shyness. Teaching of Psychology, 37(2), 135e140. http://
dx.doi.org/10.1080/00986281003626631.Stowell, J. R., Tanner, J., & Tomasino, E. (2015). Harnessing mobile technology for student assessment. In Z. Yan (Ed.), Encyclopedia of Mobile Phone Behavior. Hershey, PA: IGI
Global.Sun, J. C. Y. (2014). Influence of polling technologies on student engagement: an analysis of student motivation, academic performance, and brainwave data. Computers &
Education, 72, 80e89. http://dx.doi.org/10.1016/j.compedu.2013.10.010.Tao, J., Clark, J., Gwyn, G., & Lim, D. (2010). Hand-held clickers vs. virtual clickers: what do our students think? Journal of Interactive Instruction Development, 21(4), 17e23.
Retrieved from http://www.sealund.com/JIID_Vol21_No4.pdf.