Embed Size (px)
Citation preview

Use of biomass fuels in the brick-makingindustries of Sudan: Implications for deforestation
and greenhouse gas emission
Syed Ashraful Alam
Thesis submitted for an M. Sc. Degree in Forest Ecology/Tropical Silviculture
Department of Forest EcologyViikki Tropical Resources Institute (VITRI)
University of HelsinkiFinland
Helsinki, April 2006

2
HELSINGIN YLIOPISTO – HELSINGFORS UNIVERSITET – UNIVERSITY OF HELSINKI
Tiedekunta - Fakultet - Faculty
Faculty of Agriculture and Forestry
Laitos - Institution - Department
Forest Ecology/Viikki Tropical Resources Institute (VITRI)Tekijä - Författare - Author
Alam, Syed AshrafulTyön nimi - Arbetets title – Title
Use of biomass fuels in the brick-making industries of Sudan: Implications for deforestation andgreenhouse gas emissionOppiaine - Läroämne - Subject
Tropical SilvicultureTyön laji - Arbetets art - Level
M. Sc. thesis
Aika - Datum - Month and year
April 2006
Sivumäärä - Sidoantal - Number of pages
87Tiivistelmä - Referat – Abstract
The study focuses on the potential roles of the brick making industries in Sudan in deforestation andgreenhouse gas emission due to the consumption of biofuels. The results were based on the observation of25 brick making industries from three administrative regions in Sudan namely, Khartoum, Kassala andGezira. The methodological approach followed the procedures outlined by the Intergovernmental Panelon Climate Change (IPCC). For predicting a serious deforestation scenario, it was also assumed that all ofwood use for this particular purpose is from unsustainable sources.
The study revealed that the total annual quantity of fuelwood consumed by the surveyed brick makingindustries (25) was 2,381 t dm. Accordingly, the observed total potential deforested wood was 10,624 m3,in which the total deforested round wood was 3,664 m3 and deforested branches was 6,961 m3. The studyobserved that a total of 2,990 t biomass fuels (fuelwood and dung cake) consumed annually by thesurveyed brick making industries for brick burning. Consequently, estimated total annual emissions ofgreenhouse gases were 4,832 t CO2, 21 t CH4, 184 t CO, 0.15 t N20, 5 t NOX and 3.5 t NO while the totalcarbon released in the atmosphere was 1,318 t. Altogether, the total annual greenhouse gases emissionsfrom biomass fuels burning was 5,046 t; of which 4,104 t from fuelwood and 943 t from dung cakeburning.
According to the results, due to the consumption of fuelwood in the brick making industries (3,450 units)of Sudan, the amount of wood lost from the total growing stock of wood in forests and trees in Sudanannually would be 1,466,000 m3 encompassing 505,000 m3 round wood and 961,000 m3 branchesannually. By considering all categories of biofuels (fuelwood and dung cake), it was estimated that, thetotal emissions from all the brick making industries of Sudan would be 663,000 t CO2, 2,900 t CH4,25,300 t CO, 20 t N2O, 720 t NOX and 470 t NO per annum, while the total carbon released in theatmosphere would be 181,000 t annually.
Avainsanat – Nyckelord - Keywords
Biofuels, Brick-making industry, Deforestation, Dung cake, Fired clay bricks, Fuelwood, Greenhouse gasemission.Säilytyspaikka - Förvaringsställe - Where deposited
Viikki Science LibraryMuita tietoja - Övriga uppgifter - Additional information

3
PREFACE
This study was carried out during the summer of 2005 in four administrative States of the
Sudan within the framework of the CIMO (Centre for International Mobility) North-
South Higher Education Programme and in connection with ongoing research project
(TALDA-Trees, agroforestry and land use in dryland Africa), supported by the Academy
of Finland and implemented jointly by the Viikki Tropical Resources Institute (VITRI) of
the University of Helsinki, the University of Khartoum and the Forestry Research Centre,
Sudan, respectively. It was also supported by the Master’s Thesis Travel Grant of the
University of Helsinki.
I would like to express my heartfelt gratitude and sincerest appreciation to my supervisor
Dr. Olavi Luukkanen, Professor and Director of VITRI, University of Helsinki. His
meticulous supervision, continuous guidance, intimate co-operation, encouragement and
comments on the draft were significantly crucial for successful completion of my Thesis.
I am also deeply indebted to Dr. Omer Said Musa, Associate Professor of the Faculty of
Forestry, University of Khartoum, for co-supervising the fieldwork in Sudan. Without his
guidance and advice many of the interviewees could not have been done.
I gratefully acknowledge the generous logistical and/or administrative support provided
by Dr. Vesa Kaarakka, University Lecturer of the Department of Forest Ecology/VITRI,
University of Helsinki; Dr. Abdelazim Yassin Abdelgader, Dean, Faculty of Forestry,
University of Khartoum and Dr. Abdalla Gaafar Mohamed, Chief, Technical Sector,
Forests National Corporation (FNC), Sudan. I am also grateful to Dr. Edinam K. Glover,
Senior Researcher of VITRI, who in the first place encouraged me to go to Sudan and
helped me for writing research proposal, which I will never regret.
Grateful acknowledgement is made for the support of Dr. Mohamed Elfadl, Dr. Essam
Warrag, Dr. Elnour Adallah Elsiddig and Elamin Raddad with whom I have had many
fruitful discussions to accomplish the present study.
During field work in the Sudan, I got unlimited assistance from FNC staffs namely,
Anwar Abdel Hamid, Isam Abdel Kareem, Burae Balla, Mohamed Gasmalla Ahmed and
Fathi Ismail Omer. Thank you very much, for your kind assistance. Very special and
sincere thanks go to Rahma A. Rahman Ahmed, Forestry Manager, Kenana Sugar

4
Company; Dr. Mohammed Hussain Hamid, Director of Brick Plant Unit, University of
Khartoum and Dr. Balgis Osman Elasha, Principal Investigator of Higher Council for
Environment and Natural Resources (HCENR) for their valuable information to write-up
my Thesis.
I am grateful in all ways to the Field Assistants specifically Abdel Naser Ibrahim and
Anwar Sid Ahmed for their help as interpreter and data collector. Special thanks also go
to all the brick making entrepreneurs who provided me the interviewees and allowed me
to snap their brick making activities.
I would also want to thank all the people in VITRI, explicitly Dr. Eshetu Yirdaw, Dr.
Mark Appiah, Minna Hares, Anu Eskonheimo, Jörn Laxén, Sakina Elshibe, Ping Zhou,
Kurt Walter and Ermo Palm.
Finally, I would like to express my deepest cordial thanks to my family especially to my
mother and father for their unlimited spiritual moral support. And of course, last, but not
least, to one of the most important persons of my stay in Sudan, I would like to say thanks
to Fobissie.
Helsinki, April 2006
Syed Ashraful Alam

5
LIST OF SYMBOLS, ACRONYMS AND ABBREVIATIONS
AAS Australian Academy of ScienceALGAS Asia Least-cost Greenhouse Gas Abatement StrategyBENS Biomass Energy Network of SudanBMI Brick making IndustryBRRI Building and Road Research Institute, SudanCDIAC Carbon Dioxide Information Analysis CenterCEERD-AIT Centre for Energy-Environment Research and Development at Asian
InstituteCRATerre International Centre for Earth Construction, Francedm Dry matterEBRD European Bank for Reconstruction and DevelopmentECE United Nations Economic Commission for EuropeEIA Energy Information AdministrationEPA US Environmental Protection AgencyFAO Food and Agriculture Organization of the United NationsFEF Forest Energy ForumFNC Forests National CorporationGg Giga grams [1 Gg = 109 grams = 1,000 t (MT, metric tons)]GHG Greenhouse GasGWP Global Warming Potentialha HectareHCENR Higher Council for Environment and Natural ResourcesIEA International Energy AgencyIPCC Intergovernmental Panel on Climate ChangeITDG Intermediate Technology Development GroupLCFRD Library of Congress - Federal Research Divisionm3 Cubic MeterMEM Ministry of Energy & MiningMEPD Ministry of Environment & Physical DevelopmentMTOE Metric Tonne Oil EquivalentNET National Environmental TrustNOAA US National Oceanic and Atmospheric AdministrationOECD Organization for Economic Co-operation and DevelopmentRWEDP Regional Wood Energy Development Programme in AsiaSD Standard DeviationSEHD Society for Environment and Human Developmentt TonTOE Ton Oil EquivalentUN United NationsUNCCD United Nations Convention to Combat DesertificationUNCED United Nations Conference on Environment and DevelopmentUNEP United Nations Environmental ProgrammeUNFCCC United Nations Framework Convention on Climate ChangeWB The World BankWEC Wood Energy CouncilWMO World Meteorological Organization

6
CONTENTS
1 INTRODUCTION ....................................................................................................... 82 LITERATURE REVIEW AND THEORETICAL FRAMEWORK ........................... 12
2.1 Brick making industries in the Sudan .......................................................................... 122.1.1 General considerations ...........................................................................................................122.1.2 Distribution of brick making industries in the Northern Sudan ................................................132.1.3 Raw materials of traditional fired clay bricks production.........................................................142.1.4 Fired clay bricks production unit and their manufacturing process...........................................142.1.5 Potentials of brick making industries as a source of greenhouse gases .....................................162.1.6 Brick making industries-agent of deforestation in the Sudan ...................................................162.1.7 Instant impact of brick making industries’ emissions on human body, agriculture and forestry 172.1.8 Environmental impacts of brick making industries in the Sudan ..............................................19
2.2 Deforestation and forest cover change.......................................................................... 202.2.1 Global view of deforestation and forest cover change .............................................................202.2.2 Current state of forest resources and forest cover change in the Sudan.....................................20
2.3 Woodfuel production and consumption ....................................................................... 212.3.1 Worldwide distribution of woodfuels production and consumption .........................................212.3.2 Woodfuel as energy source in the Sudan.................................................................................22
2.4 Energy sector in Sudan ................................................................................................. 232.4.1 Energy policies and strategies.................................................................................................232.4.2 Energy resources....................................................................................................................232.4.3 Energy balance ......................................................................................................................24
2.5 General information about emission of greenhouse gases, their sinks and sources,regional status of emission and international initiatives to reduce global rate of emission............................................................................................................................................. 25
2.5.1 Greenhouse gases and greenhouse effect.................................................................................252.5.2 Sources and sinks of greenhouse gases ...................................................................................272.5.3 Regional status of greenhouse gas (CO2) emission in a global perspective...............................312.5.4 Greenhouse gas emission in the Sudan....................................................................................322.5.5 Emissions from biomass fuel burning .....................................................................................332.5.6 International initiative on the reduction of the emissions of greenhouse gases..........................33
2.6 Global warming and its impact on climate change....................................................... 342.6.1 Global warming and global warming potential........................................................................342.6.2 Climate change ......................................................................................................................342.6.3 Worldwide impact of global warming.....................................................................................352.6.4 African climate trends and projections....................................................................................362.6.5 Vulnerability to global climate change in Africa .....................................................................382.6.6 Vulnerability to climate change in the Sudan ..........................................................................40
3 MATERIAL AND METHODS OF FIELD SURVEY ............................................... 423.1 Study area...................................................................................................................... 42
3.1.1 Location ................................................................................................................................423.1.2 Climatic condition..................................................................................................................423.1.3 Demography ..........................................................................................................................433.1.4 Land use pattern.....................................................................................................................453.1.5 Vegetation .............................................................................................................................453.1.6 Infrastructural development....................................................................................................463.1.7 Energy use .............................................................................................................................46
3.2 Sampling method........................................................................................................... 47
3.3 Data collection ............................................................................................................... 47
3.4 Data processing ............................................................................................................. 48
7
3.4.1 Estimation of deforestation.....................................................................................................483.4.2 Estimation of greenhouse gas emission from biomass fuel (fuelwood and dung cake) burning inthe brick making industries of Sudan...............................................................................................48
4 RESULTS.................................................................................................................. 504.1 Potential deforestation caused by the brick making industries in the study areas ofSudan................................................................................................................................... 50
4.2 Emission of greenhouse gases from the brick making industries in the study areas ofSudan due to the consumption of fuelwood........................................................................ 50
4.3 Emission of greenhouse gases from the brick making industries of Khartoum State inthe Sudan due to the consumption of dung cake ................................................................ 53
4.4 Emission of greenhouse gases from the surveyed brick making industries in the Sudandue to the consumption of biomass fuels ............................................................................ 53
4.5 Prediction of maximum potential deforestation caused by the brick making industriesin the Sudan......................................................................................................................... 53
4.6 Prediction of annual greenhouse gas emission from the brick making Industries in theSudan due to the consumption of biomass fuels ................................................................. 56
4.7 Employment in the brick making industries of Sudan................................................. 56
4.8 Potentials of fuelwood plantation in the Sudan ............................................................ 584.8.1 Irrigated plantation by Kenana Sugar Company Ltd................................................................584.8.2 Irrigated plantation by Forests National Corporation (FNC) at Kassala State ...........................614.8.3 Sunt (A. nilotica) reserve forest managed by FNC at Talbab, El Hassahisa, Gezira State..........64
5 DISCUSSION............................................................................................................ 665.1 Consumption of biomass fuels in the brick making industries of Sudan and theirimplication for deforestation............................................................................................... 66
5.2 Brick making industries in the Sudan-means of greenhouse gas emission .................. 68
5.3 Prospects of the use of bagasse processed fuel blocks in the brick making industries ofSudan................................................................................................................................... 69
5.4 Meeting of fuelwood demand for brick making industries in the Sudan by sustainablefuelwood plantations ........................................................................................................... 70
5.4.1 Energy plantations...................................................................................................... 71
5.5 Impacts of global climate change in the Sudan ............................................................ 725.5.1 General aspects ......................................................................................................................725.5.2 Impacts of global climate change on temperature....................................................................735.5.3 Impacts of global climate change on precipitation...................................................................735.5.4 Impacts of global climate change on Sorghum and millet yield ...............................................74
5.6 Limitation and uncertainty of the study ....................................................................... 74
6 CONCLUSIONS AND RECOMMENDATIONS ...................................................... 76
REFERENCES ............................................................................................................ 78APPENDICES.............................................................................................................. 84

8
1 INTRODUCTION
From earliest times, biomass1 has provided food, fuel, feed, feedstock, fibre, and fertilizer
(the so-called “6Fs”) to humankind. At present, biomass is the world’s fourth largest
energy source, providing about 13% of the world’s energy consumption. In developing
countries it is the most important source of energy, reaching 33% of the total energy use.
Its share in industrialized countries averages only 3% of their total energy consumption.
Nearly 2 billion people in developing countries depend on traditional fuels (wood, dung,
and crop residues) (Hall et al., 1999; WMO, 2001). IPCC, Shell, IEA, and the UNCED
predicted that after the year 2020, biomass and some other renewable energies will play a
significant and increasing role in the world’s future energy mix (Hall, 1998).
There is an important contribution of biomass fuels in the total primary energy supply of
developing countries. Most of the biomass fuels used come from forests, mainly wood
and charcoal. In 1995, a total of 3,350 million m3 of wood harvested world wide, of
which 63% used for energy production (FAO/FEF, 2000). Of the total world wood-fuel
consumption, Asian countries have the highest share, with 43.6%; followed by Africa,
with 21.1%; Canada and the United States, 11.8%; Latin America, 11.7%; and Europe,
with 8.5% (Fig. 1). In some countries, the share of agriculture residues and animal dung is
also significant. FAO has estimated that about 800 million people in the world rely on
crop residues and animal dung for energy, especially in certain parts of the developing
world where fuelwood is scarce (Hall et al., 1992; Thomas et al., 1997). Crop residues
used for energy vary from place to place. The most important ones are sugarcane
bagasse2, rice husks, and corncobs. Animal dung largely contributes as an energy source
for cooking in rural households of some Asian countries like Bangladesh, India, Pakistan,
Bhutan, Nepal, and Vietnam, and also in Peru. After being collected, dung is usually
compacted and dried in the sun before being used as a mixture with wood (Bala and
Hossain, 1992; Lefevre et al., 1997)
1 Biomass: All kinds of material coming directly or indirectly from contemporary photosynthesis reactions,such as all vegetal matter and derivatives; woodfuel, charcoal, paper, dung, and a large portion of urbanrefuse (FAO as cited in WMO, 2001).
2 Bagasse is the fibrous residue of cane stalks resulting from crushing and extraction of the juice (BENS,1996).

9
Asia43 %
Africa21 %
DevelopedOceania
1 %
Canada andUSA12 %
Former USSR2 %
Europe9 %
Latin America12 %
DevelopingOceania
0 %
Figure 1. Distribution of wood energy consumption by regions, 1995. (Adapted fromWEC/FAO, 1999)
Sudan, the largest country in Africa, encompasses an area of about 2.51 million km2. The
Sudan lies within the tropical zone between latitudes 30 and 200 North and longitudes 220
and 380 East. The total annual production of fired clay bricks in the Sudan is estimated to
be about 2.8 billion. This is mainly produced by traditional methods where biomass fuels3
(fuelwood and dung cake) are used for brick burning. Modern brick production where
fuel oil is used covers less than 2% of the total annual brick production. Therefore,
biomass fuels, especially fuelwood, are the main fuels used in clay brick firing. The total
annual consumption of wood in the brick making industries of the Northern States of
Sudan is found to be about 550,000 stacked m3 (Hamid, 1994; BENS, 1996).
Consumption of biomass fuels (fuelwood, crop residues, dried animal waste etc.) is often
considered to be neutral with respect to emissions of carbonaceous greenhouse gases,
which means all the CO2 emitted in the burning process is taken up in the following
growing season by replacement crops and trees. However, only when the biomass fuels
are harvested on a sustainable basis (a new tree planted for each tree cut down for
fuelwood) and only when all the carbon in the fuel is converted to CO2 can the process be
considered truly carbon-neutral. Even when the biomass fuels are assumed to be
harvested on a completely sustainable basis (all CO2 emissions reabsorbed in the
following growing season), products of incomplete combustion (CO-carbon monoxide,
3 Biomass fuels include all the organic fuels from biological origin used for energy purposes. It includes allterrestrial and aquatic vegetation, its residues such as fuelwood, twigs, dead leaves, and shell, cultivatedcrops and their residues like cereal straw, seed-husks, bagasse; livestock products, and their residues (e.g.dung) (CEERD-AIT definitions as cited in WMO, 2001)

10
CH4-methane and NMHC-non-methane hydrocarbons) emissions from biomass fuels
combustion account for 4.5% of the total carbon emissions and 23% of CO2 equivalents
on a short-term (20-year) GWP basis. In addition, combustion efficiency is inversely
related to the formation of products of incomplete combustion. In other words, lower
combustion efficiencies lead to higher products of incomplete combustion emissions
(Streets and Waldhoff, 1999).
In the Sudan, most of the brick making kilns (intermittent scove kiln) have low
combustion efficiencies (Hamid, 1994; BENS, 1996). Because of the high rates of
incomplete combustion in the prevailing brick kilns of Sudan and the high GWPs of the
products of incomplete combustion, biomass fuels may comprise even larger share of
energy-related emissions when measured in terms of total GWP. Lefevre et al. (1997),
FAO (1999) and WB (1998) have also considered collection of fuelwood from
unsustainably managed forest is one of the major causes of deforestation and burning of
biomass fuels is responsible for the emissions of both trace and non-trace greenhouse
gases4, such as CO2, CH4, CO, N2O, NOX and NO.
Therefore, the brick making industries in the Sudan act as a serious agent of deforestation
and can be considered important sources of greenhouse gas emission as they use huge
amount of fuelwood, comes from unsustainably managed forest and dung cake for brick
burning with the brick kilns of low combustion efficiency.
MEPD/HCENR (2003), FAO (1999), BENS (1996), FNC (1995) and Hamid (1994) have
documented the overall greenhouse gas emission in the Sudan within the general
framework of estimation of greenhouse gas emission from fuelwood burning in African
countries. Thus, the present study was carried out to explore the present status of biomass
fuels consumption in the brick making industries of Sudan, as well as to assess the related
rate of the emission of greenhouse gases and potential deforestation5 caused by this
sector.
4 Greenhouse gases are those gaseous constituents of the atmosphere, both natural and anthropogenic; thoseabsorb and emit radiation at specific wavelengths within the spectrum of infrared radiation emitted by theearth’s surface, the atmosphere, and clouds. Water vapour (H2O), carbon dioxide (CO2), nitrous oxide(N2O), methane (CH4), and ozone (O3) are the primary greenhouse gases in the earth’s atmosphere (EPA,2005; IPCC, 2005).5 Deforestation is defined as the conversion of forest to another land use or the long-term reduction of thetree canopy cover below the minimum 10% threshold. Changes within the forest class, which negativelyaffect the stand or site, and thereby lower its capacity to supply products and/or services are termed asforest degradation (FAO, 1998a; FAO, 2001). For developed countries, deforestation is defined as change

11
Objectives of the study
The present study was carried out in the Sudan over a period of the three months from
June to August 2005 to achieve the following objectives:
a) To visualize present status of biomass fuel (especially fuelwood and dung cake)
consumption in the brick making industries of Sudan;
b) To estimate annual rate of potential deforestation caused by the surveyed brick
making industries of Sudan due to the consumption of fuelwood;
c) To generate baseline information on how much greenhouse gases may emit in the
atmosphere annually by the surveyed brick making industries of Sudan due to the
burning of biomass fuels (fuelwood and dung cake);
d) To predict the annual maximum potential rate of deforestation caused by the brick
making industries due to consumption of fuelwood in the Sudan;
e) To predict the annual rates of greenhouse gas emissions from brick making
industries due to the consumption of fuelwood and dung cake in the Sudan.
of forest by reducing the tree crown cover to less than 20% and for developing countries - change of forestby reducing tree crown cover to less than 10% (FAO as cited in WMO, 2001).

12
2 LITERATURE REVIEW AND THEORETICAL FRAMEWORK
2.1 Brick making industries in the Sudan
2.1.1 General considerations
Brick making industries in the Sudan are mostly operated along the banks of the rivers
during the dry season, October to July. Fired clay bricks are commonly used in most parts
of Sudan. The total annual production of fired clay bricks in the Sudan is estimated to be
about 2.8 billion. Of which, 88.5% production mainly concentrates on Khartoum and
Central States (Gezira, Sinnar, White Nile and Blue Nile). Production on Blue Nile bank
represents 82.4% and on River Nile bank is about 9.5% (Tab.1). Clay bricks are mainly
produced by traditional methods where biomass fuels (fuelwood and dung cake) are used
for brick burning. Modern brick production covers less than 2% of the total annual brick
production where fuel oil is used. The total annual consumption of wood by the brick
making industries of the Northern Sates of Sudan is found to be about 549,000 stacked m3
equivalent to 183,000 t of fuelwood. Brick making industries of Khartoum and Central
States consume 46.2% and 42.3% respectively, of the total annual consumption of wood
in this sector. The consumption of wood per 1000 bricks varies widely from 0.117 m3 to
1.6 m3. Wood consumption per 1000 bricks in Kassala and Kordofan States is
approximately more than 10 times that consumed in Khartoum and Central States. The
total number of workers employed in this sector is about 35,000; of which 50% employed
in Khartoum and 38% in Central States (Hamid, 1994; BENS, 1996).
Table 1. Brick making industries and their production rate along the river banks of Sudan
LocationNo. ofproduction units
Annual productionof bricks (’000)
Production as % oftotal bricksproduction in Sudan
Blue Nile 1,347 2,281,280 82.5River Nile 170 261,920 9.5River Gash 28 39,200 1.4River Atbara 26 36,600 1.3Total 1,571 2,619,000 94.7
(Adapted from Hamid, 1994; Bilal, 2002)

13
2.1.2 Distribution of brick making industries in the Northern Sudan
Brick production in Sudan concentrates on Central Sudan which includes Khartoum,
Central States and Southern part of Northern State. This area i.e. Central Sudan produces
75% of Northern Sudan’s brick production. Production of fired clay bricks in Eastern
State represents about 6% of brick production in Northern Sudan. Brick production units
scatter along the banks of rivers El Gash in Kassala area and along River Adbara banks at
Khashim El Gibra and El Showak areas. In Western Sudan, fired clay bricks production
mainly concentrates on Kordofan and Darfur States and they produce 7% and 9% of
Northern Sudan’s brick production respectively. Brick production in Darfur State
concentrates on Southern part of State around Niyala and Zalinga areas, whereas in
Kordofan State, it scatters in valleys and Khors6 such as Khor Taggat, Khor Bagarra and
Khor Niwala in El Obeid area and Khor Abu Habil in Rahad, Um Ruwaba and Dilling
areas (Hamid, 1994). FNC (1995) mentioned there are about 1,700 brick making
industries in the Sudan but during the present study, the Brick Making Owners’
Association in Khartoum State provided information7 that there are about 650 brick
factory owners and about 2,000 brick making industries in Khartoum state and the total
number of brick making industries in the Sudan is approximately 3,450. It is also believed
that a sizeable, but unknown number of unregistered smaller units are also scattered in
rural areas meeting the local demand where required. Tab.2 shows the distribution of
brick making industries in Northern Sudan:
Table 2. Distribution of brick making industries in the Northern Sudan
State/Province Number of brickindustries in 2005
Number of brickindustries in 1994
Khartoum 2,000 800Gezira, Central 800Sinnar, Central 110Ed Damazin (Blue Nile), Central 60
654 (Central)
Kordofan 100 58Darfur 50 69Kassala, Eastern 70 60Northern State 260 63Total 3,450 1,704 (Adapted and modified from Hamid, 1994)
6 Khor: Seasonal streams usually bring sediments
7 Information obtained from the association secretary, Mr Ali Ahmed Ibrahim (Appendix 2, Plate 12)

14
2.1.3 Raw materials of traditional fired clay bricks production
Clay is the basic raw material from which bricks are produced. Soil investigation reveals
that the existing brick clays in Sudan as occur in nature are very different and widely vary
in chemical composition and physical properties. To render them apt for brick making,
suitable admixtures should be added and some technical treatment should be carried out.
In prevailing traditional brick making, animal dung (Zibala) is the predominant additive,
which acts as a leaning material and helps in both drying and firing. Sometimes sand is
added besides animal dung, if the clay is of very high plasticity. In Western Sudan,
sometimes groundnut shells are used for reasons of bulk availability at concentration
ponds (oil mills). In Eastern Sudan sometimes, rotted bagasse is used instead of animal
dung for the same above reasons (Hamid, 1994; Bilal, 2002). Tab. 3 shows the chemical
composition of brick making clays in the Sudan.
Table 3. Chemical composition of brick making clays in the Sudan
LocationComponent Blue Nile
(Gerif East)River Nile(Kabashi)
While Nile(Guli)
El Obeid(Khor Taggat)
SiO2 49.09 53.60 57.70 -Al2O3 15.68 15.10 15.30 -Fe2O3 10.07 13.10 7.88 -CaO 6.32 3.40 2.50 1.51MgO 2.52 1.60 1.90 -Na2O 2.10 - 2.90 -K2O 2.53 - 2.50 -SO3 - - 0.13 -TiO2 1.65 - - -Organic matter - - - 0.25
(Adapted form Hamid, 1994)
2.1.4 Fired clay bricks production unit and their manufacturing process
Fired clay bricks production unit
There are wide variety of kiln types and sizes but they can be classified into two major
groups: Intermittent and Continuous kilns. Further, intermittent kilns can be classified as
clamp, scove, scotch and down draught kilns. The prevailing kiln type in the Sudan is the
intermittent scove kiln (Appendix 1, Fig.2). It is a dense setting of bricks containing fuel,
which is ignited at bottom and left to burn gradually until it reaches the other end.
Tunnels are built at the base of the pile or setting. Through these tunnels fuelwood is fed.
The width of a tunnel is 2-3 brick length equivalent to about 55 cm and they are separated
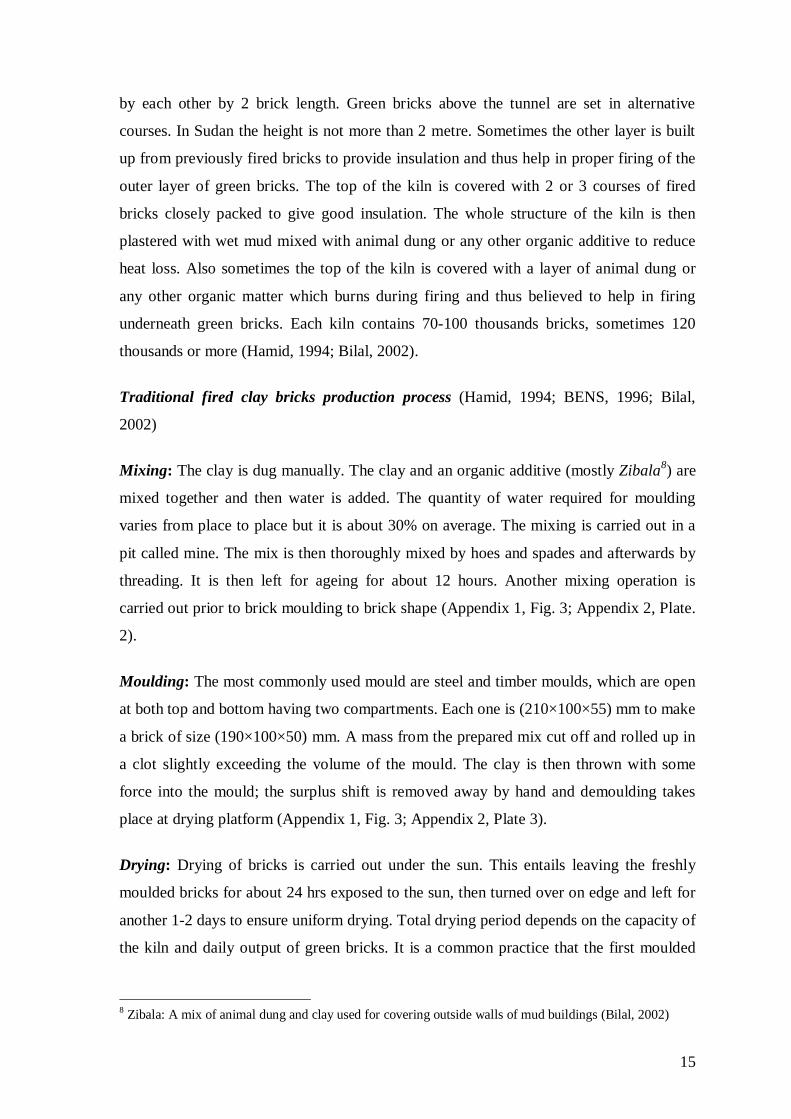
15
by each other by 2 brick length. Green bricks above the tunnel are set in alternative
courses. In Sudan the height is not more than 2 metre. Sometimes the other layer is built
up from previously fired bricks to provide insulation and thus help in proper firing of the
outer layer of green bricks. The top of the kiln is covered with 2 or 3 courses of fired
bricks closely packed to give good insulation. The whole structure of the kiln is then
plastered with wet mud mixed with animal dung or any other organic additive to reduce
heat loss. Also sometimes the top of the kiln is covered with a layer of animal dung or
any other organic matter which burns during firing and thus believed to help in firing
underneath green bricks. Each kiln contains 70-100 thousands bricks, sometimes 120
thousands or more (Hamid, 1994; Bilal, 2002).
Traditional fired clay bricks production process (Hamid, 1994; BENS, 1996; Bilal,
2002)
Mixing: The clay is dug manually. The clay and an organic additive (mostly Zibala8) are
mixed together and then water is added. The quantity of water required for moulding
varies from place to place but it is about 30% on average. The mixing is carried out in a
pit called mine. The mix is then thoroughly mixed by hoes and spades and afterwards by
threading. It is then left for ageing for about 12 hours. Another mixing operation is
carried out prior to brick moulding to brick shape (Appendix 1, Fig. 3; Appendix 2, Plate.
2).
Moulding: The most commonly used mould are steel and timber moulds, which are open
at both top and bottom having two compartments. Each one is (210×100×55) mm to make
a brick of size (190×100×50) mm. A mass from the prepared mix cut off and rolled up in
a clot slightly exceeding the volume of the mould. The clay is then thrown with some
force into the mould; the surplus shift is removed away by hand and demoulding takes
place at drying platform (Appendix 1, Fig. 3; Appendix 2, Plate 3).
Drying: Drying of bricks is carried out under the sun. This entails leaving the freshly
moulded bricks for about 24 hrs exposed to the sun, then turned over on edge and left for
another 1-2 days to ensure uniform drying. Total drying period depends on the capacity of
the kiln and daily output of green bricks. It is a common practice that the first moulded
8 Zibala: A mix of animal dung and clay used for covering outside walls of mud buildings (Bilal, 2002)

16
batch undergoes a drying period of 18-25 days while last moulded batch takes 2-4 days
(Appendix 1, Fig. 3; Appendix 2, plate 4).
Firing: Firing consists of subjecting the green bricks to gradually increasing temperature
up to a maximum of 700-9000C depending on the fusion characteristics of clay. Firing of
green bricks changes their physical and chemical structure. It renders them strong,
durable and suitable for building construction (Appendix 1, Fig. 3; Appendix 2, Plate 6-
7).
Cooling: It is the period of time (usually about 10 days) during which the temperature of
burnt units falls down and becomes safe and convenient to be removed from the kiln
(Appendix 1. Fig. 3; Appendix 2, Plate 8).
2.1.5 Potentials of brick making industries as a source of greenhouse gases
Brickfields as an industrial venture bring easy money, but generally corrode the ecology
and human health. Brickfields, with rapid urbanization are being indiscriminately
developed throughout the country of Sudan. Fuelwood, which can also be a cheap fuel
depending on its source, has been as a source of energy in brick making industry as is
evident from FAO (2000), brick kilns were the highest consumers, consuming about
51.5% of the total industrial wood consumption in Sudan. Biomass burning is responsible
for the emissions of trace and non-trace greenhouse gasses, such as CO2, CH4, CO, N2O,
NOx and NO (WB, 1998). EBRD (2005) also mentioned that nitrogen oxides, carbon
monoxide and carbon dioxide are emitted from the burning of hydrocarbon fuels in the
brick making industries and from the effect of heat on clay, sulphur dioxides are also
generated. So, brick making industries are important sources of greenhouse gases in the
Sudan as they use huge quantity of fuelwood and considerable amount of dung cake for
burning of bricks.
2.1.6 Brick making industries-agent of deforestation in the Sudan
The Forest Products Consumption Survey in the Sudan (FNC, 1995) reflects that the
industrial sector in 1994 used only 6.8% of the total wood consumption. Its consumption
was 1.07 million m3 round wood. Almost all the quantity (98.5%) was consumed in the
form of firewood and the remaining 1.5% is distributed among all the other uses. Brick
kilns were the highest consumers, consuming about 51.5% of the total industrial wood
17
consumption (FAO, 2000). The total annual brick production (2.8 billion) in the Sudan is
mainly produced by traditional methods where fuelwood is used as main fuel for brick
burning with exception in Khartoum area, dung cake (Appendix 2, Plate 11) is also used
for firing of bricks. Therefore, fuelwood is the main fuel used in clay bricks firing. This
means huge quantities of wood (about 549,000 stacked m3 equivalent to 183,000 t of
fuelwood) are used annually for clay brick production and accordingly forest resources
are extensively exploited for this purpose. In other words, obviously brick making
industries are acting as a serious agent of deforestation in the Sudan and this sector could
be considered as one of the contributory factors that seriously affecting the environment
(Hamid, 1994; BENS, 1996).
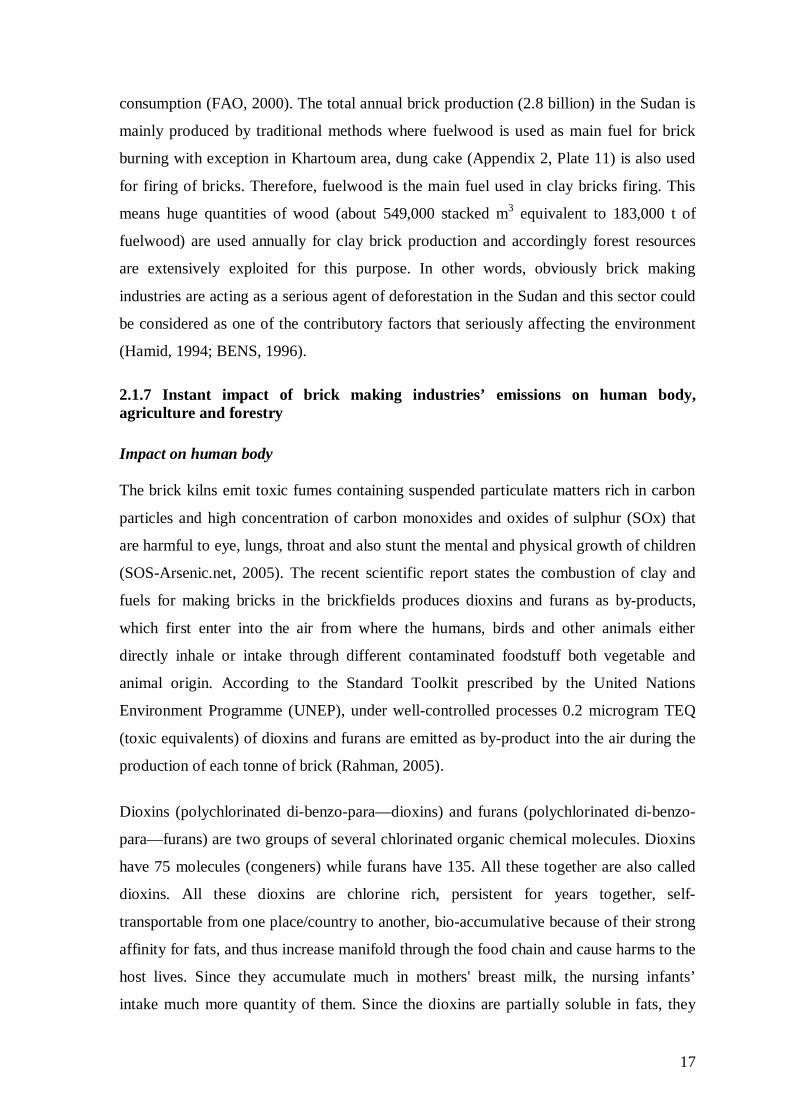
2.1.7 Instant impact of brick making industries’ emissions on human body,agriculture and forestry
Impact on human body
The brick kilns emit toxic fumes containing suspended particulate matters rich in carbon
particles and high concentration of carbon monoxides and oxides of sulphur (SOx) that
are harmful to eye, lungs, throat and also stunt the mental and physical growth of children
(SOS-Arsenic.net, 2005). The recent scientific report states the combustion of clay and
fuels for making bricks in the brickfields produces dioxins and furans as by-products,
which first enter into the air from where the humans, birds and other animals either
directly inhale or intake through different contaminated foodstuff both vegetable and
animal origin. According to the Standard Toolkit prescribed by the United Nations
Environment Programme (UNEP), under well-controlled processes 0.2 microgram TEQ
(toxic equivalents) of dioxins and furans are emitted as by-product into the air during the
production of each tonne of brick (Rahman, 2005).
Dioxins (polychlorinated di-benzo-para––dioxins) and furans (polychlorinated di-benzo-
para––furans) are two groups of several chlorinated organic chemical molecules. Dioxins
have 75 molecules (congeners) while furans have 135. All these together are also called
dioxins. All these dioxins are chlorine rich, persistent for years together, self-
transportable from one place/country to another, bio-accumulative because of their strong
affinity for fats, and thus increase manifold through the food chain and cause harms to the
host lives. Since they accumulate much in mothers' breast milk, the nursing infants’
intake much more quantity of them. Since the dioxins are partially soluble in fats, they
18
accumulate in fat-rich organs and tissues of humans particularly in breast, uterus, intestine
of women, in testes and adipose tissues of men and other similar organisms. These are
highly persistent and thus magnify manifold in those organs and as deadly elements cause
several adverse effects. They cause abnormally functioning thyroids and other hormone
system dysfunctions, feminization of males and masculinization of females, compromised
immune systems, behavioural abnormalities, neurobehavioral impairment including
learning disorders, a shortened period of lactation in nursing mothers, endometriosis,
increased incidence of diabetes, tumours and cancers, and gross birth defects. The other
effects include loss of appetite, weight loss, nausea, headache, liver and renal damage,
cardiac arrhythmias, allergic conjunctivitis, blepharitis, and retinal angiopathy (Rahman,
2005).
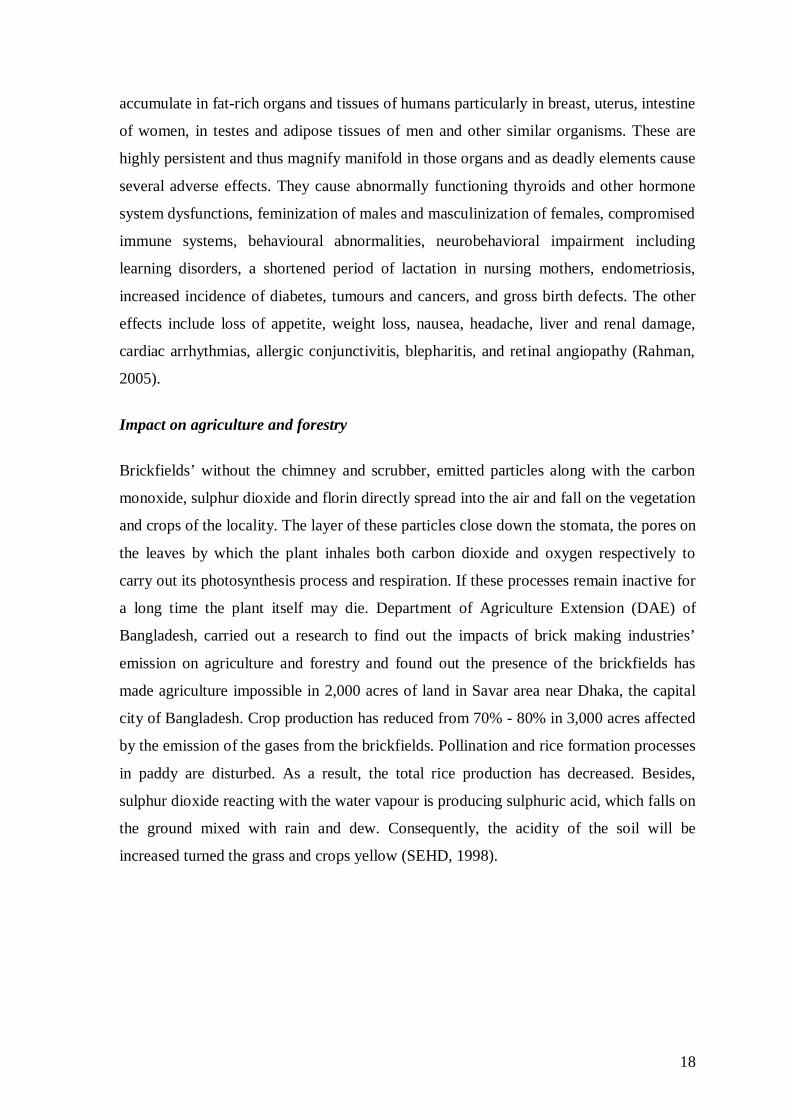
Impact on agriculture and forestry
Brickfields’ without the chimney and scrubber, emitted particles along with the carbon
monoxide, sulphur dioxide and florin directly spread into the air and fall on the vegetation
and crops of the locality. The layer of these particles close down the stomata, the pores on
the leaves by which the plant inhales both carbon dioxide and oxygen respectively to
carry out its photosynthesis process and respiration. If these processes remain inactive for
a long time the plant itself may die. Department of Agriculture Extension (DAE) of
Bangladesh, carried out a research to find out the impacts of brick making industries’
emission on agriculture and forestry and found out the presence of the brickfields has
made agriculture impossible in 2,000 acres of land in Savar area near Dhaka, the capital
city of Bangladesh. Crop production has reduced from 70% - 80% in 3,000 acres affected
by the emission of the gases from the brickfields. Pollination and rice formation processes
in paddy are disturbed. As a result, the total rice production has decreased. Besides,
sulphur dioxide reacting with the water vapour is producing sulphuric acid, which falls on
the ground mixed with rain and dew. Consequently, the acidity of the soil will be
increased turned the grass and crops yellow (SEHD, 1998).

19
2.1.8 Environmental impacts of brick making industries in the Sudan
According to Bilal (2002), fired clay brick making industries in the Sudan have following
negative impacts on environment:
Air: Smoke and gases are emitted from burning of fuelwood used in firing and burning of
the soil components. Volatile components are given off from the fired clay bricks and
wood during firing. Smoke and heat that come out as a result of the burning process
during day and night for a long time have an adverse effect on the vegetables and fruits
produced along river banks. Dust presents a latent risk in the fired clay brick production
particularly for the labour force. Fine quartz dust may cause silicosis9. Depending on the
geological and meteorological conditions, dust may occur in clay mine pits during the
extraction of the material. Dust raised by the movement of vehicles on unmade or dirty
roadways on site or by the wind may be blown outside the site and cause nuisance or
damage to property or vegetation
Soil: Since brick making is mainly concentrated along river banks, it causes erosion
(Haddams) and damage to the arable lands in these areas. However, most of the lost
arable lands are partly recovered annually after the flood period of the river by deposition
of river sediments. In addition to this burnt clay soil is permanently destroyed and
changed to an unrecoverable state.
Workplace: During firing of traditional brick kilns, temperature stresses on personnel are
observed. There may be considerable exposure to heat when the wood is fed or while the
fired red bricks are removed from kilns.
Ecosystem: On extracting clay for brick making, the landscape is impaired and there is an
alternation to the surface. Since the raw materials requirement per kiln is not very high,
the individual mining areas are generally relatively small. Nevertheless, removal of the
soil in and around the mine destroys the local flora.
9 Silicosis is an abnormal condition of the lungs caused by inhaling dust that contains silica which is acompound of silicon (Bilal, 2002).

20
Fuel energy: Many years ago brick kiln owners used to get their firewood stock from
forests along river banks. Presently, the Savannah woodlands surrounding Khartoum and
other major urban centres have shrunk by increased demand for fuel wood.
2.2 Deforestation and forest cover change
2.2.1 Global view of deforestation and forest cover change
Deforestation means those practices or processes that result in the conversion of forested
lands for non-forest uses. This is often cited as one of the major causes of the enhanced
greenhouse effect for two reasons: 1) the burning or decomposition of the releases carbon
dioxide; and 2) trees that once removed carbon dioxide from the atmosphere in the
process of photosynthesis are no longer present (EPA, 2001). Deforestation, in recent
years, has emerged as a central problem, both in Africa, Asia and in tropical forests all
over the world. During the period of 1990-2000, the world annual forest cover change
was 9.39 million ha (-0.2%). On a regional basis, during the same period, the annual
forest cover change was: Africa, 5.26 million ha (-0.8%), Asia 0.36 million ha (-0.1%)
and South America, 3.7 million ha (-0.4%) (FAO, 2005a). During the 1980s, the annual
rate of tropical deforestation was 11.3 million ha (Lanly, 1982). The average annual rate
of tropical deforestation during the decade of 1981-90 was 15.4 million ha (FAO, 1993).
2.2.2 Current state of forest resources and forest cover change in the Sudan
In 2000, the total forest coverage in Sudan was 61.63 million ha and which was 25.9% of
the total land area of this country. During the same year annual forest cover change was
959,000 ha (-1.4%) (FAO, 2005a). Forest area in the Sudan was estimated by Jackson and
Harrison (1958) to be between 36% and 43% of the total country area. Later in 1990, the
forest resource assessment carried out by the FAO indicated that the forest cover had
shrunk to 19% of the total country area. This was mainly attributed to expansion of
agriculture, building and fuel wood production, and grazing. The most recent forest
inventory (1995/1996) conducted for northern Sudan (between latitudes 10º and 16ºN by
the Forests National Corporation (FNC), in cooperation with the FAO, estimated forest
area at 12% in this part of the country (MEPD/HCENR, 2003).
The last forest inventory estimated the annual forest harvest (allowable cut) at 11.0
million cubic meters. While the 1994 forest products demand study conducted by the

21
FNC/FAO, estimated the total demand at 16.0 million cubic meters, this clearly indicates
the annual loss in the forest capital (MEPD/HCENR, 2003).
2.3 Woodfuel production and consumption
2.3.1 Worldwide distribution of woodfuels production and consumption
Woodfuels consist of three main commodities: fuelwood, charcoal and black liquor.
Fuelwood and charcoal are traditional forest products derived from the forest, trees
outside forests, wood-processing industries and recycled wooden products from society.
Black liquors are by-products of the pulp and paper industry. Quantification of the
production and consumption of all forms of biomass fuel is invariably difficult, and
woodfuels are no exception. In 1997, black liquor supplied about 72 MTOE of energy and
woodfuels in total contributed about 540 MTOE annually to the world energy
requirement. This amount is smaller than that of nuclear energy, which provided 650
MTOE in 1999, but substantially larger than the output from hydro and other renewable
sources of energy. On average, the annual per-capita consumption of woodfuels is
estimated to be 0.3-0.4 m3 or around 0.1 TOE, but with considerable regional variances.
In 1999, about 1.4 billion tonnes of fuelwood were produced worldwide, which is about
470 MTOE or about 5% of the world total energy requirement (WEC, 2005). Tab. 4
shows regional production of fuelwood (including wood for direct use as fuel and for
conversion into charcoal) in 1999.
Table 4. Total Regional fuelwood production in 1999
Region (MTOE) Percentage (%)Africa 141.1 29.9North America 38.5 8.1South America 37.7 8.0Asia 216.1 45.8Europe 34.9 7.4Middle East 0.2 0.0Oceania 3.8 0.8Total World 472.3 100.0
(Adapted from WEC, 2005)
Asia is by far the largest producer and consumer of fuelwood, accounting for 46% of
world production. Africa has the second highest share at 30%, followed by South
America and North America, both at around 8%. On the other hand, the production and
consumption of black liquor are concentrated in developed countries with large pulp and
22
paper industries. Therefore, about 50% of black liquor consumption is in North America,
followed by Europe with 19% and Asia with 12% (WEC, 2005).
Africa is the most intensive user of woodfuels in per-capita terms, with an average annual
per-capita consumption of 0.77 m3, or 0.18 TOE. In Africa, almost all countries rely on
wood to meet basic energy needs. The share of woodfuels in African primary energy
consumption is estimated at 60% to 86%, with the exception of North African countries
and South Africa. On average, about 40% of the total energy requirement in Africa is met
by fuelwood. In Asia, about 7% of the total energy requirement is met by fuelwood and
the per-capita consumption level is not very high; however, the situation varies from
country to country. Many countries in South and South East Asia, such as Nepal,
Cambodia, Thailand and Indonesia, rely heavily on fuelwood, consuming more than 0.5
m3 per-capita annually. In Europe and North America, the share of fuelwood in the total
energy requirement is low, at 1.2% and 1.4% respectively. However, for countries such as
Finland, Sweden, the USA and Canada, per-capita consumption is quite high if black
liquor is included. In Austria, Finland and Sweden, wood energy provides about 12% to
18% of the country’s total primary energy supply. In Latin America, about 10% of the
total energy requirement is met by fuelwood (WEC, 2005).
2.3.2 Woodfuel as energy source in the Sudan
Biomass is a primary source of energy in Sudan like many other developing countries.
Biomass contributed 78.5% of Sudan’s total energy supply in 1995. In that year, 70.5%
was in the form of woodfuel and only 8% was non-woody biomass. The other primary
energy source is petroleum products, which contribute 19.4% of total energy supply.
Hydro electricity contributes a tiny share of total energy supply, at just 2.1%
(MEPD/HCENR, 2003).
Sudan depends mainly on forestry sector as energy source; it contributes a total of 4.11
million TOE representing 70.8% of energy supplies in the country. Demand for woodfuel
increased in last years due to rapid population growth, urbanisation and shortage of
modern energy. However, woodfuel consumption in Sudan is expected to decrease from
current consumption as a result of investments and refining of petroleum by 2001
especially in household and traditional industries sectors. Fire wood consumption
decreased by urbanisation, while firewood still dominates in rural areas. For traditional

23
industries, including brick making, bakeries, oil mill etc. is found that woodfuel provides
about 69.3% of their total consumption. Type of wood consumed is mainly firewood
(stem), which had significant impact on forest resources. In commercial and service
sectors include institutions such as schools, hospitals, restaurants, commercial
establishments and informal activities (tea, kisra, etc), woodfuel consumption accounts
67% of the total energy used. It is concentrated in urban areas and their development
depends on urbanisation rate. Quranic schools depend totally on wood fuel especially in
lighting (FAO, 2000).
2.4 Energy sector in Sudan
2.4.1 Energy policies and strategies
Energy policy within the overall development policy of the National Comprehensive
Strategy (1992-2002) has the following objective (MEM, 2000):
• To provide an adequate and reliable supply of energy from local resources to
support sustainable development.
• To conserve the environment through efficient and optimal utilization of local
resources, especially forests, and to promote tree planting activities. The solution
of the energy problem should not be at the cost of the deterioration of natural
resources.
• To conserve all energy types so as to generate the highest economic value for
energy and minimize the cost to the economy.
• To develop the energy sector institutions to ensure coordination between
consumers and producers.
• To develop and promote local and/ or adapted energy technologies particularly in
the field of renewable energy resources.
• To train qualified and adequate staff at all levels to facilitate the development of
energy sector.
2.4.2 Energy resources
Non-commercial resources includes fuelwood (which composed of fire wood and
charcoal) beside agricultural residue and animal dung are utilized as fuel sources clearly
dominating Sudan final energy consumption 66% and represent 78.6% from the energy

24
supplies in 1997. According to the early 1970’s landsite photo imagery, the total area and
volume of Sudan’s Forest resources to be about 1.08 million hectors and 1.96 million
cubic meters respectively, about 70% of this is located in the Southern States and the
forest area decrease towards the north of Sudan. Other biomass resource, agriculture
waste (include crop residue which composed of cotton stocks, groundnut shells, bagasse
and animal dung) is the most eligible sources for non-wood biomass energy. Renewable
energy resources in Sudan include solar energy, wind energy, mini-hydro energy and
geothermal energy (MEM, 2000).
2.4.3 Energy balance
In 1998, the estimated total energy supply was about 14,595 thousands TOE. Biomass
(wood, animal waste) and the agriculture residues remained the major contributor with
the share of 88% (83% wood and 5% residues). This is a clear indication of continuous
exploitation of the country’s forest resources. Petroleum and Hydro provided 11% and
1% respectively of the total energy supply (MEM, 2000; Tab. 5).
Table 5. Estimated energy supply in 1998
Resource Supply (000 TOE) Percentage (%)Wood 12,152 83Residues 798 5Petroleum 1,555 11Hydro 90 1Total 14,595 100
(Adapted from MEM, 2000)
On the other hand, consumption estimates during the same period was about 7,790
thousand TOE (Tab. 6). The difference between supply and consumption is 6,805
thousands TOE (46.6%), which reflects the losses and the low efficiency of utilization of
energy resources about 53.4%. The most of the losses occurring in the process of
converting wood to charcoal where more than 6.4 million TOE has been lost (MEM,
2000).

25
Table 6. Estimated energy consumption by sector in 1998 (000 TOE)
Sector Household Services Transport Industry Agriculture TotalPetroleum 22 69 694 177 180 1,142Electricity 53 33 - 27 3 116Wood 2,522 691 - 217 - 3,430Charcoal 2,150 154 - - - 2,304Agricultureresidue
641 - - 157 - 798
Total 5,388 947 694 578 183 7,790% 69 12 9 8 2 100
(Adapted from MEM, 2000)
On sectoral basis, household sector is the largest consuming sector with the largest share,
5,388 thousands TOE (69%). Services sector consumed 947 thousands TOE, which is
12% of the total national energy consumption. The transportation sector consumed 694
thousands TOE of the total energy consumption in 1998 and all of it in the form of
petroleum products. It absorbed more than 60% of the total petroleum consumed in 1998.
The industrial sector consumed only 578 thousands TOE (8%) of the total energy
consumption during the same year. It consumed only 6% of the total biomass and 15% of
the total petroleum consumption and 23% of the total electricity. The agriculture sector
consumed only 183 thousands TOE (2%) of the total country energy consumption in 1998
(Tab. 6). Most of the consumption (98%) was petroleum products for water lifting in
agricultural operations. The rest (2%) is electricity, which is used for water lifting only
(MEM, 2000).
2.5 General information about emission of greenhouse gases, their sinks andsources, regional status of emission and international initiatives to reduceglobal rate of emission
2.5.1 Greenhouse gases and greenhouse effect
Greenhouse gases: Greenhouse gases are those gaseous constituents of the atmosphere,
both natural and anthropogenic; those absorb and emit radiation at specific wavelengths
within the spectrum of infrared radiation emitted by the earth’s surface, the atmosphere,
and clouds. The net effect is a local trapping of part of the absorbed energy and a
tendency to warm the planetary surface. Water vapour (H2O), carbon dioxide (CO2),
nitrous oxide (N2O), methane (CH4), and ozone (O3) are the primary greenhouse gases in
the earth’s atmosphere. Moreover, there are a number of entirely human-made
greenhouse gases in the atmosphere, such as the halocarbons and other chlorine and

26
bromine containing substances, dealt with under the Montreal Protocol. Besides CO2,
N2O, and CH4, the Kyoto Protocol deals with the greenhouse gases sulphur hexafluoride
(SF6), hydrofluorocarbons (HFCs), and perfluorocarbons (PFCs) (EPA, 2005; IPCC,
2005). According to IPCC (1996), emissions of greenhouse gases (GHGs) from human
activities as a primary cause for global climate change. The primary anthropogenic
(human-induced) GHGs include: carbon dioxide (CO2); methane (CH4); nitrous oxide
(N2O); ozone (O3); carbon monoxide (CO); nitrogen oxide (NOX); non-methane
hydrocarbons (NMHCs); and a variety of manufactured aerosols that do not occur in
nature, primarily chlorofluorocarbons (CFCs).
Greenhouse effect: Greenhouse effect is the natural mechanism of trapping and build-up
of heat in the lower atmosphere near to planet's surface. Some of the heat flowing back
towards space from the earth's surface is absorbed by water vapour, carbon dioxide,
methane and other gases in the atmosphere. If the atmospheric concentrations of these
gases rise, then theory predicts that the average temperature of the lower atmosphere will
gradually increase. Without the greenhouse effect we would be living in a very chilly
place, the world's average temperature would be minus 18°C, instead of the 16°C we are
used to. Current life on earth could not be sustained without the natural greenhouse effect.
The natural greenhouse effect is a phenomenon created by the heat energy radiated by the
sun and greenhouse gases normally present in the atmosphere. In simple terms, sunlight
passes through the atmosphere, warming the earth. In turn, the earth radiates this energy
back towards space. As it passes through the atmosphere, greenhouse gases (water
vapour, carbon dioxide, methane and nitrous oxide) absorb part of the energy, while the
remainder escapes into space. This means that some of the sun's energy becomes trapped,
thus making the lower part of the atmosphere and the earth, warmer. The enhanced
greenhouse effect is an increase in the natural process of the greenhouse effect, brought
about by human activities, whereby greenhouse gases such as carbon dioxide, methane,
chlorofluorocarbons and nitrous oxide are being released into the atmosphere at a far
greater rate than would occur through natural processes. Global warming is one of the
consequences of the enhanced greenhouse effect and will cause worldwide changes to
climate patterns (EPA, 2005; IPCC, 2005; AAS, 2005).
27
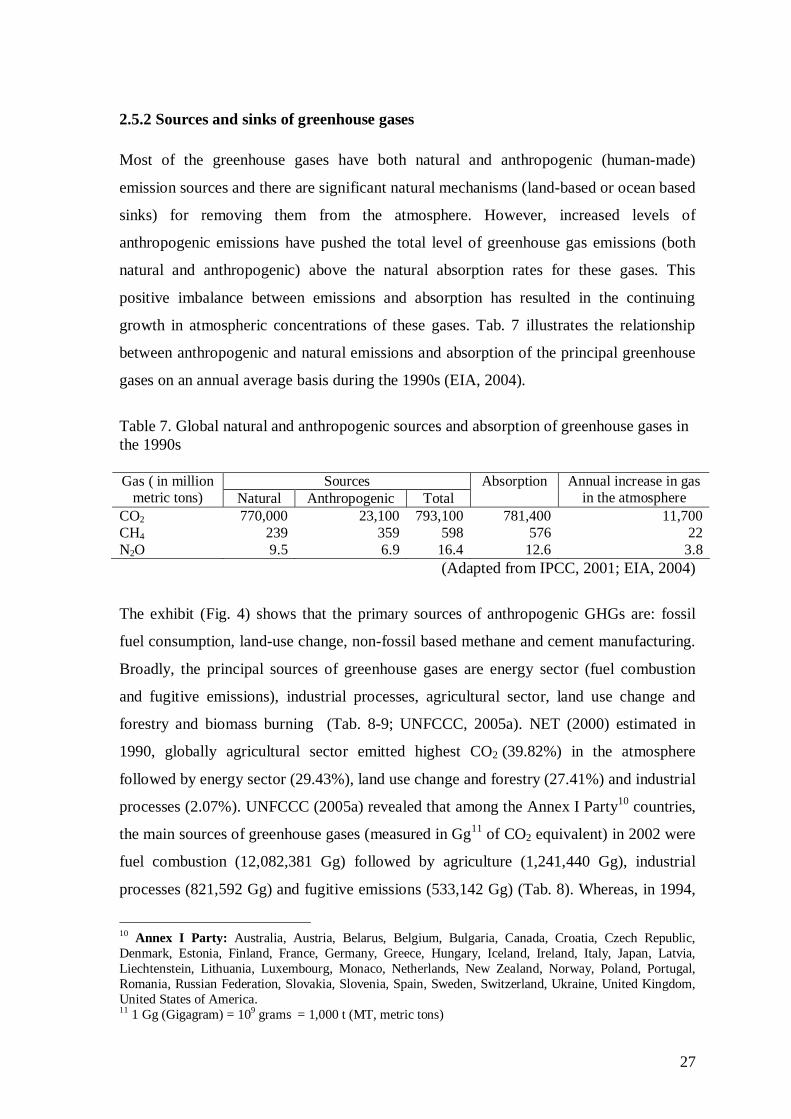
2.5.2 Sources and sinks of greenhouse gases
Most of the greenhouse gases have both natural and anthropogenic (human-made)
emission sources and there are significant natural mechanisms (land-based or ocean based
sinks) for removing them from the atmosphere. However, increased levels of
anthropogenic emissions have pushed the total level of greenhouse gas emissions (both
natural and anthropogenic) above the natural absorption rates for these gases. This
positive imbalance between emissions and absorption has resulted in the continuing
growth in atmospheric concentrations of these gases. Tab. 7 illustrates the relationship
between anthropogenic and natural emissions and absorption of the principal greenhouse
gases on an annual average basis during the 1990s (EIA, 2004).
Table 7. Global natural and anthropogenic sources and absorption of greenhouse gases inthe 1990s
SourcesGas ( in millionmetric tons) Natural Anthropogenic Total
Absorption Annual increase in gasin the atmosphere
CO2 770,000 23,100 793,100 781,400 11,700CH4 239 359 598 576 22N2O 9.5 6.9 16.4 12.6 3.8
(Adapted from IPCC, 2001; EIA, 2004)
The exhibit (Fig. 4) shows that the primary sources of anthropogenic GHGs are: fossil
fuel consumption, land-use change, non-fossil based methane and cement manufacturing.
Broadly, the principal sources of greenhouse gases are energy sector (fuel combustion
and fugitive emissions), industrial processes, agricultural sector, land use change and
forestry and biomass burning (Tab. 8-9; UNFCCC, 2005a). NET (2000) estimated in
1990, globally agricultural sector emitted highest CO2 (39.82%) in the atmosphere
followed by energy sector (29.43%), land use change and forestry (27.41%) and industrial
processes (2.07%). UNFCCC (2005a) revealed that among the Annex I Party10 countries,
the main sources of greenhouse gases (measured in Gg11 of CO2 equivalent) in 2002 were
fuel combustion (12,082,381 Gg) followed by agriculture (1,241,440 Gg), industrial
processes (821,592 Gg) and fugitive emissions (533,142 Gg) (Tab. 8). Whereas, in 1994,
10 Annex I Party: Australia, Austria, Belarus, Belgium, Bulgaria, Canada, Croatia, Czech Republic,Denmark, Estonia, Finland, France, Germany, Greece, Hungary, Iceland, Ireland, Italy, Japan, Latvia,Liechtenstein, Lithuania, Luxembourg, Monaco, Netherlands, New Zealand, Norway, Poland, Portugal,Romania, Russian Federation, Slovakia, Slovenia, Spain, Sweden, Switzerland, Ukraine, United Kingdom,United States of America.11 1 Gg (Gigagram) = 109 grams = 1,000 t (MT, metric tons)

28
Non Fossil BasedMethane***
14 %
Fossil FuelConsumption**
73 %
Land Use Change11 %Cement
manufacturing2 %
Fossil Fuel Consumption** Non Fossil Based Methane***Cement manufacturing Land Use Change
among the Non-Annex I Party12 countries, the major sources were fuel combustion
(2,061,153 Gg) followed by agriculture (1,196,557 Gg), land-use change & forestry
(1,139,516 Gg) and biomass burning (490,588 Gg) (Tab. 9).
Figure 4. Sources of greenhouse gas emissions covered under the UNFCCC, 1991*
(CDIAC, 1995)* Greenhouse gas emissions covered under the UNFCCC do not include CFCs.** Fossil fuel consumption includes the global warming potential of methane from oil and gas
production and coal mining.*** Non-fossil based methane includes solid waste, wet rice, agriculture and livestock.
12 Non-Annex I Party: Albania, Algeria, Antigua and Barbuda, Argentina, Armenia, Azerbaijan,,Bahamas Bangladesh, Barbados, Belize, Benin, Bhutan, Bolivia, Botswana, Burkina Faso,Burundi, Cambodia, Cape Verde, Chad, Chile, Colombia, Comoros, Congo, Cook Islands, CostaRica, Cote d Ivoire, Cuba, D. Rep. of Congo, Djibouti, Dominica, Dominican Republic, Ecuador,Egypt, El Salvador, Eritrea, Ethiopia, Georgia, Ghana, Grenada, Guatemala, Guinea, Guyana,Haiti, Honduras, Indonesia, Iran (Islamic Rep. of), Israel, Jamaica, Jordan, Kazakhstan, Kenya,Kiribati, Kyrgyzstan, Lao Peop Dem Rep, Lebanon, Lesotho, Malaysia, Maldives, Mali, Malta,Mauritania, Mauritius, Mexico, Micronesia (Fed. States of), Mongolia, Morocco, Namibia,Nauru, Nicaragua, Niger, Niue, Palau, Panama, Papua New Guinea, Paraguay, Peru, Philippines,Republic of Korea, Republic of Moldova, Saint Kitts and Nevis, Saint Lucia, Samoa, Senegal,Seychelles, Singapore, Solomon Islands, Sri Lanka, St. Vincent and the Grenadines, Swaziland,Tajikistan, Thailand, The f.Y. Rep of Macedonia, Togo, Trinidad and Tobago, Tunisia,Turkmenistan, Tuvalu, Uganda, Uruguay, Uzbekistan, Vanuatu, Yemen, Zimbabwe.

29
Table 8. Greenhouse gas emission in 2002 by Annex I Party according to sources
Sources &Sink
CO2(in Gg)
CH4(in Gg of
CO2equivalent)
N2O(in Gg of
CO2equivalent)
CO(in Gg of
CO2equivalent)
NOx(in Gg of
CO2equivalent)
SO2(in Gg of
CO2equivalent)
NMVOC(in Gg of
CO2equivalent)
HFCs(in Gg of
CO2equivalent)
PFCs(in Gg of
CO2equivalent)
SF6(in Gg of
CO2equivalent)
Total(in Gg of
CO2equivalent)
Fuelcombustion
11,682,210 37,129 162,617 129,090 35,147 22,405 13,783 - - - 12,082,381
Fugitiveemissions
55,338 474,964 80 274 160 500 1,826 - - - 533,142
Industrialprocesses
474,166 5,437 80,299 4,943 887 3,326 3,133 181,126 32,363 35,912 821,592
Solvent &otherproduct use
5,707 - 9,350 51 3 0.95 9,530 - - - 24,642
Agriculture 1,525 553,061 663,060 20,281 1,632 0.02 1,881 - - - 1,241,440Land-usechange &Forestry
-987,008 7,953 4,289 7,137 147 0.12 2,463 - - - 21,989
Waste 32,340 415,747 32,816 855 123 53 256 - - - 482,190Other 720 38 1,184 19 3 0.02 - - - - 1,964Total 12,252,006 1,494,329 953,695 162,650 38,102 26,285 32,872 181,126 32,363 35,912 15,209,340
(Adapted and modified from UNFCCC, 2005a)

30
Table 9. Greenhouse gas emission in 1994 by Non-Annex I Party according to sources
Sources CO2(in Gg)
CH4(in Gg of
CO2equivalent)
N2O(in Gg of
CO2equivalent)
CO(in Gg of
CO2equivalent)
NOX(in Gg of
CO2equivalent)
SO2(in Gg of
CO2equivalent)
NMVOC(in Gg of
CO2equivalent)
Total(in Gg of
CO2equivalent)
Biomass burning 488,364 1,469 183 561 11 - - 490,588Fuel combustion 1,940,101 45,201 19,826 41,402 5,681 4,726 4,216 2,061,153Fugitiveemissions
40,796 195,060 - 579 6 105 164 236,710
Industrialprocesses
133,854 592 3,881 231 113 1,935 4,659 145,265
Solvent & otherproduct use
4 - - - - - 100 104
Agriculture 701 618,879 451,658 116,616 8,700 - 3 1,196,557Land-use change& Forestry
1,078,244 40,507 4,451 15,812 451 - 51 1,139,516
Waste 152 156,575 7,691 - - - - 164,418Other - 195 - 65 0.09 9 16 285Total 3,682,216 1,058,478 487,690 175,266 14,962 6,775 9,209 5,434,596
(Adapted and modified from UNFCCC, 2005a)
31
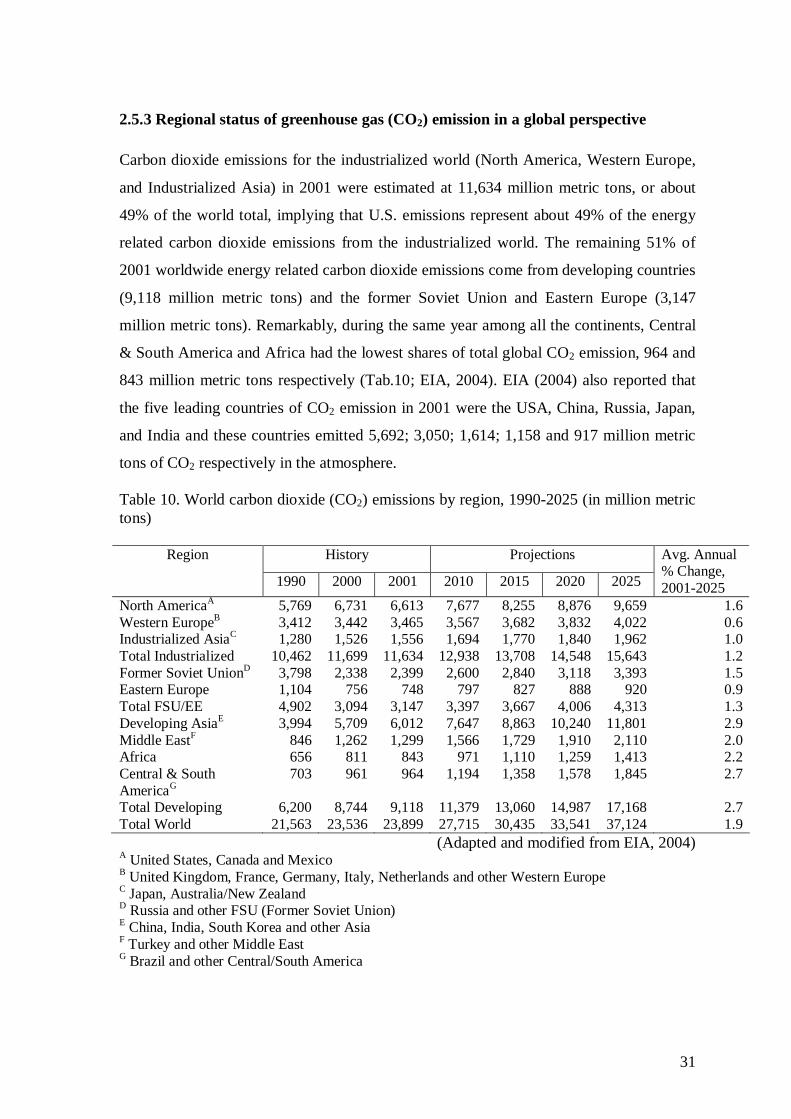
2.5.3 Regional status of greenhouse gas (CO2) emission in a global perspective
Carbon dioxide emissions for the industrialized world (North America, Western Europe,
and Industrialized Asia) in 2001 were estimated at 11,634 million metric tons, or about
49% of the world total, implying that U.S. emissions represent about 49% of the energy
related carbon dioxide emissions from the industrialized world. The remaining 51% of
2001 worldwide energy related carbon dioxide emissions come from developing countries
(9,118 million metric tons) and the former Soviet Union and Eastern Europe (3,147
million metric tons). Remarkably, during the same year among all the continents, Central
& South America and Africa had the lowest shares of total global CO2 emission, 964 and
843 million metric tons respectively (Tab.10; EIA, 2004). EIA (2004) also reported that
the five leading countries of CO2 emission in 2001 were the USA, China, Russia, Japan,
and India and these countries emitted 5,692; 3,050; 1,614; 1,158 and 917 million metric
tons of CO2 respectively in the atmosphere.
Table 10. World carbon dioxide (CO2) emissions by region, 1990-2025 (in million metrictons)
History ProjectionsRegion
1990 2000 2001 2010 2015 2020 2025
Avg. Annual% Change,2001-2025
North AmericaA 5,769 6,731 6,613 7,677 8,255 8,876 9,659 1.6Western EuropeB 3,412 3,442 3,465 3,567 3,682 3,832 4,022 0.6Industrialized AsiaC 1,280 1,526 1,556 1,694 1,770 1,840 1,962 1.0Total Industrialized 10,462 11,699 11,634 12,938 13,708 14,548 15,643 1.2Former Soviet UnionD 3,798 2,338 2,399 2,600 2,840 3,118 3,393 1.5Eastern Europe 1,104 756 748 797 827 888 920 0.9Total FSU/EE 4,902 3,094 3,147 3,397 3,667 4,006 4,313 1.3Developing AsiaE 3,994 5,709 6,012 7,647 8,863 10,240 11,801 2.9Middle EastF 846 1,262 1,299 1,566 1,729 1,910 2,110 2.0Africa 656 811 843 971 1,110 1,259 1,413 2.2Central & SouthAmericaG
703 961 964 1,194 1,358 1,578 1,845 2.7
Total Developing 6,200 8,744 9,118 11,379 13,060 14,987 17,168 2.7Total World 21,563 23,536 23,899 27,715 30,435 33,541 37,124 1.9
(Adapted and modified from EIA, 2004)A United States, Canada and MexicoB United Kingdom, France, Germany, Italy, Netherlands and other Western EuropeC Japan, Australia/New ZealandD Russia and other FSU (Former Soviet Union)E China, India, South Korea and other AsiaF Turkey and other Middle EastG Brazil and other Central/South America
32
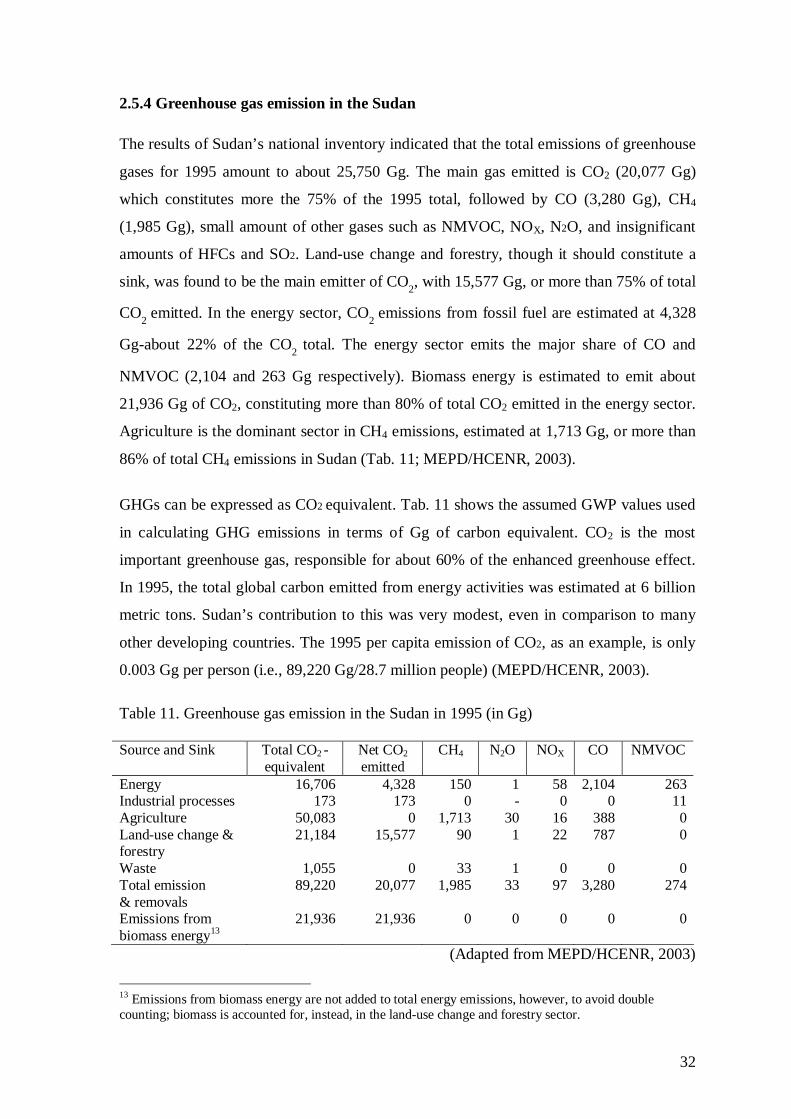
2.5.4 Greenhouse gas emission in the Sudan
The results of Sudan’s national inventory indicated that the total emissions of greenhouse
gases for 1995 amount to about 25,750 Gg. The main gas emitted is CO2 (20,077 Gg)
which constitutes more the 75% of the 1995 total, followed by CO (3,280 Gg), CH4
(1,985 Gg), small amount of other gases such as NMVOC, NOX, N2O, and insignificant
amounts of HFCs and SO2. Land-use change and forestry, though it should constitute a
sink, was found to be the main emitter of CO2, with 15,577 Gg, or more than 75% of total
CO2 emitted. In the energy sector, CO2 emissions from fossil fuel are estimated at 4,328
Gg-about 22% of the CO2 total. The energy sector emits the major share of CO and
NMVOC (2,104 and 263 Gg respectively). Biomass energy is estimated to emit about
21,936 Gg of CO2, constituting more than 80% of total CO2 emitted in the energy sector.
Agriculture is the dominant sector in CH4 emissions, estimated at 1,713 Gg, or more than
86% of total CH4 emissions in Sudan (Tab. 11; MEPD/HCENR, 2003).
GHGs can be expressed as CO2 equivalent. Tab. 11 shows the assumed GWP values used
in calculating GHG emissions in terms of Gg of carbon equivalent. CO2 is the most
important greenhouse gas, responsible for about 60% of the enhanced greenhouse effect.
In 1995, the total global carbon emitted from energy activities was estimated at 6 billion
metric tons. Sudan’s contribution to this was very modest, even in comparison to many
other developing countries. The 1995 per capita emission of CO2, as an example, is only
0.003 Gg per person (i.e., 89,220 Gg/28.7 million people) (MEPD/HCENR, 2003).
Table 11. Greenhouse gas emission in the Sudan in 1995 (in Gg)
Source and Sink Total CO2 -equivalent
Net CO2emitted
CH4 N2O NOX CO NMVOC
Energy 16,706 4,328 150 1 58 2,104 263Industrial processes 173 173 0 - 0 0 11Agriculture 50,083 0 1,713 30 16 388 0Land-use change &forestry
21,184 15,577 90 1 22 787 0
Waste 1,055 0 33 1 0 0 0Total emission& removals
89,220 20,077 1,985 33 97 3,280 274
Emissions frombiomass energy13
21,936 21,936 0 0 0 0 0
(Adapted from MEPD/HCENR, 2003)
13 Emissions from biomass energy are not added to total energy emissions, however, to avoid doublecounting; biomass is accounted for, instead, in the land-use change and forestry sector.

33
2.5.5 Emissions from biomass fuel burning
Biomass fuel is in any fuel that derives from biomass-recently living organism or their
metabolic by-products, such as manure from cows. There are many forms of solid
biomass that are combustible as a fuel, e.g. wood, straw and other dried plants, animal
waste, husks or shells from crops and bagasse. Burning of biomass fuels is responsible for
the emissions of both trace and non-trace greenhouse gases, such as CO2, CH4, CO, N2O,
NOX and NO Combustion of biomass plays a significant role in global atmospheric
chemistry due to the non-CO2 trace gases and its potential for global warming due to an
enhanced greenhouse gas effect. However, much of the CO2 from the biomass does not
result in a net increase in atmospheric concentration because the plants absorb it during
photosynthesis. The accurate estimation of greenhouse gas emission from biomass fuel
burning in small combustion is important to know their significance and to suggest
suitable mitigation options (WB, 1998; ITDG, 2005).
2.5.6 International initiative on the reduction of the emissions of greenhouse gases
The Kyoto Protocol aims to address the problem of anthropogenic climate change. The
Protocol, adopted on 11 December 1997, complements the 1992 UN Framework
Convention on Climate Change. In this Convention, countries agreed to aim to reduce
greenhouse gas emissions. The Kyoto Protocol is the legally binding international
agreement under which industrialized countries are supposed to reduce their collective
emissions of six greenhouse gases by 5.2% by 2008-12, calculated as an average over
these five years. In order to help industrialized countries to reduce their emissions in a
cost-effective way, three flexible “mechanisms” were included in Kyoto Protocol (a) The
clean development mechanism (CDM): Creation of certified emission reductions through
investments in developing countries regulated by a newly formed authority (b) An
emission trading regime: A country exceeding its emission reduction goal can sell the
excess to another that has not reached its goal and (c) A joint implementation: Creation of
emission reduction units derived from investments between parties. Each country is
expected either to reduce its emissions or to purchase quota from other countries so that
the sum of these two is not more than its national emission limit. This Protocol also
considered funding, technology transfer, and the review of information under the
convention. The Kyoto Protocol is only a first step in tackling the problem of climate
change. Achieving the Kyoto targets will only reduce developed country emissions by

34
5.2%. However, any reduction in greenhouse gas emissions will mark a significant
transformation considering the persistent upward trend in emissions since the Industrial
Revolution. As of February 16, 2005, 141 nations had ratified the Kyoto Protocol and this
Protocol came into force on 16 February, 2005 (WMO/UNEP, 1996; UNFCCC, 2005b).
2.6 Global warming and its impact on climate change
2.6.1 Global warming and global warming potential
Global warming is the progressive gradual rise of the temperature of the earth’s surface
thought to be caused by the greenhouse effect and responsible for changes in global
climate patterns. It has occurred in the distant past as the result of natural influences, but
the term is most often used to refer to the warming predicted to occur as a result of
increased emissions of greenhouse gases. The index used to translate the level of
emissions of various gases into a common measure in order to compare the relative
radiative forcing of different gases without directly calculating the changes in
atmospheric concentrations. GWPs are calculated as the ratio of the radiative forcing that
would result from the emissions of one kilogram of a greenhouse gas to that from the
emission of one kilogram of carbon dioxide over a period of time (usually 100 years).
Gases involved in complex atmospheric chemical processes have not been assigned
GWPs (EPA, 2001). CO2, CH4 and N2O account for over 90% of the global warming
potential (GWP) of all GHGs emissions. In order to compare the climate change impacts
of these three primary GHGs, the IPCCs GWP index for a 100-year time horizon was
utilized. The GWP indices for the three primary GHGs are: CO2 = 1, CH4 = 21 and N2O =
310. By applying the appropriate GWPs, the total GHGs emissions of a country can be
expressed in CO2-equivalent. For example, one tonne of CH4 would be equivalent to 21
tonnes of CO2. Similarly, one tonne of N2O would be equivalent to 310 tonnes of CO2
(ALGAS, 1998).
2.6.2 Climate change
Climate change in IPCC usage refers to any change in climate over time, whether due to
natural variability or as a result of natural activity. This usage differs from that in the
UNFCCC, where climate change refers to a change of climate which is attributed directly
or indirectly to human activity that alters the composition of the global atmosphere and
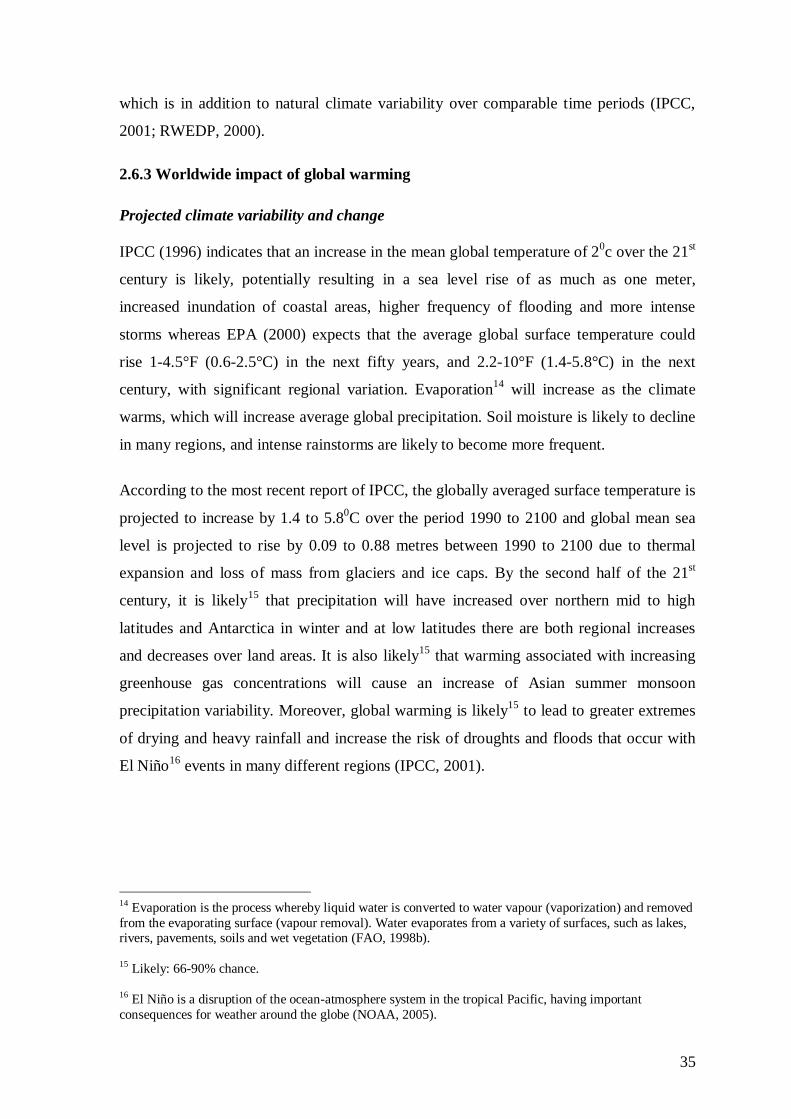
35
which is in addition to natural climate variability over comparable time periods (IPCC,
2001; RWEDP, 2000).
2.6.3 Worldwide impact of global warming
Projected climate variability and change
IPCC (1996) indicates that an increase in the mean global temperature of 20c over the 21st
century is likely, potentially resulting in a sea level rise of as much as one meter,
increased inundation of coastal areas, higher frequency of flooding and more intense
storms whereas EPA (2000) expects that the average global surface temperature could
rise 1-4.5°F (0.6-2.5°C) in the next fifty years, and 2.2-10°F (1.4-5.8°C) in the next
century, with significant regional variation. Evaporation14 will increase as the climate
warms, which will increase average global precipitation. Soil moisture is likely to decline
in many regions, and intense rainstorms are likely to become more frequent.
According to the most recent report of IPCC, the globally averaged surface temperature is
projected to increase by 1.4 to 5.80C over the period 1990 to 2100 and global mean sea
level is projected to rise by 0.09 to 0.88 metres between 1990 to 2100 due to thermal
expansion and loss of mass from glaciers and ice caps. By the second half of the 21st
century, it is likely15 that precipitation will have increased over northern mid to high
latitudes and Antarctica in winter and at low latitudes there are both regional increases
and decreases over land areas. It is also likely15 that warming associated with increasing
greenhouse gas concentrations will cause an increase of Asian summer monsoon
precipitation variability. Moreover, global warming is likely15 to lead to greater extremes
of drying and heavy rainfall and increase the risk of droughts and floods that occur with
El Niño16 events in many different regions (IPCC, 2001).
14 Evaporation is the process whereby liquid water is converted to water vapour (vaporization) and removedfrom the evaporating surface (vapour removal). Water evaporates from a variety of surfaces, such as lakes,rivers, pavements, soils and wet vegetation (FAO, 1998b).
15 Likely: 66-90% chance.
16 El Niño is a disruption of the ocean-atmosphere system in the tropical Pacific, having importantconsequences for weather around the globe (NOAA, 2005).

36
Observed climate variability and change
Average global surface temperature has increased by approximately 0.60C since the late
19th century. Globally, it is very likely17 that the 1990s was the warmest decade and 1998
the warmest year since 1861. Since the late 1950s the overall global temperature increases
in the lowest 8 kilometres of the atmosphere and in surface temperature have been similar
at 0.10C. It is very likely that17 precipitation has increased by 0.5 to 1% per decade in the
20th century over most mid and high latitudes of the Northern Hemisphere continents and
it is likely15 that rainfall has increased by 0.2 to 0.3% per decade over the tropical (100 N
to 100 S) land areas. It is also likely15 that rainfall has decreased over much of the
Northern Hemisphere sub-tropical (100 N to 300 N) land areas during the 20th century by
about 0.3% per decade (EPA, 2000; IPCC, 2001). According to Tide gauge data, IPCC
(2001) estimated that global average sea level rose between 0.1 and 0.2 metres during the
20th century whereas EPA (2000) reported that it was 4-8 inches over the past century.
Concentrations of atmospheric greenhouse gases and their radiative forcing have
continued to increase as a result of human activities. About three-quarters of the
anthropogenic emissions of CO2 to the atmosphere during the past 20 years is due to
fossil fuel burning and the rest is predominantly due to land-use change, especially
deforestation. Since 1750, the atmospheric concentration of CO2 has increased by 31%,
CH4 by 151%, N2O by 17%, and O3 by 36%. In addition, CO emissions have recently
been identified as a cause of increasing CH4 concentration (IPCC, 2001).
2.6.4 African climate trends and projections
Africa is highly vulnerable to global climate change. Impacts of particular concern to
Africa are related to water resources, food production, human health, desertification, and
costal zones especially in relation to extreme events. Alternation of spatial and temporal
pattern of temperature i.e. global greenhouse effect, rainfall, solar radiation and winds
from a changing climate will exacerbate desertification. Desertification is a critical threat
to sustainable resource management in arid, semi-arid and dry sub humid regions of
Africa, undermining food and water security (IPCC/WMO/UNEP, 1998).
With respect to temperature, land areas may warm by 2050 by as much as 1.6°C over the
Sahara and semi-arid parts of southern Africa (Hernes et al., 1995; Ringius et al., 1996).
17 Very likely: 90-99% chance
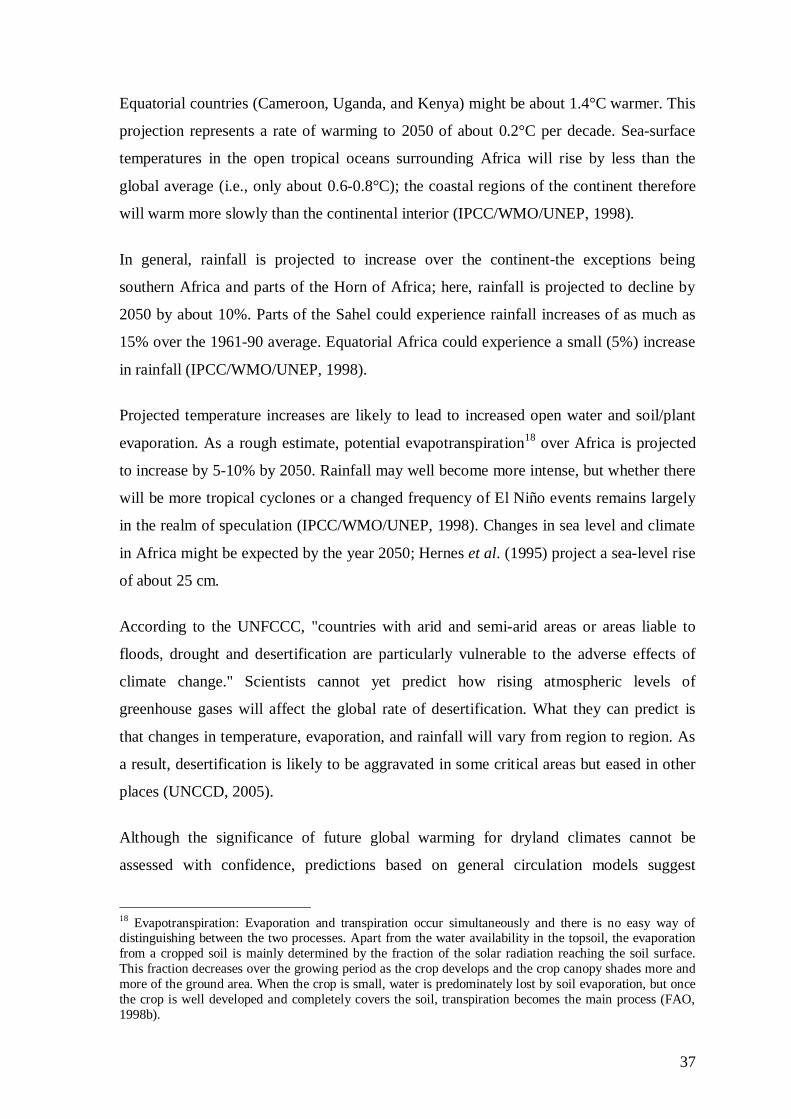
37
Equatorial countries (Cameroon, Uganda, and Kenya) might be about 1.4°C warmer. This
projection represents a rate of warming to 2050 of about 0.2°C per decade. Sea-surface
temperatures in the open tropical oceans surrounding Africa will rise by less than the
global average (i.e., only about 0.6-0.8°C); the coastal regions of the continent therefore
will warm more slowly than the continental interior (IPCC/WMO/UNEP, 1998).
In general, rainfall is projected to increase over the continent-the exceptions being
southern Africa and parts of the Horn of Africa; here, rainfall is projected to decline by
2050 by about 10%. Parts of the Sahel could experience rainfall increases of as much as
15% over the 1961-90 average. Equatorial Africa could experience a small (5%) increase
in rainfall (IPCC/WMO/UNEP, 1998).
Projected temperature increases are likely to lead to increased open water and soil/plant
evaporation. As a rough estimate, potential evapotranspiration18 over Africa is projected
to increase by 5-10% by 2050. Rainfall may well become more intense, but whether there
will be more tropical cyclones or a changed frequency of El Niño events remains largely
in the realm of speculation (IPCC/WMO/UNEP, 1998). Changes in sea level and climate
in Africa might be expected by the year 2050; Hernes et al. (1995) project a sea-level rise
of about 25 cm.
According to the UNFCCC, "countries with arid and semi-arid areas or areas liable to
floods, drought and desertification are particularly vulnerable to the adverse effects of
climate change." Scientists cannot yet predict how rising atmospheric levels of
greenhouse gases will affect the global rate of desertification. What they can predict is
that changes in temperature, evaporation, and rainfall will vary from region to region. As
a result, desertification is likely to be aggravated in some critical areas but eased in other
places (UNCCD, 2005).
Although the significance of future global warming for dryland climates cannot be
assessed with confidence, predictions based on general circulation models suggest
18 Evapotranspiration: Evaporation and transpiration occur simultaneously and there is no easy way ofdistinguishing between the two processes. Apart from the water availability in the topsoil, the evaporationfrom a cropped soil is mainly determined by the fraction of the solar radiation reaching the soil surface.This fraction decreases over the growing period as the crop develops and the crop canopy shades more andmore of the ground area. When the crop is small, water is predominately lost by soil evaporation, but oncethe crop is well developed and completely covers the soil, transpiration becomes the main process (FAO,1998b).

38
temperatures will rise in all dryland regions in all seasons. Predicted increases in
temperature are expected to increase potential evapotranspiration rates in drylands and,
without large increases in precipitation, many drylands could become more arid in the
coming century. Thus, UNEP warns that for inhabitants of drylands, the message is clear:
global warming is likely to further reduce the already limited availability of moisture
(White and Nackoney, 2003).
Relatively little research has been conducted on the possible impact of climate change on
deserts. Today, deserts tend to be found at latitudes between 20 and 32 degrees. Soils are
extremely dry at these latitudes because the potential for evaporation and transpiration is
generally greater than the average rainfall. If global temperatures were to rise by 4°C, the
potential evapotranspiration would increase 30-40%, while precipitation would only
increase 10-15%. As a result, the area with a deficiency of precipitation would expand
pole ward and toward the equator. Studies that focus on what is likely to occur over the
next century, however, do not indicate whether deserts are more likely to expand or
contract. Studies using the bio-geographic models have estimated that desert shrub lands
could increase by as much as 185% or decrease by as much as 56% (EPA, 2000).
2.6.5 Vulnerability to global climate change in Africa
Several climate regimes characterize the African continent; the wet tropical, dry tropical
and alternating wet and dry climates are most common. The African continent is
particularly vulnerable to the impacts of climate change because of widespread poverty,
recurrent droughts, inequitable land distribution and over dependence on rain-fed
agriculture. IPCC/WMO/UNEP (1997) has summarized the potential impacts of global
climate change in African continent under the following heads:
Ecosystems: A sustained increase in mean ambient temperatures beyond 10C would cause
significant changes in forest and range-land cover; species distribution, composition and
migration patterns and biome distribution. Arid to semi-arid sub-regions and grassland
areas of eastern and southern Africa, as well as areas currently under threat from land
degradation and desertification, are particularly vulnerable.
Hydrology and water resources: Of the 19 countries around the world currently classified
as water-stressed, more are in Africa than in any other region. A reduction in precipitation

39
projected by some General Circulation Models (GCMs) for the Sahel and southern
Africa-if accompanied by high inter-annual variability-could be detrimental to the
hydrological balance of the continent and disrupt various water dependent socio-
economic activities. A drop in water level in dams and rivers could adversely affect the
quality of water by increasing the concentrations of sewage waste and industrial effluents,
thereby increasing the potential for the outbreak of diseases and reducing the quality and
quantity of fresh water available for domestic use.
Agriculture and food security: Agriculture is the economic mainstay in most African
countries excluding oil-exporting countries, contributing 20-30% of GDP in sub-Saharan
Africa and 55% of the total value of African exports. In most African countries, farming
depends entirely on the quality of the rainy season-a situation that makes Africa
particularly vulnerable to climate change. A rise in mean winter temperatures also would
be harmful to the production of winter wheat and fruits that need the winter chill.
Productivity of freshwater fisheries may increase, although the mix fish species could be
altered.
Coastal systems: The coastal nations of west and central Africa (e.g. Senegal, Gambia,
Sierra Leone, Nigeria, Cameroon, Gabon, and Angola) have low-lying lagoonal coasts
that are susceptible to erosion and threatened by sea-level rise, particularly because most
of the countries in this area have major and rapidly expanding cities on the coast. The
west coast often is buffeted by storm surges and currently is at risk from erosion,
inundation and extreme storm events. The coastal zone of east Africa also will be
affected, although this area experiences calm conditions through much of the year.
However, sea level rise and climatic variation may reduce the buffer effect of coral and
patch reefs along the east coast, increasing the potential for erosion. Studies also indicate
that a sizeable proportion of the northern part of the Nile delta will be lost through a
combination of inundation and erosion with consequent loss of agricultural land and
urban areas.
Human health: Africa is expected to be at risk primarily from increased incidences of
vector-borne diseases and reduced nutritional status. A warmer environment could open
up new areas for malaria; altered temperature and rainfall patterns also could increase the
incidence of yellow fever, dengue fever, onchocerciasis and trypanosomiasis.

40
Tourism and wildlife: Tourism, one of Africa’s fastest growing industries, which is
based on wildlife, nature reserves, coastal resorts and an abundant water supply for
recreation. Projected droughts and/or reduction in precipitation in the Sahel and eastern
and southern Africa would devastate wildlife and reduce the attractiveness of some nature
reserves, thereby reducing income from current vast investments in tourism.
2.6.6 Vulnerability to climate change in the Sudan
MEPD/HCENR (2003) has illuminated the potential impacts of climate change in the
Sudan based on a combination of tools namely, three GCMs19, IPCC emission scenarios
(IS92a), scenario generating software (MAGICC/SCENGEN version 2.4) and linear
interpolation techniques. To foresee climate change scenarios, the data collected from
five stations (El Obeid, En Nahud, Rashad, Kadugli and Babanusa) of Kordofan region
which is located in mid-western Sudan between latitudes 9030/ and 16024/ North and
longitudes 270 to 320 East. Kordofan region ranges across desert and semi-desert in the
North, to moist, sub-humid and rich savannah in the South. Arid and semi-arid zones
make up the largest segment of Kordofan’s land area and the data collected at these
stations tells a story of a varied regional climate. However, climate change scenarios can
be summarized on the critically important sector of Sudan as follows:
Agriculture and forestry: The recent droughts, socio-economic changes, and on-going
process of desertification have drastically affected the distribution and condition of tree
cover in the gum arabic belt and agricultural crops in the Kordofan region, particularly in
the sandy areas of North Kordofan and North Darfur. Approach one20 and approach two21
of climate change scenarios suggested that this sector and the nation as a whole- may be
hard hit by even modest changes in temperature and precipitation, and found out
following specific impacts for this sector-(i) reduction in ecosystem integrity and
resilience and a decline in biodiversity (ii) decrease in forest area and area under
cultivation (iii) the humid agro climatic zones shift southward, rendering areas of the
North increasingly unsustainable for agriculture (iv) decline in crop production (29-71%
19 General Circulation Models (GCMs) are mathematical representations of atmosphere, ocean, ice cap andland surface processes based on physical laws and empirical relations (UNEP, 1998)
20 MAGICC/ SCENGEN software, version 2.4, with input from the IS92A emission scenarios, and threeGeneral Circulation Models (HADCM2, BMRC and GFDL) (MEPD/HCENR, 2003).
21 Synthetic vulnerability scenarios (scenarios comprised of assumption based, incremental temperature andprecipitation changes (MEPD/HCENR, 2003).
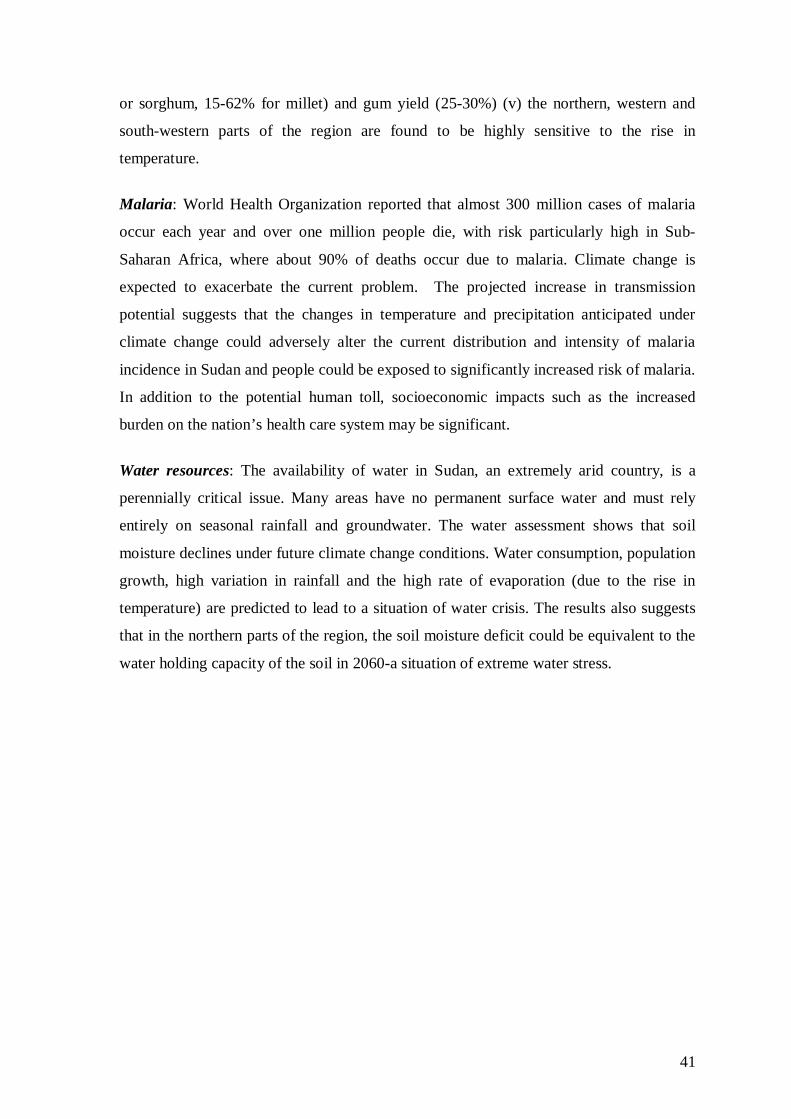
41
or sorghum, 15-62% for millet) and gum yield (25-30%) (v) the northern, western and
south-western parts of the region are found to be highly sensitive to the rise in
temperature.
Malaria: World Health Organization reported that almost 300 million cases of malaria
occur each year and over one million people die, with risk particularly high in Sub-
Saharan Africa, where about 90% of deaths occur due to malaria. Climate change is
expected to exacerbate the current problem. The projected increase in transmission
potential suggests that the changes in temperature and precipitation anticipated under
climate change could adversely alter the current distribution and intensity of malaria
incidence in Sudan and people could be exposed to significantly increased risk of malaria.
In addition to the potential human toll, socioeconomic impacts such as the increased
burden on the nation’s health care system may be significant.
Water resources: The availability of water in Sudan, an extremely arid country, is a
perennially critical issue. Many areas have no permanent surface water and must rely
entirely on seasonal rainfall and groundwater. The water assessment shows that soil
moisture declines under future climate change conditions. Water consumption, population
growth, high variation in rainfall and the high rate of evaporation (due to the rise in
temperature) are predicted to lead to a situation of water crisis. The results also suggests
that in the northern parts of the region, the soil moisture deficit could be equivalent to the
water holding capacity of the soil in 2060-a situation of extreme water stress.

42
3 MATERIAL AND METHODS OF FIELD SURVEY
3.1 Study area
3.1.1 Location
The Sudan lies within the tropical zone between latitudes 30 and 200 North and longitudes
220 and 380 East. The country is bounded on the east by the Red Sea and on other sides by
nine African countries: Eritrea and Ethiopia to the East; Kenya, Uganda and the republic
of the Congo to the South; the Central African Republic and Chad to the West and Libya
and Egypt to the North. It is divided administratively into 26 States. Of which four
administrative States are purposively selected for the present study namely Khartoum,
Kassala, Gezira and the White Nile (FAO, 2000; MEM, 2000; MEPD/HCENR, 2003;
Fig. 5).
3.1.2 Climatic condition
Sudan is divided into five climatic zones i.e. desert, semi-desert, savannah, maritime and
equatorial. It can be described as tropical, varying from desert climate in the North to
regions with semi-desert characteristics, to continental equatorial climate in the South.
Rainfall varies from less than 75 mm in the desert, 75 mm to 300 mm in the semi-desert,
300 mm to 1,500 mm in the woodland savannas and to over 1,500 mm in the montane
vegetation (Fig. 6). The rainfalls ranging from nearly nil in Wadi-Halfa to 167 mm in
Khartoum to 1000 mm in Juba. Sudan’s climate is very hot, every part of the country
experience maximum average temperatures of over 38°C during several months of the
year and many parts experience these temperatures at all times of the year. In the deserts,
winter minimum temperatures as low as 5° C are common at night, while summer
maximum temperatures often exceed 44° C (Fig. 7). The average temperature in the far
North, Wadi-Halfa is about 260C (mean maximum 34.60C and mean minimum 17.70C),
Khartoum has a yearly average temperature of about 300C (mean max. 37.10C and mean
min. 22.40C) and Juba has 27.50C (mean max. 33.90C and mean min. 21.10C) (MEM,
2000; Bilal, 2002; FAO, 2003; MEPD/HCENR, 2003).

43
3.1.3 Demography
In 2004, the United Nations Population Division estimated Sudan’s population at 36.2
million and during the period of 2000-2004, the annual growth rate was 1.93 %. During
the same period the number of births per 1,000 population was 33; the number of deaths,
11. The infant mortality rate per 1,000 live births was estimated at 72. Life expectancy at
Figure 5. Location of the study area (adapted and modified from FNC)22
22 Outline map of the study area obtained from the office of Forests National Corporation (FNC), Sudan.
Study area

44
Eastern
Khartoum
Central
Upper Nile
Bahr el Ghazal
Darfur Kordofan
Northern
LegendPrecipitation Avg.
mm/year
0 - 24
25 - 74
75 - 124
125 - 224
225 - 274
275 - 374
375 - 474
475 - 724
725 - 974
975 - 1474
1475 - 2474
No Data
Figure 7. Annual average temperature of Sudan in 0C (Adapted from FAO, 2005b)
Figure 6. Annual average precipitation of Sudan in mm (Adapted from FAO, 2005b)
Equatoria
LegendPrecipitation Avg.
0C/year
10.5 to 15.0
15.5 to 20.0
20.5 to 30.0
30.5 to 35.0
35.5 to 40.0
> 40.0
No Data
Northern Eastern
Khartoum
Central
Upper Nile
Equatoria
Kordofan
Bahr el Ghazal
Darfur

45
birth was an estimated average of 56 years. In 2004, 44 % of the population was less than
15 years of age; 54 % was between the ages of 15 and 64 years, and those aged 65 years
and older accounted for slightly more than 3 %. In the overall population, there were 1.01
males for every female. The United Nations also estimated the population density in 2004
at 14 persons per square kilometre which seems to a misleading measurement because
half of the population lives on approximately 15 % of the land, and the northern part of
the country is quite thinly populated. Estimates of urbanization ranged from 31 % to 37
%, with the greatest concentration in the greater Khartoum area (LCFRD, 2005; UN,
2005).
3.1.4 Land use pattern
Sudan’s landscape composed of vast plains interrupted by a few widely separated ranges
of hills and mountains. The most important ranges are Jebel Mara in the West, the
Amatong in the extreme south-eastern part of the country and Red Sea Hills. Sudan
encompasses an area of about 250 million ha. Of which arable land (84 mill. ha)
constitutes about one third of the total area of the country but only 21% (17 mill. ha) of
this arable land is actually cultivated. Over 45% (115 mill. ha) of the total area of Sudan
consists of permanent pasture and 25% (65 mill. ha) of forests and wood land (MEM,
2000; MEPD/HCENR, 2003).
3.1.5 Vegetation
According to the environmental climatic conditions, the vegetation in the Sudan
considerably varies from total desert in the North to tropical rainforests in the south. From
the Southern part of the country to about latitude 50C and 100C N there are high wood
lands Savannah which gradually change into low wood lands Savannah stretching
approximately to the 14th parallel and up to Gedarif region. This is followed by semi-
desert and short grasslands including the Southern part of the Red Sea Hills, which
extends to about 150C N where the desert area begins. Generally the vegetation can be
divided into seven principal types which in general follow the isohyets and form
consecutive series from North to South namely, i) Desert ii) Acacia desert scrub iii)
Acacia short grass scrub iv) Acacia tall grass scrub v) Broad-leaved woodland and forests
vi) Forests vii) Swamps and grasslands (Abdel Nour, 1999; Bilal, 2002).

46
3.1.6 Infrastructural development
Buildings in Sudan can be classified into three groups: i) buildings made of clay and
unbaked brick; ii) those made of red brick, and iii) those made of reinforced concrete
cement. Structures made from clay or unbaked bricks also, methods came from the
Turkish era, include other construction materials such as bamboo. These comprise about
35% of buildings in Sudan. Buildings made of red brick comprise most government
buildings, and 50% of all construction which have stylistic influence of both the
Egyptians and British. During the last two decades reinforced concrete construction has
greatly increased as a result of expatriate influences, development and exchange of
information. These buildings comprise 15% of all construction (MEPD/HCENR, 2003).
The second type of construction made of red bricks mainly depends on Sudanese
traditional fired clay brick kiln.
3.1.7 Energy use
Biomass is the primary source of energy in the Sudan and in 1995 its contributed 78.5%
of Sudan’s total energy supply. In that year, 70.5% was in the form of woody fuel and
only 8% was non-woody biomass. The other primary energy source is petroleum
products, which contribute 19.4% of total energy supply. Hydro electricity contributes a
tiny share of total energy supply, at just 2.1%. In 1995, net energy consumption in the
Sudan was about 6.3 million TOE. During that year, total petroleum consumption was
1.35 million TOE. Of this, about 0.63 million TOE (46.25%) of the total was used in
transportation, 0.3 million TOE (21.8%) in the electric sector, 0.17 million TOE (12.4%)
in manufacturing, 0.17 million TOE (13%) in agriculture, 0.05 million TOE (3.9%) in
depots, 12,775 TOE (1%) in construction, 2,980 TOE (0.22%) in mining, and 0.02
million TOE (1.6%) was consumed by households (MEPD/HCENR, 2003). In 1997,
consumption of total biomass in the energy sector of Northern Sudan reached about 14
million m3 consisting of 7.5 million m3 of fuel wood and 6 million m3 of charcoal (Tab.
12).

47
Table 12. Biomass consumption by sector in the Northern Sudan
Sector Fuelwood (m3) Charcoal (m3) Total (m3) %Residential 6,148,380 6,070,207 12,218.587 88.5Industrial 1,050,174 11,673 1,061,847 7.6Commercial 31,636 283,899 315,535 2.3Khalwa23 209,044 - 209,044 1.6Total 7,439,234 6,365,779 13,805,013 100
(Adapted from MEPD/HCENR, 2003)
3.2 Sampling method
The present study was accomplished with the observation of 25 randomly selected brick
making industries from three administrative regions of Sudan namely, Khartoum, Kassala
and Gezira. Of these, 15 were in Khartoum state, which has the major share of total brick
making industries in the Sudan (about 2,000 out of the total of 3,450 brick plants in the
country). From both of the other two states, five representative brick making industries
were surveyed. The total number of brick making industries in Gezira and Kassala is
about 800 and 70, respectively.
3.3 Data collection
Data or information about type of enterprise, working staff’s, sources and type of raw
materials, production capacity, total quantity of fuelwood, dung cake (Gercaf) etc used
for brick burning, marketing channels, general income for year, socio-economic
information and problems related to these etc were collected through either personal
contact of entrepreneurs or interviewing from different level of staff’s of the respective
enterprises. In addition to that, discussion and interview sessions were conducted to
different key persons and experts such as Secretary of brick making owners association,
Khartoum State, scientists and experts from HCENR, FNC, and BRRI, teachers from
Faculty of Forestry, University of Khartoum etc. Different libraries were surveyed for
reviewing literature namely, FNC, BRRI, HCENR, IES (Institute of Environmental
Studies) and Faculty of Forestry, University of Khartoum. Moreover, data were also
collected from three administrative States of Sudan namely White Nile, Kassala and
Gezira to explore future potential of fuelwood plantation in the Sudan. For this,
respective resource persons24 were interviewed after visiting plantation sites.
23 Islamic school where the Holy Quran has been taught24 Rahma A. Rahman Ahmed, Forestry Manager. Kenana Sugar Company, White Nile State, Sudan;

48
3.4 Data processing
3.4.1 Estimation of deforestation
The potential deforestation is typically measured in units of cubic meter (m3) and is often
provided for the commercial portion of biomass only (i.e., round wood). In this case, the
data of mass units (t dm) needs to be converted into cubic meter (m3) and could be
measured as deforestation, m 3 per unit of time (WB, 1998).
Conversion to cubic meters is accomplished by dividing the mass units by the density of
wood, using the default density value 0.65 t dm/m3 (Dixon et al., 1991). To account for
the non-commercial biomass (e.g. branches), an expansion ratio (1.90) should also be
applied (Brown et al., 1989, and ECE/FAO, 1992 as cited in UNEP/OECD/IEA/IPCC,
1997). Finally, the total volume of wood deforested could be enumerated.
3.4.2 Estimation of greenhouse gas emission from biomass fuel (fuelwood and dungcake) burning in the brick making industries of Sudan
The methodological approach was adopted and modified from the procedures outlined by
the Intergovernmental Panel on Climate Change (IPCC) to estimate the rate of
greenhouse gas emission caused by brick making industries in the Sudan (IPCC, 1994;
WB, 1998).
Estimation of CO2 emission from fuelwood and dung cake burning
Estimation of carbon content in biomass
The quantity of biomass (t dm) needs to be converted to units of Carbon (C) to estimate
CO2 impacts. This is accomplished by multiplying by the carbon content of biomass,
which is measured in units of tonnes of carbon per tonne of dry matter (t C/t dm). To
accomplish this, a default value of 0.5 t C/t dm should be used for woody biomass and
0.45 t C/t dm should be applied for non woody biomass.
Isam Abdel Kareem, Assistant Director and Burae Balla, State Director, FNC, Kassala State, Sudan; and
Mohamed Gasmalla Ahmed, Assistant Director, El Hassahisa and Kamlin Forests Circle, Gezira State,Sudan.

49
Estimation of the total carbon released
To estimate the carbon released, the quantity of biomass burnt (t dm) is multiplied by the
fraction of biomass oxidized and the biomass carbon content (t C/t dm). The default value
for the fraction of biomass oxidized is 0.9. To convert t C to t CO2, the ratio of 44 t
CO2/12 t C should be applied.
Total carbon released (t C) = Total biomass burnt (t dm) × Fraction of biomass oxidized
(0.9) × Biomass carbon content (for woody biomass, 0.5 t C/t dm and non-woody
biomass 0.45 t C/ t dm)
Estimation of CO2 emission from the fuelwood burning
Total fuelwood burnt (t dm) × Fraction of biomass oxidized (0.9) × Biomass carbon
content (0.5 t C/t dm) × 44/12 = Total CO2 (t CO2) released from the fuelwood burning.
Estimation of CO2 emission from dung cake burning
Total dung cake burnt (t dm) × Fraction of biomass Oxidized (0.9) × Biomass carbon
content (0.45 t C/t dm) × 44/12 = Total CO2 (t CO2) released from the dung cake burning.
Estimation of non-CO2 trace gases emission from biomass fuel (fuelwood and dung
cake) burning in the brick making industries of Sudan (Delmas, 1993; Lacaux, 1993;
Crutzen and Andreae, 1990; WB, 1998).
CH4 emissions (t CH4) = Carbon released (t C) × Emission ratio (0.012) × 16/12.
CO emissions (t CO) = Carbon released (t C) × Emission ratio (0.060) × 28/12.
N2O emissions (t N2O) = Carbon released (t C) × Emission ratio (0.007) × N/C ratio
(0.01) × 44/28.
NOx emissions (t NOx) = Carbon released (t C) × Emission ratio (0.121) × N/C ratio
(0.01) × 46/14.
NO emissions (t NO) = Carbon released (t C) × Emission ratio (0.121) × N/C ratio (0.01)
× 30/14.
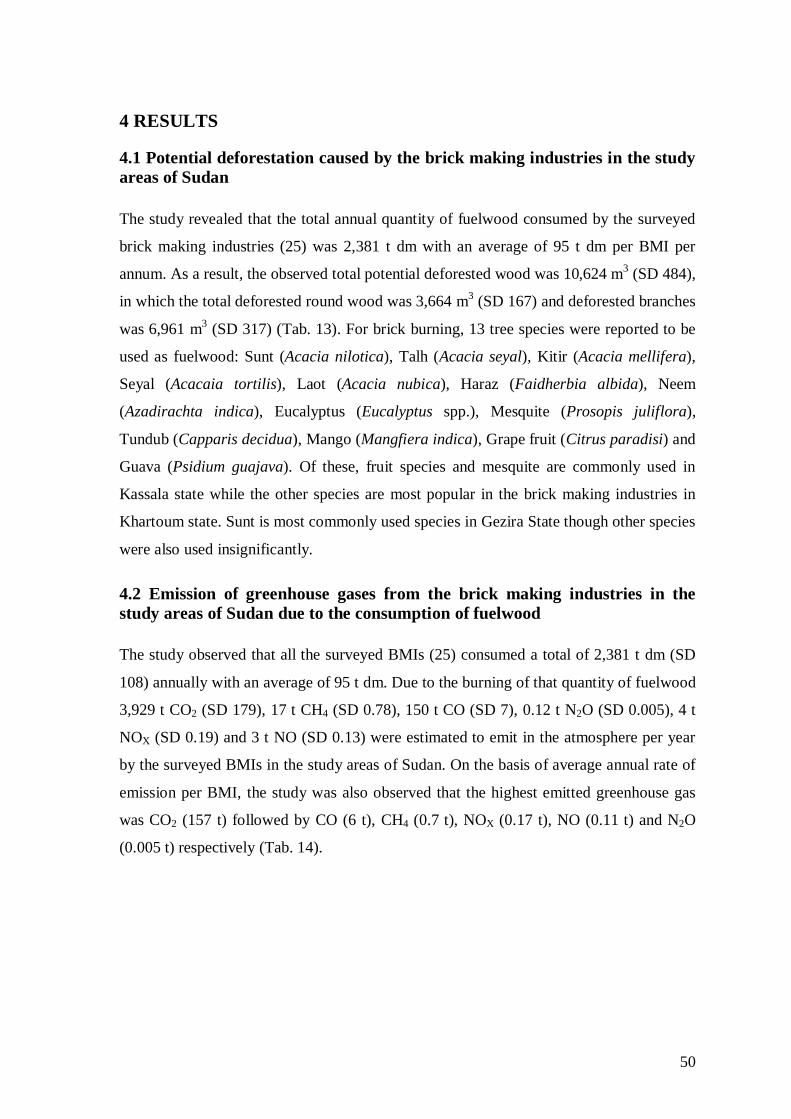
50
4 RESULTS
4.1 Potential deforestation caused by the brick making industries in the studyareas of Sudan
The study revealed that the total annual quantity of fuelwood consumed by the surveyed
brick making industries (25) was 2,381 t dm with an average of 95 t dm per BMI per
annum. As a result, the observed total potential deforested wood was 10,624 m3 (SD 484),
in which the total deforested round wood was 3,664 m3 (SD 167) and deforested branches
was 6,961 m3 (SD 317) (Tab. 13). For brick burning, 13 tree species were reported to be
used as fuelwood: Sunt (Acacia nilotica), Talh (Acacia seyal), Kitir (Acacia mellifera),
Seyal (Acacaia tortilis), Laot (Acacia nubica), Haraz (Faidherbia albida), Neem
(Azadirachta indica), Eucalyptus (Eucalyptus spp.), Mesquite (Prosopis juliflora),
Tundub (Capparis decidua), Mango (Mangfiera indica), Grape fruit (Citrus paradisi) and
Guava (Psidium guajava). Of these, fruit species and mesquite are commonly used in
Kassala state while the other species are most popular in the brick making industries in
Khartoum state. Sunt is most commonly used species in Gezira State though other species
were also used insignificantly.
4.2 Emission of greenhouse gases from the brick making industries in thestudy areas of Sudan due to the consumption of fuelwood
The study observed that all the surveyed BMIs (25) consumed a total of 2,381 t dm (SD
108) annually with an average of 95 t dm. Due to the burning of that quantity of fuelwood
3,929 t CO2 (SD 179), 17 t CH4 (SD 0.78), 150 t CO (SD 7), 0.12 t N2O (SD 0.005), 4 t
NOX (SD 0.19) and 3 t NO (SD 0.13) were estimated to emit in the atmosphere per year
by the surveyed BMIs in the study areas of Sudan. On the basis of average annual rate of
emission per BMI, the study was also observed that the highest emitted greenhouse gas
was CO2 (157 t) followed by CO (6 t), CH4 (0.7 t), NOX (0.17 t), NO (0.11 t) and N2O
(0.005 t) respectively (Tab. 14).

51
Table 13. Potential annual deforestation caused by the brick making industries (25 units), in the study areas of Sudan due to the consumption offuelwood
Name of theenterprises*
Total brick production/year (in "000")
Fuelwood consumptionin kg /1000 bricks
Fuelwood consumption/year (t dm )
Deforested roundwood (m3)
DeforestedBranches (m3)
Total deforestedwood (m3)
SK1 1120 50.67A 56.75 87.31 165.89 253.19SK2 1500 50.67 76.01 116.93 222.17 339.10SK3 1000 50.67 50.67 77.95 148.11 226.07SK4 1035 50.67 52.44 80.68 153.30 233.98SK5 1000 50.67 50.67 77.95 148.11 226.07EK1 1500 50.67 76.01 116.93 222.17 339.10EK2 1200 50.67 60.80 93.54 177.73 271.28EK3 720 50.67 36.48 56.13 106.64 162.77EK4 1135 50.67 57.51 88.48 168.11 256.59EK5 900 50.67 45.60 70.16 133.30 203.46KK1 800 50.67 40.54 62.36 118.49 180.85KK2 500 50.67 25.34 38.98 74.06 113.03KK3 600 50.67 30.40 46.77 88.87 135.64HK1 800 50.67 40.54 62.36 118.49 180.85
Kha
rtoum
Sta
te
HK2 1000 50.67 50.67 77.95 148.11 226.07K1 450 533B 239.85 369.00 701.10 1070.10K2 660 533 351.78 541.20 1028.28 1569.48K3 480 533 255.84 393.60 747.84 1141.44K4 500 533 266.50 410.00 779.00 1189.00K
assa
laSt
ate
K5 720 533 383.76 590.40 1121.76 1712.16HG1 360 39C 14.04 21.60 41.04 62.64HG2 880 39 34.32 52.80 100.32 153.12HG3 750 39 29.25 45.00 85.50 130.50HG4 750 39 29.25 45.00 85.50 130.50
Gez
ira S
tate
HG5 675 39 26.33 40.50 76.95 117.45Total 21,035 3,620.05 2,381.34 3,663.60 6,960.83 10,624.43Average 841.4 144.802 95.25 146.54 278.43 424.98SD 302.42 198.16 108.49 166.90 317.12 484.02
*SK= Shambat, Khartoum; EK=Elgeref, Khartoum; KK= Koko, Bahri, Khartoum; HK= Halfia, Bahri, Khartoum; K= Kassala and HG= Hasahisa, Gezira.A, B, C Data obtained from (Hamid, 1994)
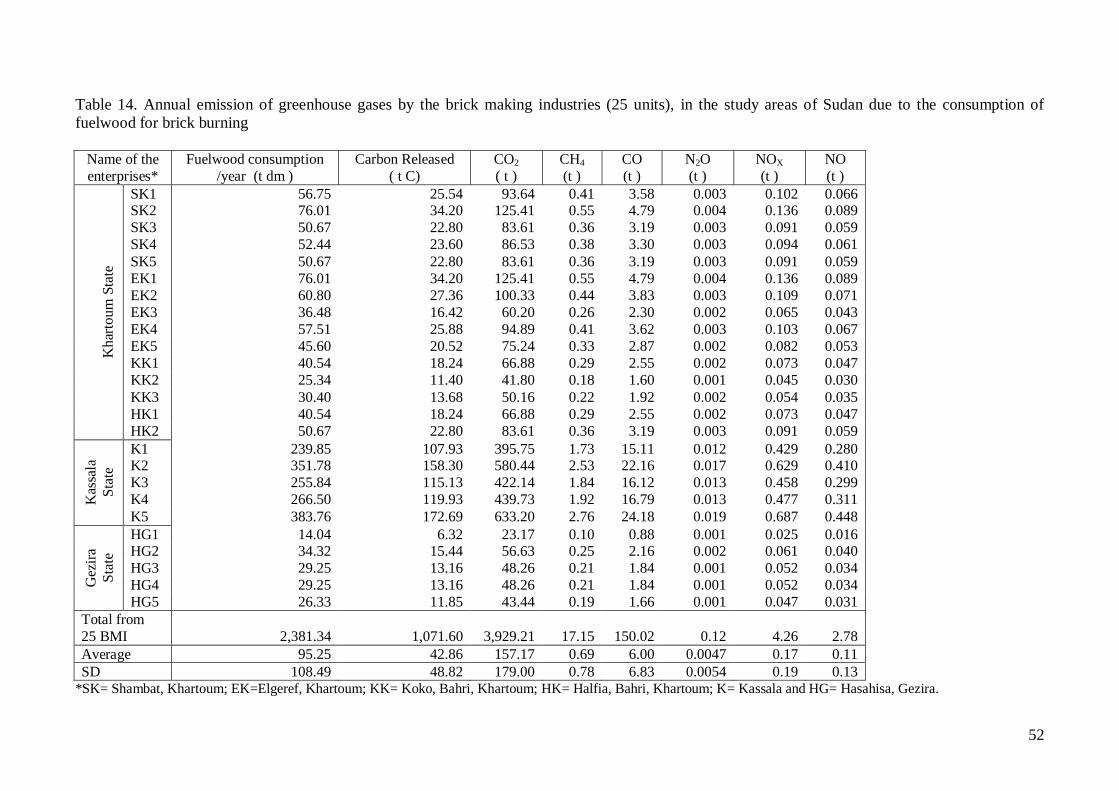
52
Table 14. Annual emission of greenhouse gases by the brick making industries (25 units), in the study areas of Sudan due to the consumption offuelwood for brick burning
Name of theenterprises*
Fuelwood consumption/year (t dm )
Carbon Released( t C)
CO2( t )
CH4(t )
CO(t )
N2O(t )
NOX(t )
NO(t )
SK1 56.75 25.54 93.64 0.41 3.58 0.003 0.102 0.066SK2 76.01 34.20 125.41 0.55 4.79 0.004 0.136 0.089SK3 50.67 22.80 83.61 0.36 3.19 0.003 0.091 0.059SK4 52.44 23.60 86.53 0.38 3.30 0.003 0.094 0.061SK5 50.67 22.80 83.61 0.36 3.19 0.003 0.091 0.059EK1 76.01 34.20 125.41 0.55 4.79 0.004 0.136 0.089EK2 60.80 27.36 100.33 0.44 3.83 0.003 0.109 0.071EK3 36.48 16.42 60.20 0.26 2.30 0.002 0.065 0.043EK4 57.51 25.88 94.89 0.41 3.62 0.003 0.103 0.067EK5 45.60 20.52 75.24 0.33 2.87 0.002 0.082 0.053KK1 40.54 18.24 66.88 0.29 2.55 0.002 0.073 0.047KK2 25.34 11.40 41.80 0.18 1.60 0.001 0.045 0.030KK3 30.40 13.68 50.16 0.22 1.92 0.002 0.054 0.035HK1 40.54 18.24 66.88 0.29 2.55 0.002 0.073 0.047
Kha
rtoum
Sta
te
HK2 50.67 22.80 83.61 0.36 3.19 0.003 0.091 0.059K1 239.85 107.93 395.75 1.73 15.11 0.012 0.429 0.280K2 351.78 158.30 580.44 2.53 22.16 0.017 0.629 0.410K3 255.84 115.13 422.14 1.84 16.12 0.013 0.458 0.299K4 266.50 119.93 439.73 1.92 16.79 0.013 0.477 0.311K
assa
laSt
ate
K5 383.76 172.69 633.20 2.76 24.18 0.019 0.687 0.448HG1 14.04 6.32 23.17 0.10 0.88 0.001 0.025 0.016HG2 34.32 15.44 56.63 0.25 2.16 0.002 0.061 0.040HG3 29.25 13.16 48.26 0.21 1.84 0.001 0.052 0.034HG4 29.25 13.16 48.26 0.21 1.84 0.001 0.052 0.034G
ezira
Stat
e
HG5 26.33 11.85 43.44 0.19 1.66 0.001 0.047 0.031Total from25 BMI 2,381.34 1,071.60 3,929.21 17.15 150.02 0.12 4.26 2.78Average 95.25 42.86 157.17 0.69 6.00 0.0047 0.17 0.11SD 108.49 48.82 179.00 0.78 6.83 0.0054 0.19 0.13
*SK= Shambat, Khartoum; EK=Elgeref, Khartoum; KK= Koko, Bahri, Khartoum; HK= Halfia, Bahri, Khartoum; K= Kassala and HG= Hasahisa, Gezira.

53
4.3 Emission of greenhouse gases from the brick making industries ofKhartoum State in the Sudan due to the consumption of dung cake
The study revealed that dung cake is only used in the brick burning industries of
Khartoum state and it was estimated that total 608 t dung cake with an average of 41 t
(SD 9) was consumed by 15 BMIs of Khartoum State. Due to the burning of that quantity
of dung cake 903 t CO2 (SD 13.45), 4 t CH4 (0.06), 34 t CO (SD 0.5), 0.03 t N2O (SD
0.0004), 1 t NOX (SD 0.01) and 0.64 t NO (SD 0.01) were estimated to emit in the
atmosphere per year by the surveyed BMIs (15 units) in the study areas of Khartoum,
Sudan while the annual total carbon released in the atmosphere was 246 t. On the basis of
average annual rate of emission per BMI, the study was also observed that the highest
emitted greenhouse gas was CO2 (60 t) followed by CO (2.3 t), CH4 (0.26 t), NOX (0.07
t), NO (0.04 t) and N2O (0.002 t) respectively (Tab. 15).
4.4 Emission of greenhouse gases from the surveyed brick making industriesin the Sudan due to the consumption of biomass fuels
The study observed that a total of 2,990 t biomass fuel (fuelwood and dung cake)
consumed by the surveyed BMIs (25 units) annually for brick burning. By considering all
categories of biomass fuels (fuelwood and dung cake) it was estimated that the total
annual emissions of greenhouse gases were 4,832 t CO2, 21 t CH4, 184 t CO, 0.15 t N20, 5
t NOX and 3.5 t NO while the total carbon released in the atmosphere was 1,318 t.
Altogether, the total annual greenhouse gas emission from biomass fuel burning was
5,046 t; of which 4,104 t from fuelwood and 943 t from dung cake burning (Tab.16). It is
also observed that emission from dung cake is considerably low as it is only used in the
BMIs of Khartoum State and dung cake consumption for brick burning is also relatively
small in quantity.
4.5 Prediction of maximum potential deforestation caused by the brickmaking industries in the Sudan
The Brick Making Owners’ Association in Khartoum State provided information2 that
there are about 3,450 brick making industries in the Sudan. Based on the average
fuelwood consumption in the brick making industries of Sudan, the study estimated that
the total amount of harvested wood for 3,450 brick making industries contributing to
deforestation annually would be 1,467,000 m3, of which amount stem round wood and
branch wood would amount to 506,000 m3 and 961,000 m3 respectively (Tab.17).

54
Table 15. Annual emission of greenhouse gases by the brick making industries (15 units) of Khartoum in the Sudan due to the consumption of dungcake for brick burning
Name of theenterprises*
Dung cake consumption/year (t )
Carbon Released( t C)
CO2( t )
CH4(t )
CO(t )
N2O(t )
NOx(t )
NO(t )
SK1 40 16.20 59.40 0.26 2.27 0.001782 0.06 0.04SK2 60 24.30 89.10 0.39 3.40 0.002673 0.10 0.06SK3 40 16.20 59.40 0.26 2.27 0.001782 0.06 0.04SK4 36 14.58 53.46 0.23 2.04 0.001604 0.06 0.04SK5 40 16.20 59.40 0.26 2.27 0.001782 0.06 0.04EK1 60 24.30 89.10 0.39 3.40 0.002673 0.10 0.06EK2 40 16.20 59.40 0.26 2.27 0.001782 0.06 0.04EK3 32 12.96 47.52 0.21 1.81 0.001426 0.05 0.03EK4 48 19.44 71.28 0.31 2.72 0.002138 0.08 0.05EK5 36 14.58 53.46 0.23 2.04 0.001604 0.06 0.04KK1 32 12.96 47.52 0.21 1.81 0.001426 0.05 0.03KK2 40 16.20 59.40 0.26 2.27 0.001782 0.06 0.04KK3 32 12.96 47.52 0.21 1.81 0.001426 0.05 0.03HK1 32 12.96 47.52 0.21 1.81 0.001426 0.05 0.03
Kha
rtoum
Sta
te
HK2 40 16.20 59.40 0.26 2.27 0.001782 0.06 0.04Total from15 BMI 608 246.24 902.88 3.94 34.47 0.0271 0.98 0.64Average 40.53 16.42 60.19 0.26 2.30 0.0018 0.07 0.04SD 9.05 3.67 13.45 0.06 0.51 0.0004 0.01 0.01
*SK= Shambat, Khartoum; EK=Elgeref, Khartoum; KK= Koko, Bahri, Khartoum; HK= Halfia, Bahri, Khartoum.
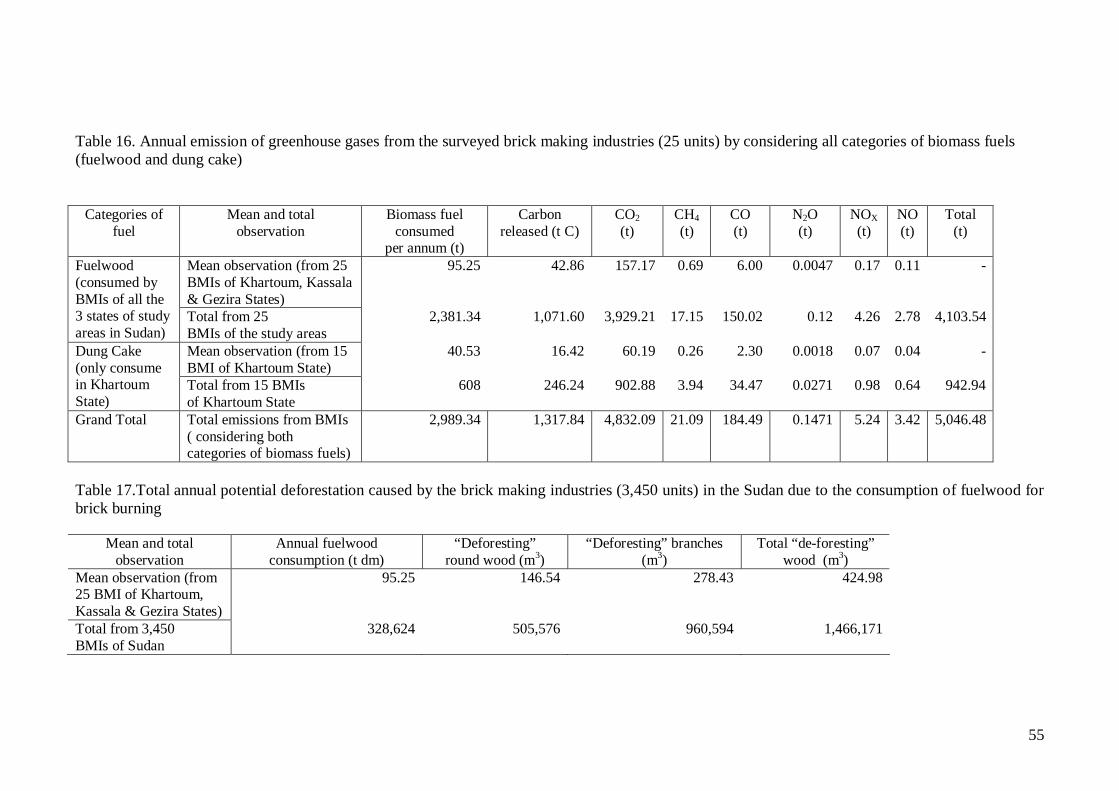
55
Table 16. Annual emission of greenhouse gases from the surveyed brick making industries (25 units) by considering all categories of biomass fuels(fuelwood and dung cake)
Categories offuel
Mean and totalobservation
Biomass fuelconsumed
per annum (t)
Carbonreleased (t C)
CO2(t)
CH4(t)
CO(t)
N2O(t)
NOX(t)
NO(t)
Total(t)
Mean observation (from 25BMIs of Khartoum, Kassala& Gezira States)
95.25 42.86 157.17 0.69 6.00 0.0047 0.17 0.11 -Fuelwood(consumed byBMIs of all the3 states of studyareas in Sudan)
Total from 25BMIs of the study areas
2,381.34 1,071.60 3,929.21 17.15 150.02 0.12 4.26 2.78 4,103.54
Mean observation (from 15BMI of Khartoum State)
40.53 16.42 60.19 0.26 2.30 0.0018 0.07 0.04 -Dung Cake(only consumein KhartoumState)
Total from 15 BMIsof Khartoum State
608 246.24 902.88 3.94 34.47 0.0271 0.98 0.64 942.94
Grand Total Total emissions from BMIs( considering bothcategories of biomass fuels)
2,989.34 1,317.84 4,832.09 21.09 184.49 0.1471 5.24 3.42 5,046.48
Table 17.Total annual potential deforestation caused by the brick making industries (3,450 units) in the Sudan due to the consumption of fuelwood forbrick burning
Mean and totalobservation
Annual fuelwoodconsumption (t dm)
“Deforesting”round wood (m3)
“Deforesting” branches(m3)
Total “de-foresting”wood (m3)
Mean observation (from25 BMI of Khartoum,Kassala & Gezira States)
95.25 146.54 278.43 424.98
Total from 3,450BMIs of Sudan
328,624 505,576 960,594 1,466,171

56
4.6 Prediction of annual greenhouse gas emission from the brick makingIndustries in the Sudan due to the consumption of biomass fuels
The present study suggests that the annual quantity of fuelwood required for the 3,450
brick making industries in the Sudan would be 328,600 t dry matter. Due to the burning
of that quantity fuelwood, 542,200 t CO2, 2,366 t CH4, 20,700 t CO, 16 t N2O, 588 t NOX
and 383 t NO would be emitted per annum, while the total amount of carbon released into
the atmosphere would be annually 147,900 t (Tab. 18).
It was also estimated that the annually required quantity of dung cake (here assumed as
sustainably used, carbon-neutral fuel) for the approximately 2,000 brick making
industries that use this fuel in the Sudan would be 81,100 t (this biomass fuel is only used
in Khartoum State). Consequently, 120,400 t CO2, 525 t CH4, 4,600 t CO, 4 t N2O, 130 t
NOX and 85 t NO were estimated to be emitted annually, while the total amount of carbon
released from this fuel source into the atmosphere annually would be 32,800 t (Tab. 18).
By considering both two categories of biomass fuels (fuelwood and dung cake) together,
the total emissions from the 3,450 brick making industries in the Sudan would be 662,600
t CO2, 2,900 t CH4, 25,300 t CO, 20 t N2O, 720 t NOX and 470 t NO per annum, while the
total amount of carbon thus released would be 180,700 t (Tab. 18).
4.7 Employment in the brick making industries of Sudan
The number of workers in any brick making industry largely depends on the numbers of
tables per production unit, number of workers per table and the number of workers
required to fire the kiln. The number of tables per production unit used to vary 2-4 and the
number of workers per table is 2 (Appendix 2, plate 3). The number of workers for kiln
operations (loading, stacking, firing and unloading) ranges between 2 and 6. Moreover,
workers are also employed as cleaner (1 person), mechanic for water pump (1 person as
temporary basis), guard (1 person) and another one person for administrative purposes.
The total number of workers per production unit is about 10 (2×2+2+4) to18 (4×2+6+4).
As a result, we may predict that the total number of workers employed in the brick
making industries of Sudan is about 34,500 to 62,100, considering the total number of
brick making industries in the Sudan is 3,450. As the size of all brick making industries
are not same so roughly number of workers employed in the brick making of industries in
the Sudan would be 50,000, of this half of workers employed in Khartoum state.

57
Table 18. Total annual emission of greenhouse gases from the brick making industries (3,450) in the Sudan due to burning of biomass fuels (fuelwoodand dung cake)
Categories offuel
Mean and total observation Biomass fuelconsumptiont dm / annum
Carbon released(t C)
CO2(t)
CH4(t)
CO(t)
N2O(t)
NOX(t)
NO(t)
Mean observation (from 25 BMIsof Khartoum, Kassala & GeziraStates)
95.25 42.86 157.17 0.69 6.00 0.0047 0.17 0.11Fuelwood(consumed byBMIs of all the 3states of studyareas in Sudan)
Total from 3,450BMI of Sudan
328,624 147,881 542,230 2,366 20,703 16.27 587.93 383.43
Mean observation (from 15 BMIof Khartoum State)
40.53 16.42 60.19 0.26 2.30 0.0018 0.07 0.04Dung Cake(only consumedby BMIs ofKhartoum State)
Total from 2000 BMI ofKhartoum State
81,066 32,832 120,384 525.31 4,596.48 3.61 130.53 85.13
Grand Total Total emissions from 3,450 BMIs(considering both categories ofbiomass fuels)
409,690 180,713 662,614 2,891 25,299 19.88 718 468

58
4.8 Potentials of fuelwood plantation in the Sudan
4.8.1 Irrigated plantation by Kenana Sugar Company Ltd.24
Background
The gigantic Kenana Sugar Company (KSC) Ltd. started late seventies of last century.
Land preparation to grow sugarcane removed the natural vegetation over the 160,000
feddans25, which is the gross area of the scheme. The forestry project started 1993/94 to
compensate the vegetation removed. Forest plantations are established within the irrigated
KSC Ltd. Estate near Rabak on the eastern bank of the White Nile, about 270 Km from
Khartoum. KSC Ltd. Site falls in the Jabalian province of the White Nile state (Latitude
130 N, Longitude 330 E and altitude of 410 m). The forest sites are scattered in and
around Kenana’s six areas of sugarcane field. These sites are about 2-30 km from Kenana
Township.
Objectives of irrigated plantation:
1. To compensate the natural vegetation, which has been removed to grow sugar
cane.
2. To maximize land utility by cultivating lands not suitable for sugar cane.
3. To utilize the drainage water of sugar cane crop.
4. To avail wind break around sugar cane fields to minimize the effect of the
desiccating winds.
5. To preserve the microclimate.
6. To serve amenity purposes.
7. To avail fuel wood for domestic use.
8. To avail building poles for local community.
9. To avail grazing area for domestic animals.
Plantation activities and production
A total of 7,000 feddans were planted until 2000/01 started from 1993/94. Of which,
3,400 feddans were planted by Eucalyptus sp. (Plate 12), followed by A. senegal (1,700
feddans), A. nilotica (1,450 feddans; Plate 13), A. seyal (550 feddans) and others (70
feddans) respectively (Tab. 19). Among all the species, A. nilotica was planted for
fuelwood production. Other uses of the plantation project were building poles (Eucalyptus
25 1 feddan = 0.42 ha or 4,200 m2; 1 hectare = 2.38 feddans

59
sp.), charcoal (A. seyal) and gum production (A. senegal). The study also found out
during the period of 1999/2000 to 2003/04 from Eucalyptus camaldulensis species about
3,400 m3 of fuelwood and 970,000 no. of poles collected and for these, about 207,000 no.
of trees were harvested during the same period (Tab.20).
Table 19. Plantation areas (in feddan) and tree species over years
TreeSpecies
SpecificUse
93/94 94/95 95/96 96/97 97/98 98/99 99/00 00/01 Total
Eucalyptssp.
Building poles& fuelwood
475 470 646 500 225 317 588 211 3432
A. nilotica Fuelwood 400 230 420 300 - - 84 08 1442A. seyal Charcoal 150 100 150 150 - - 15 - 565A senegal Gum
production90 330 300 300 - 185 479 - 1684
Others -- 20 - 16 08 - 10 15 - 69Total 1,135 1,130 1,532 1,258 225 512 1,181 219 7,192
Table 20. Production of Building Poles and fuelwood from Eucalyptus camaldulensisover years
First year of fuelwood production from A. nilotica started from 2004/05. The number of
trees harvested and fuel wood production during this year were 8,853 and 2,415 m3
respectively. During the same year charcoal and fuel wood production, for the first time,
from A. seyal were 150 sac (1 sac = 50 kg) and 483 m3 respectively. Generally, for the
production of 3 sacs charcoal 1 m3 wood is required and 10 years old five A. seyal trees
can provide 1 m3 wood. In 1998, after four years of A. senegal plantation, the first tapping
was done in about 21,000 trees for gum production but the production was only 20 kg. As
a result KSC administration organized a workshop in 2001 (July 22-25) to identify the
probable solutions of the low production of gum from A. senegal. All probable causes
were patiently examined during the workshop but no definite answer to the problem could
be reached. Eventually, KSC administration decided to replace A. senegal plantation by
A. nilotica in near future.
Productionyear
Area harvestedin feddans
No of treesHarvested
No of poles Fuelwood(m3)
1999/2000 116 46,765 80,846 2472000/01 90 48,765 82,169 1322001/02 438 - 183,195 8892002/03 498.5 70,749 296,096 7412003/04 296 41,503 327,562 1,350Total 1,438.5 207,782 969,868 3,359

60
Plate 12. Irrigated Eucalyptus plantation by KSC at White Nile State
Plate 13: Irrigated Sunt (A. nilotica) plantation by KSC at White Nile State

61
Constraints facing for future development
• KSC project depends on marginal lands that are either high lands or away from
the water sources, so highly expensive power water pumps are required or big size
lakes to be constructed to serve as reservoirs with control gates.
• Irrigated water sometime is not sufficient for cane crop requirements mainly
during hot summer months (May-June) resulting in long dry periods on forestry
plantations.
Bases on the above the company expects local and international assistance in training and
technology sphere.
Expected future activities
• Expansion in the plantations to reach 20,000 feddans.
• Establishment of small scale industries like fibre board and particle board.
• Establishment of seed orchards for genetic improvement and conservation.
Observation
The project was reasonably successful in achieving some of the set goals. Beside the
environmental benefits the followings were achieved.
• Establishment of more than 7,000 feddans of forest tree species
• Establishment of community plots.
• Production of wood poles and other woody materials for the local markets.
• Provision of grazing lands for domestic animals (under the trees).
• Use of all the marginal land within Kenana estate.
• Efficient use of the drainage water from the sugar cane fields.
4.8.2 Irrigated plantation by Forests National Corporation (FNC) at Kassala State24
Background
Kassala state is located between longitude 35055/ and 37055/ E, latitude 14015/ and 17015/
N and about 600 Km away from Khartoum. The area of the state is 4,282 km2. The state
is divided into four circles for administrative purposes. The capital of the state is Kassala.
Rainfall is between 100-400 mm per annum. Dominant species are: A. mellifera, A. seyal,

62
Prosopis chilensis (dominant in northern part). Area of reserved forest of this state is
220,059 feddans, which is 2.2% of the total land area and the total area of plantation
forest is 5,082 feddans. Irrigated plantation with agro forestry system has been established
at Kassala circle in 1992 under the management of Kassala FNC.
Area of Irrigated Plantation
Until 2004, the size of the total irrigated plantation was 172 feddans. Of which, 50
feddans on the Eastern bank and 42 feddans on the Northern bank of the river Gash and
80 feddans in New Halfa. The proposed area of irrigated plantation in 2005 is 270
feddans (100 feddans in New Halfa, 90 feddans on the Eastern bank and 80 feddans on
the Western bank of the river Gash).
Objectives of Irrigated Plantation
• To meet the local demand for building poles and firewood etc.
• To protect the soil erosion along the banks of river Gash.
• To preserve microclimate and to minimize desert creeping and desertification.
• Avail landless farmers to grow/produce agricultural crops as agro forestry
(Taungya) system.
Management system and production
For sustainable management of irrigated plantation (Plate 14), initially FNC staff selects
the landless farmers of nearby locality of the plantation site and during the selection
process, preference used to be given who are well known to Taungya system. 5-10
feddans of land area are allocated per family under the bilateral agreement between FNC
and selected local farmers. Farmers have to prepare the land both for forest and
agricultural crops and they are also responsible for rearing the plants. FNC only provides
seedlings of forest crops and most of the cases seedlings are planted by FNC staff.
Extension services are also provided by FNC staff. Farmers used to get benefits from
agri-crops as well as from fuelwood collection in case of instant demand. Prescribed tree
species for Taungya system were Eucalyptus camaldulensis and E. microthica while
common agri-crops were onion, okra tomato, and green chilli. Spacing of tree crops: 2m
(within the lines) × 3m (between the lines).

63
Plate 14. Small scale pump irrigated Eucalyptus plantation by FNC at KassalaState
In 2004, 67.5 feddans of Eucalyptus plantation were harvested and number of harvested
poles was 30,697. There was no fuelwood production after harvesting of first crop and
fuel wood production is only possible after second and third crop due to the result of
coppicing and sprouting.
Constraints for irrigated plantation
• Lack of funding
• Lack of seedlings and or nursery for plantation
• Lack of vehicle to follow up/monitor of forest plantation and transport of forest
produce.
Expected future activities:
• Expansion in the plantation to reach up to 500 feddans• Expansion of the production of seedlings from the nursery by establishing new
nursery.

64
4.8.3 Sunt (A. nilotica) reserve forest managed by FNC at Talbab, El Hassahisa,Gezira State24
Background
Talbab Sunt (A. nilotica) reserve forest (latitude 14053/ N and longitude 33013/ E) is
located at Western bank of Blue Nile near Talbab village and about 15 Km away from El
Hassahisa Town of Gezira State. Talbab sunt forest was declared as reserve forest in
1939. The area of this reserve forest is 375 feddan, of which 306 feddan is the main
reserve and the rest 69 feddan is considered as an extension.
Objectives of this reserve forest
1. Fuelwood production especially for the brick making industries
2. Provide grazing facility for the animals of nearby locality
Management system and production
Talbab Sunt reserve forest (Plate 15) is divided into 3 compartments and followed by
clear felling with artificial regeneration by seed. The rotation is 20 yrs for the production
of fuelwood. After flooding season seeds are spread on the basin of Blue Nile. During
normal flooding season untreated seeds are used but in case of low flooding, treated (by
H2SO4) seeds are used. Pit method is followed for seed sowing and depending on the seed
quality and germination capacity of seeds usually 2-4 seeds are sown on each pit. During
the rotation period, first thinning is carried out between 4 to 6 years of old plantation,
maintaining 2m×2 m spacing, the second one is on 6 to 10 yrs (3m×3m spacing) and the
final is on 10 to 15 yrs (4m×4m spacing). The final harvesting usually carried out
between 15 to 20 yrs old plantation.
In 2004, a total of 1,800 m3 fuelwood produced, of which 259 m3 of fuelwood harvested
from second thinning operation of first compartment and the rest 1,541 m3 came from
second compartment after final harvesting. Compartment number three is planned to be
harvested in 2006 (Tab. 21).

65
Table 21. Silvicultural operation and production
Compartmentnumber
Date ofplantation
ObservationThinning/harvesting
Area thinned /harvested (in feddan)
FuelwoodProduction (m3)
1 1989 Second thinning (2004) 75 2592 1984/85 Final Harvesting (2004) 75 1,5413 1986 Final harvesting (2006) -- --
Plate 15. Sustainable Sunt (A. nilotica) plantation by FNC at Talbab ReserveForest, Gezira State.
Management constraints
• Dependency on flood and rainfall
• Illicit felling by the local people
• Lac of forest guard (only one person for three compartment)
• Encroachment of the forest land by the local people
• Illegal grazing during establishment of young plantation
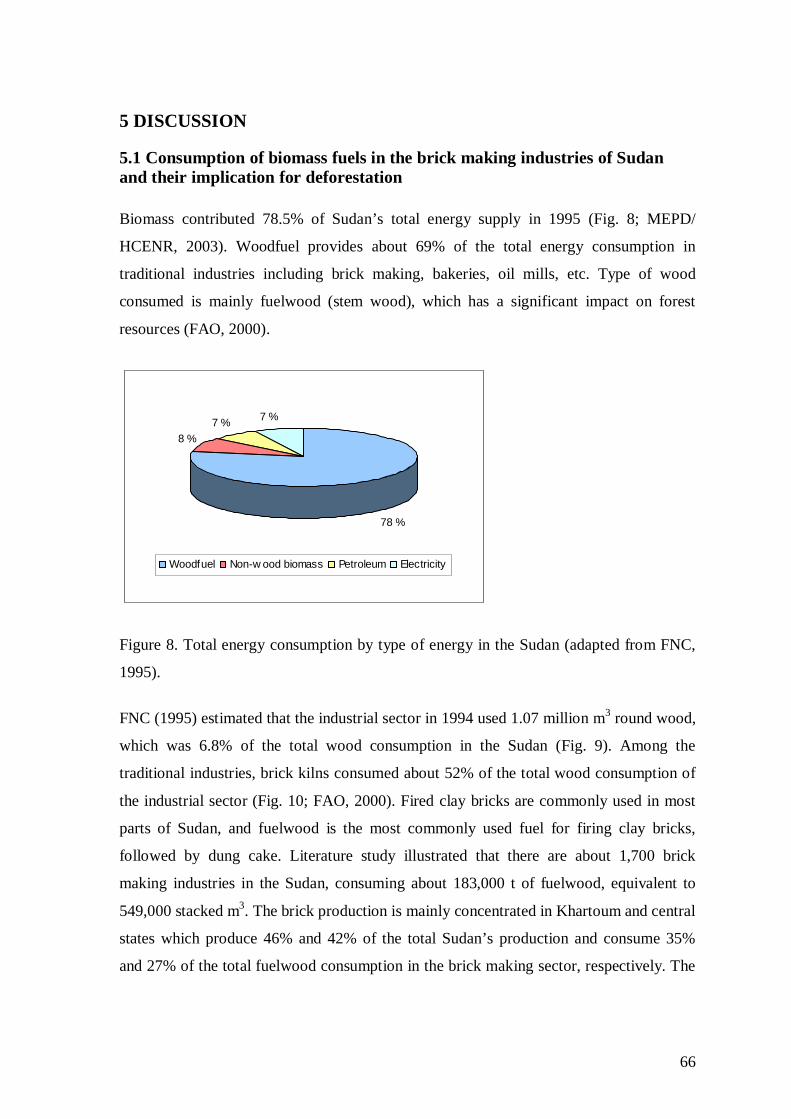
66
5 DISCUSSION
5.1 Consumption of biomass fuels in the brick making industries of Sudanand their implication for deforestation
Biomass contributed 78.5% of Sudan’s total energy supply in 1995 (Fig. 8; MEPD/
HCENR, 2003). Woodfuel provides about 69% of the total energy consumption in
traditional industries including brick making, bakeries, oil mills, etc. Type of wood
consumed is mainly fuelwood (stem wood), which has a significant impact on forest
resources (FAO, 2000).
78 %
8 %7 % 7 %
Woodfuel Non-w ood biomass Petroleum Electricity
Figure 8. Total energy consumption by type of energy in the Sudan (adapted from FNC,
1995).
FNC (1995) estimated that the industrial sector in 1994 used 1.07 million m3 round wood,
which was 6.8% of the total wood consumption in the Sudan (Fig. 9). Among the
traditional industries, brick kilns consumed about 52% of the total wood consumption of
the industrial sector (Fig. 10; FAO, 2000). Fired clay bricks are commonly used in most
parts of Sudan, and fuelwood is the most commonly used fuel for firing clay bricks,
followed by dung cake. Literature study illustrated that there are about 1,700 brick
making industries in the Sudan, consuming about 183,000 t of fuelwood, equivalent to
549,000 stacked m3. The brick production is mainly concentrated in Khartoum and central
states which produce 46% and 42% of the total Sudan’s production and consume 35%
and 27% of the total fuelwood consumption in the brick making sector, respectively. The

67
consumption of wood per 1,000 bricks varies widely from 0.12 to 1.6 m3 (Hamid, 1994;
FNC, 1995).
89 %
7 % 3 %1 %
Household Industrial
Commercial & Services Quranic Schools (Khalw as)
Figure 9: Total wood consumption by sectors (adapted from FNC, 1995).
52.30 %
7.90 %36.60 %
3.00 % 0.20 %
Bakery Brick Vegetable Oil Lime Curing Others
Figure 10: Fuel wood consumption in industrial sector (adapted from FNC, 1995).
The present study revealed that there are about 2,000 brick making industries in
Khartoum state and the total number of brick making industries in the Sudan is
approximately 3,450. Based on the consumption of fuelwood, the study estimated that the
total amount of annual harvested wood, typically considered as potential deforestation, by
the all brick making industries of Sudan (3,450 units) would be 1,467,000 m3, of which
506,000 m3 is round wood and the rest 961,000 m3 is branch wood (Tab. 17).
The study also found that dung cake (Gercaf) is also used as fuel for brick burning only in
Khartoum state, and the annual consumption of dung cake per industry varies widely,
ranging between 32 and 60 t (with an average 40.5 t) depending on the size of the plant,
annual production and availability of dung cake for brick burning. The total amount of
68
annually consumed dung cake by the brick making industries of Khartoum (2,000 units)
would be 81,000 t (Tab. 15).
5.2 Brick making industries in the Sudan-means of greenhouse gas emission
The primary anthropogenic (human-induced) greenhouse gases include carbon dioxide
(CO2), methane (CH4), nitrous oxide (N2O), chlorofluorocarbons (CFCS), ozone (O3),
carbon monoxide (CO), non-methane volatile organic compound (NMVOC) and nitrogen
oxides (NOX) (WB, 1998). Literature review indicated that the total emission of
greenhouse gases in the Sudan for 1995 amounted to 25,800 Gg. CO2 is the main
greenhouse gas which constituted more than 75% (20,100 Gg) of the total greenhouse gas
emission, followed by CO (3,300 Gg), CH4 (2,000 Gg), and small amounts of other gases
such as NMVOC, NOx, N2O. Biomass energy was estimated to emit about 21,900 Gg of
CO2, constituting more than 80% of the total CO2 emitted in the energy sector.
Agriculture was dominant in CH4 emissions, estimated at 1,700 Gg, which is more than
86% of the total CH4 emissions in the Sudan (MEPD & HCENR, 2003).
FAO (1999) has estimated the rate of greenhouse gas emissions from fuelwood burning
both for Africa and the Sudan for 1996. According to this estimation, for the whole
continent of Africa, the total amounts of 597,553,000 t CO2, 1,635,000 t CH4, 27,252,000
t CO, 2180 t N2O, 545,000 t NOX and 3,270,000 t NMVOC were emitted. Sudan’s
contribution to these emissions was 8,814,000 t CO2, 24,100 t CH4, 402,000 t CO, 300 t
N2O, 8,000 t NOX, and 48,200 t NMVOC.
The present study suggests that the annual quantity of fuelwood required for the 3,450
brick making industries in the Sudan would be 328,600 t dry matter. Due to the burning
of that quantity fuelwood, 542,200 t CO2, 2,366 t CH4, 20,700 t CO, 16 t N2O, 588 t NOX
and 383 t NO would be emitted per annum. By considering both two categories of
biomass fuels (fuelwood and dung cake) together which are currently used in the brick
making industries in the Sudan, the total emissions from the 3,450 brick making
industries in the Sudan would be 662,600 t CO2, 2,900 t CH4, 25,300 t CO, 20 t N2O, 720
t NOX and 470 t NO per annum, while the total amount of carbon thus released would be
180,700 t (Tab. 18).
69
5.3 Prospects of the use of bagasse processed fuel blocks in the brick makingindustries of Sudan
Bagasse from the sugar industry is one of the most important agricultural residues
available in Sudan, suitable for processing into compact solid fuels which can be a good
substitute for fuelwood in the brick making industries of Sudan. BENS (1996) found out
in their study, (1) the use of bagasse processed fuel blocks in the brick making sector is
technically and economically feasible and bagasse blocks can replace 80% of wood use in
the brick making industries of Sudan (2) the utilization of this resource (bagasse) will
have a significant impact on the environment by conserving fuelwood consumed in the
brick making industries and consequently will relieve pressure in degrading forest
resources and (3) the use of bagasse as fuel instead of fuelwood will contribute to the
reduction of greenhouse gas emissions as trees left to grow in the forest can be act as
carbon sink and will reduce the harmful effect of methane gas produced from bagasse by
leaving them in the vicinity of sugar factories for a long period.
There are five sugar factories in the Sudan. The first one named Guneid Sugar Factory
constructed in Butana State of Central Sudan in 1968 followed by New Halfa Sugar
Factory at Kassala, Eastern Sudan in 1968. The other three were established in 70th;
Sennar in 1974, Assalya in 1976 and Kenana in 1979. From these factories approximately
200,000 tons of bagasse is produced as by-product every year. Only Kenana Sugar
Factory is utilizing its all bagasse for satisfying its own requirement for energy, although
not all its requirement is supplied from bagasse. So, bagasse from other four sugar
factories can be used for bagasse fuel blocks production. BENS (1996) predicted that the
demand of bagasse fuel blocks by brick kilns might be less than the bagasse fuel blocks
production if all available bagasse can be utilized. For this, in 1985 trials of bagasse fuel
blocks production started at New Halfa Sugar factory with the technical support of
FAO/FNC. Later on two manual units were installed at the New Halfa area for producing
bagasse fuel blocks. In 1989, a third unit of 10 presses was established at the same place
with the financial assistance of EEC. Later, in 1993 another unit was established at
Guneid Sugar factory with the technical and financial assistance of FAO/FNC. Under the
financial aid of same project other two units were established at Senner in 1994 and at
Assalaya in 1994. Until 1995, there are 7 units located in four sugar factories with total
number of 36 presses. But unfortunately, almost all these units are no longer working due

70
to the continuous increase of price of molasses26, which is used as binder for the
production of bagasse fuel blocks within the range of 33-40%. BENS (1996) also
recommended that the amount of molasses produced now in the sugar factories will not
be sufficient if the whole available quantity of bagasse is used for bagasse fuel blocks
production. Accordingly, the total possible amount of bagasse fuel blocks will be less
than the estimated total demand of brick kilns for fuel. This demand can be satisfied if
clay or filter cake27 is used as a binder in producing bagasse fuel blocks.
However, use of densified agricultural wastes of bagasse including ground nut hells and
cotton stalks for firing of clay bricks is highly recommended as an alternative fuel.
Available, cheap compressed agricultural wastes will encourage traditional brick makers
to use them separately or in combination with wood. To achieve this, further research
should carry out to establish densifying (briquetting28) plants and to encourage brick
makers to shift from fuelwood to densified fuel blocks.
5.4 Meeting of fuelwood demand for brick making industries in the Sudan bysustainable fuelwood plantations
Present study revealed that small scale sustainable fuelwood plantations was already
established by Kenana Sugar Factory at White Nile State (irrigated Sunt plantation-1,450
feddans), by FNC at Kassala State (irrigated Eucalyptus plantation 172 feddans) and at
Gezira State (Sunt reserve-375 feddans). From the literature study it is also known that
total annual brick production in the Sudan is about 2.8 billion. Having obtained annual
brick production in the Sudan, it is easy to estimate the area of forests to be reserved
annually for sustainable fuelwood production for the brick making industries of Sudan.
Here, Sunt (Acacia nilotica) is considered to be the sole fuelwood species for calculation
and assumed that sustainable plantation is not harmful for potential deforestation and
greenhouse gas emission as it maintains the stock sustainable in the forest and acts as
26 Molasses is the final effluent obtained in the preparation of the sugar by repeated crystallization (BENS,1996).
27 Filter cake is a waste material resulting from washing sugar cane in sugar industry, composed mainly ofclays and some parts of the roots of the canes (BENS, 1996).
28 Briquetting: Material (sawdust, crop residues, and charcoal fines) compacted under pressure(densification) to improve characteristics of materials for transport and use as energy source. Because theyare compressed and have low water content, they have a higher energy density than ordinary wood and needless storage space. Also called “white coal” (WMO, 2001).

71
carbon sink simultaneously. According to Hamid (1996), the following assumptions are
made:
1,000 bricks need 45 kg of wood (one Kontar)
One m3 of stacked Sunt (A. nilotica) wood = 440 kg
One feddan produces = 37 m3 stacked Sunt
2,800,000 × 452,800,000 thousands (2.8 billion) bricks require =
440 × 37= 7739.55 7740 feddans = 3250.8 hectares (as 1 feddan = 0.42 hectares)
Hence, 3,250 hectares of A. nilotica plantation is the annually required forest area to
cover the fuelwood demand of brick making industries in the Sudan. But for sustainable
management, a total of 65,000 hectares of A. nilotica plantation is needed with 20 age
gradation plots, considering that A. nilotica plantation is managed on a basis of 20-year
rotation for fuelwood production in the Sudan (Fagg, 1992). If this amount of A. nilotica
fuelwood plantation is not provided in a sustainable base, brick production could be
considered as a main contributing factor to the problem of deforestation.
5.4.1 Energy plantations
Use of biomass fuels as a renewable, sustainable and clean energy source instead of fossil
fuels have received the interest in the recent years concerning serious environmental
issues like global climate change. Energy plantations are one of the attractive options for
addressing CO2 concerns, because both growth and conversion involve recycling
atmospheric carbon, resulting in no net addition of CO2 into the atmosphere. The amount
of carbon sequestered may be greater than that released by combustion because most
energy crops are perennials and they are harvested by cutting rather than uprooting.
Hence, the roots sequester carbon and regenerate the following year (WMO, 2001).
Nowadays, especially in developed countries, there is a growing cooperation on energy
policy and technology issues, often referred to as the “3Es”: economic development,
energy security, and environmental protection. Plantation of energy crops would be the
solution to reconcile these “3Es”. Energy crops can be grown on farms in potentially large
quantities. The best energy crops are (WMO, 2001):

72
Trees: Those grow very fast and will resprout after being cut off close to the ground, a
process called “coppicing”. The best varieties for temperate climates are sycamore and
sweet gum; for tropical climates, eucalyptus; and for cooler and humid climates are
poplar, maple, and willow.
Grasses: Thin-stemmed perennial grasses, like switch grass and big bluestem, grow
quickly in different climates and can be harvested for up to 10 years before replanting.
Thick-stemmed perennials like sugarcane and elephant grass can be grown in hot and
humid climates.
These crops are chosen because of their characteristics of growth, manageability, and
environmental impacts. Some of these crops are being developed through genetic
engineering for maximizing growth (“super trees”) or for consuming much more CO2
(“smog-eating trees”) than normal trees. For example, straw and willow have the lowest
CO2 emissions per unit of energy delivered and Switch grass has a high potential for
sequestrating carbon (Börjesson, 1998; FAO/FEF, 1998; WMO, 2001). Bearing in mind,
the study recommends for energy plantation in the Sudan and suitable species would be
eucalyptus, can be consumed as fuelwood in the brick making industries and sugarcane
for producing bagasse fuel blocks.
5.5 Impacts of global climate change in the Sudan
5.5.1 General aspects
Impacts of global climate change due to enhanced greenhouse gas emission in the Sudan
can be discussed on the estimated increase or decrease in temperature and precipitation
for the projection years 2030 and 2060 as well as sorghum and millet yield scenarios for
the same projection years.
To foresee climate change scenarios, the data collected from five stations (El Obeid, En
Nahud, Rashad, Kadugli and Babanusa) of Kordofan region which is located in mid-
western Sudan between latitudes 9030/ and 16024/ North and longitudes 270 to 320 East.
Kordofan region ranges across desert and semi-desert in the North, to moist, sub-humid
and rich savannah in the South. Arid and semi-arid zones make up the largest segment of
Kordofan’s land area and the data collected at these stations tells a story of a varied

73
regional climate. For discussion, the data adapted from MEPD/HCENR (2003) and
finally analyzed under the following heads:
5.5.2 Impacts of global climate change on temperature
Due to global climate change, Sudan’s temperature will increase for both the projection
years 2030 and 2060. For future projections, the year 1990 was considered as the base
year. For the projection year 2030, it was estimated that temperature will increase 0.4-1.00C in all five stations (El Obeid, En Nahud, Rashad, Kadugli and Babanusa) of Kordofan
region and gradual rise will continue for the projection year 2060 ranging between 1.0-1.80C. It was also observed that station El Obeid will be worse affected than the other
stations by gradual rise of temperature during the projection years (Tab. 22).
Table 22. Estimated increase in temperature for the projection years 2030 and 2060
Temperature (0C) Increase (0C)ProjectionYears/Station 1990 2030 2060 2030 2060El Obeid 27.3 28.3 29.1 1.0 1.8En Nahud 27.5 28.4 29.2 0.9 1.7Rashad 26.8 27.2 27.8 0.4 1.0Kadugli 28.1 28.8 29.4 0.7 1.3Babanusa 28.5 29.2 29.8 0.7 1.3 (Adapted and modified from MEPD/HCENR, 2003)
5.5.3 Impacts of global climate change on precipitation
Precipitation will also be affected by global climate change either by increasing or
decreasing for the projection years 2030 and 2060. Precipitation will increase at the
stations El Obeid and En Nahud ranging between 10-12 mm by 2030 and 19-21 mm by
2060 while it will decrease at the stations Rashad, Kadugli and Babanusa ranging
between 2-8 mm by 2030 and 3-15 mm by 2060 (Tab. 23).
Table 23. Estimated increase or decrease in precipitation for the projection years 2030and 2060
Precipitation (mm) Increase or decrease (mm)ProjectionYears/Station 1990 2030 2060 2030 2060El Obeid 318.0 328.9 337.4 10.9 19.4En Nahud 335.9 347.6 356.7 11.7 20.8Rashad 717.7 715.8 714.3 -1.9 -3.4Kadugli 633.1 630.5 628.2 -2.6 -4.9Babanusa 497.3 489.0 482.3 -8.3 -15.0 (Adapted and modified from MEPD/HCENR, 2003)

74
5.5.4 Impacts of global climate change on Sorghum and millet yield
Production of agricultural crops, sorghum and millet, will decrease substantially due the
result of global greenhouse effect. Production of sorghum will decrease in all the stations
except station Rashad by 215-346 kg/ha by 2030 and 253-357 by 2060. It was also
observed that surprisingly the production will remain constant at Rashad station for both
the projection years (Tab. 24). Millet production will also decrease in all the five stations
during the two projection years ranging between 56-216 kg/ha by 2030 and 69-255 kg/ha
by 2060. The study also observed that millet production at Kadugli will decrease notably
than the other stations while production loss will be a lesser amount at El Obeid station
for the both projection years (Tab. 25).
Table 24. Sorghum yield scenario for the projection years 2030 and 2060
Yield (kg/ha) Decrease (kg/ha)ProjectionYears/Station 1990 2030 2060 2030 2060El Obeid 495 150 143 -345 -352En Nahud 631 285 274 -346 -357Rashad >748 >748 >748 No change No changeKadugli >748 533 495 -215 -253Babanusa >748 417 379 -331 -369 (Adapted and modified from MEPD/HCENR, 2003)
Table 25. Millet yield scenario for the projection years 2030 and 2060
Yield (kg/ha) Decrease (kg/ha)ProjectionYears/Station 1990 2030 2060 2030 2060El Obeid 112 56 <43 -56 -69En Nahud 204 86 81 -118 -123Rashad 433 367 331 -66 -102Kadugli 433 217 178 -216 -255Babanusa 343 159 139 -184 -204 (Adapted and modified from MEPD/HCENR, 2003)
5.6 Limitation and uncertainty of the study
A central limitation in this study is the use of some ECE/FAO and IPCC default values
for the estimation of potential deforestation and greenhouse gas emission by the brick
making industries of Sudan due to the lack of local factors. Despite the fact that, in some
cases, these default values do not accurately reflect Sudan’s specific, unique conditions.

75
Apart from that, a major area of uncertainty exists in the estimation of the quantity of
fuelwood and dung cake consumption by the brick making industries of Sudan, which is
significantly important to estimate potential deforestation and the rate greenhouse gas
emission in the atmosphere. Data of biofuels consumption quantity were collected from
the interviews of entrepreneurs rather than direct field measurement.
76
6 CONCLUSIONS AND RECOMMENDATIONS
The present study focused on the annual emission of greenhouse gases and the potential
maximum rate of deforestation in the Sudan caused by the brick making industries that
use fuelwood or dung cake as fuel. In general, Sudan contributes a small amount of
greenhouse gases to the atmosphere compared to the rest of the world. In comparison, in
1995, the total global amount of carbon emitted from energy activities was estimated at 6
billion t. Sudan’s contribution to this was very modest, even in comparison to many other
developing countries. This is also seen in the 1995 per capita emission of CO2 in the
Sudan, which was only 3 t per person (i.e., 89,220 Gg/28.7 million people; MEPD
/HCENR, 2003).
The present study suggested a considerable amount of fuelwood consumed by the brick
making industries in the Sudan and this sector potentially acting as an agent of
deforestation. Changes in the environment due to degradation of forest resources and
emissions of greenhouse gases are key issues today in the national, regional and global
contexts. In the following, recommendations are listed that could mitigate deforestation
and forest degradation and reduce greenhouse gas emissions originating from the brick
making industries in the Sudan:
I. Use of densified agricultural waste, such as bagasse fuel blocks, groundnut hulls
and cotton stalks, for firing of clay bricks is highly recommended. To achieve this,
densifying (briquetting) plants should be established (cf. Hamid, 1994);
II. The use of bagasse fuel blocks instead of wood in the brick making industries in
Sudan would relieve pressure on forest resources. This would also contribute to the
reduction of greenhouse gas emission in two ways, (i) by reducing the pressure on
forests and allowing trees and forests to act as stronger carbon sinks, and (ii) by
utilizing bagasse, also reducing the harmful effect of methane gas generated from
this waste when it is left for a long period in the vicinity of sugar factories (cf.
BENS, 1996);
III. The open-top Hoffman kiln can be introduced for efficient use of alternative fuels,
such as fuel oil and densified agricultural waste (cf. Hamid, 1994);
IV. Introduction of traditional agro-forestry system in consistent with natural forest
management;

77
V. Production of fuelwood with higher calorific value by selecting suitable tree species
and recommending them for plantation establishment and sustainable natural forest
management;
VI. Establishment of energy plantation with suitable species such as eucalyptus for
fuelwood supply in the brick making industries and sugarcane for producing
bagasse fuel blocks;
VII. Intensive afforestation29 and reforestation30 programmes should be undertaken by
Forests National Corporation (FNC) with the help of NGO’s and ensuring the
participation of local people; this would also contribute to more sustainable
fuelwood use and less harmful greenhouse gas emission
Further Research
Due to the growing concern of global climate change, its impacts on environment and the
use of biomass fuels as a renewable, sustainable and clean energy source; a
comprehensive research could be carried out on, “Greenhouse gas emissions from biofuel
combustion in the Sudan”. In this connection, a high priority should be given for the
inclusion of other significant industrial fuelwood consumption sectors such as bakeries,
lime curing and vegetable oil industries in the future research project in addition with
brick making industries.
29 Establishment of a tree crop area where it has always or long been absent. (FAO as cited in WMO,2001).
30 Planting of forest on lands that have, historically, previously contained forests but which have beenconverted to some other use (IPCC as cited in WMO, 2001).

78
REFERENCES
AAS. 2005. NOVA science in the news: Enhanced greenhouse effect-a hot internationaltopic. [Available at: http://www.science.org.au/nova/082/082key.htm accessed on26/11/05]
Abdel Nour, H. O. 1999. Implementation of national forest programmes in Sudan-A casestudy. Paper presented on FAO-Turkey workshop, Istanbul, 11-12 Oct. 1999, 46 p.
ALGAS. 1998. Summary Report. Asian Development Bank, Global EnvironmentFacility, United Nations Development Program, Manila, Philippines.174 p.
Bala, B. K. and M. M. Hossain. 1992. Economics of biogas digesters in Bangladesh.Energy 17(10): 939-944.
BENS. 1996. Investigation on the production and marketing of bagasse processed fueland its use in brick-making industry. Khartoum, Sudan. 35 p.
Bilal, H. E. T. 2002. An assessment of the environmental impacts of the traditionalproduction of building materials in the Sudan. M. Sc. Thesis, Institute of EnvironmentalStudies, University of Khartoum, Sudan, 72p.
Börjesson, P. 1998. Biomass in a sustainable energy system. Department ofEnvironmental and Energy Systems Studies, Lund University, Sweden.
Brown, S., A. J. R. Gillespie, and A. E. Lugo. 1989. Biomass estimation methods fortropical forests with applications to forest inventory data. Forest Science, 35:881-902.
BRRI & CRATerre. 1984. Low cost housing study. Final report, Book 1, 2 & 3,Khartoum.
CDIAC. 1995. 1950-1992 Estimates of CO2 emissions from fossil fuel burning andcement manufacturing based on the United Nations energy statistics and the U.S. bureauof mines cement manufacturing data. Environmental Sciences Division, Oak RidgeNational Laboratory /CDICA, NDP-030R (a numerical database). Oak Ridge, TN.
Crutzen, P. J. and M. O. Andreae. 1990. Biomass burning in the tropics: impact onatmospheric chemistry and biogeochemical cycles. Science, 250:1669-1678.
Delmas, R. 1993. An overview of present knowledge on methane emission from biomassburning. In: Proceedings of an international IPCC workshop: Methane and nitrous oxides,methods in national emissions inventories and options for control, (Ed. A. R. vanAmstel). 3-5 February 1993, Amersfoort, The Netherlands. RIVM Report No 481507003,Bilthoven, The Netherlands.
Dixon, R. K., P. E. Schroeder, and J. K. Winjum. 1991. Assessment of promising forestmanagement practices and technologies for enhancing the conservation and sequestrationof atmospheric carbon and their costs at the site level. US Environmental ProtectionAgency, Office of Research and Development, Washington D.C., US, EPA/600/3-9/067.

79
EBRD. 2005. Sub-sectoral environmental guidelines: Brick manufacture. [Available at:http://www.ebrd.com/about/policies/enviro/sectoral/construc/brick.pdf accessed on16/11/05]
ECE/FAO. 1992. The forest resources of the temperate zones. The United Nations,Geneva, Switzerland.
EIA. 2004. Emissions of greenhouse gases in the United States 2003. Office of IntegratedAnalysis and Forecasting, U.S. Department of Energy, Washington, DC 20585.[Available at: http://www.eia.doe.gov/oiaf/1605/ggrpt/pdf/057303.pdf accessed on29/11/05]
EPA. 2000. Global warming-impacts of deserts. [Available at:http://yosemite.epa.gov/OAR/globalwarming.nsf/content/ImpactsDeserts.html accessedon 12/05/05]
EPA. 2001. Inventory of U.S. greenhouse gas emissions and sinks: 1990-1999. U. S.Environmental Protection Agency, Office of Atmospheric Programs (6202N), 1200Pennsylvania Avenue, NW, Washington, DC 20460, USA.
EPA. 2005. Glossary of climate change terms. [Available at:http://yosemite.epa.gov/oar/globalwarming.nsf/content/glossary.html#G accessed on26/11/05]
Fagg, C. W. 1992. Acacia nilotica-pioneer for Dry Lands. A publication of the Forest,Farm and Community Tree Network (FACT Net). Winrock International, USA. [Available at: http://v1.winrock.org/forestry/factpub/factsh/a_nilotica.html accessed on22/03/06]
FAO. 1993. Forest resources assessment 1990: tropical count ries. FAO Forestry Paper112, Rome, Italy. 59 p.
FAO. 1998a. Forest resources assessment 2000: Terms and definitions. Forest resourcesassessment programme working paper 1. Rome. Forestry Department, FAO: 17p.
FAO. 1998b. Crop evapotranspiration: Guidelines for computing crop waterrequirements. FAO irrigation and drainage paper 56. Rome, Italy. [Available at:http://www.fao.org/docrep/X0490E/x0490e00.htm#Contents accessed on 21/12/05]
FAO. 1999. Cultivating Our Futures. FAO-Netherlands conference on the multifunctionalcharacter of agriculture and land. The Netherlands, 189 pp.
FAO. 2000. Forestry outlook study for Africa (FOSA): Sudan. Ministry of Agriculture &Forests and Forests National Corporation, Government of Sudan. [Available at:ftp://ftp.fao.org/docrep/fao/003/AB574E/AB574E00.pdf accessed on 15/02/05]
FAO. 2001. Global forest resources assessment 2000. Main report. FAO Forestry PaperNo. 140. Rome.

80
FAO. 2003. Geographic description of Sudan. [Available at:http://www.fao.org/forestry/foris/webview/forestry2/index.jsp?siteId=5081&sitetreeId=18307&langId=1&geoId=0 accessed on 15/02/05]
FAO. 2005a. State of the world’s forests 2005. Food and Agriculture Organisation of theUnited Nations. Rome, Italy, 2005. [Available at:http://www.fao.org/documents/show_cdr.asp?url_file=/docrep/007/y5574e/y5574e00.htmaccessed on 12/05/05]
FAO. 2005b. FAO country profile and mapping information system. [Available at:http://www.fao.org/countryprofiles/index.asp?iso3=SDN&lang=en accessed on 18/10/05]
FAO/FEF. 1998. Forest Energy Forum, No. 2, Rome, Italy, 28 pp.
FAO/FEF. 2000. Forest Energy Forum, No. 6, Rome, Italy, 44 pp.
FNC. 1995. Forest products consumption survey in the Sudan, summary of findings.Forestry development project, FAO. GCP/SUD/047/NET.
Hall, D. O., J. House and I. Scrase. 1999. Introduction in: Industrial use of biomassenergy – the example of Brazil. F. Rosillo-Calle, S. Bajay & H. Rothman (Eds.), Taylor& Francis, London.
Hall, D.O. 1998. Biomass as an energy source. Tiempo, Global warming and the thirdworld. International Institute for Environment and Development (IIED), U.K., 25 pp.
Hall, D.O., F. Rosillo-Calle and P. Groot. 1992. Biomass energy: Lessons from casestudies in developing countries. Energy Policy 20: 62-73.
Hamid, M. H. 1994. Brick making industry in Sudan. Building and Road ResearchInstitute (BRRI), University of Khartoum, Sudan. 40 p.
Hernes, H., A. Dalfelt, T. Berntsen, B. Holtsmark, L.O. Naess, R. Selrod and A. Aaheim,1995: Climate strategy for Africa. Cicero Report No. 1995(3), Cicero, Oslo, Norway, 83pp.
IPCC. 1994. IPCC guidelines for national greenhouse gas inventories. Volumes I, II andIII. Intergovernmental Panel on Climate Change, United Nations Environment Program,World Meteorological Organization, Organization for Economic Co-operation andDevelopment and International Energy Agency, 1994.
IPCC. 1996. Climate change 1995: The Science of Climate Change. Summary forPolicymakers. IPCC, Working Group I, Bracknell, United Kingdom.
IPCC. 2001. Climate change 2001: The scientific basis. Cambridge University press,Cambridge, UK. [Available at: http://www.grida.no/climate/ipcc_tar/wg1/index.htmaccessed on 02/11/05]
IPCC. 2005. Glossary of terms used in the IPCC Third Assessment Report. [Available at:http://www.ipcc.ch/pub/gloss.htm accessed on 26/11/05]

81
IPCC/WMO/UNEP. 1997. The regional impacts of climate change: An assessment ofvulnerability. Summary for policymakers. [Available at:http://www.grida.no/climate/ipcc/spmpdf/region-e.pdf accessed on 01/11/05]
IPCC/WMO/UNEP. 1998. The regional impacts of climate change: An assessment ofvulnerability. [Available at: http://www.grida.no/climate/ipcc/regional/index.htmaccessed on 15/10/05]
ITDG. 2005. Biomass technical brief. [Available at:http://www.itdg.org/docs/technical_information_service/ biomass.pdf accessed on30/11/05].
Lacaux, J. P., H. Cachier and R. Delmas. 1993. Biomass burning in Africa: An overviewof its impact on atmospheric chemistry. In: Fire in the Environment: The Ecological,atmospheric and Climatic Importance of Vegetation fires, (Eds. P. J. Crutzen and J. G.Goldammer). J. Wiley & Sons Ltd., Chichester, England. pp. 159-191.
Lanly, J. P. 1982. Tropical forest resources. FAO Forestry Paper 30, Rome, Italy. 106 p.
LCFRD. 2005. Country profile: Sudan. [Available at:http://lcweb2.loc.gov/frd/cs/profiles/Sudan.pdf accessed on 21/10/05]
Lefevre, T., J. Todoc and G. Timilsina. 1997. The role of wood energy in Asia. FAO,Forestry Department, Wood Energy Today for Tomorrow (WETT), Regional Studies,Working Paper FOPW/97/2, Rome, 107 pp.
MEM. 2000. Sudan energy situation in house-hold sector. Paper presented at IGADmeeting held on Nairobi, 15-17 Feb/2000. [Available at:http://igadrhep.energyprojects.net/GetDoc.asp?DocumentID=9 accessed on 03/02/05]
MEPD/HCENR. 2003. Sudan's first national communications under the United NationsFramework Convention on Climate Change. Volume 1, main communications. [Availableat: http://unfccc.int/resource/docs/natc/sudnc1.pdf accessed on 15/02/05]
NET. 2000. A climate of trust report. Confronting climate change: Economic prioritiesand climate protection in developing nations, (Ed. B. Biagini). 350 p.
NOAA. 2005. NOAA El Niño page. [Available at: http://www.elnino.noaa.gov/ accessedon 21/12/05]
Rahman, M. M. 2005. How hazardous are the brickfields? The Daily Star (online), May13, 5 (340), Dhaka, Bangladesh. [Available at:http://www.thedailystar.net/2005/05/13/d505131802105.htm accessed on 16/11/05]
Ringius, L., T.E. Downing, M. Hulme and R. Selrod, 1996. Climate change in Africa:Issues and regional strategy. Cicero Report No. 1996(2), Cicero, Oslo, Norway, 154 pp.
RWEDP. 2000. Wood Energy News. Bangkok 10200, Thailand, 15 (2), pp. 4 -5 and 32-33.

82
SEHD. 1998. Bangladesh environment facing the 21st century, (Ed. P. Gain). Dhaka1205, Bangladesh. 305 p.
SOS-Arsenic.net.2005. Toxic fumes from brick kilns a threat to health. [Available at:http://www.sos-arsenic.net/english/environment/toxic-fumes.html accessed on 16/11/05]
Streets, D.G. and S. T. Waldhoff. 1999. Greenhosue-gas emissions from biofuelcombustion in Asia. Energy 24 (10): 841-855.
Thomas, J., J. Koppejan, F. Ariola, R. Buen and J. Siteur. 1997. Review of wood energydata in REWDP member countries. FAO Regional Wood Energy DevelopmentProgramme in Asia, GCP/RAS/154/NET, Field Document No. 47, Thailand, 104 pp.
UN. 2005. World population prospects: The 2004 revision population database. UnitedNations Population Division. [Available at: http://esa.un.org/unpp/ accessed on 21/10/05]
UNCCD. 2005. Desertification, global change, and sustainable development. [Availableat: http://www.unccd.int/ accessed on 12/02/05]
UNEP. 1998. Handbook on methods of climate change impact assessments andadaptation strategy.
UNEP/OECD/IEA/IPCC. 1997. Revised IPCC guidelines for national GHG inventoriesVolume 3: GHG Inventory Reference Manual. IPCC, Bracknell, UK.
UNFCCC. 2005a. Greenhouse gases database. [Available at:http://ghg.unfccc.int/default.htf accessed on 29/11/05]
UNFCCC. 2005b. The mechanisms under the Kyoto Protocol: Joint implementation, theclean development mechanism and emissions trading. [Available at:http://unfccc.int/kyoto_mechanisms/items/1673.php accessed on 02/12/05]
WB. 1998. Greenhouse gas assessment handbook: A practical guidance document for theassessment of project-level greenhouse gas emissions. Global Environment Division, theWorld Bank, USA. 168p.
WEC. 2005. WEC survey of energy resources 2001-Wood including charcoal resources.[Available at: http://www.worldenergy.org/wec-geis/publications/reports/ser/wood/wood.asp?mode=print&x=42&y=8 accessed on15/02/05]
WEC/FAO. 1999. The challenge of rural energy poverty in developing countries. WorldEnergy Council. Food and Agriculture Organization of the United Nations, UK, 185 pp.
White, R. P. and Nackoney, J. 2003. Drylands, people, and ecosystem goods and services:A web-based geospatial analysis. [Available at: http://pdf.wri.org/drylands.pdf accessedon 12/05/05]

83
WMO. 2001. Climate information for biomass energy applications. [Available at:http://www.wmo.ch/web/wcp/clips2001/html/Biomass%20Energy.pdf accessed on20/12/05]
WMO/UNEP. 1996. Technologies, policies and measures for mitigating climate change.IPCC technical paper 1, Intergovernmental Panel on Climate Change, R. Watson, M.Zynyowera and R. Moss (Eds.), 85 pp.
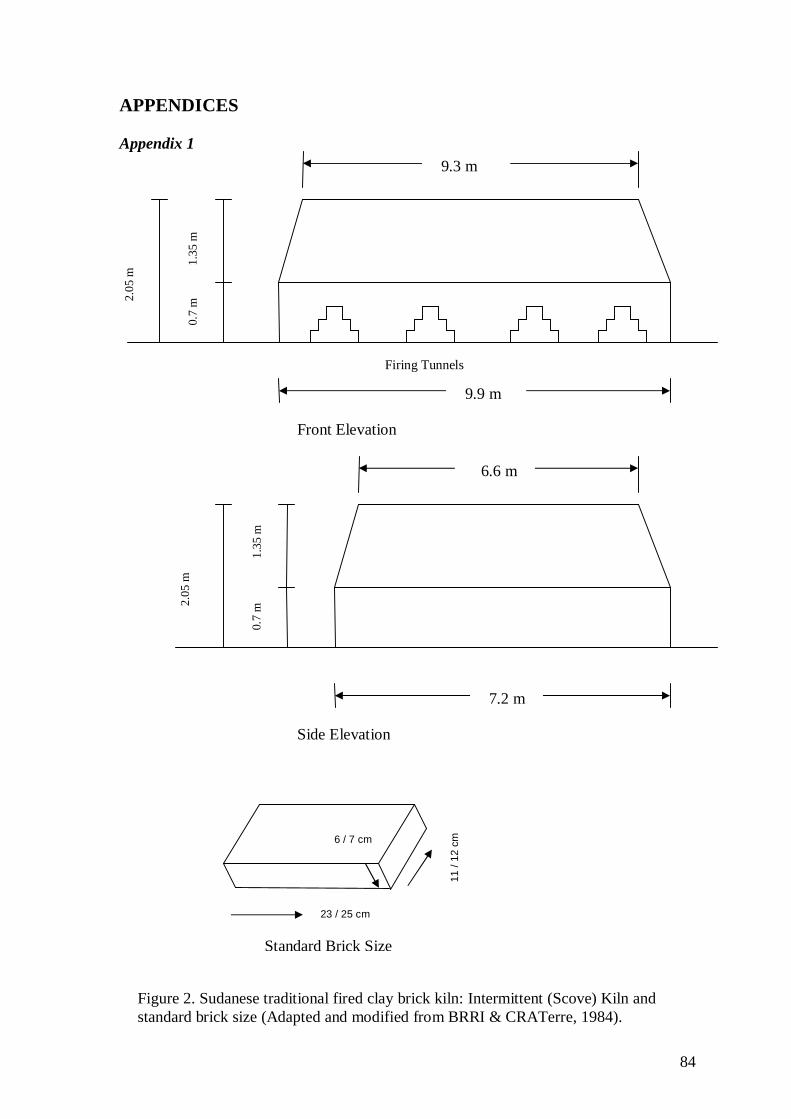
84
9.9 m
9.3 m
Firing Tunnels
2.05
m
0.7
m1.
35 m
Front Elevation
7.2 m
6.6 m
2.05
m
0.7
m1.
35 m
Side Elevation
23 / 25 cm
11 /
12 c
m 6 / 7 cm
Standard Brick Size
Figure 2. Sudanese traditional fired clay brick kiln: Intermittent (Scove) Kiln andstandard brick size (Adapted and modified from BRRI & CRATerre, 1984).
APPENDICES
Appendix 1

85
Mixing of clay, water (20-30%) andZibala Naama (Plate 10, animal dung) asadditive by hoes and spades andafterwards by threading. Plate 2
Left for ageing or fermentationfor about 12 hours
Forming the brick units by wooden orsteel mould. Plate 3
Digging of clay from the bank of the river(e.g. Blue Nile/Gash/Atbara). Plate 1
Air drying of bricks 1-3 days. Plate 4
Loading of green bricks in brick kiln forfiring. Plate 5
Firing of green bricks in brick kiln up to8500C temperature for 24 hours. Plate 6, 7
Cooling of fired red bricks for about 1week. Plate 8
Unloading of fired red bricks from thebrick kiln for marketing. Plate 9
By Fuelwood and Gercaf(Plate 11, dungcake/patties)
Figure 3. Flow chart of traditional fired clay bricks production process in Sudan. Platesare given on Appendix 2.

86
Appendix 2
Plate 1: Digging of clay from the bank of the river(e.g. Blue Nile/Gash/Atbara)
Plate 2: Mixing of clay, water (20-30%) and ZibalaNaama (animal dung) as additive by hoes andspades and afterwards by threading
Plate 3: Forming the brick units by wooden or steelmould
Plate 4: Air drying of green bricks 1-3 days
Plate 5: Loading of green bricks in brick kiln forfiring
Plate 6: Arrangement of firing of green bricks byfuelwood and Gercaf in brick kiln up to 8500Ctemperature for 24 hours
Plate 1-6: Traditional fired clay bricks production process

87
Plate 7: Firing of green bricks ( by fuelwood andGercaf ) in brick kiln up to 8500C temperature for 24hours
Plate 8: Cooling of fired red bricks for about 1week
Plate 9: Unloading of fired red bricks from the brickkiln for marketing
Plate 10: Zibala Naama (animal dung in dust form)used in clay mix
Plate 11: Gercaf ( animal dung cake) used for brickburning
Plate 12: Mr Ali Ahmed Ibrahim, Secretary ofBrick Making Owners' Association, Khartoum,interviewed by the Author
Plate 7-11: Traditional fired clay bricks production process