Embed Size (px)
Citation preview

University of South CarolinaScholar Commons
Theses and Dissertations
2016
Use Of Biochar-Ultrafiltration MembraneProcesses For Removal Of Humic AcidVaibhavi ShankarUniversity of South Carolina
Follow this and additional works at: https://scholarcommons.sc.edu/etd
Part of the Civil Engineering Commons
This Open Access Thesis is brought to you by Scholar Commons. It has been accepted for inclusion in Theses and Dissertations by an authorizedadministrator of Scholar Commons. For more information, please contact [email protected].
Recommended CitationShankar, V.(2016). Use Of Biochar-Ultrafiltration Membrane Processes For Removal Of Humic Acid. (Master's thesis). Retrieved fromhttps://scholarcommons.sc.edu/etd/3946
USE OF BIOCHAR-ULTRAFILTRATION MEMBRANE PROCESSES FOR REMOVAL OF
HUMIC ACID
by
Vaibhavi Shankar
Bachelor of Engineering
Manipal Institute of Technology, 2014
Submitted in Partial Fulfillment of the Requirements
For the Degree of Master of Science in
Civil Engineering
College of Engineering and Computing
University of South Carolina
2016
Accepted by:
Yeomin Yoon, Director of Thesis
Joseph Flora, Reader
Kyoung Hoon Chu, Reader
Cheryl L. Addy, Vice Provost and Dean of the Graduate School

ii
© Copyright by Vaibhavi Shankar, 2016
All Rights Reserved.
iii
DEDICATION
In the loving memory of my grandfather Hari Shankar Sinha. You have and will
always continue to inspire me. And to my parents Vinod Kumar and Padma Rani without
whose love, support and relentless efforts I would not be here.
iv
ACKNOWLEDGEMENTS
I would like to gratefully acknowledge a number of people who have journeyed
with me over the years and without whose support this thesis would not have been
complete. First and foremost, I would like to thank Dr. Yeomin Yoon, my advisor and a
most wonderful person. Thank you for your guidance and time and for not just honing my
academic skills but for also making a more efficient professional. I would also like to thank
Dr. Kyoung Hoon Chu for teaching me so patiently in the lab and for guiding me along
every step of the way. My heartfelt thanks to members of my research group; Yasir A.J.
Al-Hamadani and Dr. Chang Min Park for all your help, suggestions and encouragement.
Further, I am also extremely grateful to Dr. Joseph Flora, my thesis committee member for
his invaluable advice.
This work would not have been complete without the love and support of my parents Vinod
Kumar and Padma Rani. Thank you ma and papa for everything that you do for me and for
always being my pillars of strength. I would also like to thank my family and friends back
home who regardless of the distance were always there for me and my friends here in the
United States for helping me feel at home in a new country.
This research was supported by a grant from Industrial Facilities & Infrastructure
Research Program funded by Ministry of Land, Infrastructure and Transport of Korean
government.
v
ABSTRACT
The performance of an ultrafiltration (UF)-biochar process was evaluated in
comparison with a UF membrane process for the removal of humic acid (HA). Bench-scale
UF experiments were conducted to study the rejection and flux trends under various
hydrodynamic, pH, conductivity, and pressure conditions. The resistance-in-series model
was used to evaluate the processes and it showed that unlike stirred conditions, where low
fouling resistance was observed, comparable trends were obtained for UF-biochar and UF
alone for unstirred conditions. Thus, the processes were further evaluated under unstirred
conditions. Additionally, total fouling resistance was decreased in the presence of biochar,
indicating that HA adsorption by biochar could significantly diminish adsorption fouling
on the UF membrane and thus improve the efficiency of the UF-biochar process. The
rejection trends of UF-biochar and UF alone were similar in most cases, whereas UF-
biochar showed a noticeable increase in flux due to reduced membrane fouling. Three-
cycle filtration tests further demonstrated that UF-biochar showed better membrane
recovery and antifouling capability and thus may potentially prove be a viable treatment
option for the removal of HA from water.
vi
TABLE OF CONTENTS
DEDICATION ....................................................................................................................... iii
ACKNOWLEDGEMENTS ........................................................................................................ iv
ABSTRACT ............................................................................................................................v
LIST OF TABLES ................................................................................................................. vii
LIST OF FIGURES ............................................................................................................... viii
CHAPTER 1: INTRODUCTION………………………………………….………………….....1
CHAPTER 2 MATERIALS AND METHODS ................................................................................4
2.1 HA FEED SOLUTION ..............................................................................................4
2.2 CHARACTERISTICS OF BIOCHAR ...........................................................................5
2.3 BIOCHAR-UF EXPERIMENTS ..................................................................................5
2.4 RESISTANCE- IN- SERIES MODEL ..........................................................................7
CHAPTER 3 RESULTS AND DISCUSSION ................................................................................11
3.1 INFLUENCE OF BIOCHAR AND HYDRODYNAMIC CONDITIONS ON FLUX DECLINE
AND HA REJECTION .........................................................................................11
3.2 EFFECT OF PH AND CONDUCTIVITY ...................................................................13
3.3 MEMBRANE FOULING RESISTANCE ....................................................................15
3.4 INFLUENCE OF PRESSURE AND EFFECT OF THREE-CYCLE TEST ..........................16
CHAPTER 4 CONCLUSION ....................................................................................................26
REFERENCES .......................................................................................................................28
vii
LIST OF TABLES
Table 2.1. Elemental composition, aromatic ratio, ash content, aromaticity, BET-N2 surface
area (SA-N2), and cumulative pore volume of biochar used in this study ……………...….9
Table 2.2. Specifications and properties of membranes.......................................................10
Table 3.1. Characteristics of the fouling layer and resistances as a function of unit retained
DOC mass in the absence and presence of biochar and various operating conditions
according to resistance-in-series model……………...........................................................25

viii
LIST OF FIGURES
Figure 3.1. Influence of biochar concentration on flux decline and HA rejection as a
function of biochar concentration for a UF membrane ......................................................19
Figure 3.2. Influence of pH on flux decline and HA rejection based on DOC in the absence
and presence of biochar .....................................................................................................20
Figure 3.3. Influence of conductivity on flux decline and HA rejection based on DOC in
the absence and presence of biochar ..................................................................................21
Figure 3.4. Influence of applied pressure on flux decline and HA rejection based on DOC
in the absence and presence of biochar ..............................................................................22
Figure 3.5. Influence of 3 cycles of filtration on flux decline and HA rejection based on
DOC in the presence and absence of HA ..........................................................................23
Figure 3.6. Comparison of HA rejection trends with respect to cycle of filtration and VCF
over 3 cycles of filtration ...................................................................................................24
1
CHAPTER 1
INTRODUCTION
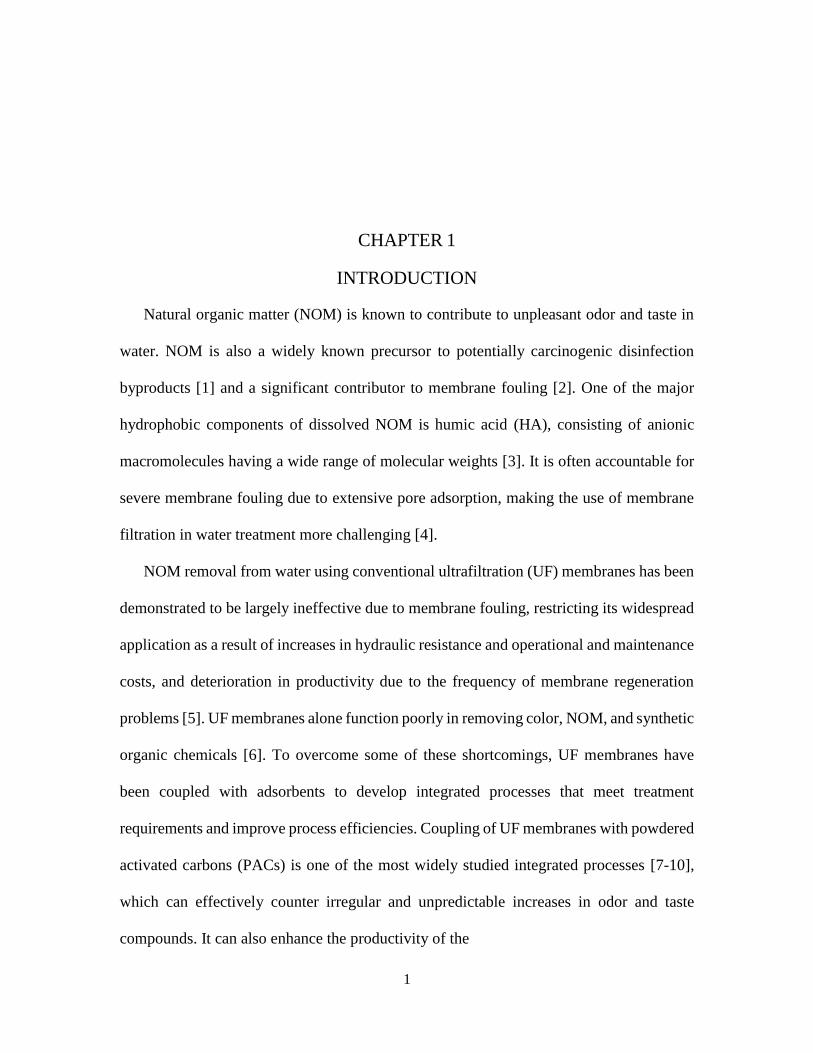
Natural organic matter (NOM) is known to contribute to unpleasant odor and taste in
water. NOM is also a widely known precursor to potentially carcinogenic disinfection
byproducts [1] and a significant contributor to membrane fouling [2]. One of the major
hydrophobic components of dissolved NOM is humic acid (HA), consisting of anionic
macromolecules having a wide range of molecular weights [3]. It is often accountable for
severe membrane fouling due to extensive pore adsorption, making the use of membrane
filtration in water treatment more challenging [4].
NOM removal from water using conventional ultrafiltration (UF) membranes has been
demonstrated to be largely ineffective due to membrane fouling, restricting its widespread
application as a result of increases in hydraulic resistance and operational and maintenance
costs, and deterioration in productivity due to the frequency of membrane regeneration
problems [5]. UF membranes alone function poorly in removing color, NOM, and synthetic
organic chemicals [6]. To overcome some of these shortcomings, UF membranes have
been coupled with adsorbents to develop integrated processes that meet treatment
requirements and improve process efficiencies. Coupling of UF membranes with powdered
activated carbons (PACs) is one of the most widely studied integrated processes [7-10],
which can effectively counter irregular and unpredictable increases in odor and taste
compounds. It can also enhance the productivity of the
2
membrane by reducing the foulant load toward the applied membrane [10]. However,
if the PAC dose, membrane characteristics, and operating conditions are not monitored
effectively, there can be a more severe flux decline with a PAC-UF membrane process than
a UF process alone [8].
To improve the efficiency of integrated processes, newer adsorbents, such as biochar
(e.g., a byproduct of bio-oil production), have been studied [11-13]. The properties of
biochar are dependent on the manufacturing process and vary with the pyrolysis conditions
and the type of biomass used. Short-term pyrolytic conditions with low thermal treatment
(< 500°C) are known to produce an enriched, carbon-based porous biochar with properties
suitable for use as an adsorbent [13]. Such biochar has favorable properties for adsorbing
metal cations, such as a large surface area with a high negative charge and charge density.
In addition, its hydrophobic characteristics provide affinity to adsorb hydrophobic organic
compounds, such as 17α-ethinyl estradiol, diclofenac, ibuprofen [14], and NOM [15].
Biochar also exhibits superior adsorption performance to activated carbon in terms of
organic removal, making it a potentially cost-effective adsorbent [11].
However, the effects of the adsorbent on membrane fouling need to be analyzed for
any adsorbent used in an integrated process. The effects are a function of the
physiochemical properties of the adsorbent (e.g., size, charge, and hydrophobicity),
solution water chemistry (e.g., pH and conductivity), and membrane characteristics (e.g.,
hydrophobicity, charge, and size) [7, 9, 16, 17]. Based on these properties, the adsorbent
can remove HA from the solution, which would otherwise adsorb onto the membrane pores
and cause fouling, or the adsorbent may itself act as a foulant, blocking membrane pores
and preventing the efficient working of the integrated process. Extensive studies have been
3
conducted on the effects of PAC on membrane fouling in an integrated process [6, 8, 10],
whereas biochar, being relatively new in the field of water treatment, has been studied less
in comparison.
A few studies have been reported previously on the adsorption mechanisms of NOM
with biochar [13, 15, 18]. Hydrophobic HA forms ᴨ bonds with biochar and occupies the
ᴨ-rich sites on the surface, acting as a ᴨ acceptor, while biochar acts as an ᴨ donor [13].
This leads to a higher adsorption affinity for HA on biochar when compared with other
commercially available adsorbents, like PAC. Additionally, the presence of diverse
functional groups on HA surface also promotes multi-layer adsorption with biochar due to
increased adsorption via hydrogen bonding and polar interactions.
The objective of this study was to investigate the potential mechanisms for HA removal
in an integrated process with a UF membrane in the presence of biochar prepared in the
laboratory as an adsorbent. The effect of biochar on membrane fouling was also studied.
To achieve this, flux decline and HA rejection in biochar-UF processes were investigated
as a function of different solution and operating conditions, including pH, conductivity,
pressure, and biochar concentration.
4
CHAPTER 2
MATERIALS AND METHODS
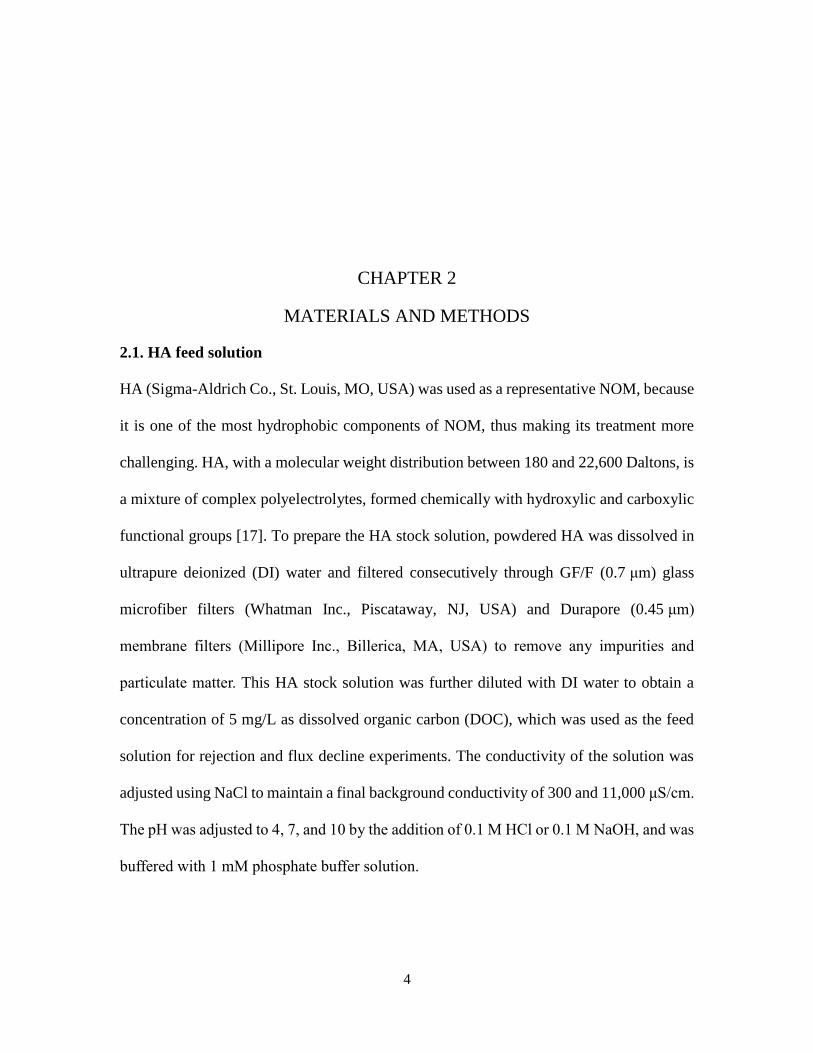
2.1. HA feed solution
HA (Sigma-Aldrich Co., St. Louis, MO, USA) was used as a representative NOM, because
it is one of the most hydrophobic components of NOM, thus making its treatment more
challenging. HA, with a molecular weight distribution between 180 and 22,600 Daltons, is
a mixture of complex polyelectrolytes, formed chemically with hydroxylic and carboxylic
functional groups [17]. To prepare the HA stock solution, powdered HA was dissolved in
ultrapure deionized (DI) water and filtered consecutively through GF/F (0.7 μm) glass
microfiber filters (Whatman Inc., Piscataway, NJ, USA) and Durapore (0.45 μm)
membrane filters (Millipore Inc., Billerica, MA, USA) to remove any impurities and
particulate matter. This HA stock solution was further diluted with DI water to obtain a
concentration of 5 mg/L as dissolved organic carbon (DOC), which was used as the feed
solution for rejection and flux decline experiments. The conductivity of the solution was
adjusted using NaCl to maintain a final background conductivity of 300 and 11,000 μS/cm.
The pH was adjusted to 4, 7, and 10 by the addition of 0.1 M HCl or 0.1 M NaOH, and was
buffered with 1 mM phosphate buffer solution.
5
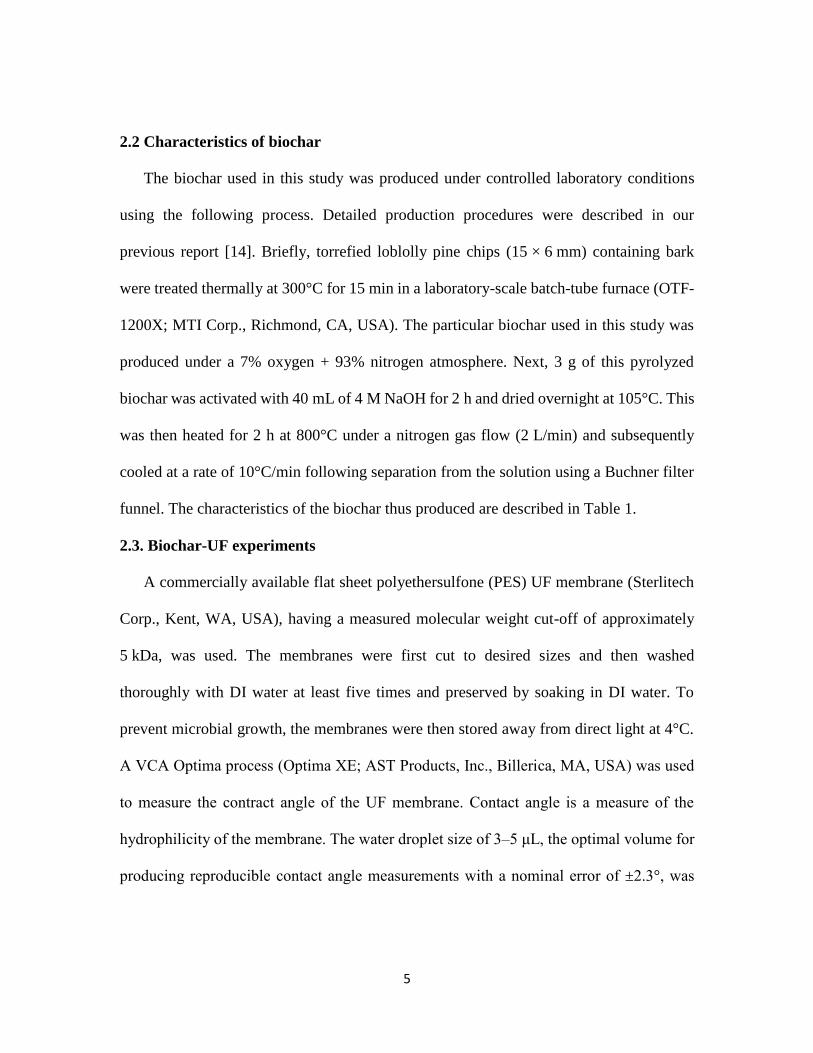
2.2 Characteristics of biochar
The biochar used in this study was produced under controlled laboratory conditions
using the following process. Detailed production procedures were described in our
previous report [14]. Briefly, torrefied loblolly pine chips (15 × 6 mm) containing bark
were treated thermally at 300°C for 15 min in a laboratory-scale batch-tube furnace (OTF-
1200X; MTI Corp., Richmond, CA, USA). The particular biochar used in this study was
produced under a 7% oxygen + 93% nitrogen atmosphere. Next, 3 g of this pyrolyzed
biochar was activated with 40 mL of 4 M NaOH for 2 h and dried overnight at 105°C. This
was then heated for 2 h at 800°C under a nitrogen gas flow (2 L/min) and subsequently
cooled at a rate of 10°C/min following separation from the solution using a Buchner filter
funnel. The characteristics of the biochar thus produced are described in Table 1.
2.3. Biochar-UF experiments
A commercially available flat sheet polyethersulfone (PES) UF membrane (Sterlitech
Corp., Kent, WA, USA), having a measured molecular weight cut-off of approximately
5 kDa, was used. The membranes were first cut to desired sizes and then washed
thoroughly with DI water at least five times and preserved by soaking in DI water. To
prevent microbial growth, the membranes were then stored away from direct light at 4°C.
A VCA Optima process (Optima XE; AST Products, Inc., Billerica, MA, USA) was used
to measure the contract angle of the UF membrane. Contact angle is a measure of the
hydrophilicity of the membrane. The water droplet size of 3–5 μL, the optimal volume for
producing reproducible contact angle measurements with a nominal error of ±2.3°, was
6
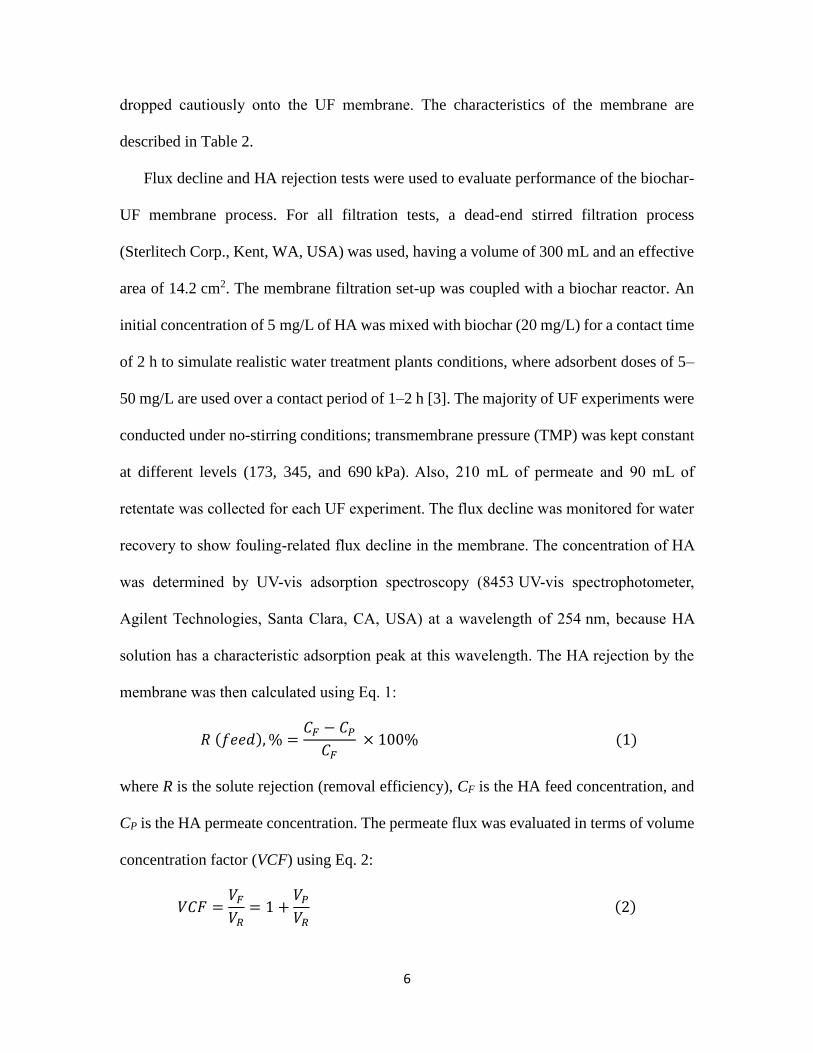
dropped cautiously onto the UF membrane. The characteristics of the membrane are
described in Table 2.
Flux decline and HA rejection tests were used to evaluate performance of the biochar-
UF membrane process. For all filtration tests, a dead-end stirred filtration process
(Sterlitech Corp., Kent, WA, USA) was used, having a volume of 300 mL and an effective
area of 14.2 cm2. The membrane filtration set-up was coupled with a biochar reactor. An
initial concentration of 5 mg/L of HA was mixed with biochar (20 mg/L) for a contact time
of 2 h to simulate realistic water treatment plants conditions, where adsorbent doses of 5–
50 mg/L are used over a contact period of 1–2 h [3]. The majority of UF experiments were
conducted under no-stirring conditions; transmembrane pressure (TMP) was kept constant
at different levels (173, 345, and 690 kPa). Also, 210 mL of permeate and 90 mL of
retentate was collected for each UF experiment. The flux decline was monitored for water
recovery to show fouling-related flux decline in the membrane. The concentration of HA
was determined by UV-vis adsorption spectroscopy (8453 UV-vis spectrophotometer,
Agilent Technologies, Santa Clara, CA, USA) at a wavelength of 254 nm, because HA
solution has a characteristic adsorption peak at this wavelength. The HA rejection by the
membrane was then calculated using Eq. 1:
𝑅 (𝑓𝑒𝑒𝑑), % =𝐶𝐹 − 𝐶𝑃
𝐶𝐹 × 100% (1)
where R is the solute rejection (removal efficiency), CF is the HA feed concentration, and
CP is the HA permeate concentration. The permeate flux was evaluated in terms of volume
concentration factor (VCF) using Eq. 2:
𝑉𝐶𝐹 =𝑉𝐹
𝑉𝑅= 1 +
𝑉𝑃
𝑉𝑅 (2)
7
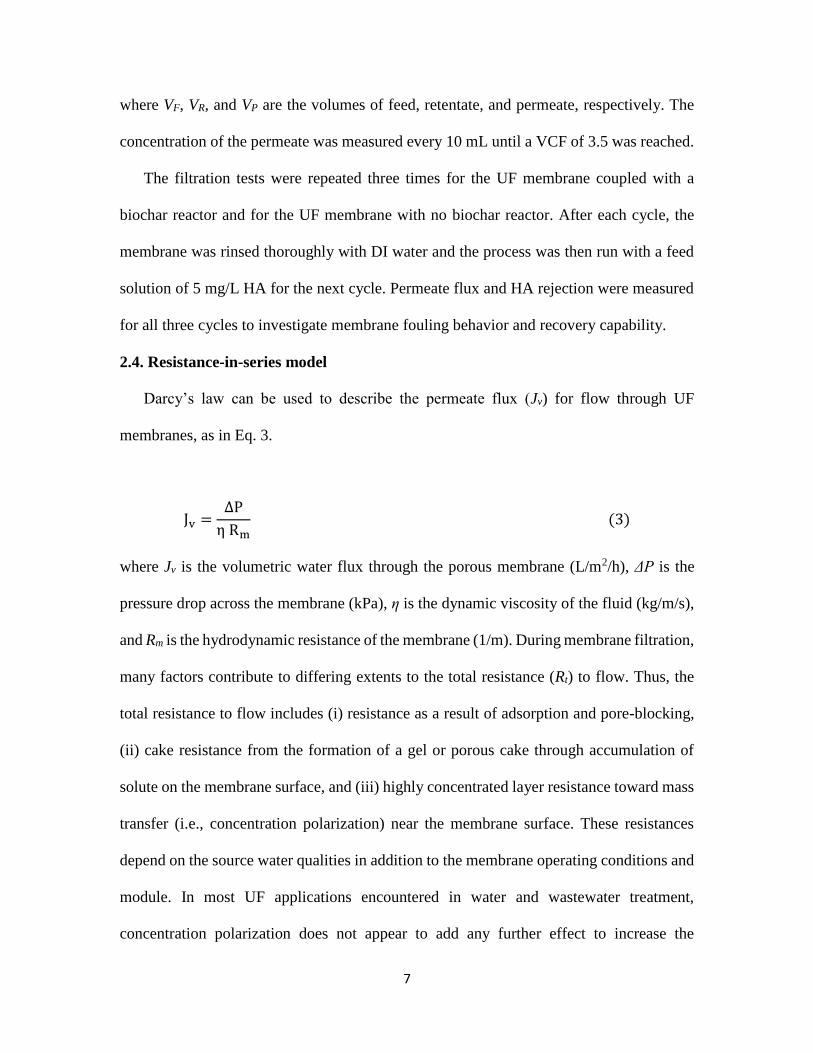
where VF, VR, and VP are the volumes of feed, retentate, and permeate, respectively. The
concentration of the permeate was measured every 10 mL until a VCF of 3.5 was reached.
The filtration tests were repeated three times for the UF membrane coupled with a
biochar reactor and for the UF membrane with no biochar reactor. After each cycle, the
membrane was rinsed thoroughly with DI water and the process was then run with a feed
solution of 5 mg/L HA for the next cycle. Permeate flux and HA rejection were measured
for all three cycles to investigate membrane fouling behavior and recovery capability.
2.4. Resistance-in-series model
Darcy’s law can be used to describe the permeate flux (Jv) for flow through UF
membranes, as in Eq. 3.
Jv =∆P
η Rm (3)
where Jv is the volumetric water flux through the porous membrane (L/m2/h), ΔP is the
pressure drop across the membrane (kPa), η is the dynamic viscosity of the fluid (kg/m/s),
and Rm is the hydrodynamic resistance of the membrane (1/m). During membrane filtration,
many factors contribute to differing extents to the total resistance (Rt) to flow. Thus, the
total resistance to flow includes (i) resistance as a result of adsorption and pore-blocking,
(ii) cake resistance from the formation of a gel or porous cake through accumulation of
solute on the membrane surface, and (iii) highly concentrated layer resistance toward mass
transfer (i.e., concentration polarization) near the membrane surface. These resistances
depend on the source water qualities in addition to the membrane operating conditions and
module. In most UF applications encountered in water and wastewater treatment,
concentration polarization does not appear to add any further effect to increase the

8
resistance after a cake layer forms near the membrane surface [19]. This indicates that
concentration polarization resistance becomes a negligible resistance factor in Jv. Thus, the
typical form of the resistance-in-series model for quantification of the filtration
characteristics through a UF membrane containing a cake layer can be expressed with Eq. 4
[20].
Jv = ∆P
η (Rm + Rc + Ra) (4)
where Rc is the cake layer resistance (l/m) and Ra is the adsorptive fouling resistance (l/m).

9
Table 2.1. Elemental composition, aromatic ratio, ash content, aromaticity, BET-N2
surface area (SA-N2), and cumulative pore volume of biochar used in this study.
Samples C
%
H
%
N
%
O
%
H/
C
Polarity
index Ash
%
Aromati
citya
SA-
N2b
(m2/g)
Pore volumec
(cm3/g)
N/
C
O/
C
micro
pore
macr
opore
Bioch
ar
83.
8
0.
24
0.
30
13
.0
0.0
34
0.0
03
0.1
16 2.7 74.1 1151 0.313 0.318
a Aromaticity = 100 × aromatic C (108–165 ppm)/[aromatic C (108–165 ppm) + aliphatic
C (0–108 ppm)]. b Calculated using the Brunauer–Emmett–Teller (BET) equation for data in the range less
than 0.1 of relative pressure. c Calculated from the adsorbed quantity of N2 at P/P0 = 0.95 with t-plot mod.
10
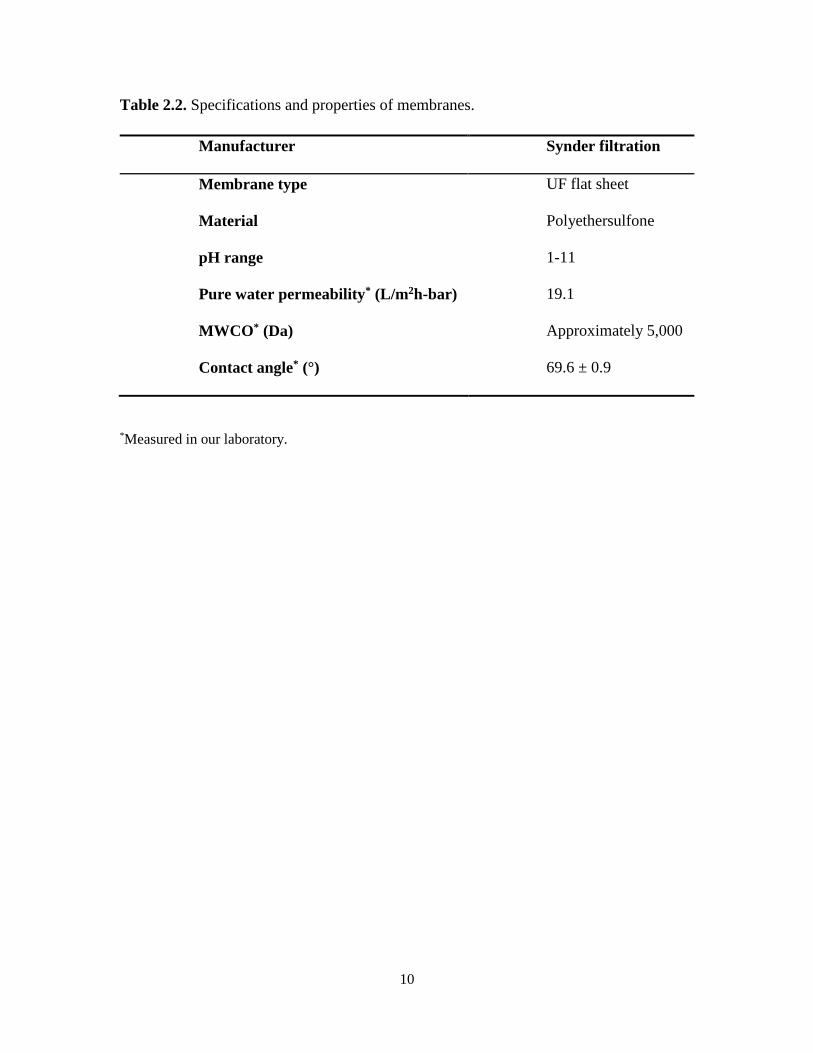
Table 2.2. Specifications and properties of membranes.
*Measured in our laboratory.
Manufacturer Synder filtration
Membrane type UF flat sheet
Material Polyethersulfone
pH range 1-11
Pure water permeability* (L/m2h-bar) 19.1
MWCO* (Da) Approximately 5,000
Contact angle* (°) 69.6 ± 0.9
11
CHAPTER 3
RESULTS AND DISCUSSION
3.1. Influence of biochar and hydrodynamic conditions on flux decline and HA
rejection
The biochar-UF process and UF alone (with no biochar) were compared in terms of
flux decline trends and HA removal efficiencies. In Fig. 1a and b, normalized flux is shown
as a function of VCF at a constant pH 7, conductivity of 300 S/cm, and a pressure of
345 kPa. The normalized flux (current permeate flux divided by the corresponding initial
flux) is used to provide dimensionless values of flux for a more reasonable comparison
between different conditions. VCF is also a widely used parameter in membrane filtration
studies [3, 21, 22]. It provides an advantage over using permeate volume by accounting for
the change in physicochemical properties of the membrane due to the retained HA during
filtration.
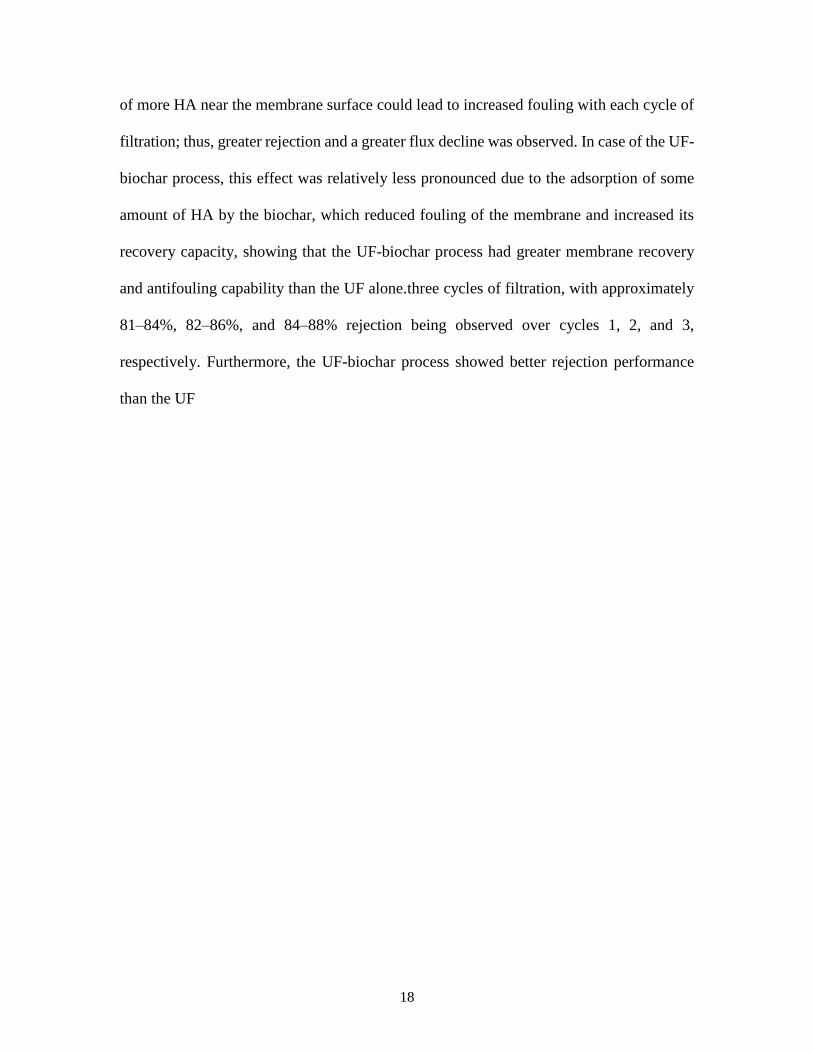
Fig. 1a shows the increase in flux for the UF-biochar process compared with the UF
alone at varying biochar concentration and unstirred conditions; the flux decline followed
the order no biochar ≥ 40 mg/L biochar > 20 mg/L biochar. This can be explained based
on the properties of the biochar (Table 1) and the hydrodynamic condition. The biochar
used in this study contained high aromaticity (74.1%), pore volume (micro- and macro-
pore, 0.313 and 0.318 cm3/g, respectively), and surface area (1151 m2/g), which enhanced
its adsorption of organic compounds, such as HA, leading to an increase in flux for the

12
process [23]. This is also evident under the stirred conditions (Fig. 1b) where the UF-
biochar process with 40 mg/L biochar showed the highest flux followed by the process
with 20 mg/L biochar. However, in the unstirred condition, a different trend occurred such
that 40 mg/L showed a lower flux than 20 mg/L biochar, presumably because under
unstirred conditions, such a high concentration of biochar, caused pore blockage and,
consecutively, a lower flux. This can be substantiated further by the fact that the small pore
size of the 5-kDa membrane used also leads to increased cake layer formation and,
consequently, lower flux [24]. It is evident that the flux decline trend was similar for all
three processes under stirred conditions, whereas a greater flux decline was noted due to
increased pore blocking under unstirred conditions.
Fig. 1c and d shows the effects of biochar concentration on HA removal in the
UF-biochar and UF-membrane processes. In comparing the data for the unstirred and
stirred conditions, it is clear that the stirred condition showed approximately 12% greater
HA rejection than the unstirred condition. However, under stirred conditions, the UF alone
showed slightly higher rejection than the UF-biochar process. This can be explained by the
occurrence of fouling due to concentration polarization in the initial stages, followed by
membrane pore blocking and gel resistance [25]. Under unstirred conditions, the three
processes showed similar rejection trends, while the process with 40 mg/L biochar showed
a greater decline in rejection over the VCFs. In comparison, the UF alone and UF
membrane with 20 mg/L biochar showed smaller declines in HA rejection. They also had
similar removal efficiencies: approximately 85% for both the UF-biochar (20 mg/L) and
UF alone processes. While a smaller flux decline and similar rejection trends were
observed under unstirred conditions, this study focused on the UF-biochar process under
13
unstirred conditions for the remainder of this study, since previous studies have suggested
that relatively less assumptions are necessary to evaluate membrane fouling resistance
using the resistance-in-series model at unstirred conditions [26-28]. Additionally, the
rejection rate for the UF-biochar process (40 mg/L) declined substantially over VCFs
versus 20 mg/L biochar, presumably because the biochar at a high concentration may act
as a foulant. Thus, 20 mg/L is considered a more optimum dose of biochar and the
performance of UF membrane combined with 20 mg/L biochar was studied in the removal
of HA under different water chemistry and operational conditions.
3.2. Effects of pH and conductivity
Various drinking water sources, such as ground/surface waters and wastewater
effluents, being treated have complex compositions, and varying pH and conductivity
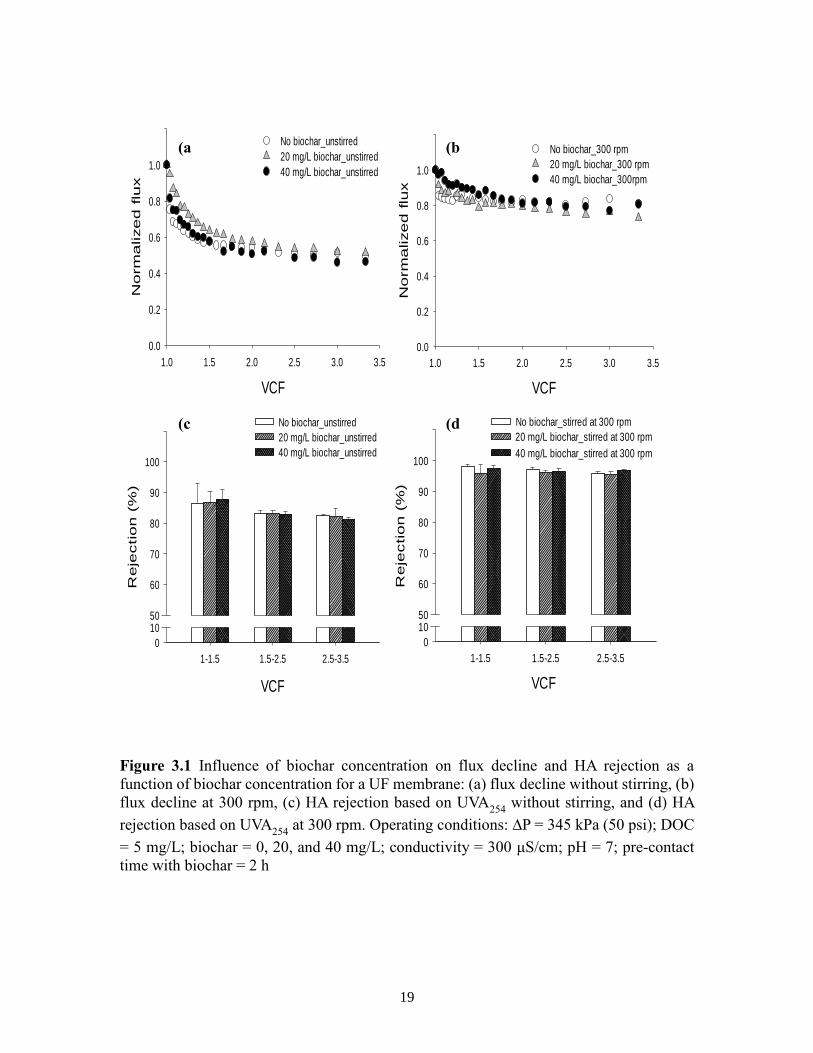
levels. Thus, it is important to evaluate the effects of solution pH on HA. Fig. 2 shows the
effects of pH on flux decline and HA rejection in the UF alone, and in the UF membrane
combined with 20 mg/L biochar, as a function of VCF. Generally, the UF-biochar process
showed a lower flux decline than the UF alone under all three pH conditions. Fig. 2a further
shows that the process had the worst flux decline at pH 4, where the UF-biochar process
showed a slightly higher flux (approximately 5%) than the UF alone. In comparison, the
flux decline was much less at pH 7 and 10 than that at pH 4, while the UF-biochar process
showed significantly higher flux (23.7%) than the UF alone at pH 7. Fig. 2b shows the HA
rejection trends under different pH conditions. The UF-membrane-alone and the UF-
biochar processes showed similar removal trends under different conditions. At pH 4, both
the processes showed significantly higher removal than at pH 7 and 10. The higher
rejection at pH 4 was also presumably due to the pore size reduction associated with

14
membrane fouling through HA concentration polarization at the membrane interface [2].
This was also observed in a previous study where, at lower pH, the rejection by UF
membranes increased to 90–95% [18]. This may also explain the lower flux observed in
Fig. 1a. In comparison, membrane fouling was found to be relatively low at the other pH
values and thus the process showed a higher flux. Another reason for higher rejection at
pH 4 is due to the fact that the negative charges on HA and the membrane surface become
less negative at lower pHs, leading to a reduction in electrostatic repulsion between the
two, thereby increasing adsorption and, consequently, the rejection rate [24].
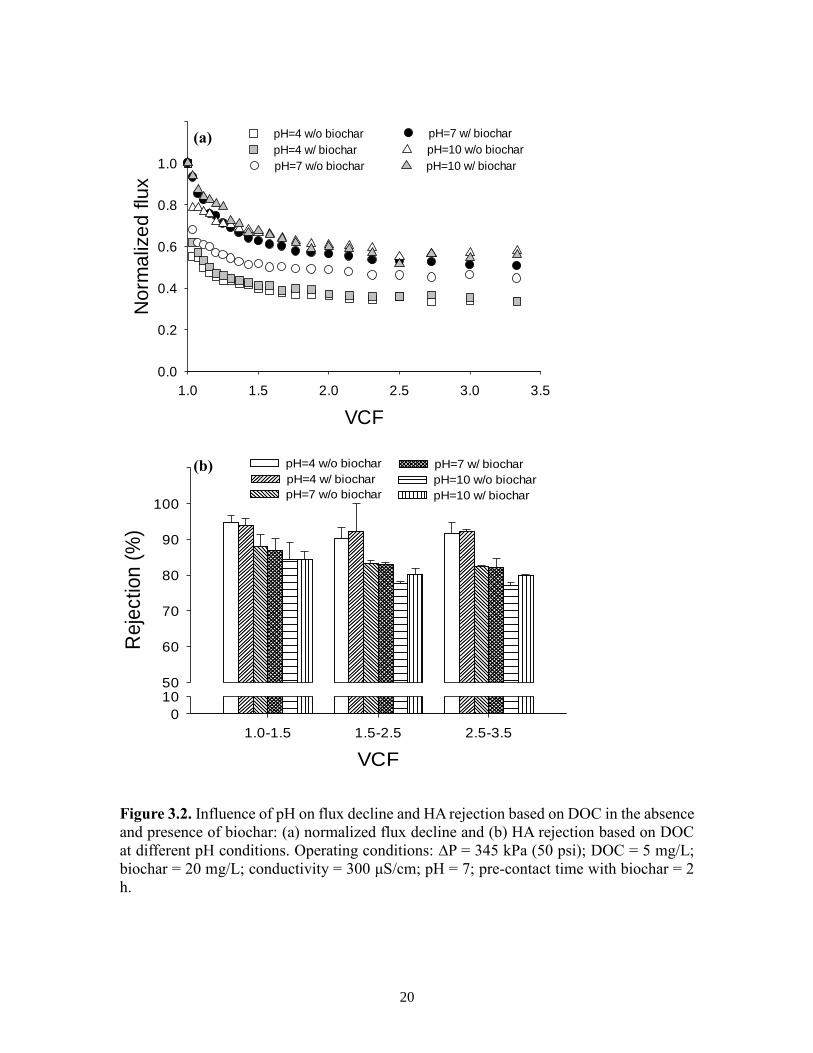
The effects of solution conductivity on the flux decline and rejection trends, of the UF
membrane process alone and the UF-biochar process, were observed under low and high
conductivity conditions, 300 and 11,000 S/cm, respectively (Fig. 3). Generally, it was
observed that with high conductivity conditions, the flux decline was slightly greater than
under low conductivity conditions. This trend toward flux decline with increasing
conductivity may seem to be contrary to the flux decline trend with increasing pH. The UF
alone showed a relatively high flux decline versus the UF-biochar process. Even in terms
of rejection, the high-conductivity conditions showed a slightly lower percentage rejection
(approximately 3.5%) than the no-salt conditions (Fig. 3b). Both the UF alone and UF-
biochar process showed lower rejection under increased conductivity and pH conditions.
In general, this can be explained by the fact that the effect of conductivity on adsorption
onto biochar is pH-dependent. In the high-conductivity conditions, the negative charge on
the biochar is neutralized by Na+ ions, which reduce the electrical double layer near the
surface, resulting in decreased electrostatic repulsion. This, in turn, increases the adsorption
rates [23]. In this case, however, the increased conductivity did not increase the rejection
15
percentage, which may be attributable to the neutral pH conditions under which the
experiment was conducted. This reduced the increased adsorption effect of biochar at
higher ionic strengths. Another factor that may support the observed trend is that at high
ionic strengths, the cake layer at the membrane surface becomes further compacted and
leads to increased membrane fouling, which reduces the rejection by the UF and UF-
biochar processes at high conductivity versus low conductivity conditions.
3.3. Membrane fouling resistance
The fouling layer characteristics associated with flux decline were evaluated using the
resistance-in-series model in the presence of biochar under various water chemistry and
operating conditions. Results of this analysis are summarized in Table 3. Unlike stirred
conditions, where significantly lower fouling resistances were observed, comparable trends
were obtained for the total fouling resistance in the UF-biochar and UF alone processes
under unstirred conditions. Fouling resistance increased with the HA solution under
unstirred conditions due to the formation of a cake/gel layer or concentration polarization
layer. It is known that a concentration polarization layer significantly influences membrane
resistance for flux decline in the concentration polarization-cake/gel layer model [20]. The
results showed that the total fouling resistances clearly decreased in the presence of
biochar, presumably due to HA adsorption onto the biochar (approximately 10% more HA
adsorption in the UF-biochar than the UF process alone). The membrane inner pores and
surface can be fouled readily by the high concentration of HA in the UF process alone,
resulting in higher fouling resistance than in the UF-biochar process. The highest total
fouling resistance (approximately 82 × 1012 1/m) occurred at pH 4. However, in general,
the fouling resistances decreased in the UF-biochar process under the same conditions,
16
because HA adsorption by biochar could considerably diminish the adsorptive fouling onto
the UF membrane, resulting in lower HA compaction on the membrane and an insignificant
fouling resistance increase in the UF-biochar process. In particular, the modeling results
indicate that the adsorptive fouling resistance was much higher than the cake resistance, as
indicated by the relatively low cake resistance ratio (Rc/Rt). These findings are consistent
with previous research results on HA adsorption fouling with UF membranes [5, 29, 30].
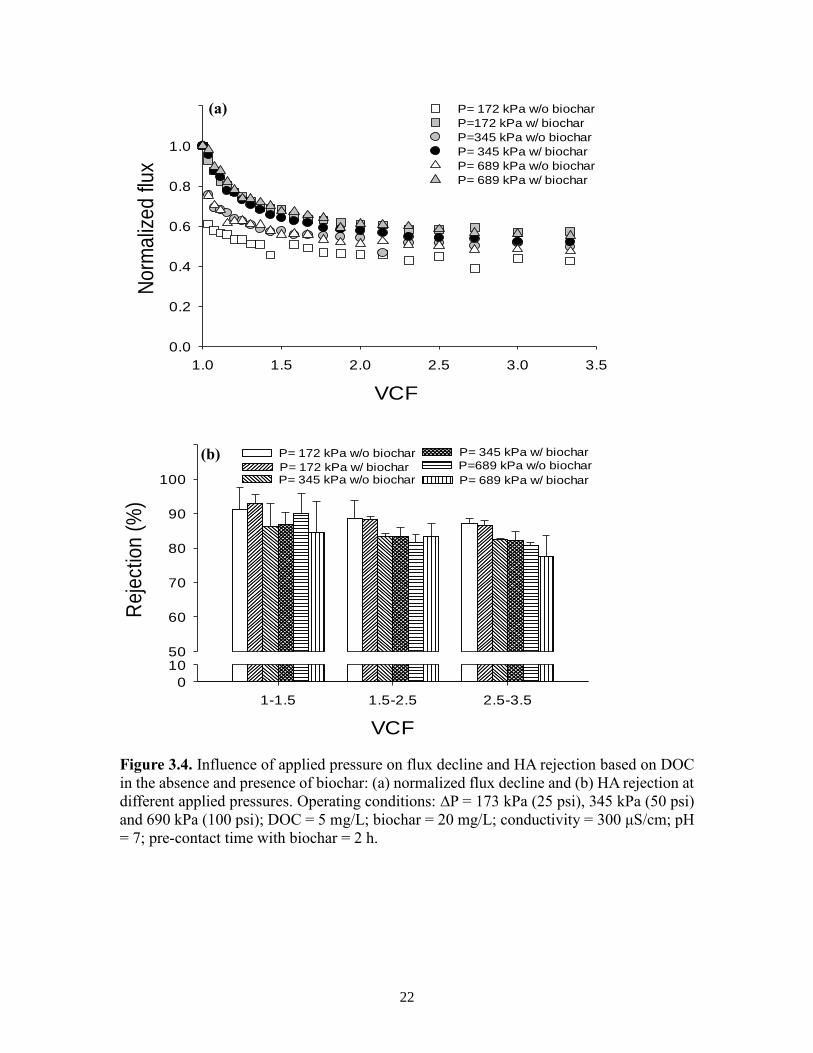
3.4. Influence of pressure and effects of three-cycle test
Fig. 4 shows flux decline and HA rejection trends over different applied pressures for
the UF-biochar and UF alone processes. Fig. 4a shows the normalized flux against VCF at
173, 345, and 690 kPa for the two processes. Generally, it can be seen that the flux decline
was less with an increase in applied pressure. The reason for this trend remains unclear;
however, one possible explanation is that at higher pressures, the cake layer formation at
the membrane surface is reduced; allowing more permeate flow and thus increased flux.
At 690 kPa, a significant increase in flux (74%) can be seen versus 173 kPa, and under all
three applied pressures, the UF-biochar process showed a higher flux than the UF alone
(25–29%). In Fig. 4b, rejection trends can be observed for UF-biochar and the UF alone at
the same applied pressures. Under all three pressure conditions, UF-biochar showed a
similar or slightly higher rejection trend than the UF alone. Both processes at 173 kPa
showed slightly higher rejection (89.8%) than at 345 kPa (84.7%) and 690 kPa (84.2%).
This trend is somewhat different from what has been observed in some previous studies on
adsorbent UF membrane combined processes, where a significant decrease in rejection was
noted (up to 50%) with increased pressure [3, 25, 31]. According to these studies, rejection
decreased with increased pressure, because an increase in pressure would cause greater
17
dominant convective processes in NOM rejection. Back diffusion would not contribute
significantly to NOM rejection because it was hindered by the stirring speed at which the
experiments were conducted. In our study, the experiments were conducted under unstirred
conditions and the effect of back diffusion could be more prominent, leading effectively to
a lesser decrease in rejection with increased pressure.
Fig. 5 shows the normalized flux and rejection percentages for the UF-biochar and UF-
membrane-alone processes over three filtration cycles. This helps compare the membrane
recovery capabilities of both systems. As expected, flux declined considerably over the
three cycles, with cycle 3 showing a 39–40% flux decline versus cycle 1. Neither the UF
membrane nor the UF-biochar processes showed full flux recovery over subsequent
filtration cycles, but the UF-biochar process showed a better flux recovery than the UF
alone. The UF membrane showed higher flux decline due to increased membrane fouling
over each filtration cycle. The UF-biochar process showed less flux decline, but some
amount of flux decline was due to the presence of biochar residue on the membrane surface,
which possibly hindered the thorough cleaning of the membrane with DI water before the
subsequent filtration cycle. A similar trend was observed in previous studies with other
adsorbents, such as PAC, coupled with UF membranes, indicating that PAC residue on the
membrane hindered backwashing and the backwashing process was only efficient for
adsorbent doses less than 20 mg/L [9].
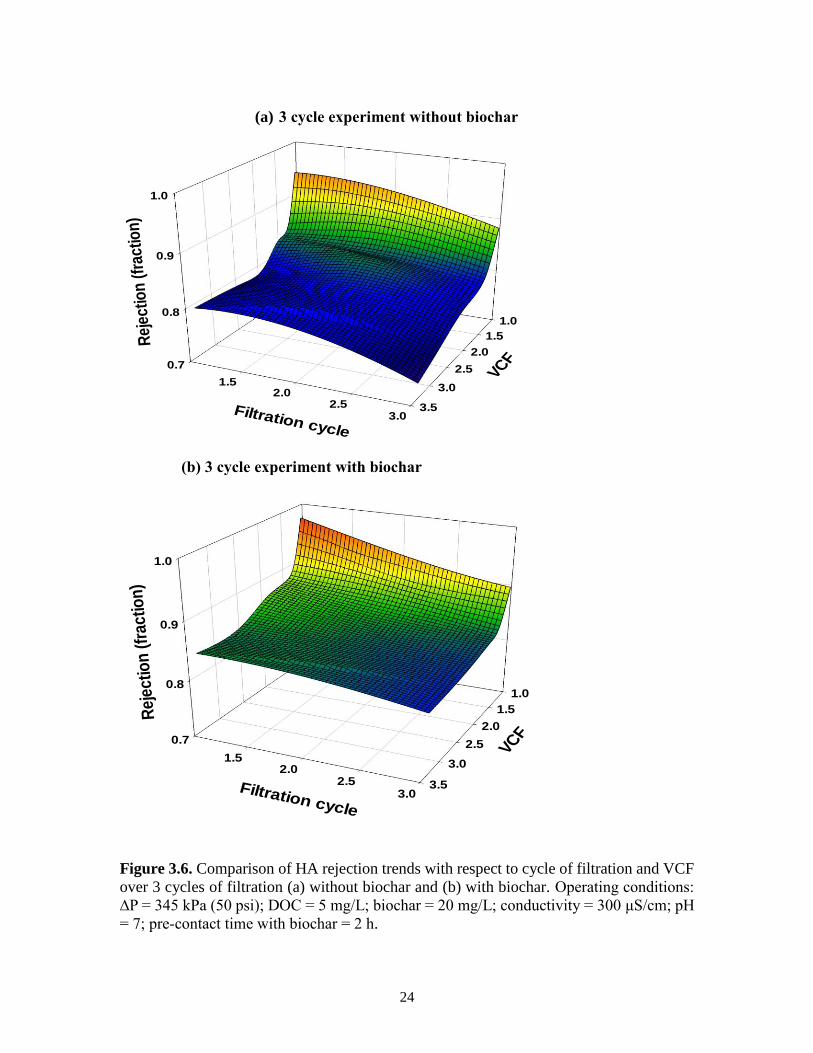
Fig. 5b shows the rejection trends over subsequent cycles of filtration: there was an
increase in rejection rates over the membrane in each membrane filtration cycle (3.1–
4.7%). This trend can be seen clearly in the 3D plot shown in Fig. 6. The reason for this
trend can be explained by the adsorption mechanisms discussed previously. The presence
18
of more HA near the membrane surface could lead to increased fouling with each cycle of
filtration; thus, greater rejection and a greater flux decline was observed. In case of the UF-
biochar process, this effect was relatively less pronounced due to the adsorption of some
amount of HA by the biochar, which reduced fouling of the membrane and increased its
recovery capacity, showing that the UF-biochar process had greater membrane recovery
and antifouling capability than the UF alone.three cycles of filtration, with approximately
81–84%, 82–86%, and 84–88% rejection being observed over cycles 1, 2, and 3,
respectively. Furthermore, the UF-biochar process showed better rejection performance
than the UF
19
Figure 3.1 Influence of biochar concentration on flux decline and HA rejection as a
function of biochar concentration for a UF membrane: (a) flux decline without stirring, (b)
flux decline at 300 rpm, (c) HA rejection based on UVA254
without stirring, and (d) HA
rejection based on UVA254
at 300 rpm. Operating conditions: ∆P = 345 kPa (50 psi); DOC
= 5 mg/L; biochar = 0, 20, and 40 mg/L; conductivity = 300 μS/cm; pH = 7; pre-contact
time with biochar = 2 h
VCF
1.0 1.5 2.0 2.5 3.0 3.5
No
rm
alize
d f
lux
0.0
0.2
0.4
0.6
0.8
1.0
1.2No biochar_unstirred
20 mg/L biochar_unstirred
40 mg/L biochar_unstirred
(a
)
VCF
1.0 1.5 2.0 2.5 3.0 3.5
No
rma
lize
d f
lux
0.0
0.2
0.4
0.6
0.8
1.0
1.2
No biochar_300 rpm
20 mg/L biochar_300 rpm
40 mg/L biochar_300rpm
(b
)
VCF
1-1.5 1.5-2.5 2.5-3.5
Re
jectio
n (
%)
0
1050
60
70
80
90
100
110No biochar_unstirred
20 mg/L biochar_unstirred
40 mg/L biochar_unstirred
(c
)
VCF
1-1.5 1.5-2.5 2.5-3.5
Re
jectio
n (
%)
0
1050
60
70
80
90
100
110No biochar_stirred at 300 rpm
20 mg/L biochar_stirred at 300 rpm
40 mg/L biochar_stirred at 300 rpm
(d
)
20
Figure 3.2. Influence of pH on flux decline and HA rejection based on DOC in the absence
and presence of biochar: (a) normalized flux decline and (b) HA rejection based on DOC
at different pH conditions. Operating conditions: ∆P = 345 kPa (50 psi); DOC = 5 mg/L;
biochar = 20 mg/L; conductivity = 300 μS/cm; pH = 7; pre-contact time with biochar = 2
h.
VCF
1.0 1.5 2.0 2.5 3.0 3.5
No
rma
lize
d f
lux
0.0
0.2
0.4
0.6
0.8
1.0
1.2pH=4 w/o biochar
pH=4 w/ biochar
pH=7 w/o biochar
pH=7 w/ biochar
pH=10 w/o biochar
pH=10 w/ biochar
(a)
VCF
1.0-1.5 1.5-2.5 2.5-3.5
Re
jectio
n (
%)
0
1050
60
70
80
90
100
110 pH=4 w/o biochar
pH=4 w/ biochar
pH=7 w/o biochar
pH=7 w/ biochar
pH=10 w/o biochar
pH=10 w/ biochar
(b)
21
Figure 3.3. Influence of conductivity on flux decline and HA rejection based on DOC in
the absence and presence of biochar: (a) normalized flux decline and (b) HA rejection
based on DOC. Operating conditions: ∆P = 345 kPa (50 psi); DOC = 5 mg/L; biochar =
20 mg/L; low and high conductivity = 300 μS/cm and 11,000 μS/cm, respectively; pH =
7; pre-contact time with biochar = 2 h.
VCF
1-1.5 1.5-2.5 2.5-3.5
Re
jectio
n (
%)
0
1050
60
70
80
90
100
110No salt w/o biochar
No salt w/ biochar
IS=0.1 M w/o biochar
IS=0.1 M w/ biochar
VCF
1.0 1.5 2.0 2.5 3.0 3.5
No
rma
lize
d f
lux
0.0
0.2
0.4
0.6
0.8
1.0
1.2 No salt w/o biochar
No salt w/ biochar
IS=0.1 M w/o biochar
IS=0.1 M w/ biochar
(a)
(b)
22
Figure 3.4. Influence of applied pressure on flux decline and HA rejection based on DOC
in the absence and presence of biochar: (a) normalized flux decline and (b) HA rejection at
different applied pressures. Operating conditions: ∆P = 173 kPa (25 psi), 345 kPa (50 psi)
and 690 kPa (100 psi); DOC = 5 mg/L; biochar = 20 mg/L; conductivity = 300 μS/cm; pH
= 7; pre-contact time with biochar = 2 h.
VCF
1.0 1.5 2.0 2.5 3.0 3.5
No
rma
lize
d f
lux
0.0
0.2
0.4
0.6
0.8
1.0
1.2 P= 172 kPa w/o biochar
P=172 kPa w/ biochar
P=345 kPa w/o biochar
P= 345 kPa w/ biochar
P= 689 kPa w/o biochar
P= 689 kPa w/ biochar
(a)
VCF
1-1.5 1.5-2.5 2.5-3.5
Re
ject
ion
(%
)
0
1050
60
70
80
90
100
110P= 172 kPa w/o biochar
P= 172 kPa w/ biochar P= 345 kPa w/o biochar
P= 345 kPa w/ biochar
P=689 kPa w/o biochar
P= 689 kPa w/ biochar
(b)

23
Figure 3.5. Influence of 3 cycles of filtration on flux decline and HA rejection based on
DOC in the presence and absence of HA: (a) normalized flux decline and (b) HA rejection
over 3 cycles of filtration. Operating conditions: ∆P = 345 kPa (50 psi); DOC = 5 mg/L;
biochar = 20 mg/L; conductivity = 300 μS/cm; pH = 7; pre-contact time with biochar = 2
h.
VCF
1.0 1.5 2.0 2.5 3.0 3.5
No
rma
lize
d f
lux
0.0
0.2
0.4
0.6
0.8
1.0
1.2 Cycle 1 w/o biochar
Cycle 1 w/ biochar
Cycle 2 w/o biochar
Cycle 2 w/ biochar
Cycle 3 w/o biochar
Cycle 3 w/ biochar
(a)
VCF
1-1.5 1.5-2.5 2.5-3.5
Re
jectio
n (
%)
0
1050
60
70
80
90
100
110 Cycle 1 w/o biochar
Cycle 1 w/ biochar
Cycle 2 w/o biochar
Cycle 2 w/ biochar
Cycle 3 w/o biochar
Cycle 3 w/ biochar
(b)
24
0.7
0.8
0.9
1.0
1.0
1.5
2.0
2.5
3.0
3.5
1.52.0
2.53.0
Rej
ectio
n (
frac
tion
)
VCF
Filtration cycle
(a) 3 cycle experiment without biochar
0.7
0.8
0.9
1.0
1.0
1.5
2.0
2.5
3.0
3.5
1.52.0
2.53.0
Re
jec
tio
n (
fra
cti
on
)
VCF
Filtration cycle
(b) 3 cycle experiment with biochar
Figure 3.6. Comparison of HA rejection trends with respect to cycle of filtration and VCF
over 3 cycles of filtration (a) without biochar and (b) with biochar. Operating conditions:
∆P = 345 kPa (50 psi); DOC = 5 mg/L; biochar = 20 mg/L; conductivity = 300 μS/cm; pH
= 7; pre-contact time with biochar = 2 h.

25
Table 3.1. Characteristics of the fouling layer and resistances as a function of unit retained
DOC mass in the absence and presence of biochar and various operating conditions
according to resistance-in-series model.
Process Solution & operating
conditions
Characteristics of the fouling layer and resistances
TMP (kPa)
pH IS Rm (1012 m-
1)
Rt
(1012m-1) Rc
(1012m-1) Rc/Rt δ
UF 345 7.0 No salts 27.5 55.5 18.1 0.327
92.3
7.0* 26.2 32.5 28.9 0.089
33.5
4.0 27.7 82.0 14.8 0.181
177.7
10.0 27.5 47.3 18.7 0.396
90.1
345 7.0 0.1 M 27.5 55.5 23.1 0.417
92.2
173 7.0 No salts 22.8 53.6 11.3 0.211
91.7
690 7.0 27.4 57.7 10.5 0.182
95.6
Biochar-UF
(40 mg/L)
345
7.0
No salts
24.4
52.7
21.2
0.40
2
85.9
Biochar-
UF (20 mg/L)
345
7.0 No salts 27.1 52.3 15.5 0.296
91.2
7.0* 21.0 28.7 51.0 0.178
31.8
4.0 27.5 81.8 23.9 0.293
172.8
10.0 23.9 42.8 18.1 0.424
89.5
345 7.0 0.1 M 22.9 45.2 19.1 0.423
78.0
173 7.0 No salts 22.3 38.9 10.1 0.260
64.0
690 7.0 23.3 42.2 13.3 0.315
68.3
*stirring.
26
CHAPTER 4
CONCLUSIONS
In this study, we investigated the performance of an integrated process of a UF
membrane with biochar, to improve the shortcomings of UF membranes alone in the
treatment of challenging compounds, such as HA. It was found that hydrodynamic
conditions strongly affected the performance of the processes, with UF-biochar showing
similar removal but higher flux than the UF alone under unstirred conditions of operation
versus stirred conditions, where the UF membrane showed slightly better rejection and
similar flux to UF-biochar. Then, we focused on the unstirred condition of operation and
the performances of the two processes were evaluated at various pH and conductivity
levels. At pH 4, UF-biochar showed significantly higher rejection and subsequently higher
flux decline than at pH 7 and 10, which was attributed to concentration polarization
occurring at the lower pH level. UF-biochar showed better flux and similar or higher
rejection than the UF alone under all three pH conditions. Regarding conductivity, better
flux was observed at lower than at higher conductivity and UF-biochar performed better.
Both the UF alone and UF-biochar processes showed less rejection with increasing
conductivity and pH. To understand the complete working of the processes, another
important aspect such as membrane recovery was analyzed for both processes, and UF-
biochar showed better recovery and less flux decline after three cycles of filtration. This
helped establish that integration of biochar with the UF

27
membrane treatment technology hindered membrane fouling to some extent and improved
the treatment of NOM like HA. Although future studies still need to explore the exact
mechanisms of the treatment processes, this study demonstrated that an integrated process
with UF-biochar may be useful for future applications in the treatment of NOM.
28
REFERENCES
[1] B. Hua, J. Yang, J. Lester, B.L. Deng, Physico-chemical processes, Water Environ.
Res. 85 (2013) 963-991.
[2] Y.M. Yoon, G. Amy, J.W. Cho, N. Her, Effects of retained natural organic matter
(NOM) on NOM rejection and membrane flux decline with nanofiltration and
ultrafiltration, Desalination, 173 (2005) 209-221.
[3] J. Heo, H. Kim, N. Her, S. Lee, Y.G. Park, Y. Yoon, Natural organic matter removal in
single-walled carbon nanotubes-ultrafiltration membrane systems, Desalination 298
(2012) 75-84.
[4] C.H. Yu, C.H. Wu, C.H. Lin, C.H. Hsiao, C.F. Lin, Hydrophobicity and molecular
weight of humic substances on ultrafiltration fouling and resistance, Sep. Purif.
Technol. 64 (2008) 206-212.
[5] A.W. Zularisam, A.F. Ismail, R. Salim, Behaviours of natural organic matter in
membrane filtration for surface water treatment - a review, Desalination 194 (2006)
211-231.
[6] T. Lebeau, C. Lelievre, H. Buisson, D. Cleret, L.W. Van de Venter, P. Cote, Immersed
membrane filtration for the production of drinking water: combination with PAC for
NOM and SOCs removal, Desalination 117 (1998) 219-231.
[7] M. Campinas, M.J. Rosa, Assessing PAC contribution to the NOM fouling control in
PAC/UF systems, Water Res. 44 (2010) 1636-1644.
29
[8] Q.L. Li, V.L. Snoeyink, B.J. Marinas, C. Campos, Pore blockage effect of NOM on
atrazine adsorption kinetics of PAC: the roles of PAC pore size distribution and NOM
molecular weight, Water Res. 37 (2003) 4863-4872.
[9] M. Tomaszewska, S. Mozia, Removal of organic matter from water by PAC/UF system,
Water Res. 36 (2002) 4137-4143.
[10] H. Oh, M. Yu, S. Takizawa, S. Ohgaki, Evaluation of PAC behavior and fouling
formation in an integrated PAC-UF membrane for surface water treatment,
Desalination 192 (2006) 54-62.
[11] C. Jung, L.K. Boateng, J.R.V. Flora, J. Oh, M.C. Braswell, A. Son, Y. Yoon,
Competitive adsorption of selected non-steroidal anti-inflammatory drugs on activated
biochars: Experimental and molecular modeling study, Chem. Eng. J. 264 (2015) 1-9.
[12] C. Jung, J. Oh, Y. Yoon, Removal of acetaminophen and naproxen by combined
coagulation and adsorption using biochar: influence of combined sewer overflow
components, Environ. Sci. Pollut. R. 22 (2015) 10058-10069.
[13] C. Jung, N. Phal, J. Oh, K.H. Chu, M. Jang, Y. Yoon, Removal of humic and tannic
acids by adsorption-coagulation combined systems with activated biochar, J. Hazard.
Mater. 300 (2015) 808-814.
[14] C. Jung, J. Park, K.H. Lim, S. Park, J. Heo, N. Her, J. Oh, S. Yun, Y. Yoon, Adsorption
of selected endocrine disrupting compounds and pharmaceuticals on activated
biochars, J. Hazard. Mater. 263 (2013) 702-710.
[15] G.N. Kasozi, A.R. Zimmerman, P. Nkedi-Kizza, B. Gao, Catechol and Humic Acid
Sorption onto a Range of Laboratory-Produced Black Carbons (Biochars), Environ.
Sci. Technol. 44 (2010) 6189-6195.
30
[16] K. Konieczny, G. Klomfas, Using activated carbon to improve natural water treatment
by porous membranes, Desalination 147 (2002) 109-116.
[17] C.F. Lin, Y.J. Huang, I.J. Hao, Ultrafiltration processes for removing humic
substances: Effect of molecular weight fractions and PAC treatment, Water Res. 33
(1999) 1252-1264.
[18] R. Chintala, T.E. Schumacher, S. Kumar, D.D. Malo, J.A. Rice, B. Bleakley, G.
Chilom, D.E. Clay, J.L. Julson, S.K. Papiernik, Z.R. Gu, Molecular characterization of
biochars and their influence on microbiological properties of soil, J. Hazard. Mater.
279 (2014) 244-256.
[19] T.D. Waite, A.I. Schafer, A.G. Fane, A. Heuer, Colloidal fouling of ultrafiltration
membranes: Impact of aggregate structure and size, J. Colloid Interf. Sci. 212 (1999)
264-274.
[20] M. Mulder, Basic Principles of Membrane Technology, 2nd Edition, Dordrecht, The
Netherlands, Kluwer Academic Publishers, 1996.
[21] S. Lee, J.W. Cho, M. Elimelech, Combined influence of natural organic matter (NOM)
and colloidal particles on nanofiltration membrane fouling, J. Hazard. Mater. 262
(2005) 27-41.
[22] Y. Yoon, R.M. Lueptow, Removal of organic contaminants by RO and NF
membranes, J. Membrane Sci. 261 (2005) 76-86.
[23] M. Ahmad, A.U. Rajapaksha, J.E. Lim, M. Zhang, N. Bolan, D. Mohan, M. Vithanage,
S.S. Lee, Y.S. Ok, Biochar as a sorbent for contaminant management in soil and water:
A review, Chemosphere, 99 (2014) 19-33.

31
[24] E. Aoustin, A.I. Schafer, A.G. Fane, T.D. Waite, Ultrafiltration of natural organic
matter, Sep. Purif. Technol. 22-3 (2001) 63-78.
[25] J. Heo, L. Joseph, Y. Yoon, Y.G. Park, N. Her, J. Sohn, S.H. Yoon, Removal of
micropollutants and NOM in carbon nanotube-UF membrane system from seawater,
Water Sci. Technol. 63 (2011) 2737-2744.
[26] J.D. Lee, S.H. Lee, M.H. Jo, P.K. Park, C.H. Lee, J.W. Kwak, Effect of coagulation
conditions on membrane filtration characteristics in coagulation-microfiltration
process for water treatment, Environ. Sci. Technol. 34 (2000) 3780-3788.
[27] S. Nicolas, B. Balannec, F. Beline, B. Bariou, Ultrafiltration and reverse osmosis of
small non-charged molecules: a comparison study of rejection in a stirred and an
unstirred batch cell, J. Membrane Sci. 164 (2000) 141-155.
[28] S. Bhattacharjee, P.K. Bhattacharya, Flux decline behavior with low-molecular-
weight solutes during ultrafiltration in an unstirred batch cell, J. Membrane Sci. 72
(1992) 149-161.
[29] K.L. Jones, C.R. O'Melia, Protein and humic acid adsorption onto hydrophilic
membrane surfaces: effects of pH and ionic strength, J. Membrane Sci. 165 (2000) 31-
46.
[30] C.-H. Yu, C.-H. Wu, C.-H. Lin, C.-H. Hsiao, C.-F. Lin, Hydrophobicity and molecular
weight of humic substances on ultrafiltration fouling and resistance, Sep. Purif.
Technol. 64 (2008) 206-212.
[31] V. Lahoussineturcaud, M.R. Wiesner, J.Y. Bottero, Fouling in tangential-flow
ultrafiltration - the effect of colloid size and coagulation pretreatment, J. Membrane
Sci. 52 (1990) 173-190.