Embed Size (px)
Citation preview

Am. J. Trop. Med. Hyg., 94(5), 2016, pp. 1157–1169doi:10.4269/ajtmh.15-0192Copyright © 2016 by The American Society of Tropical Medicine and Hygiene
Use of Balanced Scorecard Methodology for Performance Measurementof the Health Extension Program in Ethiopia
Hailay D. Teklehaimanot,* Awash Teklehaimanot, Aregawi A. Tedella, and Mustofa AbdellaCenter for National Health Development in Ethiopia, Columbia University, Addis Ababa, Ethiopia; The Earth Institute,
Columbia University, New York, New York
Abstract. In 2004, Ethiopia introduced a community-based Health Extension Program to deliver basic and essentialhealth services. We developed a comprehensive performance scoring methodology to assess the performance of theprogram. A balanced scorecard with six domains and 32 indicators was developed. Data collected from 1,014 serviceproviders, 433 health facilities, and 10,068 community members sampled from 298 villages were used to generateweighted national, regional, and agroecological zone scores for each indicator. The national median indicator scoresranged from 37% to 98% with poor performance in commodity availability, workforce motivation, referral linkage,infection prevention, and quality of care. Indicator scores showed significant difference by region (P < 0.001). Regionalperformance varied across indicators suggesting that each region had specific areas of strength and deficiency, withTigray and the Southern Nations, Nationalities and Peoples Region being the best performers while the mainly pastoralregions of Gambela, Afar, and Benishangul-Gumuz were the worst. The findings of this study suggest the need forstrategies aimed at improving specific elements of the program and its performance in specific regions to achieve qualityand equitable health services.
INTRODUCTION
In 2004, the Federal Ministry of Health (FMOH) of Ethiopiaintroduced the Health Extension Program (HEP), a primarycare strategy for scaling up essential health promotion, diseaseprevention, and basic curative services.1 HEP was designedwith the most basic health infrastructure in the context oflimited resources.2 The national health system was reformedto create a platform for integration and institutionalizationof HEP.3 A total of 38,819 female Health Extension Workers(HEWs) with a high school education who received 1-yeartraining on HEP were deployed in over 15,000 newlyconstructed health posts in rural villages.4 The candidates wererecruited from their prospective villages to limit staff turnoverand address gender, social, and cultural factors in service pro-vision. HEP comprises 16 service packages covering familyhealth, communicable diseases, and sanitation and hygieneprograms. HEWs provide health post and community-basedservices. The community-based services include provision ofhousehold and outreach services and model family package.The model family package delivery involves theoretical andpractical training of selected households on the various HEPservices. Innovators and early adopters who embrace changeopportunities are selected to receive the model family train-ing. To graduate as a model-family, households undergo train-ing on the various HEP services for about 96 hours and arerequired to implement and adopt the HEP package. Themodel family households serve as intermediary change agentswithin their respective neighborhood, while some volunteermodel families serve as health promoters to support the com-munity level activities of HEWs. Village health committeeand village administration support the implementation ofHEP in their respective villages. In line with the country’sdecentralized governance system, the District Health Office is
responsible for management of HEP, while the health centers,each linked to five health posts, provide technical, logistic,and administrative support and serve as referral center.5
HEP has come to be considered the most important institu-tional framework for achieving the health Millennium Devel-opment Goals in Ethiopia.6 It is therefore imperative thatHEP should be evaluated to determine whether its objectivesare being achieved and to document factors that facilitate orhinder the realization of the objectives.7,8 This requires com-prehensive measures that provide evidence on performance ofa range of health system elements for decision makers whilealso promoting good governance and accountability.The balanced scorecard (BSC), which was originally devel-
oped for industry by Kaplan and Norton, has been used inthe health sector for integrated performance measurementand strategic management.9–15 The BSC aids in the identifica-tion, organization, and linkage of a balanced set of indicatorsthrough strategic mapping of performance dimensions.10,14,16
The system facilitates benchmarking for comparison acrossareas and over time and guides in prioritization of resources.Despite its strategic benefit and wide application in developedcountries, the application of scorecard in developing countrieshas been limited, perhaps due to the unfavorable health-careenvironment.14,16–21 Among the few developing countries,Afghanistan has been the pioneer in integrating BSC into itsnational health system.14,16,18
In 2010, FMOH introduced BSC as a planning and man-agement tool and developed its Health Sector DevelopmentProgram (HSDP IV) based on the BSC framework.4 BSChas been implemented at the FMOH and federal hospitalslevels and remains to be cascaded to all levels of the healthsystem. HEP is one of the core components of HSDP, andalthough studies have documented the performance of theprogram on individual indicators,22–26 there is limited evidenceon integrated performance indices and scoring methodolo-gies.8 We developed a scoring methodology for performanceevaluation of HEP based on the BSC approach14,21 and gen-erated performance indices using data obtained from nation-wide HEP evaluation survey. It compared performance ofvarious geographic areas and identified health system elements
*Address correspondence to Hailay D. Teklehaimanot, Center forNational Health Development in Ethiopia, Columbia University, BoleSub City, Kebele 06, H. No. 447, P.O. Box 664, Code 1250, AddisAbaba, Ethiopia. E-mail: [email protected]
1157

that scored poorly to inform the development of interventionsaimed at strengthening the program.
MATERIALS AND METHODS
Conceptual structure of the BSC. Health system perfor-mance depends on the strength of multidimensional systemsincluding human and physical resources, finance, quality ofcare, health information, management, and community par-ticipation.27 To ensure that all key health system elementswere included in the performance measurement, a BSC con-ceptual framework that captures all the HEP dimensions wasdesigned (Figure 1).4,5,28 The framework was used to identifysix performance domains (namely, capacity for service provi-sion, financial systems, human resource development, com-munity engagement, service delivery process, and outputsand outcomes) based on the Kaplan and Norton approachand building on the BSC tool that was developed for use inlow-income countries by Peters and others.12,14 The BSCincluded 32 core performance indicators (Table 1), eachbelonging to one of the six domains. Most indicators weredrawn from the FMOH monitoring and evaluation frame-work,4 while some were included based on other acceptedframeworks to balance indicator distribution among thedomains.27,29 The indicators were selected based on theirimportance, scientific soundness, and feasibility.16,30 To clar-ify the concepts in the framework, the performance dimen-
sions are described below and the underlying indicators aresummarized in Table 1.“Capacity for service provision” domain refers to the pre-
paredness of the system based on the HEP standards forhuman and physical resources and included 10 indicators.The human resources aspect covered indicators that measurethe number and qualification of providers (staffing index)and district managers (management capacity index). Indica-tors on physical resources included infrastructure index (suchas health post, latrine, power, electricity, and water), medicalequipment availability and functionality index, commodityindex (including drugs, contraceptives, vaccines, and malariarapid diagnostic tests), and availability of HEP guidelinesand use of information, education, and communication (IEC)materials. Other indicators under this domain included thesupply distribution system, the health management informa-tion system (HMIS), the health center capacity index (mea-sured by the availability of infrastructure, equipment, drugs,and staff for emergency obstetric care), and supervision index(measuring the capacity and quality of supervision).31 Thesestructural elements determine the physical accessibility andcapacity to provide services and therefore influence the reali-zation of the full potential of a program.32
“Financial systems” domain refers to the financial input,which is usually inadequate in developing countries but criticalto deliver quality services.33 Although finance was oftenincluded under capacity for service provision,34 we consideredthis domain with two indicators covering running costs for
FIGURE 1. Conceptual framework for comprehensive performance assessment of Health Extension Program in rural Ethiopia.
1158 TEKLEHAIMANOT AND OTHERS

TABLE 1Core indicators used to develop the BSC for HEP in rural Ethiopia
Indicators Description and the factors that went into the indicator
Capacity for service provisionHEP staffing This deals with the number and qualification of service providers at the village level (including HEWs and
volunteer health promoters). The standard for HEP staffing at the village level is to have at least twoHEWs and one health promoter for every 40 households
Health facility infrastructure The infrastructure index deals with whether the health post has the required infrastructure, facilities,and amenities that enable it to render services as per the standard. It covers the availability of healthpost building with at least three rooms, the availability of electricity, water and telephonecommunication, toilet access to patients, and availability of means of transportation
Equipment functionality It measures whether the health post is equipped with the minimum medical equipment required to deliverthe HEP services based on the standard. The availability and functionality of the following wereconsidered: examination bed, thermometer, blood pressure apparatus, stethoscope, delivery bed,home delivery kit, neonatal resuscitation mask and bag, baby weighing scale, Salter scale, measuringboard, and refrigerator
Commodity availability This covers the availability of essential medical supplies and vaccines required to deliver the basic healthservices. The following medical supplies were considered: Coartem, oral rehydration salt, contraceptives,ergometrine, iron tablets, folic acid, vitamin A, amoxicillin, RDT for malaria, HIV test kit, and analgesics.The various antigens required for child and mother immunizations were also included
Supply management system This indicator deals with the supply, storage, distribution, and management of medical supplies at thehealth post, health center, and woreda health office. At the health post, the frequency and waiting timeof supply replenishment, the adequacy of supplies, and the ability of HEWs to identify expired drugswere considered. At the health center, availability of adequate stocks of medical supplies (drugs,vaccines, medical equipment, and supplies) for distribution to health posts and availability of adequateand secure storage facility were considered. The availability of medical supplies for all health posts andtheir sources were considered at the district level
HEP guideline and IEC use It deals with the availability of IEC such as posters and flip charts covering the various HEP servicepackages and summary charts, and whether the materials were displayed plainly at the health post.It also covers the availability of guidelines for HEP implementation, obstetric care, growth monitoring,and malaria case management
HMIS use The HMIS use indicator deals with the availability and proper use of registers for the various HEPservice packages including birth and death registration. It also covers reporting and use of informationfor decision making
Health center capacity This indicator covers factors that affect the readiness of the health center to serve as referral facility forthe health posts. The factors considered included the distance from the health post, availability ofservice for 24 hours, availability and use of injectable drugs and supplies for emergency obstetric care(such as diazepam, magnesium sulfate, oxytocin, ergometrine, amoxicillin, gentamicin, intravenousinfusion, incubator, and forceps and vacuum extractor for assisted delivery), availability of staff who canadminister the drugs and perform the procedures, availability of blood transfusion and cesarean sectionservices, and availability of other services that require referral
Management capacity This indicator deals with human resource performance management, planning process, HEP performancemonitoring, and partner collaboration. The human resource performance management considered theavailability and approaches used to conduct performance assessment of HEWs, ensure adherence to codeof conduct, and motivate good performing HEWs. The planning process covered the use of baselineinformation for planning and the involvement of HEWs in planning process. The HEP performancemonitoring covered the involvement of health centers and district health offices, the performancemonitoring methods used (such as review of monthly reports, and regular meetings with HEWs), the useof information for decision making, and the comprehensiveness of the indicators used for HEPperformance monitoring. The partner collaboration covered the level of support to health posts fromdistrict and kebele administrations
Supervision capacity The supervision index covers the human resource capacity for supervision available at the health centersand district health offices, the logistics (supervision guidelines and checklists, transportation and budgetfor supervision), availability of supervision plan and schedule, performance in supervision (relative toplan and the number of supervisory visits made to health posts over 3 months), the use of appropriatesupervision methods and quality of supervision (which is characterized by multidisciplinary team,frequent and regular, person-to-person discussions, discussions with local community and leaders,useful and supportive guidance, and supervisors listen and value HEWs’ suggestions), and provisionof feedback and follow-up to ensure that correction measures are taken
Financial systemsFinancing referral system The financing referral system covers the availability of sustainable arrangements for financing emergency
referral services (such as funds/fuel set aside, community insurance scheme, or revolving funds) andavailability of barriers for referral system (such as lack or high cost of transportation and cost of servicesand drugs at referral health facilities)
Financing medical supplies The financing medical supplies cover the availability of adequate funding for medical supplies and whetherpatients are referred due to lack of basic medical supplies
(continued)
1159BALANCED SCORECARD FOR ETHIOPIAN HEALTH EXTENSION PROGRAM
TABLE 1Continued
Indicators Description and the factors that went into the indicator
Human resourcesHEW knowledge The HEW knowledge index covers HEW’s competence in providing the key HEP service packages.
The assessment included knowledge on maternal health (such as on benefits of ANC, signs andmonitoring of labor, immediate newborn care, and management (diagnosis and actions taken by HEWs)when a woman comes with heavy bleeding during or after delivery, retained placenta, obstructed labor,infection, eclampsia, severe anemia, and severe malaria); neonatal and child health (including ondiagnosis and action taken by HEWs when there is neonatal infection and underweight, acuterespiratory infection, diarrhea, and danger signs); family planning (counseling skills regarding theeffectiveness, benefits, and risks of all available methods); malaria diagnosis and treatment; andimmunization administration schedules
In-service training This indicator covers the provision of in-service training to HEWs on various HEP service packages inthe year before the survey and provision of in-service training to HEW supervisors on HEP andsupervision techniques
HEW satisfaction This indicator covers the level of HEW satisfaction on salary and benefits, management handling,opportunity with professional development, support and relationship with key stakeholders,and housing condition
HEW perception This indicator deals with perceptions of the HEWs on job responsibilities (including workload anddifficulty relative to level of training), remuneration (fairness relative to workload, level of trainingand workers in other sectors), management (relationship with managers and supervisors and impactof managers on benefits), constraints affecting job performance, social and organizational obstacles,and living conditions
Retention of HEWs It deals with retention of HEWs taking into consideration the number deployed and the number leftsince HEP started in the district, which was used to generate annual retention rate
Service deliveryService availability This indicator deals with whether all the HEP service packages are render at the health postQuality of HEP service This indicator covers the quality of service provision on key aspects of HEP, including cold chain
management system that ensures potency of antigens, and important aspects of newborn care servicessuch as handling of umbilical cord, practicing suction of newborn, weighting, drying and wrappingof newborn, and administration of OPV and BCG vaccine at birth
Infection prevention The infection prevention indicator covers availability of infection prevention practices (availability anduse of syringes, gloves, and antiseptics), handwashing facility (access to water and soap for patientsand availability of handwashing apparatus with tap at the health post), and proper waste disposal(including availability of dust bins and medical waste disposal mechanisms such as pits, burning,or incineration)
Referral linkage The referral linkage index deals with health post, referral health facility, and clients’ aspect of the referralsystem. It considered the type of referral facility, distance, availability of communication and meansof transportation, reason for referral, availability of referral forms, functional two-way linkage (referraland feedback), willingness of patients to go to referral health facility, and availability of factorspreventing patients from going to referral facility and affecting the referral system (such as poorcustomer and care services, long waiting time and high cost of service at the referral facility, lack ofawareness, distance, and poor road)
HEW time use HEW time use indicator deals with whether HEWs use their time as per the HEP standard. It consideredthe number of days the health post is opened per week, whether the health post is opened on weekends,number of hours HEWs work daily, and time spent at the health post vs. community level (on average50% of time for each level). Availability and use of standard manual on apportioning their time amongthe 16 HEP service packages was also included
Model family package delivery The model family package delivery indicator covers the quality of implementation (relative to thestandard procedure) and level of household coverage. The quality of implementation considered theknowledge of HEWs on the standard procedures, actual implementation procedure (number ofhouseholds enrolled per round, number of hours households were trained before graduation andnumber of months took to complete the training), training topic selection procedure (priority is givento areas that are easily implementable, do not create conflict with culture, and showed successpreviously), use of demonstration units for training, process and criteria to determine eligibility forgraduation, involvement of key stakeholders (health promoters, kebele council, and HEW supervisor)in training and determining eligibility, and ceremony to celebrate graduation and provide awards.The level of coverage considered number of households graduated assessed relative to the totalhouseholds in the kebele
Community engagementAwareness and access The community awareness and access to HEP indicator considered the following factors: awareness
about HEP, whether the individual visited HEW in the previous month, whether it was difficult to getto the health post or the HEW and had to wait too long before receiving care during the last visit, andavailability of information on the schedule of HEW displayed outside the health post
Community and healthpromoters participation
The community and promoter participation indicator considered the level of participation of varioussections of the community in the implementation of HEP as per the standard. The participation ofhealth promoters covered the following factors: number of households assigned, availability of workplan and service registers, whether they prepare monthly reports and participate in monthly reviewmeetings, their level of satisfaction with their role, and the level of support they receive from keypartners. It also considered participation of elders, associations, religious and kebele leaders, healthpromoters, and the community at large in preparing work plan and implementation of HEP
(continued)
1160 TEKLEHAIMANOT AND OTHERS
medical supplies and emergency referral services includingfinancial barriers in service utilization. User fee was exemptedat health posts and was not included.“Human resources development” domain included five
indicators measuring workforce knowledge, in-service trainingin the past 1 year, perception and satisfaction (regardingworking and living conditions), and retention of healthworkers, which all affect quality of care.35–39
“Community engagement” domain refers to the process ofinvolving the community in decision making and service pro-vision and included four indicators. The basic philosophy ofHEP was to ensure community ownership and responsibilityfor maintaining their own health, which along with theincreased expectation for health equity contribute to perfor-mance improvement.39–42 In line with the philosophy, HEPinvolves and encourages households, model families and thecommunity health promoters to bring local knowledge, expe-riences, and problems to the forefront and take part in deci-sion making.5 The indicators included community awarenessand access to HEP, community and volunteer participationindex, model family engagement index, and village healthcommittee functionality.“Service delivery process” perspective relates to the activi-
ties carried out to ensure conformity to standard of careincluding adherence to protocols to meet performanceexpectations.14,16,43 Six indicators measuring physical accessi-bility and availability of HEP services, quality of care focus-ing on reproductive, maternal, neonatal, and child health(RMNCH), infection prevention practice, referral linkage ofhealth posts with health centers, time use of HEWs, anddelivery of model family were included.
“Outputs and outcomes” domain included two indicatorson productivity (quantity of maternal and child health ser-vices and family planning services), two indicators measuringsatisfaction of clients (with services received and HEW per-formance), and one indicator measuring the overall satisfac-tion of the community.16,43
Data sources. The data for generating the performance indi-ces came from an evaluation study of HEP conducted in 2010by the Center for National Health Development in Ethiopia.Overview of the HEP evaluation. The HEP study was
conducted in rural villages of the country, where approxi-mately 85% of the Ethiopian population lives. The objectivesof the evaluation was to determine the effect of HEP on healthoutcome measures and to assess the process and degree ofimplementation of the multidimensional health system com-ponents of the program including human resources, physicalresources, support and management, and community perspec-tives. Indicators covering these health system components weredrawn from the national monitoring and evaluation frameworkand other internationally accepted frameworks.29,44,45 Thestudy comprised process and outcome evaluations involvinghealth workers, health facility, and community surveys. Thehealth workers survey targeted volunteer health promoters,HEWs, HEW supervisors, and district managers representingdifferent levels of the health system. The health facility sur-veys covered health posts and referral health centers. Thecommunity survey covered perceptions about and satisfac-tion with HEP and model family.Sampling method. A stratified multistage cluster sampling
method with region as strata and district and village as pri-mary and secondary sampling units, respectively, was used to
TABLE 1Continued
Indicators Description and the factors that went into the indicator
Model family engagement The model family engagement indicator deals with the level of participation of the community inattending training and supporting training of other households (including encouragement and provisionof training). It also covered the level of happiness of becoming model family and their interest toserve the community
Village health committee The village health committee functionality indicator covered the availability of health committee,its involvement in planning and implementation and its participation in organizing emergencytransportation of referral cases
Delivery output and outcomeMaternal and child health
outputThis indicator deals with the number of key maternal, neonatal, and child health services provided at the
health post in the year before the survey assessed relative to the respective population and annualtarget set by the FMOH. The services included ANC, assisted delivery, immunization, PNC, casesmanaged (diarrhea, acute respiratory infection, and malaria), nutrition and growth monitoring, andHIV/AIDS education services
Family health output This indicator deals with the number of family planning clients at the health post in the year before thesurvey assessed relative to the target set by FMOH
Satisfaction with services This indicator measures the level of community satisfaction with the services, specifically on the availabilityand quality of the various HEP services packages. It covers the satisfaction rate on key maternal andchild health services, curative services, sanitation, health education, and model family implementation.It also considered whether the community members would visit again the health post or recommendthe same health post to others, and their satisfaction with cleanliness of the health post environment
Satisfaction with HEW This indicator deals with the level of community satisfaction on HEW’s technical skills (such asexplaining in understandable manner, making helpful suggestions, and discussing treatment options),communication skills (such as caring, friendly, complete explanation, attentive, and respectful) andsocial skills (such as participation in community events, use local language, good conduct/ethics, andconfidentiality of personal information)
Satisfaction with HEP The overall satisfaction with HEP indicator covers overall community satisfaction levels with respect toaddressing the health needs of households and the community at large and their level of happinesswith the availability of HEP services in their village
AIDS = acquired immunodeficiency syndrome; ANC = antenatal care; BCG = Bacillus Calmette–Guérin; BSC = balanced scorecard; FMOH = the Federal Ministry of Health; HEP = HealthExtension Program; HEW = Health Extension Worker; HMIS = health management information system; HIV = human immunodeficiency virus; IEC = information, education and communication;OPV = oral polio vaccine; PNC = postnatal care; RDT = rapid diagnostic test.
1161BALANCED SCORECARD FOR ETHIOPIAN HEALTH EXTENSION PROGRAM

sample the study units. A sampling frame of 591 districts with13,591 rural villages from the 10 regions was obtained fromthe Central Statistics Authority. At the first stage of sam-pling, a total of 71 districts were selected through system-atic random sampling with probability proportional to sizeof regions. At the second stage of sampling, four villages perdistrict were selected using systematic random sampling. Theexception was in the mainly pastoral region of Gambela,where eight villages were selected per district with the aimof increasing the sampling units for the process evaluationin pastoralist areas. This sampling procedure resulted inthe selection of 312 villages. Health workers, health facili-ties, and households were sampled at the third stage. Healthworkers and health facilities were sampled from 298 villagesthat had implemented HEP, whereas households were sam-pled from all 312 villages, including 14 that had not imple-mented the program.The process evaluation was based on health worker, health
facility, and household surveys conducted in the 298 villages.At village level, a health post and all existing HEWs withinthe 298 villages and all district managers, referral healthcenters, and HEW supervisors that were responsible for theimplementation of HEP in the 298 villages were included inthe study without requiring any further sampling procedure.On the basis of this sampling approach, 298 health posts,399 HEWs, 71 district managers, 135 health centers, and113 HEW supervisors were included in the survey. Althoughthe target was to randomly sample five volunteer health pro-moters per village, only 149 villages had at least one healthpromoter. In villages with five or less health promoters, allwere sampled. A total of 615 health promoters were sampledfrom among 701 that were available in all 298 villages. Forthe household survey, a cross-sectional sample of 6,750 house-holds at 25 households per village (in Gambela, only 12 house-holds to offset the 2-fold village sampling) was selected fromthe 298 villages using the random walk method used in theExpanded Program on Immunization cluster survey.46 A totalof 10,068 individuals—including a woman from each house-hold and a man from every other household—were sampledfor the community perception survey. Among the 298 villages,model family package had been started in 214 villages. Thus,5,722 households that were sampled from the 214 villages(a subset of the 6,750 households) were targeted for thecommunity survey on model family.Data collection. Data were collected from 1,198 key infor-
mants (399 HEWs, 615 health promoters, 113 HEP supervisors,and 71 district managers), 433 health facilities (298 healthposts and 135 referral health centers), and 10,068 householdmembers. Structured and semi-structured questionnaires, whichwere adapted from standardized and internationally acceptedsurvey instruments, were used to capture the required infor-mation from the different study units.Health worker survey. The health workers survey involved
in-depth interviews. The health promoters were assessed fortheir participation in the implementation of HEP, specificallyin training of model families, and their perception and satisfac-tion with their role. HEWs were interviewed on their percep-tion and satisfaction with their working and living conditions,their skills and competence on key maternal, neonatal andchild health problems, and their time use practice. Informationwas also collected on the sociodemographic characteristics ofHEWs including age, gender, marital status, ethnicity, lan-
guage, prior residence, and years of service. HEW supervisorswere interviewed on basic information (age, gender, experi-ence, and education), induction and supervision techniquetraining, planning and implementation of supervisory visitsincluding the frequency and supervision methods used, andlogistics. Information about the district capacity (humanresource, finance, and logistic), recruitment process and attri-tion rate of HEWs, availability of drugs and supplies forhealth posts, current practice in technical, logistic, and admin-istrative support of HEP, support from stakeholders, chal-lenges, and perception on the program was collected fromdistrict managers.Health facility survey. The health facility survey was con-
ducted through interviews and audit (observations and docu-ment reviews). It was used to capture information on numberand qualification of staffing, whether the staff receivedin-service training in the past year, the infrastructure condi-tions, availability and functionality of medical equipment,availability of drugs, vaccines, contraceptives, and other sup-plies, availability and use of guidelines and information, edu-cation and communication materials, the use of HMIS, thesupply distribution system, the frequency and quality of super-vision received, financing referral system and medical supplies,and referral linkage. Data were also collected on the avail-ability of HEP service packages, quality of service provision,infection prevention practice, model family package delivery,availability and functionality of village health committee, andquantity of services provided in the past 1 year.Community survey. The community survey, which was
conducted through person-to-person interviews with house-hold members, was used to collect information on the per-ception and satisfaction of the community regarding therecruitment process of HEWs, behavior and performanceof HEWs, accessibility of HEWs and health post, serviceavailability, client centeredness of service, their participationin program implementation, constraints of HEP, and theirexpectation of the program. Information on the process ofmodel family implementation (selection, training, and grad-uation), their perception and participation, and readiness ofgraduated model family to support other households wasalso collected.Ethical consideration. The study received ethical approval
from the National Research Ethics Review Committee ofthe Ethiopian Ministry of Science and Technology and theInstitutional Review Board of Columbia University (IRB-AAAC8935). Recruitment of study subjects was carried inperson by survey supervisors. Since the study presented nomore than minimal risk to subjects, the requirement for signedconsent was waived and oral informed consent was obtainedfrom all participants before conducting the interviews. Datacollection was carried out in January and February 2010.Variable selection process. From the various surveys, the
research team selected about 600 eligible variables that fitconceptually to one of the 32 indicators and satisfy the follow-ing inclusion criteria: 1) reliability; 2) completeness and extentof missing values; 3) outlier values; and 4) variability. Thesevariables were subjected to expert opinion for possible inclu-sion in formulating the HEP performance indices. Threeexperts with good knowledge of HEP and the national healthsystem and who were willing to express their opinions freelywere involved in the selection process. After the expertswere briefed on the objectives of the research, they were
1162 TEKLEHAIMANOT AND OTHERS

provided with the conceptual framework along with the listof the 32 indicators and 600 variables. The two experts wereasked to select and group the variables under the 32 indica-tors. The third expert was used to resolve disagreementsbetween the two experts. This process resulted in selectionof 402 variables for constructing the indicators. The list ofvariables included under each indicator is shown in Supple-mental Appendix 1.Standardization of variables at the measurement unit. In
preparation for the scoring process, the raw variables weresubjected to one or more of the following two procedures.First, the values of all variables were standardized for direc-tionality to ensure that more desirable outcomes receive ahigher value and less desirable outcomes receive a lowervalue. Next, values of variables measured on different scaleswere normalized to a common scale in the range from 0 to 1or [0,1]. This procedure was not required for nearly half ofthe variables, which were dichotomous with value of 0 or 1.Variables with other types of scales such as ordinal and countwere subjected to normalization procedures. To normalize anordinal variable measuring satisfaction level in the range [1,5],one (the minimum in the scale) was subtracted to change thescale into the range [0,4]. It was then divided by 4 (the maxi-mum value in the new scale), which preserved the relativeorder before transformation. Count data on services pro-vided were transformed into proportion that was achievedrelative to target. For example, FMOH has set a target tocover 60% of reproductive age women with contraceptives.The number of contraceptive users in the past year wasdivided by the target number of women (obtained by taking60% of the number of all reproductive age women). Theproportion relative to the target population was then scaledinto the range [0,1], and facilities that achieved or exceededthe target were given a score of 1. The standardization andnormalization procedures carried out for each variable areshown in Supplemental Appendix 1.Scoring of indicators at village level. Village (kebele),
which is the lowest administrative and implementation unit ofHEP, was used as the unit of analysis in generating the indica-tor scores. The analysis involved two steps of aggregation:aggregating observed data by village for each variable (sum-mary statistics by village) and aggregating village variables byindicator for each village (scoring indicators). The first stepinvolves standard analysis of survey data to generate mean orproportion for each variable by village. For example, the vil-lage “proportion of individuals who would visit the healthpost or HEWs again” was generated by dividing “the numberof individuals who would visit the health post or HEW again”by “the total number of individuals surveyed” in the village.Similarly, the village “mean satisfaction rate of health pro-moters with their role” was calculated by averaging the satis-faction rate of all health promoters surveyed in the village.The village means or proportions generated for each variablewere used as input variables in the next step.The indicators were constructed from aggregate sets of
variables that measure the same concept to ensure that theywere more robust and not driven by the choice of single vari-able. Thus, the second step involved aggregation of variablesalong the lines of the conceptual framework to generatescores for the 32 core indicators from the underlying vari-ables. Although various methods are available for weightingand aggregation of variables into a composite indicator, there
is no uniformly agreed methodology. We used one of the com-monly used methods, which involved assigning equal weightsto the group of variables under each indicator and calculatingarithmetic average to generate indicator scores. This methodwas more suitable and appropriate for our work, as it pre-serves the conceptual framework, involves simple procedures,and preserves the data properties allowing for easier interpre-tation of the results.47–50
The following three measures of overall performance werealso generated from the scores of the 32 core indicators:1) overall composite score, which was the average score ofthe core indicators, 2) the percent of core indicators thatscored above the bottom quintile, and 3) the percent thatscored above the top quintile.14 The results were convertedto a percentage score ranging from 0 to 100.Aggregation of scores over geographic areas. The village
level scores of the 32 core indicators and the three overallperformance measures were aggregated to estimate national,regional, and agroecological zone (agrarian, agropastoral, andpastoral) scores for each indicator. To address the complexityof the multistage sampling design, the analysis (aggregation)was undertaken using appropriate weights based on the selec-tion probability at each sampling stage.51 The aggregationanalysis at national level involved estimating weighted mean(and standard deviation), median, bottom and top quintiles,and minimum and maximum scores for each indicator. Thenational level indicator scores were compared against theoverall composite score (the mean score of the 32 indicators).Indicators with median values that fell above the top quintile,within the inter-quintile range, and below the bottom quintileof the overall composite score were designated as high, aver-age, and low, respectively. Regional and agroecological zonemedian scores were estimated for each indicator and com-pared against national scores. Indicators with scores that fellabove the top quintile, within the inter-quintile range, andbelow the bottom quintile of the national score were desig-nated as good, average, and unsatisfactory, respectively. Weused color-coded dashboard to report the performance of theregional indicator scores to facilitate comparison and to easilyidentify a trend among the various indicators. Indicators thatperformed good, average, and unsatisfactory were color-codedwith green, yellow, and red, respectively. The statistical signifi-cance of the difference in the indicator scores by region andagroecological zone was tested using Kruskal–Wallis equality-of-populations rank test.
RESULTS
National level performance. The national level medianscores (Table 2) of the indicators ranged from 37% to 98%showing mixed performance. The indicator scores relative tothe overall composite score (with bottom and top quintiles of57.3% and 70.2%, respectively) showed mixed performanceacross the domains. Under capacity for service provision, sup-ply distribution system (median, 50%), commodity availability(median, 54%), and infrastructure index (median, 57.1%)scored low, whereas management capacity index (median,87%) and equipment index (median, 81%) scored high.Financing referral system scored high (median, 75%), whereasfinancing medical supplies scored low (median, 50%). Withrespect to human resource, the median scores for HEW satis-faction (49%) and perception (59%) indices were low, while it
1163BALANCED SCORECARD FOR ETHIOPIAN HEALTH EXTENSION PROGRAM
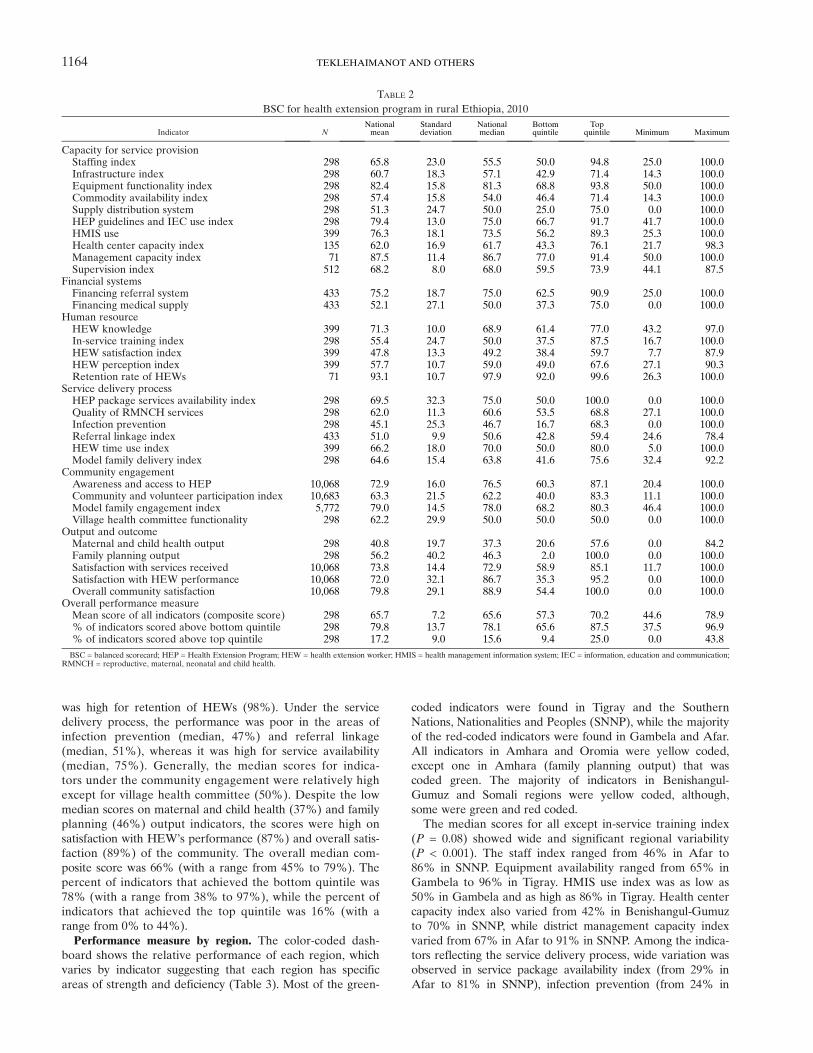
was high for retention of HEWs (98%). Under the servicedelivery process, the performance was poor in the areas ofinfection prevention (median, 47%) and referral linkage(median, 51%), whereas it was high for service availability(median, 75%). Generally, the median scores for indica-tors under the community engagement were relatively highexcept for village health committee (50%). Despite the lowmedian scores on maternal and child health (37%) and familyplanning (46%) output indicators, the scores were high onsatisfaction with HEW’s performance (87%) and overall satis-faction (89%) of the community. The overall median com-posite score was 66% (with a range from 45% to 79%). Thepercent of indicators that achieved the bottom quintile was78% (with a range from 38% to 97%), while the percent ofindicators that achieved the top quintile was 16% (with arange from 0% to 44%).Performance measure by region. The color-coded dash-
board shows the relative performance of each region, whichvaries by indicator suggesting that each region has specificareas of strength and deficiency (Table 3). Most of the green-
coded indicators were found in Tigray and the SouthernNations, Nationalities and Peoples (SNNP), while the majorityof the red-coded indicators were found in Gambela and Afar.All indicators in Amhara and Oromia were yellow coded,except one in Amhara (family planning output) that wascoded green. The majority of indicators in Benishangul-Gumuz and Somali regions were yellow coded, although,some were green and red coded.The median scores for all except in-service training index
(P = 0.08) showed wide and significant regional variability(P < 0.001). The staff index ranged from 46% in Afar to86% in SNNP. Equipment availability ranged from 65% inGambela to 96% in Tigray. HMIS use index was as low as50% in Gambela and as high as 86% in Tigray. Health centercapacity index also varied from 42% in Benishangul-Gumuzto 70% in SNNP, while district management capacity indexvaried from 67% in Afar to 91% in SNNP. Among the indica-tors reflecting the service delivery process, wide variation wasobserved in service package availability index (from 29% inAfar to 81% in SNNP), infection prevention (from 24% in
TABLE 2BSC for health extension program in rural Ethiopia, 2010
Indicator NNationalmean
Standarddeviation
Nationalmedian
Bottomquintile
Topquintile Minimum Maximum
Capacity for service provisionStaffing index 298 65.8 23.0 55.5 50.0 94.8 25.0 100.0Infrastructure index 298 60.7 18.3 57.1 42.9 71.4 14.3 100.0Equipment functionality index 298 82.4 15.8 81.3 68.8 93.8 50.0 100.0Commodity availability index 298 57.4 15.8 54.0 46.4 71.4 14.3 100.0Supply distribution system 298 51.3 24.7 50.0 25.0 75.0 0.0 100.0HEP guidelines and IEC use index 298 79.4 13.0 75.0 66.7 91.7 41.7 100.0HMIS use 399 76.3 18.1 73.5 56.2 89.3 25.3 100.0Health center capacity index 135 62.0 16.9 61.7 43.3 76.1 21.7 98.3Management capacity index 71 87.5 11.4 86.7 77.0 91.4 50.0 100.0Supervision index 512 68.2 8.0 68.0 59.5 73.9 44.1 87.5
Financial systemsFinancing referral system 433 75.2 18.7 75.0 62.5 90.9 25.0 100.0Financing medical supply 433 52.1 27.1 50.0 37.3 75.0 0.0 100.0
Human resourceHEW knowledge 399 71.3 10.0 68.9 61.4 77.0 43.2 97.0In-service training index 298 55.4 24.7 50.0 37.5 87.5 16.7 100.0HEW satisfaction index 399 47.8 13.3 49.2 38.4 59.7 7.7 87.9HEW perception index 399 57.7 10.7 59.0 49.0 67.6 27.1 90.3Retention rate of HEWs 71 93.1 10.7 97.9 92.0 99.6 26.3 100.0
Service delivery processHEP package services availability index 298 69.5 32.3 75.0 50.0 100.0 0.0 100.0Quality of RMNCH services 298 62.0 11.3 60.6 53.5 68.8 27.1 100.0Infection prevention 298 45.1 25.3 46.7 16.7 68.3 0.0 100.0Referral linkage index 433 51.0 9.9 50.6 42.8 59.4 24.6 78.4HEW time use index 399 66.2 18.0 70.0 50.0 80.0 5.0 100.0Model family delivery index 298 64.6 15.4 63.8 41.6 75.6 32.4 92.2
Community engagementAwareness and access to HEP 10,068 72.9 16.0 76.5 60.3 87.1 20.4 100.0Community and volunteer participation index 10,683 63.3 21.5 62.2 40.0 83.3 11.1 100.0Model family engagement index 5,772 79.0 14.5 78.0 68.2 80.3 46.4 100.0Village health committee functionality 298 62.2 29.9 50.0 50.0 50.0 0.0 100.0
Output and outcomeMaternal and child health output 298 40.8 19.7 37.3 20.6 57.6 0.0 84.2Family planning output 298 56.2 40.2 46.3 2.0 100.0 0.0 100.0Satisfaction with services received 10,068 73.8 14.4 72.9 58.9 85.1 11.7 100.0Satisfaction with HEW performance 10,068 72.0 32.1 86.7 35.3 95.2 0.0 100.0Overall community satisfaction 10,068 79.8 29.1 88.9 54.4 100.0 0.0 100.0
Overall performance measureMean score of all indicators (composite score) 298 65.7 7.2 65.6 57.3 70.2 44.6 78.9% of indicators scored above bottom quintile 298 79.8 13.7 78.1 65.6 87.5 37.5 96.9% of indicators scored above top quintile 298 17.2 9.0 15.6 9.4 25.0 0.0 43.8BSC = balanced scorecard; HEP = Health Extension Program; HEW = health extension worker; HMIS = health management information system; IEC = information, education and communication;
RMNCH = reproductive, maternal, neonatal and child health.
1164 TEKLEHAIMANOT AND OTHERS

Gambela to 61% in Tigray), and model family package deliveryindex (from 41% in Gambela to 72% in Tigray). In relationto the community engagement, scores for community par-ticipation ranged from 51% in Afar to 76% in Tigray andscores for village health committee ranged from 31% inAfar to 80% in SNNP. Similarly, the scores for maternaland child health output (from 15% in Afar to 51% in SNNP),family planning output (from almost none in Afar and Somali
to 71% in Amhara), and overall community satisfaction (from40% in Benishangul-Gumuz to 88% in Tigray) showed widevariation by region.Turning to the overall performance measures, the overall
composite score ranged from 54% in Gambela to 72% inTigray. The score for achieving the bottom quintile variedfrom 54% in Gambela to 90% in Tigray, while the score forachieving the top quintile varied from 7% in Gambela to
TABLE 3BSC dashboard for the HEP performance measurement by region in rural Ethiopia, 2010
BSC = balanced scorecard; HEP = Health Extension Program; HEW = health extension worker; HMIS = health management information system; IEC = information, education and communication;RMNCH = reproductive, maternal, neonatal and child health; SNNP = the Southern Nations, Nationalities, and Peoples.*Interpretation of results should be with precaution due to relatively small sample in smaller regions.
1165BALANCED SCORECARD FOR ETHIOPIAN HEALTH EXTENSION PROGRAM

31% in Tigray. Ranking of the regions based on the overallperformance measures showed that Tigray ranked at the topfollowed by SNNP and Amhara regions, while Afar andGambela ranked last (Figure 2).Performance measure by agroecological zone. The per-
formance results by agroecological zones are presentedin Table 4. Indicators with significantly low score in pastoralareas included staffing, HEW knowledge, infrastructure,equipment index, commodity availability and distribution sys-tem, HMIS use, availability of service packages, model familydelivery and engagement, and RMNCH outputs. Althoughnot statistically significant, the scores for the capacity of dis-trict management, infection prevention, and community partic-ipation were also lower in pastoral than in other areas. Bycontrast, the scores for referral system financing, retention ofHEWs, and satisfaction with performance of HEWs werehigher in the pastoral than in other areas. The overall compos-ite score for pastoral, agropastoral, and agrarian areas were59%, 64%, and 65%, respectively. The percent of indicatorsthat achieved the bottom quintile was 66%, 76%, and 79%,while that achieved the top quintile was 12%, 18%, and 17%for pastoral, agropastoral, and agrarian areas, respectively.
DISCUSSION
We developed BSC comprising six domains with 32 indica-tors for comprehensive performance measurement of theEthiopian HEP using nationally representative survey data.Despite encouraging reports of positive impact of HEP,8,22–26,52
the findings of this study show major deficiency in its overallperformance. The scores across all domains were low, whichcould be due to their interdependence, where the capacityfor service provision and financial systems influence thehuman resource development, the community engagementand service provision process that in turn affect the outputand outcome dimension.6,32,39 Although it used few indicators,a study by Sebastian and others found that the performance ofHEP was poor and that there was inefficiency in productivityrelative to available resources, which is an indication thatmultidimensional factors other than inputs affect the outcomeof the program.8 The BSC approach used in this article helpedidentify health system elements with relatively poor perfor-mance.14,16 The performance of the program was low in theareas of infrastructure, commodity (including financing, distri-
bution and availability), satisfaction and perception of HEWs,infection prevention, referral linkage, and service quality andoutputs. These elements are interconnected, where gaps inhuman and physical resources contribute to poor quality ofcare leading to low service utilization and output, which couldbe among the factors contributing to the low HEP service utili-zation reported in a study conducted by Kelbessa and others.52
Satisfactory performance was observed in the areas of equip-ment availability, use of guidelines, availability and use ofinformation, education and communication materials, referralsystem financing, HEW retention, as well as the communityawareness, engagement, and satisfaction, which is consistentwith findings of other studies conducted in various regions ofthe country.52–54 It is interesting to note that the HEW reten-tion was high despite the low satisfaction and perception, whichmay be due to the HEWs being recruited from the villagewhere they were deployed as well as the fact that the programwas new with HEWs having served only for a few years.Another possible explanation for the high retention despitethe low satisfaction could be that HEWs, unlike other healthprofessionals such as nurses, have limited prospects to work-ing in better paying private health sector jobs forcing them tostay although their intention to leave could be high. Giventhat job satisfaction is one of the factors influencing healthworker retention, the unexpected finding of this article sug-gest the need for further studies on HEW intentions regardingHEP to inform the design of strategies aimed at positivelyinfluencing the same to ensure high retention.The findings showed significant difference in the perfor-
mance of HEP by region and agroecological zone. Overallperformance was poor in pastoral regions of Gambela, Afar,Somali and Benishangul-Gumuz, consistent with the poorhealth indicators reported in these regions.45 The poor per-formance was primarily driven by poor performance in staff-ing, HEW knowledge, infrastructure, equipment, commodityavailability and distribution, HMIS use, service package avail-ability, model family delivery and engagement, and serviceoutput. The remote and harsh climatic conditions and thehighly mobile and geographically dispersed settlement coupledwith poor infrastructure and lack of social services couldbe the major factors contributing to the low performance ofHEP in these regions.55 Pastoralists have many special healthneeds that could not be completely met by the largely statichealth post–based HEP strategy, thereby resulting in poor
FIGURE 2. Overall performance scores of Health Extension Program by region in rural Ethiopia, 2010.
1166 TEKLEHAIMANOT AND OTHERS

performance of the program in such settings.3,56 In recognitionof HEP’s inadequacy in pastoral areas, FMOH took stepsto redesign the program. FMOH and pastoral regions in col-laboration with research institutions are undertaking researchprojects to understand the pastoral context and generate infor-mation to inform the design of the most appropriate healthservices and effective service delivery models.Limitations. First, although fewer indices were presented
in the BSC, the burden of data collection poses an operationalchallenge. Thus more effort should be made to minimize thedata requirement by selecting the most important and reliablepredictors of performance. Second, equal weights wereassigned to individual variables, while their actual contribution
to specific indicators might be different, which might affectthe reliability and validity of the resulting scores. However,we used the equal weighting approach because of the lack ofstatistical or empirical evidence for using a different approach.Further research is needed to understand the relative impor-tance of variables used in computing the scores, the effect ofassigning equal or different weights, and the consequences ofdropping non-important variables to minimize data require-ments. Third, indicator scores were generated using arithmeticaverage, which may produce less valid results compared withother methods such as the principal component analysis. How-ever, the use of averaging is more suitable for our studybecause of the following advantages over the other methods:it is easy to compute, the scores retain the scale metric allowingfor easier interpretation, it allows comparability across indica-tors, it preserves the dimensions of the conceptual framework,and scores are more stable across samples (more reliable).Fourth, the indicators under the output and outcome domainwere limited to health post productivity. Future work shouldincorporate outcome and impact indicators to ensure compre-hensive measurement. The findings of this study provideopportunities for further research on the methodology and listof indicators to optimize and make the BSC tool useful andacceptable to policy makers and stakeholders.
CONCLUSION
The BSC tool was used to determine the performance ofthe health system components of HEP. Despite the need tooptimize the tool, using BSC revealed three major findings:1) deficiency in the overall performance of HEP, and specifi-cally, in the areas of commodities, workforce motivation,referral linkage, and quality of care including infection preven-tion; 2) performance of regions varied by indicator suggestingthat each region has specific areas of strength and deficiency;and 3) the performance of the mainly pastoral regions waspoor, especially in the areas of workforce capacity, infrastruc-ture, equipment and commodity availability, HMIS use, HEPservice availability, model family, and outputs. The low perfor-mance on certain program and geographic areas could limitHEP in achieving its objectives and goals. The findings of thisstudy suggest the need for strategies aimed at improving spe-cific elements of the program and its overall performance inspecific regions, thereby ensuring quality and equitable healthservices and realizing its objectives and goals. Although recog-nizing the need to address the operational challenges, usingthe BSC tool to measure the performance of a program canguide resource allocation (targeting specific areas laggingbehind) and provide reference point for historical monitoringand geographic area comparison of performance.14,16,18
Received March 11, 2015. Accepted for publication January 21, 2016.
Published online February 29, 2016.
Note: Supplemental Appendix appears at www.ajtmh.org.
Acknowledgments: We gratefully acknowledge the input of profes-sionals who provided expert opinion in the design of the balancedscorecard tool and selection of the underlying indicators. We would liketo thank the survey coordinators, field workers, and study participantsincluding health workers and managers and the community members.We also thank the Federal Ministry of Health for allowing the healthmanagers, health facilities, and health workers to participate inthe study.
TABLE 4BSC for the HEP performance measurement by agroecological zonein rural Ethiopia, 2010
Indicator
Agroecological zones
P valuePastoral Mixed Agrarian
Capacity for service provisionStaffing index 53.0 56.9 66.5 0.016Infrastructure index 43.9 59.0 60.4 0.011Equipment functionality index 62.9 81.9 82.0 0.001Commodity availability index 54.8 69.9 56.3 0.000Supply distribution system 26.8 59.3 49.8 0.001HEP guidelines and IEC use index 73.2 79.3 77.7 0.367HMIS use 60.2 72.5 72.8 0.046Health center capacity index 60.0 63.3 60.3 0.753Management capacity index 73.0 81.3 84.6 0.189Supervision index 65.3 66.0 67.1 0.655
Financial systemsFinancing referral system 85.0 74.8 77.1 0.150Financing medical supply 43.3 48.8 55.6 0.458
Human resource developmentHEW knowledge 61.1 67.9 69.9 0.010In-service training index 50.5 63.5 56.5 0.451HEW satisfaction index 52.8 49.4 48.8 0.532HEW perception index 59.0 61.4 58.1 0.421Retention rate of HEWs 97.6 93.7 93.6 0.006
Service delivery processHEP package servicesavailability index
51.8 58.3 69.3 0.045
Quality of RMNCH services 59.8 65.9 61.1 0.115Infection prevention 35.9 46.6 44.6 0.409Referral linkage index 52.6 50.9 50.7 0.852HEW time use index 60.6 70.0 65.9 0.220Model family delivery index 50.6 58.6 62.0 0.013
Community engagementAwareness and access to HEP 67.3 72.2 73.1 0.124Community and volunteerparticipation index
54.6 68.5 61.4 0.117
Model family engagement index 63.8 82.0 74.0 0.017Village health committee
functionality48.3 50.0 58.7 0.102
Delivery output and outcomeMaternal and child health output 40.0 29.5 40.0 0.038Family planning output 45.3 24.7 51.6 0.002Satisfaction with services received 68.2 69.4 72.5 0.619Satisfaction with HEW performance 80.6 67.6 68.4 0.757Overall community satisfaction 78.6 73.7 77.7 0.945
Overall performance measuresMean score of all indicators(composite score)
58.8 63.6 64.6 0.006
% of indicators scored abovebottom quintile
66.1 75.8 76.9 0.046
% of indicators scored abovetop quintile
12.1 17.8 17.0 0.079
BSC = balanced scorecard; HEP = Health Extension Program; HEW = health extensionworker; HMIS = health management information system; IEC = information, education andcommunication; RMNCH = reproductive, maternal, neonatal and child health.
1167BALANCED SCORECARD FOR ETHIOPIAN HEALTH EXTENSION PROGRAM

Financial support. This study was made possible by the financial sup-port from the Blaustein Foundation and the funding provided by theUNICEF and WHO Ethiopia country offices for the 2010 NationalEvaluation of HEP.
Disclaimer: The sponsors had no role in the study design, data collec-tion, data analysis, data interpretation, or writing of the manuscript.
Authors’ addresses:HailayD. Teklehaimanot andAwashTeklehaimanot,Earth Institute at Columbia University, New York, NY, and Center forNational Health Development in Ethiopia, Columbia University, AddisAbaba, Ethiopia, E-mails: [email protected] and [email protected]. Aregawi A. Tedella and Mustofa Abdella, Center forNational Health Development in Ethiopia, Columbia University,Addis Ababa, Ethiopia, E-mails: [email protected] and [email protected].
REFERENCES
1. FMOH, 2008. Health Sector Development Plan, 2005/6–2010/11,Mid-Term Review. Addis Ababa, Ethiopia: Federal Ministryof Health.
2. Chan M, 2008. Return to Alma-Ata. Lancet 372: 865–866.3. Teklehaimanot HD, Teklehaimanot A, 2013. Human resource
development for a community-based health extension program:a case study from Ethiopia. Hum Resour Health 11: 39.
4. FMOH, 2010. Health Sector Development Program (IV), 2010/11–2014/15. Addis Ababa, Ethiopia: Federal Ministry of Health.
5. FMOH, 2007. Health Extension Program in Ethiopia. AddisAbaba, Ethiopia: Federal Ministry of Health.
6. Travis P, Bennett S, Haines A, Pang T, Bhutta Z, HyderAA, Pielemeier NR, Mills A, Evans T, 2004. Overcominghealth-systems constraints to achieve the Millennium Devel-opment Goals. Lancet 364: 900–906.
7. Lavis JN, Posada FB, Haines A, Osei E, 2004. Use of researchto inform public policymaking. Lancet 364: 1615–1621.
8. Sebastian MS, Lemma H, 2010. Efficiency of the health extensionprogramme in Tigray, Ethiopia: a data envelopment analysis.BMC Int Health Hum Rights 10: 16.
9. Gauld R, Al-wahaibi S, Chisholm J, Crabbe R, Kwon B, Oh T,Palepu R, Rawcliffe N, Sohn S, 2011. Scorecards for healthsystem performance assessment: the New Zealand example.Health Policy 103: 200–208.
10. Inamdar N, Kaplan RS, Bower M, 2002. Applying the balancedscorecard in healthcare provider organizations. J HealthcManag 47: 179–195, discussion 195–196.
11. Inamdar SN, Kaplan RS, Jones ML, Menitoff R, 2000. TheBalanced Scorecard: a strategic management system for multi-sector collaboration and strategy implementation. Qual ManagHealth Care 8: 21–39.
12. Kaplan RS, Norton DP, 1992. The balanced scorecard—measuresthat drive performance. Harv Bus Rev 70: 71–79.
13. Klassen A, Miller A, Anderson N, Shen J, Schiariti V, O’DonnellM, 2010. Performance measurement and improvement frame-works in health, education and social services systems: asystematic review. Int J Qual Health Care 22: 44–69.
14. Peters DH, Noor AA, Singh LP, Kakar FK, Hansen PM,Burnham G, 2007. A balanced scorecard for health services inAfghanistan. Bull World Health Organ 85: 146–151.
15. Zelman WN, Pink GH, Matthias CB, 2003. Use of the balancedscorecard in health care. J Health Care Finance 29: 1–16.
16. Edward A, Kumar B, Kakar F, Salehi AS, Burnham G, PetersDH, 2011. Configuring balanced scorecards for measuringhealth system performance: evidence from 5 years’ evaluationin Afghanistan. PLoS Med 8: e1001066.
17. Chan GJ, Parco KB, Sihombing ME, Tredwell SP, O’Rourke EJ,2010. Improving health services to displaced persons in Aceh,Indonesia: a balanced scorecard. Bull World Health Organ88: 709–712.
18. Hansen PM, Peters DH, Niayesh H, Singh LP, Dwivedi V,Burnham G, 2008. Measuring and managing progress in theestablishment of basic health services: the Afghanistan healthsector balanced scorecard. Int J Health Plann Manage 23:107–117.
19. Rabbani F, Jafri SM, Abbas F, Pappas G, Brommels M, TomsonG, 2007. Reviewing the application of the balanced scorecardwith implications for low-income health settings. J HealthcQual 29: 21–34.
20. Rabbani F, Jafri SM, Abbas F, Shah M, Azam SI, Shaikh BT,Brommels M, Tomson G, 2010. Designing a balanced score-card for a tertiary care hospital in Pakistan: a modified Delphigroup exercise. Int J Health Plann Manage 25: 74–90.
21. ten Asbroek AH, Arah OA, Geelhoed J, Custers T, DelnoijDM, Klazinga NS, 2004. Developing a national performanceindicator framework for the Dutch health system. Int J QualHealth Care 16 (Suppl 1): i65–i71.
22. Datiko DG, Lindtjorn B, 2009. Health extension workers improvetuberculosis case detection and treatment success in southernEthiopia: a community randomized trial. PLoS One 4: e5443.
23. Karim AM, Admassu K, Schellenberg J, Alemu H, Getachew N,Ameha A, Tadesse L, Betemariam W, 2013. Effect of Ethiopia’shealth extension program on maternal and newborn healthcare practices in 101 rural districts: a dose-response study.PLoS One 8: e65160.
24. King JD, Endeshaw T, Escher E, Alemtaye G, Melaku S, GelayeW, Worku A, Adugna M, Melak B, Teferi T, Zerihun M,Gesese D, Tadesse Z, Mosher AW, Odermatt P, Utzinger J,Marti H, Ngondi J, Hopkins DR, Emerson PM, 2013. Intestinalparasite prevalence in an area of Ethiopia after implementingthe SAFE strategy, enhanced outreach services, and healthextension program. PLoS Negl Trop Dis 7: e2223.
25. Medhanyie A, Spigt M, Kifle Y, Schaay N, Sanders D, Blanco R,Geertjan D, Berhane Y, 2012. The role of health extensionworkers in improving utilization of maternal health services inrural areas in Ethiopia: a cross sectional study. BMC HealthServ Res 12: 352.
26. Yitayal M, Berhane Y, Worku A, Kebede Y, 2014. The community-based Health Extension Program significantly improved contra-ceptive utilization in West Gojjam Zone, Ethiopia. J MultidiscipHealthc 7: 201–208.
27. Kringos DS, Boerma WG, Hutchinson A, van der Zee J,Groenewegen PP, 2010. The breadth of primary care: a sys-tematic literature review of its core dimensions. BMC HealthServ Res 10: 65.
28. Kringos DS, Boerma WG, Bourgueil Y, Cartier T, Hasvold T,Hutchinson A, Lember M, Oleszczyk M, Pavlic DR, Svab I,Tedeschi P, Wilson A, Windak A, Dedeu T, Wilm S, 2010.The European primary care monitor: structure, process andoutcome indicators. BMC Fam Pract 11: 81.
29. Kruk ME, Freedman LP, 2008. Assessing health system perfor-mance in developing countries: a review of the literature.Health Policy 85: 263–276.
30. Campbell SM, Braspenning J, Hutchinson A, Marshall M,2002. Research methods used in developing and applyingquality indicators in primary care. Qual Saf Health Care 11:358–364.
31. Bosch-Capblanch X, Garner P, 2008. Primary health care supervi-sion in developing countries. Trop Med Int Health 13: 369–383.
32. Brugha R, Starling M, Walt G, 2002. GAVI, the first steps: lessonsfor the Global Fund. Lancet 359: 435–438.
33. WHO, 2001. Macroeconomics and Health: Investing in Healthfor Economic Development. Report of the Commission onMacroeconomics and Health. Geneva, Switzerland: WorldHealth Organization.
34. Donabedian A, 1980. Methods for deriving criteria for assessingthe quality of medical care. Med Care Rev 37: 653–698.
35. Chen LC, 2010. Striking the right balance: health workforceretention in remote and rural areas. Bull World Health Organ88: 323 A.
36. Kitaw Y, Ye-Ebiyo Y, Said A, Desta H, Teklehaimanot A, 2007.Assessment of the training of the first intake of health extensionworkers. Ethiop J Health Dev 21: 232–239.
37. Mutale W, Ayles H, Bond V, Mwanamwenge MT, BalabanovaD, 2013. Measuring health workers’ motivation in rural healthfacilities: baseline results from three study districts in Zambia.Hum Resour Health 11: 8.
38. Olsen OE, Ndeki S, Norheim OF, 2005. Human resources foremergency obstetric care in northern Tanzania: distribution ofquantity or quality? Hum Resour Health 3: 5.
1168 TEKLEHAIMANOT AND OTHERS

39. Yitayal M, Berhane Y, Worku A, Kebede Y, 2014. Health exten-sion program factors, frequency of household visits and beingmodel households, improved utilization of basic health servicesin Ethiopia. BMC Health Serv Res 14: 156.
40. Banteyerga H, 2011. Ethiopia’s health extension program: improv-ing health through community involvement. MEDICC Rev 13:46–49.
41. Bruni RA, Laupacis A, Martin DK, University of TorontoPriority Setting in Health Care Research Group, 2008. Publicengagement in setting priorities in health care. CMAJ 179:15–18.
42. Rosato M, Laverack G, Grabman LH, Tripathy P, Nair N,Mwansambo C, Azad K, Morrison J, Bhutta Z, Perry H,Rifkin S, Costello A, 2008. Community participation: lessonsfor maternal, newborn, and child health. Lancet 372: 962–971.
43. Arah OA, Westert GP, Hurst J, Klazinga NS, 2006. A conceptualframework for the OECD Health Care Quality IndicatorsProject. Int J Qual Health Care 18 (Suppl 1): 5–13.
44. Donabedian A, 1988. The quality of care. How can it be assessed?JAMA 260: 1743–1748.
45. FMOH, 2010. Health and Health Related Indicators of Ethiopia.Addis Abab, Ethiopia: Federal Ministry of Health.
46. WHO, 2005. Immunization Coverage Cluster Survey: ReferenceManual. WHO/IVB/04.23. Geneva, Switzerland: WorldHealth Organization.
47. DiStefano C, Zhu M, Mindrila D, 2009. Understanding andusing factor scores: considerations for the applied researcher.Pract Assess Res Eval 14: 1–11. Available at: http://pareonline.net/getvn.asp?v=14&n=20.
48. Singh RP, Nath S, Prasad SC, Nema AK, 2008. Selection of suit-able aggregation function for estimation of aggregate pollutionindex for river Ganges in India. J Environ Eng 134: 689–701.
49. Grice JW, Harris RJ, 1998. A comparison of regression and load-ing weights for the computation of factor scores. MultivariateBehav Res 33: 221–247.
50. Jollands N, Lermit J, Patterson M, 2003. The Usefulness of Aggre-gate Indicators in Policy Making and Evaluation: A Discussionwith Application to Eco-Efficiency Indicators in New Zealand.Available at: http://een.anu.edu.au/wsprgpap/papers/jolland1.pdf.
51. Wooldridge JM, 2003. Cluster-sample methods in applied econo-metris. Am Econ Rev XCIII: 133–138.
52. Kelbessa Z, Baraki N, Egata G, 2014. Level of health extensionservice utilization and associated factors among community inAbuna Gindeberet District, West Shoa Zone, Oromia RegionalState, Ethiopia. BMC Health Serv Res 14: 324.
53. Negusse H, McAuliffe E, MacLachlan M, 2007. Initial communityperspectives on the Health Service Extension Programme inWelkait, Ethiopia. Hum Resour Health 5: 21.
54. Birhanu Z, Godesso A, Kebede Y, Gerbaba M, 2013. Mothers’experiences and satisfactions with health extension programin Jimma zone, Ethiopia: a cross sectional study. BMC HealthServ Res 13: 74.
55. WISP, 2008. Pastoralism in Ethiopia: Its Total Economic Valuesand Development Challenges. Addis Ababa, Ethiopia: SOSSahel Ethiopia, World Initiative for Sustainable Pastoralism.
56. Dubale T, Mariam DH, 2007. Determinants of conventional healthservice utilization among pastoralists in northeast Ethiopia.Ethiop J Health Dev 21: 142–147.
1169BALANCED SCORECARD FOR ETHIOPIAN HEALTH EXTENSION PROGRAM