Embed Size (px)
Citation preview

I. INTRODUCTION
Algae have long been used to assess environmentalconditions in aquatic habitats throughout the world.During the early part of the twentieth century, algaewere exploxed as indicators of organic pollution inEuropean streams and rivers (Kolkwitz and Marsson,1908). Between 20 and 50 years ago, use of algal indi-cators of environmental conditions flourished based onthe environmental sensitivities and tolerances of indi-vidual taxa and species composition of assemblages(e.g., Butcher, 1947; Fjerdingstad, 1950; Zelinka andMarvan, 1961; Slàdecek, 1973; Lowe, 1974; Lange-Bertalot, 1979). Nutrient stimulation of algal growthmade algae part of the problem in the eutrophicationof lakes such that trophic status of lakes was also characterized by the amount of algae (Vollenweider,1976; Carlson, 1977). In North America, Ruth Patrickand C. Mervin Palmer were pioneers in the develop-
ment of large monitoring programs to assess the eco-logical health of rivers and nuisance algal growths(Patrick, 1949; Patrick et al., 1954; Palmer, 1969).More recently, the sensitivity of many algal taxa to pH,combined with preservation of certain algal cell wallcomponents (e.g., diatom frustules and chrysophytescales) in sediments, has been employed to assess prob-lems with acid deposition and to determine if rates oflake acidification have been enhanced by human con-tributions to acid deposition (Smol, 1995; Battarbee etal., 1999). Government agencies throughout the worldnow use algae to monitor and assess ecological condi-tions in many types of aquatic ecosystems (e.g., Weber,1973; Dixit and Smol, 1991; Dixit et al., 1992, 1999;Bahls, 1993; Kentucky Division of Water, 1993;Whitton and Rott, 1996; Biggs et al., 1998; Kelly et al.,1998; Stevenson and Bahls, 1999). Thus, characteriza-tion of algal assemblages has been important in envi-ronmental assessment, both in indicating changes in
775
23USE OF ALGAE IN ENVIRONMENTAL
ASSESSMENTS
R. Jan Stevenson
Department of ZoologyMichigan State UniversityEast Lansing, Michigan 48824
John P. Smol
Department of BiologyPaleoecological Environmental Assessment
and Research Laboratory (PEARL)Queen’s UniversityKingston, OntarioCanada K7L 3N6
I. IntroductionII. Goals of Environmental Assessment
with AlgaeIII. Sampling and Assessing Algal
Assemblages for EnvironmentalAssessmentA. Sampling Algae in
Freshwater HabitatsB. Attributes of Algal Assemblages for
Environmental AssessmentIV. Developing Metrics for Hazard Assessment
A. Relating Goals to Ecological Attributes
B. Testing MetricsC. Multimetric IndicesD. Multivariate Statistics and
Hazard AssessmentV. Exopsure Assessment: What Are
Environmental Conditions?VI. Stressor–Response Relations
VII. Risk Characterization and ManagementDecisions
VIII. ConclusionsLiterature Cited
Freshwater Algae of North AmericaCopyright © 2003, Elsevier Science (USA). All rights of reproduction in any form reserved.
environmental conditions that impair or threatenecosystem health and in determining if algae themselvesare causing problems.
Algae are particularly valuable in environmentalassessments. Algae are the base of most aquatic foodchains, are important in biogeochemical cycling, andserve as habitat for many organisms in aquatic ecosys-tems (e.g., Minshall, 1978; Wetzel, 1983; Power, 1990;Carpenter and Kitchell, 1993; Vymazal, 1994; Bott,1996; Lamberti, 1996; Mulholland, 1996; Wetzel,1996). Thus, a natural balance of species and assem-blage functions is important for ecosystem health(Angermeier and Karr, 1994). Increases in algal bio-mass and shifts in species composition can cause problems with many ecosystem services by causingtaste and odor problems in water supplies (Sigworth,1957; Palmer, 1962; Arruda and Fromm, 1989), toxicalgal blooms (Bowling and Baker, 1996; Burkholderand Glasgow, 1997), and low dissolved oxygen levels(Lasenby, 1975).
In many aquatic habitats, algae are the mostdiverse assemblage of organisms that can be easily sampled and readily identified to species (particularlydiatoms and desmids). The great species-specific sensi-tivity of algae to environmental conditions and theirhigh diversity in habitats provide the potential for veryprecise and accurate assessments of the physical, chem-ical, and biological conditions that may be causingproblems. Moreover, algae and paleolimnological tech-niques can be used to infer historical conditions inlakes, wetlands, and even reservoirs and rivers (Fritz,1990; Smol, 1992). Algae occur in all aquatic habitats,so they could be very valuable for comparison amongecosystems with the same group of organisms. From alogistical perspective, algae are relatively easy to sam-ple, and analysis is relatively inexpensive comparedwith bioassessment with other groups of organisms. In addition, many characteristics of algal assemblagescan be measured and used as multiple lines of evidencefor whether ecological integrity has been altered andthe causes of those alterations. Algal bioassessmentcomplements physical and chemical data by providingcorroborative evidence for environmental change.
Both structural and functional characteristics ofalgae can be used to assess environmental conditions in aquatic habitats. Algal biomass (measured as chloro-phyll a, cell numbers, and/or algal biovolume;Stevenson, 1996) can be used to indicate the presenceof toxic pollutants as well as trophic status and nui-sance algal growths (Carlson, 1977; Dodds et al.,1998). Taxonomic composition and diversity of algalassemblages are used to assess ecological health ofhabitats and to infer probable environmental causes ofecological impairment (e.g., Patrick et al., 1954; Smol,
1992; Stevenson and Pan, 1999). Ratios of chemicalsin algal samples can be used to indicate algal health(phaeophytin:chlorophyll a) and nutrient limitation(N:P) (Weber, 1973; Hecky and Kilham, 1988; Biggs,1995). Photosynthesis, respiration, and phosphataseactivity are examples of algal metabolism that can beused to assess the amount of algae in habitats, physio-logical impairment, and phosphorus limitation (Blanck,1985; Hill et al., 1997; Newman et al., 1994).
In this chapter, the abundant and diverse methodsof using algae to assess environmental conditions in allaquatic habitats are organized in a risk assessmentframework (U.S. Environmental Protection Agency,1992, 1996, 1998). Many reviews of algal methods forenvironmental assessment have been published inrecent years (Stevenson and Lowe, 1986; Round, 1991;Coste et al., 1991; Smol, 1992; Whitton and Kelly,1995; Rosen, 1995; Reid et al., 1995; Lowe and Pan, 1996; Stevenson, 1998; McCormick and Stevenson,1998; Wehr and Descy, 1998; Kelly and Whitton,1998; Kelly et al., 1998; Ibelings et al., 1998; Prygiel etal., 1999a; Stevenson and Pan, 1999; Stevenson andBahls, 1999; see many chapters in Whitton et al., 1991;Whitton and Rott, 1996; Stoermer and Smol, 1999;Prygiel et al., 1999b). We take this abundance of recentreviews as an indication of the growing importance ofalgae in environmental assessment. In our chapter, weemphasize understanding the goals of environmentalprograms, developing and testing hypotheses thataddress program goals, and selecting the simplest andmost direct methods for achieving program goals. Wepresent the characteristics of algae that can be used inenvironmental assessments and then elaborate on howthese characteristics can be related by using them in thefive steps of ecological risk assessment. Although algaehave been used for such assessments in habitatsthroughout the world, great potential exists for devel-oping indices that more directly meet the needs of specific environmental assessment programs. Thus, inthis chapter, we present the many approaches for devel-oping algal methods for environmental assessment, andthen we describe the application of algal methods forassessment.
II. GOALS OF ENVIRONMENTAL ASSESSMENT WITH ALGAE
The goals of environmental assessment programscan be established by legislation, by government offi-cials and policy decision makers, by scientists, or by thegeneral public. In most cases, scientists play an impor-tant role in translating the official goals of an environ-mental program into hypotheses that can be tested and
776 R. Jan Stevenson and John P. Smol
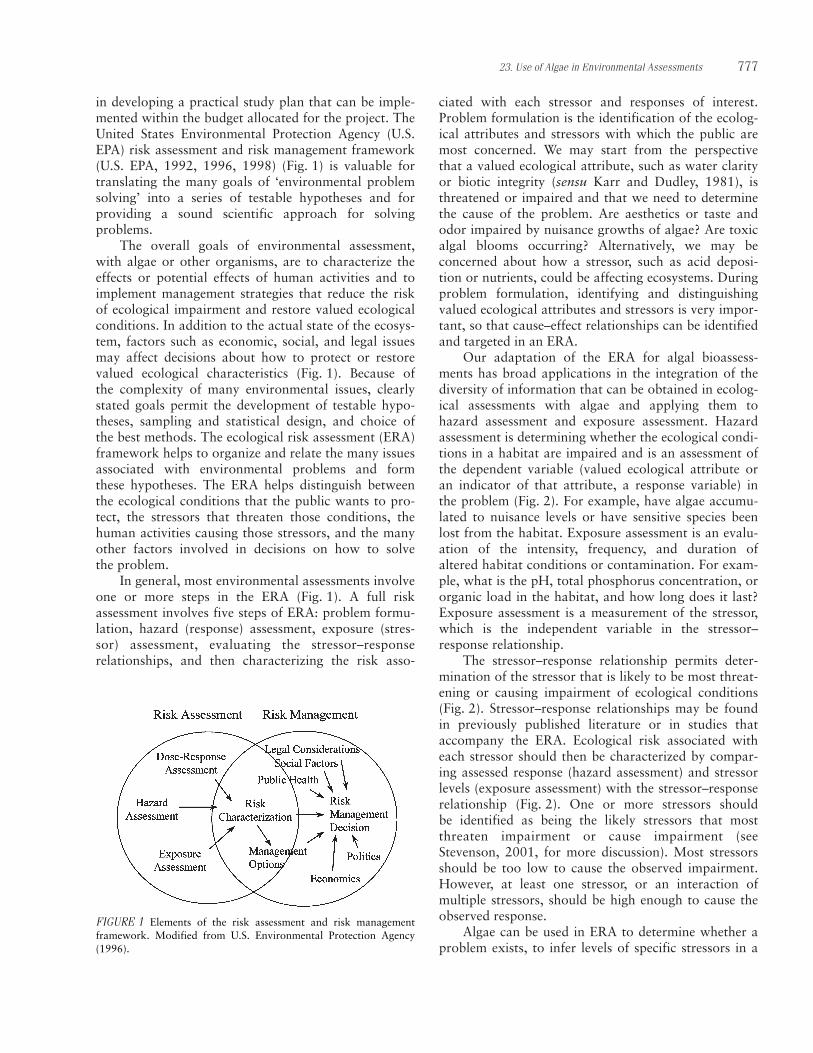
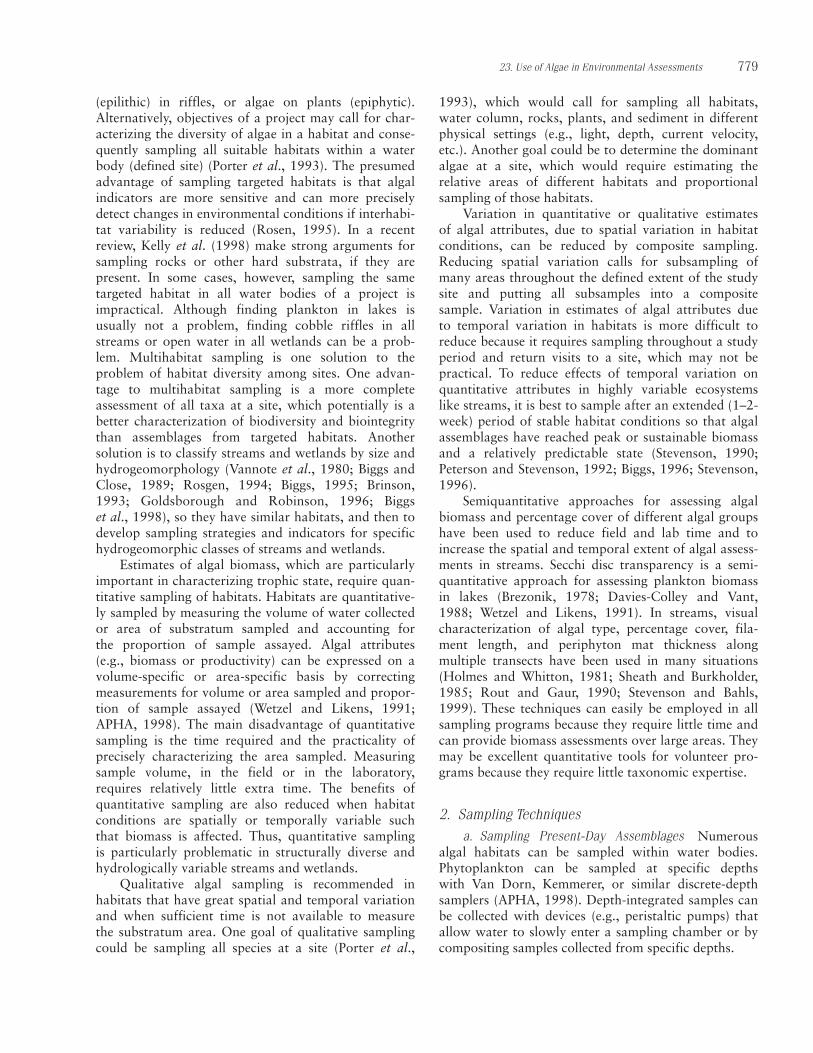
in developing a practical study plan that can be imple-mented within the budget allocated for the project. TheUnited States Environmental Protection Agency (U.S.EPA) risk assessment and risk management framework(U.S. EPA, 1992, 1996, 1998) (Fig. 1) is valuable fortranslating the many goals of ‘environmental problemsolving’ into a series of testable hypotheses and for providing a sound scientific approach for solving problems.
The overall goals of environmental assessment,with algae or other organisms, are to characterize theeffects or potential effects of human activities and toimplement management strategies that reduce the riskof ecological impairment and restore valued ecologicalconditions. In addition to the actual state of the ecosys-tem, factors such as economic, social, and legal issuesmay affect decisions about how to protect or restorevalued ecological characteristics (Fig. 1). Because of the complexity of many environmental issues, clearlystated goals permit the development of testable hypo-theses, sampling and statistical design, and choice ofthe best methods. The ecological risk assessment (ERA)framework helps to organize and relate the many issuesassociated with environmental problems and formthese hypotheses. The ERA helps distinguish betweenthe ecological conditions that the public wants to pro-tect, the stressors that threaten those conditions, thehuman activities causing those stressors, and the manyother factors involved in decisions on how to solve the problem.
In general, most environmental assessments involveone or more steps in the ERA (Fig. 1). A full riskassessment involves five steps of ERA: problem formu-lation, hazard (response) assessment, exposure (stres-sor) assessment, evaluating the stressor–responserelationships, and then characterizing the risk asso-
ciated with each stressor and responses of interest.Problem formulation is the identification of the ecolog-ical attributes and stressors with which the public aremost concerned. We may start from the perspectivethat a valued ecological attribute, such as water clarityor biotic integrity (sensu Karr and Dudley, 1981), isthreatened or impaired and that we need to determinethe cause of the problem. Are aesthetics or taste andodor impaired by nuisance growths of algae? Are toxicalgal blooms occurring? Alternatively, we may be concerned about how a stressor, such as acid deposi-tion or nutrients, could be affecting ecosystems. Duringproblem formulation, identifying and distinguishingvalued ecological attributes and stressors is very impor-tant, so that cause–effect relationships can be identifiedand targeted in an ERA.
Our adaptation of the ERA for algal bioassess-ments has broad applications in the integration of thediversity of information that can be obtained in ecolog-ical assessments with algae and applying them to hazard assessment and exposure assessment. Hazardassessment is determining whether the ecological condi-tions in a habitat are impaired and is an assessment ofthe dependent variable (valued ecological attribute oran indicator of that attribute, a response variable) inthe problem (Fig. 2). For example, have algae accumu-lated to nuisance levels or have sensitive species beenlost from the habitat. Exposure assessment is an evalu-ation of the intensity, frequency, and duration ofaltered habitat conditions or contamination. For exam-ple, what is the pH, total phosphorus concentration, ororganic load in the habitat, and how long does it last?Exposure assessment is a measurement of the stressor,which is the independent variable in the stressor–response relationship.
The stressor–response relationship permits deter-mination of the stressor that is likely to be most threat-ening or causing impairment of ecological conditions(Fig. 2). Stressor–response relationships may be foundin previously published literature or in studies thataccompany the ERA. Ecological risk associated witheach stressor should then be characterized by compar-ing assessed response (hazard assessment) and stressorlevels (exposure assessment) with the stressor–responserelationship (Fig. 2). One or more stressors should be identified as being the likely stressors that mostthreaten impairment or cause impairment (seeStevenson, 2001, for more discussion). Most stressorsshould be too low to cause the observed impairment.However, at least one stressor, or an interaction of multiple stressors, should be high enough to cause theobserved response.
Algae can be used in ERA to determine whether aproblem exists, to infer levels of specific stressors in a
23. Use of Algae in Environmental Assessments 777
FIGURE 1 Elements of the risk assessment and risk managementframework. Modified from U.S. Environmental Protection Agency(1996).

habitat, and to characterize stressor–response relation-ships. Algal indices are used to assess both stressors aswell as valued ecological attributes. Probably morethan any other group of organisms, algae have beenused to infer physical and chemical conditions (poten-tial stressors) in a habitat through the determination of species composition of assemblages and species’ ecological preferences. Potential for inferring stressorconditions exists for other organisms, but algae areused much more often than fish, macroinvertebrates, orinsects in terrestrial habitats to infer levels of pH, con-ductivity, trophic status, and sewage contamination.Therefore, distinguishing between whether algal indicesare indicating valued ecological attributes or stressorsis important for relating results of algal bioassessmentsto goals of the ERA. This opportunity to use algae todetermine whether problems exist, potentially evenforecast problems, and to diagnose causes of problemsshould be emphasized in algal bioassessments.
III. SAMPLING AND ASSESSING ALGALASSEMBLAGES FOR ENVIRONMENTALASSESSMENT
A. Sampling Algae in Freshwater Habitats
Sampling techniques and design may vary with theobjectives of the assessment, probable factors affectingalgae and anticipated problems, water body type,
targeted habitat within the water body, and budget. Acomplete discussion of the most appropriate samplingmethods and design is beyond the scope of this chapter,but we will review some of the important issues relatedto sampling for bioassessment. In general, the samebasic approaches are useful for solving most problemsin any water body or habitat. Algal indicators may, however, be more precise if they are refined withregional datasets for specific water body types, but thisproblem will be discussed later with development ofindicators of exposure assessment (weighted averaginginference models).
1. Sampling Design
Objectives of an environmental assessment shouldbe defined as clearly as possible for the formulation ofhypotheses and a sampling design (e.g., Green, 1979).Testable hypotheses should be formed so that resultsprovide answers that address the objectives of theassessment and that have a defined error or uncertainty.Testing hypotheses requires a sampling design thatincludes replicate sampling or some form of assessmentof error variation. Estimates of ecological health insmall, local studies are usually based on replicate sampling at all sites and provide means and estimatesof variation at each site to test the hypothesis that con-ditions at a tested site are significantly different fromconditions at a reference site or from a criterion.However, replicate sampling at all sites in large surveysis often not affordable; then replicate sampling at arandom subset of sites (often 10% or more) can beused to characterize variation in estimates of ecologicalhealth. The error variation associated with the randomsubset of sites in large surveys is a measure of the precision (standard deviation or standard error) ofassessments at all sites.
Before sampling, investigators should define theextent of each sample site so that it can be repeated atall locations. The open-water region of lakes usuallydefines the horizontal extent of plankton habitats sampled at a lake site, but the vertical extent (depth ofsampling) may vary with goals of the project. In manyriver programs, for example, sampling one riffle hasbeen considered sufficient to characterize the ecologicalhealth of a stream with benthic algae (Bahls, 1993), butin other programs the extent of the habitat is defined asa stream reach with a length that is 40 times the widthof the stream (Klemm and Lazorchak, 1994; Stevensonand Bahls, 1999). Similarly, a representative portion ofwetland should be chosen to sample (e.g., Stevenson etal., 1999).
Most algal sampling strategies focus on a specifichabitat within the water body (Wehr and Sheath,Chap. 2, this volume), such as plankton, algae on rocks
778 R. Jan Stevenson and John P. Smol
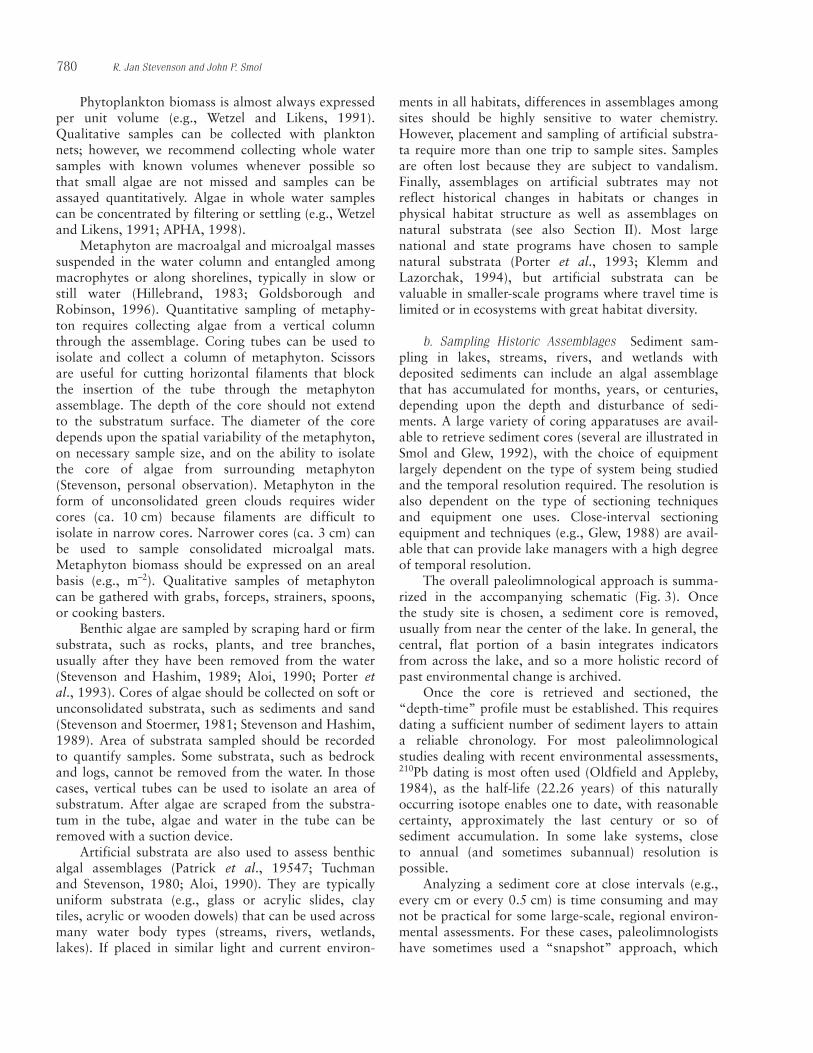
FIGURE 2 Response–stressor relationship between hypothetical eco-logical response and stressor with hazard assessment and exposureassessment indicated. Acceptable levels of the ecological response areindicated by the horizontal dotted line. The stressor level that pro-duces that level of response is indicated by the vertical dashed line.The observed ecological response (indicated by horizontal solidarrow marked HA on the y axis) is below acceptable levels. Twostressors were measured or inferred based on algal indices (indicatedby the vertical arrows marked EA (exposure assessment) on the x
axis). One stressor (indicated by EA1) is too low to cause theobserved response, whereas the other has a high certainty of causingthe observed ecological condition.
(epilithic) in riffles, or algae on plants (epiphytic).Alternatively, objectives of a project may call for char-acterizing the diversity of algae in a habitat and conse-quently sampling all suitable habitats within a waterbody (defined site) (Porter et al., 1993). The presumedadvantage of sampling targeted habitats is that algalindicators are more sensitive and can more preciselydetect changes in environmental conditions if interhabi-tat variability is reduced (Rosen, 1995). In a recentreview, Kelly et al. (1998) make strong arguments forsampling rocks or other hard substrata, if they arepresent. In some cases, however, sampling the same targeted habitat in all water bodies of a project isimpractical. Although finding plankton in lakes is usually not a problem, finding cobble riffles in allstreams or open water in all wetlands can be a prob-lem. Multihabitat sampling is one solution to the problem of habitat diversity among sites. One advan-tage to multihabitat sampling is a more completeassessment of all taxa at a site, which potentially is abetter characterization of biodiversity and biointegritythan assemblages from targeted habitats. Another solution is to classify streams and wetlands by size andhydrogeomorphology (Vannote et al., 1980; Biggs andClose, 1989; Rosgen, 1994; Biggs, 1995; Brinson,1993; Goldsborough and Robinson, 1996; Biggs et al., 1998), so they have similar habitats, and then todevelop sampling strategies and indicators for specifichydrogeomorphic classes of streams and wetlands.
Estimates of algal biomass, which are particularlyimportant in characterizing trophic state, require quan-titative sampling of habitats. Habitats are quantitative-ly sampled by measuring the volume of water collectedor area of substratum sampled and accounting for the proportion of sample assayed. Algal attributes (e.g., biomass or productivity) can be expressed on avolume-specific or area-specific basis by correctingmeasurements for volume or area sampled and propor-tion of sample assayed (Wetzel and Likens, 1991;APHA, 1998). The main disadvantage of quantitativesampling is the time required and the practicality ofprecisely characterizing the area sampled. Measuringsample volume, in the field or in the laboratory,requires relatively little extra time. The benefits ofquantitative sampling are also reduced when habitatconditions are spatially or temporally variable suchthat biomass is affected. Thus, quantitative sampling is particularly problematic in structurally diverse andhydrologically variable streams and wetlands.
Qualitative algal sampling is recommended inhabitats that have great spatial and temporal variationand when sufficient time is not available to measure the substratum area. One goal of qualitative samplingcould be sampling all species at a site (Porter et al.,
1993), which would call for sampling all habitats,water column, rocks, plants, and sediment in differentphysical settings (e.g., light, depth, current velocity,etc.). Another goal could be to determine the dominantalgae at a site, which would require estimating the relative areas of different habitats and proportionalsampling of those habitats.
Variation in quantitative or qualitative estimates of algal attributes, due to spatial variation in habitatconditions, can be reduced by composite sampling.Reducing spatial variation calls for subsampling ofmany areas throughout the defined extent of the studysite and putting all subsamples into a composite sample. Variation in estimates of algal attributes due to temporal variation in habitats is more difficult toreduce because it requires sampling throughout a studyperiod and return visits to a site, which may not bepractical. To reduce effects of temporal variation onquantitative attributes in highly variable ecosystemslike streams, it is best to sample after an extended (1–2-week) period of stable habitat conditions so that algalassemblages have reached peak or sustainable biomassand a relatively predictable state (Stevenson, 1990;Peterson and Stevenson, 1992; Biggs, 1996; Stevenson,1996).
Semiquantitative approaches for assessing algalbiomass and percentage cover of different algal groupshave been used to reduce field and lab time and toincrease the spatial and temporal extent of algal assess-ments in streams. Secchi disc transparency is a semi-quantitative approach for assessing plankton biomassin lakes (Brezonik, 1978; Davies-Colley and Vant,1988; Wetzel and Likens, 1991). In streams, visualcharacterization of algal type, percentage cover, fila-ment length, and periphyton mat thickness along multiple transects have been used in many situations(Holmes and Whitton, 1981; Sheath and Burkholder,1985; Rout and Gaur, 1990; Stevenson and Bahls,1999). These techniques can easily be employed in allsampling programs because they require little time andcan provide biomass assessments over large areas. Theymay be excellent quantitative tools for volunteer pro-grams because they require little taxonomic expertise.
2. Sampling Techniques
a. Sampling Present-Day Assemblages Numerousalgal habitats can be sampled within water bodies.Phytoplankton can be sampled at specific depths with Van Dorn, Kemmerer, or similar discrete-depthsamplers (APHA, 1998). Depth-integrated samples canbe collected with devices (e.g., peristaltic pumps) thatallow water to slowly enter a sampling chamber or bycompositing samples collected from specific depths.
23. Use of Algae in Environmental Assessments 779
Phytoplankton biomass is almost always expressedper unit volume (e.g., Wetzel and Likens, 1991).Qualitative samples can be collected with planktonnets; however, we recommend collecting whole watersamples with known volumes whenever possible sothat small algae are not missed and samples can beassayed quantitatively. Algae in whole water samplescan be concentrated by filtering or settling (e.g., Wetzeland Likens, 1991; APHA, 1998).
Metaphyton are macroalgal and microalgal massessuspended in the water column and entangled amongmacrophytes or along shorelines, typically in slow orstill water (Hillebrand, 1983; Goldsborough andRobinson, 1996). Quantitative sampling of metaphy-ton requires collecting algae from a vertical columnthrough the assemblage. Coring tubes can be used toisolate and collect a column of metaphyton. Scissorsare useful for cutting horizontal filaments that blockthe insertion of the tube through the metaphytonassemblage. The depth of the core should not extend to the substratum surface. The diameter of the coredepends upon the spatial variability of the metaphyton,on necessary sample size, and on the ability to isolate the core of algae from surrounding metaphyton(Stevenson, personal observation). Metaphyton in theform of unconsolidated green clouds requires widercores (ca. 10 cm) because filaments are difficult to isolate in narrow cores. Narrower cores (ca. 3 cm) canbe used to sample consolidated microalgal mats.Metaphyton biomass should be expressed on an arealbasis (e.g., m–2). Qualitative samples of metaphytoncan be gathered with grabs, forceps, strainers, spoons,or cooking basters.
Benthic algae are sampled by scraping hard or firmsubstrata, such as rocks, plants, and tree branches, usually after they have been removed from the water(Stevenson and Hashim, 1989; Aloi, 1990; Porter etal., 1993). Cores of algae should be collected on soft orunconsolidated substrata, such as sediments and sand(Stevenson and Stoermer, 1981; Stevenson and Hashim,1989). Area of substrata sampled should be recordedto quantify samples. Some substrata, such as bedrockand logs, cannot be removed from the water. In thosecases, vertical tubes can be used to isolate an area ofsubstratum. After algae are scraped from the substra-tum in the tube, algae and water in the tube can beremoved with a suction device.
Artificial substrata are also used to assess benthicalgal assemblages (Patrick et al., 19547; Tuchman and Stevenson, 1980; Aloi, 1990). They are typicallyuniform substrata (e.g., glass or acrylic slides, clay tiles, acrylic or wooden dowels) that can be used acrossmany water body types (streams, rivers, wetlands,lakes). If placed in similar light and current environ-
ments in all habitats, differences in assemblages amongsites should be highly sensitive to water chemistry.However, placement and sampling of artificial substra-ta require more than one trip to sample sites. Samplesare often lost because they are subject to vandalism.Finally, assemblages on artificial subtrates may notreflect historical changes in habitats or changes inphysical habitat structure as well as assemblages onnatural substrata (see also Section II). Most largenational and state programs have chosen to samplenatural substrata (Porter et al., 1993; Klemm andLazorchak, 1994), but artificial substrata can be valuable in smaller-scale programs where travel time islimited or in ecosystems with great habitat diversity.
b. Sampling Historic Assemblages Sediment sam-pling in lakes, streams, rivers, and wetlands withdeposited sediments can include an algal assemblagethat has accumulated for months, years, or centuries,depending upon the depth and disturbance of sedi-ments. A large variety of coring apparatuses are avail-able to retrieve sediment cores (several are illustrated inSmol and Glew, 1992), with the choice of equipmentlargely dependent on the type of system being studiedand the temporal resolution required. The resolution isalso dependent on the type of sectioning techniquesand equipment one uses. Close-interval sectioningequipment and techniques (e.g., Glew, 1988) are avail-able that can provide lake managers with a high degreeof temporal resolution.
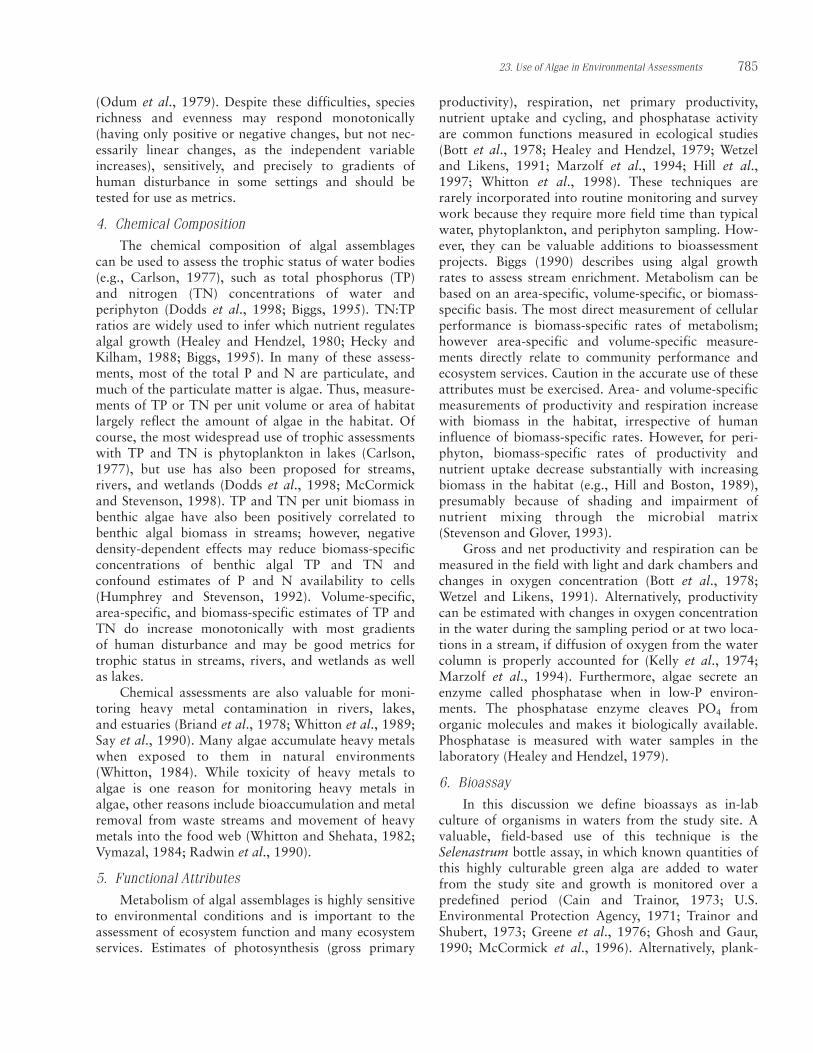
The overall paleolimnological approach is summa-rized in the accompanying schematic (Fig. 3). Once the study site is chosen, a sediment core is removed,usually from near the center of the lake. In general, thecentral, flat portion of a basin integrates indicatorsfrom across the lake, and so a more holistic record ofpast environmental change is archived.
Once the core is retrieved and sectioned, the“depth-time” profile must be established. This requiresdating a sufficient number of sediment layers to attaina reliable chronology. For most paleolimnological studies dealing with recent environmental assessments,210Pb dating is most often used (Oldfield and Appleby,1984), as the half-life (22.26 years) of this naturallyoccurring isotope enables one to date, with reasonablecertainty, approximately the last century or so of sediment accumulation. In some lake systems, close to annual (and sometimes subannual) resolution is possible.
Analyzing a sediment core at close intervals (e.g.,every cm or every 0.5 cm) is time consuming and maynot be practical for some large-scale, regional environ-mental assessments. For these cases, paleolimnologistshave sometimes used a “snapshot” approach, which
780 R. Jan Stevenson and John P. Smol

attempts to estimate what conditions were like beforeanthropogenic impacts and how much degradation hasoccurred. This so-called top/bottom approach is a very simple but effective tool for obtaining regionalassessments of environmental change. Paleolimno-logists remove surface sediment cores as they would ina detailed paleoenvironmental assessment; but insteadof sectioning and analyzing the entire core, they simplyanalyze, for example, diatom valves and/or chryso-phyte scales in the top 1 cm of sediment (= present-dayconditions) and from a sediment level known to havebeen deposited before anthropogenic impact (i.e., thebottom sediment section). This before-and-afterapproach has been effectively used to infer environ-mental change, such as acidification (Cumming et al.,1992a; Battarbee et al., 1999; Dixit et al., 1999) andeutrophication (e.g., Dixit and Smol, 1994; Hall andSmol, 1999) that has occurred on regional scales. Inaddition to providing some estimate of degradation,these paleoenvironmental data also provide importantinformation on the natural background conditions of asystem and therefore provide important mitigation targets for environmental remediation efforts (Smol,
1992). To determine the rates and trajectories of pastchanges, more detailed paleoenvironmental assessmentsare required.
The next step is to recover any paleoenvironmentalinformation archived in dated sediment cores. Ourfocus here is on the paleophycological data, but manyother types of proxy data are available. For example,past changes in terrestrial vegetation can be inferredfrom the analyses of fossil pollen grains (the field ofpalynology); paleomagnetic measurements and othertechniques can be used to estimate past erosion rates(e.g., Dearing et al., 1987); and isotope and geochemi-cal analyses of metals and other contaminants (e.g.,PCBs, DDT, etc.) can be analyzed from the sedimentaryprofiles (Autenrieth et al., 1991). Despite these otherpowerful approaches, the mainstay of many paleo-limnological assessments is algal data. Virtually everyalgal group leaves some sort of morphological or chem-ical fossil in the sedimentary record, but the indicatorsthat are most often used are diatom valves (Dixit et al.,1992), chrysophyte scales and cysts (Smol, 1995), andfossil pigments (Leavitt, 1996). As shown in examplesgiven later in this chapter, these indicators can be used
23. Use of Algae in Environmental Assessments 781
FIGURE 3 Schematic diagram showing the major steps involved in a paleolimnological assessment. Modifiedfrom Dixit et al., (1992a).

to reconstruct past limnological characteristics (such aspH, eutrophication variables, and salinity). Paleo-limnological approaches have been subjected to a largeamount of quality assurance and quality control considerations; if undertaken carefully and correctly,the paleolimnological approach is robust, reproducible,and powerful.
B. Attributes of Algal Assemblages for Environmental Assessment
Many attributes of algal assemblages can be usedto assess environmental conditions in a habitat or site(Table I). Structural attributes (e.g., species composi-tion) and functional attributes (e.g., productivity) canbe measured in the field or the laboratory. The diversityof these attributes and the pros and cons of their useshave been discussed in recent studies (Stevenson, 1996;Stoermer and Smol, 1999; Stevenson and Pan, 1999;Stevenson and Bahls, 1999). In this treatment, we willfocus more on the value of these attributes in detectingeffects of humans on ecological systems.
For this review, we will use a set of terms recom-mended by Karr and Chu (1999) to clarify discussionsof using biological data for bioassessment. An attribute
is any characteristic of an assemblage that can be meas-ured, such as chlorophyll a (chl a), number of species,or net primary productivity. A metric is an attributethat responds to human disturbances of habitats. Someattributes, such as the number of diatom genera in a200-valve count, may not reliably respond to humanimpacts. Karr and Chu (1999) also recommend the useof the term index for statistical and other mathematicalsummaries of many metrics and indices. Multimetricindices of biotic integrity, such as the diatom bio-assessment index (Kentucky Division of Water, 1993),are examples of multiple metrics being averaged orsummed to compose a single, summary index. Many ofthe water quality indices that are commonly used inEurope (e.g., pollution tolerance index (Lange-Bertlalot1979), generic diatom index (Coste and Ayphassorho,1991), and trophic diatom index (Kelly and Whitton,1995)) should probably be characterized as metrics,according to the method of Karr and Chu (1999), butwe do not recommend renaming these indicators andbeing encumbered by semantics.
Algal assemblages can be characterized throughthe use of two basic kinds of attributes, structural andfunctional (Table I). Structural attributes are instanta-neous characterizations of assemblages, such as bio-mass per unit area or volume of habitat, taxonomicand chemical characterizations of community composi-tion, and diversity of community taxa (e.g., speciesrichness). Functional attributes are measures or indica-tors of assemblage metabolism, such as photosyntheticrate (gross primary production), respiration rate, netprimary productivity, nutrient cycling, phosphataseactivity, and population growth rates. Functionalassessments usually require more time in the field ormultiple trips, so are used less in routine environmentalassessments. However, they can be important for under-standing impairment of algal and microbial activity.
1. Biomass
Biomass of algae usually increases with resourceavailability and decreases with many stressors causedby humans (Vollenweider, 1976; Dodds et al., 1998).Removal of riparian (stream-side) canopies alongstreams and nutrient loading in all water bodiesincrease light, temperature, and nutrient availability,which can limit algal growth rates and biomass accrual(see reviews in Biggs, 1996; Hill, 1996; DeNicola,1996; Borchardt, 1996). Sediments, toxic substances,and removal of benthic habitat can limit algal growthand accrual (Genter, 1996; Hoagland et al., 1996).Because biomass and the potential for nuisance algalgrowths vary temporally with season and weather(Whitton, 1970; Wong et al., 1978; Lembi et al.,1988), timing of sampling is important. In most habi-
782 R. Jan Stevenson and John P. Smol
TABLE I Basic Attributes of Algal Assemblages That Can Be Measured and Potentially Be Used to AssessEnvironmental Conditions
Structural attributesBiomass
chl a
Ash free dry massCell densityCell biovolume
Taxonomic compositionSpecies relative abundancesSpecies relative biovolumeFunctional group biovolume
DiversitySpecies richnessGenus richnessEvenness
Chemical compositionchl a:(Phaeophytin+Chl a) ratiochl a:ash free dry mass ratioP or N/ash free dry massN:P ratio of algal assemblages
Functional attributesPhotosynthesis ratesRespiration ratesNet primary productivityGrowth ratesNutrient uptake rates
For a more detailed list with literature citations, see McCormick andCairns (1994).

tats, peak biomass occurs after periods of undisturbedhabitat conditions (e.g., post-flood) when algal biomasshas had an opportunity to accrue. Spring and summerblooms of phytoplankton are common in lakes withspring turnover and warm summer temperatures(Wetzel, 1983; Harper, 1992). Nuisance algal growthsmay occur, with filamentous benthic algal accrual during seasonal optima (Whitton, 1970; Biggs andPrice, 1987; Dodds and Gudder, 1992; Lembi et al.,Chap. 24, this volume), or in the water column duringsummer low flow, when water residence time is suffi-cient for algal accrual in the water column (Bowlingand Baker, 1996). Biomass is an important attribute in environmental assessments because it is related to productivity and nuisance problems.
Biomass of algal assemblages can be estimatedwith laboratory assays of chl a, dry mass, ash-free drymass, algal cell density, biovolume, or chemical mass of samples. All of these measurements have pros andcons (see Stevenson, 1996, for a review), because nonedirectly measure all constituents of algal biomass oronly algal biomass. However, all are reasonable esti-mates of algal biomass in different situations. Chl amust be extracted from cells in organic solvents, suchas acetone or methanol, and then assayed by spectro-photometry, fluorometry, or high-performance liquidchromatography (HPLC) (Lorenzen, 1967; Mantouraand Llewellyn, 1983; Wetzel and Likens, 1991; APHA,1998; Van Heukelem et al., 1992; Millie et al., 1993).Spectrophotometric and flourometric chl a assaysshould be corrected for phaeophytin. Dry mass andash-free dry mass are measured by drying and com-busting samples (APHA, 1998). Cell density is meas-ured after cells are counted microscopically (Lund etal., 1958; APHA, 1998; Stevenson and Bahls, 1999).Algal biovolume can be measured by distinguishingsizes of cells during microscopic counts, multiplyingbiovolume by cell size for all size categories, and finallysumming biovolumes for all size categories in the sample (Stevenson et al., 1985; Wetzel and Likens,1991; APHA, 1998; Hillebrand et al., 1999). Becauseof variation in vacuole size and cell walls (e.g., Sicko-Goad et al., 1977), cell surface area may be a valuableindicator of biomass because much cytoplasm is within1–2 µm of the cell membrane.
Biomass can also be estimated rapidly with fieldassays, such as secchi depth in the water column andpercentage cover and thickness of algal assemblages on substrata (Wetzel and Likens, 1991). Secchi depthcharacterizes light attenuation in the water column;assessments of algal biomass by this method are con-founded by suspended inorganic materials, dissolvedsubstances, and other factors (Preisendorfer, 1986).The strengths of assessing benthic algal biomass from
percentage cover and thickness of algal assemblages isthat biomass throughout a stream reach can be readilycharacterized (Holmes and Whitton, 1981; Sheath andBurkholder, 1985; Stevenson and Bahls, 1999). Remotesensing of algal biomass also shows promise for assess-ing spatially and temporally variable growths (Cullenet al., 1997). These rapid assessment techniques maypermit more thorough spatial and temporal assess-ments, which may improve the notoriously variablerelationships between biomass and nutrient concentra-tions or loading.
2. Taxonomic Composition
Taxonomic composition of algae is a powerful tool for assessing biotic integrity and diagnosing thedirect and indirect causes of environmental problems(Stevenson, 1998). Differences in taxonomic composi-tion of assemblages between an assessed site and a reference (desired) site can indicate impairment of biot-ic integrity and environmental conditions, if naturalvariation in assemblage composition is well documented(e.g., McCormick and O’Dell, 1996; McCormick andStevenson, 1998). When natural seasonal or interhabi-tat variation in composition is not well known, changesin taxonomic composition can be related to humanactivities by comparing shifts in taxonomic compo-sition to environmental change with autecological characteristics of species and relating inferred environ-mental changes to human activities (e.g., Kwandrans etal., 1998). Shifts in functional groups of algae (definedas different growth forms and divisions of algae; e.g.,Pan et al., 2000) can also indicate an important changein food quality and in habitat structure for benthicinvertebrates. For example, the food quality and acces-sibility of diatoms are usually greater than cyanobacte-ria and filamentous green algae for many herbivores(Porter, 1977; Lamberti, 1996). In addition, the habitatstructure for benthic invertebrates differs greatly withchanges from microalgae (e.g., diatoms) to macroalgae(e.g., Cladophora) (Holomuzki and Short, 1988;Power, 1990).
Taxonomic composition of algal assemblages canprovide a highly precise and accurate characterizationof biotic integrity and environmental conditions(Stoermer and Smol, 1999). Taxonomic composition of assemblages develops over periods of time, rangingfrom weeks to years, and should reflect environmentalchanges during that period. Even though taxonomiccomposition varies spatially and temporally in a waterbody, autecological characterizations of environmentalconditions based on taxonomic composition shouldconsistently reflect the physical and chemical changescaused by humans. For example, if trophic status of ahabitat is being assessed, only low-nutrient indicator
23. Use of Algae in Environmental Assessments 783

taxa should occur in low-nutrient habitats, eventhough temperature and shading and stage of commu-nity development may change with time and local habitat structure. Species presence and success inassemblages are fundamentally constrained by environ-mental conditions and interactions (e.g., competition)with other species in the habitat (Stevenson, 1997).Thus, attributes of assemblages based on percentagetaxonomic similarity of assemblages at a test site and areference site (Raschke, 1993; Stevenson, 1984) andpercentage sensitive species should be good metricsbecause typically they sensitively, precisely, and monot-onically change along gradients of human disturbance.
Taxonomic composition of algal assemblages usually requires microscopic assessments of samples,but some basic information about growth form andclass can be obtained with rapid field assessments (e.g.,Sheath and Burkholder, 1985; Stevenson and Bahls,1999). The methods used for microscopic identificationand counting of algae depend upon the objectives ofdata analysis and type of sample. A two-step processhas been adopted by the national stream assessmentprograms in the United States. The first step is to count all algae and identify only nondiatom algae in awet mount at either 400× (e.g., Palmer cell) or 1000×,if many small algae occur in samples. Algae can becounted in wet mounts at 1000× with an invertedmicroscope (Lund et al., 1958) or with a regular micro-scope by drying samples onto a coverglass, invertingthe sample onto a microscope slide in 20 µL of water,and sealing the sample by ringing the coverglass withfingernail polish or varnish (Stevenson, unpublishedmethod). The second step is to count diatoms after oxidizing organic material out of diatoms and mount-ing them in a highly refractive mounting medium(Stevenson and Bahls, 1999). This technique providesthe most complete taxonomic assessment of an algalassemblage. Using counts of 300 algal cells, colonies,or filaments and about 500 diatom valves is a standardapproach of some U.S. national programs (Porter et al.,1993; Pan et al., 1996) and usually provides relativelyprecise estimates of the relative abundances of thedominant taxa in a sample. Alternatively, countingrules have been defined so that cells of all algae areidentified and counted until at least 10 cells (or naturalcounting units = cells, colonies, or filaments) of the 10dominant taxa are counted (Stevenson, unpublisheddata). This type rule, rather than a fixed total numberof cells, ensures precision in estimates of a specifiednumber of taxa. Some assessment programs primarilyuse diatoms (Bahls, 1993; Kentucky Division of Water,1993; Kelly et al., 1998; Kwandrans et al., 1998),because the number of species in diatom assemblages isusually sufficient to show a response.
Taxonomic composition can be recorded as presence/absence, percentage or proportional relativeabundances, percentage or proportional relative bio-volumes, or absolute densities and biovolumes of taxa(cells or µm3 cm–2 or mL–1). Although there is no published comparison of these forms of data, they re-present scales of biological resolution and probablyreflect a gradient from least sensitive to most sensitiveand least variable to most variable. Presence/absencerecords of species should be based on observations ofthousands of cells and conceptually should reflect long-term changes in habitat conditions if immigration andcolonization of habitats are a selective barrier. Relativeabundances and biovolumes of taxa probably reflectrecent habitat conditions more than long-term condi-tions because of recent species responses to environ-ment. Densities and biovolumes of taxa change daily,so absolute densities and biovolumes may be too sensi-tive to detect more long-term environmental changes.Relative abundance of cells is more commonly usedthan relative biovolumes (because of ease of use), butthe latter is particularly valuable when cell sizes varygreatly among taxa within samples.
3. Diversity
Richness and evenness of taxa abundances are twobasic elements of diversity (Shannon, 1948; Simpson,1949; Hurlbert, 1971) of biological assemblages.Richness and evenness are hypothesized to decreasewith increasing human disturbance of habitats; how-ever, evenness of species abundances may increase iftoxic stresses retard the growth of dominant taxa morethan rare taxa (e.g., Patrick, 1973). Two problemsdevelop with use of diversity measures in environmen-tal assessment: standard counting procedures may not accurately assess diversity (Patrick et al., 1954;Stevenson and Lowe, 1986), and diversity may notchange monotonically across the gradient of humandisturbance (Stevenson, 1984; Jüttner et al., 1996;Stevenson and Pan, 1999). Species diversity and even-ness are highly correlated with standard 300–600 cellcounts (Archibald, 1972). In these counts many specieshave usually not been identified, so richness is more a function of evenness than evenness is a function ofrichness (Patrick et al., 1954; Stevenson and Lowe,1986). As shown by standard counting procedures,nonmonotonic (showing both positive and negativechanges as the independent variable increases) respons-es of algal diversity to some environmental gradientsseem to be related to maximum evenness of tolerantand sensitive taxa at midpoints along environmentaloptima, to fewer species being adapted to environ-mental extremes at both ends of environmental gradients, and to subsidy-stress perturbation gradients
784 R. Jan Stevenson and John P. Smol
(Odum et al., 1979). Despite these difficulties, speciesrichness and evenness may respond monotonically(having only positive or negative changes, but not nec-essarily linear changes, as the independent variableincreases), sensitively, and precisely to gradients ofhuman disturbance in some settings and should be tested for use as metrics.
4. Chemical Composition
The chemical composition of algal assemblages can be used to assess the trophic status of water bodies(e.g., Carlson, 1977), such as total phosphorus (TP)and nitrogen (TN) concentrations of water and periphyton (Dodds et al., 1998; Biggs, 1995). TN:TPratios are widely used to infer which nutrient regulatesalgal growth (Healey and Hendzel, 1980; Hecky andKilham, 1988; Biggs, 1995). In many of these assess-ments, most of the total P and N are particulate, andmuch of the particulate matter is algae. Thus, measure-ments of TP or TN per unit volume or area of habitatlargely reflect the amount of algae in the habitat. Ofcourse, the most widespread use of trophic assessmentswith TP and TN is phytoplankton in lakes (Carlson,1977), but use has also been proposed for streams,rivers, and wetlands (Dodds et al., 1998; McCormickand Stevenson, 1998). TP and TN per unit biomass inbenthic algae have also been positively correlated tobenthic algal biomass in streams; however, negativedensity-dependent effects may reduce biomass-specificconcentrations of benthic algal TP and TN and confound estimates of P and N availability to cells(Humphrey and Stevenson, 1992). Volume-specific,area-specific, and biomass-specific estimates of TP andTN do increase monotonically with most gradients of human disturbance and may be good metrics fortrophic status in streams, rivers, and wetlands as wellas lakes.
Chemical assessments are also valuable for moni-toring heavy metal contamination in rivers, lakes, and estuaries (Briand et al., 1978; Whitton et al., 1989;Say et al., 1990). Many algae accumulate heavy metalswhen exposed to them in natural environments(Whitton, 1984). While toxicity of heavy metals toalgae is one reason for monitoring heavy metals inalgae, other reasons include bioaccumulation and metalremoval from waste streams and movement of heavymetals into the food web (Whitton and Shehata, 1982;Vymazal, 1984; Radwin et al., 1990).
5. Functional Attributes
Metabolism of algal assemblages is highly sensitiveto environmental conditions and is important to theassessment of ecosystem function and many ecosystemservices. Estimates of photosynthesis (gross primary
productivity), respiration, net primary productivity,nutrient uptake and cycling, and phosphatase activityare common functions measured in ecological studies(Bott et al., 1978; Healey and Hendzel, 1979; Wetzeland Likens, 1991; Marzolf et al., 1994; Hill et al.,1997; Whitton et al., 1998). These techniques arerarely incorporated into routine monitoring and surveywork because they require more field time than typicalwater, phytoplankton, and periphyton sampling. How-ever, they can be valuable additions to bioassessmentprojects. Biggs (1990) describes using algal growthrates to assess stream enrichment. Metabolism can bebased on an area-specific, volume-specific, or biomass-specific basis. The most direct measurement of cellularperformance is biomass-specific rates of metabolism;however area-specific and volume-specific measure-ments directly relate to community performance andecosystem services. Caution in the accurate use of theseattributes must be exercised. Area- and volume-specificmeasurements of productivity and respiration increasewith biomass in the habitat, irrespective of humaninfluence of biomass-specific rates. However, for peri-phyton, biomass-specific rates of productivity andnutrient uptake decrease substantially with increasingbiomass in the habitat (e.g., Hill and Boston, 1989),presumably because of shading and impairment ofnutrient mixing through the microbial matrix(Stevenson and Glover, 1993).
Gross and net productivity and respiration can bemeasured in the field with light and dark chambers andchanges in oxygen concentration (Bott et al., 1978;Wetzel and Likens, 1991). Alternatively, productivitycan be estimated with changes in oxygen concentrationin the water during the sampling period or at two loca-tions in a stream, if diffusion of oxygen from the watercolumn is properly accounted for (Kelly et al., 1974;Marzolf et al., 1994). Furthermore, algae secrete anenzyme called phosphatase when in low-P environ-ments. The phosphatase enzyme cleaves PO4 fromorganic molecules and makes it biologically available.Phosphatase is measured with water samples in the laboratory (Healey and Hendzel, 1979).
6. Bioassay
In this discussion we define bioassays as in-lab culture of organisms in waters from the study site. Avaluable, field-based use of this technique is theSelenastrum bottle assay, in which known quantities ofthis highly culturable green alga are added to waterfrom the study site and growth is monitored over a predefined period (Cain and Trainor, 1973; U.S.Environmental Protection Agency, 1971; Trainor andShubert, 1973; Greene et al., 1976; Ghosh and Gaur,1990; McCormick et al., 1996). Alternatively, plank-
23. Use of Algae in Environmental Assessments 785
tonic or benthic assemblages from reference or test sitescould be cultured in bioassays with waters from thosehabitats or different dilution levels of effluents enteringthose regions. Twist et al. (1997) introduced the novelapproach of embedding test organisms in alginate andculturing them in situ. Nutrient-diffusing substrata,microcosms, and mesocosms are also valuable bioassaytechniques in field settings (e.g., Cotê, 1983; Fairchildet al., 1985; Gensemer, 1991; Hoagland et al., 1993;Lamberti and Steinman, 1993; Thorp et al., 1996).Response of organisms to bioassays can provide another valuable line of evidence for identifying causesof environmental stress. Bioassay results with specificchemicals or effluents added can be used to confirmcause–effect relations between parameters for whichonly observational correlations can be obtained in fieldsurveys (e.g., McCormick and O’Dell, 1996; Pan et al.,2000).
IV. DEVELOPING METRICS FOR HAZARD ASSESSMENT
A. Relating Goals to Ecological Attributes
Hazard assessments are the determination of theintensity, spatial extent, frequency, and duration ofenvironmental problems or the threat of environmentalproblems in which ecological conditions do not meetdesignated use (U.S. EPA, 1996). Designated usedescribes the goals for environmental protection in U.S.management plans, such as preserving biotic integrityand biodiversity, maintaining fishable and swimmableconditions, minimizing taste and odor problems orrisks to human health in water supplies, optimizingsustainable fisheries production, and protecting humanhealth. Designated use emphasizes valued ecologicalattributes that the public wants to protect. Many algalattributes can be related to these designated uses. Werecommend selecting as many metrics as possible todevelop multiple lines of evidence to help assess ecolog-ical conditions, which can be altered in many ways.Thus, hazard assessment requires identifying the goalsof environmental assessment, selecting algal metricsthat represent qualities of ecosystems that are related todesignated uses, and then measuring those algal metricsto determine if goals are being met.
One of the most fundamental goals of environmen-tal assessment is to determine if the natural balance offlora and fauna has been altered in a habitat. The concept of biotic integrity and natural balance of floraand fauna is a legislated goal in the United States’Clean Water Act (Karr and Dudley, 1981; Adler, 1995),is fundamental to ecosystem protection and sustainingbiodiversity (Angermeier and Karr, 1994), and is
broadly applied in U.S. monitoring programs in whichindices of biotic integrity are used to identify ecologicalproblems (Plafkin et al., 1989; Barbour et al., 1999;Karr and Chu, 1999). Biotic integrity or ecosystemhealth can be defined as the similarity between assem-blages in an evaluated habitat and assemblages in a set of reference habitats (sensu Hughes, 1995). Thatassessment of similarity can be based on structural andfunctional characteristics. In most cases, assessment ofbiotic integrity has been based on changes in diversity,species composition, functional groups (such as pro-portions of diatoms versus green algae and cyanobacte-ria), and changes in ecological conditions inferred byspecies composition and species autecological charac-teristics (Karr, 1981; Smol, 1992; Kerans and Karr,1994; Stevenson and Bahls, 1999).
Alternatively, more specific assessments of algalnuisance can be the goals of projects. Such nuisancesmay cause reduced water clarity, hypolimnetic deoxy-genation, taste and odor problems, habitat alteration,or toxic effects on other organisms, including humans(Carmichael, 1994, Chap. 24). In these cases, algal biomass or specific problem taxa may be importantattributes for assessment.
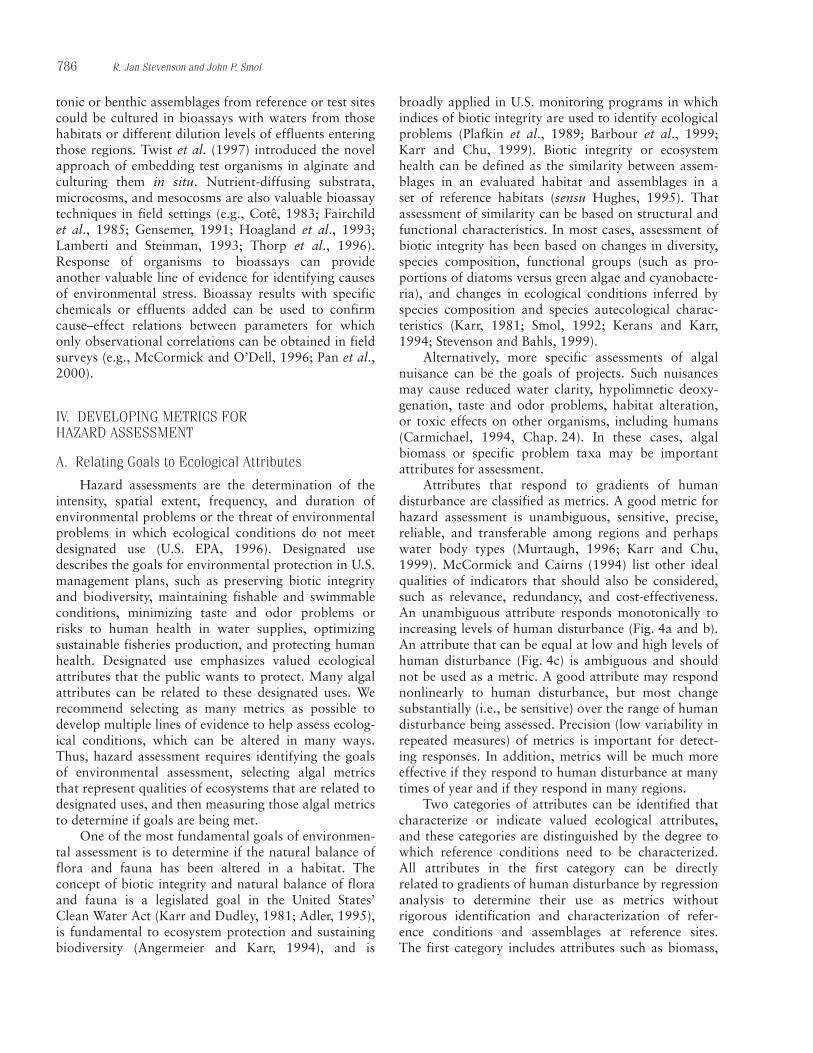
Attributes that respond to gradients of human disturbance are classified as metrics. A good metric forhazard assessment is unambiguous, sensitive, precise,reliable, and transferable among regions and perhapswater body types (Murtaugh, 1996; Karr and Chu,1999). McCormick and Cairns (1994) list other idealqualities of indicators that should also be considered,such as relevance, redundancy, and cost-effectiveness.An unambiguous attribute responds monotonically toincreasing levels of human disturbance (Fig. 4a and b).An attribute that can be equal at low and high levels ofhuman disturbance (Fig. 4c) is ambiguous and shouldnot be used as a metric. A good attribute may respondnonlinearly to human disturbance, but most changesubstantially (i.e., be sensitive) over the range of humandisturbance being assessed. Precision (low variability inrepeated measures) of metrics is important for detect-ing responses. In addition, metrics will be much moreeffective if they respond to human disturbance at manytimes of year and if they respond in many regions.
Two categories of attributes can be identified thatcharacterize or indicate valued ecological attributes,and these categories are distinguished by the degree towhich reference conditions need to be characterized.All attributes in the first category can be directly related to gradients of human disturbance by regressionanalysis to determine their use as metrics without rigorous identification and characterization of refer-ence conditions and assemblages at reference sites. The first category includes attributes such as biomass,
786 R. Jan Stevenson and John P. Smol

species richness, Shannon (1948) diversity, relativeabundances of specific nuisance taxa or functionalgroups of taxa, relative abundances of pollution-sensi-tive and pollution-tolerant taxa, and function of assem-blages (Tables I and II; Stevenson and Bahls, 1999).
A second category of metrics requires comparisonof differences between reference and test sites as the
response variable to the gradient of human disturbance(Table II). Similarity of species composition betweentest sites and reference sites is one potential metric.Similarity of species composition between referenceand test sites should decrease with increasing humandisturbance at test sites. Many different formula can beused to calculate percentage similarity. One compares
23. Use of Algae in Environmental Assessments 787
FIGURE 4 Examples of attribute responses that provide useful metrics. (A) Negative attribute responses along agradient of human disturbance. (B) Positive responses along a gradient of human disturbance. (C) Ambiguousresponses along a gradient of human disturbance. The different lines in each figure (A–C) represent differentpatterns that would fit the categories represented in the figures (negative, positive, and ambiguous, respectively).
TABLE II Examples of Metrics That Are Based on Taxonomic Composition of Assemblages andAutecological Characteristics of Species
Class Stressor Representative references
SC BI Pollution in general Lange-Bertalot (1979), Descy (1979), Coste (1982), (based on species) Bahls (1993)
SC BI Pollution in general Rumeau and Coste (1988), Coste and Ayphassorho (1991)(based on genera)
SC D pH Whitmore (1989)
SC D Trophic status Whitmore (1989), Kelly and Whitton (1995)
SC D Organic wastes Zelinka and Marvan (1961), Palmer (1969), Sládecek (1973, 1986), Watanabe et al. (1986)
SC D Salinity Zeimann (1991)
WA D pH Charles and Smol (1988), ter Braak and van Dam (1989),Sweets (1992), Cumming et al. (1992a, b)
WA D Salinity Fritz (1990), Cumming and Smol (1992)
WA D TP Anderson et al. (1993), Reavie et al. (1995), Pan et al. (1996), Pan and Stevenson (1996)
WA D Fish presence Kingston et al. (1992)
Metrics are classified based on whether they are based on simple categorical autecological characterizations (SC)or accurate weighted-average (WA) autecological characterizations and on whether they could be used to inferbiotic integrity (BI) of sites or are highly diagnostic (D) of stressors that may threaten or impair biotic integrity.

relative abundances of species in two samples andbases similarity upon the sum of the lower relativeabundances of each taxon in the two communities. Thepercentage community similarity (PSc; Whittaker,1952) is a straightforward example, where
PSC = Σi = 1,Smin(ai, bi)
Here ai is the percentage of the ith species in sample a, and bi is the percentage of the same ithspecies in sample b.
A second kind of similarity measurement is basedon a distance measurement, which is a dissimilaritymeasurement rather than a similarity measurement,because the index increases with the greater dissimilari-ty (Pielou, 1984; Stevenson, 1984). Euclidean distance(ED) is a standard, where
ED = √(Σi = 1,S(ai – bi)2)
When using these dissimilarity indices, we recom-mend log-transforming relative abundances to reducethe importance and variability of common taxa.
A third category of similarity indices only com-pares the observed taxa at an assessed site with thetaxa that are expected at that site to determine the pro-portion of species that have been lost from assessedsites. This technique has been used widely with macro-invertebrates (Moss et al., 1999) and was recentlyemployed with diatom genera (Chessman et al., 1999).This approach has the potential for increasing the pre-cision of algal metrics by distinguishing species in threecategories: species that should be there and are stillthere, species that have been lost, and species that have invaded. First, loss of species is an importantimpairment of biodiversity. Second, diagnosis of causesof impairment may be substantially enhanced by linking autecological information to whether specieshave resisted disturbance, not resisted disturbance, orinvaded to exploit disturbance.
In our application of the ERA framework, weemphasize the distinction between algal indicators thatcharacterize designated use and ecological values inwhich the public are most interested and algal indica-tors that diagnose the stressors that may threaten orcause impairment of designated use. Some protocolsrecommend that metrics indicating the status of desig-nated use be called “response” or “condition” indica-tors, and metrics that diagnose the physical, chemical,or biological factors that could be impairing designateduse be called “stressor” or “causal” indicators (Paulsenet al., 1991; U.S. Environmental Protection Agency,1998). This distinction of types of metrics emphasizesthe diversity of information that can be obtained withalgal assessments and how to apply that information inenvironmental problem solving. Therefore, algal indi-
cators that use environmental preferences of species,such as weighted average indices of pH or TP, will bedescribed later under exposure assessment, rather thathere under hazard assessment.
B. Testing Metrics
Metrics can be tested with measurements of attrib-utes at multiple sites with varying levels of human disturbance and either parametric or nonparametricstatistical methods (see Sokal and Rohlf, 1998). Siteswith different levels of human impact should be chosenand sampled to assess the ecological response to humandisturbance. The level of human disturbance at sitescan be characterized with multiple lines of evidence.When point sources of pollution occur, environmentalgradients are relatively simple to establish with a refer-ence condition upstream from the point source and adecreasing gradient of disturbance at increasing distances downstream from the point source. Whennon-point-source pollution is a concern, human distur-bance can be estimated by land use type, intensity, andproximity to a habitat or by concentrations of contami-nants. The multivariate nature of complex non-point-source contamination can be simplified with the use ofordination techniques and axis scores as a rankingscale of human disturbance.
Reference sites help define expected conditions in ahabitat if it had not been affected by human activities(Hughes, 1995); these are typically the least impactedecosystems in the region. Reference sites can be sitesupstream from a point source of pollution in a stream,whereas test sites can be downstream. Alternatively,reference sites for a specific climatic and hydrogeomor-phic class of habitats can be defined as a set of siteswith lowest human disturbance or greatest riparianbuffer within their watersheds. Reference sites may havethe lowest level of a specific stressor in them, such aslow phosphorus and other specific indicators of humandisturbance.
Algae are particularly useful in establishing refer-ence conditions in lakes and wetlands, where sedimentsare continuously deposited because algal remains insediments from times of low human disturbance can beused to infer historical conditions in those habitats.Paleolimnological approaches provide direct measure-ments of long-term environmental trends at a specificsite, which increases certainty about how fast and theextent to which a system is deteriorating. To proposerealistic mitigation procedures, paleolimnologicalreconstruction of past conditions can provide a realistictarget for restoration. Long-term data can also showcritical loads of pollutants or stressors that a systemcan handle before negative effects are manifested
788 R. Jan Stevenson and John P. Smol

(Smol, 1990, 1992, 1995; Anderson and Battarbee,1994; and papers in Stoermer and Smol, 1999).
Paleolimnological approaches are based on fairlystraightforward principles. Under ideal conditions, sediments slowly accumulate at the bottom of lakes,without disruptions. Certainly, in some cases, problemsmay occur (e.g., excessive bioturbation), but theseproblems can usually be recognized and assessed. Overtime, therefore, the history of the lake and its water-shed is archived in the depth/time profile of the sedi-ments. Incorporated in these sediments is a surprisinglylarge library of information on the conditions presentin the lake (from autochthonous indicators), as well asenvironmental conditions that existed outside the lake(from allochthonous indicators). Physical, chemical,and biological information is archived in sediments;however, for the purpose of this chapter, we will prima-rily focus on algal data. Paleolimnology is now widelyrecognized as a robust environmental managementtool. We mainly discuss lake paleoenvironmental studiesin this chapter, as most of the research has centered onthese systems. However, many paleo approaches caneasily be transferred to other aquatic systems such asponds (Douglas et al., 1994), rivers (e.g., Reavie andSmol, 1987, 1998; Amoros and Van Urk, 1989;Reavie et al., 1998), wetlands (Bunting et al., 1997),estuaries (Cooper, 1999), and marine systems(Anderson and Vos, 1992).
After algal attributes from habitats with differentlevels of human disturbance have been assessed, theirresponse to human disturbance can be characterized.Log-transformation of biomass-related variables (suchas chl a, cell density, and biovolume) is recommendedto meet the equal variances assumption of regressionanalysis and sometimes to make patterns more linear.Other data transformations may be necessary to meetassumptions of statistical tests (e.g., Green, 1979; Sokaland Rohlf, 1998) or to manage the sensitivity of met-rics. For example, arc-sine transformations of propor-tional data and log or square-root transformations ofrelative abundances should increase the normality ofthe data (Sokal and Rohlf, 1998) and can reduce theimportance of highly variable abundant taxa, whichincreases the precision of some metrics.
Both nonparametric and parametric statistical tech-niques can be used to determine whether algal attributesrespond to gradients of human disturbance. The sim-plest and most direct method is to compare attributesto the gradient of human disturbance by regression orcorrelation (e.g., Hill et al., 2000), if human disturbancecan be quantified on a continuous scale. Alternatively,human disturbance can be categorized as low and high,and ANOVA or Mann–Whitney U tests can be used totest for differences in metrics with differences in human
disturbance (Green, 1979; Barbour et al., 1992; Sokaland Rohlf, 1998; Barbour et al., 1999).
C. Multimetric Indices
Summarizing data in the form of multimetricindices has been a valuable method for communicatingresults of complex analyses that often involve multiplelines of evidence. This method has been used commonlywith fish and invertebrate assemblages as multimetricindices of biotic integrity (IBI) (Karr, 1981; Kerans andKarr, 1992), but it has also been used with periphyton(Kentucky Division of Water, 1993; Hill et al., 2000).Development of a multimetric index calls for selecting6–10 metrics that describe a diversity of responses ofassemblages that will be sensitive to all probable envi-ronmental stressors. For example, species richness, per-centage of diatoms, percentage similarity to referenceassemblages, number of taxa sensitive to pollution, per-centage motile diatoms, percentage aberrant diatoms,inferred trophic status, inferred salinity (conductivity),inferred saprobity, and inferred pH could be used in amultimetric index, if they all responded to gradients ofhuman disturbance (i.e., performed as good metrics).The range of each metric should be normalized, forexample, to a range of 0–10, so that each metric hasequal weight (see Hill et al., 2000). Then values of eachmetric for a sample can be summed. In an examplewith 10 metrics and each ranging from 0 to 10 in scale,the multimetric index would then range from 0 to 100.
The value of multimetric indices is that they pro-vide a single number as a summary of multiple lines ofevidence. Such a summary statistic is highly valuablefor communicating information to a lay audience, espe-cially when compared with interpretations of ordina-tion analyses (Karr and Chu, 1999). The disadvantageis that they may mask effects on one or two metrics;however, they can provide a hierarchically decompos-able system of metrics for assessing ecological risk andeven diagnosing causes or threats to impairment(Stevenson and Pan, 1999).
D. Multivariate Statistics and Hazard Assessment
Multivariate statistics are powerful and informa-tive statistical tools for determining the major patternsof change in species composition and relating them tophysical, chemical, or other biological characteristics ofthe habitats studied. We regard a multimetric index of biotic integrity (IBI) and multivariate statistics ascomplementary tools.
Cluster analysis and ordination provide multi-variate methods for grouping stations by similarity inassemblage structure, exploring patterns in data, and
23. Use of Algae in Environmental Assessments 789
illustrating those patterns (Hill, 1979; Pielou, 1984;Jongman et al., 1995). Cluster analyses can be bottom-up, such as UPGMA, or top-down, like TWINSPAN. Arecent evaluation comparing these approaches showedthat UPGMA, compared with TWINSPAN, groupedartificial assemblages better (developed based on aselected set of assumptions and assignment of species’relative abundances, based on a probabilistic distribu-tion) (Belbin and McDonald, 1993). However, manyresearchers use TWINSPAN and find results with actualdata to be highly interpretable (e.g., Pan et al., 2000).
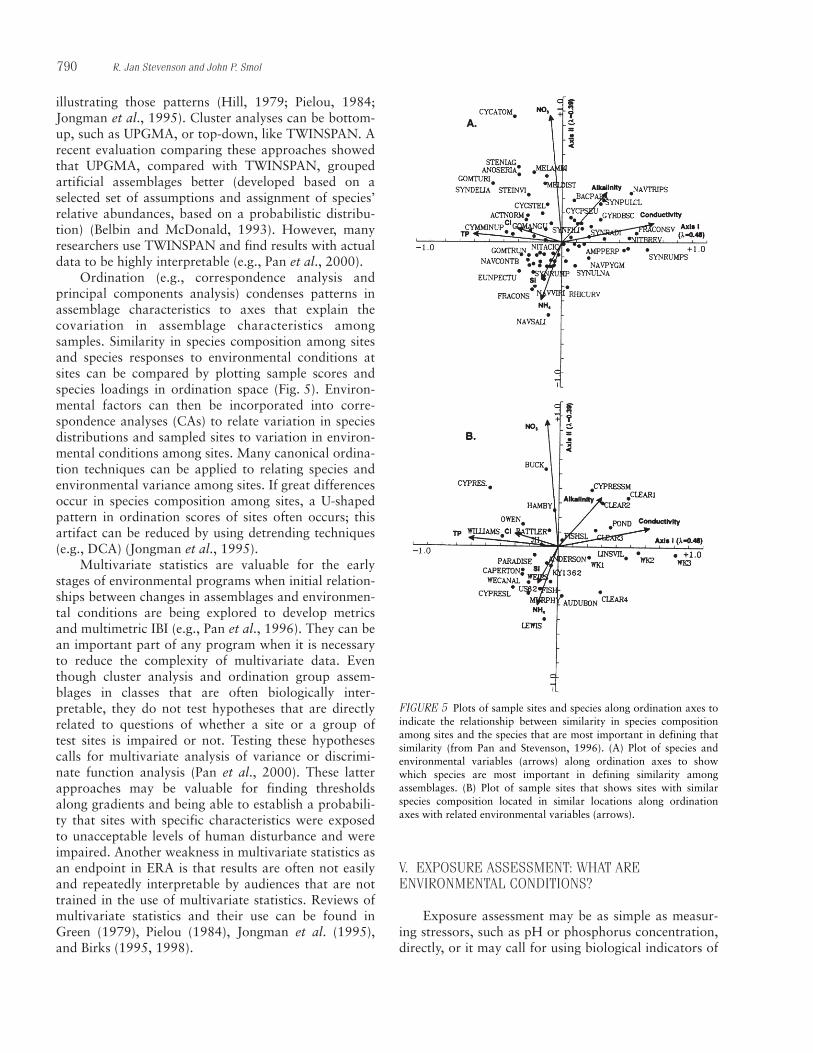
Ordination (e.g., correspondence analysis and principal components analysis) condenses patterns inassemblage characteristics to axes that explain thecovariation in assemblage characteristics among samples. Similarity in species composition among sitesand species responses to environmental conditions atsites can be compared by plotting sample scores andspecies loadings in ordination space (Fig. 5). Environ-mental factors can then be incorporated into corre-spondence analyses (CAs) to relate variation in speciesdistributions and sampled sites to variation in environ-mental conditions among sites. Many canonical ordina-tion techniques can be applied to relating species andenvironmental variance among sites. If great differencesoccur in species composition among sites, a U-shapedpattern in ordination scores of sites often occurs; thisartifact can be reduced by using detrending techniques(e.g., DCA) (Jongman et al., 1995).
Multivariate statistics are valuable for the earlystages of environmental programs when initial relation-ships between changes in assemblages and environmen-tal conditions are being explored to develop metricsand multimetric IBI (e.g., Pan et al., 1996). They can bean important part of any program when it is necessaryto reduce the complexity of multivariate data. Eventhough cluster analysis and ordination group assem-blages in classes that are often biologically inter-pretable, they do not test hypotheses that are directlyrelated to questions of whether a site or a group of test sites is impaired or not. Testing these hypothesescalls for multivariate analysis of variance or discrimi-nate function analysis (Pan et al., 2000). These latterapproaches may be valuable for finding thresholdsalong gradients and being able to establish a probabili-ty that sites with specific characteristics were exposedto unacceptable levels of human disturbance and wereimpaired. Another weakness in multivariate statistics asan endpoint in ERA is that results are often not easilyand repeatedly interpretable by audiences that are nottrained in the use of multivariate statistics. Reviews ofmultivariate statistics and their use can be found inGreen (1979), Pielou (1984), Jongman et al. (1995),and Birks (1995, 1998).
V. EXPOSURE ASSESSMENT: WHAT AREENVIRONMENTAL CONDITIONS?
Exposure assessment may be as simple as measur-ing stressors, such as pH or phosphorus concentration,directly, or it may call for using biological indicators of
790 R. Jan Stevenson and John P. Smol
FIGURE 5 Plots of sample sites and species along ordination axes toindicate the relationship between similarity in species compositionamong sites and the species that are most important in defining thatsimilarity (from Pan and Stevenson, 1996). (A) Plot of species andenvironmental variables (arrows) along ordination axes to showwhich species are most important in defining similarity amongassemblages. (B) Plot of sample sites that shows sites with similarspecies composition located in similar locations along ordinationaxes with related environmental variables (arrows).
exposure. Exposure assessment is important for precisely characterizing the level or intensity of envi-ronmental conditions that may be affecting valuedecosystem components or services. Often, environ-mental conditions in a habitat cannot be measuredaccurately or precisely, particularly in shallow-waterhabitats like streams and wetlands, where environmen-tal conditions change diurnally and seasonally withbiological activity and from day to day with weather.
Many algal taxa have long been recognized to be,with varying degrees of specificity, restricted to certainaquatic environments (Kolkwitz and Marsson, 1908);therefore, they can potentially be used as bioindicatorsof environmental conditions. The simplest of the quan-titative stressor or causal indicators are simply the sumof relative abundances of organisms that are either tolerant or sensitive to a specific environmental stres-sor, such as the relative abundance of motile diatoms or aberrant diatoms, which indicate silt and heavymetal pollution, respectively (Bahls, 1993; McFarlandet al., 1997). Alternatively, the relative abundance oforganisms adapted to environmental extremes could be used to diagnose stressors, such as high organic contamination, high salinity, low dissolved oxygen, orlow pH (Stevenson and Bahls, 1999). More complexquantitative approaches use species composition ofalgal assemblages and categorical rankings of speciesenvironmental preferences, with either weighted aver-age equations (Zelinka and Marvan, 1961) or regres-sion equations (Renberg and Hellberg, 1982) to inferthe stressor level. Recently, new accessibilities to personal computers and new statistical techniques(weighted average assessment of species preferences)have enabled the development of more accurate charac-terizations of species environmental preferences andmore accurate and precise biological indicators of stres-sors in ecosystems (see Birks, 1995, 1998, for reviews).Thus, stressor levels in a habitat can be inferred withweighted average equations with species autecologiesthat were developed based on a categorical ranking ofspecies environmental preferences or with autecologiesdetermined with weighted average techniques.
Simple autecological ranks have been assigned tocharacterize environmental preferences for many taxaand many environmental characteristics (see van Damet al., 1994, for a review). These autecological charac-teristics of taxa have been compiled in several reviews:Lowe (1974), Beaver (1981), Denys (1991), Hofmann(1994), and van Dam et al. (1994). Using a weightedaverage formula, stressor levels in habitats can beinferred based on the categorical autecological ranks of taxa (often eight or fewer categories) and relativeabundances of taxa in samples. For example, a simpleautecological index (SAI) for trophic status can be
developed based on autecological ranks (Θi) of 0–7 for taxa observed to be most abundant in waters classified as ultraoligotrophic, oligotrophic, oligo- tomesotrophic, mesotrophic, meso- to eutrophic, eutro-phic, and hypereutrophic, respectively (see van Dam etal., 1994). Then the trophic index can be calculated as
SAITI = Σi = 1,SpiΘi
where pi is the proportion of the ith species and Θi isthe ecological condition in which the highest relativeabundances of the ith species are collected. If auteco-logical information is not known for all taxa, valuableinformation can still be obtained by correcting theindex for the proportion of taxa with autecologicalcharacterizations. Next, one can redefine the communi-ty as the subset of taxa for which autecological charac-teristics are known by dividing the SAI by the sum of the proportional abundances of taxa with knownautecological information.
This weighted average approach with simple aute-cological characterizations of taxa has been used exten-sively in stream assessments with algae, particularly inEurope (Table II) (see reviews in Whitton et al., 1991;Whitton and Rott, 1996; Prygiel et al., 1999). Softwareand databases of diatom autecological characteristics(e.g., OMNIDIA; Lecointe et al., 1993) have beendeveloped that can be used to calculate these indices. Intests of these indices, some perform better than otherswhen used in regions other than those for which theywere originally developed (e.g., Kwandrans et al.,1998). Regional calibration of these indices may berequired to improve performance by reassessment ofalgal autecological characteristics.
Stressor indicators based on accurate weighted-average assessments of species’ environmental optimaare more precise than indicators based on categoricalcharacterizations of species’ autecologies (e.g., terBraak and van Dam, 1989; Agbeti, 1992). However,acquiring accurate descriptions of species’ autecologiesmay be more difficult than using categorical characteri-zations. Weighted-average inference (WAI) models havebeen widely used to precisely infer environmental characteristics (Birks, 1998). The general principle forcharacterizing species autecological preferences is that,under most circumstances, the distributions of mostalgal taxa will exhibit a unimodal, Gaussian responsecurve (Fig. 6), if the gradient is long enough. The optimum (m) is estimated by the position along theenvironmental gradient where the taxon is most common, and the tolerance (t) can be estimated by the standard deviation of the curve. Because differenttaxa will have different optima and tolerances to environmental variables, these data can be used tomake quantitative inferences of these variables (Fig. 7).
23. Use of Algae in Environmental Assessments 791
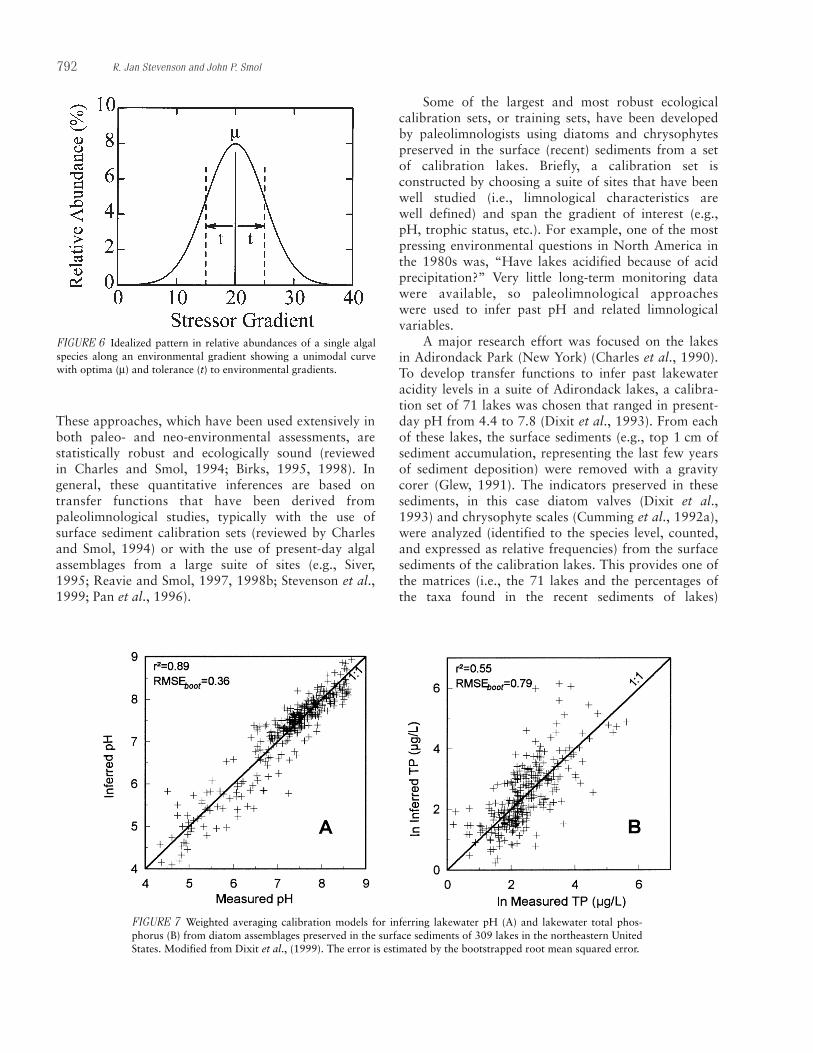
These approaches, which have been used extensively inboth paleo- and neo-environmental assessments, arestatistically robust and ecologically sound (reviewed in Charles and Smol, 1994; Birks, 1995, 1998). In general, these quantitative inferences are based ontransfer functions that have been derived from paleolimnological studies, typically with the use of surface sediment calibration sets (reviewed by Charlesand Smol, 1994) or with the use of present-day algalassemblages from a large suite of sites (e.g., Siver,1995; Reavie and Smol, 1997, 1998b; Stevenson et al.,1999; Pan et al., 1996).
Some of the largest and most robust ecological calibration sets, or training sets, have been developedby paleolimnologists using diatoms and chrysophytespreserved in the surface (recent) sediments from a set of calibration lakes. Briefly, a calibration set is constructed by choosing a suite of sites that have beenwell studied (i.e., limnological characteristics are well defined) and span the gradient of interest (e.g.,pH, trophic status, etc.). For example, one of the mostpressing environmental questions in North America inthe 1980s was, “Have lakes acidified because of acidprecipitation?” Very little long-term monitoring datawere available, so paleolimnological approaches were used to infer past pH and related limnologicalvariables.
A major research effort was focused on the lakes in Adirondack Park (New York) (Charles et al., 1990).To develop transfer functions to infer past lakewateracidity levels in a suite of Adirondack lakes, a calibra-tion set of 71 lakes was chosen that ranged in present-day pH from 4.4 to 7.8 (Dixit et al., 1993). From eachof these lakes, the surface sediments (e.g., top 1 cm ofsediment accumulation, representing the last few yearsof sediment deposition) were removed with a gravitycorer (Glew, 1991). The indicators preserved in thesesediments, in this case diatom valves (Dixit et al.,1993) and chrysophyte scales (Cumming et al., 1992a),were analyzed (identified to the species level, counted,and expressed as relative frequencies) from the surfacesediments of the calibration lakes. This provides one ofthe matrices (i.e., the 71 lakes and the percentages ofthe taxa found in the recent sediments of lakes)
792 R. Jan Stevenson and John P. Smol
FIGURE 6 Idealized pattern in relative abundances of a single algalspecies along an environmental gradient showing a unimodal curvewith optima (µ) and tolerance (t) to environmental gradients.
FIGURE 7 Weighted averaging calibration models for inferring lakewater pH (A) and lakewater total phos-phorus (B) from diatom assemblages preserved in the surface sediments of 309 lakes in the northeastern UnitedStates. Modified from Dixit et al., (1999). The error is estimated by the bootstrapped root mean squared error.
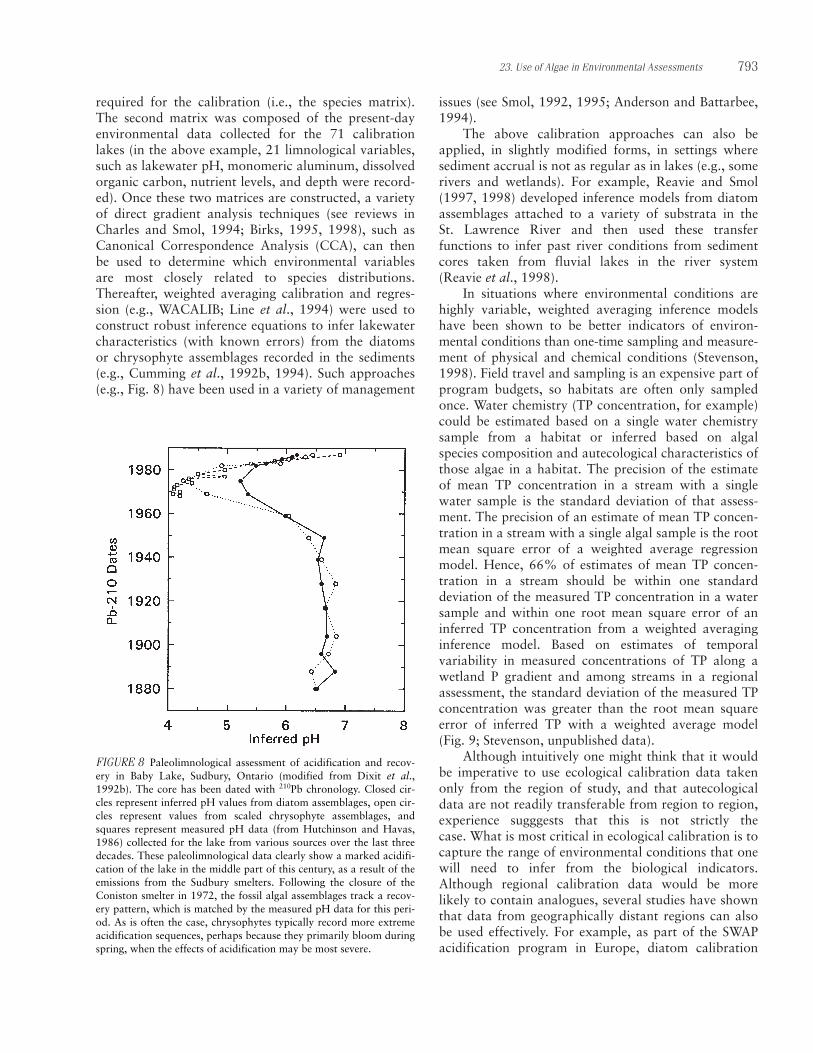
required for the calibration (i.e., the species matrix).The second matrix was composed of the present-dayenvironmental data collected for the 71 calibrationlakes (in the above example, 21 limnological variables,such as lakewater pH, monomeric aluminum, dissolvedorganic carbon, nutrient levels, and depth were record-ed). Once these two matrices are constructed, a varietyof direct gradient analysis techniques (see reviews inCharles and Smol, 1994; Birks, 1995, 1998), such asCanonical Correspondence Analysis (CCA), can thenbe used to determine which environmental variablesare most closely related to species distributions.Thereafter, weighted averaging calibration and regres-sion (e.g., WACALIB; Line et al., 1994) were used toconstruct robust inference equations to infer lakewatercharacteristics (with known errors) from the diatomsor chrysophyte assemblages recorded in the sediments(e.g., Cumming et al., 1992b, 1994). Such approaches(e.g., Fig. 8) have been used in a variety of management
issues (see Smol, 1992, 1995; Anderson and Battarbee,1994).
The above calibration approaches can also beapplied, in slightly modified forms, in settings wheresediment accrual is not as regular as in lakes (e.g., somerivers and wetlands). For example, Reavie and Smol(1997, 1998) developed inference models from diatomassemblages attached to a variety of substrata in the St. Lawrence River and then used these transfer functions to infer past river conditions from sedimentcores taken from fluvial lakes in the river system(Reavie et al., 1998).
In situations where environmental conditions arehighly variable, weighted averaging inference modelshave been shown to be better indicators of environ-mental conditions than one-time sampling and measure-ment of physical and chemical conditions (Stevenson,1998). Field travel and sampling is an expensive part ofprogram budgets, so habitats are often only sampledonce. Water chemistry (TP concentration, for example)could be estimated based on a single water chemistrysample from a habitat or inferred based on algalspecies composition and autecological characteristics ofthose algae in a habitat. The precision of the estimateof mean TP concentration in a stream with a singlewater sample is the standard deviation of that assess-ment. The precision of an estimate of mean TP concen-tration in a stream with a single algal sample is the rootmean square error of a weighted average regressionmodel. Hence, 66% of estimates of mean TP concen-tration in a stream should be within one standard deviation of the measured TP concentration in a watersample and within one root mean square error of aninferred TP concentration from a weighted averaginginference model. Based on estimates of temporal variability in measured concentrations of TP along awetland P gradient and among streams in a regionalassessment, the standard deviation of the measured TPconcentration was greater than the root mean squareerror of inferred TP with a weighted average model(Fig. 9; Stevenson, unpublished data).
Although intuitively one might think that it wouldbe imperative to use ecological calibration data takenonly from the region of study, and that autecologicaldata are not readily transferable from region to region,experience sugggests that this is not strictly the case. What is most critical in ecological calibration is tocapture the range of environmental conditions that onewill need to infer from the biological indicators.Although regional calibration data would be more likely to contain analogues, several studies have shownthat data from geographically distant regions can alsobe used effectively. For example, as part of the SWAPacidification program in Europe, diatom calibration
23. Use of Algae in Environmental Assessments 793
FIGURE 8 Paleolimnological assessment of acidification and recov-ery in Baby Lake, Sudbury, Ontario (modified from Dixit et al.,1992b). The core has been dated with 210Pb chronology. Closed cir-cles represent inferred pH values from diatom assemblages, open cir-cles represent values from scaled chrysophyte assemblages, andsquares represent measured pH data (from Hutchinson and Havas,1986) collected for the lake from various sources over the last threedecades. These paleolimnological data clearly show a marked acidifi-cation of the lake in the middle part of this century, as a result of theemissions from the Sudbury smelters. Following the closure of theConiston smelter in 1972, the fossil algal assemblages track a recov-ery pattern, which is matched by the measured pH data for this peri-od. As is often the case, chrysophytes typically record more extremeacidification sequences, perhaps because they primarily bloom duringspring, when the effects of acidification may be most severe.
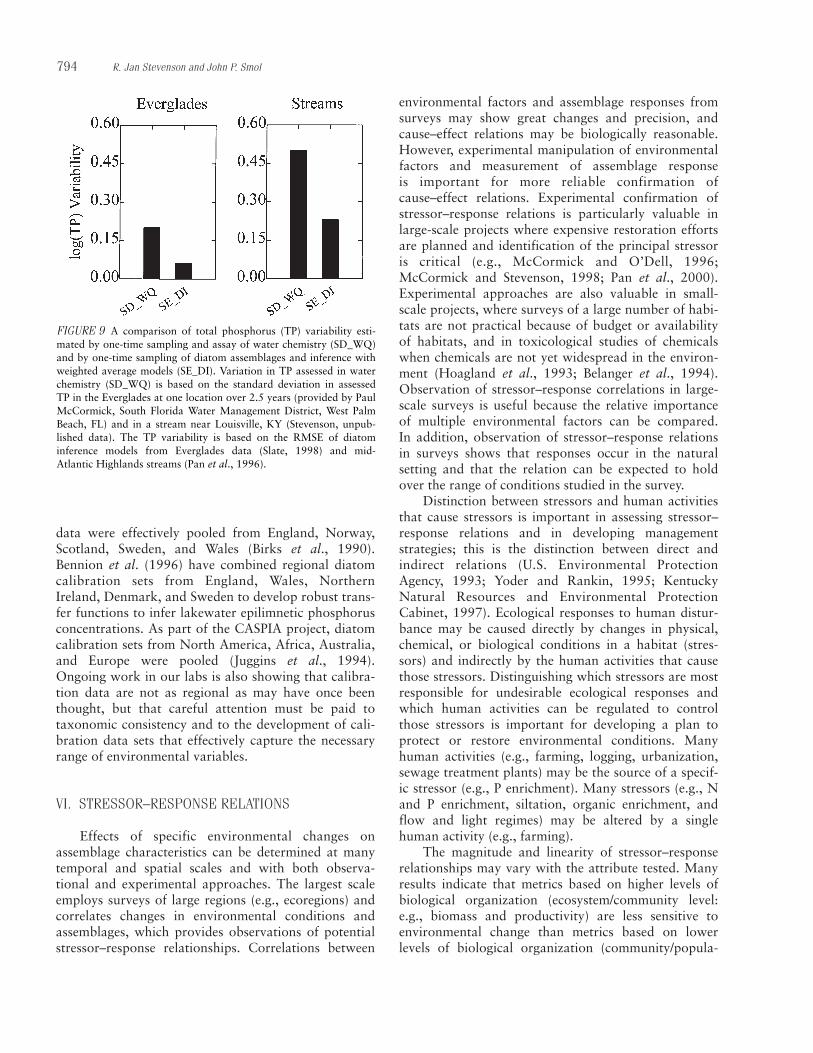
data were effectively pooled from England, Norway,Scotland, Sweden, and Wales (Birks et al., 1990).Bennion et al. (1996) have combined regional diatomcalibration sets from England, Wales, NorthernIreland, Denmark, and Sweden to develop robust trans-fer functions to infer lakewater epilimnetic phosphorusconcentrations. As part of the CASPIA project, diatomcalibration sets from North America, Africa, Australia,and Europe were pooled (Juggins et al., 1994).Ongoing work in our labs is also showing that calibra-tion data are not as regional as may have once beenthought, but that careful attention must be paid to taxonomic consistency and to the development of cali-bration data sets that effectively capture the necessaryrange of environmental variables.
VI. STRESSOR–RESPONSE RELATIONS
Effects of specific environmental changes onassemblage characteristics can be determined at manytemporal and spatial scales and with both observa-tional and experimental approaches. The largest scaleemploys surveys of large regions (e.g., ecoregions) andcorrelates changes in environmental conditions andassemblages, which provides observations of potentialstressor–response relationships. Correlations between
environmental factors and assemblage responses fromsurveys may show great changes and precision, andcause–effect relations may be biologically reasonable.However, experimental manipulation of environmentalfactors and measurement of assemblage response is important for more reliable confirmation ofcause–effect relations. Experimental confirmation ofstressor–response relations is particularly valuable inlarge-scale projects where expensive restoration effortsare planned and identification of the principal stressoris critical (e.g., McCormick and O’Dell, 1996;McCormick and Stevenson, 1998; Pan et al., 2000).Experimental approaches are also valuable in small-scale projects, where surveys of a large number of habi-tats are not practical because of budget or availabilityof habitats, and in toxicological studies of chemicalswhen chemicals are not yet widespread in the environ-ment (Hoagland et al., 1993; Belanger et al., 1994).Observation of stressor–response correlations in large-scale surveys is useful because the relative importanceof multiple environmental factors can be compared. In addition, observation of stressor–response relationsin surveys shows that responses occur in the naturalsetting and that the relation can be expected to holdover the range of conditions studied in the survey.
Distinction between stressors and human activitiesthat cause stressors is important in assessing stressor–response relations and in developing managementstrategies; this is the distinction between direct andindirect relations (U.S. Environmental ProtectionAgency, 1993; Yoder and Rankin, 1995; KentuckyNatural Resources and Environmental ProtectionCabinet, 1997). Ecological responses to human distur-bance may be caused directly by changes in physical,chemical, or biological conditions in a habitat (stres-sors) and indirectly by the human activities that causethose stressors. Distinguishing which stressors are mostresponsible for undesirable ecological responses andwhich human activities can be regulated to controlthose stressors is important for developing a plan toprotect or restore environmental conditions. Manyhuman activities (e.g., farming, logging, urbanization,sewage treatment plants) may be the source of a specif-ic stressor (e.g., P enrichment). Many stressors (e.g., Nand P enrichment, siltation, organic enrichment, andflow and light regimes) may be altered by a singlehuman activity (e.g., farming).
The magnitude and linearity of stressor–responserelationships may vary with the attribute tested. Manyresults indicate that metrics based on higher levels ofbiological organization (ecosystem/community level:e.g., biomass and productivity) are less sensitive toenvironmental change than metrics based on lower levels of biological organization (community/popula-
794 R. Jan Stevenson and John P. Smol
FIGURE 9 A comparison of total phosphorus (TP) variability esti-mated by one-time sampling and assay of water chemistry (SD_WQ)and by one-time sampling of diatom assemblages and inference withweighted average models (SE_DI). Variation in TP assessed in waterchemistry (SD_WQ) is based on the standard deviation in assessedTP in the Everglades at one location over 2.5 years (provided by PaulMcCormick, South Florida Water Management District, West PalmBeach, FL) and in a stream near Louisville, KY (Stevenson, unpub-lished data). The TP variability is based on the RMSE of diatominference models from Everglades data (Slate, 1998) and mid-Atlantic Highlands streams (Pan et al., 1996).

tion: e.g., species composition) (Schindler, 1990;Leland, 1995). Because of high dispersal rates and highspecies numbers in microbial assemblages, speciesadapted to altered environmental conditions are proba-bly able to invade and populate a habitat relativelyquickly. Thus, impaired populations may be replacedby populations that are adapted to the altered condi-tions and thereby maintain ecosystem function(Stevenson, 1997). Therefore, biomass and many functional attributes of algal assemblages are often lesssensitive to environmental change than changes inspecies composition (Schindler, 1990).
Relating the stressor–response relations betweenalgal species composition and environmental factors tostressor–response relations for ecosystem attributesmay help in the understanding of ecosystem dynamicsand establishing criteria to protect ecological integrity.Recently, results from the Everglades show punctuated(sudden, discrete) changes in algal species compositionalong a phosphorus gradient (Pan et al., 2000)(Fig. 10). Along the same gradient, higher-level biologi-cal attributes, such as biomass and productivity, changelinearly or asymptotically. Thus, punctuated changes inspecies composition may result in multiple stable states(May, 1974) along an environmental gradient, whichresult from changes in the factor or factors that are themost important constraints on species composition.Punctuated changes in biomass and productivity maybe blurred by species replacement along the phospho-rus gradient, and spatial and temporal variability inother factors that have more short-term effects on bio-mass. Criteria for protecting the ecological integrity of a habitat may be established at thresholds along
gradients where punctuated changes in species compo-sition occur that correspond to undesirable changes inmore than one ecological attribute (Fig. 11).
VII. RISK CHARACTERIZATION AND MANAGEMENT DECISIONS
Risk characterization relates assessments of expo-sures to stressor–response relationships to evaluate thelevel of threat to an unimpaired system or the probablestressors and intensity of stress of impaired systems(Fig. 2) (U.S. Environmental Protection Agency, 1992).Thus, based on a set of metrics and stressor–responserelationships, we can predict ecological effects of expo-sures to specific stressors, assess the likelihood thateffects will occur, or assess the likelihood that effectswere caused by specific stressors or interactions amongmultiple stressors. Standard risk characterizations also increase risk ratings with increasing uncertainty in information. Therefore, we are concerned with both underprotecting as well as overprotecting ourresources.
Quantitatively, risk characterization on a metric-by-metric and stressor-by-stressor basis can be conduct-ed to assess the sustainability of ecological conditionsand the level of impairment or restorability of impairedconditions (Stevenson, 1998) (Fig. 12). Sustainabilitycan be defined quantitatively as the difference between
23. Use of Algae in Environmental Assessments 795
FIGURE 10 Ordination of sites based on species composition ofalgal assemblages at sites along a phosphorus gradient in theEverglades (Pan et al., 2000).
FIGURE 11 Linear (diagonal dashed line) and nonlinear (solid line)ecological responses along an environmental gradient (e.g., µg TP/L).Setting criteria for protection and remediation of ecological integritymay be facilitated by nonlinear ecological responses. Reference conditions (Ref) are indicated by the vertical arrow. The vertical lineindicates a criterion.

measured exposure (stressor) levels and the exposurecriteria for protecting ecological integrity (or designateduse of the ecosystem). Restorability is assessed forimpaired ecosystems and is equal to 1/(differencebetween measured exposure levels and the criteria forprotecting ecological integrity). These two measures ofrisk characterization can provide quantitative assess-ments of probable effects on ecological systems—thegreater the sustainability, the lower the probability ofstressor effects on ecological integrity, and the lowerthe restorability, the greater the probability of stressoreffects on ecological integrity.
Management decisions can be linked to risk assess-ment through risk characterizations and the stressorlinkage to human activities and management options(Fig. 1). After risk characterizations are completed,management options for protecting or remediatingenvironmental stressors will be considered with themany other factors that affect risk management deci-sions (e.g., political, economic, and regulatory factors).Management options depend upon the human activities
that produce stressors that are causing or threateningenvironmental impairment. Biological assessments can actually be used to infer the human activities thatcause the main ecological stressors (Yoder and Rankin,1995; Stevenson, 1998), but detailing that approach isbeyond the scope of this chapter. Thus, managementoptions for controlling nutrients and deoxygenation instreams include reducing point sources and nonpointsources of nutrients and BOD to streams. Point sources(e.g., municipal waste treatment plants) are easier toregulate and significantly reduce nutrient loading andrelated problems in many lakes and streams. However,further reduction in nutrient problems will requireaddressing nonpoint sources of nutrients. Thus, distin-guishing the direct and indirect effects of stressors andhuman activities provides for a more focused approachto evaluating management options and developing arisk management decision.
VIII. CONCLUSIONS
Algae have been used successfully for environmen-tal assessment of many streams, larger rivers, lakes,and wetlands around the world. Many differentapproaches can be used, which vary in the level of tech-nical expertise required and in the amount of timerequired per sample. In this chapter we have tried notto make specific recommendations for which methodsshould be used, because different programs may callfor different methods. In addition, we would not wantto constrain the great promise for further developmentand linkage of algal methods for environmental assess-ment by making specific recommendations of methods.However, we have started to develop a framework for relating the different methods of environmentalassessment and to explore the specific situations inwhich different methods should be used. We havelinked the algal framework for environmental assess-ment to a standardized risk assessment framework sothat assessments with algae can be better related toassessments with other organisms and other approaches(such as laboratory-based toxicology).
Future developments in algal methods for environ-mental assessment should be directed to the ultimategoal of solving environmental problems. More rigoroushypothesis testing of the precision and sensitivity ofalgal indicators will be important in documenting theperformance of algal indicators and encouraging theirapplication. Transferability of algal indicators amongregions should be rigorously evaluated because thisallows development of consistent approaches acrossregions (and perhaps habitat type) and saves costs ofdeveloping regional indicators. Current efforts to devel-
796 R. Jan Stevenson and John P. Smol
FIGURE 12 Relating ecological response to the sustainability of eco-logical conditions in unimpaired ecosystems and to restorability ofconditions in impaired ecosystems. Reference conditions (Ref) areindicated by the vertical arrow. The vertical lines indicate a criterionand assessed conditions at two sites. Assessed conditions at Sites 1and 2 are unimpaired and impaired, respectively. Site 1 illustratesthat the greater the difference between assessed conditions and thecriterion for unimpaired sites, the greater is the sustainability of val-ued ecological attributes at a site. Site 2 indicates that the greater thedifference between assessed conditions and the criterion for impairedsites, the less restorable a habitat is.
op web-based access to autecological characteristics of taxa will be valuable for making this informationavailable to a broader audience, but this approach alsorequires cautious evaluation of the quality of informa-tion on the web. Great challenges also exist for ourmore consistent application and integration of multiplelines of evidence, which may be facilitated by using aframework, such as the risk assessment framework. In addition, we must learn to communicate the resultsof our research more effectively and clearly to a broadaudience, some of whom have little experience withinterpreting mathematically complex information.
Algae can cause ecological problems, but can also perform valuable ecological services. In a recentreport by the National Research Council of the US(CEIMATE, 2000), total and native species diversity,productivity, trophic status, and nutrient-use efficiencywere listed as fundamental ecological indicators for the United States. Algal attributes related to these indi-cators, as well as other valued ecological attributes ofalgae, should provide one part of a rationale for assess-ing algal properties of ecosystems. The second part ofthat rationale is the extraordinary sensitivity and diag-nostic power of algae to detect environmental problemsand identify their causes.
ACKNOWLEDGMENTS
We acknowledge the contributions of anonymousreviewers and comments by the editors of this book,John Wehr and Bob Sheath. In addition, we are grate-ful for the openness of interactions among colleaguesand students, which has moved our discipline forwardso successfully. Stevenson’s efforts were supported bythe U.S. Environmental Protection Agency. Smol’sefforts were supported by the Natural Sciences andEngineering Research Council of Canada.
LITERATURE CITED
Adler, R. W. 1995. Filling the gaps in water quality standards: Legalperspectives on biocriteria, in: Davis, W. S., Simon, T. P., Eds.,Biological assessment and criteria: Tools for water resourceplanning and decision making. Lewis Publishers, Boca Raton,FL, pp. 31–47.
Agbeti, M. D. 1992. The relationship between diatom assemblagesand trophic variables: a comparison of old and new approaches.Canadian Journal of Fisheries and Aquatic Sciences49:1171–1175.
Aloi, J. E. 1990. A critical review of recent freshwater periphytonmethods. Canadian Journal of Fisheries and Aquatic Sciences47:656–670.
Amoros, C., Van Urk, G. 1989. Palaeoecological analyses of largerivers: Some principles and methods, in: Petts, G. E., Möller, H.,
Roux, A. L., Eds., Historical change of large alluvial rivers:Western Europe. Wiley, Chicester, U.K., pp. 143–165.
Anderson, N. J., Battarbee, R. W. 1994. Aquatic community persist-ence and variability: A paleolimnological perspective, in: Giller,P. S., Hildrew, A. G., Raffaelli D. G., Eds., Aquatic ecology:Scale, pattern and process. Blackwell Scientific, Oxford, U.K.,pp. 233–259.
Anderson, N. J., Ripply, B., Gibson, C. E. 1993. A comparison ofsedimentary and diatom-inferred phosphorus profiles: Impli-cations for defining pre-disturbance nutrient conditions.Hydrobiologia 253:171–213.
Anderson, N. J., Vos, P. 1992. Learning from the past: Diatoms aspalaeoecological indicators of change in marine environments.Netherlands Journal of Aquatic Ecology 26:19–30.
Angermeier, P. L., Karr, J. R. 1994. Biological integrity versus biolog-ical diversity as policy directives. BioScience 44:690–697.
APHA. 1998. Standard methods for the evaluation of water andwastewater, 20th ed. American Public Health Association,Washington, DC.
Archibald, R. E. M. 1972. Diversity in some South African diatomassemblages and its relation to water quality. Water Research6:1229–1238.
Arruda, J. A., Fromm, C. H. 1989. The relationship between tasteand odor problems and lake enrichment from Kansas lakes inagricultural watersheds. Lake and Reservoir Management5:45–52.
Autenrieth, R., Bonner, J., Schreiber, L. 1991. Aquatic sediments.Research Journal of Water Pollution Control Federation63:709–725.
Bahls, L. L. 1993. Periphyton bioassessment methods for Montanastreams. Water Quality Bureau, Department of Health andEnvironmental Sciences, Helena, MT.
Barbour, M. T., Gerritsen, J., Snyder, B. D., Stribling J. B. 1999.Rapid bioassessment protocols for use in wadeable streams and rivers: Periphyton, benthic macroinvertebrates, and fish,2nd Ed., EPA 841-D-97-002. United States EnvironmentalProtection Agency, Washington, DC.
Barbour, M. T., Plafkin, J. L., Bradley, B. P., Graves, C. G.,Wisseman, R. W. 1992. Evaluation of EPA’s rapid bioassessmentbenthic metrics: Metric redundancy and variability among refer-ence stream sites. Environmental Toxicology and Chemistry11:437–449.
Battarbee, R. W., Charles, D. F., Dixit, S. S., Renberg, I. 1999.Diatoms as indicators of surface water acidity, in: Stoermer, E.F., Smol, J. P., Eds., The diatoms: Applications for the environ-mental and earth sciences. Cambridge University Press,Cambridge, U.K., pp. 85–127.
Beaver, J. 1981. Apparent ecological characteristics of some commonfreshwater diatoms. Ontario Ministry of the Environment,Technical Support Section, Central Region, Don Mills, Ontario,Canada.
Belanger, S. E., Barnum, J. B., Woltering, D. M., Wowling, J. W.,Ventullo, R. M., Schermerhorn, S. D., Lowe, R. L. 1994. Algalperiphyton structure and function in response to consumerchemicals in stream mesocosms, in: Graney, R. L., Kennedy, J.H., Rogers, J. H., Eds., Aquatic mesocosm studies in ecologicalrisk assessment, SETAC Special Publications Series, LewisPublishers, Ann Arbor, MI.
Belbin, L., McDonald, C. 1993. Comparing three classificationstrategies for use in ecology. Journal of Vegetation Science4:341–348.
Bennion, H., Juggins, S., Anderson, N. J. 1996. Predicting epilimneticphosphorus concentrations using an improved diatom-basedtransfer function and its application to lake eutrophicationmanagement. Environmental Science & Technology 30:2004–2007.
23. Use of Algae in Environmental Assessments 797
Biggs, B. J. F. 1990. Use of relative specific growth rates of periphyticdiatoms to assess enrichment of a stream. New Zealand Journalof Marine and Freshwater Research 24:9–18.
Biggs, B. J. F. 1995. The contribution of flood disturbance, catch-ment geology and land use to the habitat template of periphy-ton in stream ecosystems. Freshwater Biology 33:419–438.
Biggs, B. J. F. 1996. Patterns of benthic algae in streams, in: Stevenson,R. J., Bothwell, M., Lowe, R. L., Eds., Algal ecology: Freshwaterbenthic ecosystems. Academic Press, San Diego, pp. 31–55.
Biggs, B. J. F., Close, M. E. 1989. Periphyton biomass dynamics ingravel bed rivers: The relative effects of flow and nutrients.Freshwater Biology 22:209–231.
Biggs, B. J. F., Kilroy, C., Mulcock, C. M. 1998. New Zealandstream health monitoring and assessment kit. Stream monitor-ing manual, Version 1. NIWA Technical Report, Christchurch,New Zealand, 150 pp.
Biggs, B. J. F., Price, G. M. 1987. A survey of filamentous algal proliferations in New Zealand rivers. New Zealand Journal ofMarine and Freshwater Research 21:175–191.
Birks, H. J. B. 1995. Quantitative palaeoenvironmental reconstruc-tions, in: Maddy, D., Brew, J. S., Eds., Statistical modelling of quaternary science data. Technical Guide 5. QUATERNARYResearch Association, London, U.K., pp. 161–254.
Birks, H. J. B. 1998. Numerical tools in palaeolimnology: Progress,potentialities, and problems. Journal of Paleolimnology20:307–332.
Birks, H. J. B., Line, J. M., Juggins, S., Stevenson, A. C., ter Braak,C. J. F. 1990. Diatoms and pH reconstruction. PhilosophicalTransactions of the Royal Society (London) B327:263–278.
Blanck, H. 1985. A simple, community level, ecotoxicological testsystem using samples of periphyton. Hydrobiologia124:251–261.
Borchardt, M. A. 1996. Nutrients, in: Stevenson, R. J., Bothwell, M. L., Lowe, R. L., Eds., Algal ecology: Freshwater benthicecosystems. Academic Press, San Diego, pp. 184–228.
Bott, T. L. 1996. Algae in microscopic food webs, in: Stevenson, R. J., Bothwell, M. L., Lowe, R. L., Eds., Algal ecology:Freshwater benthic ecosystems. Academic Press, San Diego, pp.574–608.
Bott, T. L., Brock, J. T., Cushing, C. E., Gregory, S. V., King, D.,Petersen, R. C. 1978. A comparison of methods for measuringprimary productivity and community respiration in streams.Hydrobiologia 60:3–12.
Bowling, L. C., Baker, P. D. 1996. Major cyanobacterial bloom in the Barwon-Darling River, Australia, in 1991, and underlyinglimnological conditions. Marine and Freshwater Research47:643–657.
Brezonik, P. L. 1978. Effect of organic color and turbidity of Secchidisk transparency. Journal of the Fisheries Research Board ofCanada 35:1410–1416.
Briand, F., Trucco, R., Ramamoorthy, S. 1978. Correlations betweenspecific algae and heavy metal binding in lakes. Journal of theFisheries Research Board of Canada 35:1482–1485.
Brinson, M. M. 1993. A hydrogeomorphic classification for wet-lands. Wetlands Research Program Technical Report WRP-DE-4. U. S. Army Corps of Engineers Waterways ExperimentalStation, Vicksburg, MS.
Bunting, M. J., Duthie, H., Campbell, D., Warner, B., Turner, L.1997. A paleoecological record of recent environmental changeat Big Creek Marsh, Long Point, Lake Erie. Journal of GreatLakes Research 23:349–368.
Burkholder, J. M., Glasgow, H. B. Jr. 1997. Pfiesteria piscicida
and other Pfiesteria-like dinoflagellates: Behavior, impacts, andenvironmental controls. Limnology and Oceanography42:1052–1075.
Butcher, R. W. 1947. Studies in the ecology of rivers. IV. The algae oforganically enriched water. Journal of Ecology 35:186–191.
Cain, J. R., Trainor, F. R. 1973. A bioassay compromise. Phycologia12:227–232.
Carlson, R. E. 1977. A trophic state index for lakes. Limnology andOceanography 22:361–69.
Carmichael, W. W. 1994. The toxins of cyanobacteria. ScientificAmerican 270:78–86.
Carpenter, S. R., Kitchell, J. F., Eds. 1993. The trophic cascade inlakes. Cambridge University Press, Cambridge, UK. 283 pp.
CEIMATE (Committee to Evaluate Indicators for MonitoringAquatic and Terrestrial Environments). 2000. Ecological indica-tors for the nation. National Academy Press, Washington, DC,180 pp.
Charles, D. F., Binford, M. W., Furlong, E. T., Hites, R. A., Mitchell,M. J., Norton, S. A., Oldfield, F., Paterson, M. J., Smol, J. P.,Uutala, A. J., White, J. R., Whitehead, D. R., Wise, R. J. 1990.Paleoecological investigation of recent lake acidification in theAdirondack Mountains, New York. Journal of Paleolimnology3:195–141.
Charles, D. F., Smol, J. P. 1988. New methods for using diatoms and chrysophytes to infer past pH of low-alkalinity lakes.Limnology and Oceanography 33:1451–1462.
Charles, D. F., Smol, J. P. 1994. Long-term chemical changes in lakes:Quantitative inferences using biotic remains in the sedimentrecord, in: Baker, L, Ed., Environmental chemistry of lakes andreservoirs, Advances in Chemistry Series 237. AmericanChemical Society, Washington, DC, pp 3–31.
Chessman, B., Growns, I., Currey, J., Plunkett-Cole, N. 1999.Predicting diatom communities at the genus level for the rapid biological assessment of rivers. Freshwater Biology41:317–331.
Chilton, E. W., Lowe, R. L., Schurr, K. M. 1986. Invertebrate com-munities associated with Bangia atropurpurea and Cladophora
glomerata in western Lake Erie. Journal of Great LakesResearch 12:149–153.
Cooper, S. R. 1999. Estuarine paleoenvironmental reconstructionsusing diatoms, in: Stoermer, E. F., Smol, J. P., Eds., The diatoms:Applications for the environmental and earth sciences.Cambridge University Press, Cambridge, U.K., pp. 352–373.
Coste, M., Bosca, C., Dauta, A. 1991. Use of algae for monitoringrivers in France, in: Whitton, B. A., Rott, E., Friedrich, G., Eds.,Use of algae for monitoring rivers. Institut für Botanik,Universität Innsbruck, Innsbruck, Austria, pp. 75–88.
Cotê, R. 1983. Aspects toxiques du cuivre sur la biomasse et la pro-ductivité du phytoplankton de la rivière du Saguenay, Québec.Hydrobiologia 98:85–95.
Cullen, J. J., Ciotiti, A. M., Lewis, M. R. 1997. Optical detection andassessment of algal blooms. Limnology and Oceanography42:1223–1239.
Cumming, B. F., Davey, K., Smol, J. P., Birks, H. J. 1994. When didAdirondack Mountain lakes begin to acidify and are they stillacidifying? Canadian Journal of Fisheries and Aquatic Sciences51:1550–1568.
Cumming, B. F., Smol, J. P., Birks, H. J. B. 1992a. Scaled chryso-phytes (Chrysophyceae and Synurophyceae) from Adirondack(N.Y., USA) drainage lakes and their relationship to measuredenvironmental variables, with special reference to lakewater pHand labile monomeric aluminum. Journal of Phycology28:162–178.
Cumming, B. F., Smol, J. P., Kingston, J. C., Charles, D. F., Birks,H. J. B., Camburn, K. E., Dixit, S. S., Uutala, A. J., Selle, A. R.1992b. How much acidification has occurred in Adirondackregion (New York, USA) lakes since pre-industrial times?Canadian Journal of Fisheries and Aquatic Sciences 49:128–141.
798 R. Jan Stevenson and John P. Smol

Davies-Colley, R. J., Vant, W. N. 1988. Estimation of optical proper-ties of water from Secchi disk depths. Water Research Bulletin24:1329–1335.
Dearing, J. A, Håkansson, H., Liedberg-Jönsson, B., Persson, A.,Skansjö, S., Windholm, D., El-Dahousy, F. 1987. Lake sedi-ments used to quantify the erosional response to land usechanges in southern Sweden. Oikos 50:60–78.
Denicola, D. M. 1986. Periphyton responses to temperature at different ecological levels, in: Stevenson, R. J., Bothwell, M. L.,Lowe, R. L., Eds., Algal ecology: Freshwater benthic ecosys-tems. Academic Press, San Diego, pp. 150–183.
Denys, L. 1991. A check-list of the diatoms in the Holocene depositsof the western Belgian coastal plain with a survey of theirapparent ecological requirements. I. Introduction, ecologicalcode, and complete list. Professional paper. Ministère desAffaires Economiques, Service Géologique de Belgique. Brussels,Belgium, 41 p.
Descy, J. P. 1979. A new approach to water quality estimation usingdiatoms. Nova Hedwigia 64:305–323.
Dixit, S. S., Smol, J. P. 1994. Diatoms as environmental indicators inthe Environmental Monitoring and Assessment—Surface Waters(EMAP-SW) program. Environmental Monitoring andAssessment 31:275–206.
Dixit, A. S., Dixit, S. S., Smol, J. P. 1992a. Algal microfossils providehigh temporal resolution of environmental trends. Water, Air,and Soil Pollution 62:75–87.
Dixit, S. S., Smol, J. P., Kingston, J. C., Charles, D. F. 1992a.Diatoms: Powerful indicators of environmental change.Environmental Science & Technology 26:22–33.
Dixit, S. S., Cumming, B. F., Kingston, J. C., Smol, J. P., Birks,H. J. B., Uutala, A. J., Charles, D. F., Camburn, K. 1993.Diatom assemblages from Adirondack lakes (N.Y., USA) andthe development of inference models for retrospective environ-mental assessment. Journal of Paleolimnology 8:27–47.
Dixit, S. S., Smol, J. P., Charles, D. F., Hughes, R. M., Paulsen, S. G.,Collins, G. B. 1999. Assessing water quality changes in thelakes of the northeastern United States using sediment diatoms.Canadian Journal of Fisheries and Aquatic Science 56:131–152.
Dodd, W. K., Gudder, D. A. 1992. The ecology of Cladophora.Journal of Phycology 28:415–427.
Dodds, W. K., Jones, J. R., Welch, E. B. 1998. Suggested criteria forstream trophic state: Distributions of temperate stream types bychlorophyll, total nitrogen and phosphorus. Water Research32:1455–1462.
Douglas, M. S. V., Smol, J. P., Blake, W., Jr. 1994. Marked post-18thcentury environmental change in high Arctic ecosystems.Science 266:416–419.
Fairchild, G. W., Lowe, R. L., Richardson, W. B. 1985. Algal periphyton growth on nutrient-diffusing substrates: An in situbioassay. Ecology 66:465–472.
Fjerdingstad, E. 1950. The microflora of the River Molleaa with special reference to the relation of benthic algae to pollution.Folia Limnologica Scandanavica 5:1–123.
Fritz, S. C. 1990. Twentieth-century salinity and water-level fluctua-tions in Devils Lake, North Dakota: test of a diatom-basedtransfer function. Limnology and Oceanography35:1771–1781.
Fritz, S. C., Juggins, S., Battarbee, R. W., Engstrom, D. R. 1991.Reconstruction of past changes in salinity and climate using adiatom-based transfer function. Nature 352:706–708.
Gensemer, R. W. 1991. The effects of pH and aluminum on thegrowth of the acidophilic diatom Asterionella ralfsii var. ameri-
cana. Limnology and Oceanography 36:123–131.Genter, R. B. 1996. Ecotoxicology of inorganic chemical stress to
algae, in: Stevenson, R. J., Bothwell, M., Lowe, R. L., Eds.,
Algal ecology: Freshwater benthic ecosystems. Academic Press,San Diego, pp. 403–468.
Ghosh, M., Gaur, J. P. 1990. Application of algal assay for definingnutrient limitation in two streams at Shillong. Proceedings ofIndian Academy of Sciences 100:361–368.
Glew, J. R. 1991. Miniature gravity corer for recovering short sediment cores. Journal of Paleolimnology 5:285–287.
Glew, J. R. 1988. A portable extruding device for close interval sectioning of unconsolidated core samples. Journal ofPaleolimnology 1:235–239.
Green, R. H. 1979. Sampling design and statistical methods for envi-ronmental biologists. Wiley, New York, 257 pp.
Greene, J. C., Miller, W. E., Shiroyama, T., Soltero, R. A., Putnam, K.1976. Use of laboratory cultures of Selenastrum, Anabaena, andthe indigenous isolate Sphaerocystis to predict effects of nutri-ent and zinc interactions upon phytoplankton growth in LongLake, Washington. Internationale Vereinigung für Theoretischeund Angewandte Limnologie Mitteilungen 21:372–384.
Hall, R. I., Smol, J. P. 1992. A weighted-averaging regression andcalibration model for inferring total phosphorus from diatomsfrom British Columbia (Canada) lakes. Freshwater Biology 27:417–437.
Hall, R. I., Smol, J. P. 1996. Paleolimnological assessment of long-term water quality changes in south-central Ontario lakesaffected by cottage development and acidification. CanadianJournal of Fisheries and Aquatic Sciences 53:1–17.
Hallegraeff, G. M. 1993. A review of harmful algal blooms and theirapparent global increase. Phycologia 32:79–99.
Hanson, J. M., Leggett, W. C. 1982. Empirical prediction of fish biomass and yield. Canadian Journal of Fisheries and AquaticSciences 39:257–263.
Harper, D. 1992. Eutrophication of freshwaters: Principles, prob-lems, and restoration. Chapman and Hall, New York. 327 p.
Harvey, R. S., Patrick, R. 1968. Concentration of 137Cs, 65Zn, and85Sr by fresh-water algae. Biotechnology and Bioengineering 9:449–456.
Healey, F. P., Hendzel, L. L. 1979. Fluorometric measurement ofalkaline phosphatase activity in algae. Freshwater Biology9:429–439.
Healey, F. P., Hendzel, L. L. 1980. Physiological indicators of nutri-ent deficiency in lake phytoplankton. Canadian Journal ofFisheries and Aquatic Sciences 37:442–453.
Hecky, R. E., Kilham, P. 1988. Nutrient limitation of phytoplanktonin freshwater and marine environments: A review of recent evidence on the effects of enrichment. Limnology andOceanography 33:796–822.
Hill, B. H., Herlihy, A. T., Kaufmann, P. R., Stevenson, R. J.,McCormick, F. H., Johnson, C. B. 2000. The use of periphytonassemblage data as an index of biotic integrity. Journal of theNorth American Benthological Society 19:50–67.
Hill, B. H., Lazorchak, J. M., McCormick, F. H., Willingham, W. T.1997. The effects of elevated metals on benthic communitymetabolism in a Rocky Mountain stream. EnvironmentalPollution 95:183–190.
Hill, M. O. 1979. TWINSPAN—A FORTRAN program for detrend-ed correspondence analysis and reciprocal averaging. CornellUniversity, Ithaca, NY.
Hill, W. R., Boston, H. L. 1991. Community development alters photosynthesis-irradiance relations in stream periphyton.Limnology and Oceanography 36:1375–1389.
Hillebrand, H. 1983. Development and dynamics of floating clustersof filamentous algae, in: Wetzel, R. G., Ed., Periphyton of freshwater ecosystems. Dr. W. Junk Publishers, The Hague, pp.31–39.
Hillebrand, H., Dürlsen, C. D., Kirschtel, D., Pollingher, U., Zohary,
23. Use of Algae in Environmental Assessments 799

T. 1999. Biovolume calculation for pelagic and benthic micro-algae. Journal of Phycology 403–424.
Hoagland, K. D., Carder, J. P., Spawn, R. L. 1996. Effects of organictoxic substances, in: Stevenson, R. J., Bothwell, M., Lowe, R.L., Eds., Algal ecology: Freshwater benthic ecosystems.Academic Press, San Diego, pp. 469–497.
Hoagland, K. D., Drenner, R. W., Smith, J. D., Cross. D. R. 1993.Freshwater community responses to mixtures of agriculturalpesticides: Effects of atrazine and bifenthrin. EnvironmentalToxicology and Chemical 12:627–637.
Hofmann, G. 1994. Aufwuchs Diatomeen in Seen and ihre Eignungals Indikatoren der Trophie. Bibliotheca Diatomologica30:1–24.
Holmes, N. T. H., Whitton, B. A. 1981. Phytobenthos of the RiverTees and its tributaries. Freshwater Biology 11:139–163.
Holomuzki, J. R., Short, T. M. 1988. Habitat use and fish avoidancebehaviors by the stream-dwelling isopod, Lirceus fontinalis.Oikos 52:79–86.
Hughes, R. M. 1995. Defining acceptable biological status by com-paring with reference conditions, in: Davis, W. S., Simon, T. P.,Eds., Biological assessment and criteria: Tools for waterresource planning and decision making. Lewis Publishers, BocaRaton, FL, pp. 31–47.
Humphrey, K. P., Stevenson, R. J. 1992. Responses of benthic algaeto pulses in current and nutrients during simulations of sub-scouring spates. Journal of the North American BenthologicalSociety 11:37–48.
Hurlbert, S. H. 1971. The nonconcept of species diversity: A critiqueand alternative parameters. Ecology 52:577–586.
Hutchinson, T., Havas, M. 1986. Recovery of previously acidifiedlakes near Coniston, Canada, following reductions in atmos-pheric sulphur and metal emissions. Water, Air, and SoilPollution 29:319–333.
Ibelings, B., Admiraal, W., Bijker, R., Letswaart, T., Prins, H. 1998.Monitoring of algae in Dutch rivers: Does it meet its goals?Journal of Applied Phycology 10:171–181.
Jongman, R. H. G., ter Braak, C. J. F., Van Tongeren, O. F. R. 1995.Data analysis in community and landscape ecology. CambridgeUniversity Press, Cambridge, U.K., 299 p.
Juggins, S., Battarbee, R., Fritz, S., Gasse, F. 1994. The CASPIA project: Diatoms, salt lakes, and environmental change. Journalof Paleolimnology 12:1–196.
Juggins, S., ter Braak, C. J. F. 1992. CALIBRATE—A program forspecies-environment calibration by [weighted averaging] partialleast squares regression. Environmental Change ResearchCenter, University College, London, 20 p.
Jüttner, I., Rothfritz, H., Omerod, S. J. 1996. Diatoms as indicatorsof river water quality in the Nepalese Middle Hills with consid-eration of the effects of habitat-specific sampling. FreshwaterBiology 36:475–486.
Karr, J. R. 1981. Assessment of biotic integrity using fish communi-ties. Fisheries 6:21–27.
Karr, J. R., Chu, E. W. 1999. Restoring life in running waters. IslandPress, Washington, DC, 206 p.
Karr, J. R., Dudley, D. R. 1981. Ecological perspective on waterquality goals. Environmental Management 5:55–68.
Kelly, M. G., Cazaubon, A., Coring, E., Dell’Uomo, A., Ector, L.,Goldsmith, B., Guasch, H., Hürlimann, J., Jarlman, A.,Kawecka, B., Kwandrans, J., Laugaste, R., Lindstrrm, E.-A.,Leitao, M., Marvan, P., Padisák, J., Pipp, E., Pyrgiel, J., Rott,E., Sabater, S., van Dam, H., Viznet, J. 1998. Recommendationsfor the routine sampling of diatoms for water quality assess-ments in Europe. Journal of Applied Phycology 10:215–224.
Kelly, M. G., Hornberger, G. M., Cosby, B. J. 1974. Continuousautomated measurement of rates of photosynthesis and respira-
tion in an undisturbed river community. Limnology andOceanography 19:305–312.
Kelly, M. G., Penny, C. J., Whitton, B. A. 1995. Comparative performance of benthic diatom indices used to assess riverwater quality. Hydrobiologia 302:179–188.
Kelly, M. G., Whitton, B. A. 1989. Interspecific differences in Zn, Cdand Pb accumulation by freshwater algae and bryophytes.Hydrobiologia 175:1–11.
Kelly, M. G., Whitton, B. A. 1995. The trophic diatom index: A newindex for monitoring eutrophication in rivers. Journal ofApplied Phycology 7:433–444.
Kentucky Division of Water. 1993. Methods for assessing biologicalintegrity of surface waters. Kentucky Natural Resources and Environmental Protection Cabinet, Frankfort, Kentucky,139 p.
Kentucky Natural Resources and Environmental Protection Cabinet.1997. Kentucky outlook 2000: A strategy for Kentucky’s thirdcentury. Executive summary and guide to the technical commit-tee reports. Frankfort, Kentucky.
Kerans, B. L., Karr, J. R. 1994. A benthic index of biotic integrity (B-IBI) for rivers of the Tennessee Valley. Ecological Applications4:768–785.
Kingston, J. C., Birks, H. J. B., Uutala, A. J., Cumming, B. F., Smol, J. P. 1992. Assessing trends in fishery resources and lake wateraluminum from paleolimnological analyses of siliceous algae.Canadian Journal of Fisheries and Aquatic Science 49:127–138.
Klemm, D.J., Lazorchak, J. M. [Eds.] 1994. Pilot field operation andmethods manual for streams, EPA/620/R-94/004. Environ-mental Monitoring Systems Laboratory Office of Research and Development, U.S. Environmental Protection Agency,Cincinnati, OH.
Kolkwitz, R., Marsson, M. 1908. Ökologie der pflanzlicheSaprobien. Berichte der Deutschen Botanischen Gessellschaft26:505–519.
Kwandrans, J., Eloranta, P., Kawecka, B., Wojtan, K. 1998. Use ofbenthic diatom communities to evaluate water quality in riversof southern Poland. Journal of Applied Phycology 10:193–201.
Lamberti, G. A. 1996. The role of periphyton in benthic food webs,in: Stevenson, R. J., Bothwell, M., Lowe, R. L., Eds., Algal ecology: Freshwater benthic ecosystems. Academic Press, SanDiego, pp. 533–572.
Lamberti, G. A., Steinman, A. D., Eds. 1993. Research in artificialstreams: Applications, uses, and abuses. Journal of the NorthAmerican Benthological Society 12:313–384.
Lange-Bertalot, H. 1979. Pollution tolerance of diatoms as a criteri-on for water quality estimation. Nova Hedwigia 64:285–304.
Lasenby, D. C. 1975. Development of oxygen deficits in 14 southernOntario lakes. Limnology and Oceanography 20:993–999.
Leavitt, P. R. 1993. A review of factors that regulate carotenoid andchlorophyll deposition and fossil pigment abundance. Journalof Paleolimnology 9:109–127.
Lecointe, C., Coste, M., Prygiel, J. 1993. “Omnidia”: Software fortaxonomy, calculations of diatom indices and inventories man-agement. Hydrobiologia 269/270:509–513.
Leland, H. V. 1995. Distribution of phytobenthos in the YakimaRiver basin, Washington, in relation to geology, land use andother environmental factors. Canadian Journal of Fisheries andAquatic Sciences 52:1108–1129.
Lembi, C. A., O’Neil, S. W., Spencer, D. F. 1988. Algae as weeds:economic impact, ecology, and management alternatives, in:Lembi, C. A., Waaland, J. R., Eds., Algae and human affairs.Cambridge University Press, Cambridge, U.K., pp. 455–481.
Line, J. M., ter Braak, C. J. F, Birks, H. J. B. 1994. WACALIB version 3.3—a computer program to reconstruct environmentalvariables from fossil assemblages by weighted averaging and
800 R. Jan Stevenson and John P. Smol

to derive sample-specific errors of prediction. Journal ofPaleolimnology 10:147–152.
Lorenzen, C. J. 1967. Determinations of chlorophyll and pheo-pigments: spectrophotometric equations. Limnology andOceanography 12:343–346.
Lowe, R. L. 1974. Environmental requirements and pollution toler-ance of freshwater diatoms, U.S. Environmental ProtectionAgency, EPA-670/4-74-005. Cincinnati, OH, 334 pp.
Lowe, R. L., Pan, Y. 1996. Benthic algal communities and biologicalmonitors, in: Stevenson, R. J., Bothwell, M., Lowe, R. L., Eds.,Algal ecology: Freshwater benthic ecosystems. Academic Press,San Diego, pp. 705–739.
Lund, J. W. G., Kipling, C., LeCren, E. D. 1958. The inverted micro-scope method of estimating algal numbers and the statisticalbasis of estimations by counting. Hydrobiologia 11:143–170.
Mantoura, R. F. C., Llewellyn, C. A. 1983. The rapid determinationof algal chlorophyll and carotenoid pigments and their break-down products in natural waters by reverse-phase high-performance liquid chromatography. Analytica Chimica Acta(Amsterdam) 151:297–314.
Marzolf, E. R., Mulholland, P. J., Steinman, A. D. 1994.Improvements to the diurnal upstream-downstream dissolvedoxygen change technique for determining whole-stream metabolism in small streams. Canadian Journal of Fisheries andAquatic Sciences 51:1591–1599.
May, R. M. 1974. Biological populations with nonoverlapping generations: Stable points, stable cycles, and chaos. Science186:273–275.
McCormick, P. V., Cairns, J. Jr. 1994. Algae as indicators of environ-mental change. Journal of Applied Phycology 6:509–526.
McCormick, P. V., O’Dell, M. B. 1996. Quantifying periphytonresponses of phosphorus in the Florida Everglades: A synoptic-experimental approach. Journal of the North AmericanBenthological Society 15:450–468.
McCormick, P. V., Rawlik, P. S., Lurding, K., Smith, E. P., Sklar, F. H.1996. Periphyton-water quality relationships along a nutrientgradient in the northern Florida Everglades. Journal of NorthAmerican Benthological Society 14:433–449.
McCormick, P. V., Stevenson, R. J. 1998. Periphyton as a tool forecological assessment and management in the FloridaEverglades. Journal of Phycology 34:726–733.
McFarland, B. H., Hill, B. H., Willingham, W. T. 1997. AbnormalFragilaria spp. (Bacillariophyceae) in streams impacted by minedrainage. Journal of Freshwater Ecology 12:141–149.
Millie, D. F., Pearl, H. W., Hurley, J. P. 1993. Microalgal pigmentassessments using high-performance liquid chromatography: Asynopsis of organismal and ecological applications. CanadianJournal of Fisheries and Aquatic Sciences 50:2513–2527.
Minshall, G. W. 1978. Autotrophy in stream ecosystems. BioScience28:767–771.
Moss, D., Wright, J. F., Furse, M. T., Clarke, R. T. 1999. A comparisonof alternative techniques for prediction of the fauna of runningwater sites in Great Britain. Freshwater Biology 41:167–181.
Mulholland, P. J. 1996. Role of nutrient cycling in streams, in:Stevenson, R. J., Bothwell, M., Lowe, R. L., Eds., Algal ecology:Freshwater benthic ecosystems. Academic Press, San Diego, pp.609–639.
Murtaugh, P. A. 1996. The statistical evaluation of ecological indica-tors. Ecological Application 6:132–139.
Neill, C., Cronwell, J. C. 1992. Stable carbon, nitrogen, and sulfurisotopes in a prairie marsh food web. Wetlands 12:217–214.
Newman, S., Aldridge, F. J., Phlips, E. J., Reddy, K. R. 1994.Assessment of phosphorus availability for natural phytoplank-ton populations from a hypereutrophic lake. Archiv fürHydrobiologie 130:409–427.
Niederlehner, B. R., Cairns, J. C., Jr. 1994. Consistency and sensiti-vity of community level endpoints in microcosm tests. Journalof Aquatic Ecosystem Health 3:93–99.
Odum, E. P., Finn, J. T., Franz, E. H. 1979. Perturbation theory andthe subsidy-stress gradient. BioScience 29:349–352.
Oldfield, F., Appleby, P. G. 1984. Empirical testing of 210Pb-datingmodels for lake sediments, in: Haworth, E. Y., Lund J. W. G.,Eds., Lake sediments and environmental history. LeicesterUniversity Press, Leicester, U.K., pp. 93–124.
Palmer, C. M. 1962. Algae in water supplies. U.S. Department ofHealth, Education and Welfare, Washington, D.C., 88 p.
Palmer, C. M. 1969. A composite rating of algae tolerating organicpollution. Journal of Phycology 5:78–82.
Pan, Y., Stevenson, R. J. 1996. Gradient analysis of diatom assemblagesin western Kentucky wetlands. Journal of Phycology 32:222–232.
Pan, Y., Stevenson, R. J., Hill, B. H., Herlihy, A. T., Collins, G. B.1996. Using diatoms as indicators of ecological conditions inlotic systems: A regional assessment. Journal of the NorthAmerican Benthological Society 15:481–495.
Pan, Y., Stevenson, R. J., Vaithiyanathan, P., Slate, J., Richardson, C.J. 2000. Changes in algal assemblages along observed andexperimental phosphorus gradients in a subtropical wetland,U.S.A. Freshwater Biology 43:1–15.
Patrick, R. 1949. A proposed biological measure of stream condi-tions based on a survey of the Conestoga Basin, LancasterCounty, Pennsylvania. Proceedings of the Academy of NaturalSciences of Philadelphia 101:277–341.
Patrick, R. 1973. Use of algae, especially diatoms, in the assessmentof water quality, in: Biological methods for the assessment ofwater quality, ASTM STP 528, American Society for Testingand Materials, Philadelphia, pp. 76–95.
Patrick, R., Hohn, M. H., Wallace, J. H. 1954. A new method fordetermining the pattern of the diatom flora. Notulae Naturae(Philadelphia) No. 259, 12 p.
Paulsen, S. G., Larsen, D. P., Kaufmann, P. R., Whittier, T. R., Baker,J. R., Peck, D. V, McGue, J., Hughes, R. M., McMullen, D.,Stevens, D., Stoddard, J. L., Larzorchak, J., Kinney, W., Selle, A.R., Hjort, R. 1991. Environmental monitoring and assessmentprogram (EMAP) surface waters monitoring and research strategy—fiscal year 1991. Environmental Research Laboratory,Office of Research and Development, U.S. EnvironmentalProtection Agency, Corvallis, OR.
Peterson, C. G., Stevenson, R. J. 1992. Resistance and recovery of lotic algal communities: Importance of disturbance timing,disturbance history, and current. Ecology 73:1445–1461.
Pielou, E. C. 1984. The interpretation of ecological data: A primeron classification and ordination. Wiley, New York, 263 pp.
Plafkin, J. L., Barbour, M. T., Porter, K. D., Gross, S. K., Hughes, R.M. 1989. Rapid bioassessment protocols for use in streams andrivers: Benthic macroinvertebrates and fish, U.S. EPA Office ofWater, Washington, D.C. EPA/444/4–89–001.
Porter, K. G. 1977. The plant-animal interaction in freshwaterecosystems. American Scientist 65:159–170.
Porter, S. D., Cuffney, T. F., Gurtz, M. E., Meador, M. R. 1993.Methods for collecting algal samples as part of the nationalwater-quality assessment program. Report 93–409. U.S.Geological Survey, Raleigh, NC.
Power, M. E. 1990. Benthic turfs versus floating mats of algae inriver food webs. Oikos 58:67–79.
Preisendorfer, R. W. 1996. Secchi disk science: Visual optics of natural waters. Limnology and Oceanography 31:909–926.
Pringle, C. M., Bowers, J. A. 1984. An in situ substratum fertilizationtechnique: Diatom colonization on nutrient-enriched, sand substrata. Canadian Journal of Fisheries and Aquatic Sciences41:1247–1251.
23. Use of Algae in Environmental Assessments 801
Prygiel, J., Coste, M., Bukowska, J. 1999a. Review of the majordiatom-based techniques for the quality assessments of rivers—state of the art in Europe, in: Prygiel, J., Whitton, B. A.,Bukowska, J., Eds., Use of algae for monitoring rivers III.Agence de l’Eau Artois-Picardi, Douai, France, 271 p.
Prygiel, J., Whitton, B. A., Bukowska, J. 1999b. Use of algae formonitoring rivers III. Agence de l’Eau Artois-Picardi, Douai,France, 271 pp.
Radwan, S., Kowalik, W., Kowalczyk, C. 1990. Occurrence of heavymetals in water, phytoplankton and zooplankton of amesotrophic lake in eastern Poland. Science of the TotalEnvironment 96:115–120.
Raschke, R. L. 1993. Diatom (Bacillariophyta) community responseto phosphorus in the Everglades National Park, USA.Phycologia 32:48–58.
Reavie, E. D., Smol, J. P. 1997. Diatom-based model to infer past littoral habitat characteristics in the St. Lawrence River.International Journal of Great Lakes Research 23:339–348.
Reavie, E. D., Smol, J. P. 1998. Epilithic diatoms of the St. LawrenceRiver and their relationships to water quality. Canadian Journalof Botany 76:251–257.
Reavie, E. D., Smol, J. P., Carignan, R., Lorrain, S. 1998. Diatompaleolimnology of two fluvial lakes in the St. Lawrence River: Areconstruction of environmental changes during the last century.Journal of Phycology 34:446–456.
Reid, M. A., Tibby, J. C., Penny, D., Gell, P. A. 1995. The use ofdiatoms to assess past and present water quality. AustralianJournal of Ecology 20:57–64.
Renberg, I., Hellberg, T. 1982. The pH history of lakes inSouthwestern Sweden, as calculated from the subfossil diatomflora of the sediments. Ambio 11:30–33.
Rosen, B. H. 1995. Use of periphyton in the development of biocrite-ria, in: Davis, W. S., Simon, T. P., Eds., Biological assessmentand criteria: Tools for water resource planning and decisionmaking. Lewis Publishers, Boca Raton, FL, pp. 209–215.
Rosgen, D. L. 1994. A classification of natural rivers. Amsterdam,50 pp.
Round, F. E. 1991. Diatoms in river water-monitoring studies.Journal of Applied Phycology 3:129–145.
Rout, J., Gaur, J. P. 1990. Comparative asessment of line transectand point intercept methods for stream periphyton. Archiv fürHydrobiologie 119:293–298.
Rumeau, A., Coste, M. 1988. Initiation à la systématique desdiatomées d’eau douce pour l’utilisation pratique d’un indicediatomique générique. Bulletin Francais de la Pêche et de laPisciculture 309:1–69.
Say, P. J., Burrows, L. G., Whitton, B. A. 1990. Enteromorpha as amonitor of heavy metals in estuaries. Hydrobiologia195:119–126.
Schindler, D. W. 1990. Experimental perturbations of whole lakes astests of hypotheses concerning ecosystem structure and func-tion. Oikos 57:25–41.
Shannon, C. F. 1948. A mathematical theory of communication. BellSystems Technical Journal 27:37–42.
Sheath, R. G., Burkholder, J. M. 1985. Characteristics of soft water streams in Rhode Island. II. Composition and seasonaldynamics of macroalgal communities. Hydrobiologia128:109–118.
Sicko-Goad, L., Stoermer, E. F., Ladewski, B. G. 1977. A morphome-tric method for correcting phytoplankton cell volume estimates.Protoplasma 93:147–163.
Sigworth, E. A. 1957. Control of odor and taste in water supplies.Journal of American Water Works Association 49:1507–1521.
Simpson, E. H. 1949. Measurement of diversity. Nature 163:688.Siver, P. A. 1995. The distribution of chrysophytes along environ-
mental gradients: Their use as biological indicators, in:Sandgren, C., Smol, J. P., Kristiansen, J., Eds., Chrysophytealgae: Ecology, phylogeny and development. CambridgeUniversity Press, Cambridge, U.K., pp. 232–268.
Siver, P. A., Smol, J. P. 1993. The use of scaled chrysophytes in longterm monitoring programs for the detection of changes in lakewater acidity. Water, Air, and Soil Pollution 73:357–376.
Slàdecek, V. 1973. System of water quality from the biological pointof view. Archiv für Hydrobiologie und Ergebnisse Limnologie7:1–218.
Slàdecek, V. 1986. Diatoms as indicators of organic pollution. ActaHydrochimica et Hydrobiologica 14:555–566.
Slate, J. E. 1998. Inference of present and historical environmentalconditions in the Everglades with diatoms and other siliceousmicrofossils. Ph.D. dissertation, University of Louisville,Louisville, Kentucky.
Smol, J. P. 1990. Paleolimnology—recent advances and future challenges, in: De Bernardi, R., Giussani, G., Barbanti, L., Eds.,Scientific Perspectives in Theoretical and Applied Limnology.CNDR, Pallanza. Memorie dell’ Istituto Italiano di IdrobiologiaDott Marco de Marchi 47:253–276.
Smol, J. P. 1992. Paleolimnology: An important tool for effectiveecosystem management. Journal of Aquatic Ecosystem Health1:49–58.
Smol, J. P. 1995. Application of chrysophytes to problems in paleoecology, in: Sandgren, C., Smol, J. P., Kristiansen, J., Eds.,Chrysophyte algae: Ecology, phylogeny and development.Cambridge University Press, Cambridge, U.K., pp. 303–329.
Smol, J. P., Glew, J. R. 1992. Paleolimnology, in: Nierenberg, W. A.,Ed., Encyclopedia of earth system science, Vol. 3. AcademicPress, San Diego, pp. 551–564.
Sokal, R. R., Rohlf, F. J. 1998. Biometry: The principles and practiceof statistics in biological research. W. H. Freeman, New York,887 p.
Stevenson, R. J. 1984. Epilithic and epipelic diatoms in the SanduskyRiver, with emphasis on species diversity and water quality.Hydrobiologia 114:161–175.
Stevenson, R. J. 1990. Benthic algal community dynamics in a streamduring and after a spate. Journal of the North AmericanBenthological Society 9:277–288.
Stevenson, R. J. 1996. An introduction to algal ecology in freshwaterbenthic habitats, in: Stevenson, R. J., Bothwell, M., Lowe, R.L., Eds., Algal ecology: Freshwater benthic ecosystems.Academic Press, San Diego, pp. 3–30.
Stevenson, R. J. 1997. Scale-dependent causal frameworks and theconsequences of benthic algal heterogeneity. Journal of theNorth American Benthological Society 16:248–262.
Stevenson, R. J. 1998. Diatom indicators of stream and wetlandstressors in a risk management framework. EnvironmentalMonitoring and Assessment 51:107–118.
Stevenson, R. J. 2001. Using algae to assess wetlands with multi-variate statistics, multimetric indices, and an ecological riskassessment framework, in: Rader, R., Batzger, D., Wissinger, S.,Eds., Biomonitoring and management of North American fresh-water wetlands. Wiley, New York.
Stevenson, R. J., Bahls, L. L. 1999. Periphyton protocols, in:Barbour, M. T., Gerritsen, J., Snyder, B. D., Eds., Rapidbioassessment protocols for use in wadeable streams and rivers:Periphyton, benthic macroinvertebrates, and fish, 2nd Ed., EPA841-B-99-002. U.S. Environmental Protection Agency,Washington, DC, pp 6–1–6–22.
Stevenson, R. J., Glover, R. 1993. Effects of algal density and currenton ion transport through periphyton communities. Limnologyand Oceanography 38:1276–1281.
Stevenson, R. J., Hashim, S. 1989. Variation in diatom
802 R. Jan Stevenson and John P. Smol

(Bacillariophyceae) community structure among microhabitatsin sandy streams. Journal of Phycology 25:678–686.
Stevenson, R. J., Lowe, R. L. 1986. Sampling and interpretation ofalgal patterns for water quality assessment, in: Isom, B. G., Ed.,Rationale for sampling and interpretation of ecological data inthe assessment of freshwater ecosystems, ASTM STP 894.American Society for Testing and Materials Publication,Philadelphia, pp. 118–149.
Stevenson, R. J., Pan, Y. 1999. Assessing ecological conditions inrivers and streams with diatoms, in: Stoermer, E. F., Smol, J. P.,Eds., The diatoms: Applications to the environmental and earthsciences. Cambridge University Press, Cambridge, U.K., pp.11–40.
Stevenson, R. J., Stoermer, E. F. 1981. Quantitative differencesbetween benthic algal communities along a depth gradient inLake Michigan. Journal of Phycology 17:29–36.
Stevenson, R. J., Singer, R., Roberts, D. A., Boylen, C. W. 1985.Patterns of benthic algal abundance with depth, trophic status,and acidity in poorly buffered New Hampshire lakes. CanadianJournal of Fisheries and Aquatic Sciences 42:1501–1512.
Stevenson, R. J., Sweets, P. R., Pan, Y., Schultz, R. E. 1999. Algalcommunity patterns in wetlands and their use as indicators ofecological conditions, in: McComb, A. J., Davis, J. A., Eds.,Proceedings of INTECOL’s Vth international wetland confer-ence, Gleneagles Press, Adelaide, Australia, pp. 517–527.
Stoermer, E. F., Smol, J. P. 1999. The diatoms: Applications for theenvironmental and earth sciences. Cambridge University Press,Cambridge, U.K., 484 pp.
Sweets, P. R. 1992. Diatom paleolimnological evidence for lake acidi-fication in the Trial Ridge region of Florida. Water, Air and SoilPollution 65: 43–57.
ter Braak, C. J. F., van Dam, H. 1989. Inferring pH from diatoms: Acomparison of old and new calibration methods. Hydrobiologia178:209–223.
Tett, P., Gallegos, C., Kelly, M. G., Hornberger, G. M., Cosby, B. J.1978. Relationships among substrate, flow, and benthicmicroalgal pigment density in the Mechums River, Virginia.Limnology and Oceanography 23:785–797.
Thorp, J. H., Black, A. R., Jack, J. D., Casper, A. F. 1996. Pelagicenclosures—modification and use for experimental study ofriverine plankton. Archiv für Hydrobiologie (Supplement)113:583–589.
Trainor, F. R., Shubert, L. E. 1973. Growth of Dictyosphaerium,Selenastrum, and Scenedesmus (Chlorophyceae) in a dilute algalmedium. Phycologia 12:35–39.
Tuchman, M., Stevenson, R. J. 1980. Comparison of clay tile, steril-ized rock, and natural substrate diatom communities in a smallstream in southeastern Michigan, U.S.A. Hydrobiologia75:73–79.
Twist, H., Edwards, A. C., Codd. G. A. 1997. A novel in-situ bio-monitor using alginate immobilized algae (Scenedesmus subspi-catus) for the assessment of eutrophication in flowing surfacewaters. Water Research 31:2066–2072.
U.S. Environmental Protection Agency. 1978. The Selenastrum capri-
cornutum Printz algal assay bottle test, EPA-600/9-78-018.Office of Research and Development, U.S. EnvironmentalProtection Agency, Corvallis, OR, 126 p.
U.S. Environmental Protection Agency. 1992. Framework for ecolog-ical risk assessment, EPA 630/R–92/001. Washington, DC.
U.S. Environmental Protection Agency. 1993. A guidebook to comparing risks and setting environmental priorities, EPA 230-B-93-003. Washington, DC.
U.S. Environmental Protection Agency. 1996. Strategic plan for theOffice of Research and Development, EPA/600/R-96/059.Washington, DC.
U.S. Environmental Protection Agency. 1998. Guidelines for eco-logical risk assessment. EPA/630/R-95/002F. Washington, D.C.114 p.
Van Dam, H., Mertenes, A., Sinkeldam, J. 1994. A coded checklistand ecological indicator values of freshwater diatoms from the Netherlands. Netherlands Journal of Aquatic Ecology28:117–133.
Van Heukelem, L., Lewitus, A. J., Kana, T. M. 1992. High-perform-ance liquid chromatography of phytoplankton pigments using a polymeric reverse-phase C18 column. Journal of Phycology28:867–872.
Vannote, R. L., Minshall, G. W., Cummins, K. W., Sedell, J. R.,Cushing, C. E. 1980. The river continuum concept. CanadianJournal of Fisheries and Aquatic Sciences 37:130–137.
Vinebrooke, R. D., Graham, M. D. 1997. Periphyton assemblages as indicators of recovery in acidified Canadian Shield lakes. Canadian Journal of Fisheries and Aquatic Sciences54:1557–1568.
Vollenweider, R. A. 1976. Advances in defining critical loading levelsfor phosphorus in lake eutrophication. Memorie dell’IstitutoItaliano di Idrobiologia Dott Marco de Marchi 33:53–83.
Vymazal, J. 1984. Short-term uptake of heavy metals by periphytonalgae. Hydrobiologia 119:171–179.
Vymazal, J. 1994. Algae and element cycling in wetlands. LewisPublishers, Boca Raton, FL, 689 pp.
Watanabe, T., Asai, K., Houki, A., Tanaka, S., Hizuka, T. 1986.Saprophilous and eurysaprobic diatom taxa to organic waterpollution and diatom assemblage index (DAIpo). DiatomResearch 2:23–73.
Weber, C. I. 1973. Recent developments in the measurement of the response of plankton and periphyton to changes in theirenvironment, in: Glass, G., Ed., Bioassay techniques and envi-ronmental chemistry. Ann Arbor Science Publishers, Ann Arbor,MI, pp. 119–38.
Wehr, J. D., Descy, J.-P. 1998. Use of phytoplankton in large rivermanagement. Journal of Phycology 34:741–749.
Wetzel, R. G. 1983. Limnology, 2nd Ed. Saunders CollegePublishing, Philadelphia, 767 pp.
Wetzel, R. G. 1996. Benthic algae and nutrient cycling in lenthicfreshwater ecosystem, in: Stevenson, R. J., Bothwell, M., Lowe, R. L., Eds., Algae ecology: Freswater benthic ecosystems.Academic Press, San Diego, pp. 641–667.
Wetzel, R. G., Likens, G. E. 1991. Limnological analyses. 2nd Ed.Springer-Verlag, New York, 391 p.
Whitehead, D. R., Charles, D. F., Goldstein, R. A. 1990. The PIRLAproject (Paleoecological Investigation of Recent LakeAcidification): An introduction to the synthesis of the project.Journal of Paleolimnology 3:187–194.
Whitmore, T. J. 1989. Florida diatom assemblages as indicators oftrophic state and pH. Limnology and Oceanography 34:882–895.
Whitton, B. A. 1970. Biology of Cladophora in freshwaters. WaterResearch 4:457–476.
Whitton, B. A. 1984. Algae as monitors of heavy metals in fresh-waters, in: Shubert, L. E., Ed., Algae as ecological indicators.Academic Press, London, pp. 257–280.
Whitton, B. A., Shehata, F. H. A. 1982. Influence of cobalt, nickel,copper and cadmium on the blue-green alga Anacystis nidulans.Environmental Pollution 27:275–281.
Whitton, B. A., Kelly, M. G. 1995. Use of algae and other plants formonitoring rivers. Australian Journal of Ecology 20:45–56.
Whitton, B. A., Rott, E., Eds. 1996. Use of algae for monitoringrivers II. Universität Innsbruck, Innsbruck, Austria, 196 pp.
Whitton, B. A., Burrows, I. G., Kelly, M. G. 1989. Use ofCladophora glomerata to monitor heavy metals in rivers.Journal of Applied Phycology 1:293–299.
23. Use of Algae in Environmental Assessments 803

Whitton, B. A., Rott, E., Friedrich, G., Eds. 1991. Use of algae formonitoring rivers. Institut für Botanik, Universität Innsbruck,Innsbruck, Austria, 193 pp.
Whitton, B. A., Yelloly, J. M., Christmas, M., Hernández, I. 1998.Surface phosphatase activity of benthic algae in a stream with highly variable ambient phosphate concentrations.Internationale Vereinigung für Theoretische und AngewandteLimnologie Verhandlungen 26:967–972.
Wong, S. L., Clark, B. Kirby, M., Kosciuw, R. F. 1978. Water temper-ature fluctuations and seasonal periodicity of Cladophora andPotamogeton in shallow rivers. Journal of the FisheriesResearch Board of Canada 35:866–870.
Yoder, C. O., Rankin, E. T. 1995. Biological response signatures and the area of degradation value: new tools for interpretingmultimetric data, in: Davis, W. S., Simon, T. P., Eds., Biologicalassessment and criteria: Tools for water resource planning anddecision making. Lewis Publishers, Boca Raton, FL,pp. 263–286.
Zeimann, H. 1991. Veränderungen der Diatomeenflora der Werraunter dem Einfluß des Salzgehaltes. Acta Hydrochimica etHydrobiologica 19:159–174.
Zelinka, M., Marvan, P. 1961. Zur Prazisierung der biologischenKlassifikation des Reinheit fliessender Gewässer. Archiv fürHydrobiologie 57:389–407.
804 R. Jan Stevenson and John P. Smol