Embed Size (px)
Citation preview
Transportation Research Record 869 1
Use of Additional Through Lanes at Signalized
Intersections
PATRICK T. McCOY AND JOHN R. TOBIN
One method sometimes used to increase the capacity of signalized intersections is to widen the roadways through the intersections to provide additional through lanes. The degree to which these additional through lanes actually improve the efficiency of traffic operations at the intersections depends on the extent to which they are used by through vehicles. The objectives of this research were to (a) observe the use of additional through lanes, (b) evaluate the effect of the length of these lanes on their use by through vehicles, and (c) incorporate the findings into the critical-movement-analysis technique in Transportation Research Board (TRB) Circular 212. Lane-use studies were conducted during peak periods on five signalized intersection approaches that had additional through lanes that ranged from 800 to 1200 ft in length. The lane-use data were collected for more than 700 signal cycles that were fully utilized by through vehicles. Analyses of these data determined that use of these lanes by through vehicles fit a Poisson distribution with a mean that was a linear function of lane length and green time. It was concluded that (a) the lane-use factors of the critical-movement-analysis procedure in TRB Circular 212 generally overestimate the use of additional through lanes by through vehicles and (bl length requirements for additional through lanes based on vehicle storage considerations are too short to achieve an average use of additional through lanes of more than 1.5 through vehicles per cycle.
To increase capacity, roadways are often widened at signalized intersections to provide additional lanes. Usually these lanes are provided for turning movements, but, in some cases, additional through lanes are also required. A common situation on two-lane, two-way roadways is the addition of both a left-turn lane and a through lane, as illustrated in Figure 1. In such cases, the additional through lane is a curb lane, which is used by both through and right-turning vehicles.
The degree to which this additional through lane improves the efficiency of traffic operations at the intersection depends on the extent to which it is used by through vehicles. According to the assumptions of previously developed lane-distribution models (,!,~), use of the additional through lane by through vehicles depends on drivers' perceptions of the travel-time savings to be realized by using it. If a driver perceives that use of the lane will minimize his or her travel time, it will be usedi otherwise, it will not. Therefore, to use the additional through lane, the driver must perceive the delay to be experienced by entering it in advance of the intersection and merging from it beyond the intersection to be less than the additional delay to be experienced on the inter section approach by not using it. Obviously, the delay of entering and merging from the additional through lane relative to the additional delay of not using it is reduced as the length of the additional through lane is increased. Thus, use of the additional through lane by through vehicles would be exE>ected to be greater as its length is increased.
PROBLEM
The critical-movement-analysis procedure in Transportation Research Board (TRB) Circular 212 (3) does not include lane-use factors specifically for through lanes of limited length. In fact, few capacity-analysis procedures do account for the effects of limited through-lane length on lane use anq/or capacity at signalized intersections.
Capacity-analysis techniques developed by Leisch (_!) do include a theoretical method for determining
Figure 1. Additional through-lane geometry.
minimum-length requirements of additional through lanes. This method is based on vehicle-storage requirements, both in advance of and beyond the intersection, which are intended to prevent (a) the blocking of access to the additional lane by vehicles waiting on the intersection approach and (bl the blocking of the intersection itself by vehicles waiting to merge from the additional lane on the exit side of the intersection. However, these techniques are not applicable to capacity analysis of signalized intersections with additional through lanes that do not satisfy these minimum-length requirements nor has the adequacy of these length requirements been verified in the field (5).
The Australian Road Capacity Guide (6) does address the question of use of through ianes of limited length. With this guide, an additional through lane would be treated in the same way as a through curb lane blocked by parked vehicles on the approach and exit sides of the intersection. For approaches with three or more lanes and no vehicles parked within 100 ft back from the stop line, an average of 1.5 through vehicles per cycle would be assumed to use the blocked lane, This average use by through vehicles was determined from field studies conducted in Sydney (7). It was also concluded from these studies that one parked vehicle 500 ft downstream from the intersection has as much effect on lane use by through vehicles as one parked only 200 ft downstream. This conclusion implies that to achieve an average through-vehicle use of an additional through lane of more than 1.5 through vehicles per cycle, the length of this lane beyond the intersection must be considerably more than 500 ft.
The Australian data suggest that the lane-use factors in TRB Circular 212 (3) would be inappropriate for determining the level of service of a signalized intersection with additional through lanes. In addition, these data indicate that the minimumlength requirements of additional through lanes developed by Leisch (_!) may be too short to achieve the level of through-vehicle use that would be implied by the use of these lane-use factors. Thus, there is a need to determine the appropriate laneuse factor to be used in the critical-movement analysis of signalized intersections with additional through lanes.
OBJECTIVES
The objectives paper were to through lanes
of (aJ at
the research observe the signalized
reported in this use of additional
intersections, (bl
2
quantify the effect of the length of additional through lanes on their use by through vehicles, and (c) incorporate the findings into the critical-movement-analysis procedure in TRB Circular 212 (1_). This paper presents the procedure, findings, and conclusions of this research. Also, the application of the research results to the critical-movement analysis of signalized intersections is presented.
PROCEDURE
Lane-use studies were conducted during peak periods on five signalized-intersection approaches in Lincoln, Nebraska, in the spring of 1980. The approaches were on two-lane, two-way streets that had been widened at the intersections several years earlier. The widenings were done to add a left-turn lane and another through lane on the approaches. Although the approaches studied all had lane geometries similar to that shown in Figure 1, the total length of the additional through lanes ranged from just more than 800 ft to nearly 1200 ft. All the studies were conducted during fair weather and under dry pavement conditions.
The lane-use data collected during these studies were analyzed to determine the use of the additional through lanes by through vehicles. Comparisons were made among the approaches to determine the effects of additional-through-lane length on its use by through vehicles. The results of this analysis were then formulated for use in the critical-movementanalysis procedure in TRB Circular 212 (3), in order to make it more directly applicable t;- signalized intersections with additional through lanes.
Lane-Use Stuqy
A lane-use study consisted of counting the number of vehicles that entered the intersection per cycle from each of the two through lanes on a study approach. Thus, during each cycle, a count was made on the approach of (a) the number of through veh icles discharging from the additional through (curb) lane, (b) the number of right-turning vehicles discharging from the additional through (curb) lane, and (c) the number of through vehicles discharging from the other (inside) through lane. The number of vehicles discharging from the left-turn lane was not recorded, because in the critical-movement-analysis procedure the left-turn volume would be assigned to the left-turn lane and adjusted separately from the through and right-turn volumes in the other two approach lanes. However, the left-turn operations were noted during the conduct of the lane-use studies to ensure that data were not collected if these operations interfered with those in the through lanes.
In an attempt to observe the most frequent use of the additional through lanes by through vehicles, the lane-use studies were conducted only during peak periods when the green times on the study approaches were fully utilized by the through vehicles in the inside through lane. Also, only data collected during these fully utilized cycles were used in the subsequent analysis. A cycle was considered to be fully utilized when the following conditions applied: (a) there are vehicles stopped waiting in the inside through lane on the approach when the signal turns green, (b) vehicles in the inside through lane continue to be available to enter the intersection during the entire phase and there is no unused time or exceedingly long spacings between the vehicles at any time due to lack of traffic, and (cl at least one vehicle in the inside through lane is stopped at the end of the phase when the signal turns red. These conditions are similar to those
Transportation Research Record 869
used in the 1965 Highway Capacity Manual (.!!_) to define a loaded cycle.
Study Sites
All five of the study sites were level and were located at four-legged, right-angle intersections. There was no parking at any time on the streets on which the study sites were located. The posted speed limit on these streets was 35 mph.
As mentioned previously, the total lengths of the additional through lanes at these sites ranged from around 800 ft to nearly 1200 ft. The taper and lane lengths of these lanes, both in advance of and beyond the intersections, are given in Figure 2. Also given are the widths of the through lanes at each site, which were all within the 11- to 13-ft range.
The minimum-length requirements recommended by Leisch (_!) for a 40-mph design speed are presented in Table l. Comparison of these requirements with the lengths given in Figure 2 indicates that except for the taper lengths in advance of the inter sections, all the lengths at the study sites exceeded these requirements.
During the periods when the lane-use studies were conducted, the signals at the study sites operated in an isolated, pretimed mode. The cycle lengths were 60 s, and the green times for the through and right-turn movements are shown in Figure 2. Although only one of the study sites (site 3) had a separate left-turn phase, all the approaches had sufficient left-turn capacity to accommodate their left-turn volumes without their interfering with the through and right-turn movements.
Traffic volume data obtained from the City of Lincoln prior to the conduct of the lane-use studies indicated that there would be less than l percent trucks and little pedestrian activity at the study sites in the peak hours during which the studies were to be conducted. Also, there were no scheduled local bus stops at any of the study sites. A critical-movement analysis of these volume data determined that according to TRB Circular 212 (3), an intersection level-of-service C existed at th;- study sites during the peak hours when the lane-use studies were conducted.
FINDINGS
Lane-use data were collected for more than 700 fully utilized cycles at the study sites. During these cycles, there was no pedestrian activity at the intersections, and, as expected, very few of these cycles had any trucks and/or buses included in the lane-use counts. Therefore, those few that did were excluded from the subsequent analysis. Thus, this analysis included only passenger-car data.
A summary of the sample means and standard deviations of the lane-use counts made on each approach is given in Table 2. Of course, with respect to the objectives of this research, the sample statistics for the number of through vehicles discharging from the additional through lane per cycle (STR) were of primary interest. It was noted that the mean values of STR were in general agreement with the Australian findings (7). Also, none of them exceeded the 1.5 vehicles per cycle, which is the value assumed in the Australian Road Capacity Guide (6) for the use of through lanes of limited length by through vehicles.
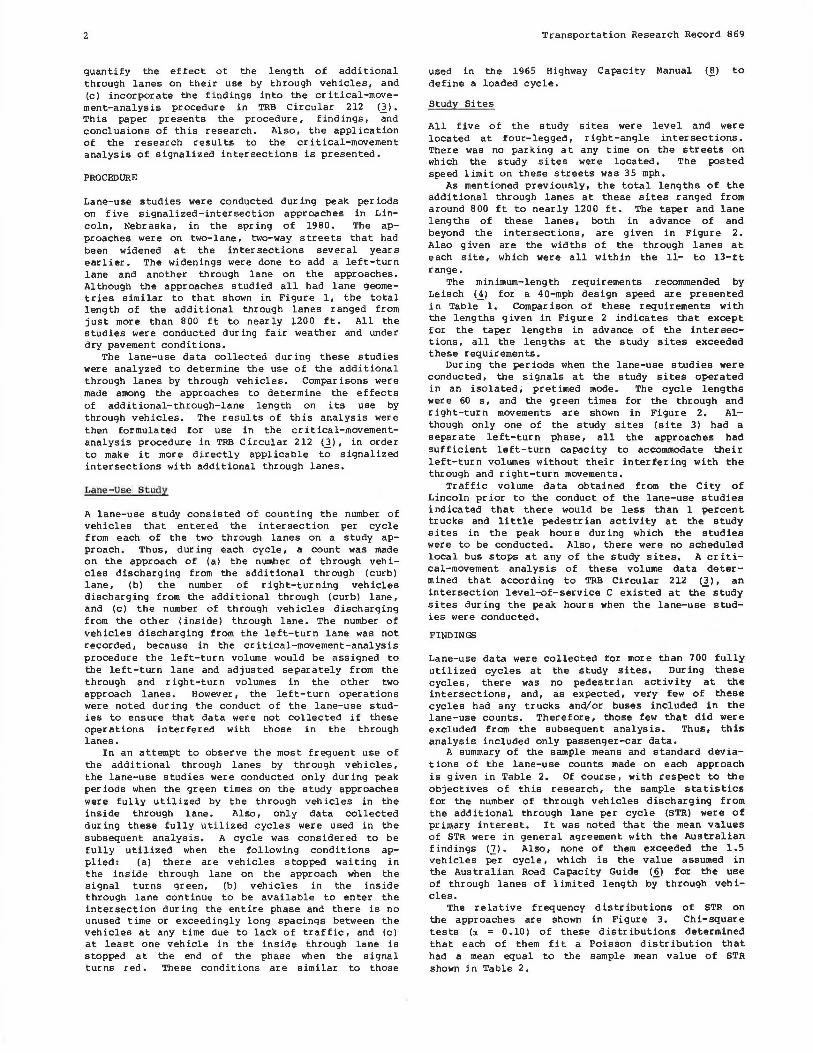
The relative frequency distributions of STR on the approaches are shown in Figure 3. Chi-square tests (a = 0.10) of these distributions determined that each of them fit a Poisson distribution that had a mean equal to the sample mean value of STR shown in Table 2.

Transportation Research Record 869 3
Figure 2. Study sites.
__ ____,J
-~I
Db -i-- -------------i-- ---------------
Study Ta Site (ft)
1 155
2 145
3 65
4 155
5 130
Table 1. Minimum-length requirements.
Study Site T0
a (ft) D. b (ft) Db c (ft)
I 175 300 275 2 175 275 250 3 175 250 240 4 175 375 360 5 175 400 325
8Len1m or t.aper in advanCll of in tornccion. bLe n&lh of additional through Jane in advance of stop line. 'Length of additional through lane beyond stop line. dl~ngi h of taper beyond intersection.
Da (ft)
365
475
580
600
515
Tb d (ft)
200 200 200 200 200
Table 2. Summary of lane-use data statistics (passenger cars).
THRU0 STRb RTC Study No. of Site Mean SD Mean SD Mean SD Cycles
I 9.19 1.32 1.23 1.00 1.02 0.98 160 2 8.35 1.42 1.37 1.09 1.39 1.09 175 3 7.62 1.76 1.41 1.24 0.78 0.85 189 4 13.04 2.18 1.23 1.04 0.54 0.69 99 5 11.41 0.95 1.36 I.ID 2.83 1.70 103
•Number of through vehlcle& discJuus:lng from orhu (lnalde) through lane per cycle.
bNumbet of through vehicles dischftrglng from additional through (curb) lane per cycle,
CNumbCi" or rfcht-turning vehicles dischDrging from additional through (curb) lane per cycfc.
Db (ft)
465
495
460
480
680
It was anticipated that the mean number of through vehicles discharging from an additional through .lane per cycle (STR) might be affected by traffic, geometric, and signal-timing factors. Therefore, a stepwise multiple-linear-regression analysis was performed that used STR as the dependent variable and various traffic, geometric, and signal-timing factors as the independent variables. The specific geometric and signal-timing factors used in this analysis were the taper and lane lengths and the green times given in Figure 2. The traffic factors used were the mean number of through vehicles discharging from the other through lane per
Tb (ft)
260
205
240
580
285
Green D3 +Db W1 W2 Time
(ft) (ft) (ft) (sec)
830 11 11 23
970 12 11 21
1,040 12 11 20
1,080 13 12 30
1,195 13 12 27
Figure 3. Relative frequency distributions of STA.
.5filJ .4
~.3 . a; .2 a:
.1
0 0 , 2 3 2' 4 Study Site No. 1
.5[0_1_] .4
!-3 i -2 a: .1
0 0 1 2 3 2: 4 Study Site No. 4
.5[[h] f 4 .t: .3
i .2 . a:
.1 0
0 1 2 3 2' 4 Study Site No. 2 .5fill] .4
~-3 a; .2 a: .1
0 0 1 2 3 2:4 Study Site No. 5
.5[DJ z-·4 .t: .3
i .2 a:
.1 0
0 1 2 3 2' 4 Study Site No. 3
cycle (THRu) and the mean number of right-turning vehicles discharging from the additional through lane per cycle (RT). The values used for STR, THRU, and RT are shown in Table 2.
As a result of the regression analysis, the following relationship was found to be statistically significant (a= 0.01):
STR = l.24 + 0.000 58 (Da + Db)-0.02IG
where
STR mean number of through vehicles (passenger cars) discharging from additional through lane per cycle,
Da length of additional through lane in advance of stop line (ft),
Db • length of additional through lane beyond stop line (ft) , and
(1)
G a green time for through and right-turn movement on approach (s).
This relationship explained 99 percent of the variation in the observed values of STR.
4
The relationship in Equation l is consistent with the assumption discussed earlier that the use of an additional through lane by through vehicles is directly proportional to the travel-time savings that drivers perceive would result from its use. The longer the additional-through-lane length (Da + Db), the greater the likelihood that travel-time savings would result from its use, and, as in Equation l, the value of STR would be higher. Conversely, the longer the green time for the through and right-turn movement on an approach, the greater the number of through vehicles that can be accommodated per cycle in the other through lane and the lower the probability that travel-time savings would result by using the additional through lane. Also, as in Equation l, the value of STR would be lower.
It is interesting to note that the results of the regression analysis, as well as those of the chisquare tests, indicated that the number of rightturning vehicles discharging from the additional through lane did not significantly affect its use by through vehicles. However, it must be remembered that the lane-use data were collected at intersections that had little pedestrian activity and where, as indicated in Table 2, the right-turn volumes were less than 25 percent of their respective through volumes. Therefore, the effect of right-turning traffic might be significant at intersections that had more pedestrians and higher right-turn percentages.
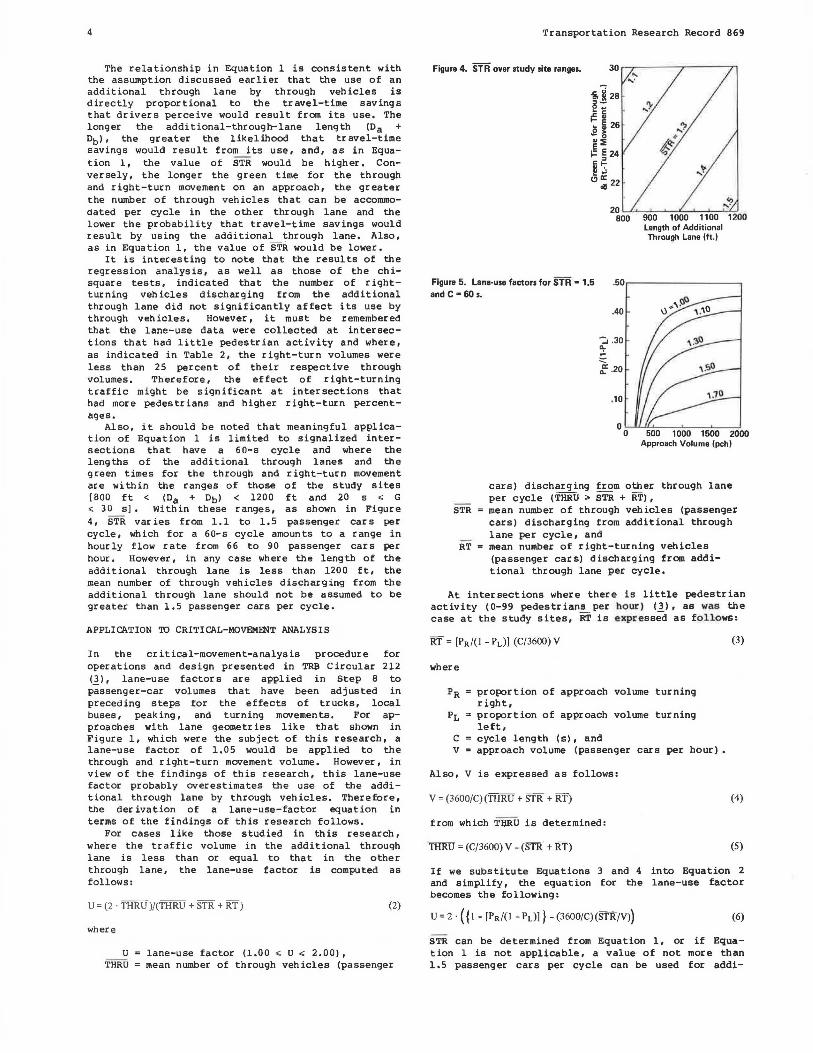
Also, it should be noted that meaningful application of Equation 1 is limited to signalized intersections that have a 60-s cycle and where the lengths of the additional through lanes and the green times for the through and right-turn movement are within the ranges of those of the study sites [BOO ft < (Da + Dbl < 1200 ft and 20 s .; G .;; 30 s]. Within these ranges, as shown in Figure 4, STR varies from 1.1 to 1.5 passenger cars per cycle, which for a 60-s cycle amounts to a range in hourly flow rate from 66 to 90 passenger cars per hour. However, in any case where the length of the additional through lane is less than 1200 ft, the mean number of through vehicles discharging from the additional through lane should not be assumed to be greater than 1.5 passenger cars per cycle.
APPLICATION '.£0 CRITICAL-MOVEMENT ANALYSIS
In the critical-movement-analysis procedure for operations and design presented in TRB Circular 212 <ll, lane-use factors are applied in Step B to passenger-car volumes that have been adjusted in preceding steps for the effects of trucks, local buses, peaking, and turning movements. For approaches with lane geometries like that shown in Figure 1, which were the subject of this research, a lane-use factor of 1.05 would be applied to the through and right-turn movement volume. However, in view of the findings of this research, this lane-use factor probably overestimates the use of the additional through lane by through vehicles. Therefore, the derivation of a lane-use-factor equation in terms of the findings of this research follows.
For cases like those studied in this research, where the traffic volume in the additional through lane is less than or equal to that in the other through lane, the lane-use factor is computed as follows:
U=(2 · THRU)/(THRU + STR +RT) (2)
where
U = lane-use factor (l.00 .; U .; 2.00), THRU mean number of through vehicles (passenger
Transportation Research Record 869
20L...L.._.....__._~__,~..._ .............. 800 900 1000 1 100 1 200
Length of Additional Through Lane (ft.)
Figure 5. lane·use factors for STA = 1.5 andC=60s.
.40
-:, .30
'.! ~ .20
.10
500 1000 1500 2000 Approach Volume (pch)
cars) discharging from other through lane per cycle (THRU > STR +RT),
STR mean number of through vehicles (passenger cars) discharging from additional through lane per cycle, and
RT mean number of right-turning vehicles (passenger cars) discharging from additional through lane per cycle.
At intersections where there is little pedestrian activity (0-99 pedestrians per hour) (3), as was the case at the study sites, RT is expressed as follows:
RT = (PR/(! - PL)] (C/3600) V (3)
where
PR proportion of approach volume turning right,
PL = proportion of approach volume turning left,
c cycle length (sl, and v approach volume (passenger cars per hour) •
Also, V is expressed as follows:
V = (3600/C) (THRU + STR + RT) (4)
from which THRU is determined:
THRU = (C/3600) V - (STR +RT) (5)
If we substitute Equations 3 and 4 into Equation 2 and simplify, the equation for the lane-use factor becomes the following:
U = 2 · ( {I - (PR/(! - PL)) } - (3600/C) (STR/V)) (6)
STR can be determined from Equation 1, or if Equation l is not applicable, a value of not more than 1.5 passenger cars per cycle can be used for addi-
Transportation Research Record 869
tional through lanes of less than 1200 ft. A plot of Equation 6 is shown in Figure 5 for a
6 0-s cycle and an STR of 1. 5 passenger cars per cycle. This illustrates that the lane-use factor of l.05, which is given in TRB Circular 212 (3), is appropriate for approaches with additional through lanes only when the percentage of right turns is relatively high. When the percentage is not high, Equation 6 should be used to avoid overestimating the use of additional through lanes by through vehicles.
CONCLUSIONS
Based on the findings of th is research, the following conclusions were reached concerning the use of additional through lanes by through vehicles on signalized intersection approaches with lane geometries similar to that shown in Figure l:
1. The lane-use factors of the critical-movement-analysis procedure in TRB Circular 212 (3) generally overestimate the use of additional through lanes by through vehicles. Therefore, in using this capacity-analysis procedure to evaluate the operat ions and design of signalized intersections with additional through lanes similar to those studied in this research, lane-use factors computed by the method presented in th is paper should be used instead.
2. Length requirements for additional through lanes based on vehicle-storage considerations, such as those developed by Leisch (4), are too short to achieve an average use of the additional through lane by through vehicles of more than 1. 5 passenger cars per cycle.
3. Use of additional through lanes by through vehicles is a function of the total length of the lane and the green time provided for the through and right-turn movement on the approach. It is positively correlated with length and negatively correlated with green time.
4. Use of additional through lanes by through vehicles is independent of the right-turn volume on signalized intersection approaches where there is little pedestrian activity and on which the rightturn volume is less than 25 percent of the through volume
5. The numbers of through vehicles per fully utilized cycle that use an additional through lane fit a Poisson distribution
Al though the findings of this research were conclusive and consistent with those of Australian studies
5
(irll • they are applicable to a limited range of traffic, geometric, and signal-timing conditions. Therefore, there is a need for further research to study the use of additional through lanes over wider ranges of lane lengths, signal timings, and traffic volumes than was possible within the limited resources of this research. Also, further studies should be conducted in other urban areas, where drivers' attitudes toward the confrontations associated with the use of an additional through lane and their perceptions of delay might be different from those of the driver population in Lincoln, Nebraska.
ACKNOWLEDGIENT
This research was funded by the Engineering Research Center at the University of Nebraska-Lincoln. It was conducted with the cooperation of the City of Lincoln's Department of Transportation, which provided data and assistance pertinent to the selection of the study sites. Richard J. Haden, traffic engineer, was particularly helpful in that phase of research.
REFERENCES
1. E.B. Lieberman. Determining the Lateral Deployment of Traffic on an Approach to an Intersection. TRB, Transportation Research Reoord 772, 1980, pp. 1-5.
2. K.-L. Bang. Capacity of Transportation ll-28.
Swedish Capacity Manual--Part Signalized Intersections. Research Record 667, 1978,
3: TRB,
pp.
3. Interim Materials on Highway Capacity. TRB, Transportation Research Circular 212, Jan. 1980.
4. J.E. Leisch. Capacity Analysis Techniques for Design of Signalized Intersections. Public Roads, Vol. 34, No. 9, Aug. 1967.
5. Research Problem Statements. TRB, Transportation Research Circular 227, April 1981.
6. Australian Road Capacity Guide. Australian Road Research Board, Nunawading, Australia, Bull. 4, June 1968.
7. A.J. Miller. The Capacity of Signalized Intersections in Australia. Australian Road Research Board, Nunawading, Australia, Bull. 3, March 1968,
8. Highway Capacity Manual. HRB, Special Rept. 87, 1965.
Publication of this paper sponsored by Committee on Highway Capacity and Quality of Service.