Embed Size (px)
Citation preview
15th International Conference on Fluid Control, Measurements and Visualization 27-30 May 2019, Naples, Italy
Extended Abstract ID:210 1
Use of Acoustic Emission in combination with Machine Learning: recognition of gas-liquid mixing regime in stirred tanks
G. Forte1, 2*, M. Antonelli3, F. Alberini2, M.J.H. Simmons2, E.H. Stitt1
1 Johnson Matthey Technology Centre, Billingham, TS23 4LB, UK 2 School of Chemical Engineering, University of Birmingham, Edgbaston, B15 2TT, UK 3 Department of Civil and Industrial Engineering, University of Pisa, I-56126, Pisa, Italy.
*corresponding author: [email protected]
Abstract
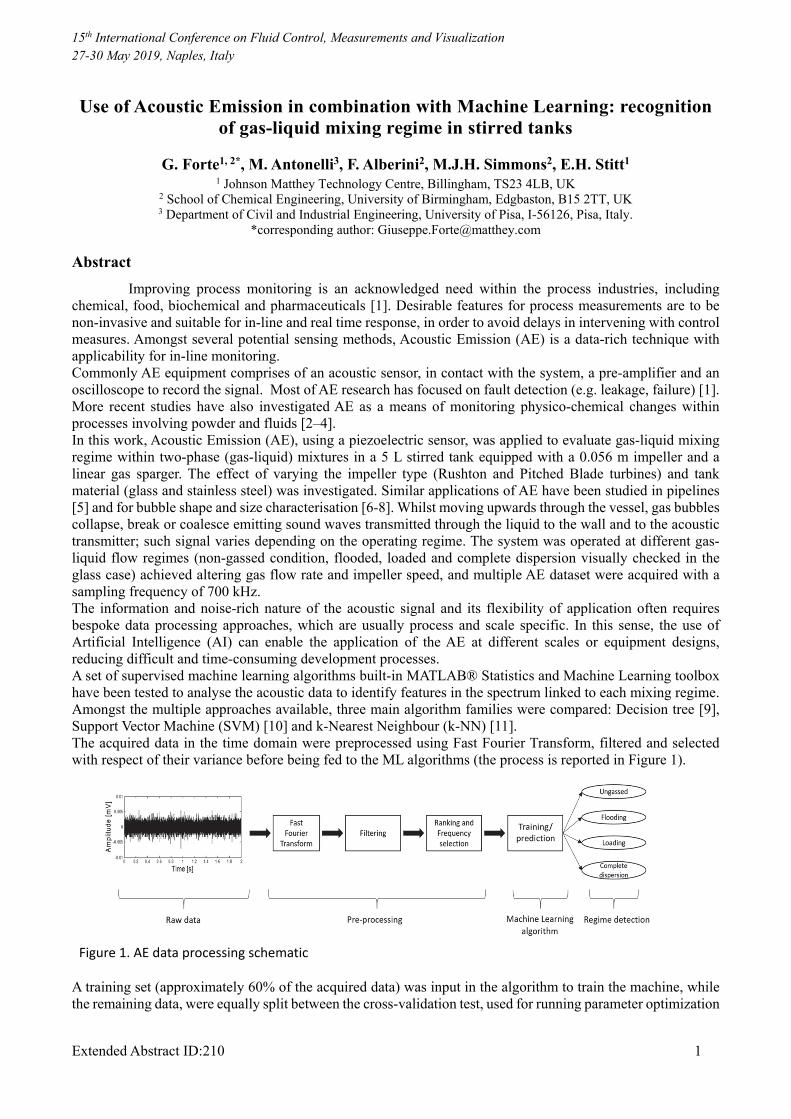
Improving process monitoring is an acknowledged need within the process industries, including chemical, food, biochemical and pharmaceuticals [1]. Desirable features for process measurements are to be non-invasive and suitable for in-line and real time response, in order to avoid delays in intervening with control measures. Amongst several potential sensing methods, Acoustic Emission (AE) is a data-rich technique with applicability for in-line monitoring. Commonly AE equipment comprises of an acoustic sensor, in contact with the system, a pre-amplifier and an oscilloscope to record the signal. Most of AE research has focused on fault detection (e.g. leakage, failure) [1]. More recent studies have also investigated AE as a means of monitoring physico-chemical changes within processes involving powder and fluids [2–4]. In this work, Acoustic Emission (AE), using a piezoelectric sensor, was applied to evaluate gas-liquid mixing regime within two-phase (gas-liquid) mixtures in a 5 L stirred tank equipped with a 0.056 m impeller and a linear gas sparger. The effect of varying the impeller type (Rushton and Pitched Blade turbines) and tank material (glass and stainless steel) was investigated. Similar applications of AE have been studied in pipelines [5] and for bubble shape and size characterisation [6-8]. Whilst moving upwards through the vessel, gas bubbles collapse, break or coalesce emitting sound waves transmitted through the liquid to the wall and to the acoustic transmitter; such signal varies depending on the operating regime. The system was operated at different gas-liquid flow regimes (non-gassed condition, flooded, loaded and complete dispersion visually checked in the glass case) achieved altering gas flow rate and impeller speed, and multiple AE dataset were acquired with a sampling frequency of 700 kHz. The information and noise-rich nature of the acoustic signal and its flexibility of application often requires bespoke data processing approaches, which are usually process and scale specific. In this sense, the use of Artificial Intelligence (AI) can enable the application of the AE at different scales or equipment designs, reducing difficult and time-consuming development processes. A set of supervised machine learning algorithms built-in MATLAB® Statistics and Machine Learning toolbox have been tested to analyse the acoustic data to identify features in the spectrum linked to each mixing regime. Amongst the multiple approaches available, three main algorithm families were compared: Decision tree [9], Support Vector Machine (SVM) [10] and k-Nearest Neighbour (k-NN) [11]. The acquired data in the time domain were preprocessed using Fast Fourier Transform, filtered and selected with respect of their variance before being fed to the ML algorithms (the process is reported in Figure 1).
Figure 1. AE data processing schematic A training set (approximately 60% of the acquired data) was input in the algorithm to train the machine, while the remaining data, were equally split between the cross-validation test, used for running parameter optimization
15th International Conference on Fluid Control, Measurements and Visualization 27-30 May 2019, Naples, Italy
Extended Abstract ID:210 2
and the test dataset, unseen by the machine, that was used to evaluate the final accuracy of the built model. A table reporting the global obtained accuracy for the used algorithms in the case of the Rushton Turbine for the three different materials (Glass, Aluminium and Stainless-steel) is reported below.
Table 1. Accuracy (%) for the different materials in the case of Rushton Turbine Algorithm/Material Glass Aluminium Stainless-steel Decision tree 90,33 94,42 97,83 SVM linear kernel 93 93 99,67 SVM quadratic kernel 96,17 99,08 99,67 SVM cubic kernel 95,58 98,42 99,75 k-NN cubic function 87 94 95,50 k-NN weighted function 86,83 92,92 95
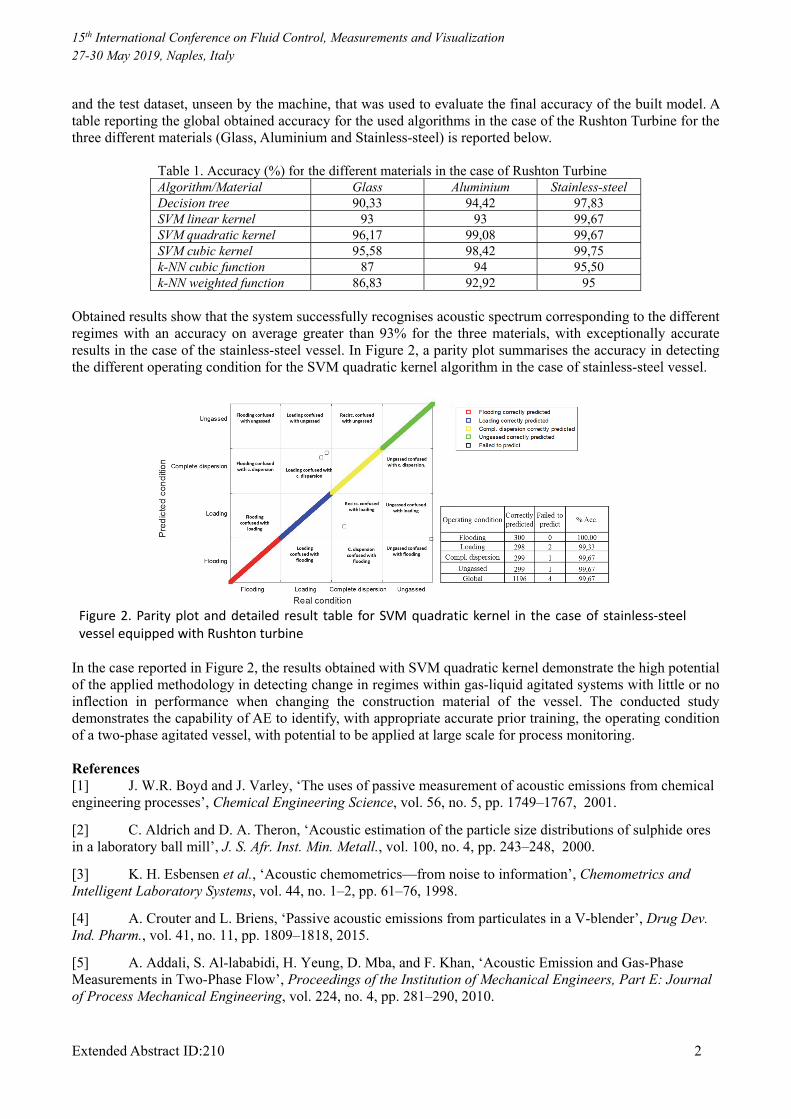
Obtained results show that the system successfully recognises acoustic spectrum corresponding to the different regimes with an accuracy on average greater than 93% for the three materials, with exceptionally accurate results in the case of the stainless-steel vessel. In Figure 2, a parity plot summarises the accuracy in detecting the different operating condition for the SVM quadratic kernel algorithm in the case of stainless-steel vessel.
Figure 2. Parity plot and detailed result table for SVM quadratic kernel in the case of stainless-steel vessel equipped with Rushton turbine
In the case reported in Figure 2, the results obtained with SVM quadratic kernel demonstrate the high potential of the applied methodology in detecting change in regimes within gas-liquid agitated systems with little or no inflection in performance when changing the construction material of the vessel. The conducted study demonstrates the capability of AE to identify, with appropriate accurate prior training, the operating condition of a two-phase agitated vessel, with potential to be applied at large scale for process monitoring. References [1] J. W.R. Boyd and J. Varley, ‘The uses of passive measurement of acoustic emissions from chemical engineering processes’, Chemical Engineering Science, vol. 56, no. 5, pp. 1749–1767, 2001.
[2] C. Aldrich and D. A. Theron, ‘Acoustic estimation of the particle size distributions of sulphide ores in a laboratory ball mill’, J. S. Afr. Inst. Min. Metall., vol. 100, no. 4, pp. 243–248, 2000.
[3] K. H. Esbensen et al., ‘Acoustic chemometrics—from noise to information’, Chemometrics and Intelligent Laboratory Systems, vol. 44, no. 1–2, pp. 61–76, 1998.
[4] A. Crouter and L. Briens, ‘Passive acoustic emissions from particulates in a V-blender’, Drug Dev. Ind. Pharm., vol. 41, no. 11, pp. 1809–1818, 2015.
[5] A. Addali, S. Al-lababidi, H. Yeung, D. Mba, and F. Khan, ‘Acoustic Emission and Gas-Phase Measurements in Two-Phase Flow’, Proceedings of the Institution of Mechanical Engineers, Part E: Journal of Process Mechanical Engineering, vol. 224, no. 4, pp. 281–290, 2010.

15th International Conference on Fluid Control, Measurements and Visualization 27-30 May 2019, Naples, Italy
Extended Abstract ID:210 3
[6] T. G. Leighton, ‘The acoustic bubble’, 1994 (Academic Press, London). [7] R. Manasseh, ‘Acoustic sizing of bubbles at moderate to high bubbling rates’, In Proc.4th World Conference on Experimental heat transfer, fluid mechanics and thermodynamics, Bruxelles, Belgium, pp. 943–947, 1997. [8] W. A. Al-Masry, E. M. Ali and Y. M. Aqeel, ‘Determination of bubble characteristics in bubble columns using statistical analysis of acoustic sound measurements’, Inst. Chem. Eng., vol. 83 no. A10, pp. 1196–1207, 2005. [9] J. R. Quinlan, ‘Induction of decision trees’, Machine learning, vol. 1 no.1, pp. 81-106, Mar 1986. [10] S. Warfield, ‘Fast k-NN classification for multichannel image data’, Pattern Recognition Letters, vol 17, no. 7, pp.713-721, 1996. [11] T.M. Cover, P.E. Hart, P.E. ‘Nearest neighbor pattern classification’, IEEE Trans. Inform. Theory, vol. 13, no. 1, pp. 21–27, 1967.


![SENTRO - Acoustic Emission Presentation [2016]](https://img.pdfslide.us/doc/110x75/5875c8511a28ab33128b6abf/sentro-acoustic-emission-presentation-2016.jpg)