Embed Size (px)
Citation preview

USE OF A REGIONAL GROUNDWATER MODEL FOR SOURCE WATER
ASSESSMENT AND PROTECTION
SUFFOLK COUNTY, LONG ISLAND, NY
Steven R. Colabufo Water Resources ManagerSuffolk County Water Authority, Oakdale, NY

SCWA GENERAL INFORMATION
Location: Suffolk County, Long Island, NY
Largest Supplier on Long Island (2nd largest in N. Y.)
SCWA serves approx. 1.3 million people
2014 Avg. Day = 202 million gallons
2014 Peak Day = 459 million gallons
2014 Annual Total = 74 BILLION gallons

Location of SCWA Well FieldsLocal supply, Local distribution
586 Active Wells
237 Well Fields
64 Storage Tanks
Wells range from 50 ft. to 850 ft. deep
50 gpm to 2400 gpm

Local supply, local distribution
Steve’s house
SCWA well fields

Local supply, local distribution

L. I. Aquifer system cross sectionfrom USGS Atlas
Magothy aquifer
Bedrock
Upper Glacial aquifer
North shore South Shore
3 principal aquifers: unconsolidated sand and gravel
Estimated 70 trillion gallons stored within Suffolk County’s aquifers
All groundwater derived from precipitation – no other sources
Designated a Sole source aquifer – EPA - 1978

Water table elevation and groundwater flow – upper glacial aquifer

Long Island Groundwater Divide
Groundwater divide

Cross Section - groundwater flow
through the L. I. aquifer system
GW Divide

Early Attempts at Source Water Delineation
Flat water table - Simplest case
Groundwater influenced =
Groundwater captured
Zone of Influence

Sloping water table
(more realistic)
Groundwater influenced
is NOT equal to
Groundwater captured
Contributing Area OR
Zone of Capture
Early Attempts at Source Water Delineation
REALITY: Source areas and flow paths
shallow v. deep wells

DELINEATING THE SOURCE AREAS FOR
LONG ISLAND WELLS
• REALIZATION - Simple Shapes Don’t Work: • radius around well OR
• Parabola based on flow rate
NEED A GROUNDWATER MODEL TO ACCOUNT FOR
ALL VARIABLES: Pumpage, Geology, Recharge, Etc.

B.N.L.
SUFFOLK COUNTY GROUNDWATER MODEL
Developed between 1996 and 2002
CDM Smith consultant
SCWA, SCDHS cooperators
Dynflow software
Model Layers

Simulating groundwater flow
Brookhaven Nat’l Lab
SCWA Lambert
Ave. wells
(Magothy)
SCWA Country Club
Drive wells (glacial)
Carmans
River

Modeling groundwater flowvertical view
SCWA Lambert
Ave. wells
(Magothy)

Modeling groundwater flowvertical view
SCWA Country Club
Drive wells (glacial)

SOURCE WATER ASSESSMENT PROGRAM (S W A P)
2002 - 2003
• Utilized Suffolk County Groundwater Model to delineate Source Areas to public supply wells
• Assumed simultaneous, annualized avg. pumping of all wells
• Maps of contributing areas were then provided for every Public Supply Well in Nassau and Suffolk (1300 + wells)

SUBGRIDS for better detail over smaller areas
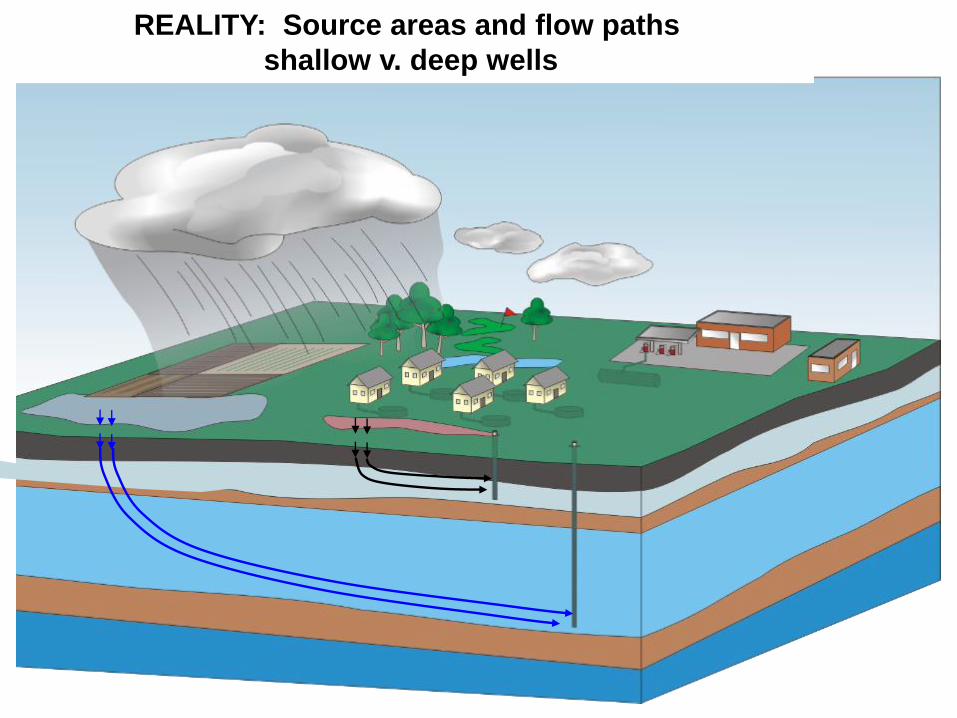
Lincoln Ave. well no. 1 contributing area
Macarthur
Airport
5 year contr. area
25 year contr. area
Land uses within cont. area

Lincoln Ave. #2 and #3 contributing areas

Lincoln Ave. well field – all 3 wells
#1
#3
#2

Source Water Assessment: Case Studies

Source Water Assessment Study using GIS data:
Nitrates in local wells vs. historical land use
2013Greenlawn WD well:
Nitrates < 1 ppm
Nitrates > 10 ppm
100 yr. capture zone for
All wells at S. Spur Dr.

1947
Greenlawn WD well
Source Water Assessment Study using GIS data:
Nitrates in local wells vs. historical land use

19471962
Greenlawn WD well
Source Water Assessment Study using GIS data:
Nitrates in local wells vs. historical land use

Oxhead Rd.
Mud Rd.
Sherry Dr.
Oak St. – GAC, Nitr. = 7 ppm
Belle Terre Rd
Jayne
Blvd
Henry Clay Dr.
Dan. Webster Dr.
Regional analysis: 100 yr. contributing areas – multiple
well fields

Preventing water quality problems before they start:
Lakeview Avenue, Bayport
SCWA well field
Parcel to be
developed

SWAP Map
Lakeview Avenue well field
Parcel to be developed
Contributing Area
for shallow wells

Site Plan – Lakeview Ave.
STP located
outside contrib.
Area of glacial
wells
Apt. Bldg
Apt. Bldg.
Apt.Bldg.
Apt.
Bldg.
S.T. P.

Lakeview Ave. well field and Apt. complexas constructed
STP
New well #6 (Magothy)
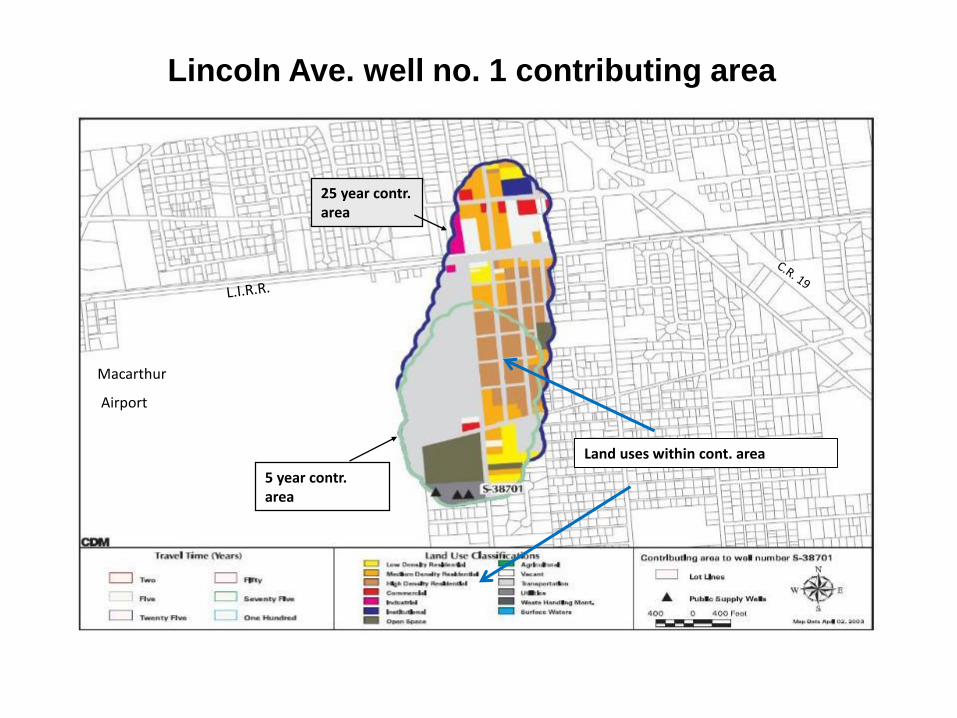
SUMMARY
• Regional groundwater models were developed in the past 20
years to accurately determine groundwater flow in Nassau and
Suffolk Counties under real world conditions
• This model was utilized to determine the source areas to every
Public supply well in Nassau and Suffolk Counties, and
• Focus preservation or remediation efforts for maximum benefit
to public water supply
• Model continues to be used to determine the potential impacts
for a variety of land use and management decisions

THE END
?
?
?
?