Embed Size (px)
Citation preview

University of Tennessee, Knoxville University of Tennessee, Knoxville
TRACE: Tennessee Research and Creative TRACE: Tennessee Research and Creative
Exchange Exchange
Masters Theses Graduate School
12-2010
Use of a Press-Fit Grip Sleeve for Cable-In-Conduit Use of a Press-Fit Grip Sleeve for Cable-In-Conduit
Superconductor Integration: Effects of Tensile and Fatigue Superconductor Integration: Effects of Tensile and Fatigue
Loading Loading
Paul Michael Hayes University of Tennessee - Knoxville, [email protected]
Follow this and additional works at: https://trace.tennessee.edu/utk_gradthes
Part of the Applied Mechanics Commons, and the Other Mechanical Engineering Commons
Recommended Citation Recommended Citation Hayes, Paul Michael, "Use of a Press-Fit Grip Sleeve for Cable-In-Conduit Superconductor Integration: Effects of Tensile and Fatigue Loading. " Master's Thesis, University of Tennessee, 2010. https://trace.tennessee.edu/utk_gradthes/806
This Thesis is brought to you for free and open access by the Graduate School at TRACE: Tennessee Research and Creative Exchange. It has been accepted for inclusion in Masters Theses by an authorized administrator of TRACE: Tennessee Research and Creative Exchange. For more information, please contact [email protected].

To the Graduate Council:
I am submitting herewith a thesis written by Paul Michael Hayes entitled "Use of a Press-Fit Grip
Sleeve for Cable-In-Conduit Superconductor Integration: Effects of Tensile and Fatigue Loading."
I have examined the final electronic copy of this thesis for form and content and recommend
that it be accepted in partial fulfillment of the requirements for the degree of Master of Science,
with a major in Mechanical Engineering.
Madhu S. Madhukar, Major Professor
We have read this thesis and recommend its acceptance:
Don W. Dareing, John D. Landes
Accepted for the Council:
Carolyn R. Hodges
Vice Provost and Dean of the Graduate School
(Original signatures are on file with official student records.)

To the Graduate Council:
I am submitting herewith a thesis written by Paul Michael Hayes entitled “Use of a Press-
Fit Grip Sleeve for Cable-In-Conduit Superconductor Integration: Effects of Tensile and
Fatigue Loading.” I have examined the final electronic copy of this thesis for form and
content and recommend that it be accepted in partial fulfillment of the requirements for
the degree of Master of Science, with a major in Mechanical Engineering.
Madhu S. Madhukar, Major Professor
We have read this thesis
and recommend its acceptance:
Don W. Dareing
John D. Landes
Accepted for the Council:
Carolyn R. Hodges
Vice Provost and Dean of the Graduate School
(Original signatures are on file with official student records.)

Use of a Press-Fit Grip Sleeve for Cable-In-Conduit
Superconductor Integration: Effects of Tensile and Fatigue
Loading
A Thesis Presented for the
Master of Science Degree
The University of Tennessee, Knoxville
Paul Michael Hayes
December 2010

Copyright © 2010 by Paul Michael Hayes
All rights reserved.
ii

ABSTRACT
Presently, one of the most promising sources for a future of abundant, low-
emission, and efficient energy comes in the form of nuclear fusion. However, in order for
it to become a reality, fusion technology must overcome the obstacle of plasma
confinement. Utilizing the tokomak based design for magnetic plasma confinement;
ITER is currently developing a fusion reactor to prove its commercial viability.
The purpose of this research was to determine the feasibility of pulling
superconducting cable with a press-fit grip sleeve that utilizes friction to generate a
gripping force. Such a design is being considered by ITER to integrate (join) 800 m long
sections of superconducting cable and conduit for use in toroidal field plasma
confinement coil construction. In order to see if friction alone had the potential to
withstand the required pulling load, eight grip sleeve samples were subjected to
monotonic tensile loading until failure (sleeve slippage) occurred. It was also important
that the grip could withstand the variable loading that will likely occur during the pulling
process due to friction between the cable and conduit. Therefore, a period of cyclic
loading, prior to tensile loading, was incorporated into the testing regimen. Based on the
results of each experiment, additional modifications were made until the sleeve’s
gripping strength exceeded that of the weld joint used in the design, meaning the physical
limitations of the grip sleeve had been reached. Once the design was optimized,
additional samples were tested under identical conditions to establish repeatability. In
addition, Finite Element Analysis was used to obtain better insight into the deformation
behavior of the cable.
Based on the findings of this research, it was determined that a 300 mm long
press-fit sleeve with a 25.4 mm long reinforcement grip ring is capable of supporting a
116 kN (26,000 lbf) to 126.5 kN (28,500 lbf) tensile load, with little to no adverse effects
from fatigue testing. Since this value exceeds the 8,000 lbf load used by a Russian team
to perform this same task, it can be concluded that the press-fit grip design is capable of
performing the required cable pull with a generous safety factor.
iii

TABLE OF CONTENTS
Chapter Page
1. Introduction....................................................................................................................1
1.1. Energy Crisis...........................................................................................................1
1.2. Nuclear Power.........................................................................................................2
1.2.1. ITER............................................................................................................3
1.3. Magnetic Confinement of Plasma...........................................................................4
1.4. Construction of Toroidal Field Magnetic Coils......................................................6
1.4.1. Why an 800 meter Cable Pull?...................................................................9
1.5. Modeling Toroidal Field Conductor as Wire Rope..............................................10
1.6. Methods of Cable Termination.............................................................................12
1.6.1. Cable Pull Requirements...........................................................................21
2. Review of Literature....................................................................................................23
2.1. Overview...............................................................................................................23
2.2. Mechanics of Wire Rope......................................................................................23
2.2.1. Wire and Strand Lay Variations...............................................................24
2.2.1. End Supports of Twisted Rope and Torque..............................................27
2.2.2. Influence of Wire and Strand Lay on Torque...........................................28
2.2.3. Torque Balanced Rope..............................................................................29
2.3. Press Fit Analysis..................................................................................................30
2.3.1. Stick Slip Condition..................................................................................31
2.4. Related Studies......................................................................................................31
3. Methodology.................................................................................................................33
3.1. Overview...............................................................................................................33
3.2. Experimental Testing............................................................................................33
3.2.1. Test Sample Materials...............................................................................34
3.2.2. Types of Test samples...............................................................................35
3.2.3. Sample Construction and Preparation.......................................................36
3.2.4. Method of Attachment to Test Fixture......................................................43
3.2.5. Testing Descriptions.................................................................................44
3.3. Finite Element Analysis............................................................................................45
3.3.1. Geometric Modifications..........................................................................46
3.3.2. Solver Settings..........................................................................................50
4. Results and Discussion.................................................................................................52
4.1. Experimental Test Results....................................................................................52
4.1.1. Preliminary Tests......................................................................................52
4.1.2. Full Scale Testing.....................................................................................63
4.1.3. Modified Grip Design...............................................................................85
4.1.4. Fatigue Testing........................................................................................100
4.2. Finite Element Analysis Results.........................................................................120
iv

4.3. Welding Metallurgy Results...............................................................................120
5. Conclusions and Recommendations.........................................................................122
5.1. Conclusions.........................................................................................................122
5.2. Recommendations...............................................................................................123
References.......................................................................................................................124
Appendix.........................................................................................................................130
v

LIST OF FIGURES
Figure Page
1.1 Conceptual cutaway view of the ITER tokomak.....................................................4
1.2 Schematic of the current and magnetic fields within a tokomak.............................5
1.3 Rendering of the ITER tokomak highlighting the key components
of the magnet system...............................................................................................6
1.4 Rendering of Toroidal Field Coil design.................................................................7
1.5 Assembled cable-in-conduit conductor....................................................................8
1.6 Cross section of TF coil to show the layering strategy of the cable windings.........8
1.7 Illustration of problem statement.............................................................................9
1.8 Proposed TF cable-in-conduit integration site at airport in Florida.......................10
1.9 Schematic illustrating wire rope construction........................................................11
1.10 Schematic illustrating superconducting cable construction...................................11
1.11 Loop termination with ferrule................................................................................13
1.12 Eye splice rope termination...................................................................................13
1.13 Loop termination with wire rope clips...................................................................14
1.14 Schematic of wedge socket termination................................................................15
1.15 Installation of Lace-up grip....................................................................................16
1.16 Rendering of various spelter socket designs..........................................................16
1.17 Stages of assembly of dry spelter socket termination............................................17
1.18 Rendering of non-swage fitting.............................................................................18
1.19 Stages of assembly of non-swage end fitting.........................................................19
1.20 Grip sleeve and cable prior to swaging..................................................................20
1.21 Grip sleeve and cable after swaging......................................................................20
1.22 Rendering of loop socket auxiliary coupling.........................................................21
1.23 Rendering of tensile Lug auxiliary coupling.........................................................21
2.1. Wire rope featuring Left hand Lay strand orientation...........................................24
2.2. Wire rope featuring Right hand lay strand orientation..........................................24
2.3. Comparison of the most common wire and strand lay combinations....................25
vi

2.4. Illustration of strand length measurement of a wire rope......................................25
2.5. Forces acting on straight lay rope under tensile load.............................................26
2.6. Force decomposition of straight laid wire rope.....................................................26
2.7. Forces acting on helically laid rope under tensile load..........................................27
2.8. Force decomposition of helically laid wire rope....................................................27
2.9. Cross-section of Single Layer Rope......................................................................29
2.10. Cross-section of Two Layer Rope.........................................................................29
2.11. Schematic of rope layer cross sections to illustrate torque balancing…………...30
2.12. Schematic of a press fit grip illustrating interference and contact pressure..........31
3.1 Cross-section of conductor showing its 6 strand single layer construction...........34
3.2 Side view of conductor showing its right laid Lang lay wire orientation..............34
3.3 Rendering of full scale TF sample configuration..................................................36
3.4 Proposed grip sleeve design with tensile lug.........................................................37
3.5 Actual pre-crimped grip sleeve with tensile lug....................................................37
3.6 Pre-crimped grip sleeve compared to nominal cable diameter..............................38
3.7 Hose clamps positioned around cut to prevent unwinding....................................38
3.8 Insertion of solid rod into core tube of TF cable...................................................39
3.9 Grip sleeve positioned on TF cable prior to compaction.......................................39
3.10 Val Power material crimping machine used during test sample fabrication.........40
3.11 Initial stages of TF grip sleeve compaction...........................................................40
3.12 Jaws of crimping machine fully compressed around grip sleeve..........................41
3.13 Grip sleeve exiting from crimping machine..........................................................41
3.14 Fully assembled full scale TF pull test sample......................................................42
3.15 Work hardened region on pre-crimped sleeve.......................................................43
3.16 Bottom view of threaded tensile lug......................................................................44
3.17 Side view of threaded tensile lug...........................................................................44
3.18 Contact area of circular strands with circular grip sleeve......................................47
3.19 Contact area of octagonal strands with dodecagon grip sleeve.............................47
3.20 Displacement of square sleeve and strands subjected to tensile loading...............48
3.21 Displacement of octagonal sleeve and strands subjected to tensile loading..........48
vii
3.22 Cross-section of FEA model showing single layer 6 strand
construction with octagonal strands and dodecagonal core and sleeve.................49
3.23 FEA model without grip sleeve to show combination of coiled
and straight strand geometry..................................................................................50
4.1 Equipment Setup for Preliminary Pull Tests.........................................................52
4.2a TF – WC1 Schematic.............................................................................................53
4.2b TF – WC1 cross-section.........................................................................................53
4.3a TF-WOC1 Schematic.............................................................................................54
4.3b TF-WOC1 Cross section........................................................................................54
4.4 Threaded stud connected to tensile lug..................................................................55
4.5 Extensometer set-up used in preliminary testing...................................................55
4.6 Axial Force vs. Displacement for TF-WOC1 and TF-WC1..................................56
4.7 Axial Force vs. Time for TF-WOC1 and TF-WC1...............................................57
4.8 TF-WC1 grip sleeve position before testing..........................................................58
4.9 TF-WC1 grip sleeve position after testing.............................................................58
4.10 TF-WOC1 grip sleeve position before testing.......................................................59
4.11 TF-WOC1 grip sleeve position after testing..........................................................59
4.12 Axial Strain for TF-WC1 and TF-WOC1 measured by extensometer..................60
4.13 TF – WOC1 Copper Cable Exposure from grip sleeve slippage...........................61
4.14 TF-WC1 Copper Cable Exposure from grip sleeve slippage................................61
4.15 Indentions of cable strands on grip sleeve due to contact pressure.......................62
4.16 Base component of static coupling attached to hydraulic actuator........................64
4.17 All-thread rod to mate test sample and fixture.......................................................64
4.18 Fully assembled static coupling mounted to hydraulic actuator............................65
4.19 Main anchor component for upper dynamic coupling...........................................66
4.20 Hemispherical nut for upper sample support.........................................................66
4.21 Unthreaded attachment rod to join sample and test fixture...................................67
4.22 Assembled upper sample attachment rod..............................................................67
4.23 Assembled dynamic coupling to illustrate attachment rod clearance....................68
4.24 Fully assembled dynamic coupling installed on cross head..................................68
4.25 Contrasting colored band to indicate sleeve slippage............................................69
viii

4.26 Dynamic coupling connected to upper tensile lug.................................................70
4.27 Test specimen mounted to fixture’s cross head.....................................................70
4.28 All-thread rod installed in lower tensile lug..........................................................71
4.29 All-thread rod contacting lower coupling..............................................................72
4.30 Test specimen mounted to fixture’s hydraulic actuator.........................................72
4.31 TF-WC2-FS mounted to Interlaken testing machine.............................................73
4.32 Vertical markings to monitor displacement due to rotation...................................74
4.33 Schematic of TF-WOC1 specimen........................................................................75
4.34 Schematic of TF-WC2-FS specimen.....................................................................75
4.35 Comparison of axial force vs. time for TF-WOC1 and TF-WC2-FS....................76
4.36 Comparison of axial force vs. displacement for TF-WOC1 and TF-WC2-FS......76
4.37 Indention of cable strands on inner surface of TF-WOC1 grip sleeve
without the protective foil – This sample did have sub-cable foil on it.................78
4.38 Conductor cable showing sub-cable foil wrap.......................................................79
4.39 Indention of cable strands on inner surface of TF-WC2 grip sleeve
with the protective foil – This sample also had sub-cable foil on it......................79
4.40 Dimensions of TF-WC2-FS upper grip sleeve before pull test.............................80
4.41 Dimensions of TF-WC2-FS upper grip sleeve after pull test................................80
4.42 Dimensions of TF-WC2-FS lower grip sleeve before pull test.............................80
4.43 Dimensions of TF-WC2-FS lower grip sleeve after pull test................................80
4.44 First occurrence of stick-slip mechanism for TF-WC2-FS....................................82
4.45 Second occurrence of stick-slip mechanism for TF-WC2-FS...............................82
4.46 Third occurrence of stick-slip mechanism for TF-WC2-FS..................................83
4.47 Fourth occurrence of stick-slip mechanism for TF-WC2-FS................................83
4.48 Close-up of fourth occurrence of stick-slip for TF-WC2-FS to show
constant magnitude of oscillation..........................................................................84
4.49 Wrap end of cable with tape to prevent foil from unwrapping..............................86
4.50 Slide uncompacted sleeve over end of cable.........................................................86
4.51 Reference lines marked to indicate where to cut foil.............................................86
4.52 Protective foil being removed, revealing sub-cable foil........................................86
4.53 End of cable with foil removed showing 0.5” foil band for grip sleeve overlap...87
ix
4.54 Schematic of modified TF grip sleeve design........................................................88
4.55 Reinforcement grip rings prior to install................................................................89
4.56 Uncompacted grip ring compared to partially compacted sleeve..........................89
4.57 Grip ring positioned on compacted grip sleeve.....................................................89
4.58 Grip ring taped in place in preparation for swaging..............................................89
4.59 Reinforcement grip ring after compaction around grip sleeve..............................89
4.60 Smooth grip sleeve surface due to incremental compaction..................................90
4.61 Deformed grip sleeve surface due to compaction in one step...............................90
4.62 Single accent band for samples without reinforcement grip ring..........................91
4.63 Double accent band for samples with reinforcement grip ring..............................91
4.64 Tensile lug flush with lower coupling to prevent rotation.....................................92
4.65 Reference lines to monitor specimen rotation.......................................................92
4.66 Comparison of axial force vs. time for TF-WC2-FS, TF-WC3-FS,
and TF-WC4-FS.....................................................................................................93
4.67 Comparison of axial force vs. displacement for TF-WC2-FS,
TF-WC3-FS, and TF-WC4-FS..............................................................................93
4.68 Grip sleeve failure due to sleeve slippage..............................................................96
4.69 Grip sleeve failure due to seam weld fracture.......................................................96
4.70 Grip sleeve failure due to seam weld fracture.......................................................96
4.71 First occurrence of stick-slip mechanism..............................................................97
4.72 Second occurrence of stick-slip mechanism..........................................................97
4.73 Load drop due to sample rotation..........................................................................99
4.74 Sample rotation responsible for load drop with respect to fixed coupling..........100
4.75 Jam nut installed against upper tensile lug to prevent rotation............................101
4.76 Lower tensile lug tightened flush with coupling to prevent rotation...................101
4.77 Reference marks to monitor sample rotation.......................................................102
4.78 Initial 100 sec. interval of TF-WC5-FS fatigue test............................................104
4.79 Intermediate 100 sec. interval of TF-WC5-FS fatigue test..................................104
4.80 Final 100 sec. interval of TF-WC5-FS fatigue test..............................................105
4.81 Initial 100 sec. interval of TF-WC6-FS fatigue test............................................105
4.82 Intermediate 100 sec. interval of TF-WC6-FS fatigue test..................................106
x

4.83 Final 100 sec. interval of TF-WC6-FS fatigue test..............................................106
4.84 Initial 100 sec. interval of TF-WC7-FS fatigue test............................................107
4.85 Intermediate 100 sec. interval of TF-WC7-FS fatigue test..................................107
4.86 Final 100 sec. interval of TF-WC7-FS fatigue test..............................................108
4.87 TF-WC5-FS displacement increase with increasing time/# cycles.....................109
4.88 TF-WC6-FS displacement increase with increasing time/# cycles.....................109
4.89 TF-WC7-FS displacement increase with increasing time/# cycles.....................110
4.90 Gap between accent bands after fatigue testing...................................................111
4.91 Gap between accent bands after fatigue testing...................................................111
4.92 Axial force vs. time for TF-WC4, TF-WC5, TF-WC6, and TF-WC7.................112
4.93 Axial force vs. displacement for TF-WC4, TF-WC5, TF-WC6, and TF-WC7...112
4.94 Rotation of foil wrap on TF-WC5-FS sample.....................................................114
4.95 Rotation of foil wrap on TF-WC6-FS sample.....................................................114
4.96 Rotation of foil wrap on TF-WC7-FS sample.....................................................114
4.97 Folding of foil wrap due to cable rotation...........................................................115
4.98 Folding of foil wrap due to cable rotation...........................................................115
4.99 Lack of foil wrap folding due to lack of cable rotation.......................................115
4.100 TF-WC4-FS seam weld fracture..........................................................................116
4.101 TF-WC4-FS seam weld fracture..........................................................................116
4.102 TF-WC6-FS seam weld fracture..........................................................................116
4.103 TF-WC6-FS seam weld fracture..........................................................................116
4.104 TF-WC7-FS seam weld fracture..........................................................................117
4.105 TF-WC7-FS seam weld fracture..........................................................................117
4.106 Comparison of stick slip experienced by TF-WC4, TF-WC5,
TF-WC6, and TF- WC7.......................................................................................119
4.107 Seam weld fracture showing 45° angle of fracture face......................................121
xi

Chapter 1
Introduction
1.1. Energy Crisis
Since the beginning of time, humans have learned to convert energy from forms
that are less desirable to those that are better suited to meet their current needs (i.e. from
wood to heat and from fossil fuels to electricity). As the world continues to become more
technologically advanced, energy consumption continues to increase, and we are
beginning to run out of ways to convert the forms of energy we possess to keep up with
the demand. In 2008, worldwide energy consumption reached an all time high, with 85%
derived from the combustion of fossil fuels [1]. While this reliance on fossil fuels has
proven to be beneficial in years past due to its abundance, ease of conversion, and
relatively low cost, today‟s massive demand for energy is causing a variety of other
problems that are making fossil fuels less attractive. As a nonrenewable resource, fossil
fuels require millions of years to develop under extreme conditions. Since we are using
them at a faster rate than they can be replenished, we will quickly run out at the given
rate of consumption, and once they are gone, they can no longer be part of our energy
mix. Additionally, fossil fuels have a major environmental impact. The combustion of
fossil fuels can be blamed for more than 80% of the greenhouse gas emissions, and when
used in such large quantities, has led to other problems such as global warming [2].
While the use of fossil fuels has historically been very beneficial, the fact that they are
non-renewable and have many adverse environmental affects has forced us to turn
elsewhere as we look towards the future of energy. For the next few decades, there are
only a few realistic solutions to the current energy crisis. These include:
Increasing efficiency in power generation and use
Expanding the use of renewable energy sources such as wind, solar, biomass,
and geothermal
Increasing the use of nuclear power
For the purposes of this thesis, we will be focusing on the latter; increasing the use of
nuclear power.
1

1.2. Nuclear Power
Presently, the most viable solution for an abundant, low-emission, and efficient
source of energy comes in the form of nuclear power. In addition to being a more
environmentally benign source of energy, nuclear power promises long term energy
production using less fuel due to its large energy density as compared to that of
conventional fossil fuels. This nuclear reaction can take on two forms (fission and
fusion), which differ based on the products of the reaction.
The process that is currently being used by nuclear power plants is called fission.
Nuclear Fission refers to the splitting of a large atom into two or more smaller fragments
by striking it with a neutron. During this process, neutrons are released at high speed, and
large amounts of heat and radiation are generated. The benefit of fission over the
combustion of fossil fuels is that the energy released by fission is a million times greater
than that released in chemical reactions [8]. Compared to the electricity generated by
burning fossil fuels, nuclear energy is also clean. No air pollution or carbon dioxide is created
by nuclear power plants, but there are many sources of radioactive waste in the fission cycle,
and the problem of waste disposal is yet to be solved. Fission reactors also carry the danger
of a nuclear accident, where run-away reactors and meltdowns are a reality.
The alternative to fission is nuclear fusion. Nuclear fusion refers to the
combining, or fusing of two or more light atomic nuclei into a heavier nucleus with a
resultant loss in the combined mass and a massive release of energy. The use of nuclear
fusion offers many advantages over both fission and the combustion of fossil fuels; the
main one being its energy density. The energy released by fusion is three to four times
greater than the energy released by fission, and about four million times more energetic
than a chemical reaction such as the burning of coal, oil or gas [8]. Another key feature of
fusion that makes it an attractive option as part of a future energy mix is that fusion fuels
are abundantly available and inherently safe. Only tiny amounts of Deuterium and
Tritium are necessary to fuel the fusion reaction, and both are readily available on Earth.
Deuterium is found in water and Tritium can be bred on site using a Lithium reaction.
Additionally, fusion emits no pollution or greenhouse gases. Its major by-product is
Helium: an inert, non-toxic gas. Finally, there is no possibility of a run-away reaction
2

because the conditions for fusion are precise; any deviation from these conditions and the
plasma cools within seconds and the reaction stops [5].
Despite its many advantages, fusion technology must overcome several obstacles
before it can become a viable energy source; the main one being the confinement of the
plasma. Plasma generation in a fusion reaction requires temperatures in excess of 100
million °C and no current construction material can withstand this heat. Naturally
occurring fusion in the heart of stars is contained by the gravity of their enormous mass,
but the gravitational forces of our universe can not be recreated here on Earth. Without
the mass required to obtain a high gravitational field, fusion on earth must be controlled
by some means other than gravity [4]. Therefore, the success of fusion energy on Earth
depends on the development of an effective plasma containment device.
1.2.1. ITER
Headquartered in Cadarache, France, the ITER program is an international joint
venture between seven nations (China, Europe, India, Japan, the Republic of Korea, the
Russian Federation, and the USA) that aims to demonstrate the feasibility of fusion
power for commercial energy purposes. The ITER program is based on the tokomak
concept for magnetic confinement in which plasma is contained in a doughnut shaped
vacuum vessel. The fuel, a mixture of Deuterium and Tritium, is heated to temperatures
in excess of 150 million °C (ten times the temperature at the core of the sun), forming a
hot plasma. Strong magnetic fields produced by superconducting coils surrounding the
vessel and an electrical current driven through the plasma itself are used to keep the
plasma away from the walls [7].
Though other attempts have been made to harness fusion energy in the past, no
one has successfully met or exceeded the critical breakeven point with plasma. The
plasma energy breakeven point describes the condition when plasma in a fusion device
releases at least as much energy as is required to produce it. Fusion performance is
measured by Plasma Power Amplification (Q), which is the ratio of fusion power output
to power input. Plasma energy breakeven or Q = 1, has never been achieved: the current
record for energy release is held by the Joint European Torus (JET), which succeeded in
3

generating 70% of its input power [6]. The goal of the ITER fusion program is to be the
first of all fusion experiments to produce a net gain of energy, and set the stage for the
demonstration fusion power plant (DEMO) to come. Scientists have designed the ITER
device to produce 500 MW of output power from 50 MW of input power, or ten times the
amount of energy put in (Q = 10). A conceptual cutaway view of the ITER tokomak
design can be seen in Figure 1.1.
Figure 1.1: Conceptual cutaway view of the ITER tokomak [9]
1.3. Magnetic Confinement of Plasma
As was described earlier, the fuel in the ITER machine will be a mixture of
Deuterium and Tritium that will be heated to temperatures in excess of 150 million °C.
4
At these extreme temperatures, electrons are separated from their nuclei and a gas
becomes plasma. Plasma consists of charged particles (positive nuclei and negative
electrons) that experience electromagnetic interactions and, therefore, can be shaped and
confined by magnetic forces. Like iron filings in the presence of a magnet, particles in the
plasma will follow magnetic field lines [3].
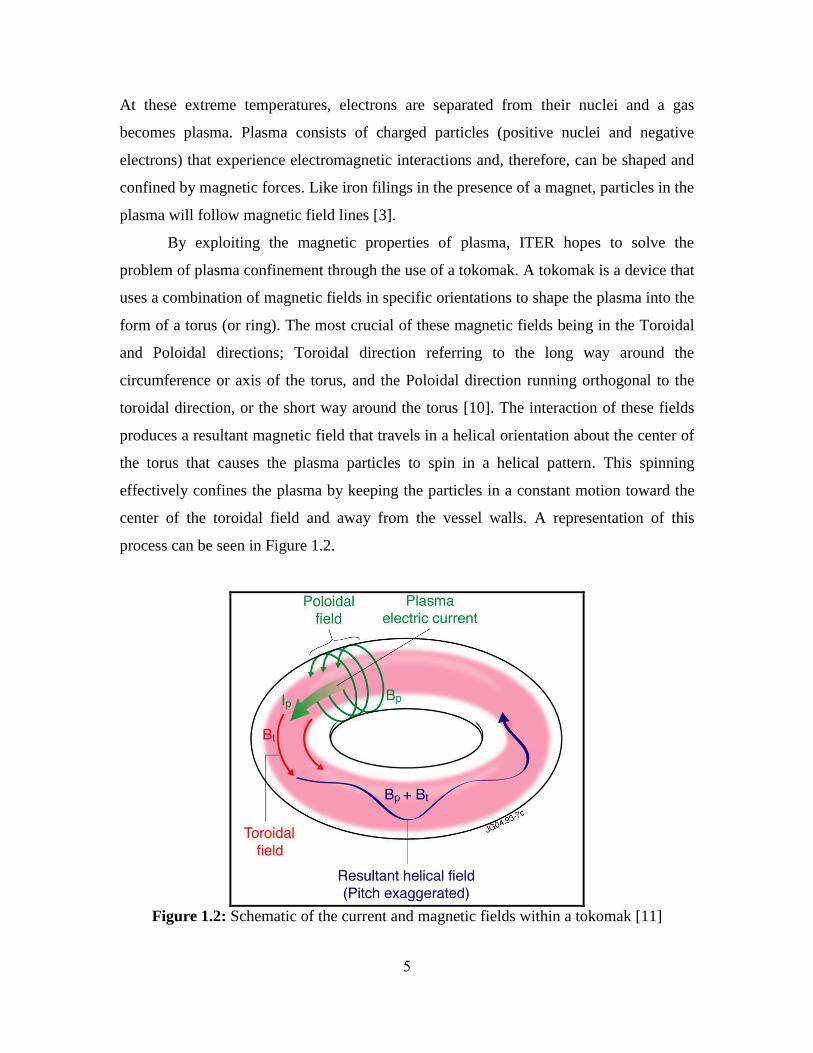
By exploiting the magnetic properties of plasma, ITER hopes to solve the
problem of plasma confinement through the use of a tokomak. A tokomak is a device that
uses a combination of magnetic fields in specific orientations to shape the plasma into the
form of a torus (or ring). The most crucial of these magnetic fields being in the Toroidal
and Poloidal directions; Toroidal direction referring to the long way around the
circumference or axis of the torus, and the Poloidal direction running orthogonal to the
toroidal direction, or the short way around the torus [10]. The interaction of these fields
produces a resultant magnetic field that travels in a helical orientation about the center of
the torus that causes the plasma particles to spin in a helical pattern. This spinning
effectively confines the plasma by keeping the particles in a constant motion toward the
center of the toroidal field and away from the vessel walls. A representation of this
process can be seen in Figure 1.2.
Figure 1.2: Schematic of the current and magnetic fields within a tokomak [11]
5
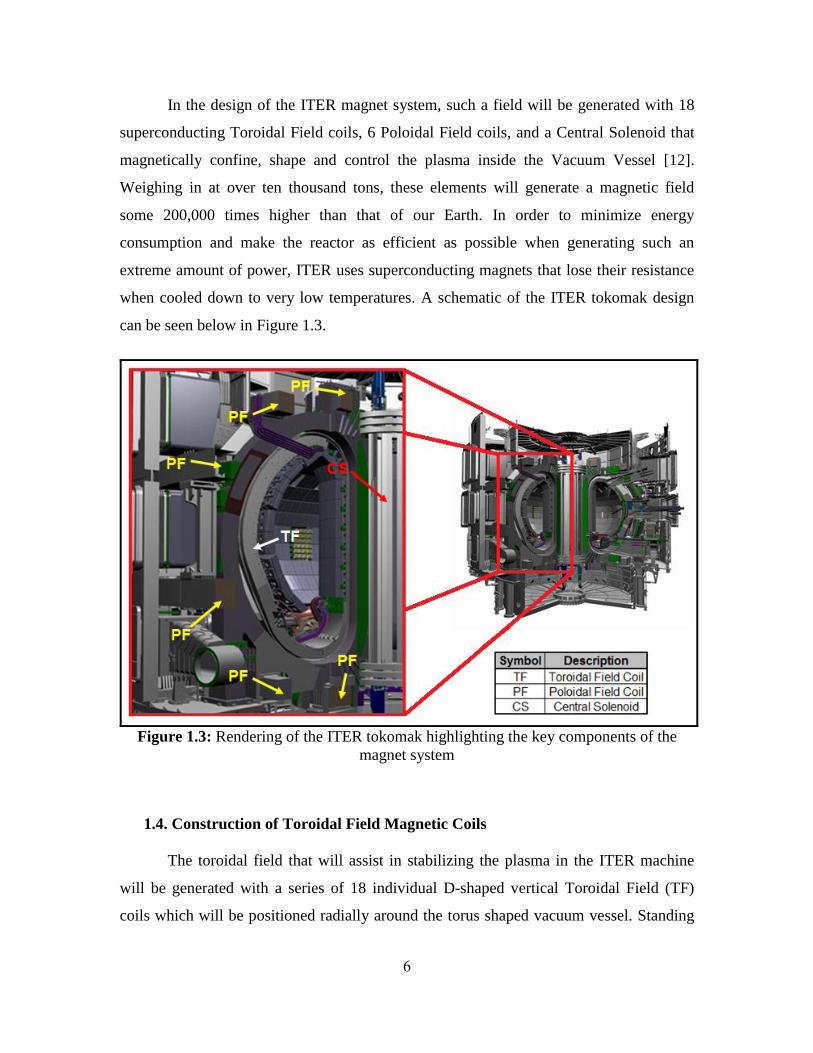
In the design of the ITER magnet system, such a field will be generated with 18
superconducting Toroidal Field coils, 6 Poloidal Field coils, and a Central Solenoid that
magnetically confine, shape and control the plasma inside the Vacuum Vessel [12].
Weighing in at over ten thousand tons, these elements will generate a magnetic field
some 200,000 times higher than that of our Earth. In order to minimize energy
consumption and make the reactor as efficient as possible when generating such an
extreme amount of power, ITER uses superconducting magnets that lose their resistance
when cooled down to very low temperatures. A schematic of the ITER tokomak design
can be seen below in Figure 1.3.
Figure 1.3: Rendering of the ITER tokomak highlighting the key components of the
magnet system
1.4. Construction of Toroidal Field Magnetic Coils
The toroidal field that will assist in stabilizing the plasma in the ITER machine
will be generated with a series of 18 individual D-shaped vertical Toroidal Field (TF)
coils which will be positioned radially around the torus shaped vacuum vessel. Standing
6
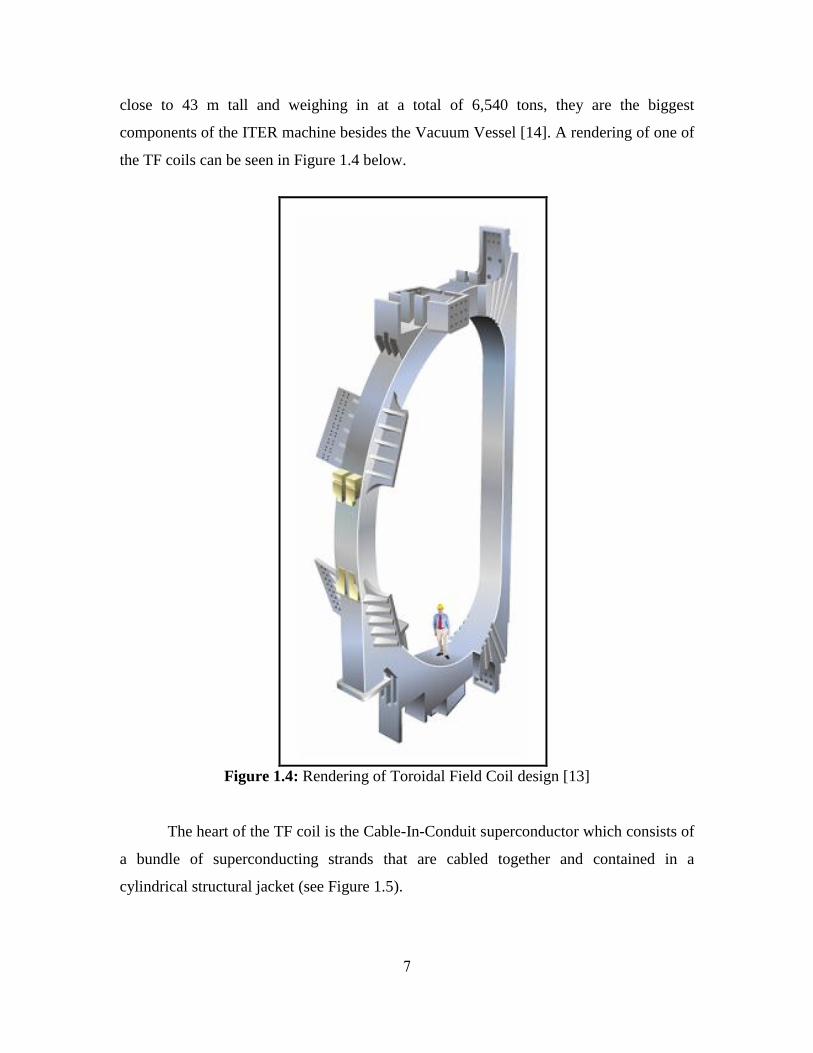
close to 43 m tall and weighing in at a total of 6,540 tons, they are the biggest
components of the ITER machine besides the Vacuum Vessel [14]. A rendering of one of
the TF coils can be seen in Figure 1.4 below.
Figure 1.4: Rendering of Toroidal Field Coil design [13]
The heart of the TF coil is the Cable-In-Conduit superconductor which consists of
a bundle of superconducting strands that are cabled together and contained in a
cylindrical structural jacket (see Figure 1.5).
7

Figure 1.5: Assembled cable-in-conduit conductor
The ITER TF coils are designed to have a total magnetic energy of 41 gigajoules
and a maximum magnetic field of 11.8 tesla. In order to generate a magnetic field of this
magnitude, each TF coil will contain multiple layers of these cable-in-conduit assemblies
wound on top of one another. This layering of cable windings can be seen in Figure 1.6
below which shows the cross section of the TF coil.
Figure 1.6: Cross section of TF coil to show the layering strategy of the cable windings
The term “long double pancake” refers to 1 conductor length of 800 m. Each of the 18 TF
coils that will be used in the ITER machine consists of 5 of these double pancake
configurations [15]. Therefore, 90 of the 800 m lengths of cable-in-conduit are required
to make the TF coils in the machine.
8

1.4.1. Why an 800 meter Cable Pull?
As was previously discussed, the TF coils in the ITER fusion reactor will be made
of Cable-In-Conduit superconductors in which a bundle of superconducting strands are
wound into a cable and encased in a structural conduit jacket. This superconducting cable
and conduit are initially two separate pieces that must be joined together before they can
be wound into the coil. To minimize the movement of the cable when it is energized, the
conductor and conduit are designed with very minimal ID and OD clearance.
Additionally, the conductor is manufactured in 800 m sections. Because of these
complications, integration (joining) of the cable and conduit is a process that could not be
performed by hand. Therefore, the proposed method for joining these two components
requires a force assisted cable pull.
When presented with this task, it was known that 800 m lengths of
superconducting cable had to be pulled through 800 m lengths of conduit using some sort
of winch device. However, the question of how to attach the winch line to the
superconducting cable needed to be answered (see Figure 1.7). Therefore, this thesis will
focus on the development of a gripping mechanism that is capable of pulling
superconducting cable through conduit for Cable-In-Conduit Conductor Integration.
Figure 1.7: Illustration of problem statement
9

After a method for joining the cable and conduit is developed, the problem with
finding a suitable location to perform the task must be addressed. At first glance this
might not seem like much of a challenge, but when you consider the specific details of
the cable pull, it becomes a lot more difficult. First of all, the assembled length of the
cable-in-conduit will span 800 m. More importantly, the land must be as flat as possible,
because any significant changes in elevation will introduce bends into the conduit which
will make it more difficult to pull the cable through. Another major consideration is that
the cable pull must take place in a secure area, meaning it can not simply be done on a
back road in some remote area. After weighing all of the possible options, the most
suitable location turned out to be a vacant airport runway in Florida. A Google Earth
rendering of the proposed cable pull site can be seen in Figure 1.8.
Figure 1.8: Proposed TF cable-in-conduit integration site at airport in Florida
1.5. Modeling Superconducting Cable as Wire Rope
When searching for a suitable gripping mechanism to perform the cable and
conduit integration, the first step was to research how others in the industry were
performing similar tasks. Surprisingly, there was no published documentation pertaining
to cable pulls with superconducting cable. However, there was a great deal of information
regarding the use of wire tope to apply tension over great distances. When you ignore its
10

electrical properties and focus on its mechanical aspects, superconducting cable is
essentially wire rope. This basis of comparison is very valid when you consider the
construction of both.
As the name implies, wire rope is a type of rope which consists of several strands
of metal wire laid (or twisted) into a helix (see Figure 1.9).
Figure 1.9: Schematic illustrating wire rope construction [16]
Despite the fact that it is designed for an entirely different purpose, the
construction of the superconducting cable is exactly like that of a wire rope (see Figure
1.10).
Figure 1.10: Schematic illustrating superconducting cable construction
As a result of this type of construction, wire rope exhibits many mechanical
properties that make it ideal for situations involving tensile loading. Because it is used
11

almost exclusively in tensile loading applications, the mechanical properties of wire rope
are also well documented. Even though it would not ultimately be used in this manner,
construction of the toroidal field coils requires that the superconducting cable be
subjected to tensile loading. Because of these similarities in construction and usage,
superconducting cable can accurately be modeled as wire rope.
1.6. Methods of Cable Termination
The flexible nature and tensile strength of wire rope lends itself to be used in a
wide variety of applications that require physical tension to be transmitted over long
distances. A few of these applications include arresting gear on aircraft carriers, winch
lines for utility trucks, elevator lift cables, structural members in suspension bridges, lift
lines for cranes, and mooring lines for offshore oil production and drilling rigs, just to
name a few. In all of these applications, at least one end of the wire rope features some
sort of termination or gripping device that is used to attach the wire rope to the object that
it is going to lift or secure. Due to the similarities between wire rope and superconducting
cable, there was a good chance that some of the existing wire rope grips might fit our
needs. Therefore, researching some of these off the shelf grips seemed like a good place
to start the search. A few of the most commonly used terminations are as follows.
Loop termination with Ferrule
The most common type of end fitting for a wire rope is created by turning the
loose end of the rope back against itself to form a loop. A ferrule is then swaged around
both pieces of wire to hold them in place (see Figure 1.11).
12

Figure 1.11: Loop termination with ferrule [17]
Another variation of this design is called an eye splice or Flemish eye. Rather than using
a swaged ferrule to fix the ends together, the strands at the end of the rope are unwound a
certain distance and spliced back into the rope to form the loop, or eye (see Figure 1.12).
The benefit to this design over the use of the ferrule is that a swaging machine is not
required.
Figure 1.12: Eye splice rope termination [18]
One of the main benefits of these designs is that the looped end makes them a very
universal termination because a wide variety of couplings for different applications can
be attached. However, due to the fact that the end of the rope must be turned back against
itself to form a loop, both of these designs are limited to ropes that possess good
flexibility.
13

Loop termination with Wire rope clip
Another commonly used looped termination can be created with a wire rope clip.
Similar to the loop with ferrule and the eye splice, the end of the rope is turned back on
itself to form a loop, and then the ends of the rope are fixed together by bolting a series of
wire rope clips around them (see Figure 1.13). The benefit of this design as compared to
the use of the ferrule is that it can be assembled with the use of hand tools rather than a
sophisticated swaging machine. However, as was the case with the other looped
terminations, this design is also limited to use with flexible ropes.
Figure 1.13: Loop termination with wire rope clips [19]
Wedge Socket Termination
With a wedge socket, the termination is created by feeding the wire rope into the
end of the socket, looping it around the wedge, pulling the rope back through the end of
the socket, and fixing it with a rope clip (see Figure 1.14). The result is a termination
whose strength increases with load as the wedge is pulled tighter and tighter against the
cable. In addition to being easy to install, another benefit to this design is that the grip
does not create a permanent bond and can be easily removed when it is no longer needed.
The major drawback to this design is that the rope must be fairly flexible because it has to
be turned back against itself to loop through the socket.
14
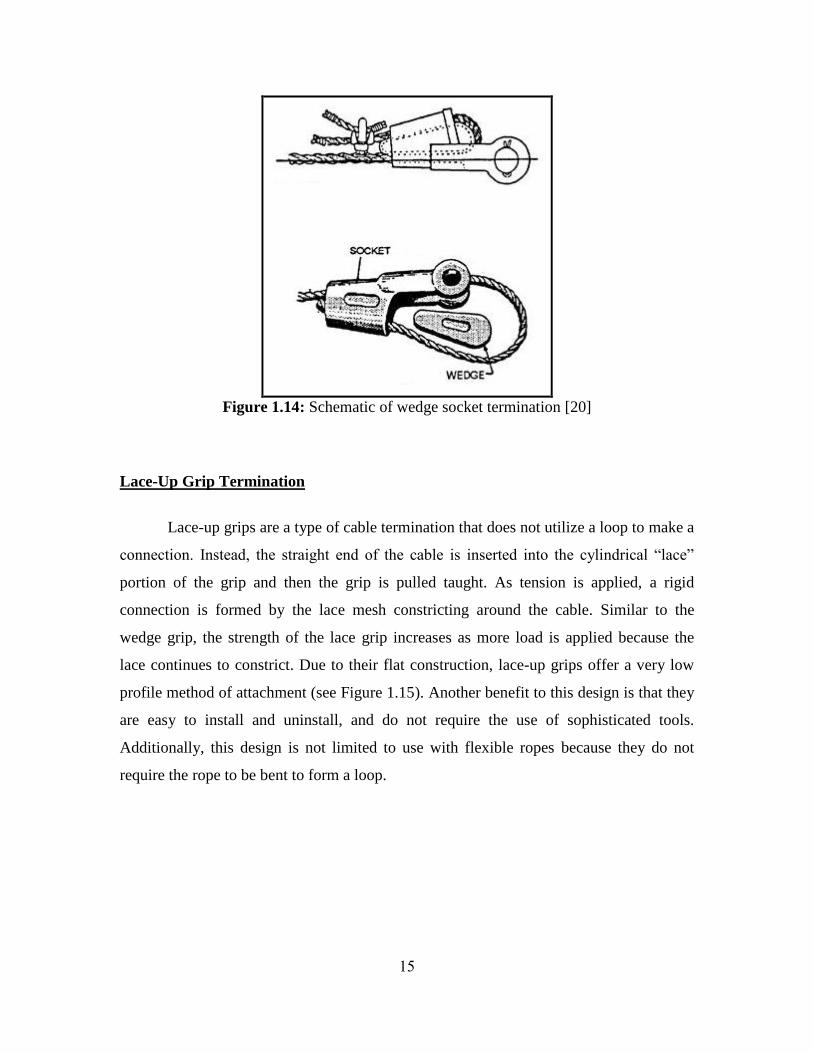
Figure 1.14: Schematic of wedge socket termination [20]
Lace-Up Grip Termination
Lace-up grips are a type of cable termination that does not utilize a loop to make a
connection. Instead, the straight end of the cable is inserted into the cylindrical “lace”
portion of the grip and then the grip is pulled taught. As tension is applied, a rigid
connection is formed by the lace mesh constricting around the cable. Similar to the
wedge grip, the strength of the lace grip increases as more load is applied because the
lace continues to constrict. Due to their flat construction, lace-up grips offer a very low
profile method of attachment (see Figure 1.15). Another benefit to this design is that they
are easy to install and uninstall, and do not require the use of sophisticated tools.
Additionally, this design is not limited to use with flexible ropes because they do not
require the rope to be bent to form a loop.
15
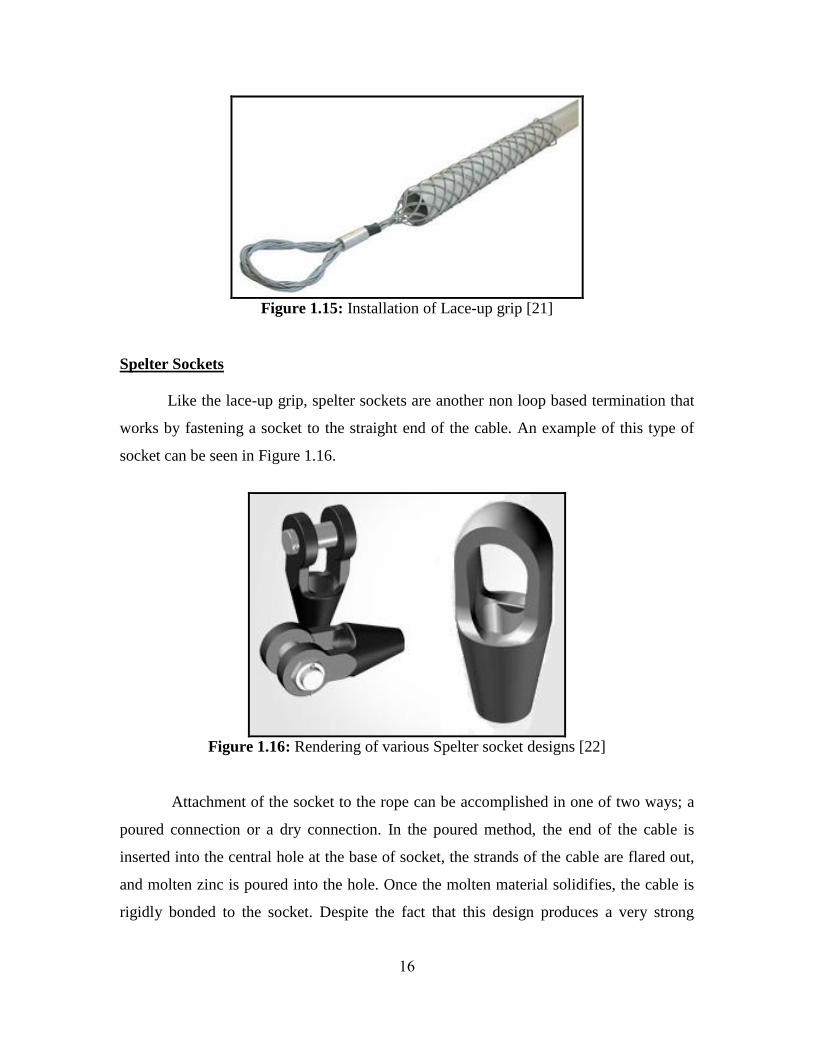
Figure 1.15: Installation of Lace-up grip [21]
Spelter Sockets
Like the lace-up grip, spelter sockets are another non loop based termination that
works by fastening a socket to the straight end of the cable. An example of this type of
socket can be seen in Figure 1.16.
Figure 1.16: Rendering of various Spelter socket designs [22]
Attachment of the socket to the rope can be accomplished in one of two ways; a
poured connection or a dry connection. In the poured method, the end of the cable is
inserted into the central hole at the base of socket, the strands of the cable are flared out,
and molten zinc is poured into the hole. Once the molten material solidifies, the cable is
rigidly bonded to the socket. Despite the fact that this design produces a very strong
16
bond, the use of molten metal has many drawbacks; the main one being that the handling
of molten material is an inherently dangerous operation. Additionally, working with
molten metal requires access to a furnace to heat the zinc, which makes it difficult to use
in remote areas. Finally, the bond between the cable and socket is permanent.
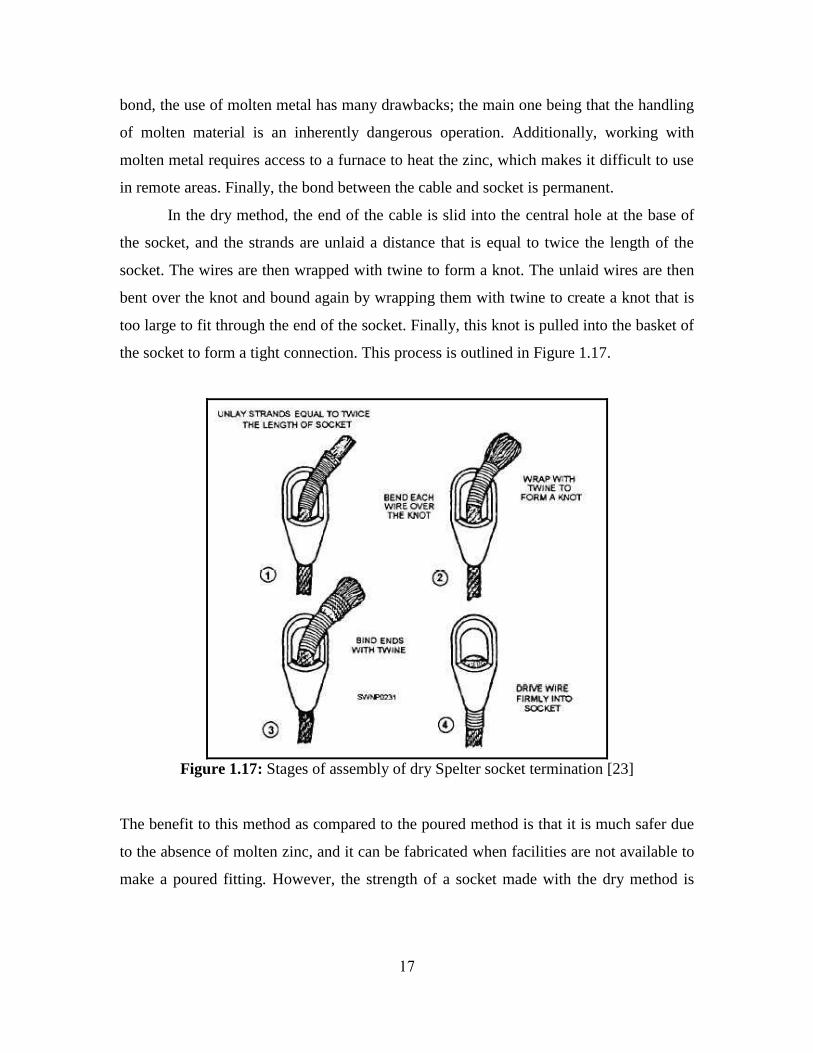
In the dry method, the end of the cable is slid into the central hole at the base of
the socket, and the strands are unlaid a distance that is equal to twice the length of the
socket. The wires are then wrapped with twine to form a knot. The unlaid wires are then
bent over the knot and bound again by wrapping them with twine to create a knot that is
too large to fit through the end of the socket. Finally, this knot is pulled into the basket of
the socket to form a tight connection. This process is outlined in Figure 1.17.
Figure 1.17: Stages of assembly of dry Spelter socket termination [23]
The benefit to this method as compared to the poured method is that it is much safer due
to the absence of molten zinc, and it can be fabricated when facilities are not available to
make a poured fitting. However, the strength of a socket made with the dry method is
17

reduced to approximately one sixth of that of a poured zinc connection. Furthermore, like
the poured socket, this too is considered a permanent connection [23].
Despite their drawbacks, Spelter Sockets are installed on the straight end of the
rope, making them ideal for ropes that are stiff or where bending in a short radius is
difficult.
Non-Swage End Fittings
Non-swage wire rope fittings are similar to spelter sockets in that the connection
is formed by attaching a socket to the end of the cable. An example of this type of socket
can be seen in Figure 1.18.
Figure 1.18: Rendering of non-swage fitting [25]
Rather than using molten metal or knots to secure the socket, the rope passes
through a central hole at the base of a threaded sleeve, the strands are fanned out and a
plug is inserted. As the plug is driven into the fanned end of the rope, the diameter of the
rope end increases such that it can not dislodge itself by slipping through the end of the
sleeve. Finally, the socket is slid over the sleeve and threaded on tight. This process is
illustrated in Figure 1.19.
18

Figure 1.19: Stages of assembly of non-swage end fitting [24]
In addition to the ease of installation offered by this configuration, the biggest
advantage is the fact that they do not require the expensive and bulky equipment that is
inherent to swaging. Compared to other grips, these are also fairly low profile since they
do not involve looping the rope back against itself. Additionally, this design is very
effective for ropes that do not possess the greatest flexibility because they do not require
the rope to bend.
Press-Fit Grip Sleeves
The press-fit grip sleeve design is another type of end fitting that creates a rope
termination without the use of a loop. This type of connection is created by sliding a
cylindrical tube (whose diameter is initially greater than that of the cable) over the end of
the cable and swaging it down to a diameter that is less than or equal to the diameter of
the cable. Doing so creates interference, and thus a contact pressure between the grip
sleeve and cable strands, which creates a solid grip based on friction force alone. The
assembly process for this type of grip can be seen in Figures 1.20 and 1.21.
19

Figure 1.20: Grip sleeve and cable prior to swaging
Figure 1.21: Grip sleeve and cable after swaging
As a result of swaging the grip sleeve to a diameter that is less than or equal to that of the
cable, the press-fit grip is the most low profile termination out of all of the options that
have been discussed. Despite the fact that it does require the use of a swaging machine
for installation, this design is relatively easy to install and very inexpensive, consisting
only of a single piece of cylindrical thin walled tubing. This design is also very effective
for ropes that do not possess the greatest flexibility because they do not require the rope
to be bent to form a loop. The only drawback to this design is that an additional coupling
has to be connected to the grip sleeve since the grip sleeve itself does not possess an
attachment point. This coupling can be in the form of a threaded lug, loop, hook, or other
similar component which is welded to the end of the grip sleeve (see Figures 1.22 and
1.23).
20

Figure 1.22: Rendering of loop socket
auxiliary coupling
Figure 1.23: Rendering of tensile Lug
auxiliary coupling
1.6.1. Cable Pull Requirements
When selecting the appropriate grip to use for the 800 m conductor cable pull,
there were several factors that needed to be considered. These included the strength,
overall size, and ease of manufacturing and installation of the gripping mechanism. Of
the three criteria, the most important was the ability to withstand the required pulling load
without failing. For the purposes of this application, failure refers to the grip detaching
from the end of the cable by slipping or breaking such that the cable could not be pulled
completely through the conduit. Should the grip sleeve fail during a cable pull, the
conduit would have to be cut and the cable removed. Doing so would be a very costly
mistake in terms of both time and labor; not to mention the possibility of damaging the
irreplaceable toroidal field cable.
The second most important design criterion was the size of the gripping
mechanism itself. In order to restrict the motion of the cable when it is energized, the
40.2 mm diameter conductor would be contained within a cylindrical conduit with an
inner diameter of only 43.5 mm. These tight tolerances left a clearance between the
conductor and conduit of roughly 3.25 mm. The last requirement was the ease of
21
manufacturing and installation of the gripping device. There are a total of 18 TF coils in
the ITER magnet system, each of which is formed from 5 of these 800 m lengths of
conductor. In addition to these 90 required pulls, 6 additional 800 m cable pulls are going
to be performed to create dummy cables for test purposes. Therefore, this same cable pull
would be performed at least 96 times, meaning 96 of these grips had to be fabricated,
installed, and put to use. With a need for that many cable grips, the chosen device needed
to be fairly simple to construct and relatively cost effective. Additionally, the grips would
also be installed in the field at the time the pull test would take place, so installation
needed to be prompt. Along these same lines, installation in the field meant that access to
tools would be limited. Therefore, keeping the complexity of the installation procedure to
a minimum was preferred.
As can be seen in the figures above, many of these off the shelf grip
configurations were immediately eliminated based on the size requirement alone, as they
would not come close to fitting through the conduit. All of the designs that required that a
loop be formed at the end of the cable fell into this category as well since the size of the
loop that would be created by turning the cable back on itself would exceed the inner
diameter of the conduit; not to mention the fact that the superconducting cable is far too
stiff to easily loop back on itself. The final requirement was the load bearing capacity of
the grip. Even though it offers a very low profile design when compared to many of the
other grips, the lace-up style grip would not support the kind of load that we would be
subjecting it to.
Of all the designs discussed above, only two adhered to all of the specified
criteria. These included the non-swage end fitting and the press-fit sleeve. Selecting the
best design from the remaining two was done based on their simplicity. Among these, the
press-fit grip sleeve turned out to be the least complicated and was the first to be tested.
As will be described in Chapter 4, it turned out that the first and most basic design
worked so well that other grips did not need to be tested. However, modifications were
made to the original grip sleeve design to improve upon its effectiveness. Additional
details regarding the construction and testing of this device are documented in Chapters 3
and 4.
22
Chapter 2
Review of Literature
2.1. Overview
Wire rope research and development has led to the creation of a wide variety of
cabling devices that have found extensive use in hoisting and mooring applications where
tension needs to be transmitted over great distances. Similarly, press-fit joints have
proven themselves to be an effective means of creating a rigid connection between two
objects. In both cases, there is a great deal of literature that documents the advancements
and usage of both items. However, there is no current literature that documents the use of
a press-fit grip as a termination method for a wire rope. Since there is a lack of literature
that focuses on the exact type of work being done, this literature review will focus on the
different characteristics that are inherent to the wire rope and press fit grips when used in
a tensile loading application. The topics of interest will be explained and described as
they pertain to this research. Since the overall performance of the grip sleeve will depend
on how the grip sleeve and the wire rope behave individually, each component can be
studied individually and experimental testing will be utilized to effectively predict how
they interact with one another.
2.2. Mechanics of Wire Rope
Due to their helical construction, wire rope responds very differently to tensile
loading than a straight or braided rope would. Unlike braided rope that will simply
elongate when subjected to a tensile load, the wires and strands in a wire rope attempt to
straighten themselves out or in other words, to "unlay". The degree to which the strands
and wires untwist depends upon the magnitude of the force applied, the construction of
the rope, and also upon the stiffness of the wires and strands. The lay of the wires, the lay
of the strands, the way that each end of the rope is fixed, and even the number of layers
that form the rope are all factors that can drastically influence the rope‟s behavior.
23
2.2.1. Wire and Strand Lay Variations
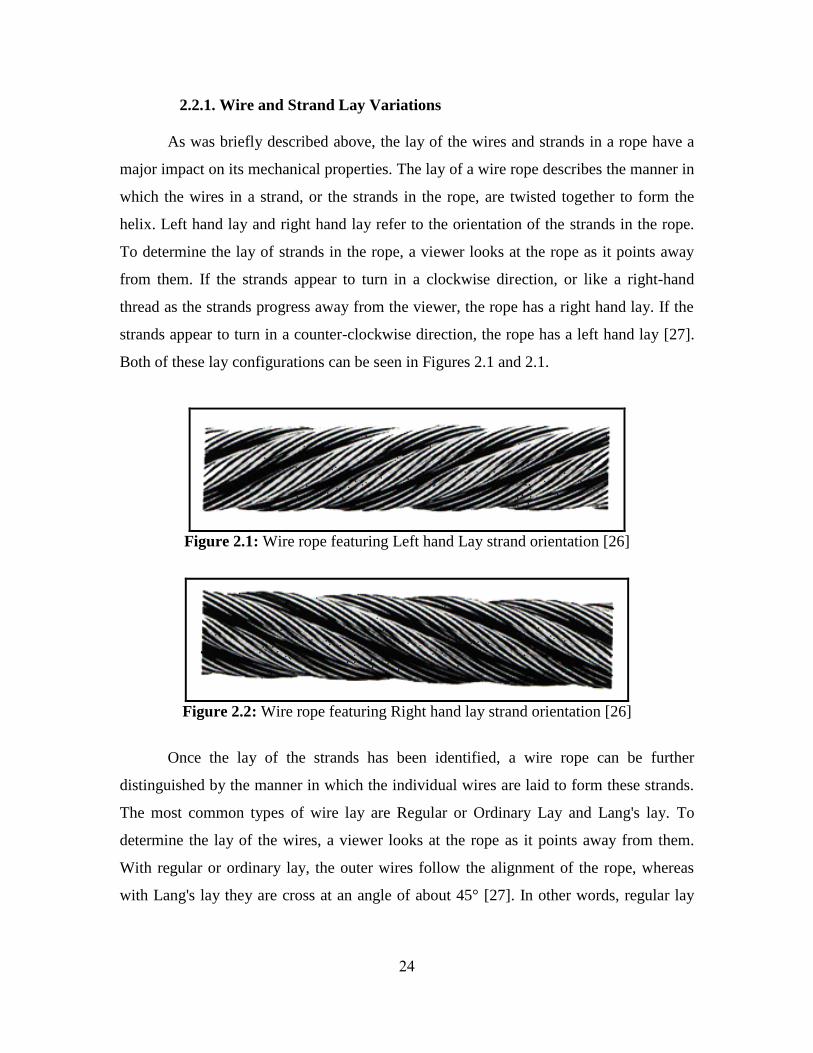
As was briefly described above, the lay of the wires and strands in a rope have a
major impact on its mechanical properties. The lay of a wire rope describes the manner in
which the wires in a strand, or the strands in the rope, are twisted together to form the
helix. Left hand lay and right hand lay refer to the orientation of the strands in the rope.
To determine the lay of strands in the rope, a viewer looks at the rope as it points away
from them. If the strands appear to turn in a clockwise direction, or like a right-hand
thread as the strands progress away from the viewer, the rope has a right hand lay. If the
strands appear to turn in a counter-clockwise direction, the rope has a left hand lay [27].
Both of these lay configurations can be seen in Figures 2.1 and 2.1.
Figure 2.1: Wire rope featuring Left hand Lay strand orientation [26]
Figure 2.2: Wire rope featuring Right hand lay strand orientation [26]
Once the lay of the strands has been identified, a wire rope can be further
distinguished by the manner in which the individual wires are laid to form these strands.
The most common types of wire lay are Regular or Ordinary Lay and Lang's lay. To
determine the lay of the wires, a viewer looks at the rope as it points away from them.
With regular or ordinary lay, the outer wires follow the alignment of the rope, whereas
with Lang's lay they are cross at an angle of about 45° [27]. In other words, regular lay
24

wires appear to follow in the same direction as the rope, while Lang‟s lay wires appear to
follow the direction of the strands. A comparison of regular and Lang‟s lay for both
strand lay directions are shown below in Figure 2.3.
Figure 2.3: Comparison of the most common wire and strand lay combinations [28]
Finally, wire ropes may be classified even further based on their lay length. The
length of a rope lay is the distance measured parallel to the center line of a wire rope in
which a strand makes one complete spiral or turn around the rope. Similarly, the length of
a strand lay is the distance measured parallel to the center line of the strand in which one
wire makes one complete spiral or turn around the strand. Generally, strand lay length is
the more important of the two parameters. An illustration that shows the measurement of
the strand lay can be seen in Figure 2.4.
Figure 2.4: Illustration of strand length measurement of a wire rope [29]
25
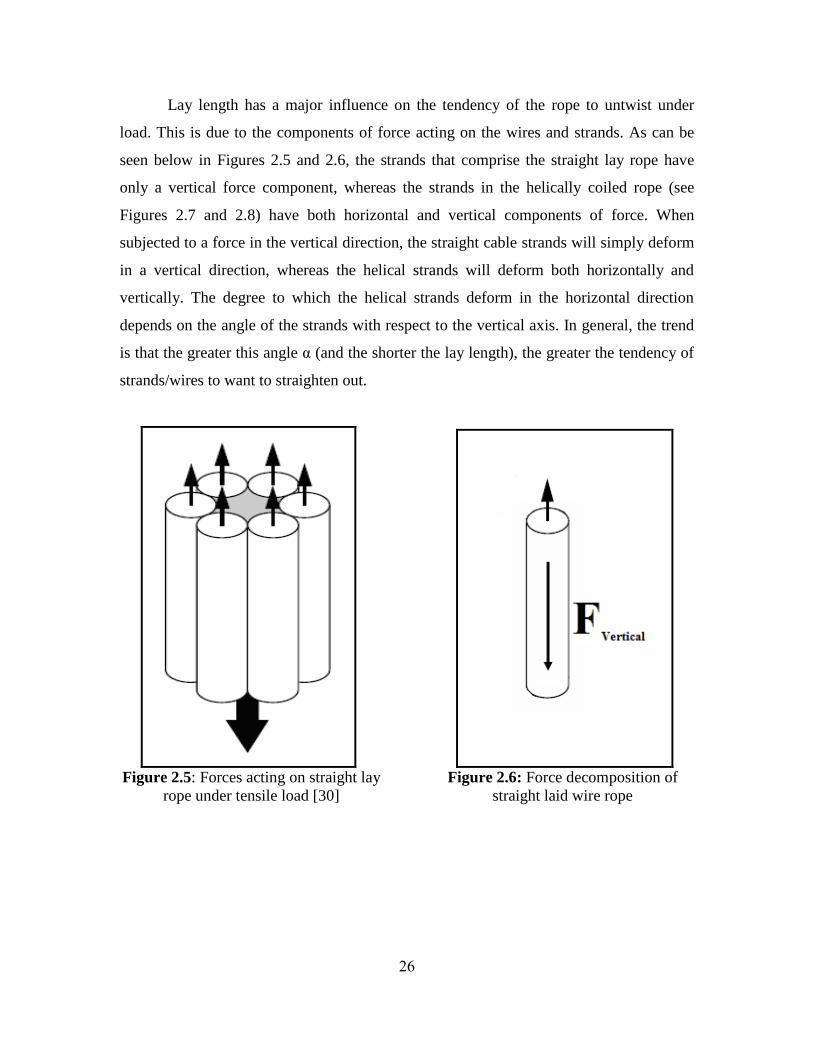
Lay length has a major influence on the tendency of the rope to untwist under
load. This is due to the components of force acting on the wires and strands. As can be
seen below in Figures 2.5 and 2.6, the strands that comprise the straight lay rope have
only a vertical force component, whereas the strands in the helically coiled rope (see
Figures 2.7 and 2.8) have both horizontal and vertical components of force. When
subjected to a force in the vertical direction, the straight cable strands will simply deform
in a vertical direction, whereas the helical strands will deform both horizontally and
vertically. The degree to which the helical strands deform in the horizontal direction
depends on the angle of the strands with respect to the vertical axis. In general, the trend
is that the greater this angle α (and the shorter the lay length), the greater the tendency of
strands/wires to want to straighten out.
Figure 2.5: Forces acting on straight lay
rope under tensile load [30]
Figure 2.6: Force decomposition of
straight laid wire rope
26
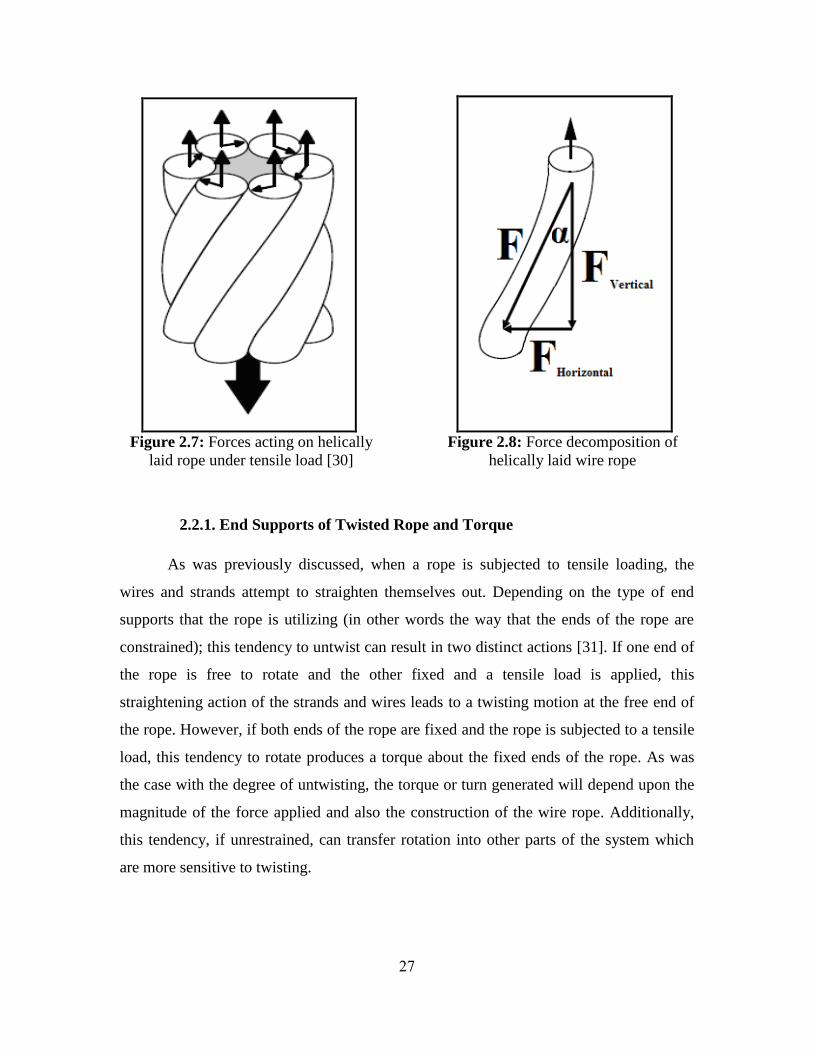
Figure 2.7: Forces acting on helically
laid rope under tensile load [30]
Figure 2.8: Force decomposition of
helically laid wire rope
2.2.1. End Supports of Twisted Rope and Torque
As was previously discussed, when a rope is subjected to tensile loading, the
wires and strands attempt to straighten themselves out. Depending on the type of end
supports that the rope is utilizing (in other words the way that the ends of the rope are
constrained); this tendency to untwist can result in two distinct actions [31]. If one end of
the rope is free to rotate and the other fixed and a tensile load is applied, this
straightening action of the strands and wires leads to a twisting motion at the free end of
the rope. However, if both ends of the rope are fixed and the rope is subjected to a tensile
load, this tendency to rotate produces a torque about the fixed ends of the rope. As was
the case with the degree of untwisting, the torque or turn generated will depend upon the
magnitude of the force applied and also the construction of the wire rope. Additionally,
this tendency, if unrestrained, can transfer rotation into other parts of the system which
are more sensitive to twisting.
27

2.2.2. Influence of Wire and Strand Lay on Torque
As was previously discussed, wire rope exists in a wide variety of configurations
which differ based on their construction. Among these variations, one of the most
important is the way in which the wires and strands are twisted together to form the rope.
It turns out that these characteristics have a major impact on how the cable acts when
subjected to tensile loading.
The most common types of strand construction are Right Lay and Left Lay. When
subjected to tensile loading, the strands in a rope have a natural tendency to turn in the
opposite direction to which they are laid in an attempt to straighten themselves out. This
means a left lay rope will untwist to the right and a right lay rope to the left. This
tendency is amplified based on the configuration of the wires that make up the strands in
the rope. Strands are typically twisted together in a Regular or Ordinary Lay or a Lang‟s
Lay pattern. Regular lay means that the wires are twisted together in the opposite
direction of the strands, and Lang‟s Lay meaning that they are twisted together in the
same direction as the strands. What this equates to is that regular lay strands reduce rope
torque since the wires spin in the opposite direction of the strands, whereas Lang‟s lay
strands increase rope torque since the wires spin in the same direction as the strands [32].
Single layer Lang‟s lay ropes have exceptionally bad rotational characteristics and must
only be used in applications where both ends of the rope are securely fixed.
It has been observed that these torque characteristics have a major impact on the
application of wire rope. In a situation where the cable is being used to hoist or pull, a
coupling of some sort is required to attach the cable to the object it is pulling. A common
type of cable termination is a threaded tensile lug that features standard right hand
threads. As was discovered in the oil production industry, left lay rope has greatest usage
in oil fields on rod and tubing lines because the rotation of right lay rope would loosen
the couplings. The rotation of a left lay rope tightens a standard coupling [33].
28
2.2.3. Torque Balanced Cable
As was discussed above, twisted ropes have an inherent torque problem that
makes then unsuitable for use in a wide variety of applications. This natural torque
tendency, however, can actually be used against itself to combat this torque problem. As
was mentioned above, a regular lay rope has somewhat of a rotation preventing
characteristic due to its construction. Since the wires that make up the strands are twisted
in the direction opposite to that of the strands, when the wires unwind, they partially
counteract the untwisting of the strands. The result is a built in torque balance.
Recognizing the potential in this configuration, multiple layer ropes were created.
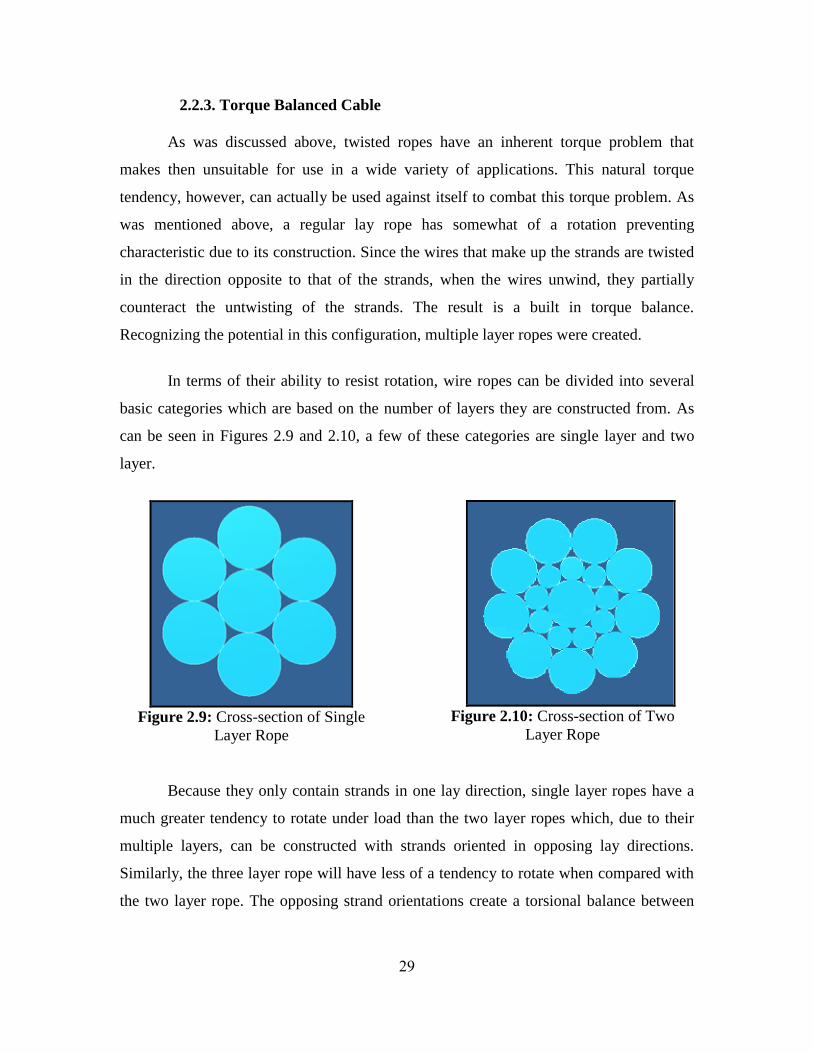
In terms of their ability to resist rotation, wire ropes can be divided into several
basic categories which are based on the number of layers they are constructed from. As
can be seen in Figures 2.9 and 2.10, a few of these categories are single layer and two
layer.
Figure 2.9: Cross-section of Single
Layer Rope
Figure 2.10: Cross-section of Two
Layer Rope
Because they only contain strands in one lay direction, single layer ropes have a
much greater tendency to rotate under load than the two layer ropes which, due to their
multiple layers, can be constructed with strands oriented in opposing lay directions.
Similarly, the three layer rope will have less of a tendency to rotate when compared with
the two layer rope. The opposing strand orientations create a torsional balance between
29
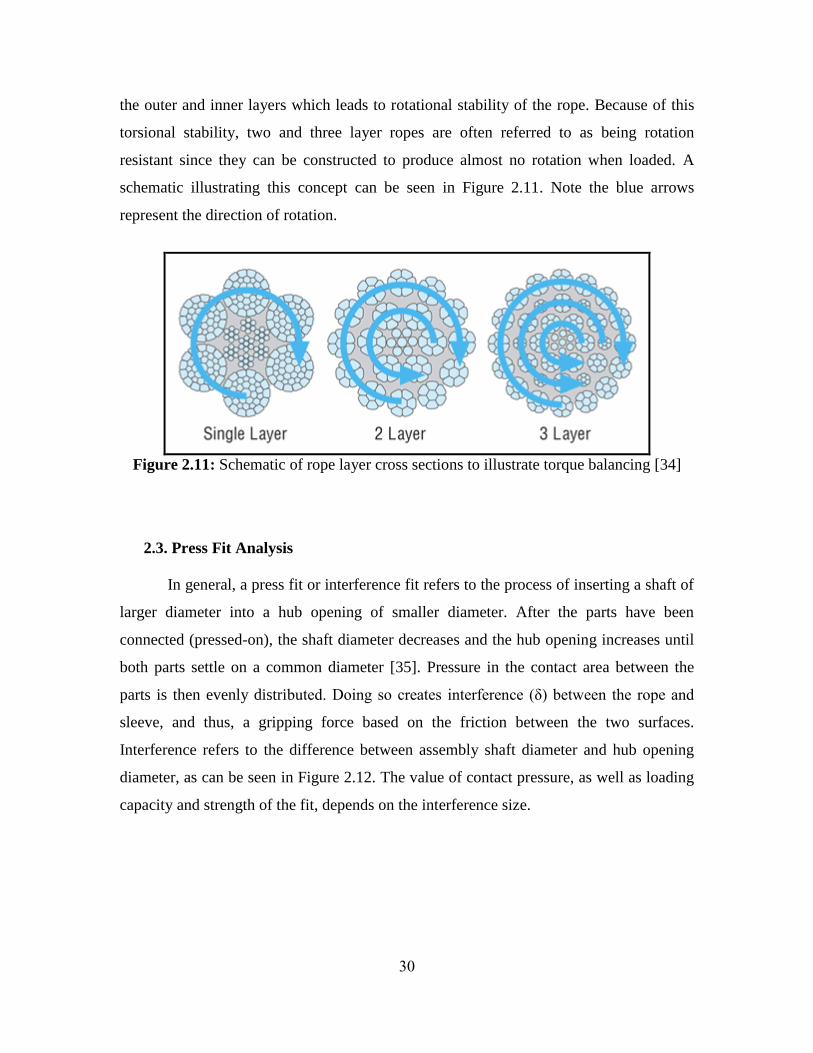
the outer and inner layers which leads to rotational stability of the rope. Because of this
torsional stability, two and three layer ropes are often referred to as being rotation
resistant since they can be constructed to produce almost no rotation when loaded. A
schematic illustrating this concept can be seen in Figure 2.11. Note the blue arrows
represent the direction of rotation.
Figure 2.11: Schematic of rope layer cross sections to illustrate torque balancing [34]
2.3. Press Fit Analysis
In general, a press fit or interference fit refers to the process of inserting a shaft of
larger diameter into a hub opening of smaller diameter. After the parts have been
connected (pressed-on), the shaft diameter decreases and the hub opening increases until
both parts settle on a common diameter [35]. Pressure in the contact area between the
parts is then evenly distributed. Doing so creates interference (δ) between the rope and
sleeve, and thus, a gripping force based on the friction between the two surfaces.
Interference refers to the difference between assembly shaft diameter and hub opening
diameter, as can be seen in Figure 2.12. The value of contact pressure, as well as loading
capacity and strength of the fit, depends on the interference size.
30
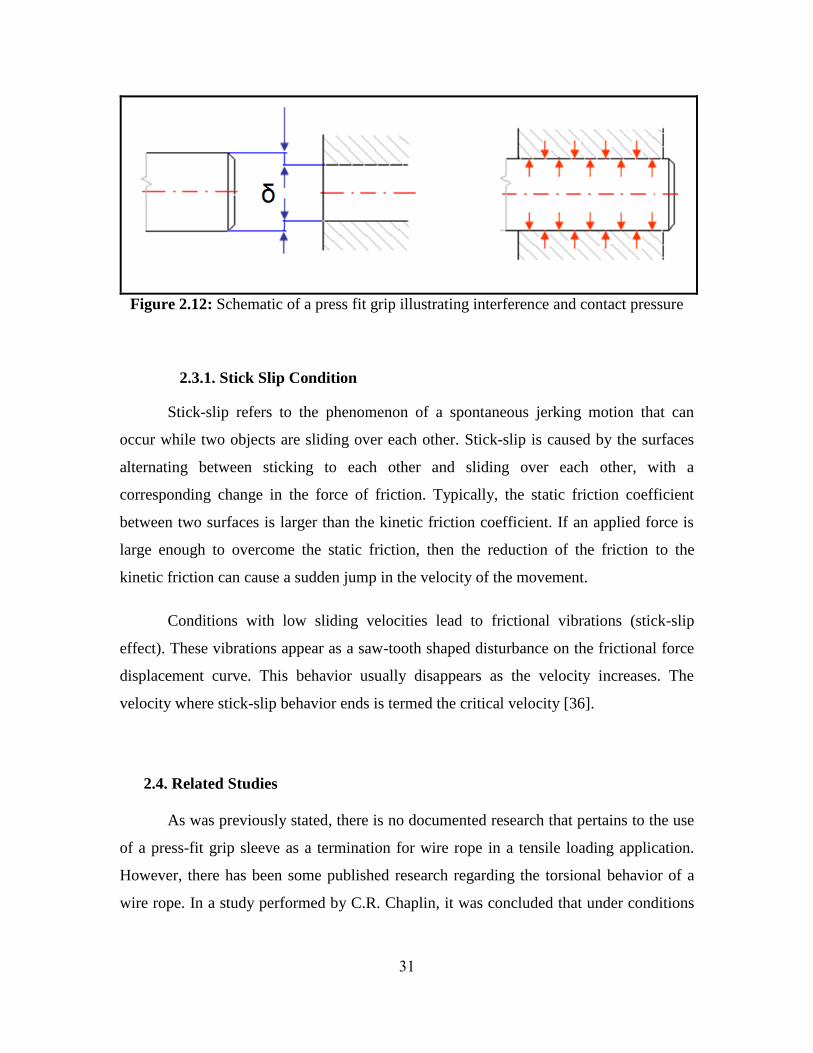
Figure 2.12: Schematic of a press fit grip illustrating interference and contact pressure
2.3.1. Stick Slip Condition
Stick-slip refers to the phenomenon of a spontaneous jerking motion that can
occur while two objects are sliding over each other. Stick-slip is caused by the surfaces
alternating between sticking to each other and sliding over each other, with a
corresponding change in the force of friction. Typically, the static friction coefficient
between two surfaces is larger than the kinetic friction coefficient. If an applied force is
large enough to overcome the static friction, then the reduction of the friction to the
kinetic friction can cause a sudden jump in the velocity of the movement.
Conditions with low sliding velocities lead to frictional vibrations (stick-slip
effect). These vibrations appear as a saw-tooth shaped disturbance on the frictional force
displacement curve. This behavior usually disappears as the velocity increases. The
velocity where stick-slip behavior ends is termed the critical velocity [36].
2.4. Related Studies
As was previously stated, there is no documented research that pertains to the use
of a press-fit grip sleeve as a termination for wire rope in a tensile loading application.
However, there has been some published research regarding the torsional behavior of a
wire rope. In a study performed by C.R. Chaplin, it was concluded that under conditions
31

of rotational restraint, conventional six strand ropes develop a torque which is
approximately proportional to the tensile load, however this torsional response is
modified by twisting or untwisting the rope [32]. In addition, it was shown that a
reduction in the lay length of a rope increases the torque generated by applied tension.
In another study, Utting and Jones discovered significant differences in strand
response between wire rope samples having fixed and free (zero torque) end conditions
[37]. By referring to the free end condition as zero torque, it is clear that the significant
differences the authors of this study are referring to are that a cable with fixed-free ends
will rotate under load and produce no torque, while a cable with fixed-fixed ends will
produce a torque under load.
Chaplin, Rebel, and Ridge discussed the usage of single layer Lang‟s Lay rope for
mine hoists in South African gold mines in an article titled “Tension-torsion fatigue
effects in wire ropes”. They commented that this construction (Lang‟s Lay) has even
greater tendency to untwist than the ordinary lay ropes that are used for traditional work
wires in the offshore industry [31]. The authors of this article go on to discuss an
experimental tensile-torsion fatigue test performed on cable samples with torsionally
fixed ends compared to those with free ends. Identical tests were conducted on right hand
ordinary lay and right hand Lang‟s lay ropes. The results of the testing showed that the
torsionally restrained (fixed-fixed) samples displayed excellent fatigue endurance for
both cable configurations (Lang‟s Lay and Ordinary Lay), whereas the torsionally
unrestrained (fixed-free) samples displayed very poor fatigue endurance. In both cases,
the Lang‟s Lay rope slightly outperformed the ordinary lay rope [31]. Since fatigue
testing is performed at loads that are below the yield strength of the material and torque is
proportional to the applied load, it is likely that the torque experienced by the fixed-fixed
samples was not sufficient to cause the cable to fail or diminish its fatigue endurance.
32
Chapter 3
Methodology
3.1. Overview
The purpose of this research was to determine the feasibility of pulling TF cable
with a press-fit sleeve grip design that utilizes friction to generate a gripping force. Such
a design is being considered by ITER for integrating (joining) 800 meter lengths of
superconducting TF cable and conduit. In order to see if friction alone had the potential to
withstand the required pulling load, test samples were created and subjected to tensile and
fatigue loading until failure occurred. Additionally, finite element analysis methods were
used to obtain a better insight into the deformation behavior of the cables.
3.2. Experimental Testing
Unsure of the capabilities of the press-fit grip sleeve design, two trial samples of
an arbitrary grip sleeve length were created. Both samples were subjected to monotonic
tensile loading until failure (slippage of the sleeve) occurred. Using the results of these
tests as a guide, a subsequent series of full scale grip sleeve samples were made using the
same design and tested under identical conditions. In addition to its gripping strength (the
load at which slippage between the sleeve and cable occurs) during tensile loading, it was
also important that the grip would withstand the variable loading that will likely occur
during the pulling process due to the friction between the cable and conduit. Therefore, a
period of cyclic loading, prior to tensile loading, was also incorporated into the testing
program. Based on the results of each experiment, additional modifications were
integrated into the design to try and maximize its gripping strength. Once the grip sleeve
design was optimized, additional samples were tested under identical conditions to
establish repeatability. The testing setup and procedure as well as detailed descriptions of
each test sample are outlined in the Chapter 4.
33

3.2.1. Test Sample Materials
The materials utilized in this experiment to construct the test samples consisted of
three main components: superconducting cable, thin walled stainless steel tubing, and a
perforated stainless steel tube. The superconducting cable from which the test samples
were made consisted of 1,422 individual wires which were wound into 6 strands, and
finally into the actual conductor. In terms of the wire rope classifications described in
Chapter 2, this superconducting cable is a single layer Right Lay Lang‟s lay rope with a
lay length of 500 mm as can be seen in Figures 3.1 and 3.2.
Figure 3.1: Cross-section of conductor showing its 6 strand single layer construction
Figure 3.2: Side view of conductor showing its right laid Lang lay wire orientation
34

Each of the 1,422 wires that make up the cable strand has a diameter of 0.82 mm.
The outer diameter of the conductor itself measures 40.2 mm with an estimated 8% void
fraction amongst the packing of the strands and wires. Additionally, the conductor weighs
approximately 0.41 lbs per inch, meaning each 800 m section will weigh over 13,000 lbs.
The wires that will be used to create the actual conductor will be constructed from
Copper with a core composed of a special alloy of Niobium and Tin (Nb3Sn). Due to the
expense of this material composition, the conductor used in these experiments consists
only of Copper. Because of its non-superconducting properties, it is often referred to as
“dummy” cable. The thin walled tube that was used in this experiment to construct the
grip sleeves consisted of 47.6 mm dia. x 2.1mm wall thickness (1.875 in. x 0.083 in.) 316
Stainless Steel tube. The core tube that runs down the center of the conductor consisted of
9.52 mm dia. 1.25 mm wall thickness (0.375 in. x 0.05 in.) perforated stainless steel tube.
3.2.2. Types of Test Samples
All eight test samples that were utilized during this experimental process were of
the press-fit configuration, meaning the only connection between the grip and the
conductor were the forces due to friction. Unsure of the capabilities of this design, the
testing process began by selecting an arbitrary grip sleeve length, constructing two
samples, and tensile testing them until failure (sleeve slippage) occurred. Based on the
results of these preliminary tests, a second set of grip sleeves were created, whose
specific design parameters were based on the results of the previous experiment. This
process was repeated until a total of 8 samples with 6 different grip sleeve configurations
had been tested. Once the strength of the design exceed the physical limitations of the
attachment coupling that was used to mate the sample to the testing machine, no
additional changes were made and several identical samples were tested to establish
repeatability. Details regarding the construction of each specimen and their test results
are discussed in the results section found in Chapter 4.
35

3.2.3. Sample Construction and Preparation
All of the samples that were tested utilized the same press-fit design, but were
built to a wide variety of specifications due to the outcome of each series of tests. As a
result, some aspects of the construction process deviate from the standard procedure to
accommodate these modifications. These specific design changes are not covered in this
description, but will be described in detail as they occurred in the results section located
in Chapter 4. A general summary of the construction of the first full scale sample is
outlined below.
The design for the full scale test samples as proposed by ITER included an overall
length of 1.1 m, of which 300 mm were compacted within each grip sleeve, and a section
of exposed cable between the grip sleeves of no less than 500 mm. The term full scale
corresponds to the distance between the grip sleeves, which for the TF cable is a
minimum of 500 mm to allow for one full rotation of the cable based on its lay length. A
rendering of this design can be seen in Figure 3.3.
Figure 3.3: Rendering of full scale TF sample configuration [38]
Construction of a press-fit grip sleeve test sample began by creating 2 grip sleeves
that would eventually be compacted around each end of the TF cable. This was done by
cutting 2 pieces of the uncompacted TF conduit (47.57 mm diameter and 2.05 mm wall
thickness stainless steel tube) to a length of 315 mm. The crimping machine was then
used to swage one end of each piece down to a diameter of 38 mm so that a tensile lug
36
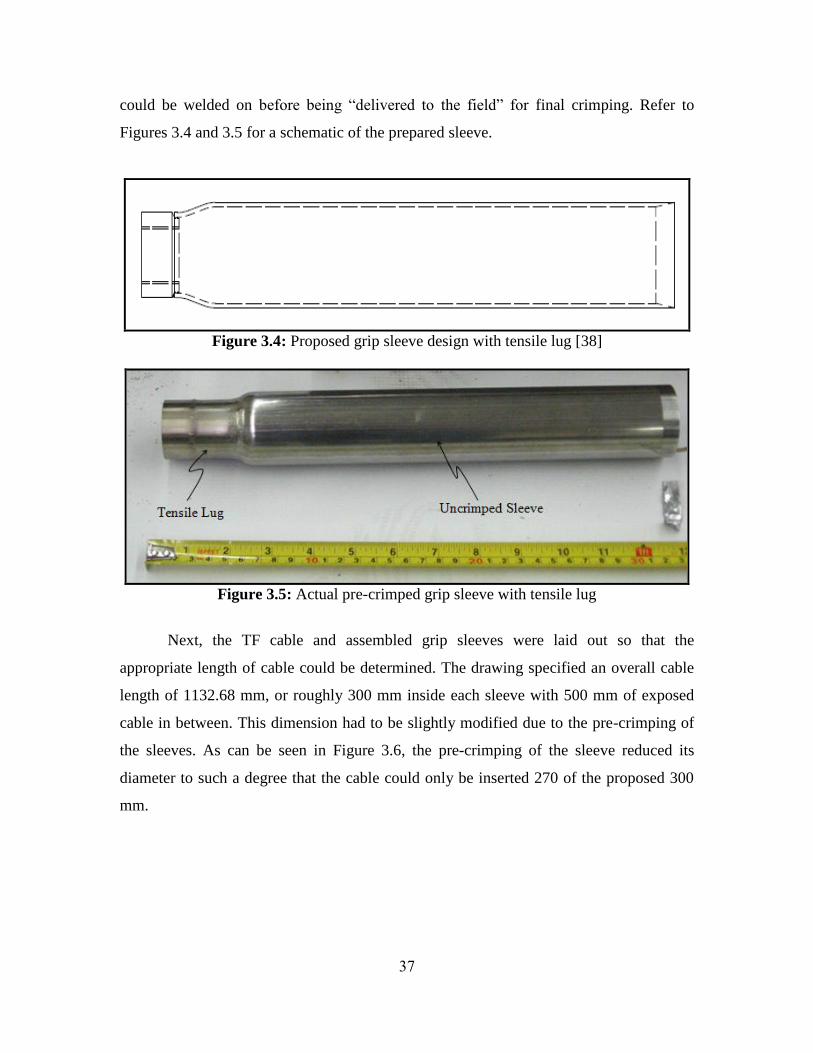
could be welded on before being “delivered to the field” for final crimping. Refer to
Figures 3.4 and 3.5 for a schematic of the prepared sleeve.
Figure 3.4: Proposed grip sleeve design with tensile lug [38]
Figure 3.5: Actual pre-crimped grip sleeve with tensile lug
Next, the TF cable and assembled grip sleeves were laid out so that the
appropriate length of cable could be determined. The drawing specified an overall cable
length of 1132.68 mm, or roughly 300 mm inside each sleeve with 500 mm of exposed
cable in between. This dimension had to be slightly modified due to the pre-crimping of
the sleeves. As can be seen in Figure 3.6, the pre-crimping of the sleeve reduced its
diameter to such a degree that the cable could only be inserted 270 of the proposed 300
mm.
37

Figure 3.6: Pre-crimped grip sleeve compared to nominal cable diameter
Therefore, the overall length of cable was reduced by 60 mm and cut to a length of
1069.975 mm to maintain the desired 500 mm of exposed cable between the sleeves. As
can be seen in Figure 3.7, hose clamps were positioned at both ends of the cut to ensure
that the cable and foil wrap would not unwind as it was separated.
Figure 3.7: Hose clamps positioned around cut to prevent unwinding
Next, a solid stainless steel rod (O-1 tool steel) of 7.5 mm diameter was cut into
292 mm lengths. One of these rods was then inserted into the core tube at each end of the
sample (see Figure 3.8) by gently tapping the opposite end of the rod. Their purpose was
to simulate the effect of a solid core within the region of compaction by providing
additional rigidity and preventing the hollow core tube from being deformed during
compaction.
38
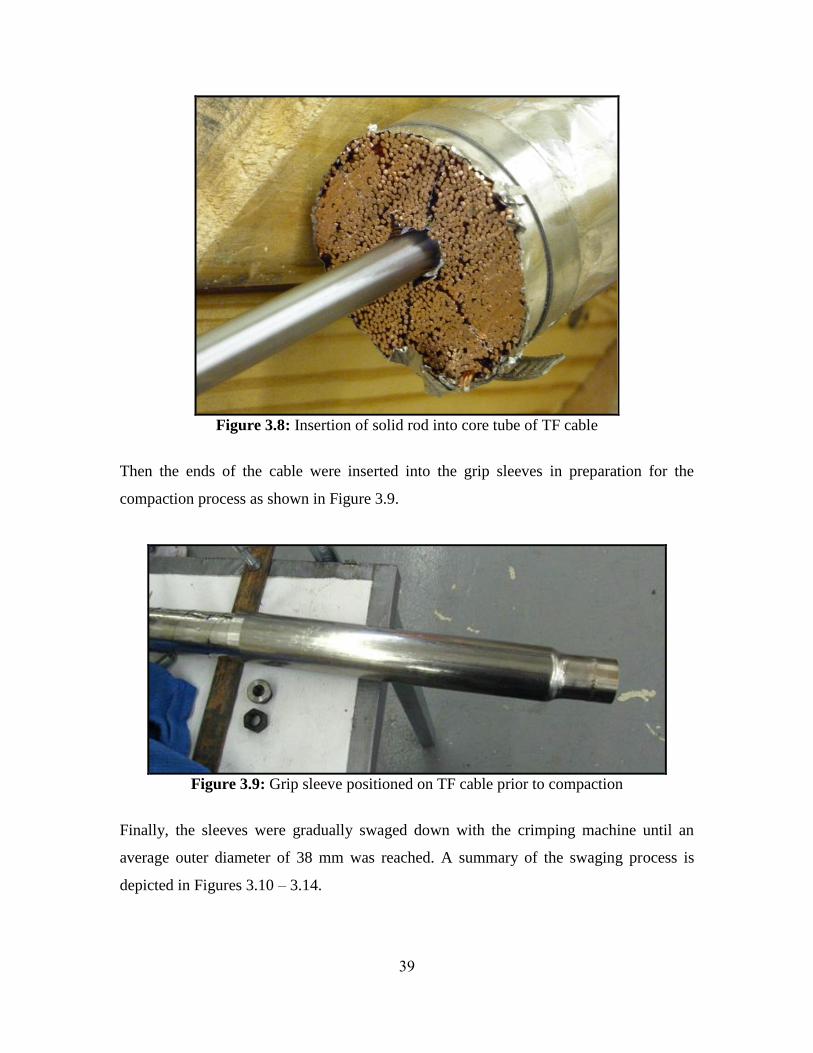
Figure 3.8: Insertion of solid rod into core tube of TF cable
Then the ends of the cable were inserted into the grip sleeves in preparation for the
compaction process as shown in Figure 3.9.
Figure 3.9: Grip sleeve positioned on TF cable prior to compaction
Finally, the sleeves were gradually swaged down with the crimping machine until an
average outer diameter of 38 mm was reached. A summary of the swaging process is
depicted in Figures 3.10 – 3.14.
39
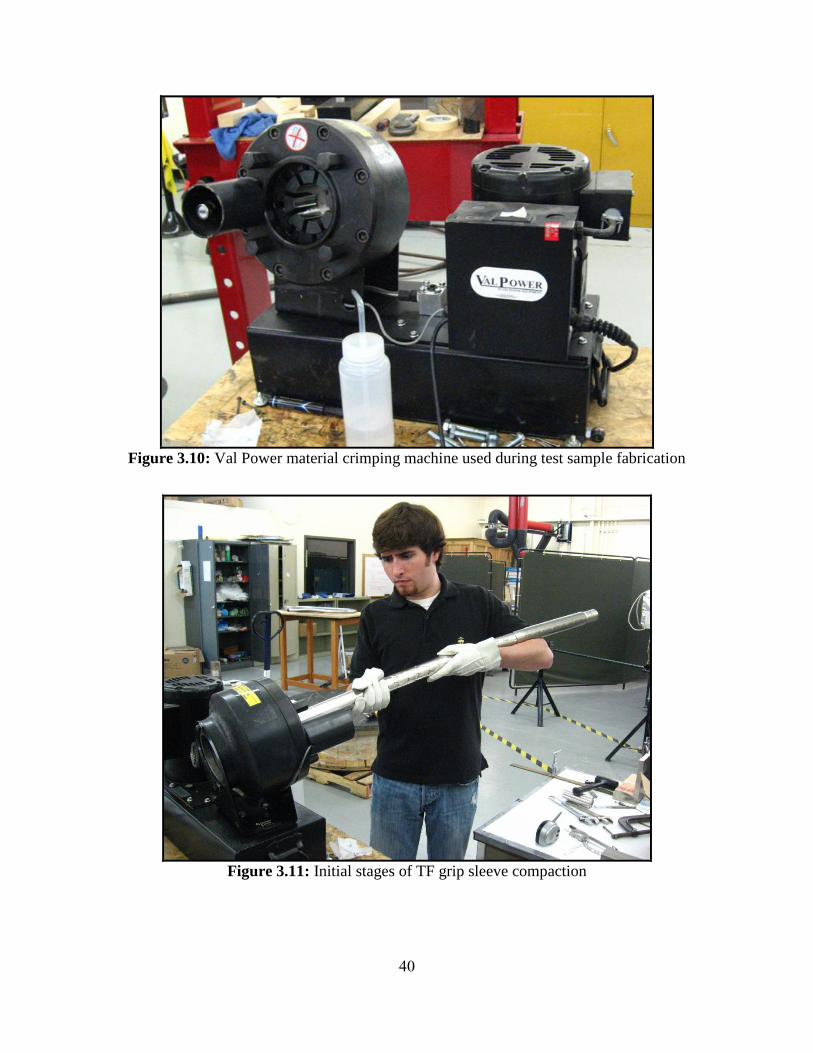
Figure 3.10: Val Power material crimping machine used during test sample fabrication
Figure 3.11: Initial stages of TF grip sleeve compaction
40
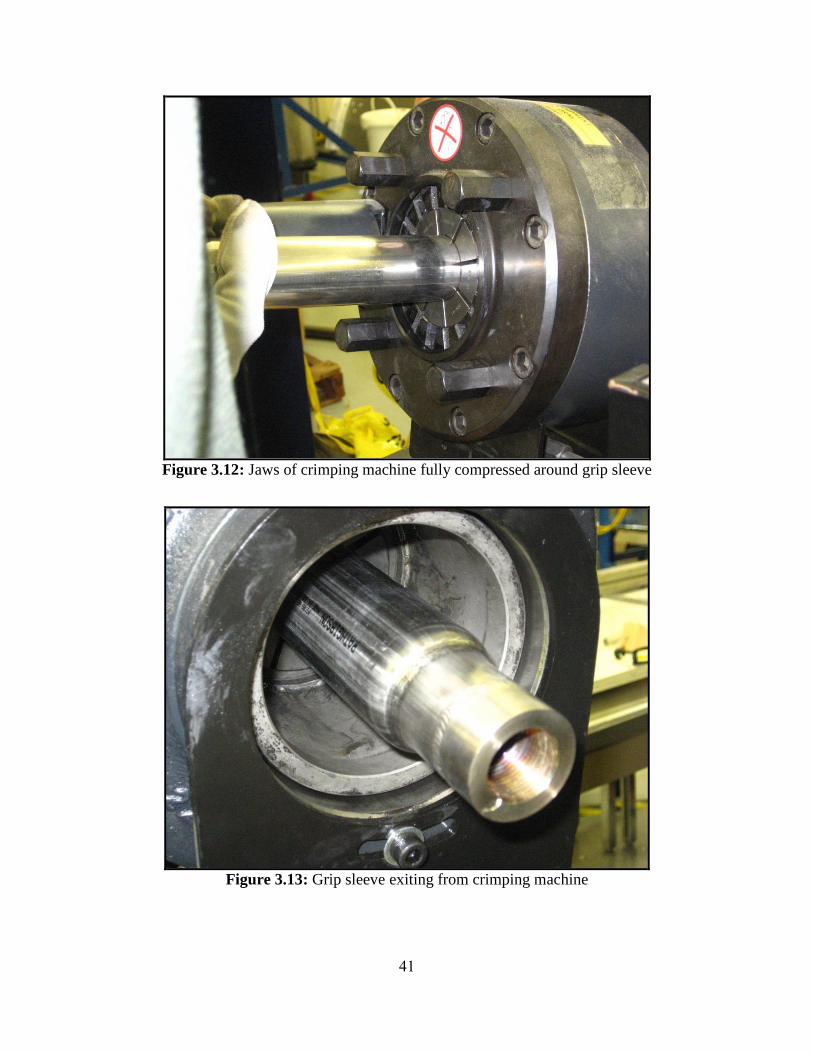
Figure 3.12: Jaws of crimping machine fully compressed around grip sleeve
Figure 3.13: Grip sleeve exiting from crimping machine
41

Figure 3.14: Fully assembled full scale TF pull test sample
Throughout the fabrication process of the full scale sample, the average diameter of the
grip sleeves as well as the overall length of the sample was measured. The results of this
compaction process are displayed in Table 1. Note that the initial and final lengths and
diameters of the sample are highlighted in red.
Table 1: Summary of TF Cable Compaction
Notes regarding compaction process:
The first 6 mm of compaction were done in increments of 0.5 mm, while the final
3 mm in increments of 0.25 mm due to a noticeable overloading of the machine.
42

Each stage of compaction was performed to both sides before moving on to a new
setting.
Multiple breaks were taken during the compaction process to allow the crimping
machine to cool down. The machine used was not equipped with a cooling fan,
nor was it designed to work on continuous duty, and would quickly overheat.
Due to the slow rate of compaction as well as the need to allow the machine to
rest, the entire process took around 12 hours to complete.
The overall length of the sample increased by 0.047 m. during the compaction
process.
Due to the pre-crimping of the sleeves to weld on the tensile lugs, work hardening
over a small area (see Figure 3.15) of the grip sleeve was observed.
Figure 3.15: Work hardened region on pre-crimped sleeve
3.2.4. Method of Attachment to Test Fixture
Having settled on the press-fit sleeve design as the first configuration to test, the
next step was to select a coupling to fasten the grip sleeve to the testing apparatus. This
same coupling would also be used to join the conductor and the winch cable during the
actual cable pull, so it had to be low profile enough to fit through the conduit. Of the
43
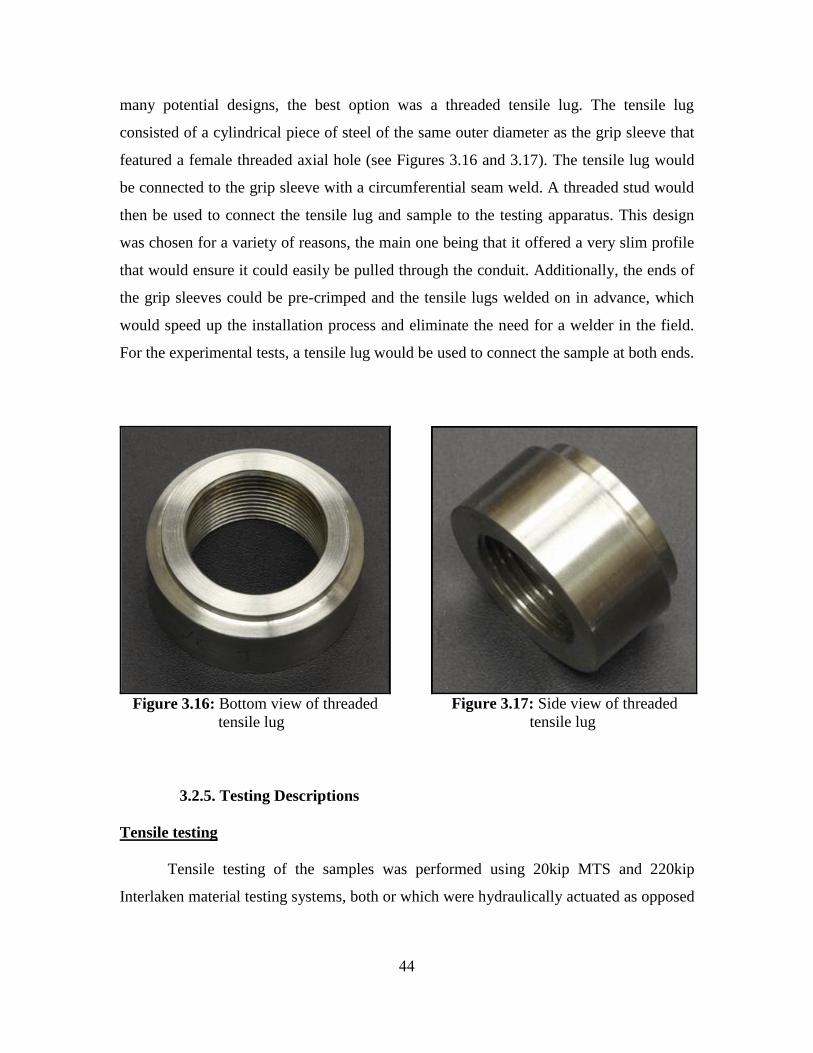
many potential designs, the best option was a threaded tensile lug. The tensile lug
consisted of a cylindrical piece of steel of the same outer diameter as the grip sleeve that
featured a female threaded axial hole (see Figures 3.16 and 3.17). The tensile lug would
be connected to the grip sleeve with a circumferential seam weld. A threaded stud would
then be used to connect the tensile lug and sample to the testing apparatus. This design
was chosen for a variety of reasons, the main one being that it offered a very slim profile
that would ensure it could easily be pulled through the conduit. Additionally, the ends of
the grip sleeves could be pre-crimped and the tensile lugs welded on in advance, which
would speed up the installation process and eliminate the need for a welder in the field.
For the experimental tests, a tensile lug would be used to connect the sample at both ends.
Figure 3.16: Bottom view of threaded
tensile lug
Figure 3.17: Side view of threaded
tensile lug
3.2.5. Testing Descriptions
Tensile testing
Tensile testing of the samples was performed using 20kip MTS and 220kip
Interlaken material testing systems, both or which were hydraulically actuated as opposed
44
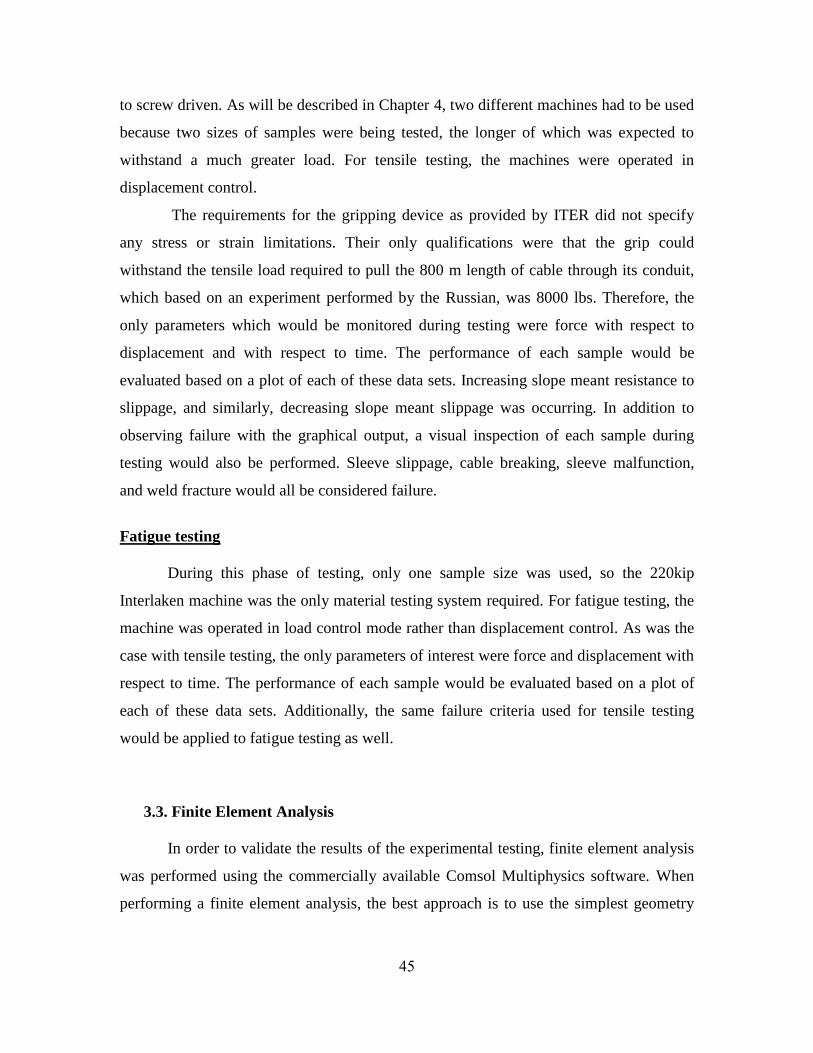
to screw driven. As will be described in Chapter 4, two different machines had to be used
because two sizes of samples were being tested, the longer of which was expected to
withstand a much greater load. For tensile testing, the machines were operated in
displacement control.
The requirements for the gripping device as provided by ITER did not specify
any stress or strain limitations. Their only qualifications were that the grip could
withstand the tensile load required to pull the 800 m length of cable through its conduit,
which based on an experiment performed by the Russian, was 8000 lbs. Therefore, the
only parameters which would be monitored during testing were force with respect to
displacement and with respect to time. The performance of each sample would be
evaluated based on a plot of each of these data sets. Increasing slope meant resistance to
slippage, and similarly, decreasing slope meant slippage was occurring. In addition to
observing failure with the graphical output, a visual inspection of each sample during
testing would also be performed. Sleeve slippage, cable breaking, sleeve malfunction,
and weld fracture would all be considered failure.
Fatigue testing
During this phase of testing, only one sample size was used, so the 220kip
Interlaken machine was the only material testing system required. For fatigue testing, the
machine was operated in load control mode rather than displacement control. As was the
case with tensile testing, the only parameters of interest were force and displacement with
respect to time. The performance of each sample would be evaluated based on a plot of
each of these data sets. Additionally, the same failure criteria used for tensile testing
would be applied to fatigue testing as well.
3.3. Finite Element Analysis
In order to validate the results of the experimental testing, finite element analysis
was performed using the commercially available Comsol Multiphysics software. When
performing a finite element analysis, the best approach is to use the simplest geometry
45

possible that still contains all of the features necessary to recreate the physical situation of
interest. Often times, a three dimensional model can be accurately represented with a two
dimensional model by utilizing axisymmetry. When a three dimensional model is
mandatory and the geometry and stresses are symmetric, another common simplification
is to “quarter” the work piece and only model a fraction of the actual geometry. However,
due to the helical geometry of the work piece that was being modeled, neither of these
simplifications was applicable. Furthermore, due to the complex geometry of the coil we
were modeling, the drawing capabilities of Comsol could not accommodate all of the
features. As a result, Autodesk Inventor CAD software was used to create the coiled
feature of the cables and these parts were then imported into Comsol.
3.3.1. Geometric Modifications
Despite the fact that the traditional geometric modifications were not applicable,
there were still several other ways to reduce the complexity of this model; the first being
to modify the shape of the components. The actual superconducting cable consisted of a
round sleeve with round strands and a round core, but in the FEA models, these same
components were based on octagonal and dodecagonal cross sections. The purpose for
this change came about due to the inability to obtain solutions to models with round
strands in contact with a round grip sleeve. When you consider the contact surface
between circular objects, the problem becomes clear. The contact area between a circular
strand and sleeve is a straight line with no true surface area whereas the octagon and
dodecagon sleeve have an actual surface area that can be calculated (see Figure 3.18 and
3.19). Note that the contact area is represented by the red lines between the surfaces.
46
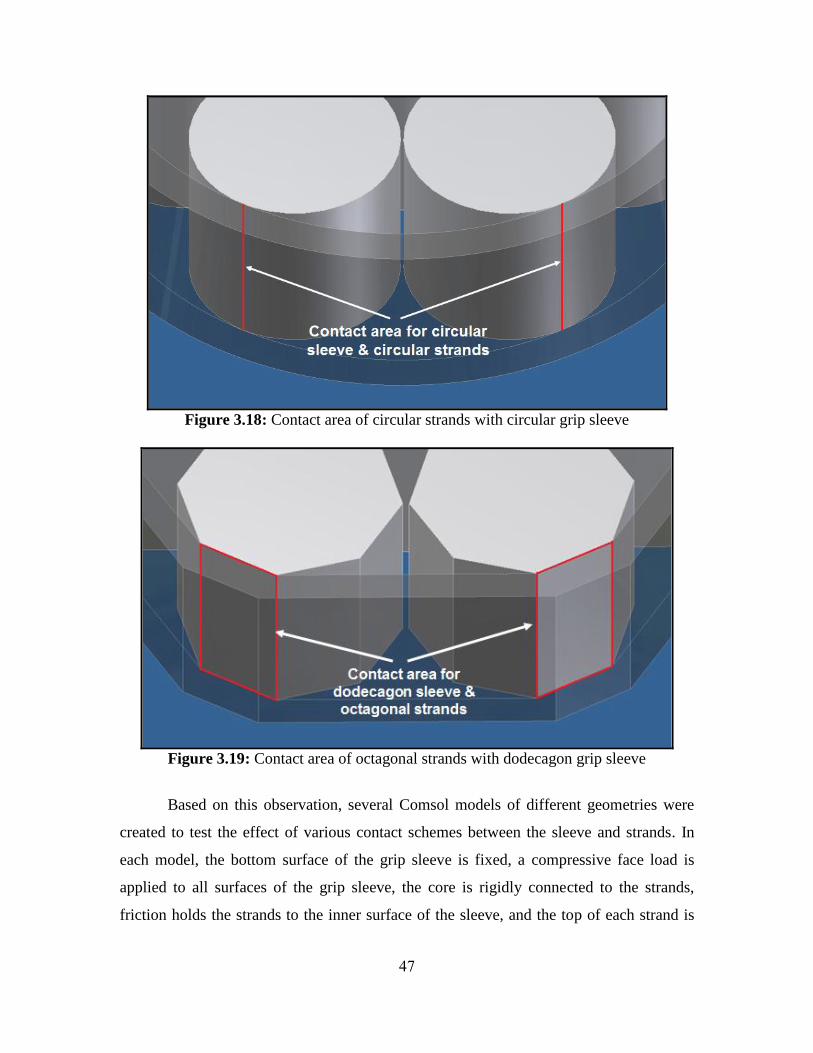
Figure 3.18: Contact area of circular strands with circular grip sleeve
Figure 3.19: Contact area of octagonal strands with dodecagon grip sleeve
Based on this observation, several Comsol models of different geometries were
created to test the effect of various contact schemes between the sleeve and strands. In
each model, the bottom surface of the grip sleeve is fixed, a compressive face load is
applied to all surfaces of the grip sleeve, the core is rigidly connected to the strands,
friction holds the strands to the inner surface of the sleeve, and the top of each strand is
47
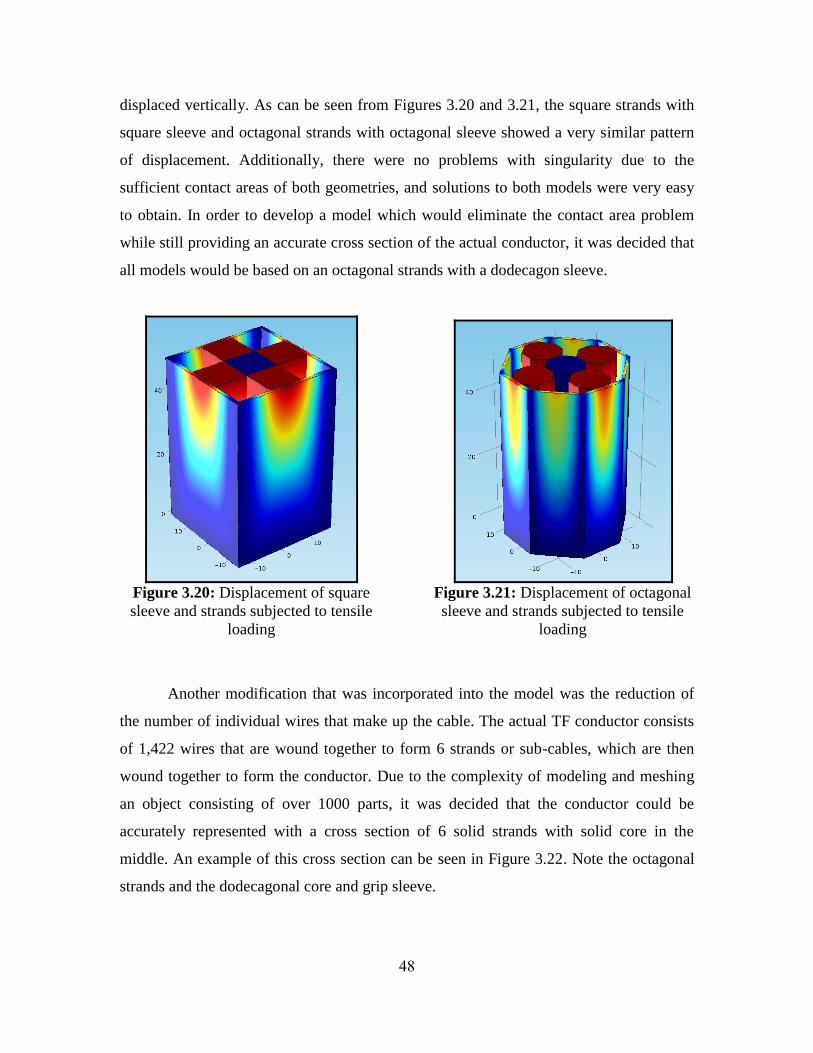
displaced vertically. As can be seen from Figures 3.20 and 3.21, the square strands with
square sleeve and octagonal strands with octagonal sleeve showed a very similar pattern
of displacement. Additionally, there were no problems with singularity due to the
sufficient contact areas of both geometries, and solutions to both models were very easy
to obtain. In order to develop a model which would eliminate the contact area problem
while still providing an accurate cross section of the actual conductor, it was decided that
all models would be based on an octagonal strands with a dodecagon sleeve.
Figure 3.20: Displacement of square
sleeve and strands subjected to tensile
loading
Figure 3.21: Displacement of octagonal
sleeve and strands subjected to tensile
loading
Another modification that was incorporated into the model was the reduction of
the number of individual wires that make up the cable. The actual TF conductor consists
of 1,422 wires that are wound together to form 6 strands or sub-cables, which are then
wound together to form the conductor. Due to the complexity of modeling and meshing
an object consisting of over 1000 parts, it was decided that the conductor could be
accurately represented with a cross section of 6 solid strands with solid core in the
middle. An example of this cross section can be seen in Figure 3.22. Note the octagonal
strands and the dodecagonal core and grip sleeve.
48
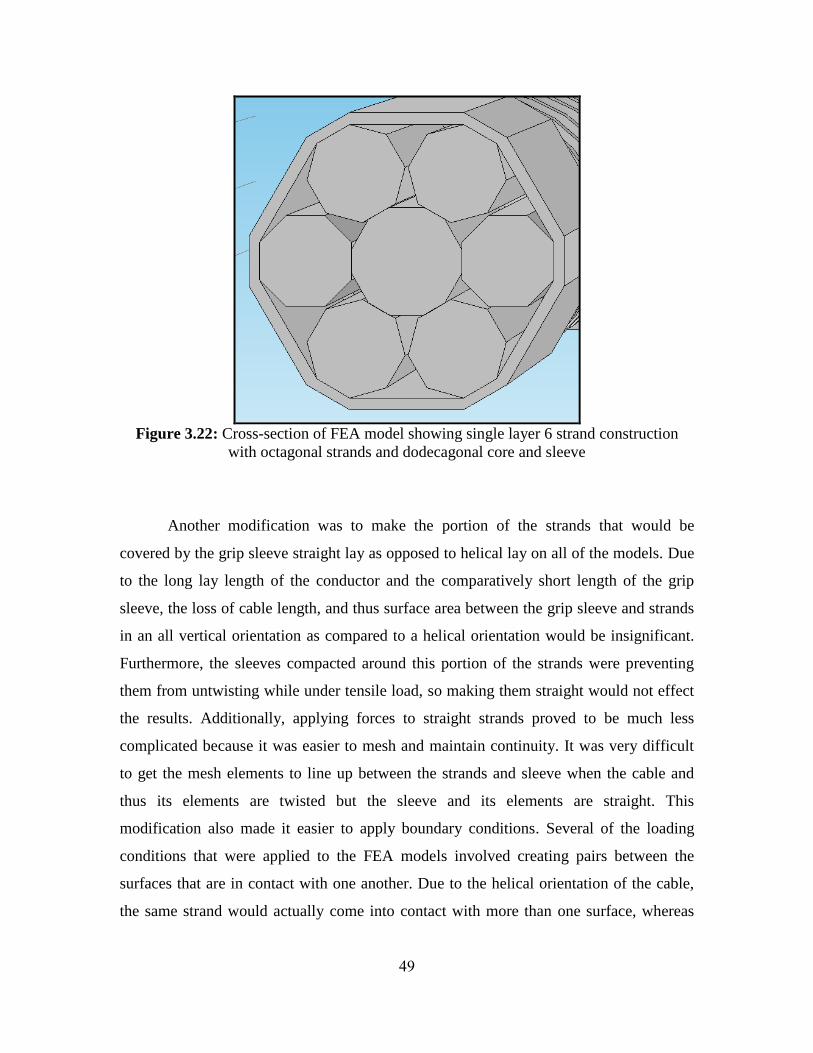
Figure 3.22: Cross-section of FEA model showing single layer 6 strand construction
with octagonal strands and dodecagonal core and sleeve
Another modification was to make the portion of the strands that would be
covered by the grip sleeve straight lay as opposed to helical lay on all of the models. Due
to the long lay length of the conductor and the comparatively short length of the grip
sleeve, the loss of cable length, and thus surface area between the grip sleeve and strands
in an all vertical orientation as compared to a helical orientation would be insignificant.
Furthermore, the sleeves compacted around this portion of the strands were preventing
them from untwisting while under tensile load, so making them straight would not effect
the results. Additionally, applying forces to straight strands proved to be much less
complicated because it was easier to mesh and maintain continuity. It was very difficult
to get the mesh elements to line up between the strands and sleeve when the cable and
thus its elements are twisted but the sleeve and its elements are straight. This
modification also made it easier to apply boundary conditions. Several of the loading
conditions that were applied to the FEA models involved creating pairs between the
surfaces that are in contact with one another. Due to the helical orientation of the cable,
the same strand would actually come into contact with more than one surface, whereas
49

straight strands would only contact one surface. An example of this geometric
modification can be seen in Figure 3.23 below. Note that the coiled portion of the cable is
only 150 mm instead of the actual 500 mm in order to show more detail.
Figure 3.23: FEA model without grip sleeve to show combination of coiled and straight
strand geometry
The final simplification was to model the samples without the tensile lugs
attached to the ends. As was described above, the tensile lugs are only attached to the grip
sleeve and do not interfere with the wires at all. Therefore, a load applied to the tensile
lug would transfer that load to the grip sleeve in the same way that a load could be
applied directly to the grip sleeve.
3.3.2. Solver Settings
In general, Comsol‟s default solvers are sufficient to obtain a solution to a
standard type of model. However, when dealing with a model this complex, several
specific features need to be incorporated into the solver settings to aid in convergence of
a solution. These include a parametric solver and manual scaling of the variables. The
parametric solver assists the standard direct solver in finding a solution by allowing it to
vary the magnitude of the dependent variables over a specified range. For the purposes of
the models used in this analysis, it was tied to the displacement of the grip sleeve. Rather
50

than trying to obtain a solution based on the entire displaced distance right away, the
parametric feature allowed the solvers to begin with a fraction of that distance, then it
would gradually increase that displacement value based on the prescribed range as the
solutions began to converge.
The other crucial solver setting was the use of manual scaling. Manual scaling
refers to the act of reducing the magnitude of the dependent variables in the model by
scaling (or dividing) them by a number which is of the order of their calculated value. For
example, assume that in a structural mechanics problem the displacements are of the
order of 0.0001 m while the stresses are 1,000,000 Pa. The result is likely to be an ill-
conditioned matrix. By scaling the displacement by 10-4
and the stresses by 106, the
resulting variables are now of the order 1 [39]. Comsol is designed to take care of this
procedure automatically, but depending on the complexity of the situation, solution times
will become excessive and in many cases, the solver will reach its maximum number of
iterations before a solution is able to converge. Therefore, if the order of magnitudes of
the variables is known in advance, it is advantageous for the user to scale the variables
themselves.
51

Chapter 4
Results and Discussion
4.1. Experimental Test Results
4.1.1. Preliminary Tests
A series of tensile tests were conducted on the proposed press-fit grip sleeve
configuration to evaluate its feasibility for the 800m TF cable pull. Anticipating that each
trial sample would fail at loads that were less than 20,000 lbs, the trial sample pull tests
were performed using a 20kip MTS 810 Test System. A photograph of this equipment
setup can be seen in Figure 4.1.
Figure 4.1: Equipment Setup for Preliminary Pull Tests
The grip sleeve design that was being tested during this experiment was of the
press-fit configuration, meaning the only connection between the cable and grip sleeve
was the friction force created when the sleeve is compacted around the cable. The grip
sleeves consist of a length of thin wall stainless steel tube which was compacted around a
piece of TF cable. Both samples were based on this same design, the only difference
52

being the perforated steel tube (outer diameter ~ 9.4 mm, wall thickness ~ 1 mm) that
was placed at the core of one of the samples. In subsequent sections of this report, these
samples will be referred to as TF – WC1 and TF – WOC1; TF indicating Toroidal Field
conductor, WC and WOC indicating with and without core, respectively, and 1 being that
these are the first samples in the series. Once both samples were compacted, a small
groove was machined out of the center of the steel sleeve until the strands of the TF cable
were visible around the entire perimeter. The purpose of this groove was to create two
separate grip sleeves that could slip independently when placed in tension. A detailed
schematic of each conductor sample and photographs of their cross-sections can be seen
below in Figures 4.2 and 4.3.
Figure 4.2a: TF – WC1 Schematic Figure 4.2b: TF – WC1 cross-section
53
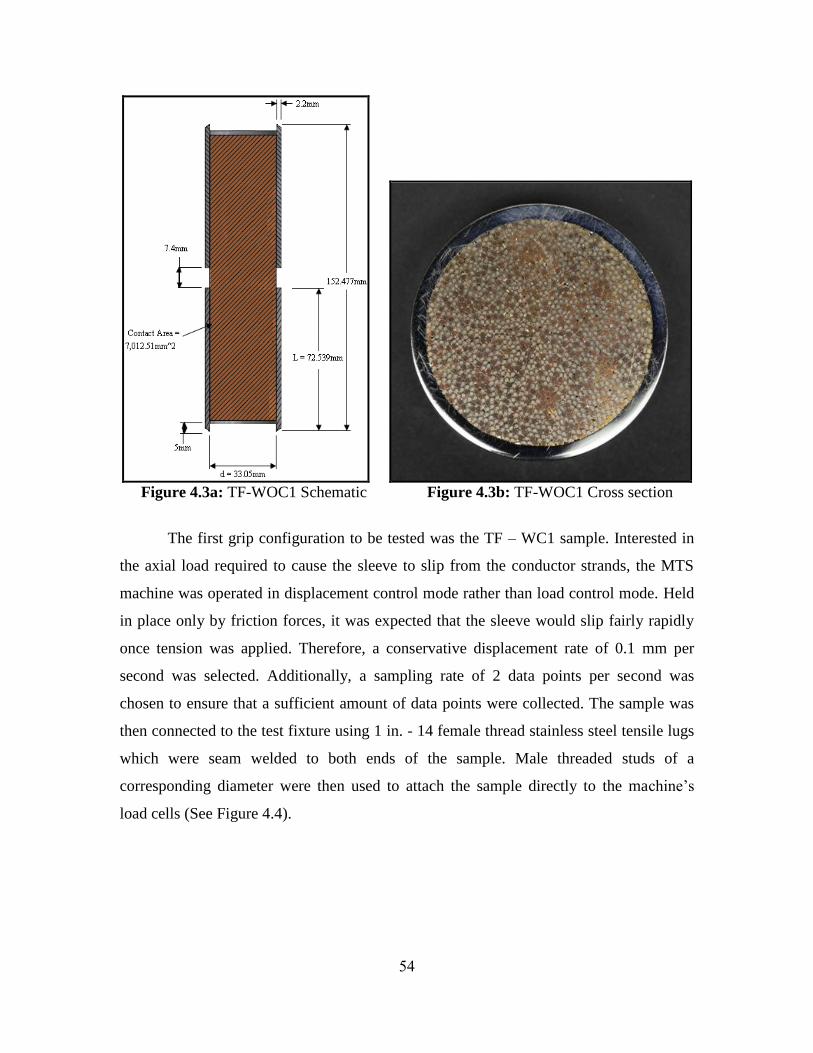
Figure 4.3a: TF-WOC1 Schematic Figure 4.3b: TF-WOC1 Cross section
The first grip configuration to be tested was the TF – WC1 sample. Interested in
the axial load required to cause the sleeve to slip from the conductor strands, the MTS
machine was operated in displacement control mode rather than load control mode. Held
in place only by friction forces, it was expected that the sleeve would slip fairly rapidly
once tension was applied. Therefore, a conservative displacement rate of 0.1 mm per
second was selected. Additionally, a sampling rate of 2 data points per second was
chosen to ensure that a sufficient amount of data points were collected. The sample was
then connected to the test fixture using 1 in. - 14 female thread stainless steel tensile lugs
which were seam welded to both ends of the sample. Male threaded studs of a
corresponding diameter were then used to attach the sample directly to the machine‟s
load cells (See Figure 4.4).
54

Figure 4.4: Threaded stud connected to tensile lug
In order to monitor slip between the grip and cable, an extensometer was
positioned in the gap between the sleeves (See Figure 4.5).
Figure 4.5: Extensometer set-up used in preliminary testing
55

Progress of the test procedure was monitored in real time by a graphical output of
the axial force.
Before testing began on the TF-WOC1 sample, a slight change had to be made to
the test procedure. Reaching its failure load after only 65 seconds, the displacement rate
used for the TF-WC1 sample proved to be a bit too high and was reduced to 0.05 mm per
second. Having obtained sufficient data during the first test, a data sampling rate of 2 data
points per second was chosen for this test as well. Utilizing the same method of
attachment as TF – WC1, this sample was then connected to the MTS machine and the
same loading process was repeated.
Based on the force and displacement data collected during these tests, a series of
plots were created to evaluate the performance of the TF-WC1 sample as compared to the
TF-WOC1 sample. A comparison of the axial force versus time and axial force versus
displacement for both configurations are displayed below in Figures 4.6 and 4.7. For
clarification, a schematic of the samples being compared and a list of their key features
are displayed next to each plot. Note: the number associated with each schematic is also
displayed on the plot next to the data series that it represents.
0
10
20
30
40
50
60
70
80
90
0 2 4 6 8 10 12 14 16 18
Axial Displacement (mm)
Axia
l F
orc
e (k
N)
TF-WOC1: Failure Load 81.28 kN (18,273 lbf)
TF-WC1: Failure Load 64.84 kN (14,578 lbf)
Figure 4.6: Axial Force vs. Displacement for TF-WOC1 and TF-WC1
56

0
10
20
30
40
50
60
70
80
90
0 50 100 150 200 250 300 350
Time (sec)
Ax
ial
Fo
rce (
kN
)
TF-WOC1: Failure Load 81.28 kN (18,273 lbf)
TF-WC1: Failure Load 64.84 kN (14,578 lbf)
Figure 4.7: Axial Force vs. Time for TF-WOC1 and TF-WC1
As can be seen in Figures 4.6 and 4.7, TF-WC1 and TF-WOC1 reached maximum
loads of 64.84 kN (14,578 lbf) and 81.28 kN (18,273 lbf), respectively. Based on these
results, several observations can be made; the first being that both configurations of the
trial grip sleeve withstood substantial loads before failing (slipping). A surprising
observation is that TF-WOC1 failed at a load that was 16.44 kN (3,696 lbf) higher than
TF-WC1. From Figure 4.2a and 4.3a we can calculate the cross-sectional area occupied
by the strands in each sample. For the WOC1 and WC1 samples, this area is about 856
and 831 mm2, respectively. Since both samples share the same number of strands and
were compacted to within 0.8mm of the same outer diameter, one would expect that the
sample with the core tube would experience a higher contact pressure because there is
less area available for the strands. It was surprising to see that the WC1 sample failed at a
lower load than the WOC1 sample. Additional tests need to be conducted to understand
this unexpected behavior. There may be two possible explanations for this behavior: 1)
the hollow perforated tube did not provide enough rigidity (as can be seen from the
deformation of the core tube in Figure 4.2b, and 2) the strands in the WC1 specimen were
deformed beyond their elastic limit (Yield Strength), thereby decreasing the reactive
57

force from the strands on the sleeve. With the help of photomicrographs of these samples,
this issue is further discussed at the end of this section.
Another important observation to make from Figures 4.6 and 4.7 is the decrease
in the load after the specimens reached their maximum value. The decrease in load was
accompanied by the increase in space between the grip sleeves, as can be seen in Figures
4.8 - 4.11. This increase in space suggested that slippage of the grip sleeves with respect
to the strands had occurred.
Figure 4.8: TF-WC1 grip sleeve
position before testing
Figure 4.9: TF-WC1 grip sleeve
position after testing
58

Figure 4.10: TF-WOC1 grip sleeve
position before testing
Figure 4.11: TF-WOC1 grip sleeve
position after testing
In addition to the axial force and displacement data collected by the test system,
an extensometer was also utilized to measure the displacement of the grip sleeves, which
it would then translate to an axial strain value. This particular extensometer was only
capable of measuring up to a 5% extension of its 25.4 mm gauge length, meaning that it
would quickly become ineffective when the sleeves slipped more than 1.27 mm. As can
be seen in Figure 4.12, the recorded data proved to be insignificant as the extensometer
exceeded its limit in a matter of seconds, as indicated by plateau of the load versus axial
strain curves.
59

0
0.5
1
1.5
2
2.5
3
3.5
4
4.5
5
0 5 10 15 20 25
Time (sec)
Axia
l S
train
(%
)
TF-WOC1
TF-WC1
Figure 4.12: Axial Strain for TF-WC1 and TF-WOC1 measured by extensometer
In addition to the numerical results obtained with the MTS data acquisition
software, a physical inspection of each specimen revealed a series of visual effects, one
being the removal of the Chromium coating from the Copper conductor strands. When
the TF cable is created, a thin layer of protective Chromium coating is applied that gives
the cable a gray finish. After the pull test was performed, vertical lines of Copper
appeared on the surface of the conductor strands from where the Chromium was scraped
off as the grip sleeve slipped (See Figures 4.13 and 4.14). It is interesting to note that
these sections of exposed copper took a completely vertical orientation, rather than
following the pitch of the cable.
Extensometer limit
exceeded
60

Figure 4.13: TF – WOC1 Copper Cable Exposure from grip sleeve slippage
Figure 4.14: TF-WC1 Copper Cable Exposure from grip sleeve slippage
61
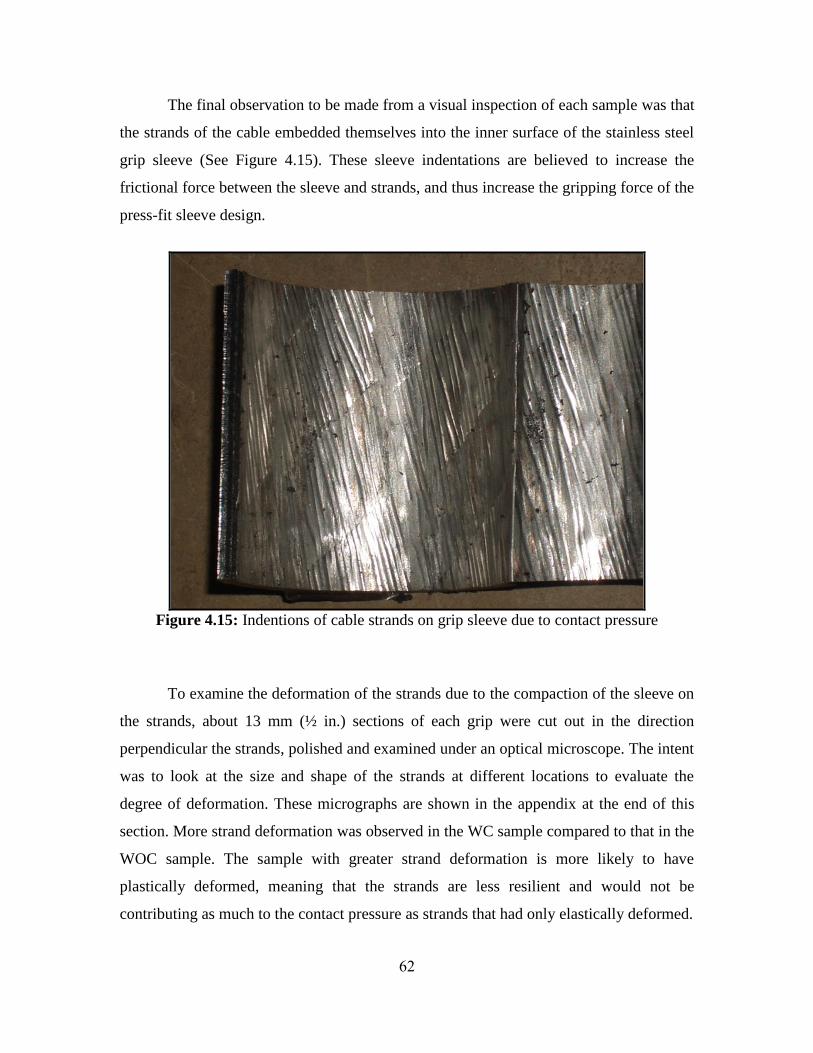
The final observation to be made from a visual inspection of each sample was that
the strands of the cable embedded themselves into the inner surface of the stainless steel
grip sleeve (See Figure 4.15). These sleeve indentations are believed to increase the
frictional force between the sleeve and strands, and thus increase the gripping force of the
press-fit sleeve design.
Figure 4.15: Indentions of cable strands on grip sleeve due to contact pressure
To examine the deformation of the strands due to the compaction of the sleeve on
the strands, about 13 mm (½ in.) sections of each grip were cut out in the direction
perpendicular the strands, polished and examined under an optical microscope. The intent
was to look at the size and shape of the strands at different locations to evaluate the
degree of deformation. These micrographs are shown in the appendix at the end of this
section. More strand deformation was observed in the WC sample compared to that in the
WOC sample. The sample with greater strand deformation is more likely to have
plastically deformed, meaning that the strands are less resilient and would not be
contributing as much to the contact pressure as strands that had only elastically deformed.
62

Based on these results, it can be concluded that the press-fit grip sleeve is an
effective design that shows great potential for use in the 800 m TF cable pull. It can also
be concluded that the TF-WOC1 sample was the more capable of the two variations, and
all future designs should be based on this configuration. Despite the fact that the TF-
WOC1 sample with its 75 mm grip sleeve was capable of a supporting a load greater than
what is required, a second series of tests were performed with a larger grip sleeve. In
addition to the larger grip sleeve, the length of exposed cable between the grip sleeves
was increased to at least 500 mm to allow for one full rotation of the cable based on its
pitch.
4.1.2. Full Scale Testing
Based on the results of the preliminary tests, the grip sleeve design was slightly
modified and a tensile test was performed on the first of six full scale TF press-fit grip
sleeves. Due to insufficient travel and load capacity, the 20 kip MTS testing system used
for the TF-WC1 and TF-WOC1 samples could not be used to test these full size samples.
Therefore, the pull test for the TF-WC2-FS sample was conducted using a 200 kip
Interlaken Series 3300 universal testing machine. For more information regarding the
specifications and construction of this sample, refer to 3.2.3 of this report. Because of the
elevated loads that these specimens would be experiencing, the machine‟s standard
hydraulic wedge grips would not suffice. Therefore, attaching the cable sample to the test
fixture was accomplished using a combination of high strength threaded adapters. The
main portion of the lower mount utilized a static connection, consisting of a 73 mm
(2.875 in.) diameter externally threaded cylindrical coupling with an axial hole that
would accept 25.4 mm (1 in.) diameter male threads. As can be seen in Figure 4.16, this
coupling served as the lower anchor and was threaded directly into the test fixture‟s
hydraulic actuator.
63
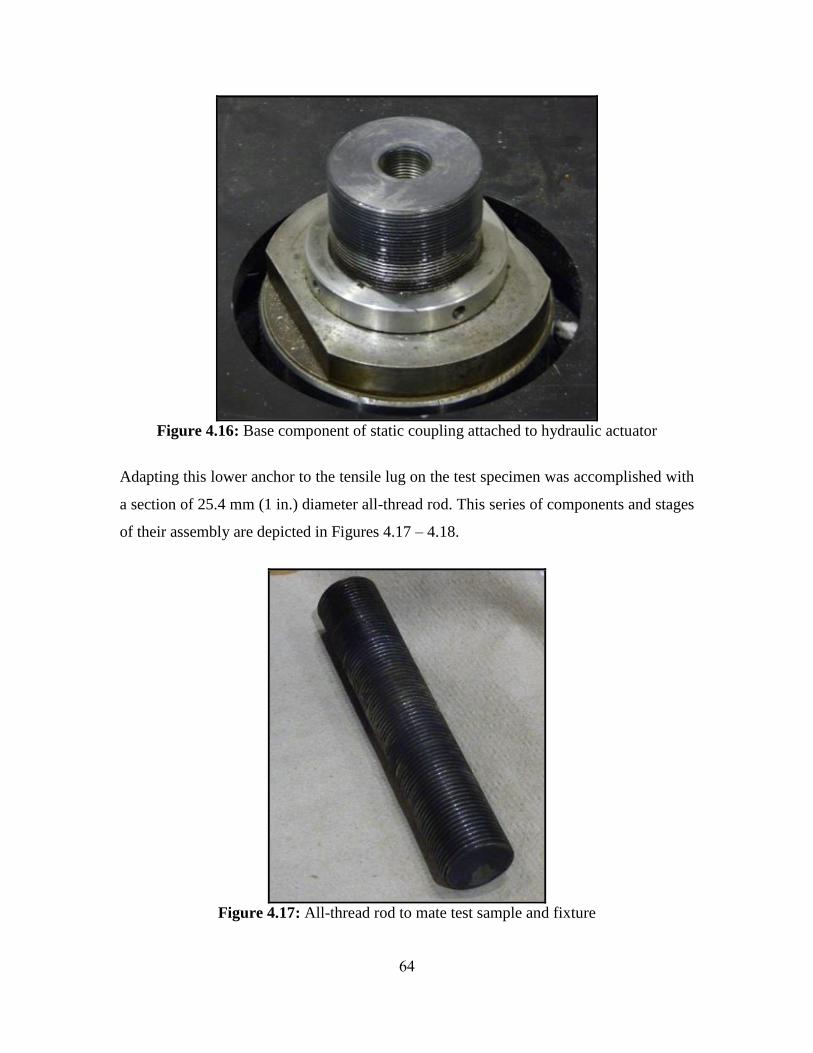
Figure 4.16: Base component of static coupling attached to hydraulic actuator
Adapting this lower anchor to the tensile lug on the test specimen was accomplished with
a section of 25.4 mm (1 in.) diameter all-thread rod. This series of components and stages
of their assembly are depicted in Figures 4.17 – 4.18.
Figure 4.17: All-thread rod to mate test sample and fixture
64

Figure 4.18: Fully assembled static coupling mounted to hydraulic actuator
The upper connection, though similar to the configuration of the lower coupling,
required a more dynamic design. In the previous experiment, static connections were
used at both ends, meaning both ends had to be screwed in simultaneously. Though this
method proved to be effective, it only allowed for partial thread engagement of both
tensile lugs and would need to be improved upon for the higher loadings expected of the
full size samples. Like the lower unit, the upper mount also utilized a 73 mm (2.875 in.)
diameter externally threaded cylindrical coupling to anchor the sample to the cross head
of the testing machine. The difference between this component and the lower
configuration was the way in which it joined the test sample and fixture. Unlike the all-
thread rod used by the lower mount, this piece employed a 31.75 mm (1.25 in.) diameter
unthreaded axial hole and a 25.4 mm (1 in.) unthreaded rod with hemispherical nut. This
combination enabled the coupling to effectively support the test specimen and still
permitted the attachment rod to rotate independently. Not only did this allow the
attachment rod to fully engage the sample‟s upper tensile lug, but it also introduced a
degree of freedom into the system by allowing the sample to rotate as it was subjected to
65
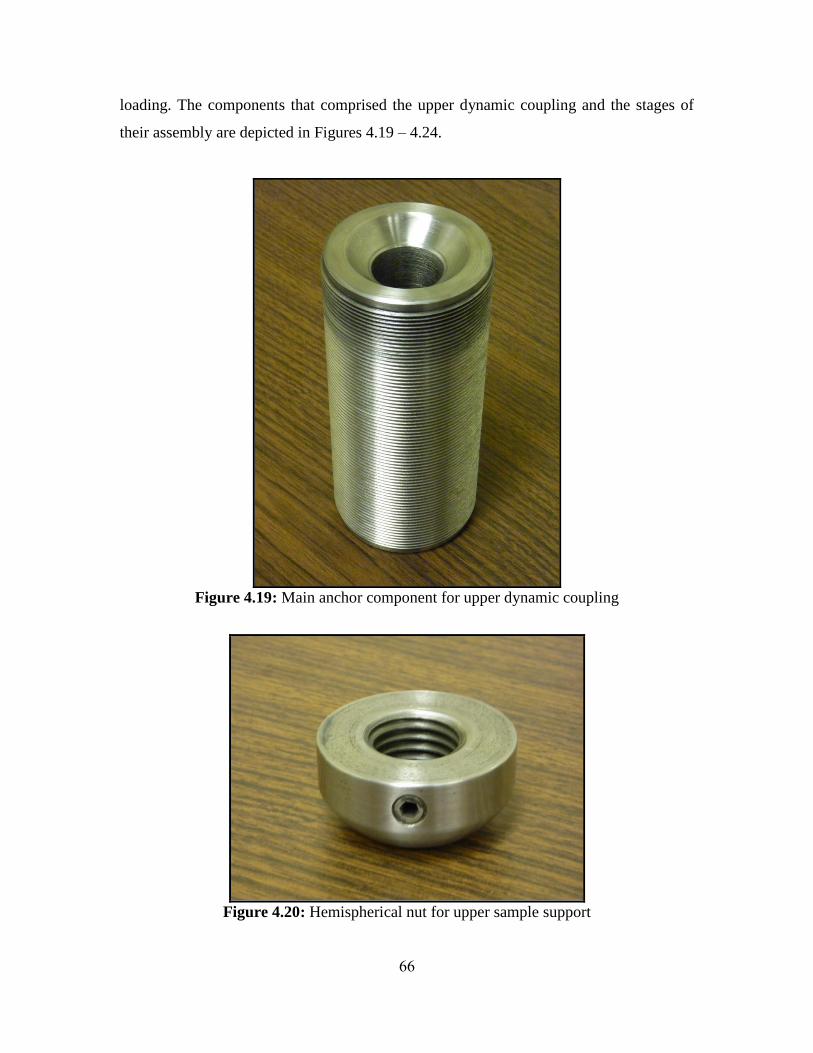
loading. The components that comprised the upper dynamic coupling and the stages of
their assembly are depicted in Figures 4.19 – 4.24.
Figure 4.19: Main anchor component for upper dynamic coupling
Figure 4.20: Hemispherical nut for upper sample support
66

Figure 4.21: Unthreaded attachment rod to join sample and test fixture
Figure 4.22: Assembled upper sample attachment rod
67

Figure 4.23: Assembled dynamic coupling to illustrate attachment rod clearance
Figure 4.24: Fully assembled dynamic coupling installed on cross head
68

Interested in the amount of axial loading that would cause the grip sleeve to
separate from the strands; solid black bands were painted with a permanent marker
around the junctions between the strands and sleeve of the sample. Their purpose was to
serve as a reference point of the initial positions of the grip sleeves, as well as provide a
drastic contrast to the color of the specimen so that slippage could more easily be seen.
An example of one of these colored bands is depicted in Figure 4.25.
Figure 4.25: Contrasting colored band to indicate sleeve slippage
Attachment of the sample to the test fixture began by screwing the hemispherical
nut onto the appropriate end of the unthreaded attachment rod (see Figure 4.22). Next, the
unthreaded attachment rod was inserted into the hole of the 73 mm (2.875 in.) threaded
cylindrical steel coupling, such that the hemispherical nut would match up with the
spherical recess (see Figure 4.23). The attachment rod was then screwed into the tensile
lug of the test specimen as shown in Figure 4.26. It is important to note that the
attachment rod was screwed in until it bottomed out within the grip sleeve. Doing so
ensured that full engagement of the threads within the tensile lug had been obtained. Note
the 31.75 mm (1.25 in.) gap between the top of the tensile lug and bottom of the
cylindrical threaded coupling (see Figure 4.26). This slack was incorporated into the
design of the coupling so that the lower mount could be threaded in without unscrewing
the top.
69

Figure 4.26: Dynamic coupling connected to upper tensile lug
Next, the assembled dynamic coupling was screwed into the cross head as shown in
Figure 4.27.
Figure 4.27: Test specimen mounted to fixture‟s cross head
70

Then, the all-thread rod was screwed into the tensile lug on the bottom of the
sample. As was the case with the upper coupling, the all-thread rod was also screwed into
the tensile lug until it bottomed out (see Figure 4.28).
Figure 4.28: All-thread rod installed in lower tensile lug
The crosshead of the testing machine was then lowered until the all-thread rod
made contact with the lower coupling on the hydraulic actuator. It was then lowered an
additional 31.75 mm (1.25 in.) so that the sample could be screwed in. This was made
possible by the slack between the upper tensile lug and coupling as well as the ability of
the attachment rod of the upper coupling to rotate freely. These stages of assembly are
depicted in Figures 4.29 and 4.30.
71

Figure 4.29: All-thread rod contacting lower coupling
Figure 4.30: Test specimen mounted to fixture‟s hydraulic actuator
72

Finally, the crosshead was raised back up until a load of about 200 lbs. was
applied to the sample. Doing so ensured that any slack left in the system of couplings had
been removed. Note that the sample was also pulled taught enough that it began to
straighten out, as can be seen in Figure 4.31.
Figure 4.31: TF-WC2-FS mounted to Interlaken testing machine
Once the sample was affixed to the test frame, a piece of tape was wrapped
around the all-thread rod that was used to mate the hydraulic actuator and bottom tensile
lug. A vertical line was then drawn onto the tape and another onto the tensile lug directly
above it (see Figure 4.32). The purpose of these lines was to provide a visual reference of
the initial position of the sample so that any rotation that occurred during the loading
process could be monitored.
73

Figure 4.32: Vertical markings to monitor displacement due to rotation
After all of the sample preparation steps were completed, the system‟s data
acquisition software was configured. Interested in determining the load that would cause
the grip sleeve to fail; the test machine was operated in displacement control mode.
Based on the results of the trial samples, it was witnessed that slippage between the
sleeve and conductor occurred fairly rapidly once a load was applied. Therefore, a
relatively low displacement rate of 0.2 cm per minute was selected. Additionally, a
sampling rate of 1 data point per second was chosen to ensure that a sufficient amount of
data points were collected. Lastly, the equipment was activated and progress of the test
procedure was monitored in real time by a graphical output of the axial force versus
displacement. The test was concluded when the specimen was pulled until the stroke of
the machine‟s hydraulic actuator reached its limit.
Based on the force and displacement data collected during the test, a series of
plots were created to evaluate the performance of the TF-WC2-FS sample as compared to
the TF-WOC1 sample. When analyzing this data, it is important to keep in mind that TF-
74
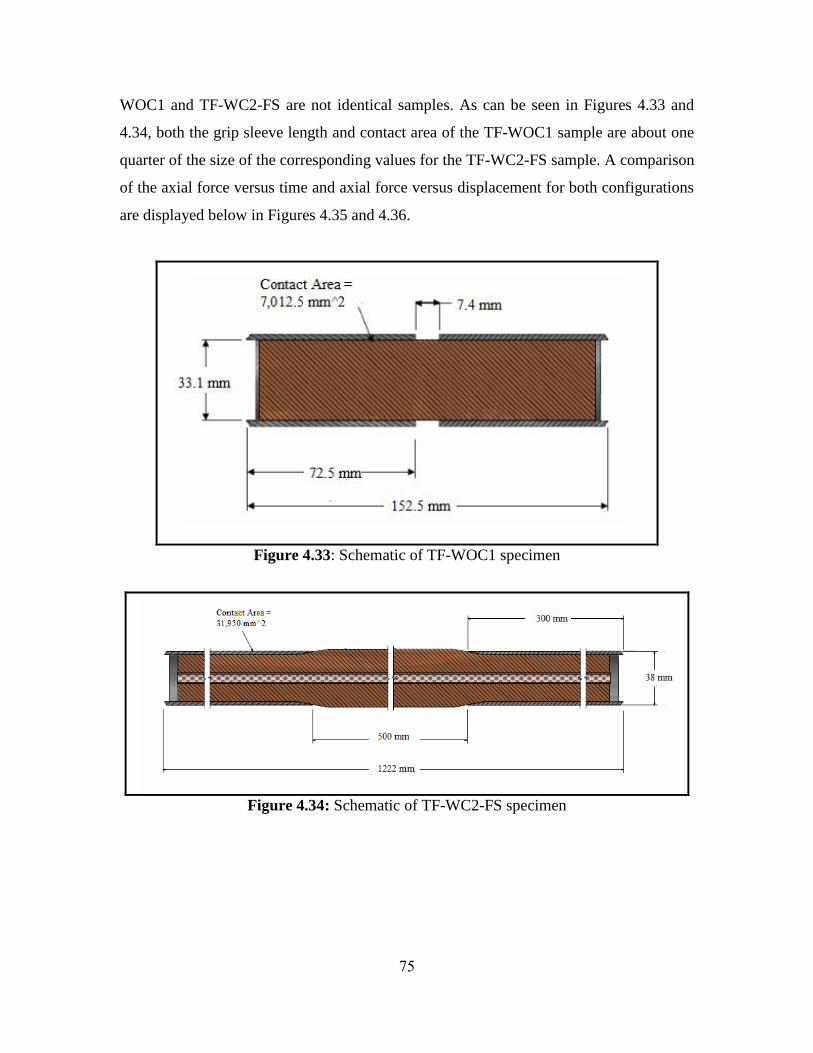
WOC1 and TF-WC2-FS are not identical samples. As can be seen in Figures 4.33 and
4.34, both the grip sleeve length and contact area of the TF-WOC1 sample are about one
quarter of the size of the corresponding values for the TF-WC2-FS sample. A comparison
of the axial force versus time and axial force versus displacement for both configurations
are displayed below in Figures 4.35 and 4.36.
Figure 4.33: Schematic of TF-WOC1 specimen
Figure 4.34: Schematic of TF-WC2-FS specimen
75
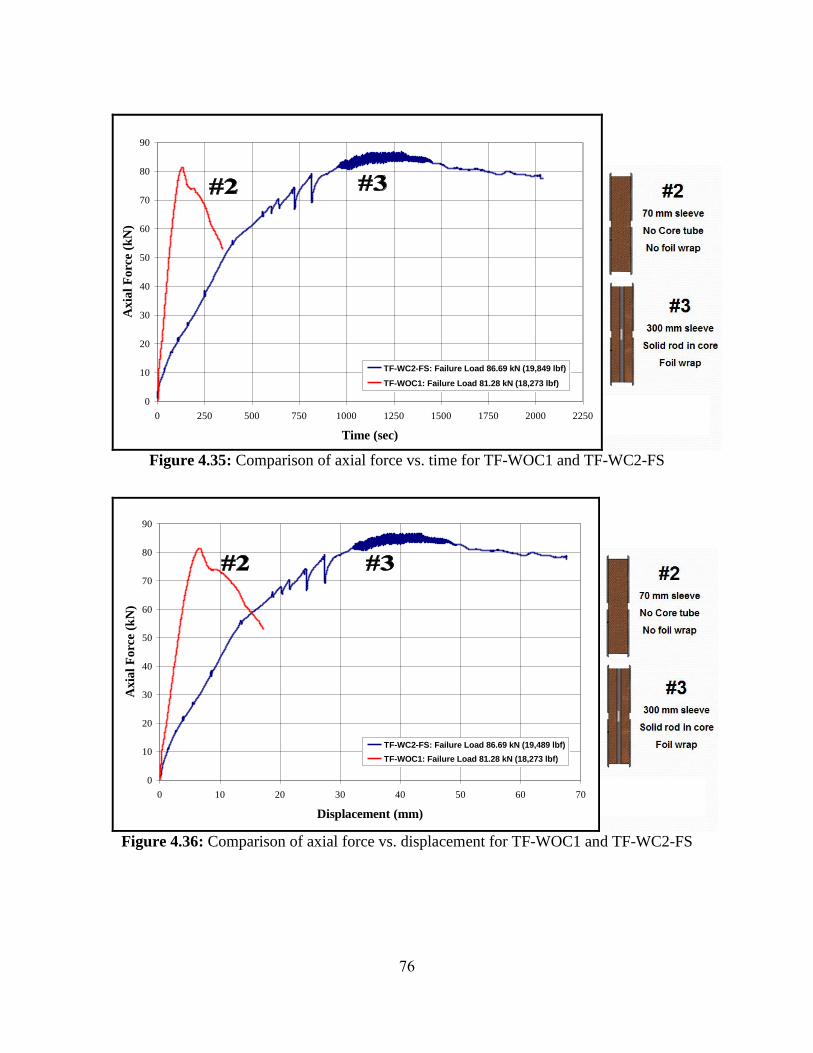
0
10
20
30
40
50
60
70
80
90
0 250 500 750 1000 1250 1500 1750 2000 2250
Time (sec)
Axia
l F
orc
e (k
N)
TF-WC2-FS: Failure Load 86.69 kN (19,849 lbf)
TF-WOC1: Failure Load 81.28 kN (18,273 lbf)
Figure 4.35: Comparison of axial force vs. time for TF-WOC1 and TF-WC2-FS
0
10
20
30
40
50
60
70
80
90
0 10 20 30 40 50 60 70
Displacement (mm)
Axia
l F
orc
e (k
N)
TF-WC2-FS: Failure Load 86.69 kN (19,489 lbf)
TF-WOC1: Failure Load 81.28 kN (18,273 lbf)
Figure 4.36: Comparison of axial force vs. displacement for TF-WOC1 and TF-WC2-FS
76
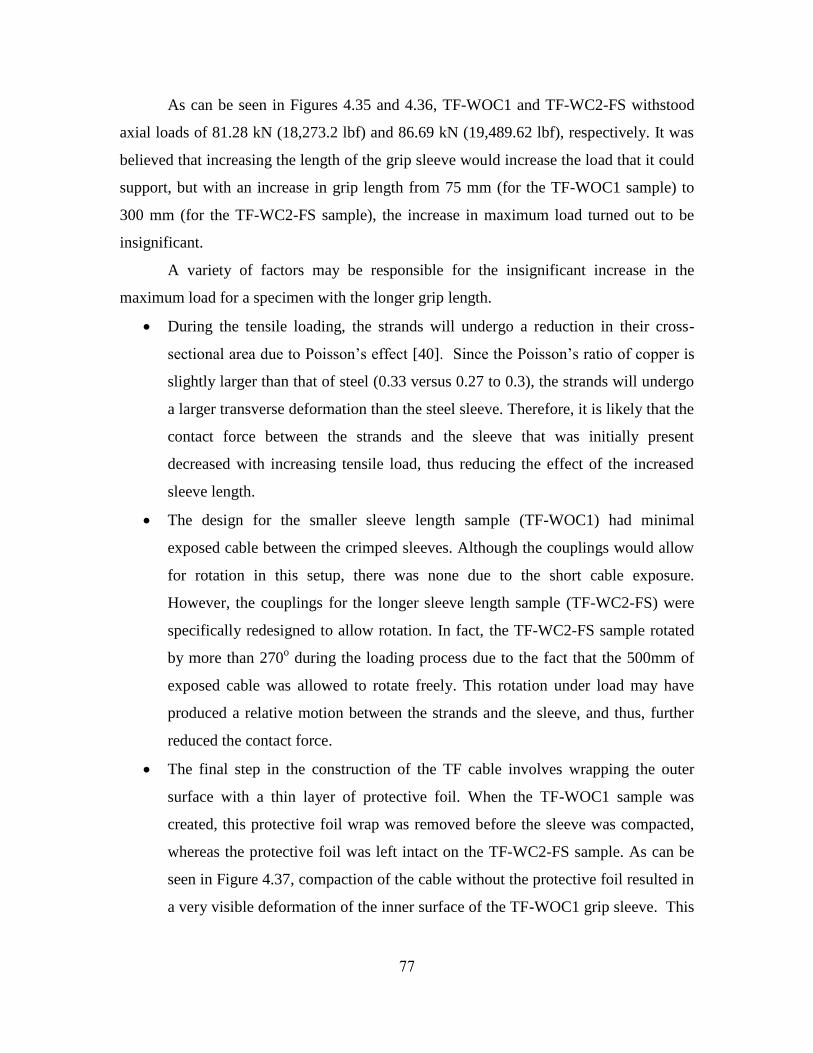
As can be seen in Figures 4.35 and 4.36, TF-WOC1 and TF-WC2-FS withstood
axial loads of 81.28 kN (18,273.2 lbf) and 86.69 kN (19,489.62 lbf), respectively. It was
believed that increasing the length of the grip sleeve would increase the load that it could
support, but with an increase in grip length from 75 mm (for the TF-WOC1 sample) to
300 mm (for the TF-WC2-FS sample), the increase in maximum load turned out to be
insignificant.
A variety of factors may be responsible for the insignificant increase in the
maximum load for a specimen with the longer grip length.
During the tensile loading, the strands will undergo a reduction in their cross-
sectional area due to Poisson‟s effect [40]. Since the Poisson‟s ratio of copper is
slightly larger than that of steel (0.33 versus 0.27 to 0.3), the strands will undergo
a larger transverse deformation than the steel sleeve. Therefore, it is likely that the
contact force between the strands and the sleeve that was initially present
decreased with increasing tensile load, thus reducing the effect of the increased
sleeve length.
The design for the smaller sleeve length sample (TF-WOC1) had minimal
exposed cable between the crimped sleeves. Although the couplings would allow
for rotation in this setup, there was none due to the short cable exposure.
However, the couplings for the longer sleeve length sample (TF-WC2-FS) were
specifically redesigned to allow rotation. In fact, the TF-WC2-FS sample rotated
by more than 270o during the loading process due to the fact that the 500mm of
exposed cable was allowed to rotate freely. This rotation under load may have
produced a relative motion between the strands and the sleeve, and thus, further
reduced the contact force.
The final step in the construction of the TF cable involves wrapping the outer
surface with a thin layer of protective foil. When the TF-WOC1 sample was
created, this protective foil wrap was removed before the sleeve was compacted,
whereas the protective foil was left intact on the TF-WC2-FS sample. As can be
seen in Figure 4.37, compaction of the cable without the protective foil resulted in
a very visible deformation of the inner surface of the TF-WOC1 grip sleeve. This
77
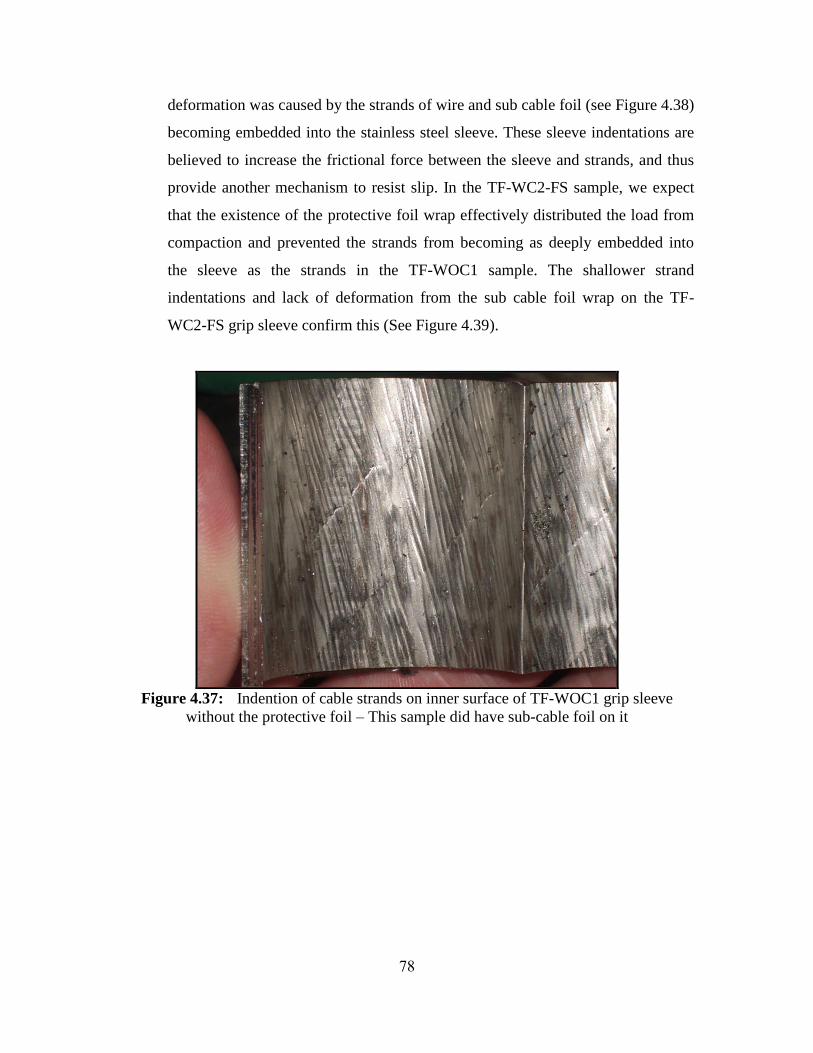
deformation was caused by the strands of wire and sub cable foil (see Figure 4.38)
becoming embedded into the stainless steel sleeve. These sleeve indentations are
believed to increase the frictional force between the sleeve and strands, and thus
provide another mechanism to resist slip. In the TF-WC2-FS sample, we expect
that the existence of the protective foil wrap effectively distributed the load from
compaction and prevented the strands from becoming as deeply embedded into
the sleeve as the strands in the TF-WOC1 sample. The shallower strand
indentations and lack of deformation from the sub cable foil wrap on the TF-
WC2-FS grip sleeve confirm this (See Figure 4.39).
Figure 4.37: Indention of cable strands on inner surface of TF-WOC1 grip sleeve
without the protective foil – This sample did have sub-cable foil on it
78

Figure 4.38: Conductor cable showing sub-cable foil wrap
Figure 4.39: Indention of cable strands on inner surface of TF-WC2 grip sleeve with
the protective foil – This sample also had sub-cable foil on it
The diameters and lengths of the grip sleeves were measured before and after the
tensile testing. Due to the lack of uniformity in the swaging process, the diameters
of the samples were not equal at all locations (the values varying from 37.87 mm
to 38.02 mm). Because of this level of inconsistency, the diameter of each sleeve
was checked at three axial positions, which included both ends and the center.
This lack of uniformity was also present in the radial direction. As a result, sleeve
diameters were measured at two positions (from 12 to 6 o‟clock and from 3 to 9
o‟clock), and their average was taken. To ensure consistency, grip sleeve lengths
were measured from the outside edge of the tensile lug to the end of the sleeve
where the strands become exposed. Unlike the sleeve diameter, the sleeve lengths
did not show any variations when checked from different positions. Schematics
79
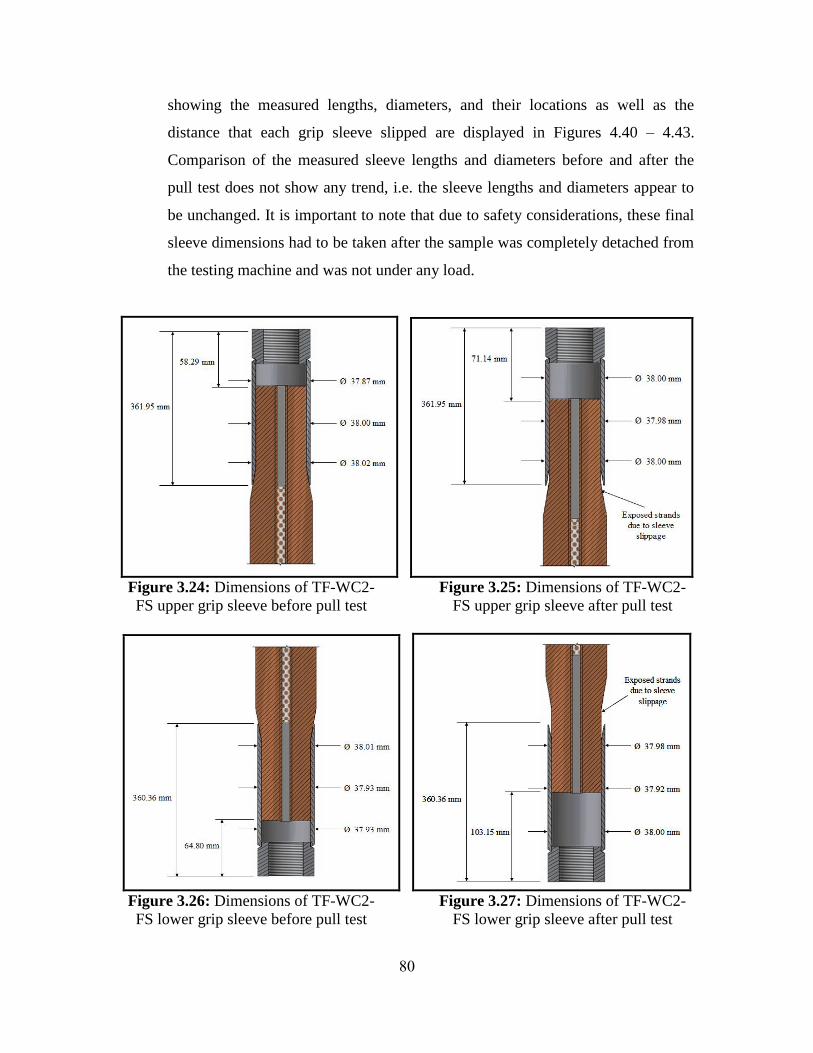
showing the measured lengths, diameters, and their locations as well as the
distance that each grip sleeve slipped are displayed in Figures 4.40 – 4.43.
Comparison of the measured sleeve lengths and diameters before and after the
pull test does not show any trend, i.e. the sleeve lengths and diameters appear to
be unchanged. It is important to note that due to safety considerations, these final
sleeve dimensions had to be taken after the sample was completely detached from
the testing machine and was not under any load.
Figure 3.24: Dimensions of TF-WC2-
FS upper grip sleeve before pull test
Figure 3.25: Dimensions of TF-WC2-
FS upper grip sleeve after pull test
Figure 3.26: Dimensions of TF-WC2-
FS lower grip sleeve before pull test
Figure 3.27: Dimensions of TF-WC2-
FS lower grip sleeve after pull test
80
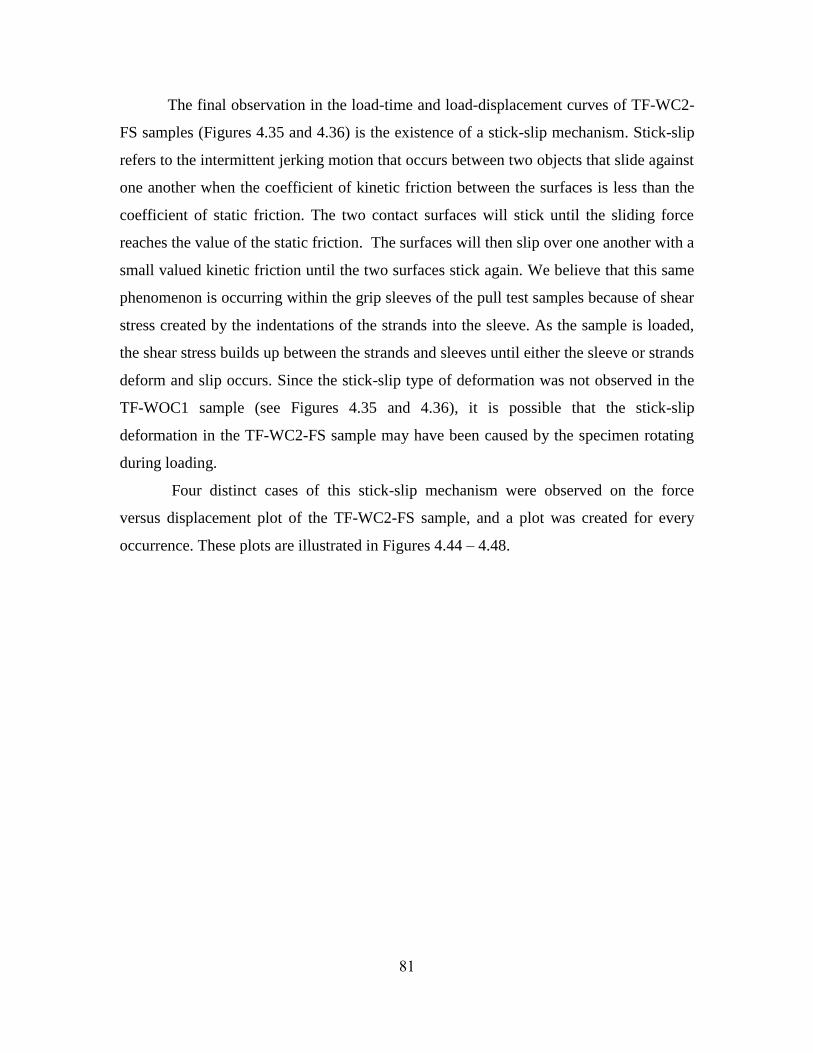
The final observation in the load-time and load-displacement curves of TF-WC2-
FS samples (Figures 4.35 and 4.36) is the existence of a stick-slip mechanism. Stick-slip
refers to the intermittent jerking motion that occurs between two objects that slide against
one another when the coefficient of kinetic friction between the surfaces is less than the
coefficient of static friction. The two contact surfaces will stick until the sliding force
reaches the value of the static friction. The surfaces will then slip over one another with a
small valued kinetic friction until the two surfaces stick again. We believe that this same
phenomenon is occurring within the grip sleeves of the pull test samples because of shear
stress created by the indentations of the strands into the sleeve. As the sample is loaded,
the shear stress builds up between the strands and sleeves until either the sleeve or strands
deform and slip occurs. Since the stick-slip type of deformation was not observed in the
TF-WOC1 sample (see Figures 4.35 and 4.36), it is possible that the stick-slip
deformation in the TF-WC2-FS sample may have been caused by the specimen rotating
during loading.
Four distinct cases of this stick-slip mechanism were observed on the force
versus displacement plot of the TF-WC2-FS sample, and a plot was created for every
occurrence. These plots are illustrated in Figures 4.44 – 4.48.
81

0
10
20
30
40
50
60
70
0 2 4 6 8 10 12 14 16 18 20
Displacement (mm)
Axia
l F
orc
e (k
N)
Figure 4.44: First occurrence of stick-slip mechanism for TF-WC2-FS
64
66
68
70
72
20 20.5 21 21.5 22 22.5 23
Displacement (mm)
Axia
l F
orc
e (k
N)
Figure 4.45: Second occurrence of stick-slip mechanism for TF-WC2-FS
82

65
70
75
80
85
23 24 25 26 27 28 29 30 31 32
Displacement (mm)
Axia
l F
orc
e (k
N)
Figure 4.46: Third occurrence of stick-slip mechanism for TF-WC2-FS
80
81
82
83
84
85
86
87
31 33 35 37 39 41 43 45 47 49
Displacement (mm)
Axia
l F
orc
e (k
N)
Figure 4.47: Fourth occurrence of stick-slip mechanism for TF-WC2-FS
83

82
83
84
85
86
87
39 39.25 39.5 39.75 40 40.25 40.5 40.75 41
Displacement (mm)
Axia
l F
orc
e (k
N)
Figure 4.48: Close-up of fourth occurrence of stick-slip for TF-WC2-FS to show
constant magnitude of oscillation
The four occurrences of stick-slip were identified based on the magnitude of the
oscillations that were visible on the force versus displacement plots. As can be seen in
Figures 4.44 – 4.48, the magnitude of the oscillations increased with increasing axial
load, until a value of ~82 kN was reached. At this point, the slope of the force versus
displacement curve leveled out and the magnitude of the oscillations remained constant
for about 400 seconds. Eventually these oscillations began to die out as the failure mode
transitioned from stick-slip to a strictly slip condition. This trend indicates that the critical
load of the system had been reached. The force versus displacement plot for the TF-
WOC1 sample clearly illustrates this trend because of its rapid decrease in slope as soon
as 81 kN was reached. It is interesting to note that these same oscillations were not nearly
as visible on the TF-WOC1 curve as they were on the TF-WC2-FS curve.
Several photographs (see Appendix B) of the regions painted with permanent
marker were taken during the loading process. These photographs show the slippage
84

between the sleeve and strands as tensile load increased. The photographs are presented
in chronological order, beginning with the lower painted strand/sleeve junction.
4.1.3. Modified Grip Design
Based on the results of the first full scale test, tensile tests were performed on the
second and third of six full scale TF press-fit grip sleeves. Both of these samples shared
the same basic dimensions as the previous specimen (TF-WC2-FS, refer to Section
4.1.2.). The pull tests for the TF-WC3-FS and TF-WC4-FS samples were also conducted
with the same universal testing machine. Due to the similarities between the samples and
the fact that one of the intents of these tests was to establish repeatability, all of the
previous testing parameters remained unchanged. Among these included the method of
attachment to the testing apparatus, equipment settings such as displacement rate and data
sampling rate, and testing procedure.
In hopes of improving upon the performance of the TF-WC2-FS sample, the
previous grip sleeve design received three distinct modifications.
1. The first of these modifications, which was incorporated into both TF-WC3-FS
and TF-WC4-FS, was the removal of the protective foil wrap from the sections of
cable that would be compacted within the grip sleeves. As was witnessed with the
TF-WC1 and TF-WOC1 samples, removal of the protective foil allowed the
strands of wire to become embedded into the inner surface of the grip sleeves.
This interference between the grip sleeve and strands of wire is believed to
increase the frictional force between these surfaces and provide another
mechanism to resist slip.
Removal of the protective foil wrap began by wrapping each end of the cable with
tape so that the foil would not prematurely unwrap. Next, grip sleeves were slid
over each end of the cable and reference lines were painted on the foil to indicate
the length of cable that was covered by the grip sleeve. The grip sleeves were then
85
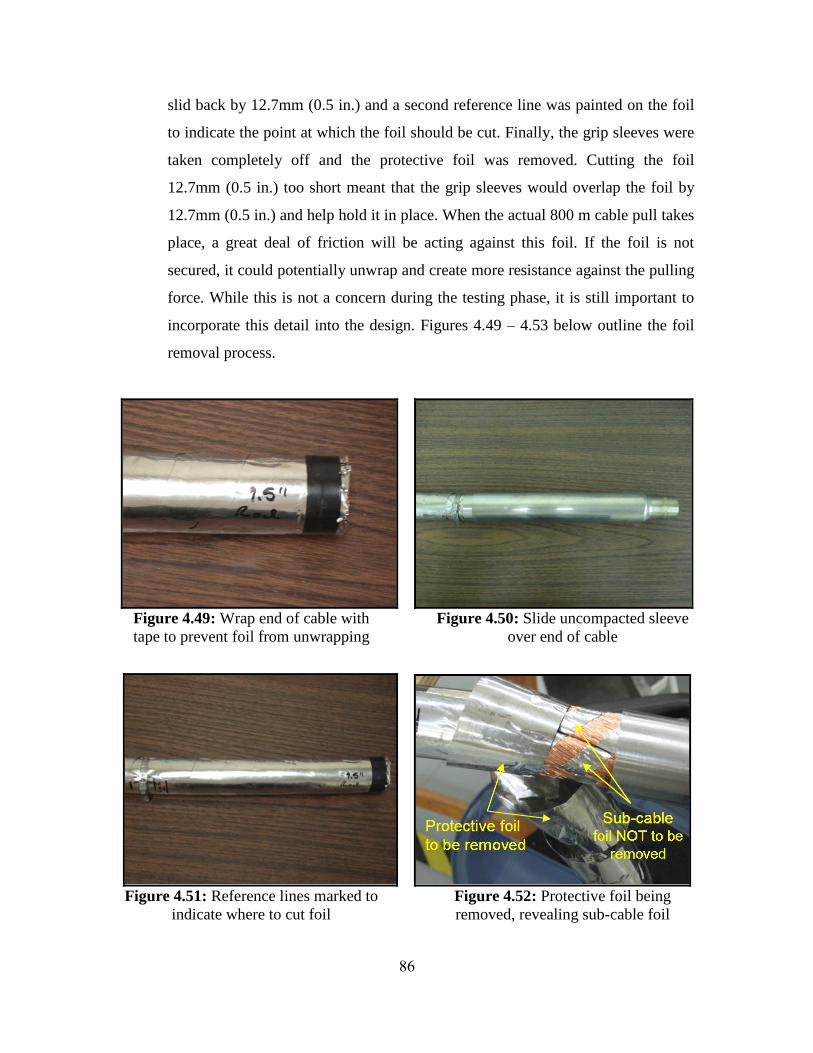
slid back by 12.7mm (0.5 in.) and a second reference line was painted on the foil
to indicate the point at which the foil should be cut. Finally, the grip sleeves were
taken completely off and the protective foil was removed. Cutting the foil
12.7mm (0.5 in.) too short meant that the grip sleeves would overlap the foil by
12.7mm (0.5 in.) and help hold it in place. When the actual 800 m cable pull takes
place, a great deal of friction will be acting against this foil. If the foil is not
secured, it could potentially unwrap and create more resistance against the pulling
force. While this is not a concern during the testing phase, it is still important to
incorporate this detail into the design. Figures 4.49 – 4.53 below outline the foil
removal process.
Figure 4.49: Wrap end of cable with
tape to prevent foil from unwrapping
Figure 4.50: Slide uncompacted sleeve
over end of cable
Figure 4.51: Reference lines marked to
indicate where to cut foil
Figure 4.52: Protective foil being
removed, revealing sub-cable foil
86
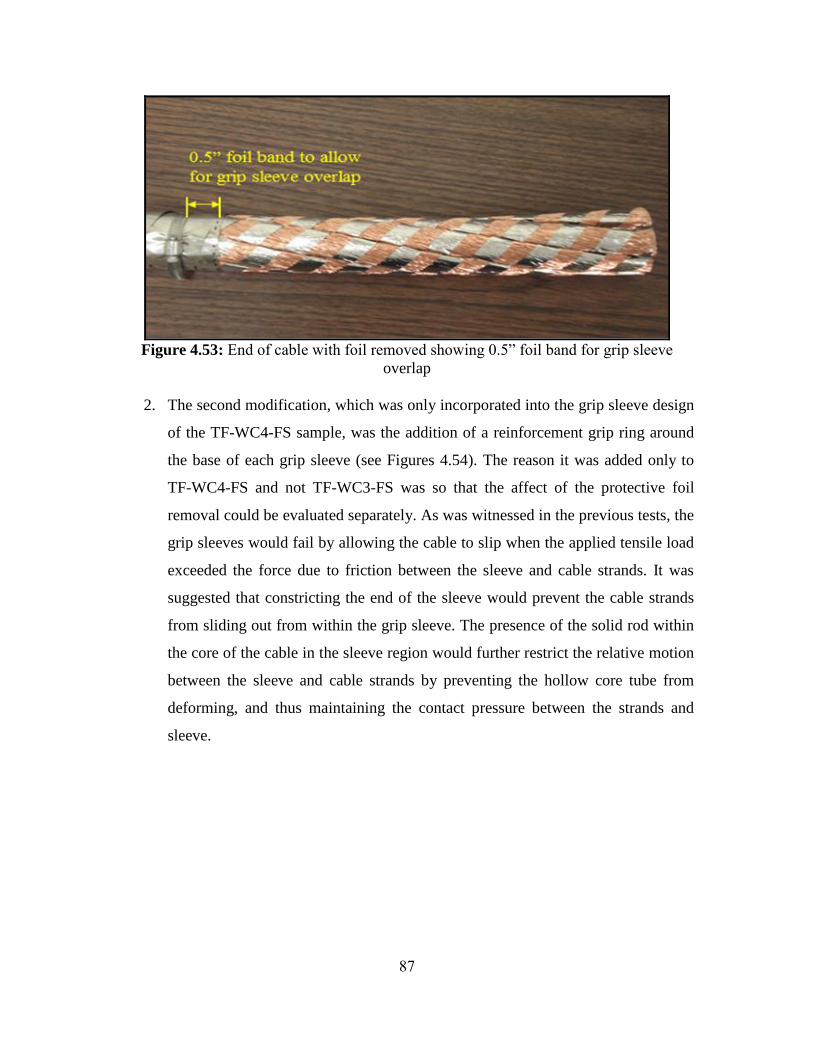
Figure 4.53: End of cable with foil removed showing 0.5” foil band for grip sleeve
overlap
2. The second modification, which was only incorporated into the grip sleeve design
of the TF-WC4-FS sample, was the addition of a reinforcement grip ring around
the base of each grip sleeve (see Figures 4.54). The reason it was added only to
TF-WC4-FS and not TF-WC3-FS was so that the affect of the protective foil
removal could be evaluated separately. As was witnessed in the previous tests, the
grip sleeves would fail by allowing the cable to slip when the applied tensile load
exceeded the force due to friction between the sleeve and cable strands. It was
suggested that constricting the end of the sleeve would prevent the cable strands
from sliding out from within the grip sleeve. The presence of the solid rod within
the core of the cable in the sleeve region would further restrict the relative motion
between the sleeve and cable strands by preventing the hollow core tube from
deforming, and thus maintaining the contact pressure between the strands and
sleeve.
87
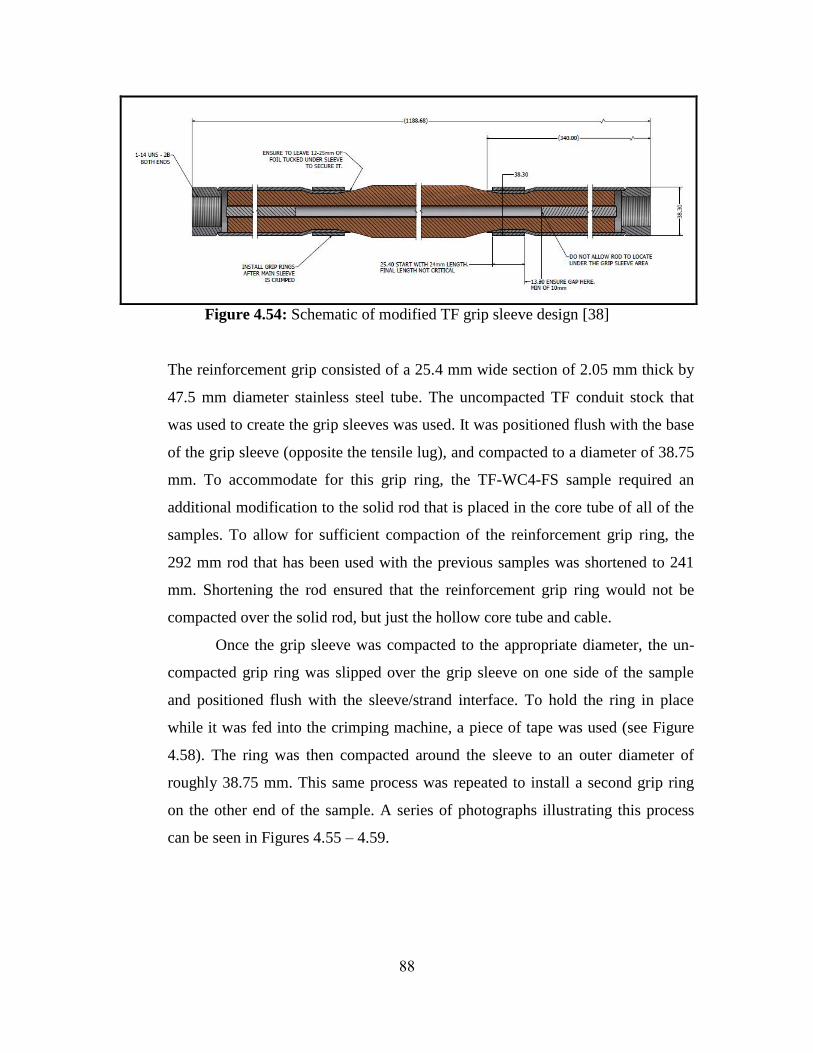
Figure 4.54: Schematic of modified TF grip sleeve design [38]
The reinforcement grip consisted of a 25.4 mm wide section of 2.05 mm thick by
47.5 mm diameter stainless steel tube. The uncompacted TF conduit stock that
was used to create the grip sleeves was used. It was positioned flush with the base
of the grip sleeve (opposite the tensile lug), and compacted to a diameter of 38.75
mm. To accommodate for this grip ring, the TF-WC4-FS sample required an
additional modification to the solid rod that is placed in the core tube of all of the
samples. To allow for sufficient compaction of the reinforcement grip ring, the
292 mm rod that has been used with the previous samples was shortened to 241
mm. Shortening the rod ensured that the reinforcement grip ring would not be
compacted over the solid rod, but just the hollow core tube and cable.
Once the grip sleeve was compacted to the appropriate diameter, the un-
compacted grip ring was slipped over the grip sleeve on one side of the sample
and positioned flush with the sleeve/strand interface. To hold the ring in place
while it was fed into the crimping machine, a piece of tape was used (see Figure
4.58). The ring was then compacted around the sleeve to an outer diameter of
roughly 38.75 mm. This same process was repeated to install a second grip ring
on the other end of the sample. A series of photographs illustrating this process
can be seen in Figures 4.55 – 4.59.
88
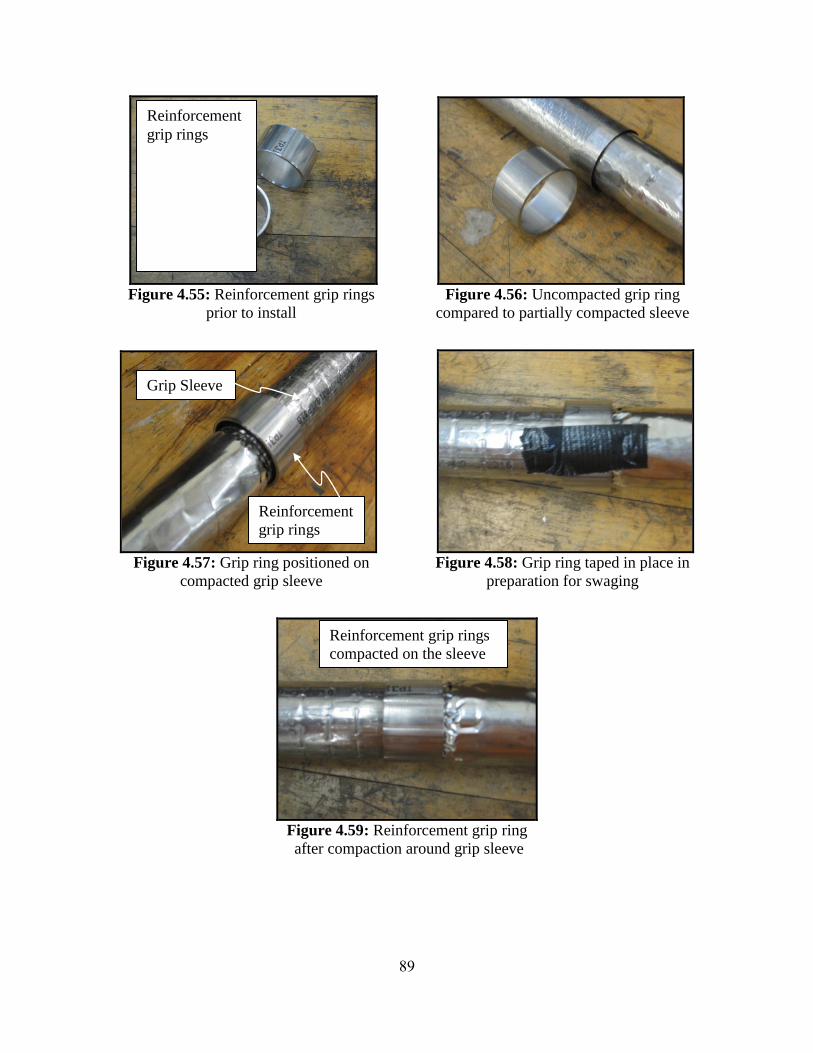
Figure 4.55: Reinforcement grip rings
prior to install
Figure 4.56: Uncompacted grip ring
compared to partially compacted sleeve
Figure 4.57: Grip ring positioned on
compacted grip sleeve
Figure 4.58: Grip ring taped in place in
preparation for swaging
Figure 4.59: Reinforcement grip ring
after compaction around grip sleeve
Reinforcement
grip rings
Reinforcement
grip rings
Grip Sleeve
Reinforcement grip rings
compacted on the sleeve
89
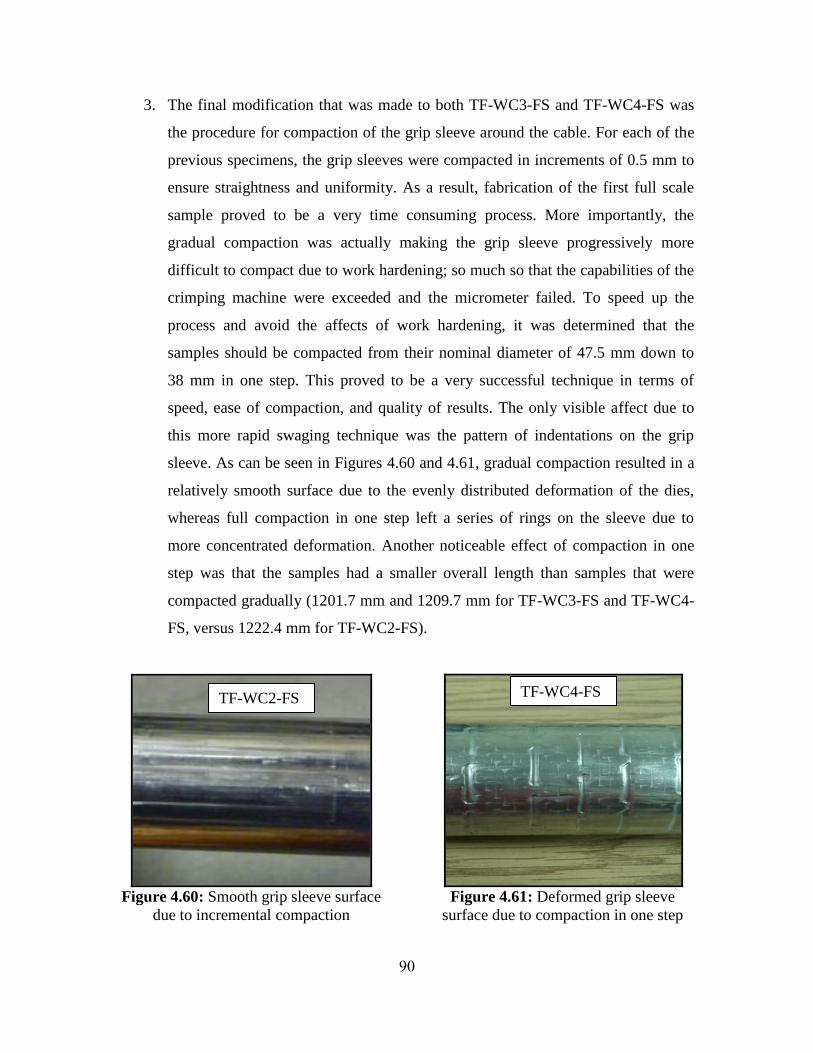
3. The final modification that was made to both TF-WC3-FS and TF-WC4-FS was
the procedure for compaction of the grip sleeve around the cable. For each of the
previous specimens, the grip sleeves were compacted in increments of 0.5 mm to
ensure straightness and uniformity. As a result, fabrication of the first full scale
sample proved to be a very time consuming process. More importantly, the
gradual compaction was actually making the grip sleeve progressively more
difficult to compact due to work hardening; so much so that the capabilities of the
crimping machine were exceeded and the micrometer failed. To speed up the
process and avoid the affects of work hardening, it was determined that the
samples should be compacted from their nominal diameter of 47.5 mm down to
38 mm in one step. This proved to be a very successful technique in terms of
speed, ease of compaction, and quality of results. The only visible affect due to
this more rapid swaging technique was the pattern of indentations on the grip
sleeve. As can be seen in Figures 4.60 and 4.61, gradual compaction resulted in a
relatively smooth surface due to the evenly distributed deformation of the dies,
whereas full compaction in one step left a series of rings on the sleeve due to
more concentrated deformation. Another noticeable effect of compaction in one
step was that the samples had a smaller overall length than samples that were
compacted gradually (1201.7 mm and 1209.7 mm for TF-WC3-FS and TF-WC4-
FS, versus 1222.4 mm for TF-WC2-FS).
Figure 4.60: Smooth grip sleeve surface
due to incremental compaction
Figure 4.61: Deformed grip sleeve
surface due to compaction in one step
TF-WC2-FS TF-WC4-FS
90

The accent bands that were painted around the junction between the strands and
sleeve on the TF-WC2-FS sample proved to be a very effective reference point of the
initial positions of the grip sleeves, as well as a drastic contrast that made grip sleeve
slippage more visible. Therefore, this technique was utilized with the TF-WC3-FS and
TF-WC4-FS samples as well. However, due to the addition of the reinforcement grip
ring, TF-WC4-FS was marked slightly different than TF-WC2-FS and TF-WC3-FS. In
addition to the typical accent band around the sleeve/strand interface, a similar band was
painted around the sleeve/reinforcement grip ring interface as well. An example of these
colored bands is depicted in Figures 4.62 and 4.63.
Figure 4.62: Single accent band for
samples without reinforcement grip ring
Figure 4.63: Double accent band for
samples with reinforcement grip ring
As was the case with the previous tests, we were interested in monitoring the
movement of the sample during the loading process. Because of the pitch orientation of
the sub cables, it was observed in the previous test that the cable had a tendency to
straighten itself out by rotating in a counter clockwise direction (the direction opposite to
the helical direction of the wires). Additionally, the tensile lugs that were used to attach
the sample to the test fixture utilized standard right hand threads at both ends. Due to
their opposing orientations, this meant that tightening one end would loosen the other,
and vice versa. In terms of the actual specimen behavior during testing, this counter
TF-WC2-FS TF-WC4-FS
91

clockwise rotation caused the upper tensile lug to rotate counter clockwise, while the
lower tensile lug remained fairly stationary. What this translated to was a partial
unwinding of the exposed cable between the grip sleeves, rather than a uniform rotation
of the entire specimen. Therefore, the TF-WC3-FS and TF-WC4-FS samples were
screwed all the way down against the lower coupling (see Figure 4.64) so that their
motion was completely restricted. The configuration of the upper coupling, however, still
allowed for rotation. Therefore, a vertical black line was painted on the tensile lug and a
corresponding horizontal line on the bottom of the main body of the upper threaded
coupling (see Figure 4.65) so that the behavior of the upper end of the specimen could be
monitored.
Figure 4.64: Tensile lug flush with
lower coupling to prevent rotation
Figure 4.65: Reference lines to monitor
specimen rotation
Based on the force and displacement data collected during these tests, a series of
plots were created to evaluate the performance of the TF-WC3-FS and TF-WC4-FS
samples as compared to the TF-WC2-FS. When analyzing this data, it is important to
keep in mind that each of the three samples was slightly different. Because TF-WC2-FS
was the only unmodified sample, it can be thought of as a baseline configuration, to
which the effectiveness of the modifications made to the subsequent samples can be
evaluated. A comparison of the axial force versus time and axial force versus
displacement for all three configurations are displayed below in Figures 4.66 and 4.67.
92
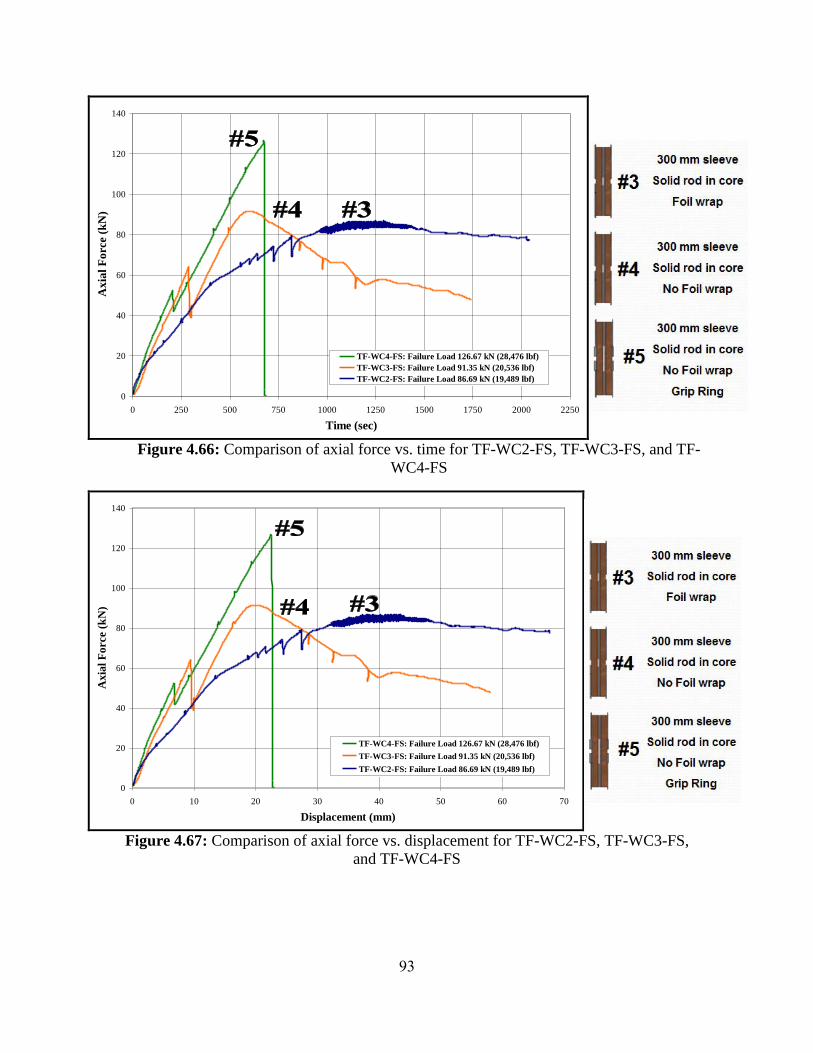
0
20
40
60
80
100
120
140
0 250 500 750 1000 1250 1500 1750 2000 2250
Time (sec)
Ax
ial
Fo
rce
(kN
)
TF-WC4-FS: Failure Load 126.67 kN (28,476 lbf)
TF-WC3-FS: Failure Load 91.35 kN (20,536 lbf)
TF-WC2-FS: Failure Load 86.69 kN (19,489 lbf)
Figure 4.66: Comparison of axial force vs. time for TF-WC2-FS, TF-WC3-FS, and TF-
WC4-FS
0
20
40
60
80
100
120
140
0 10 20 30 40 50 60 70
Displacement (mm)
Ax
ial
Fo
rce (
kN
)
TF-WC4-FS: Failure Load 126.67 kN (28,476 lbf)
TF-WC3-FS: Failure Load 91.35 kN (20,536 lbf)
TF-WC2-FS: Failure Load 86.69 kN (19,489 lbf)
Figure 4.67: Comparison of axial force vs. displacement for TF-WC2-FS, TF-WC3-FS,
and TF-WC4-FS
93
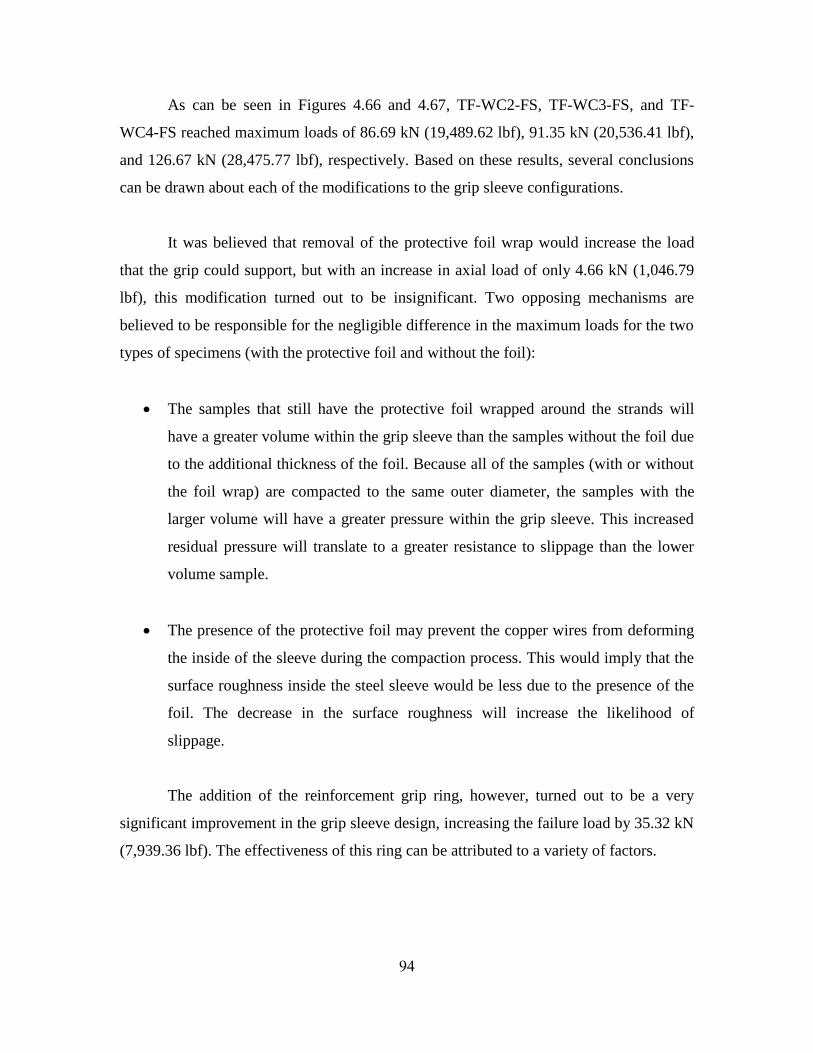
As can be seen in Figures 4.66 and 4.67, TF-WC2-FS, TF-WC3-FS, and TF-
WC4-FS reached maximum loads of 86.69 kN (19,489.62 lbf), 91.35 kN (20,536.41 lbf),
and 126.67 kN (28,475.77 lbf), respectively. Based on these results, several conclusions
can be drawn about each of the modifications to the grip sleeve configurations.
It was believed that removal of the protective foil wrap would increase the load
that the grip could support, but with an increase in axial load of only 4.66 kN (1,046.79
lbf), this modification turned out to be insignificant. Two opposing mechanisms are
believed to be responsible for the negligible difference in the maximum loads for the two
types of specimens (with the protective foil and without the foil):
The samples that still have the protective foil wrapped around the strands will
have a greater volume within the grip sleeve than the samples without the foil due
to the additional thickness of the foil. Because all of the samples (with or without
the foil wrap) are compacted to the same outer diameter, the samples with the
larger volume will have a greater pressure within the grip sleeve. This increased
residual pressure will translate to a greater resistance to slippage than the lower
volume sample.
The presence of the protective foil may prevent the copper wires from deforming
the inside of the sleeve during the compaction process. This would imply that the
surface roughness inside the steel sleeve would be less due to the presence of the
foil. The decrease in the surface roughness will increase the likelihood of
slippage.
The addition of the reinforcement grip ring, however, turned out to be a very
significant improvement in the grip sleeve design, increasing the failure load by 35.32 kN
(7,939.36 lbf). The effectiveness of this ring can be attributed to a variety of factors.
94
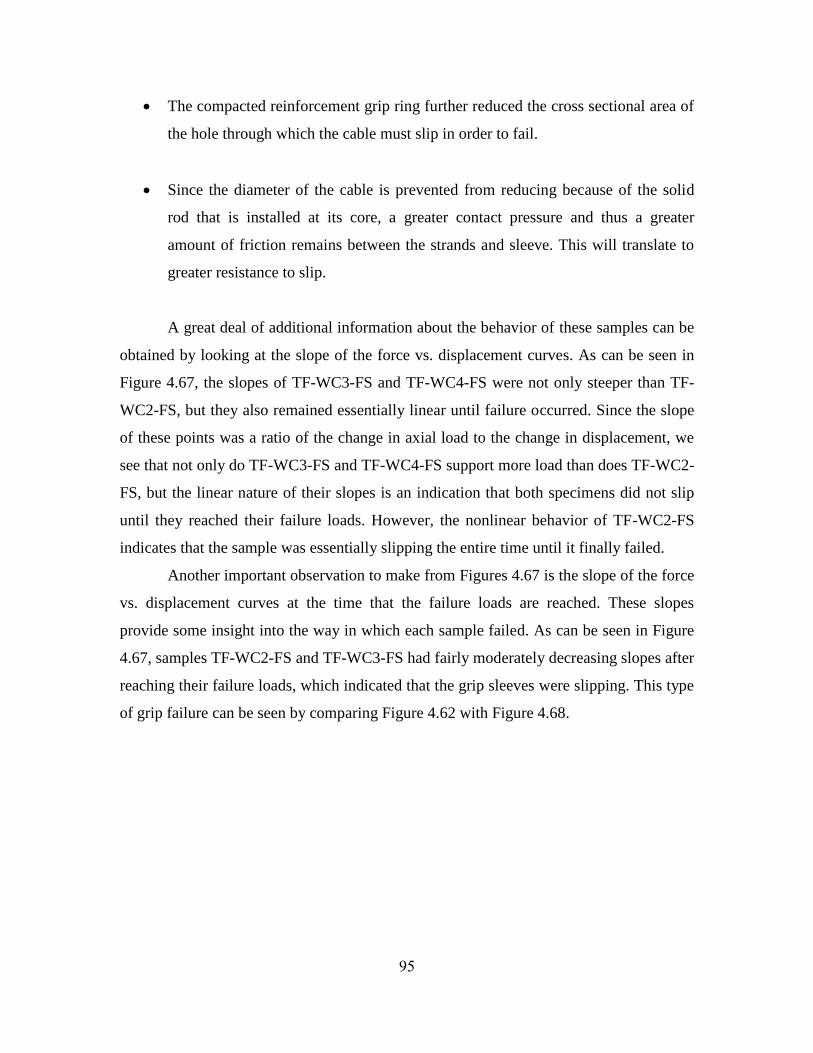
The compacted reinforcement grip ring further reduced the cross sectional area of
the hole through which the cable must slip in order to fail.
Since the diameter of the cable is prevented from reducing because of the solid
rod that is installed at its core, a greater contact pressure and thus a greater
amount of friction remains between the strands and sleeve. This will translate to
greater resistance to slip.
A great deal of additional information about the behavior of these samples can be
obtained by looking at the slope of the force vs. displacement curves. As can be seen in
Figure 4.67, the slopes of TF-WC3-FS and TF-WC4-FS were not only steeper than TF-
WC2-FS, but they also remained essentially linear until failure occurred. Since the slope
of these points was a ratio of the change in axial load to the change in displacement, we
see that not only do TF-WC3-FS and TF-WC4-FS support more load than does TF-WC2-
FS, but the linear nature of their slopes is an indication that both specimens did not slip
until they reached their failure loads. However, the nonlinear behavior of TF-WC2-FS
indicates that the sample was essentially slipping the entire time until it finally failed.
Another important observation to make from Figures 4.67 is the slope of the force
vs. displacement curves at the time that the failure loads are reached. These slopes
provide some insight into the way in which each sample failed. As can be seen in Figure
4.67, samples TF-WC2-FS and TF-WC3-FS had fairly moderately decreasing slopes after
reaching their failure loads, which indicated that the grip sleeves were slipping. This type
of grip failure can be seen by comparing Figure 4.62 with Figure 4.68.
95

Figure 4.68: Grip sleeve failure due to sleeve slippage
As can be seen in Figure 4.66, TF-WC4-FS failed catastrophically without any
warning. This drastic failure was actually caused by a seam weld fracture between the
tensile lug and grip sleeve body (see Figure 4.69 and 4.70).
Figure 4.69: Grip sleeve failure due to
seam weld fracture
Figure 4.70: Grip sleeve failure due to
seam weld fracture
Another factor to consider when evaluating these results is the existence of a
stick-slip mechanism (refer to Section 4.1.2.) during the loading. One distinct case of this
stick-slip mechanism was observed at two different locations on the force versus
displacement plot for the TF-WC3-FS and TF-WC4-FS samples. These plots are
illustrated in Figures 4.71 and 4.72.
TF-WC2-FS
TF-WC4-FS
TF-WC4-FS
96
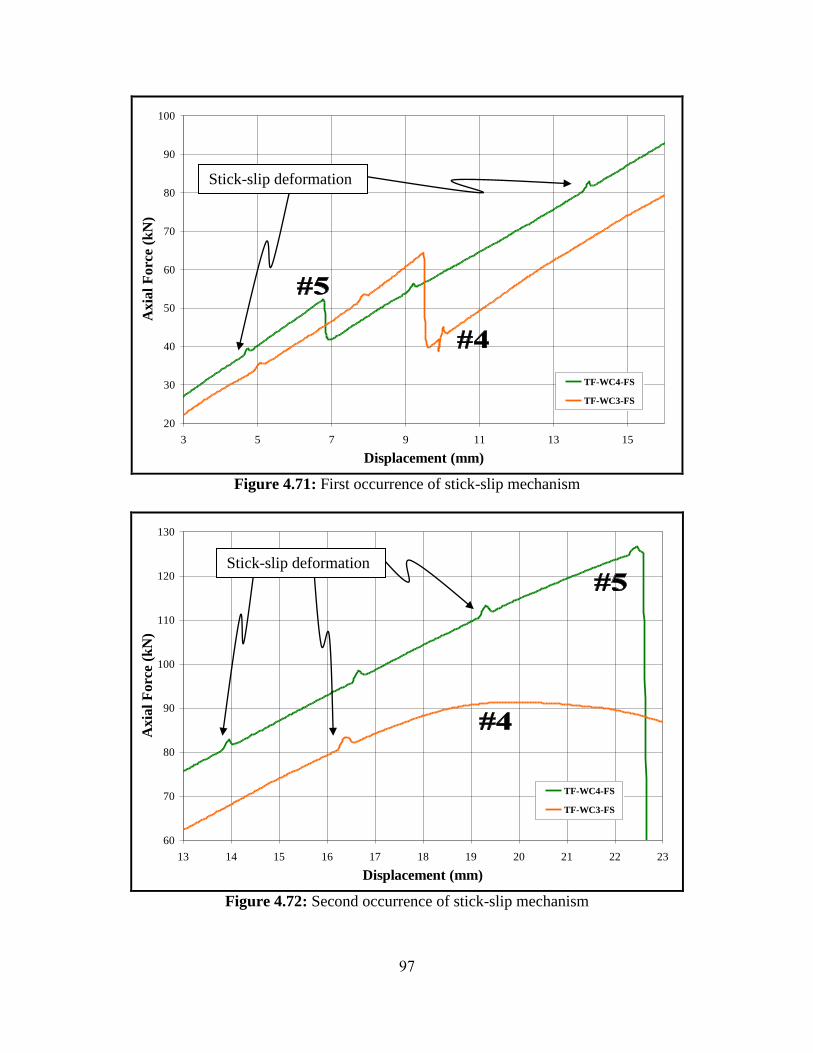
20
30
40
50
60
70
80
90
100
3 5 7 9 11 13 15
Displacement (mm)
Axia
l F
orc
e (k
N)
TF-WC4-FS
TF-WC3-FS
Figure 4.71: First occurrence of stick-slip mechanism
60
70
80
90
100
110
120
130
13 14 15 16 17 18 19 20 21 22 23
Displacement (mm)
Axia
l F
orc
e (k
N)
TF-WC4-FS
TF-WC3-FS
Figure 4.72: Second occurrence of stick-slip mechanism
Stick-slip deformation
Stick-slip deformation
97

The occurrences of stick-slip were identified based on the magnitude of the
fluctuations that were noted on the force versus displacement plots. As can be seen in
Figures 4.71 and 4.72, the magnitude of the oscillations remained constant with
increasing axial load.
In addition to the stick-slip, another unusual trend appeared on the force vs.
displacement plots of both samples. This phenomenon was a sudden drop in the axial
load that cannot be attributed to stick-slip. As can be seen in Figures 4.73, the loads
applied to both TF-WC3-FS and TF-WC4-FS abruptly decreased after 7 to 10 mm of
displacement and then immediately continued to increase at the same rate as before, but
from the point to which the load had fallen. Stick-slip, however, is characterized by an
abrupt load increase which quickly returns to a value equal to or slightly greater than the
value at which the spike occurred, before loading continues (see Figures 4.71 and 4.72).
Despite the fact that both specimens experienced the same amount of displacement, TF-
WC3-FS experienced a much greater load decrease (~24 kN) than TF-WC4-FS (~9 kN).
This is likely due to the fact that at the load drop point the TF-WC3-FS sample was at a
much greater load than TF-WC4-FS.
98
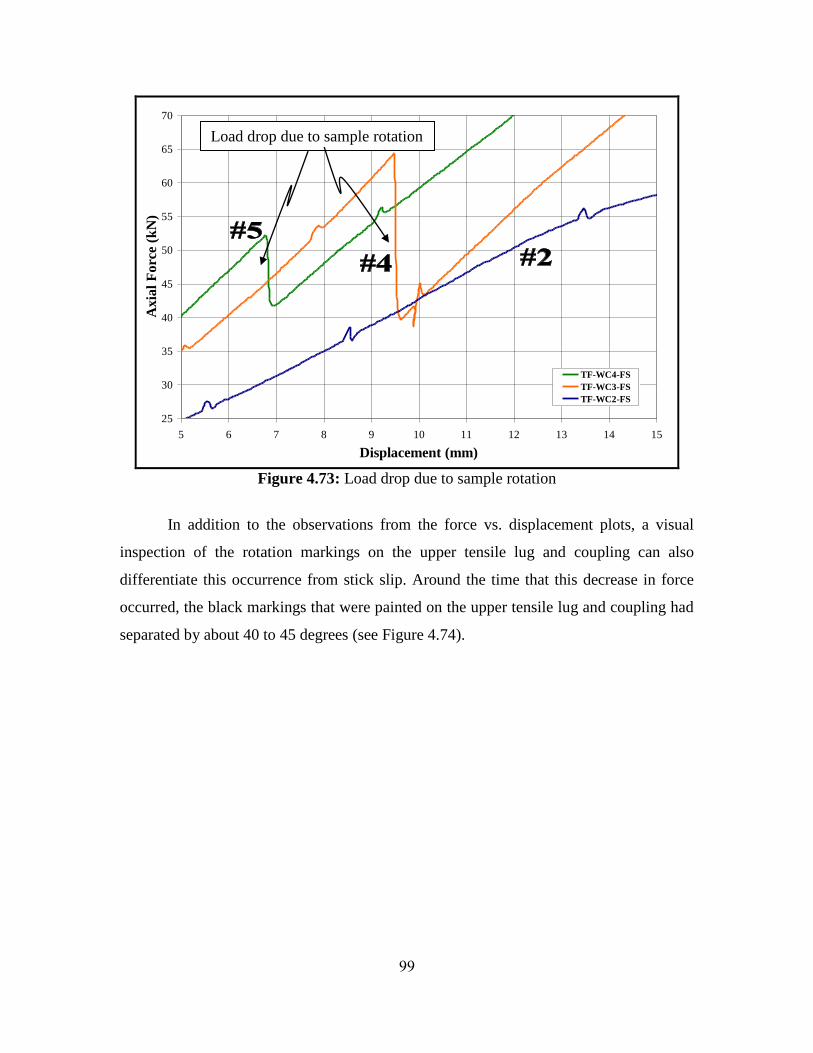
25
30
35
40
45
50
55
60
65
70
5 6 7 8 9 10 11 12 13 14 15
Displacement (mm)
Axia
l F
orc
e (k
N)
TF-WC4-FS
TF-WC3-FS
TF-WC2-FS
Figure 4.73: Load drop due to sample rotation
In addition to the observations from the force vs. displacement plots, a visual
inspection of the rotation markings on the upper tensile lug and coupling can also
differentiate this occurrence from stick slip. Around the time that this decrease in force
occurred, the black markings that were painted on the upper tensile lug and coupling had
separated by about 40 to 45 degrees (see Figure 4.74).
Load drop due to sample rotation
99

Figure 4.74: Sample rotation responsible for
load drop with respect to fixed coupling
Examination of the force vs. displacement plots at the time that this drop in force
occurred revealed that both specimens experienced a vertical displacement of about 0.2
mm (0.0079 in.). When we consider that the tensile lug has a thread pattern of 1 in. – 14,
meaning it has 14 threads per one inch of length, the 0.2 mm of vertical displacement
equates to a rotation of roughly 0.11 threads. A complete rotation around 1 thread is
equal to 360 degrees. Therefore a rotation of 0.11 threads would correspond to a rotation
of 39.7 degrees. Factoring in the stretch of the cable at these elevated loads, the estimated
40 to 45 degree rotation of the sample with respect to the upper coupling can be attributed
to the abrupt reduction in load experienced by both specimens. Installing jam nuts at the
upper coupling to prevent rotation of the upper portion of the sample will provide further
insight into mechanical behavior of the grip design.
4.1.4. Fatigue Testing
Based on the results of the modified grip design, a series of tests on the fifth,
sixth, and seventh full scale TF press-fit grip sleeves were performed. Due to the success
of the previous tests (see Section 4.1.3), this final group of samples were constructed to
the same specifications as TF-WC4-FS, tested with the same apparatus, and followed the
40 to 45 deg. rotation
100
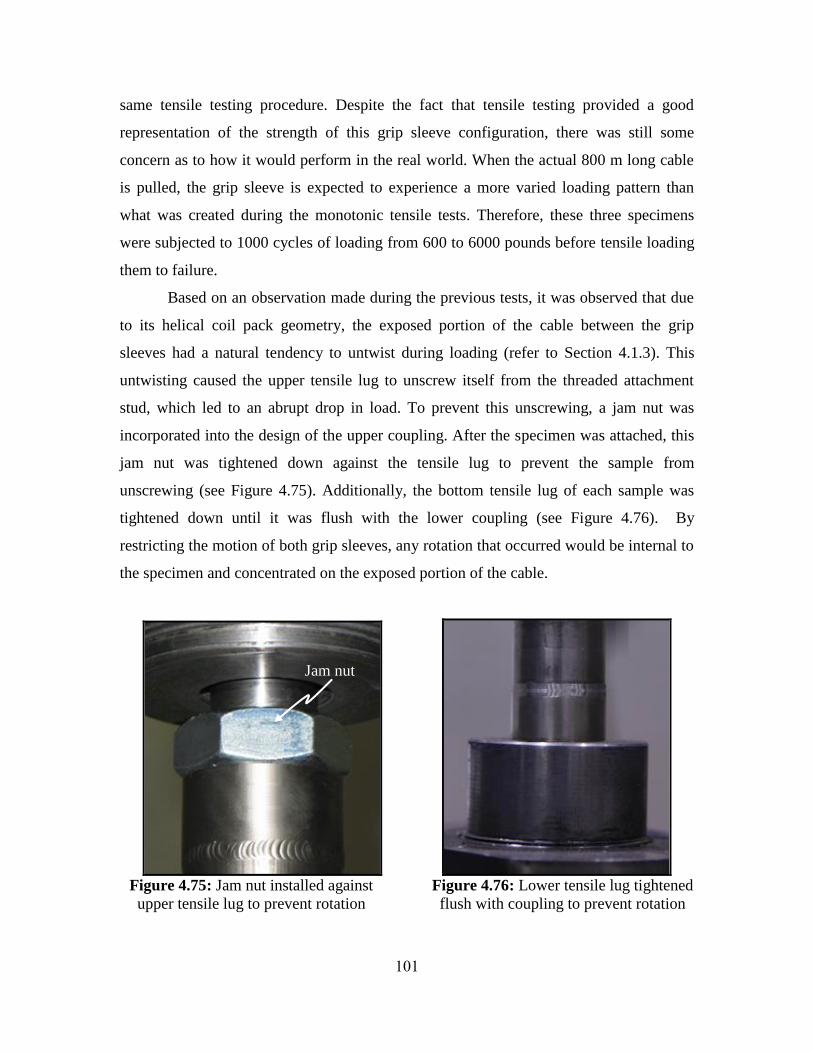
same tensile testing procedure. Despite the fact that tensile testing provided a good
representation of the strength of this grip sleeve configuration, there was still some
concern as to how it would perform in the real world. When the actual 800 m long cable
is pulled, the grip sleeve is expected to experience a more varied loading pattern than
what was created during the monotonic tensile tests. Therefore, these three specimens
were subjected to 1000 cycles of loading from 600 to 6000 pounds before tensile loading
them to failure.
Based on an observation made during the previous tests, it was observed that due
to its helical coil pack geometry, the exposed portion of the cable between the grip
sleeves had a natural tendency to untwist during loading (refer to Section 4.1.3). This
untwisting caused the upper tensile lug to unscrew itself from the threaded attachment
stud, which led to an abrupt drop in load. To prevent this unscrewing, a jam nut was
incorporated into the design of the upper coupling. After the specimen was attached, this
jam nut was tightened down against the tensile lug to prevent the sample from
unscrewing (see Figure 4.75). Additionally, the bottom tensile lug of each sample was
tightened down until it was flush with the lower coupling (see Figure 4.76). By
restricting the motion of both grip sleeves, any rotation that occurred would be internal to
the specimen and concentrated on the exposed portion of the cable.
Figure 4.75: Jam nut installed against
upper tensile lug to prevent rotation
Figure 4.76: Lower tensile lug tightened
flush with coupling to prevent rotation
Jam nut
101
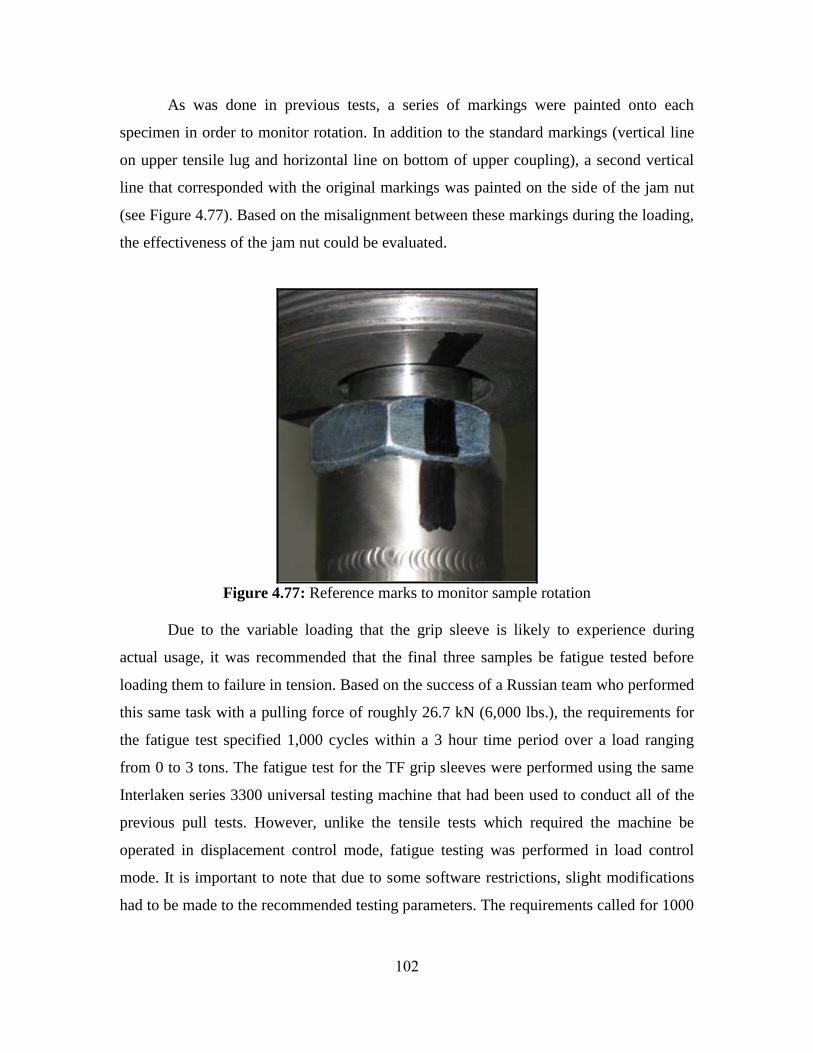
As was done in previous tests, a series of markings were painted onto each
specimen in order to monitor rotation. In addition to the standard markings (vertical line
on upper tensile lug and horizontal line on bottom of upper coupling), a second vertical
line that corresponded with the original markings was painted on the side of the jam nut
(see Figure 4.77). Based on the misalignment between these markings during the loading,
the effectiveness of the jam nut could be evaluated.
Figure 4.77: Reference marks to monitor sample rotation
Due to the variable loading that the grip sleeve is likely to experience during
actual usage, it was recommended that the final three samples be fatigue tested before
loading them to failure in tension. Based on the success of a Russian team who performed
this same task with a pulling force of roughly 26.7 kN (6,000 lbs.), the requirements for
the fatigue test specified 1,000 cycles within a 3 hour time period over a load ranging
from 0 to 3 tons. The fatigue test for the TF grip sleeves were performed using the same
Interlaken series 3300 universal testing machine that had been used to conduct all of the
previous pull tests. However, unlike the tensile tests which required the machine be
operated in displacement control mode, fatigue testing was performed in load control
mode. It is important to note that due to some software restrictions, slight modifications
had to be made to the recommended testing parameters. The requirements called for 1000
102
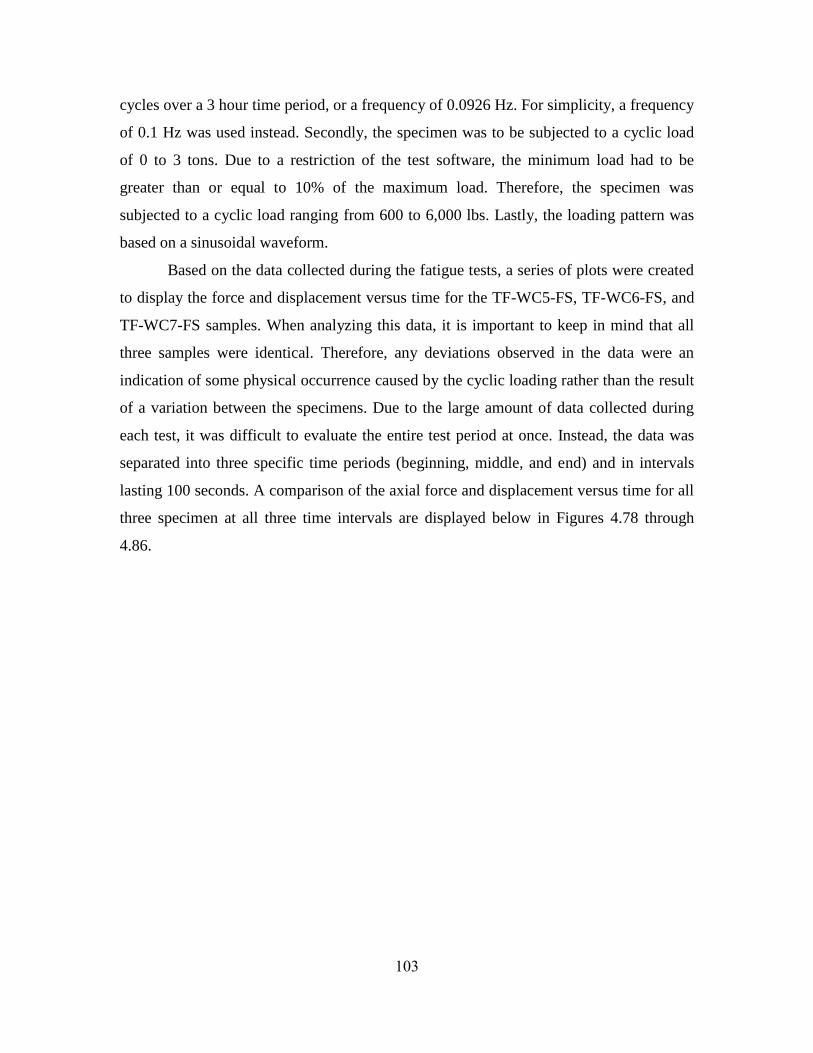
cycles over a 3 hour time period, or a frequency of 0.0926 Hz. For simplicity, a frequency
of 0.1 Hz was used instead. Secondly, the specimen was to be subjected to a cyclic load
of 0 to 3 tons. Due to a restriction of the test software, the minimum load had to be
greater than or equal to 10% of the maximum load. Therefore, the specimen was
subjected to a cyclic load ranging from 600 to 6,000 lbs. Lastly, the loading pattern was
based on a sinusoidal waveform.
Based on the data collected during the fatigue tests, a series of plots were created
to display the force and displacement versus time for the TF-WC5-FS, TF-WC6-FS, and
TF-WC7-FS samples. When analyzing this data, it is important to keep in mind that all
three samples were identical. Therefore, any deviations observed in the data were an
indication of some physical occurrence caused by the cyclic loading rather than the result
of a variation between the specimens. Due to the large amount of data collected during
each test, it was difficult to evaluate the entire test period at once. Instead, the data was
separated into three specific time periods (beginning, middle, and end) and in intervals
lasting 100 seconds. A comparison of the axial force and displacement versus time for all
three specimen at all three time intervals are displayed below in Figures 4.78 through
4.86.
103

0
5
10
15
20
25
30
0 10 20 30 40 50 60 70 80 90 100
Time (sec)
Axia
l F
orc
e (k
N)
0
1
2
3
4
5
Axia
l D
isp
lace
men
t (m
m)
Axial Force
Axial Displacement
Figure 4.78: Initial 100 sec. interval of TF-WC5-FS fatigue test
0
5
10
15
20
25
30
4950 4960 4970 4980 4990 5000 5010 5020 5030 5040 5050
Time (sec)
Axia
l F
orc
e (k
N)
0
1
2
3
4
5
Axia
l D
isp
lace
men
t (m
m)
Axial Force
Axial Displacement
Figure 4.79: Intermediate 100 sec. interval of TF-WC5-FS fatigue test
104

0
5
10
15
20
25
30
9900 9910 9920 9930 9940 9950 9960 9970 9980 9990 10000
Time (sec)
Axia
l F
orc
e (k
N)
0
1
2
3
4
5
Axia
l D
isp
lace
men
t (m
m)
Axial Force
Axial Displacement
Figure 4.80: Final 100 sec. interval of TF-WC5-FS fatigue test
0
5
10
15
20
25
30
0 10 20 30 40 50 60 70 80 90 100
Time (sec)
Axia
l F
orc
e (k
N)
0
1
2
3
4
5
Axia
l D
isp
lace
men
t (m
m)
Axial Force
Axial Displacement
Figure 4.81: Initial 100 sec. interval of TF-WC6-FS fatigue test
105
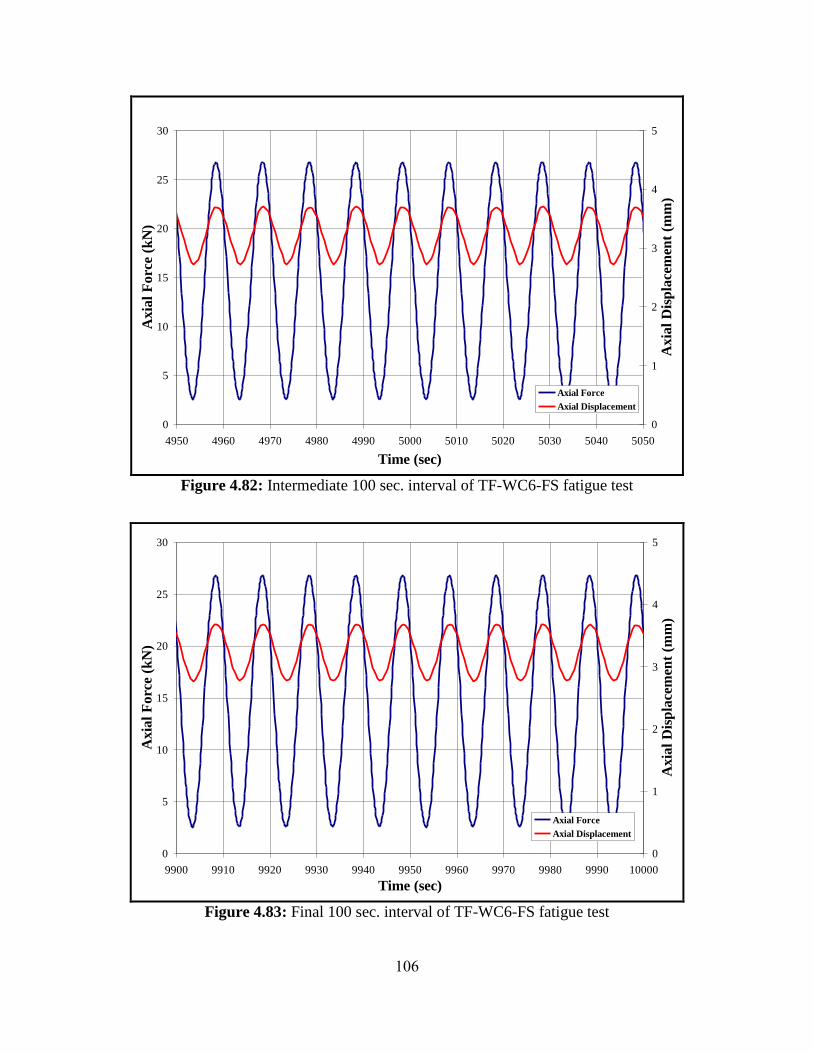
0
5
10
15
20
25
30
4950 4960 4970 4980 4990 5000 5010 5020 5030 5040 5050
Time (sec)
Axia
l F
orc
e (k
N)
0
1
2
3
4
5
Axia
l D
isp
lace
men
t (m
m)
Axial Force
Axial Displacement
Figure 4.82: Intermediate 100 sec. interval of TF-WC6-FS fatigue test
0
5
10
15
20
25
30
9900 9910 9920 9930 9940 9950 9960 9970 9980 9990 10000
Time (sec)
Axia
l F
orc
e (k
N)
0
1
2
3
4
5
Axia
l D
isp
lace
men
t (m
m)
Axial Force
Axial Displacement
Figure 4.83: Final 100 sec. interval of TF-WC6-FS fatigue test
106

0
5
10
15
20
25
30
0 10 20 30 40 50 60 70 80 90 100
Time (sec)
Axia
l F
orc
e (k
N)
0
1
2
3
4
5
Axia
l D
isp
lace
men
t (m
m)
Axial Force
Axial Displacement
Figure 4.84: Initial 100 sec. interval of TF-WC7-FS fatigue test
0
5
10
15
20
25
30
4950 4960 4970 4980 4990 5000 5010 5020 5030 5040 5050
Time (sec)
Axia
l F
orc
e (k
N)
0
1
2
3
4
5
Axia
l D
isp
lace
men
t (m
m)
Axial Force
Axial Displacement
Figure 4.85: Intermediate 100 sec. interval of TF-WC7-FS fatigue test
107
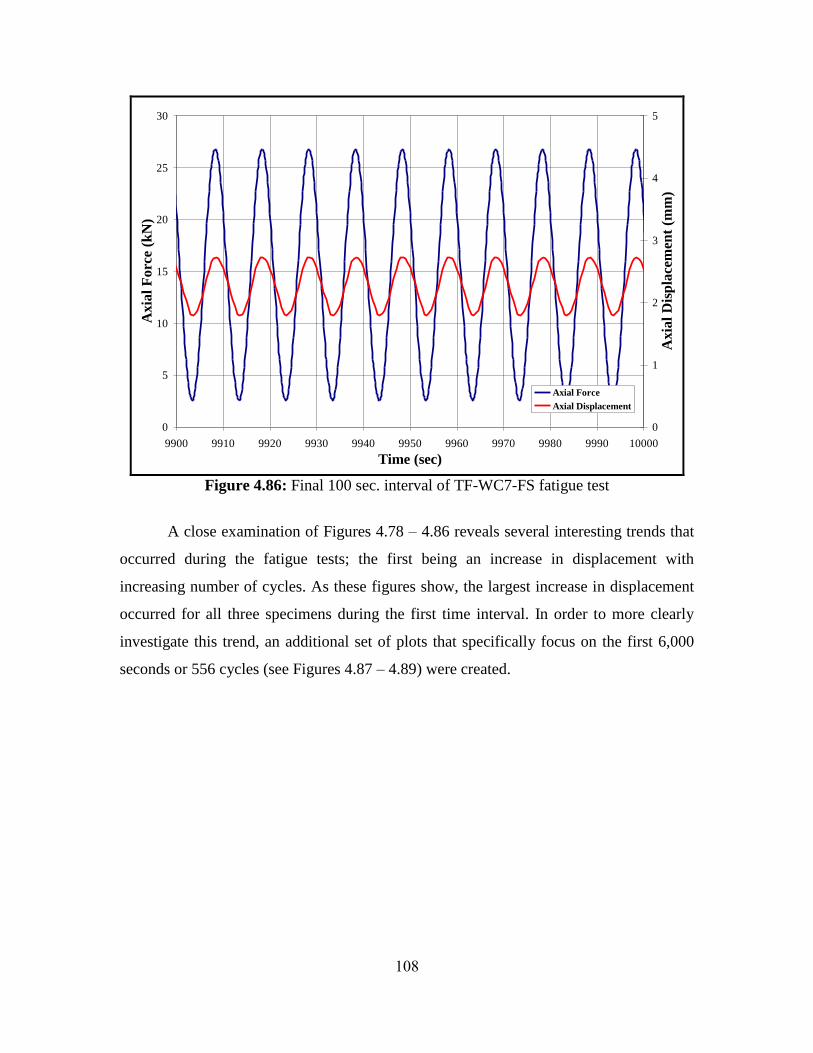
0
5
10
15
20
25
30
9900 9910 9920 9930 9940 9950 9960 9970 9980 9990 10000
Time (sec)
Axia
l F
orc
e (k
N)
0
1
2
3
4
5
Axia
l D
isp
lace
men
t (m
m)
Axial Force
Axial Displacement
Figure 4.86: Final 100 sec. interval of TF-WC7-FS fatigue test
A close examination of Figures 4.78 – 4.86 reveals several interesting trends that
occurred during the fatigue tests; the first being an increase in displacement with
increasing number of cycles. As these figures show, the largest increase in displacement
occurred for all three specimens during the first time interval. In order to more clearly
investigate this trend, an additional set of plots that specifically focus on the first 6,000
seconds or 556 cycles (see Figures 4.87 – 4.89) were created.
108

0
1
2
3
4
5
0 1000 2000 3000 4000 5000 6000
Time (sec)
Axia
l D
isp
lace
men
t (m
m)
Figure 4.87: TF-WC5-FS displacement increase with increasing time/# cycles
0
1
2
3
4
5
0 1000 2000 3000 4000 5000 6000
Time (sec)
Axia
l D
isp
lace
men
t (m
m)
`
Figure 4.88: TF-WC6-FS displacement increase with increasing time/# cycles
109

0
1
2
3
4
5
0 1000 2000 3000 4000 5000 6000
Time (sec)
Axia
l D
isp
lace
men
t (m
m)
Figure 4.89: TF-WC7-FS displacement increase with increasing time/# cycles
As can be seen in Figures 4.87 – 4.89, not only did each sample achieve a slightly
different maximum average displacement, they also occurred at different times. This
increase in displacement with increasing cycles is likely the elongation of the cable
resulting from a combination of cable stretch, sleeve slippage, and slack within the grip
sleeves being removed (see Figures 4.90 and 4.91). It was also noted that the gap between
the accent bands occurred during the cyclic loading, but did not appear to increase during
the tensile loading to failure.
110

Figure 4.90: Gap between accent bands
after fatigue testing
Figure 4.91: Gap between accent bands
after fatigue testing
Additionally, the behavior of each specimen as it approached its maximum mean
displacement was slightly different. As can be seen in Figures 4.87 – 4.89, TF-WC5-FS
and TF-WC6-FS experienced rapid increases in mean displacement (see Figures 4.87 and
4.88), whereas TF-WC7-FS maintained a gradual increase in mean displacement (see
Figure 4.89). We can attribute these rapid increased in displacement of TF-WC5-FS and
TF-WC6-FS to a stick slip mechanism.
Despite the fact that each of the three samples experienced different displacement
at different rates, it‟s important to note that peak to peak amplitude for all three samples
remained constant at about 1.25 mm. Also the slope of the load versus displacement data
for each sample was the same during the cyclic loading; providing a good indication of
repeatability.
After each fatigue test was concluded, the machine was reconfigured and tensile
testing immediately began. Based on the force and displacement data collected during the
tensile loading to failure, a series of plots were created to evaluate the performance of the
TF-WC5-FS, TF-WC6-FS, and TF-WC7-FS samples as compared to the TF-WC4-FS
sample. Note that sample TF-WC4-FS was not subjected to fatigue testing prior to tensile
testing, nor did it utilize a jam nut to prevent rotation of its upper grip sleeve. Because
TF-WC4-FS was the only dissimilar sample, it can be thought of as a baseline
configuration, to which the effects of the modifications made to the subsequent samples
111
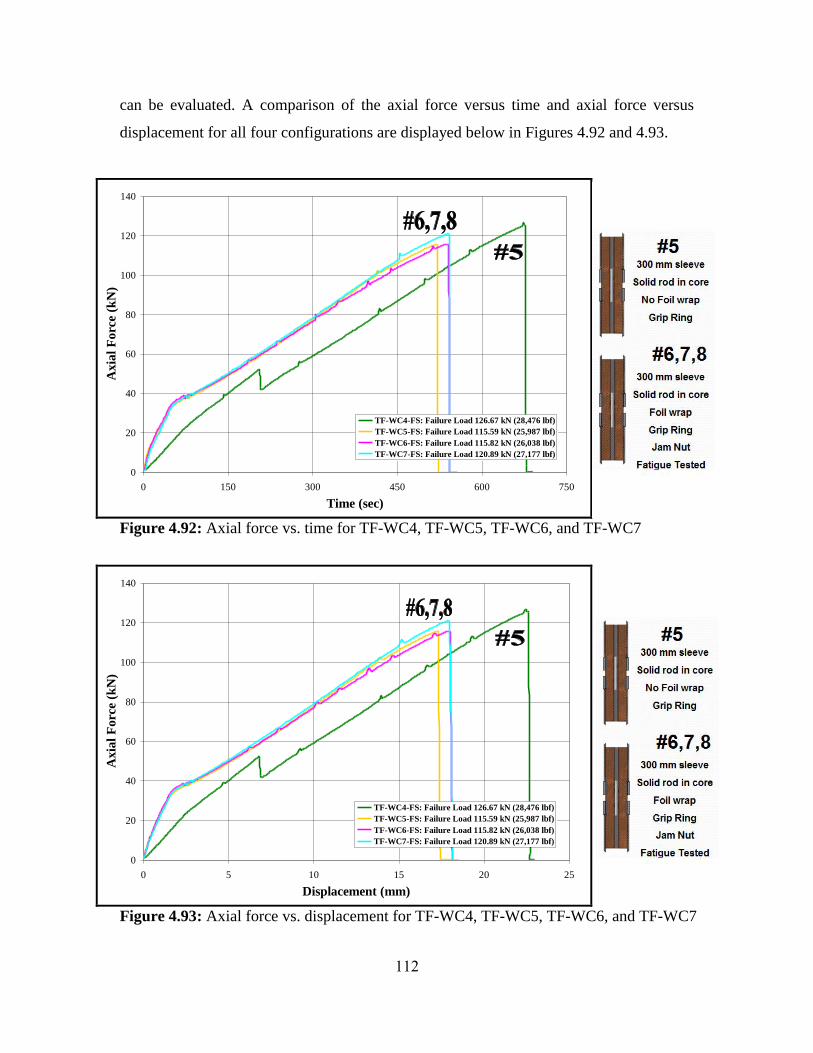
can be evaluated. A comparison of the axial force versus time and axial force versus
displacement for all four configurations are displayed below in Figures 4.92 and 4.93.
0
20
40
60
80
100
120
140
0 150 300 450 600 750
Time (sec)
Axia
l F
orc
e (k
N)
TF-WC4-FS: Failure Load 126.67 kN (28,476 lbf)
TF-WC5-FS: Failure Load 115.59 kN (25,987 lbf)
TF-WC6-FS: Failure Load 115.82 kN (26,038 lbf)
TF-WC7-FS: Failure Load 120.89 kN (27,177 lbf)
Figure 4.92: Axial force vs. time for TF-WC4, TF-WC5, TF-WC6, and TF-WC7
0
20
40
60
80
100
120
140
0 5 10 15 20 25
Displacement (mm)
Axia
l F
orc
e (k
N)
TF-WC4-FS: Failure Load 126.67 kN (28,476 lbf)
TF-WC5-FS: Failure Load 115.59 kN (25,987 lbf)
TF-WC6-FS: Failure Load 115.82 kN (26,038 lbf)
TF-WC7-FS: Failure Load 120.89 kN (27,177 lbf)
Figure 4.93: Axial force vs. displacement for TF-WC4, TF-WC5, TF-WC6, and TF-WC7
112
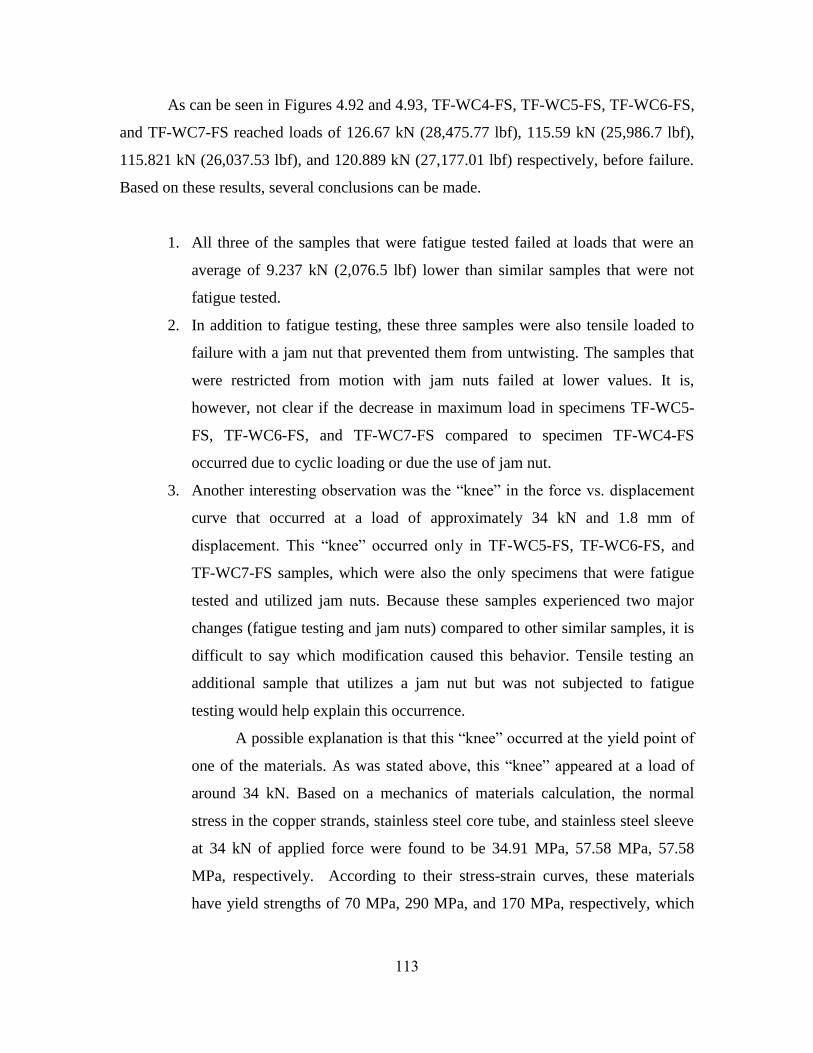
As can be seen in Figures 4.92 and 4.93, TF-WC4-FS, TF-WC5-FS, TF-WC6-FS,
and TF-WC7-FS reached loads of 126.67 kN (28,475.77 lbf), 115.59 kN (25,986.7 lbf),
115.821 kN (26,037.53 lbf), and 120.889 kN (27,177.01 lbf) respectively, before failure.
Based on these results, several conclusions can be made.
1. All three of the samples that were fatigue tested failed at loads that were an
average of 9.237 kN (2,076.5 lbf) lower than similar samples that were not
fatigue tested.
2. In addition to fatigue testing, these three samples were also tensile loaded to
failure with a jam nut that prevented them from untwisting. The samples that
were restricted from motion with jam nuts failed at lower values. It is,
however, not clear if the decrease in maximum load in specimens TF-WC5-
FS, TF-WC6-FS, and TF-WC7-FS compared to specimen TF-WC4-FS
occurred due to cyclic loading or due the use of jam nut.
3. Another interesting observation was the “knee” in the force vs. displacement
curve that occurred at a load of approximately 34 kN and 1.8 mm of
displacement. This “knee” occurred only in TF-WC5-FS, TF-WC6-FS, and
TF-WC7-FS samples, which were also the only specimens that were fatigue
tested and utilized jam nuts. Because these samples experienced two major
changes (fatigue testing and jam nuts) compared to other similar samples, it is
difficult to say which modification caused this behavior. Tensile testing an
additional sample that utilizes a jam nut but was not subjected to fatigue
testing would help explain this occurrence.
A possible explanation is that this “knee” occurred at the yield point of
one of the materials. As was stated above, this “knee” appeared at a load of
around 34 kN. Based on a mechanics of materials calculation, the normal
stress in the copper strands, stainless steel core tube, and stainless steel sleeve
at 34 kN of applied force were found to be 34.91 MPa, 57.58 MPa, 57.58
MPa, respectively. According to their stress-strain curves, these materials
have yield strengths of 70 MPa, 290 MPa, and 170 MPa, respectively, which
113
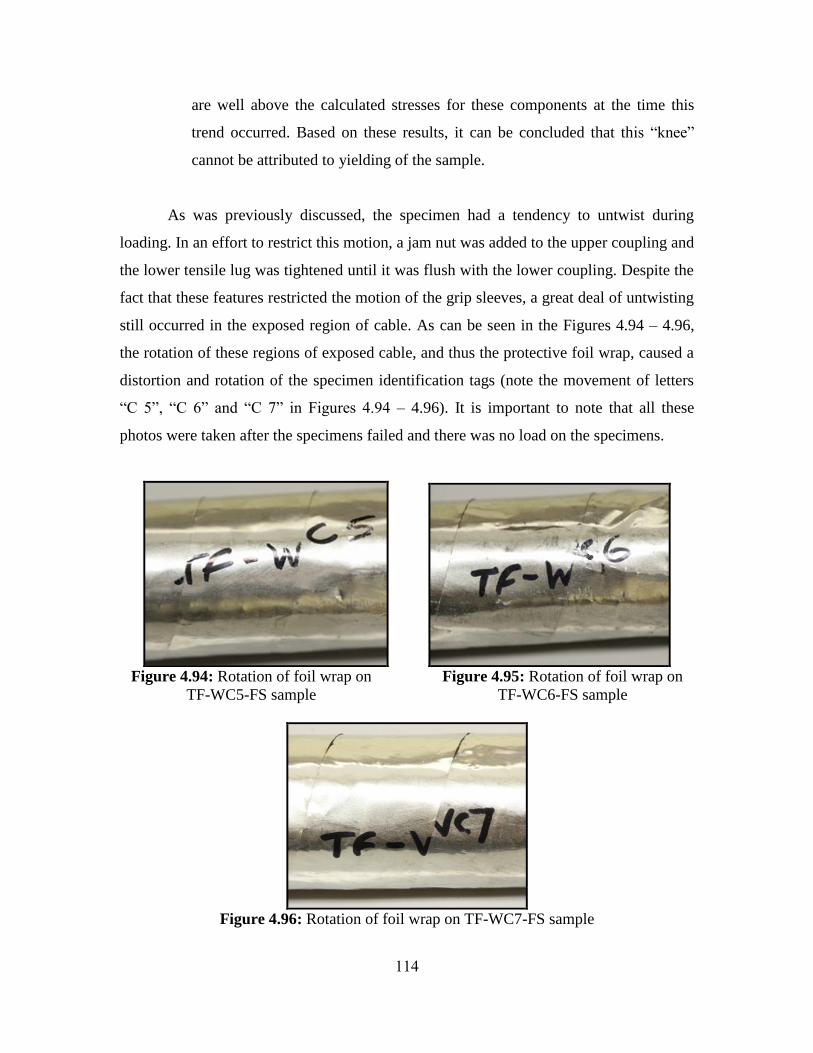
are well above the calculated stresses for these components at the time this
trend occurred. Based on these results, it can be concluded that this “knee”
cannot be attributed to yielding of the sample.
As was previously discussed, the specimen had a tendency to untwist during
loading. In an effort to restrict this motion, a jam nut was added to the upper coupling and
the lower tensile lug was tightened until it was flush with the lower coupling. Despite the
fact that these features restricted the motion of the grip sleeves, a great deal of untwisting
still occurred in the exposed region of cable. As can be seen in the Figures 4.94 – 4.96,
the rotation of these regions of exposed cable, and thus the protective foil wrap, caused a
distortion and rotation of the specimen identification tags (note the movement of letters
“C 5”, “C 6” and “C 7” in Figures 4.94 – 4.96). It is important to note that all these
photos were taken after the specimens failed and there was no load on the specimens.
Figure 4.94: Rotation of foil wrap on
TF-WC5-FS sample
Figure 4.95: Rotation of foil wrap on
TF-WC6-FS sample
Figure 4.96: Rotation of foil wrap on TF-WC7-FS sample
114
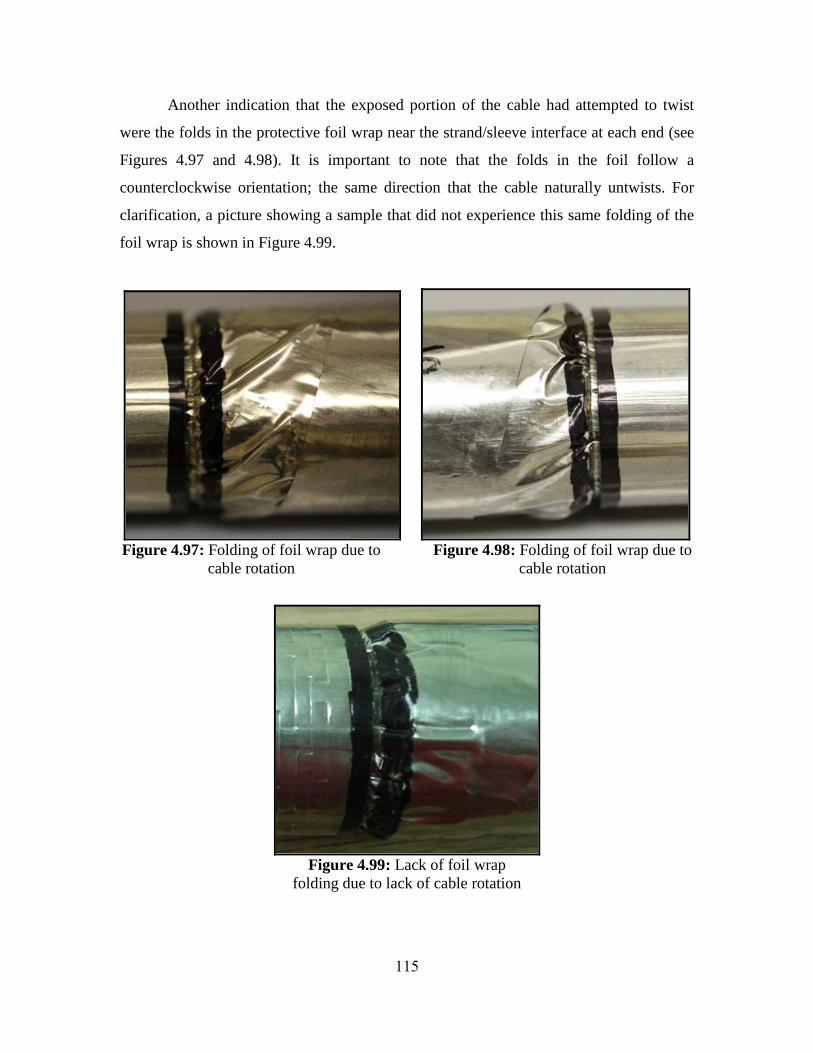
Another indication that the exposed portion of the cable had attempted to twist
were the folds in the protective foil wrap near the strand/sleeve interface at each end (see
Figures 4.97 and 4.98). It is important to note that the folds in the foil follow a
counterclockwise orientation; the same direction that the cable naturally untwists. For
clarification, a picture showing a sample that did not experience this same folding of the
foil wrap is shown in Figure 4.99.
Figure 4.97: Folding of foil wrap due to
cable rotation
Figure 4.98: Folding of foil wrap due to
cable rotation
Figure 4.99: Lack of foil wrap
folding due to lack of cable rotation
115
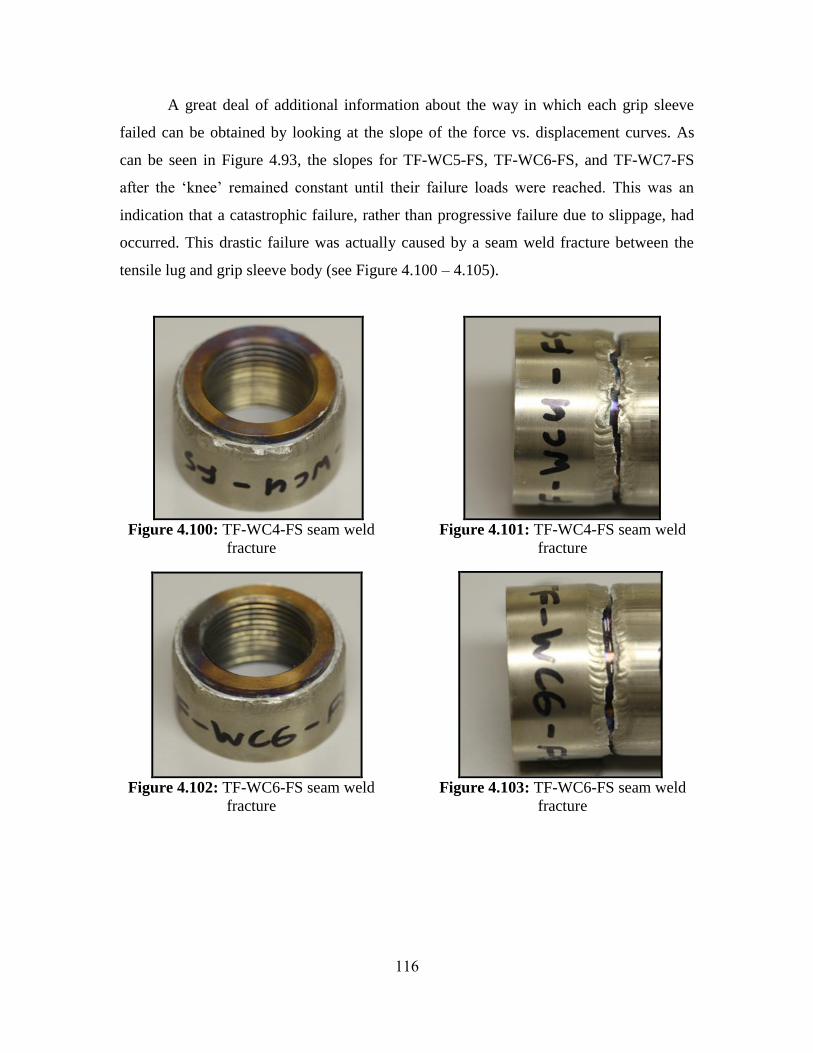
A great deal of additional information about the way in which each grip sleeve
failed can be obtained by looking at the slope of the force vs. displacement curves. As
can be seen in Figure 4.93, the slopes for TF-WC5-FS, TF-WC6-FS, and TF-WC7-FS
after the „knee‟ remained constant until their failure loads were reached. This was an
indication that a catastrophic failure, rather than progressive failure due to slippage, had
occurred. This drastic failure was actually caused by a seam weld fracture between the
tensile lug and grip sleeve body (see Figure 4.100 – 4.105).
Figure 4.100: TF-WC4-FS seam weld
fracture
Figure 4.101: TF-WC4-FS seam weld
fracture
Figure 4.102: TF-WC6-FS seam weld
fracture
Figure 4.103: TF-WC6-FS seam weld
fracture
116
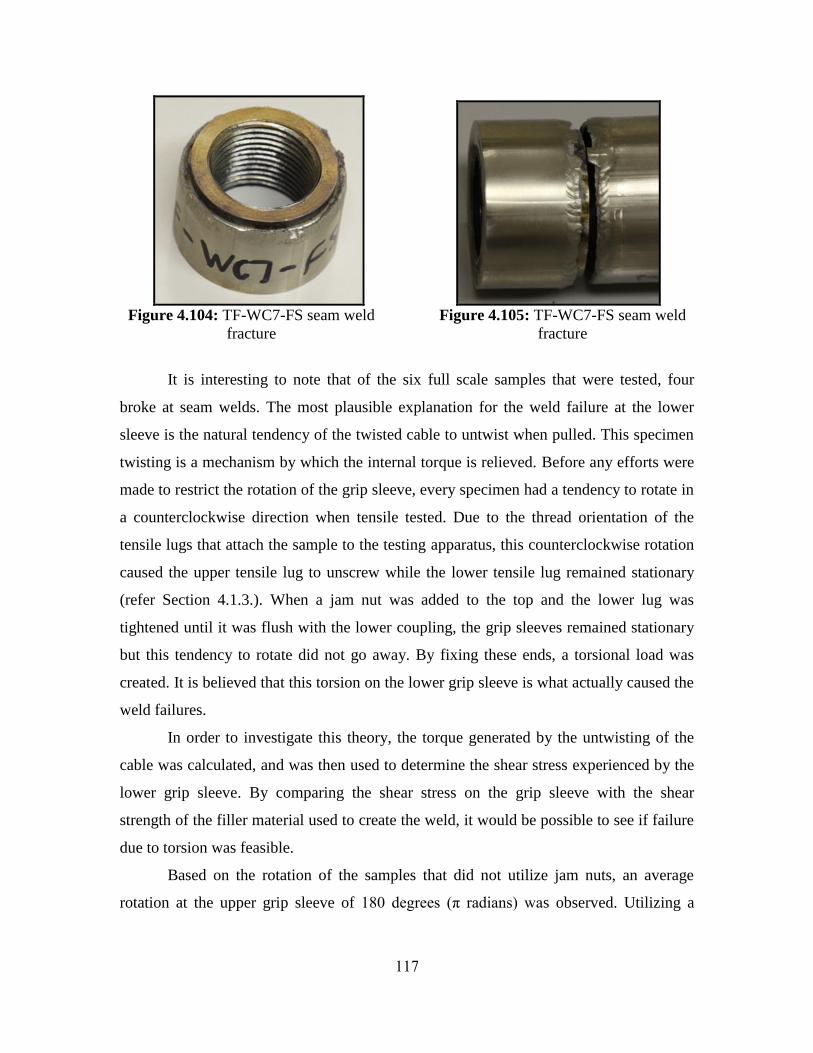
Figure 4.104: TF-WC7-FS seam weld
fracture
Figure 4.105: TF-WC7-FS seam weld
fracture
It is interesting to note that of the six full scale samples that were tested, four
broke at seam welds. The most plausible explanation for the weld failure at the lower
sleeve is the natural tendency of the twisted cable to untwist when pulled. This specimen
twisting is a mechanism by which the internal torque is relieved. Before any efforts were
made to restrict the rotation of the grip sleeve, every specimen had a tendency to rotate in
a counterclockwise direction when tensile tested. Due to the thread orientation of the
tensile lugs that attach the sample to the testing apparatus, this counterclockwise rotation
caused the upper tensile lug to unscrew while the lower tensile lug remained stationary
(refer Section 4.1.3.). When a jam nut was added to the top and the lower lug was
tightened until it was flush with the lower coupling, the grip sleeves remained stationary
but this tendency to rotate did not go away. By fixing these ends, a torsional load was
created. It is believed that this torsion on the lower grip sleeve is what actually caused the
weld failures.
In order to investigate this theory, the torque generated by the untwisting of the
cable was calculated, and was then used to determine the shear stress experienced by the
lower grip sleeve. By comparing the shear stress on the grip sleeve with the shear
strength of the filler material used to create the weld, it would be possible to see if failure
due to torsion was feasible.
Based on the rotation of the samples that did not utilize jam nuts, an average
rotation at the upper grip sleeve of 180 degrees (π radians) was observed. Utilizing a
117

standard Mechanics of Materials approach, this amount of rotation was found to produce
a torque of approximately 28.98 kN·m on the lower grip sleeve with a corresponding
shear stress of approximately 550.65 MPa. Due to the fact that this methodology was
based on the assumption that the copper cable was actually a solid tubular shaft, this
value is likely higher than the actual shear stress. In order to improve upon the accuracy
of this calculation, a second torque value was determined using a Mechanics of Wire
Rope approach. With this method, the moment produced by the cable could be
determined based on the load applied to the cable, the winding radius of the cable, the
number of layers that comprise the cable, the number of strands in each layer, and the lay
angle of the strands in the cable [42]. For a single layer 6 strand rope with a failure load
of 121 kN (the average load supported by the four samples that experienced weld
failures), the torque produced by the unwinding of the cable was approximately 17.18
kN·m. Utilizing the same Mechanics of Materials approach as before, the shear stress
based on this torque was calculated to be approximately 326.42 MPa. Despite the fact
that this approach accounted for the 6 strands that comprise the cable, there was no
consideration for the number of individual wires that make up the strands or the material
properties of the cable in the torque equation. Therefore, this shear stress is still likely to
be different than the actual number.
The weld joints used to connect the tensile lugs and grip sleeves on the test
samples were Gas Tungsten Arc Welded (GTAW or TIG) welded using 304 Stainless
Steel filler metal. This particular filler metal possesses a shear strength of 186 MPa and a
tensile strength of 500 MPa [43]. A comparison of these values with those calculated
above shows that the shear stress produced by the cable torque exceeds the shear strength
of the weld joint, but not its tensile strength. Based on this comparison, it is very probable
that the failure of the TF-WC4-FS, TF-WC5-FS, TF-WC6-FS, and TF-WC7-FS samples
was due to torsion.
Another factor to consider when evaluating these results is the existence of a
stick-slip mechanism (see Sections 4.1.2. and 4.1.3.) that occurred during the tensile
loading. One distinct case of this stick-slip mechanism was observed on the force versus
118

displacement plot for the TF-WC4-FS, TF-WC5-FS, TF-WC6-FS, and TF-WC7-FS
samples (see Figure 4.106).
40
50
60
70
80
90
100
110
120
130
6 8 10 12 14 16 18
Displacement (mm)
Axia
l F
orc
e (k
N)
TF-WC4-FS
TF-WC5-FS
TF-WC6-FS
TF-WC7-FS
Figure 4.106: Comparison of stick slip experienced by TF-WC4, TF-WC5, TF-WC6,
and TF-WC7
The occurrence of stick-slip was identified based on the magnitude of the
fluctuations that were observed on the force versus displacement plot. As can be seen in
Figure 4.106, the magnitude of the oscillations remained constant with increasing axial
load for all four samples, and occurred at roughly the same load/displacement/time. This
is an indication that fatigue testing had no effect on this behavior.
In addition to the stick-slip mechanism, another unusual trend appeared on the
force vs. displacement plots of both TF-WC3-FS and TF-WC4-FS samples. This
phenomenon was characterized by a sudden drop in the axial load that was not indicative
of stick-slip. Based on a visual observation as well as a numerical calculation, it was
determined that this abrupt load decrease was the result of the upper tensile lug
unscrewing from the coupling as the specimen began to untwist (see Section 4.1.3.). In an
119

attempt to combat this problem, jam nuts were installed against the upper tensile lug to
prevent this unwanted action (refer to Figure 4.77). As can be seen in Figures 4.106, this
phenomenon did not occur with TF-WC5-FS, TF-WC6-FS, or TF-WC7-FS.
4.2. Finite Element Analysis Results
Despite the fact that they were simplified in a variety of ways, the FEA models
that were used to evaluate the deformation behavior of the cable were still extremely
complex. Additionally, the Comsol Multiphysics modeling environment is difficult for an
inexperienced user to master. As a result, accurate FEA results could not be obtained.
Due to these inaccuracies, FEA results will not be included in this thesis. However, the
process that was used to develop the FEA models was accurate and could potentially be
helpful for someone else who chooses to perform a similar analysis in the future.
Therefore, the methodology will still be included.
4.3. Welding Metallurgy Results
In addition to the deformation behavior of the cable, there are several
characteristics of the weld joints that indicate grip sleeve failure due to torsion. Based on
the angle of their fracture surfaces, it can be concluded that the welds failed in shear
rather than tension. As can be seen in Figure 4.107, the fracture face is oriented at an
angle of approximately 45°, which is indicative of shear fracture [41]. The surface of a
tensile fracture would appear to be flat, or oriented at a 90° angle. Additionally, we can
see from figure 4.107 that it was the weld itself that broke and not the grip sleeve as there
is no sleeve material at the fracture surface. Since the shear strength of the weld filler
material is less than its tensile strength, this is another indication of shear failure.
120

Figure 4.107: Seam weld fracture showing 45° angle of fracture face
121
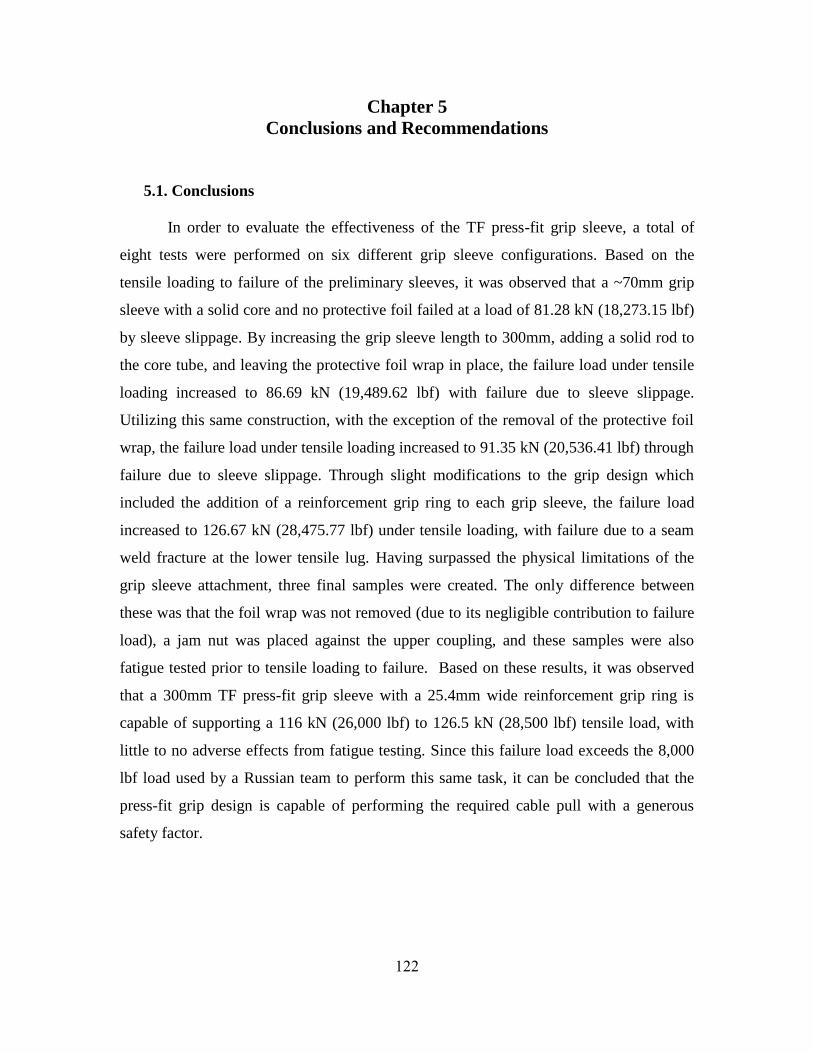
Chapter 5
Conclusions and Recommendations
5.1. Conclusions
In order to evaluate the effectiveness of the TF press-fit grip sleeve, a total of
eight tests were performed on six different grip sleeve configurations. Based on the
tensile loading to failure of the preliminary sleeves, it was observed that a ~70mm grip
sleeve with a solid core and no protective foil failed at a load of 81.28 kN (18,273.15 lbf)
by sleeve slippage. By increasing the grip sleeve length to 300mm, adding a solid rod to
the core tube, and leaving the protective foil wrap in place, the failure load under tensile
loading increased to 86.69 kN (19,489.62 lbf) with failure due to sleeve slippage.
Utilizing this same construction, with the exception of the removal of the protective foil
wrap, the failure load under tensile loading increased to 91.35 kN (20,536.41 lbf) through
failure due to sleeve slippage. Through slight modifications to the grip design which
included the addition of a reinforcement grip ring to each grip sleeve, the failure load
increased to 126.67 kN (28,475.77 lbf) under tensile loading, with failure due to a seam
weld fracture at the lower tensile lug. Having surpassed the physical limitations of the
grip sleeve attachment, three final samples were created. The only difference between
these was that the foil wrap was not removed (due to its negligible contribution to failure
load), a jam nut was placed against the upper coupling, and these samples were also
fatigue tested prior to tensile loading to failure. Based on these results, it was observed
that a 300mm TF press-fit grip sleeve with a 25.4mm wide reinforcement grip ring is
capable of supporting a 116 kN (26,000 lbf) to 126.5 kN (28,500 lbf) tensile load, with
little to no adverse effects from fatigue testing. Since this failure load exceeds the 8,000
lbf load used by a Russian team to perform this same task, it can be concluded that the
press-fit grip design is capable of performing the required cable pull with a generous
safety factor.
122
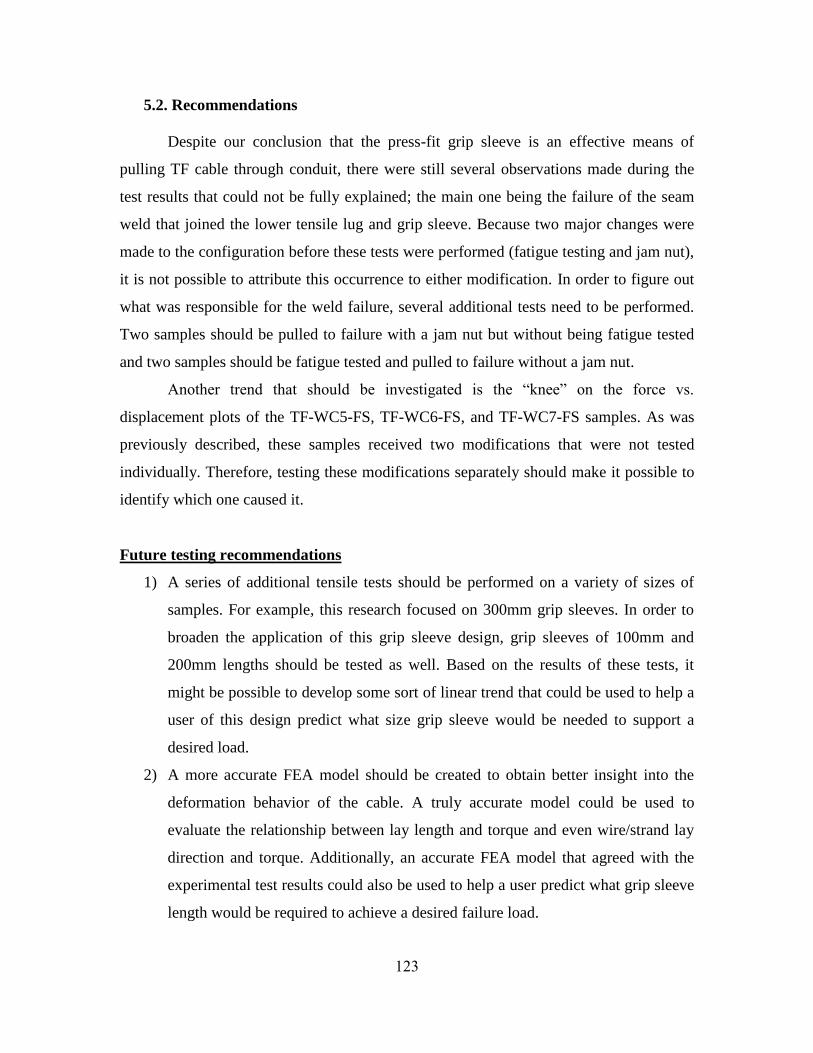
5.2. Recommendations
Despite our conclusion that the press-fit grip sleeve is an effective means of
pulling TF cable through conduit, there were still several observations made during the
test results that could not be fully explained; the main one being the failure of the seam
weld that joined the lower tensile lug and grip sleeve. Because two major changes were
made to the configuration before these tests were performed (fatigue testing and jam nut),
it is not possible to attribute this occurrence to either modification. In order to figure out
what was responsible for the weld failure, several additional tests need to be performed.
Two samples should be pulled to failure with a jam nut but without being fatigue tested
and two samples should be fatigue tested and pulled to failure without a jam nut.
Another trend that should be investigated is the “knee” on the force vs.
displacement plots of the TF-WC5-FS, TF-WC6-FS, and TF-WC7-FS samples. As was
previously described, these samples received two modifications that were not tested
individually. Therefore, testing these modifications separately should make it possible to
identify which one caused it.
Future testing recommendations
1) A series of additional tensile tests should be performed on a variety of sizes of
samples. For example, this research focused on 300mm grip sleeves. In order to
broaden the application of this grip sleeve design, grip sleeves of 100mm and
200mm lengths should be tested as well. Based on the results of these tests, it
might be possible to develop some sort of linear trend that could be used to help a
user of this design predict what size grip sleeve would be needed to support a
desired load.
2) A more accurate FEA model should be created to obtain better insight into the
deformation behavior of the cable. A truly accurate model could be used to
evaluate the relationship between lay length and torque and even wire/strand lay
direction and torque. Additionally, an accurate FEA model that agreed with the
experimental test results could also be used to help a user predict what grip sleeve
length would be required to achieve a desired failure load.
123

References
124
1. BP. (2006). [Statistical Review of World Energy 2009]. Retrieved from
http://www.bp.com/statisticalreview. 21 July, 2010.
2. Energy Information Administration. (2009). [Emissions of Greenhouse Gases in the
United States 2008]. Retrieved from
http://www.eia.doe.gov/oiaf/1605/ggrpt/pdf/0573%282008%29.pdf. 18 October,
2010.
3. ITER. [Plasma Confinement]. Retrieved from
http://www.iter.org/sci/plasmaconfinement. 13 July, 2010.
4. Associated Plasma Laboratory. [Plasma Confinement]. Retrieved from
http://www.plasma.inpe.br/LAP_Portal/LAP_Site/Text/Plasma_Confinement.htm.
13, Jule 2010.
5. ITER. [Small quantities of fuel]. Retrieved from http://www.iter.org/sci/fusionfuels.
13 July, 2010.
6. ITER. [20th
Century Fusion]. Retrieved from http://www.iter.org/sci/beyonditer. 11
July, 2010.
7. ITER. [ITER: the world‟s largest tokomak]. Retrieved from http://www.iter.org/mach.
13 July, 2010.
8. [Nuclear Fission vs. Nuclear Fusion]. Retrieved from
http://www.diffen.com/difference/Nuclear_Fission_vs_Nuclear_Fusion. 14 August,
2010
9. ITER. Image taken from http://www.iter.org/industry. 13 July, 2010.
10. The Institute of Physics blog. (2010). [Physics around the UK]. Retrieved from
http://www.iopblog.org/2010-schools-lecture-part-5/. 14 August, 2010.
125
11. JET. Image taken from http://www.jet.efda.org/focus-on/plasma-heating-current-
drive/ohmic-heating/. 14 August, 2010.
12. ITER. [Magnets]. Retrieved from http://www.iter.org/mach/magnets. 11 July, 2010.
13. ITER. Image taken from http://www.iter.org/mach/magnets. 13 July, 2010.
14. ITER. [Toroidal Field System]. Retrieved from http://www.iter.org/mach/magnets.
11 July, 2010
15. Chan, Kevin. ITER. Personal communication. May 2010 – October 2010.
16. Washington State Department of Labor and Industries. Image taken from
http://www.lni.wa.gov/wisha/rules/construction/HTML/296-155L_2.htm. 14
August, 2010
17. Wikipedia: Wire Rope. Image taken from
http://en.wikipedia.org/wiki/File:Wire_rope_with_thimble_and_ferrule.jpg. 2
September, 2010.
18. Far Reach Voyages. Image taken from
http://www.farreachvoyages.com/projects/standingrigging.html. 2 September, 2010.
19. The Yacht Shop. Image taken from
http://www.theyachtshop.co.uk/items/rope~twine~chain-and-wire/wire-rope/rope-
grips/bulldog-grip-12mm-galvanised-h02811-detail.htm. 2 September, 2010.
20. Image taken from
http://www.tpub.com/content/construction/14251/css/14251_139.htm. 5 September,
2010
21. Noble and Son Ltd. Image taken from
http://www.nobles.com.au/products.aspx?doc_id=2827. 5 September, 2010.
126

22. Gunnebo Industries. Image taken from
http://www.gunneboindustries.com/en/Lifting/Products/Steel-wire-ropes/Steel-wire-
rope-components/Open-spelter-socket/. 2 September, 2010.
23. Integrated Publishing. [Construction: Basket Socket]. Retrieved from
http://www.tpub.com/content/construction/14251/css/14251_140.htm. 4 September,
2010
24. McMaster-Carr. Image taken from
http://www.mcmaster.com/#catalog/116/1406/=98ibf4. 4 September, 2010
25. ThomasNet News. Image taken from http://news.thomasnet.com/fullstory/Wire-
Rope-Fittings-eliminate-need-for-swage-press-479682. 4 September, 2010
26. Wire Rope Specialists. Image taken from
http://www.wireropespecialists.com/wirerope.htm. 4 September, 2010
27. Costello, George A. Theory of Wire Rope. Springer – Verlag. New York, New York.
1997. 1-3.
28. I and I Sing Inc. Image taken from
http://www.iandisling.com/wire_rope_by_the_foot.htm. 4 September, 2010.
29. Integrated Publishing. Image taken from
http://www.tpub.com/content/aviation/14018/css/14018_142.htm. 4 September,
2010.
30. Casar. Image taken from http://www.fastlift.co.za/pdf/CASAR%20-
%20Rotation%20characteristics%20of%20steel%20wire%20rope.pdf. 4 September,
2010.
31. Chaplin, C.R. et al. (1999). [Tension-torsion fatigue effects in wire rope]. Retrieved
from http://www.bgisl.com/RRR_OE_Twist_article_OIPEEC_1999.pdf
127

32. Chaplin, C.R., [Torsional failure of a wire rope during mooring line installation in
deep water], Failure Analysis Case Studies II. Jones, D.R.H., Pergamon 2001. 49.
33. Hanes Supply, Inc. [Wire Rope 101]. Retrieved from
http://www.hanessupply.com/content/catalog/001/001-0001.pdf. 2 September, 2010.
34. CarlStahl. Image taken from
http://www.carlstahlevita.co.uk/Category.aspx?category=18. 2 September, 2010.
35. MITCalc. [Interference Fit]. Retrieved from
http://www.mitcalc.com/doc/shaftconf/help/en/shaftconf.htm. 17 September, 2010.
36. Laboratory of Physics of Granular Plant Materials. [Wall Friction: Frictional
Vibrations]. Retrieved from http://lgm.ipan.lublin.pl/eng/research.html. 17
September, 2010.
37. International Journal of Mechanical Sciences, Volume 29, Issue 9. (1987). Pages
605-619. [The response of wire rope to axial tensile loads- Part 1. Experimental
results and theoretical predictions.
38. Images provided by Steve Kenney of ITER
39. COMSOL Solid Mechanics Module Documentation
40. Costello, George A. (2003). [Mechanics of Wire Rope]. Retrieved from
http://www.ideals.illinois.edu/bitstream/handle/2142/286/1018.pdf?sequence=1. 21
September, 2010.
41. Lundin, Carl. University of Tennessee. Personal Communication. September 2010.
42. Feyrer, Klaus. [Wire Ropes: Tension, Endurance, Reliability]. Springer. New York.
2007. 64-104.
128

43. The University of Bolton. [Mechanical Properties of Metals]. Retrieved from
http://www.ami.ac.uk/courses/topics/0123_mpm/index.html. 19 October, 2010.
129

Appendix
130
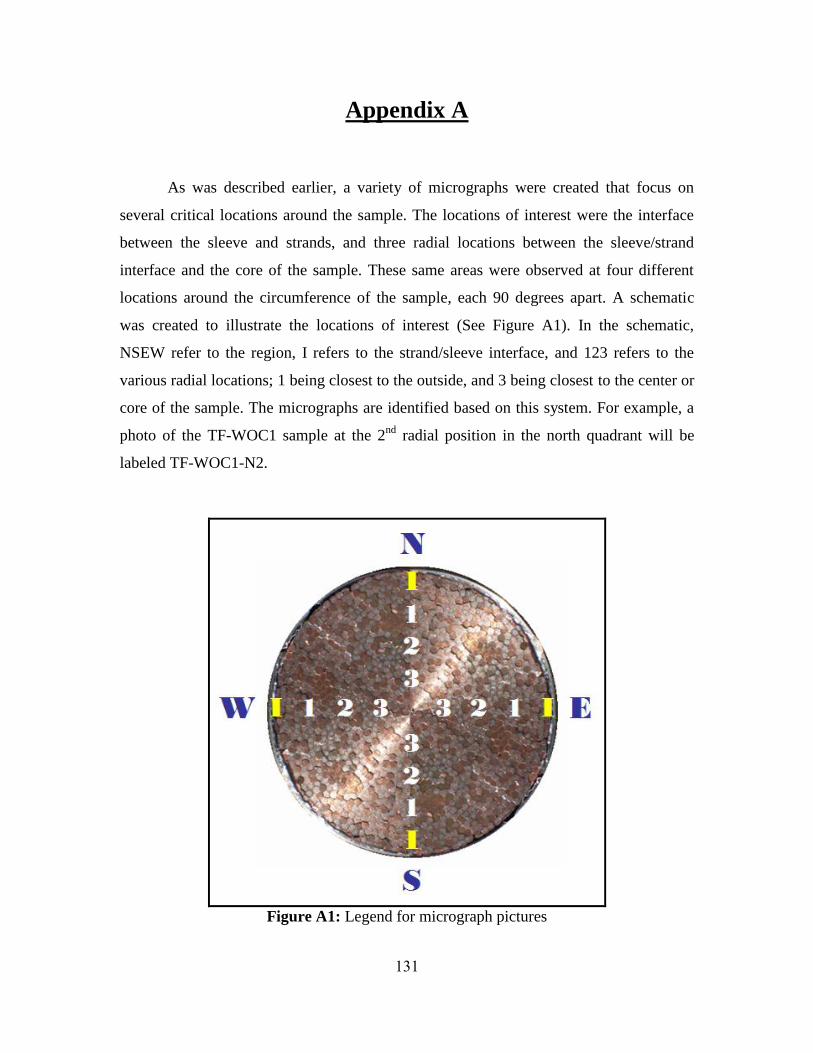
Appendix A
As was described earlier, a variety of micrographs were created that focus on
several critical locations around the sample. The locations of interest were the interface
between the sleeve and strands, and three radial locations between the sleeve/strand
interface and the core of the sample. These same areas were observed at four different
locations around the circumference of the sample, each 90 degrees apart. A schematic
was created to illustrate the locations of interest (See Figure A1). In the schematic,
NSEW refer to the region, I refers to the strand/sleeve interface, and 123 refers to the
various radial locations; 1 being closest to the outside, and 3 being closest to the center or
core of the sample. The micrographs are identified based on this system. For example, a
photo of the TF-WOC1 sample at the 2nd
radial position in the north quadrant will be
labeled TF-WOC1-N2.
Figure A1: Legend for micrograph pictures
131
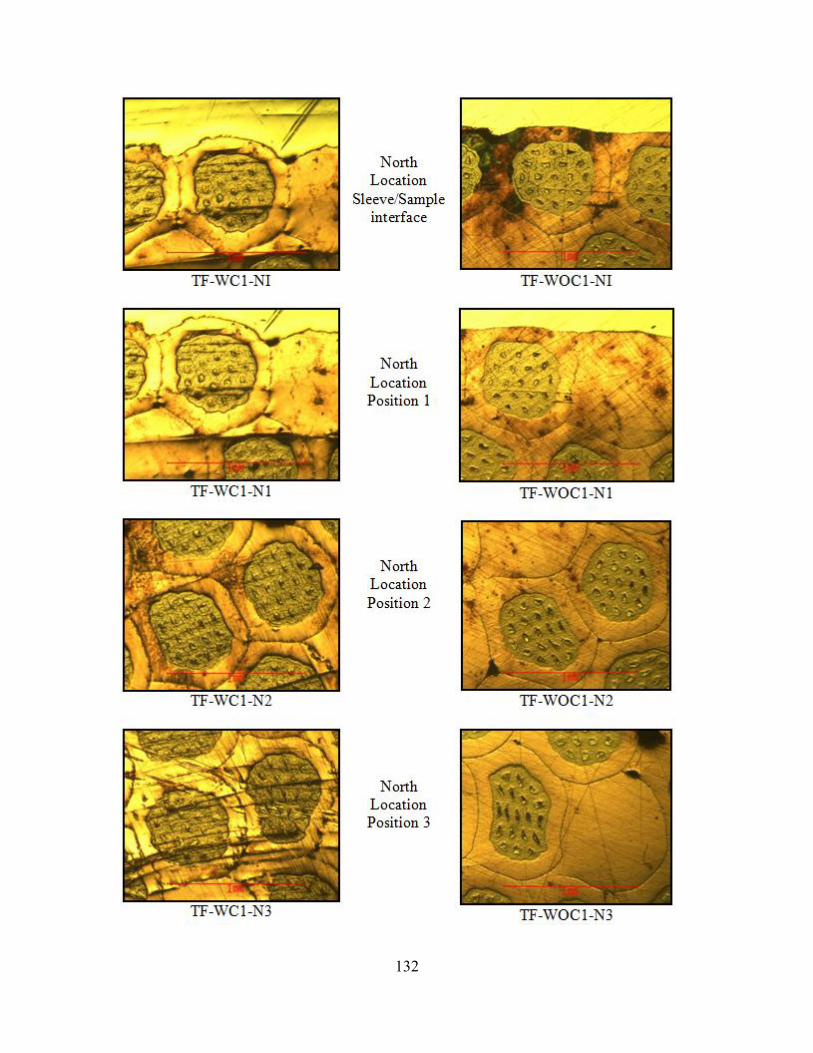
132
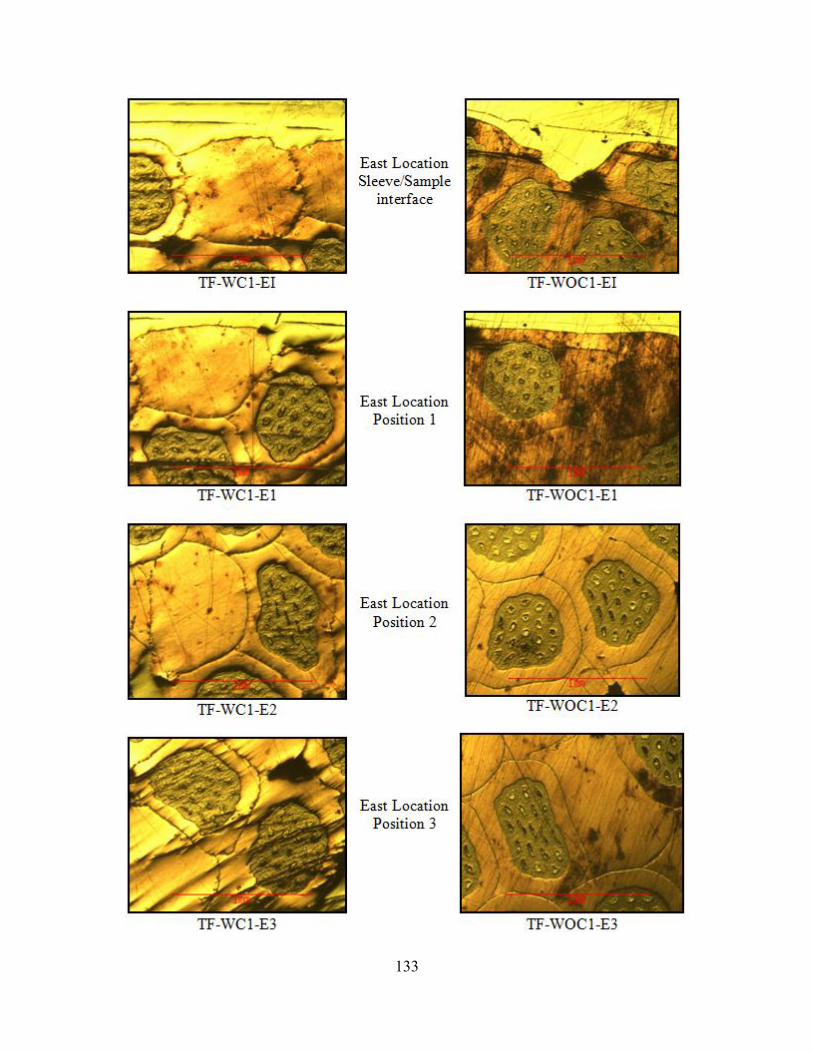
133

134

135
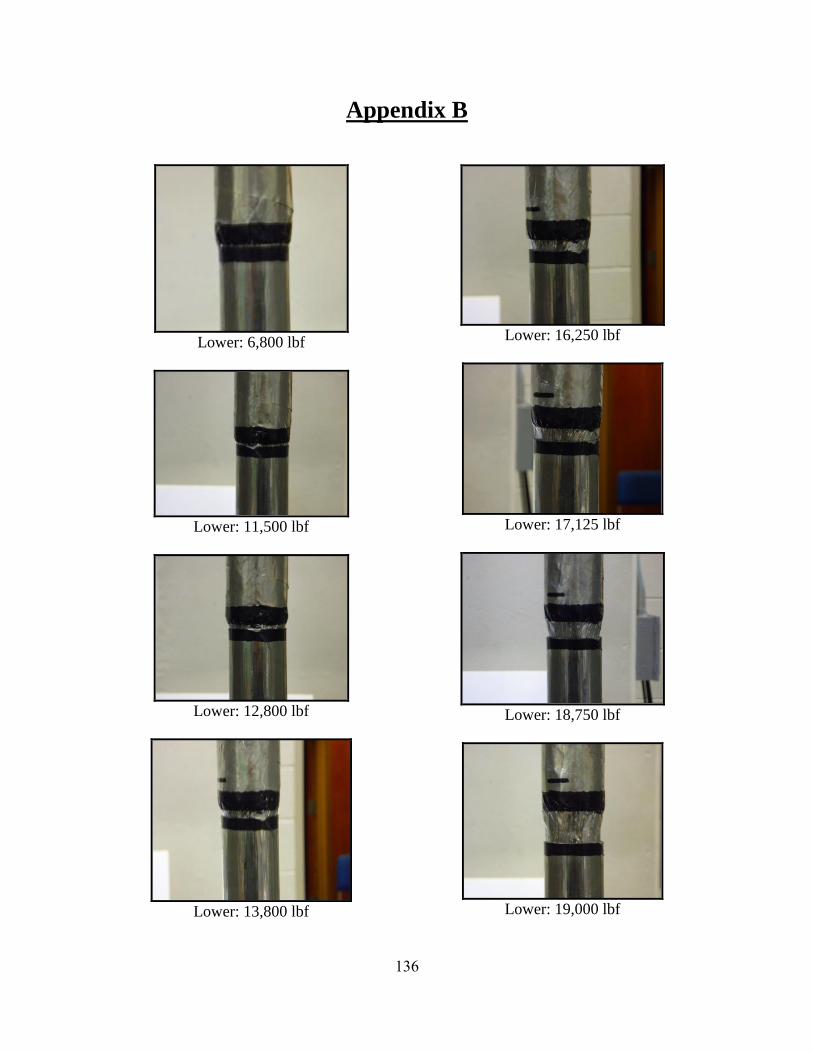
Appendix B
Lower: 6,800 lbf
Lower: 11,500 lbf
Lower: 12,800 lbf
Lower: 13,800 lbf
Lower: 16,250 lbf
Lower: 17,125 lbf
Lower: 18,750 lbf
Lower: 19,000 lbf
136
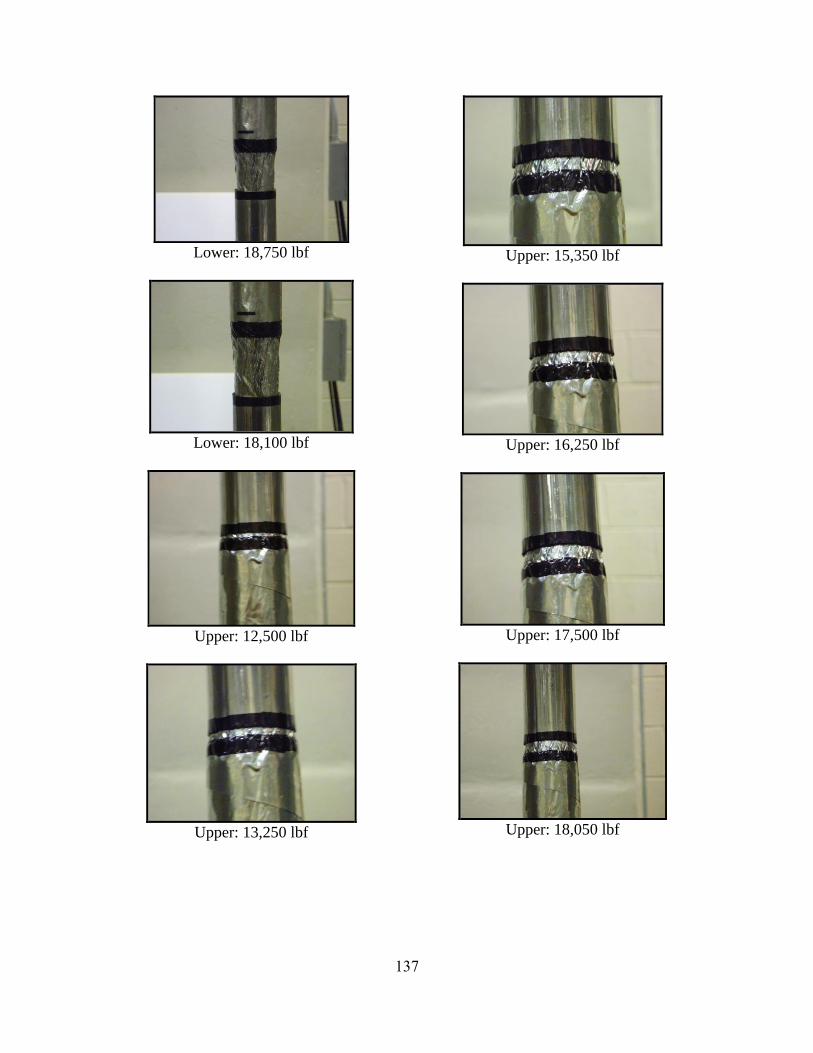
Lower: 18,750 lbf
Lower: 18,100 lbf
Upper: 12,500 lbf
Upper: 13,250 lbf
Upper: 15,350 lbf
Upper: 16,250 lbf
Upper: 17,500 lbf
Upper: 18,050 lbf
137

Upper: 18,300 lbf
Upper: 19,200 lbf
138

VITA
Paul Michael Hayes was born on May 24, 1985 in Knoxville, Tennessee. He was
raised in Knoxville, Tennessee where he attended Cedar Bluff Primary, Middle, and
Intermediate for grades K-8, and went to high school at Bearden High School. He
graduated in 2003 and began college that fall at the University of Tennessee in Knoxville.
After pursuing a Logistics degree for two years, he changed majors to Mechanical
Engineering and graduated in May of 2009 with his Bachelor of Science in Mechanical
Engineering. During his undergraduate studies, Paul worked at Imagepoint, Inc. as an
engineering designer. He began his graduate studies in May 2009 in Mechanical
Engineering with a concentration on machine design. He worked as a research assistant to
Dr. Madhu S. Madhukar at the Magnet Development Laboratory in collaboration with the
University of Tennessee and the Oak Ridge National Laboratory. He will be graduating
in December 2010 with his Masters of Science in Mechanical Engineering and will begin
working in January 2011 for DCP Midstream as a project engineer in Houston, Texas.
139


![Cable reduction sleeve - Glenair, Inc. · Reduction Sleeve for use with Mechanical Cable Clamp or Basketweave Cable Grip Shell Size Sleeve P/N Sleeve inner diameter [mm] Sleeve outer](https://img.pdfslide.us/doc/110x75/5ec496aef7ac3c7f406c6755/cable-reduction-sleeve-glenair-inc-reduction-sleeve-for-use-with-mechanical.jpg)