Embed Size (px)
Citation preview
J. Mol. Biol. (1997) 274, 421±435
Use of a 3D Structure Data Base for UnderstandingSequence-dependent Conformational Aspects of DNA
Masashi Suzuki1,2*, Naoki Amano1, Jun Kakinuma1,2
and Masaru Tateno1,3
1AIST-NIBHT, CREST Centreof Structural BiologyHigashi 1-1, Tsukuba305 Japan2Graduate School of Humanand Environmental SciencesUniversity of TokyoKomaba 3-8-1, Meguro, Tokyo153 Japan3Computational ScienceLaboratory, Institute of Physicaland Chemical ResearchRIKEN, Hirosawa 2-1, Wako351-01 Japan
0022±2836/97/480421±15 $25.00/0/mb
The roll-twist-slide correlation in the DNA crystal structures that are col-lected in the Nucleic Acid Data Base is analyzed in order to obtain a gen-eral understanding of the effects of the nucleotide sequence on the 3Dstructure of a dinucleotide step. It is concluded that the differencesbetween the pyrimidine bases and the purine bases in terms of theirphysical shapes are the major factors that determine the stereochemicalcharacteristics of the steps through base to backbone and base to baseinteractions. The characteristics are further modulated by the differencesbetween the A:T and G:C base-pairs, which can be explained by enhance-ment of the purine-pyrimidine asymmetry in the A:T base-pair.
# 1997 Academic Press Limited
Keywords: DNA conformation; crystal structure; TATA box; DNA-proteininteraction; DNA bending
*Corresponding authorIntroduction
A protein structure is stabilized by side-chain±side-chain interactions, which can be madebetween residues a long way from each other inthe linear polypeptide chain. In contrast, distantcontacts are not frequently observed in the double-stranded DNA structure. As a consequence, DNAmolecules are more ¯exible. The ¯exibility allowsDNA, for example, to bind around a protein sur-face (Barber & Zhurkin, 1990; Suzuki & Yagi, 1995;Juo et al., 1996; Suzuki et al., 1996b), or to adopt aparticular crystal packing (Yanagi et al., 1991;Dickerson, 1992; Dickerson et al., 1994; Timsit &Moras, 1995; Grzeskowiak, 1996). Therefore, tounderstand the stereochemical characteristics ofDNA, it is essential to crystallize the same DNAfragment in as many conditions as possible and tomake comparisons with other determined confor-mations, i.e. by using data bases (Calladine &Drew, 1984; Dickerson, 1992; Heinemann et al.,1992; Suzuki & Yagi, 1995; Young et al., 1995;Suzuki et al., 1996a; Olson & Zhurkin, 1996; Olson,1996; EL Hassan & Calladine, 1997).
In these data bases, the conformational changesfound in protein complexes are larger than thosecaused by crystal packing, since the protein-bind-ing DNAs have been designed in evolution to pro-
971406
duce various superstructures by the selection ofappropriate sequences, while most of the DNAmolecules crystallized in the absence of a proteinare packed more or less straight. Therefore, thegreatly distorted DNA structures in complexeswith TBP (Kim, Y. et al., 1993; Kim, J. L. et al.,1993; Juo et al., 1996), CAP (Schultz et al., 1991;Parkinson et al., 1996a,b) and E2 (Hegde et al.,1992) gave us a good insight into this subject(Barber & Zhurkin, 1990; Suzuki et al., 1996b;Guzikevich-Guerstein & Shakked, 1996).
The number of DNA crystal structures so fardetermined is large enough to make a statisticalsurvey of the conformations of the ten independenttypes of dinucleotide steps, and thus these stepsare the focus of this analysis. In general, a database-oriented analysis proceeds, ®rst by collectingcrystal structures, second by de®ning the par-ameters that will be used for characterizing thestructures, third by calculating the parametersusing an appropriate algorithm, and ®nally byinterpreting the calculated values in order todevelop a concept that can explain various charac-teristics of the 3D structures. Here the NucleicAcid Data Base (NDB; Berman et al., 1992) isused at the ®rst step, the Cambridge code par-ameters (Dickerson, 1989) at the second step, and
# 1997 Academic Press Limited
422 DNA Sequence-dependent Conformation
the Babcock-Olson program (Babcock et al., 1994)at the third step.
The study of DNA conformations in this way isnot totally novel (Dickerson, 1992; Bhattacharyya& Bansal, 1992; Sponer & Kypr,1993; Suzuki &Yagi, 1995; Young et al., 1995; Gorin et al., 1995;Suzuki et al., 1996a; Olson, 1996; EL Hassan &Calladine, 1997). However, the ®nal step of inter-preting the statistics, though most important, isvery dif®cult. The already published interpret-ations do not seem to provide a simple and con-sistent concept that can cover the overall featuresof sequence-dependence in DNA conformations.
There are at least two novel and importantaspects in this work. First, the correlation of thethree parameters, roll, helical twist (here referredto as twist) and slide, is concentrated on for thereasons described below, and is analyzed in asystematic way. Second, a simpli®ed 3D model ofa dinucleotide step is used extensively to providea consistent explanation. Through this process ofsimpli®cation, by keeping important stereochemi-cal characteristics of the dinucleotide confor-
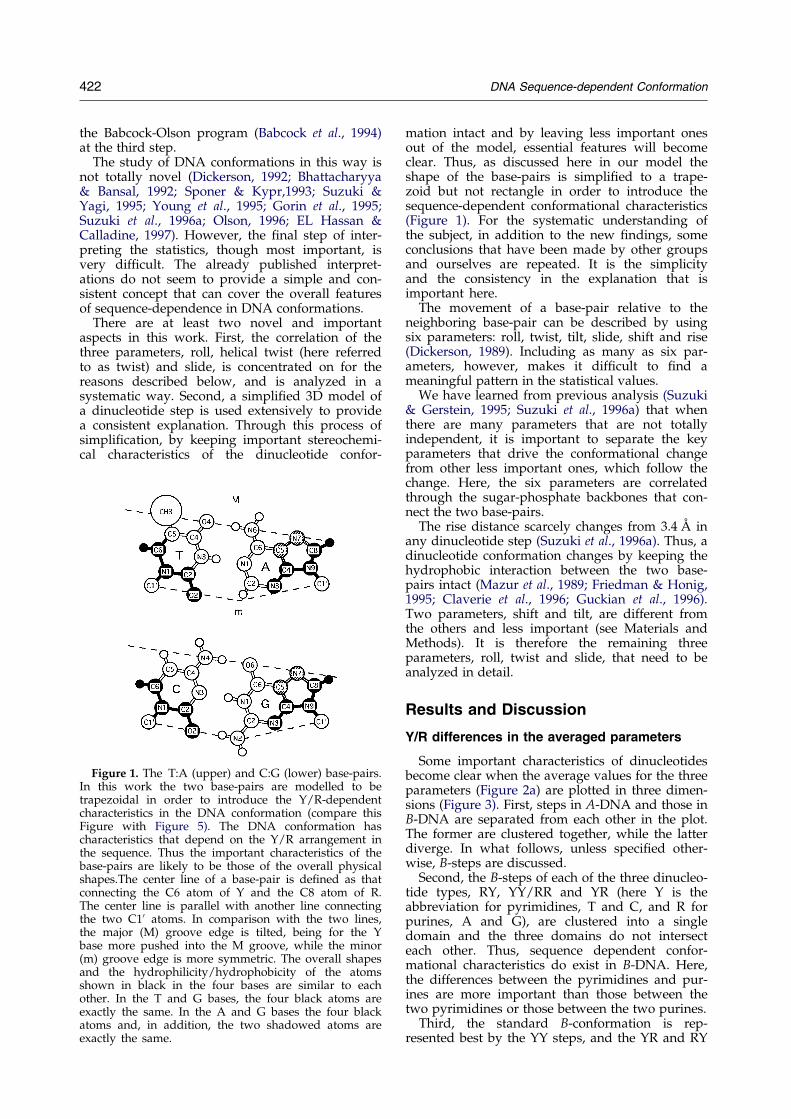
Figure 1. The T:A (upper) and C:G (lower) base-pairs.In this work the two base-pairs are modelled to betrapezoidal in order to introduce the Y/R-dependentcharacteristics in the DNA conformation (compare thisFigure with Figure 5). The DNA conformation hascharacteristics that depend on the Y/R arrangement inthe sequence. Thus the important characteristics of thebase-pairs are likely to be those of the overall physicalshapes.The center line of a base-pair is de®ned as thatconnecting the C6 atom of Y and the C8 atom of R.The center line is parallel with another line connectingthe two C10 atoms. In comparison with the two lines,the major (M) groove edge is tilted, being for the Ybase more pushed into the M groove, while the minor(m) groove edge is more symmetric. The overall shapesand the hydrophilicity/hydrophobicity of the atomsshown in black in the four bases are similar to eachother. In the T and G bases, the four black atoms areexactly the same. In the A and G bases the four blackatoms and, in addition, the two shadowed atoms areexactly the same.
mation intact and by leaving less important onesout of the model, essential features will becomeclear. Thus, as discussed here in our model theshape of the base-pairs is simpli®ed to a trape-zoid but not rectangle in order to introduce thesequence-dependent conformational characteristics(Figure 1). For the systematic understanding ofthe subject, in addition to the new ®ndings, someconclusions that have been made by other groupsand ourselves are repeated. It is the simplicityand the consistency in the explanation that isimportant here.
The movement of a base-pair relative to theneighboring base-pair can be described by usingsix parameters: roll, twist, tilt, slide, shift and rise(Dickerson, 1989). Including as many as six par-ameters, however, makes it dif®cult to ®nd ameaningful pattern in the statistical values.
We have learned from previous analysis (Suzuki& Gerstein, 1995; Suzuki et al., 1996a) that whenthere are many parameters that are not totallyindependent, it is important to separate the keyparameters that drive the conformational changefrom other less important ones, which follow thechange. Here, the six parameters are correlatedthrough the sugar-phosphate backbones that con-nect the two base-pairs.
The rise distance scarcely changes from 3.4 AÊ inany dinucleotide step (Suzuki et al., 1996a). Thus, adinucleotide conformation changes by keeping thehydrophobic interaction between the two base-pairs intact (Mazur et al., 1989; Friedman & Honig,1995; Claverie et al., 1996; Guckian et al., 1996).Two parameters, shift and tilt, are different fromthe others and less important (see Materials andMethods). It is therefore the remaining threeparameters, roll, twist and slide, that need to beanalyzed in detail.
Results and Discussion
Y/R differences in the averaged parameters
Some important characteristics of dinucleotidesbecome clear when the average values for the threeparameters (Figure 2a) are plotted in three dimen-sions (Figure 3). First, steps in A-DNA and those inB-DNA are separated from each other in the plot.The former are clustered together, while the latterdiverge. In what follows, unless speci®ed other-wise, B-steps are discussed.
Second, the B-steps of each of the three dinucleo-tide types, RY, YY/RR and YR (here Y is theabbreviation for pyrimidines, T and C, and R forpurines, A and G), are clustered into a singledomain and the three domains do not intersecteach other. Thus, sequence dependent confor-mational characteristics do exist in B-DNA. Here,the differences between the pyrimidines and pur-ines are more important than those between thetwo pyrimidines or those between the two purines.
Third, the standard B-conformation is rep-resented best by the YY steps, and the YR and RY
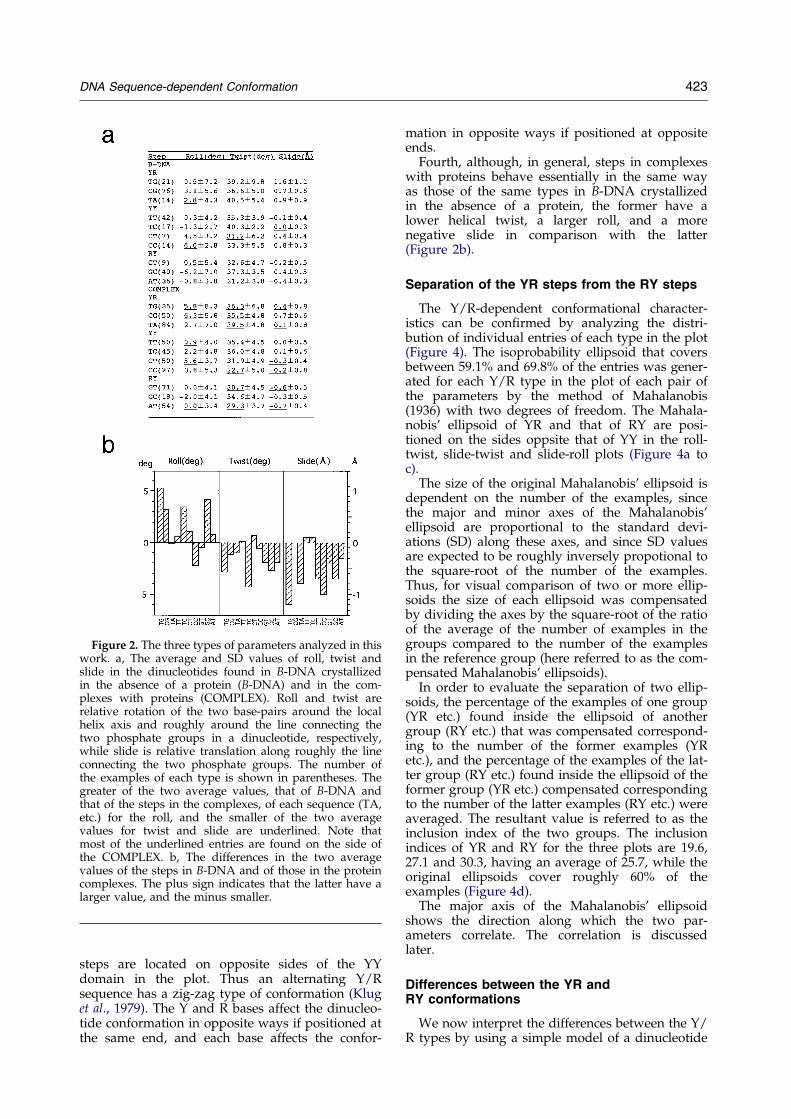
Figure 2. The three types of parameters analyzed in thiswork. a, The average and SD values of roll, twist andslide in the dinucleotides found in B-DNA crystallizedin the absence of a protein (B-DNA) and in the com-plexes with proteins (COMPLEX). Roll and twist arerelative rotation of the two base-pairs around the localhelix axis and roughly around the line connecting thetwo phosphate groups in a dinucleotide, respectively,while slide is relative translation along roughly the lineconnecting the two phosphate groups. The number ofthe examples of each type is shown in parentheses. Thegreater of the two average values, that of B-DNA andthat of the steps in the complexes, of each sequence (TA,etc.) for the roll, and the smaller of the two averagevalues for twist and slide are underlined. Note thatmost of the underlined entries are found on the side ofthe COMPLEX. b, The differences in the two averagevalues of the steps in B-DNA and of those in the proteincomplexes. The plus sign indicates that the latter have alarger value, and the minus smaller.
DNA Sequence-dependent Conformation 423
steps are located on opposite sides of the YYdomain in the plot. Thus an alternating Y/Rsequence has a zig-zag type of conformation (Kluget al., 1979). The Y and R bases affect the dinucleo-tide conformation in opposite ways if positioned atthe same end, and each base affects the confor-
mation in opposite ways if positioned at oppositeends.
Fourth, although, in general, steps in complexeswith proteins behave essentially in the same wayas those of the same types in B-DNA crystallizedin the absence of a protein, the former have alower helical twist, a larger roll, and a morenegative slide in comparison with the latter(Figure 2b).
Separation of the YR steps from the RY steps
The Y/R-dependent conformational character-istics can be con®rmed by analyzing the distri-bution of individual entries of each type in the plot(Figure 4). The isoprobability ellipsoid that coversbetween 59.1% and 69.8% of the entries was gener-ated for each Y/R type in the plot of each pair ofthe parameters by the method of Mahalanobis(1936) with two degrees of freedom. The Mahala-nobis' ellipsoid of YR and that of RY are posi-tioned on the sides oppsite that of YY in the roll-twist, slide-twist and slide-roll plots (Figure 4a toc).
The size of the original Mahalanobis' ellipsoid isdependent on the number of the examples, sincethe major and minor axes of the Mahalanobis'ellipsoid are proportional to the standard devi-ations (SD) along these axes, and since SD valuesare expected to be roughly inversely propotional tothe square-root of the number of the examples.Thus, for visual comparison of two or more ellip-soids the size of each ellipsoid was compensatedby dividing the axes by the square-root of the ratioof the average of the number of examples in thegroups compared to the number of the examplesin the reference group (here referred to as the com-pensated Mahalanobis' ellipsoids).
In order to evaluate the separation of two ellip-soids, the percentage of the examples of one group(YR etc.) found inside the ellipsoid of anothergroup (RY etc.) that was compensated correspond-ing to the number of the former examples (YRetc.), and the percentage of the examples of the lat-ter group (RY etc.) found inside the ellipsoid of theformer group (YR etc.) compensated correspondingto the number of the latter examples (RY etc.) wereaveraged. The resultant value is referred to as theinclusion index of the two groups. The inclusionindices of YR and RY for the three plots are 19.6,27.1 and 30.3, having an average of 25.7, while theoriginal ellipsoids cover roughly 60% of theexamples (Figure 4d).
The major axis of the Mahalanobis' ellipsoidshows the direction along which the two par-ameters correlate. The correlation is discussedlater.
Differences between the YR andRY conformations
We now interpret the differences between the Y/R types by using a simple model of a dinucleotide
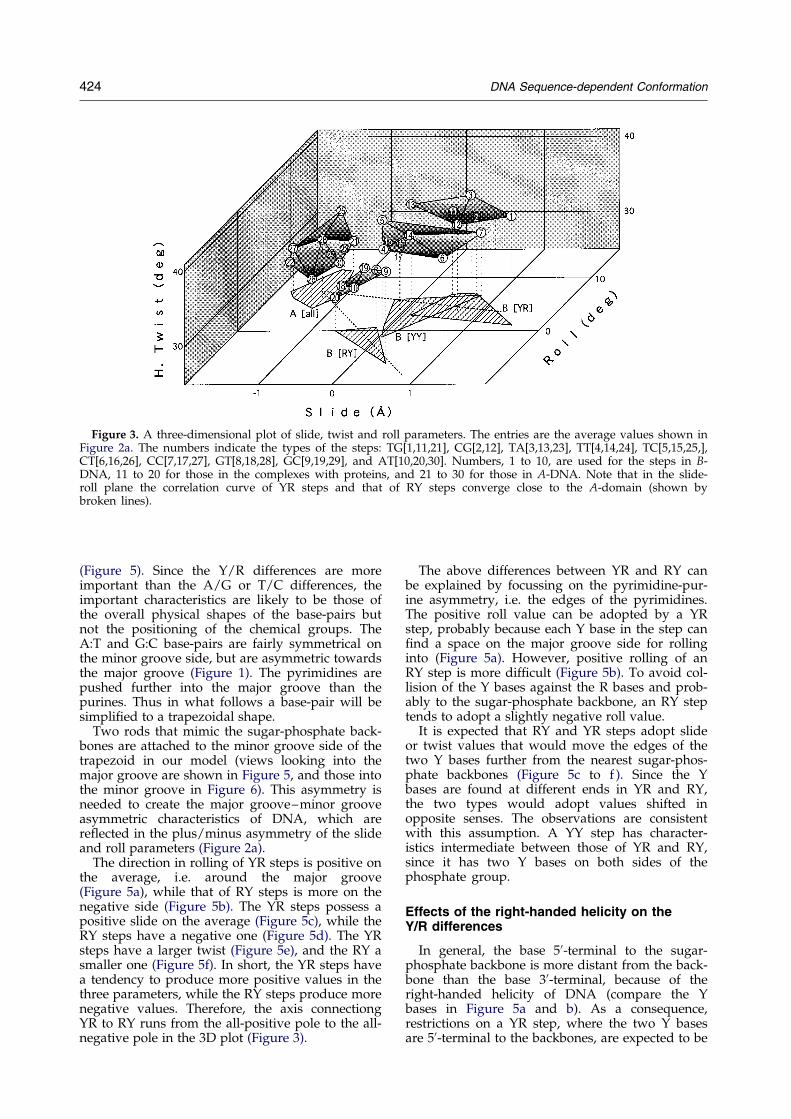
Figure 3. A three-dimensional plot of slide, twist and roll parameters. The entries are the average values shown inFigure 2a. The numbers indicate the types of the steps: TG[1,11,21], CG[2,12], TA[3,13,23], TT[4,14,24], TC[5,15,25,],CT[6,16,26], CC[7,17,27], GT[8,18,28], GC[9,19,29], and AT[10,20,30]. Numbers, 1 to 10, are used for the steps in B-DNA, 11 to 20 for those in the complexes with proteins, and 21 to 30 for those in A-DNA. Note that in the slide-roll plane the correlation curve of YR steps and that of RY steps converge close to the A-domain (shown bybroken lines).
424 DNA Sequence-dependent Conformation
(Figure 5). Since the Y/R differences are moreimportant than the A/G or T/C differences, theimportant characteristics are likely to be those ofthe overall physical shapes of the base-pairs butnot the positioning of the chemical groups. TheA:T and G:C base-pairs are fairly symmetrical onthe minor groove side, but are asymmetric towardsthe major groove (Figure 1). The pyrimidines arepushed further into the major groove than thepurines. Thus in what follows a base-pair will besimpli®ed to a trapezoidal shape.
Two rods that mimic the sugar-phosphate back-bones are attached to the minor groove side of thetrapezoid in our model (views looking into themajor groove are shown in Figure 5, and those intothe minor groove in Figure 6). This asymmetry isneeded to create the major groove±minor grooveasymmetric characteristics of DNA, which arere¯ected in the plus/minus asymmetry of the slideand roll parameters (Figure 2a).
The direction in rolling of YR steps is positive onthe average, i.e. around the major groove(Figure 5a), while that of RY steps is more on thenegative side (Figure 5b). The YR steps possess apositive slide on the average (Figure 5c), while theRY steps have a negative one (Figure 5d). The YRsteps have a larger twist (Figure 5e), and the RY asmaller one (Figure 5f). In short, the YR steps havea tendency to produce more positive values in thethree parameters, while the RY steps produce morenegative values. Therefore, the axis connectiongYR to RY runs from the all-positive pole to the all-negative pole in the 3D plot (Figure 3).
The above differences between YR and RY canbe explained by focussing on the pyrimidine-pur-ine asymmetry, i.e. the edges of the pyrimidines.The positive roll value can be adopted by a YRstep, probably because each Y base in the step can®nd a space on the major groove side for rollinginto (Figure 5a). However, positive rolling of anRY step is more dif®cult (Figure 5b). To avoid col-lision of the Y bases against the R bases and prob-ably to the sugar-phosphate backbone, an RY steptends to adopt a slightly negative roll value.
It is expected that RY and YR steps adopt slideor twist values that would move the edges of thetwo Y bases further from the nearest sugar-phos-phate backbones (Figure 5c to f ). Since the Ybases are found at different ends in YR and RY,the two types would adopt values shifted inopposite senses. The observations are consistentwith this assumption. A YY step has character-istics intermediate between those of YR and RY,since it has two Y bases on both sides of thephosphate group.
Effects of the right-handed helicity on theY/R differences
In general, the base 50-terminal to the sugar-phosphate backbone is more distant from the back-bone than the base 30-terminal, because of theright-handed helicity of DNA (compare the Ybases in Figure 5a and b). As a consequence,restrictions on a YR step, where the two Y basesare 50-terminal to the backbones, are expected to be
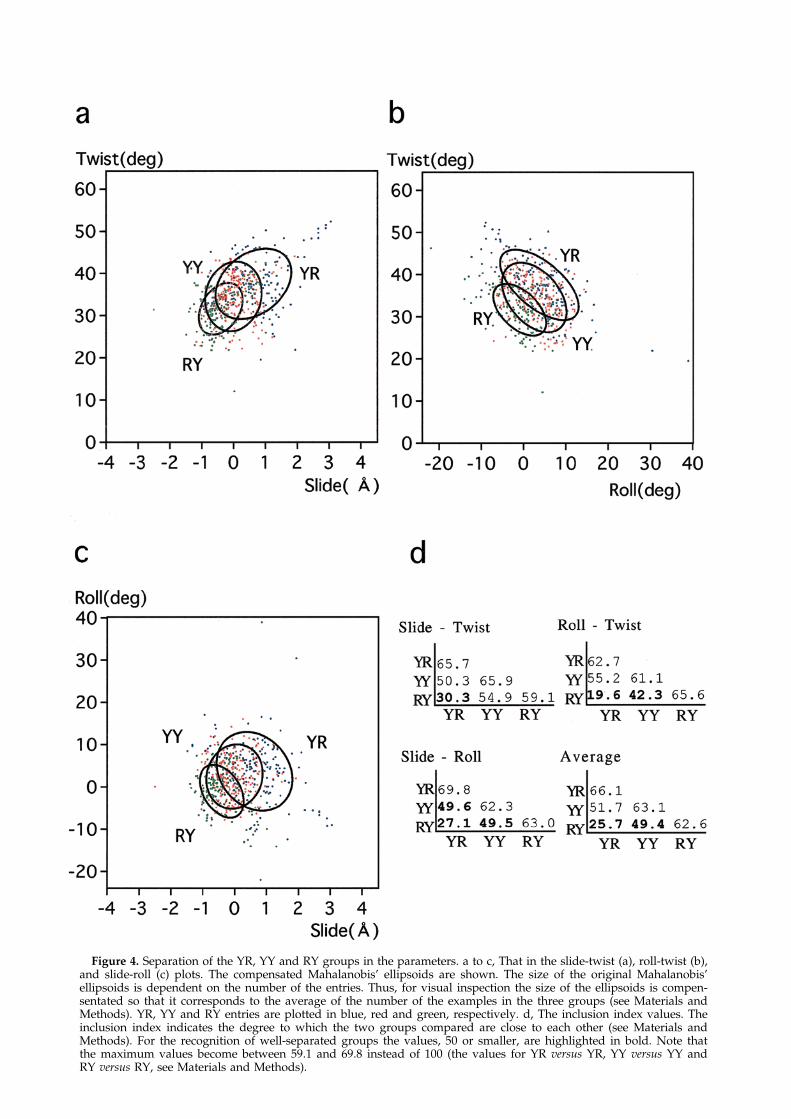
Figure 4. Separation of the YR, YY and RY groups in the parameters. a to c, That in the slide-twist (a), roll-twist (b),and slide-roll (c) plots. The compensated Mahalanobis' ellipsoids are shown. The size of the original Mahalanobis'ellipsoids is dependent on the number of the entries. Thus, for visual inspection the size of the ellipsoids is compen-sentated so that it corresponds to the average of the number of the examples in the three groups (see Materials andMethods). YR, YY and RY entries are plotted in blue, red and green, respectively. d, The inclusion index values. Theinclusion index indicates the degree to which the two groups compared are close to each other (see Materials andMethods). For the recognition of well-separated groups the values, 50 or smaller, are highlighted in bold. Note thatthe maximum values become between 59.1 and 69.8 instead of 100 (the values for YR versus YR, YY versus YY andRY versus RY, see Materials and Methods).
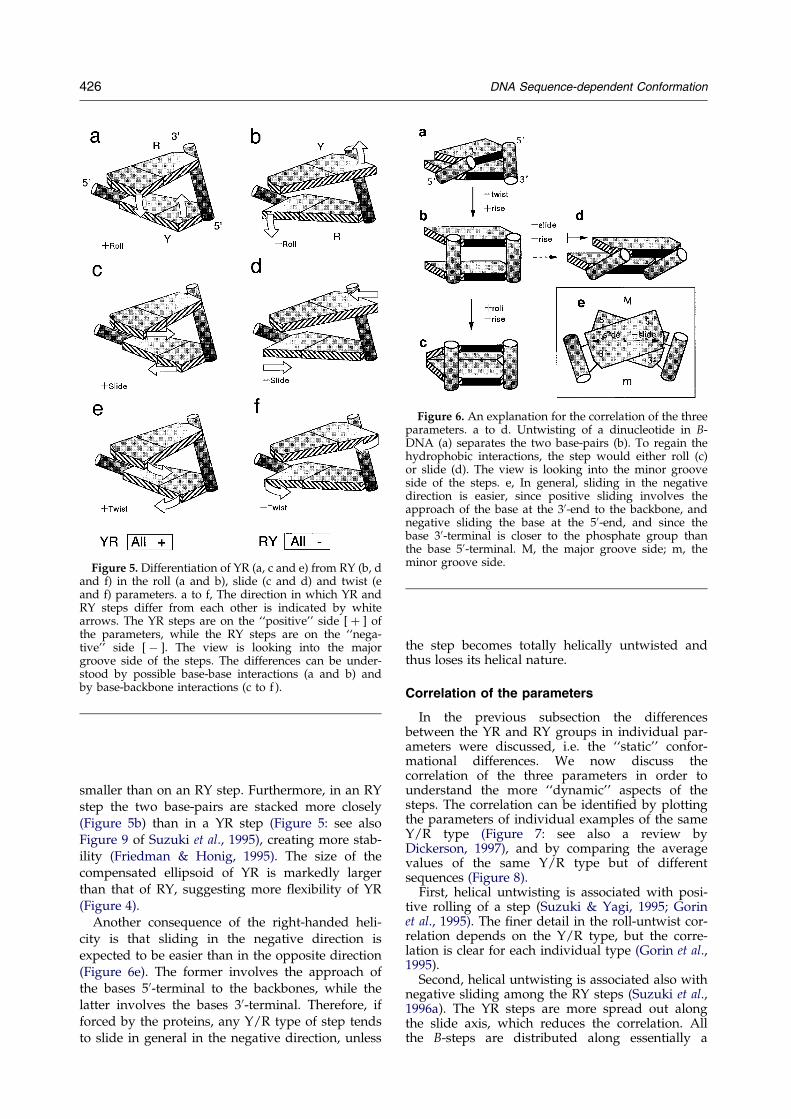
Figure 5. Differentiation of YR (a, c and e) from RY (b, dand f) in the roll (a and b), slide (c and d) and twist (eand f) parameters. a to f, The direction in which YR andRY steps differ from each other is indicated by whitearrows. The YR steps are on the ``positive'' side [ � ] ofthe parameters, while the RY steps are on the ``nega-tive'' side [ ÿ ]. The view is looking into the majorgroove side of the steps. The differences can be under-stood by possible base-base interactions (a and b) andby base-backbone interactions (c to f ).
Figure 6. An explanation for the correlation of the threeparameters. a to d. Untwisting of a dinucleotide in B-DNA (a) separates the two base-pairs (b). To regain thehydrophobic interactions, the step would either roll (c)or slide (d). The view is looking into the minor grooveside of the steps. e, In general, sliding in the negativedirection is easier, since positive sliding involves theapproach of the base at the 30-end to the backbone, andnegative sliding the base at the 50-end, and since thebase 30-terminal is closer to the phosphate group thanthe base 50-terminal. M, the major groove side; m, theminor groove side.
426 DNA Sequence-dependent Conformation
smaller than on an RY step. Furthermore, in an RYstep the two base-pairs are stacked more closely(Figure 5b) than in a YR step (Figure 5: see alsoFigure 9 of Suzuki et al., 1995), creating more stab-ility (Friedman & Honig, 1995). The size of thecompensated ellipsoid of YR is markedly largerthan that of RY, suggesting more ¯exibility of YR(Figure 4).
Another consequence of the right-handed heli-city is that sliding in the negative direction isexpected to be easier than in the opposite direction(Figure 6e). The former involves the approach ofthe bases 50-terminal to the backbones, while thelatter involves the bases 30-terminal. Therefore, ifforced by the proteins, any Y/R type of step tendsto slide in general in the negative direction, unless
the step becomes totally helically untwisted andthus loses its helical nature.
Correlation of the parameters
In the previous subsection the differencesbetween the YR and RY groups in individual par-ameters were discussed, i.e. the ``static'' confor-mational differences. We now discuss thecorrelation of the three parameters in order tounderstand the more ``dynamic'' aspects of thesteps. The correlation can be identi®ed by plottingthe parameters of individual examples of the sameY/R type (Figure 7: see also a review byDickerson, 1997), and by comparing the averagevalues of the same Y/R type but of differentsequences (Figure 8).
First, helical untwisting is associated with posi-tive rolling of a step (Suzuki & Yagi, 1995; Gorinet al., 1995). The ®ner detail in the roll-untwist cor-relation depends on the Y/R type, but the corre-lation is clear for each individual type (Gorin et al.,1995).
Second, helical untwisting is associated also withnegative sliding among the RY steps (Suzuki et al.,1996a). The YR steps are more spread out alongthe slide axis, which reduces the correlation. Allthe B-steps are distributed along essentially a
DNA Sequence-dependent Conformation 427
single correlation curve, although the three Y/Rtypes are distributed in different places along it.
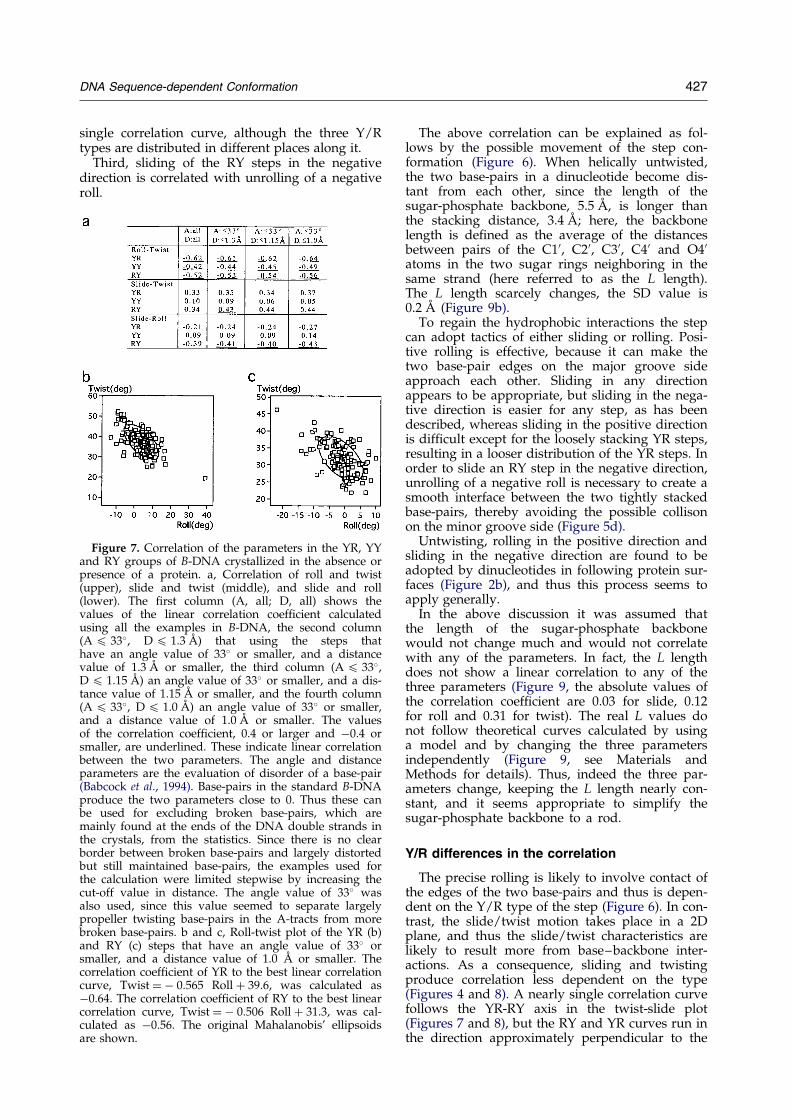
Third, sliding of the RY steps in the negativedirection is correlated with unrolling of a negativeroll.
Figure 7. Correlation of the parameters in the YR, YYand RY groups of B-DNA crystallized in the absence orpresence of a protein. a, Correlation of roll and twist(upper), slide and twist (middle), and slide and roll(lower). The ®rst column (A, all; D, all) shows thevalues of the linear correlation coef®cient calculatedusing all the examples in B-DNA, the second column(A 4 33�, D 4 1.3 AÊ ) that using the steps thathave an angle value of 33� or smaller, and a distancevalue of 1.3 AÊ or smaller, the third column (A 4 33�,D 4 1.15 AÊ ) an angle value of 33� or smaller, and a dis-tance value of 1.15 AÊ or smaller, and the fourth column(A 4 33�, D 4 1.0 AÊ ) an angle value of 33� or smaller,and a distance value of 1.0 AÊ or smaller. The valuesof the correlation coef®cient, 0.4 or larger and ÿ0.4 orsmaller, are underlined. These indicate linear correlationbetween the two parameters. The angle and distanceparameters are the evaluation of disorder of a base-pair(Babcock et al., 1994). Base-pairs in the standard B-DNAproduce the two parameters close to 0. Thus these canbe used for excluding broken base-pairs, which aremainly found at the ends of the DNA double strands inthe crystals, from the statistics. Since there is no clearborder between broken base-pairs and largely distortedbut still maintained base-pairs, the examples used forthe calculation were limited stepwise by increasing thecut-off value in distance. The angle value of 33� wasalso used, since this value seemed to separate largelypropeller twisting base-pairs in the A-tracts from morebroken base-pairs. b and c, Roll-twist plot of the YR (b)and RY (c) steps that have an angle value of 33� orsmaller, and a distance value of 1.0 AÊ or smaller. Thecorrelation coef®cient of YR to the best linear correlationcurve, Twist � ÿ 0.565 Roll � 39.6, was calculated asÿ0.64. The correlation coef®cient of RY to the best linearcorrelation curve, Twist � ÿ 0.506 Roll � 31.3, was cal-culated as ÿ0.56. The original Mahalanobis' ellipsoidsare shown.
The above correlation can be explained as fol-lows by the possible movement of the step con-formation (Figure 6). When helically untwisted,the two base-pairs in a dinucleotide become dis-tant from each other, since the length of thesugar-phosphate backbone, 5.5 AÊ , is longer thanthe stacking distance, 3.4 AÊ ; here, the backbonelength is de®ned as the average of the distancesbetween pairs of the C10, C20, C30, C40 and O40atoms in the two sugar rings neighboring in thesame strand (here referred to as the L length).The L length scarcely changes, the SD value is0.2 AÊ (Figure 9b).
To regain the hydrophobic interactions the stepcan adopt tactics of either sliding or rolling. Posi-tive rolling is effective, because it can make thetwo base-pair edges on the major groove sideapproach each other. Sliding in any directionappears to be appropriate, but sliding in the nega-tive direction is easier for any step, as has beendescribed, whereas sliding in the positive directionis dif®cult except for the loosely stacking YR steps,resulting in a looser distribution of the YR steps. Inorder to slide an RY step in the negative direction,unrolling of a negative roll is necessary to create asmooth interface between the two tightly stackedbase-pairs, thereby avoiding the possible collisonon the minor groove side (Figure 5d).
Untwisting, rolling in the positive direction andsliding in the negative direction are found to beadopted by dinucleotides in following protein sur-faces (Figure 2b), and thus this process seems toapply generally.
In the above discussion it was assumed thatthe length of the sugar-phosphate backbonewould not change much and would not correlatewith any of the parameters. In fact, the L lengthdoes not show a linear correlation to any of thethree parameters (Figure 9, the absolute values ofthe correlation coef®cient are 0.03 for slide, 0.12for roll and 0.31 for twist). The real L values donot follow theoretical curves calculated by usinga model and by changing the three parametersindependently (Figure 9, see Materials andMethods for details). Thus, indeed the three par-ameters change, keeping the L length nearly con-stant, and it seems appropriate to simplify thesugar-phosphate backbone to a rod.
Y/R differences in the correlation
The precise rolling is likely to involve contact ofthe edges of the two base-pairs and thus is depen-dent on the Y/R type of the step (Figure 6). In con-trast, the slide/twist motion takes place in a 2Dplane, and thus the slide/twist characteristics arelikely to result more from base±backbone inter-actions. As a consequence, sliding and twistingproduce correlation less dependent on the type(Figures 4 and 8). A nearly single correlation curvefollows the YR-RY axis in the twist-slide plot(Figures 7 and 8), but the RY and YR curves run inthe direction approximately perpendicular to the
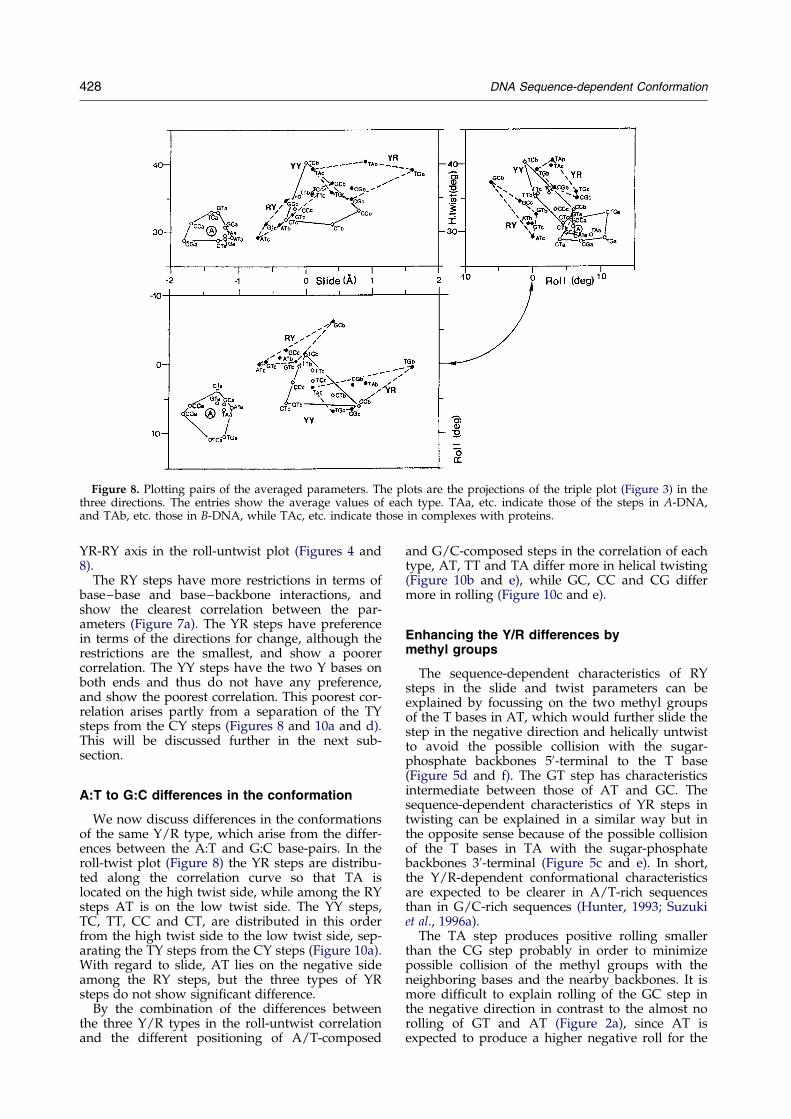
Figure 8. Plotting pairs of the averaged parameters. The plots are the projections of the triple plot (Figure 3) in thethree directions. The entries show the average values of each type. TAa, etc. indicate those of the steps in A-DNA,and TAb, etc. those in B-DNA, while TAc, etc. indicate those in complexes with proteins.
428 DNA Sequence-dependent Conformation
YR-RY axis in the roll-untwist plot (Figures 4 and8).
The RY steps have more restrictions in terms ofbase±base and base±backbone interactions, andshow the clearest correlation between the par-ameters (Figure 7a). The YR steps have preferencein terms of the directions for change, although therestrictions are the smallest, and show a poorercorrelation. The YY steps have the two Y bases onboth ends and thus do not have any preference,and show the poorest correlation. This poorest cor-relation arises partly from a separation of the TYsteps from the CY steps (Figures 8 and 10a and d).This will be discussed further in the next sub-section.
A:T to G:C differences in the conformation
We now discuss differences in the conformationsof the same Y/R type, which arise from the differ-ences between the A:T and G:C base-pairs. In theroll-twist plot (Figure 8) the YR steps are distribu-ted along the correlation curve so that TA islocated on the high twist side, while among the RYsteps AT is on the low twist side. The YY steps,TC, TT, CC and CT, are distributed in this orderfrom the high twist side to the low twist side, sep-arating the TY steps from the CY steps (Figure 10a).With regard to slide, AT lies on the negative sideamong the RY steps, but the three types of YRsteps do not show signi®cant difference.
By the combination of the differences betweenthe three Y/R types in the roll-untwist correlationand the different positioning of A/T-composed
and G/C-composed steps in the correlation of eachtype, AT, TT and TA differ more in helical twisting(Figure 10b and e), while GC, CC and CG differmore in rolling (Figure 10c and e).
Enhancing the Y/R differences bymethyl groups
The sequence-dependent characteristics of RYsteps in the slide and twist parameters can beexplained by focussing on the two methyl groupsof the T bases in AT, which would further slide thestep in the negative direction and helically untwistto avoid the possible collision with the sugar-phosphate backbones 50-terminal to the T base(Figure 5d and f). The GT step has characteristicsintermediate between those of AT and GC. Thesequence-dependent characteristics of YR steps intwisting can be explained in a similar way but inthe opposite sense because of the possible collisionof the T bases in TA with the sugar-phosphatebackbones 30-terminal (Figure 5c and e). In short,the Y/R-dependent conformational characteristicsare expected to be clearer in A/T-rich sequencesthan in G/C-rich sequences (Hunter, 1993; Suzukiet al., 1996a).
The TA step produces positive rolling smallerthan the CG step probably in order to minimizepossible collision of the methyl groups with theneighboring bases and the nearby backbones. It ismore dif®cult to explain rolling of the GC step inthe negative direction in contrast to the almost norolling of GT and AT (Figure 2a), since AT isexpected to produce a higher negative roll for the
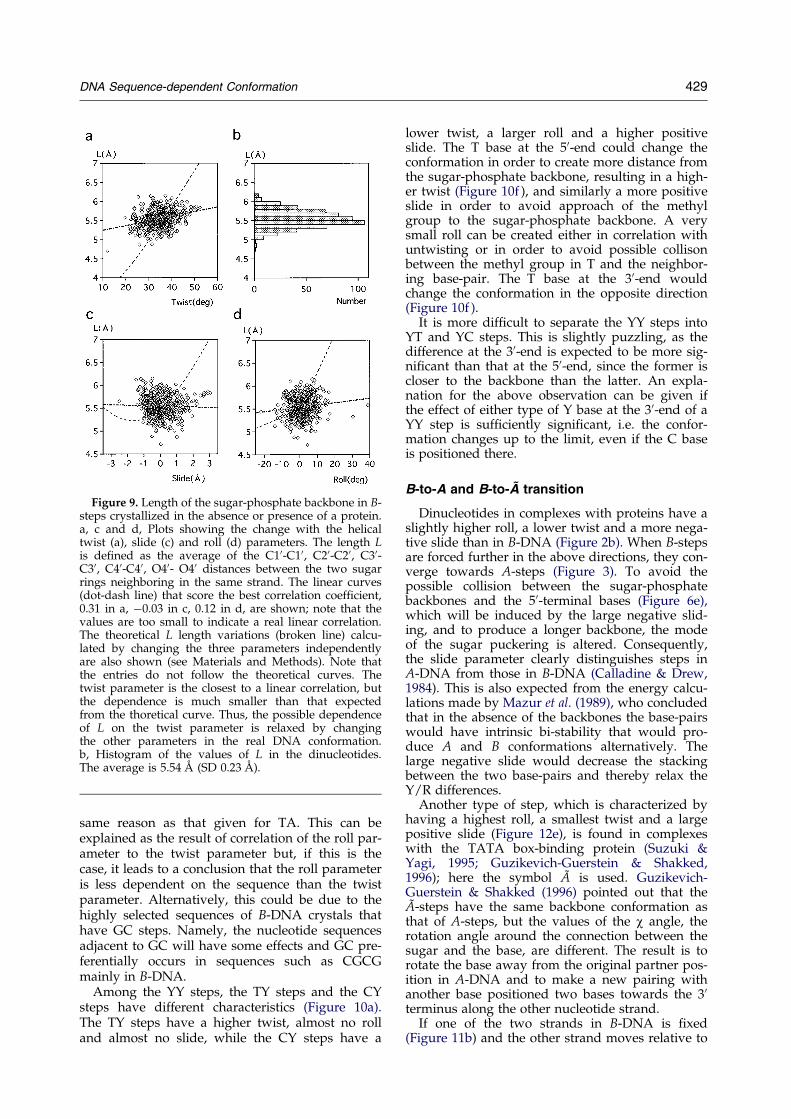
Figure 9. Length of the sugar-phosphate backbone in B-steps crystallized in the absence or presence of a protein.a, c and d, Plots showing the change with the helicaltwist (a), slide (c) and roll (d) parameters. The length Lis de®ned as the average of the C10-C10, C20-C20, C30-C30, C40-C40, O40- O40 distances between the two sugarrings neighboring in the same strand. The linear curves(dot-dash line) that score the best correlation coef®cient,0.31 in a, ÿ0.03 in c, 0.12 in d, are shown; note that thevalues are too small to indicate a real linear correlation.The theoretical L length variations (broken line) calcu-lated by changing the three parameters independentlyare also shown (see Materials and Methods). Note thatthe entries do not follow the theoretical curves. Thetwist parameter is the closest to a linear correlation, butthe dependence is much smaller than that expectedfrom the thoretical curve. Thus, the possible dependenceof L on the twist parameter is relaxed by changingthe other parameters in the real DNA conformation.b, Histogram of the values of L in the dinucleotides.The average is 5.54 AÊ (SD 0.23 AÊ ).
DNA Sequence-dependent Conformation 429
same reason as that given for TA. This can beexplained as the result of correlation of the roll par-ameter to the twist parameter but, if this is thecase, it leads to a conclusion that the roll parameteris less dependent on the sequence than the twistparameter. Alternatively, this could be due to thehighly selected sequences of B-DNA crystals thathave GC steps. Namely, the nucleotide sequencesadjacent to GC will have some effects and GC pre-ferentially occurs in sequences such as CGCGmainly in B-DNA.
Among the YY steps, the TY steps and the CYsteps have different characteristics (Figure 10a).The TY steps have a higher twist, almost no rolland almost no slide, while the CY steps have a
lower twist, a larger roll and a higher positiveslide. The T base at the 50-end could change theconformation in order to create more distance fromthe sugar-phosphate backbone, resulting in a high-er twist (Figure 10f ), and similarly a more positiveslide in order to avoid approach of the methylgroup to the sugar-phosphate backbone. A verysmall roll can be created either in correlation withuntwisting or in order to avoid possible collisonbetween the methyl group in T and the neighbor-ing base-pair. The T base at the 30-end wouldchange the conformation in the opposite direction(Figure 10f ).
It is more dif®cult to separate the YY steps intoYT and YC steps. This is slightly puzzling, as thedifference at the 30-end is expected to be more sig-ni®cant than that at the 50-end, since the former iscloser to the backbone than the latter. An expla-nation for the above observation can be given ifthe effect of either type of Y base at the 30-end of aYY step is suf®ciently signi®cant, i.e. the confor-mation changes up to the limit, even if the C baseis positioned there.
B-to-A and B-to-AÄ transition
Dinucleotides in complexes with proteins have aslightly higher roll, a lower twist and a more nega-tive slide than in B-DNA (Figure 2b). When B-stepsare forced further in the above directions, they con-verge towards A-steps (Figure 3). To avoid thepossible collision between the sugar-phosphatebackbones and the 50-terminal bases (Figure 6e),which will be induced by the large negative slid-ing, and to produce a longer backbone, the modeof the sugar puckering is altered. Consequently,the slide parameter clearly distinguishes steps inA-DNA from those in B-DNA (Calladine & Drew,1984). This is also expected from the energy calcu-lations made by Mazur et al. (1989), who concludedthat in the absence of the backbones the base-pairswould have intrinsic bi-stability that would pro-duce A and B conformations alternatively. Thelarge negative slide would decrease the stackingbetween the two base-pairs and thereby relax theY/R differences.
Another type of step, which is characterized byhaving a highest roll, a smallest twist and a largepositive slide (Figure 12e), is found in complexeswith the TATA box-binding protein (Suzuki &Yagi, 1995; Guzikevich-Guerstein & Shakked,1996); here the symbol AÄ is used. Guzikevich-Guerstein & Shakked (1996) pointed out that theAÄ -steps have the same backbone conformation asthat of A-steps, but the values of the w angle, therotation angle around the connection between thesugar and the base, are different. The result is torotate the base away from the original partner pos-ition in A-DNA and to make a new pairing withanother base positioned two bases towards the 30terminus along the other nucleotide strand.
If one of the two strands in B-DNA is ®xed(Figure 11b) and the other strand moves relative to
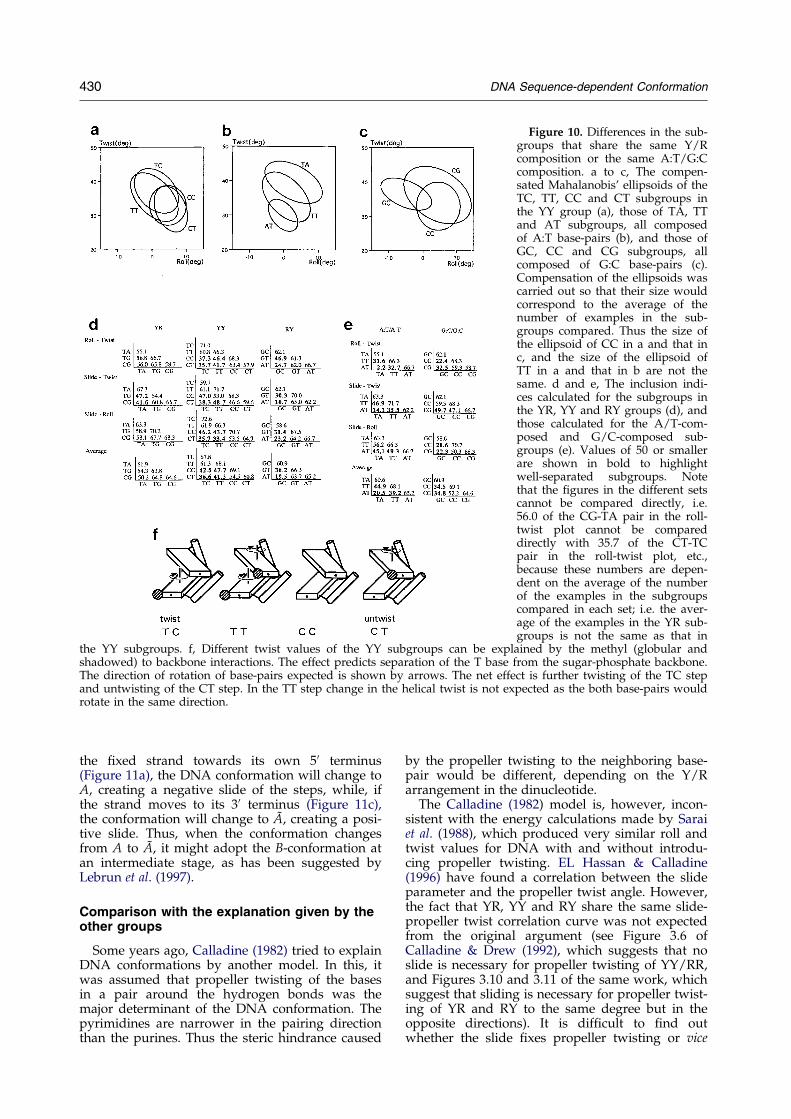
Figure 10. Differences in the sub-groups that share the same Y/Rcomposition or the same A:T/G:Ccomposition. a to c, The compen-sated Mahalanobis' ellipsoids of theTC, TT, CC and CT subgroups inthe YY group (a), those of TA, TTand AT subgroups, all composedof A:T base-pairs (b), and those ofGC, CC and CG subgroups, allcomposed of G:C base-pairs (c).Compensation of the ellipsoids wascarried out so that their size wouldcorrespond to the average of thenumber of examples in the sub-groups compared. Thus the size ofthe ellipsoid of CC in a and that inc, and the size of the ellipsoid ofTT in a and that in b are not thesame. d and e, The inclusion indi-ces calculated for the subgroups inthe YR, YY and RY groups (d), andthose calculated for the A/T-com-posed and G/C-composed sub-groups (e). Values of 50 or smallerare shown in bold to highlightwell-separated subgroups. Notethat the ®gures in the different setscannot be compared directly, i.e.56.0 of the CG-TA pair in the roll-twist plot cannot be compareddirectly with 35.7 of the CT-TCpair in the roll-twist plot, etc.,because these numbers are depen-dent on the average of the numberof the examples in the subgroupscompared in each set; i.e. the aver-age of the examples in the YR sub-groups is not the same as that in
the YY subgroups. f, Different twist values of the YY subgroups can be explained by the methyl (globular andshadowed) to backbone interactions. The effect predicts separation of the T base from the sugar-phosphate backbone.The direction of rotation of base-pairs expected is shown by arrows. The net effect is further twisting of the TC stepand untwisting of the CT step. In the TT step change in the helical twist is not expected as the both base-pairs wouldrotate in the same direction.
430 DNA Sequence-dependent Conformation
the ®xed strand towards its own 50 terminus(Figure 11a), the DNA conformation will change toA, creating a negative slide of the steps, while, ifthe strand moves to its 30 terminus (Figure 11c),the conformation will change to AÄ , creating a posi-tive slide. Thus, when the conformation changesfrom A to AÄ , it might adopt the B-conformation atan intermediate stage, as has been suggested byLebrun et al. (1997).
Comparison with the explanation given by theother groups
Some years ago, Calladine (1982) tried to explainDNA conformations by another model. In this, itwas assumed that propeller twisting of the basesin a pair around the hydrogen bonds was themajor determinant of the DNA conformation. Thepyrimidines are narrower in the pairing directionthan the purines. Thus the steric hindrance caused
by the propeller twisting to the neighboring base-pair would be different, depending on the Y/Rarrangement in the dinucleotide.
The Calladine (1982) model is, however, incon-sistent with the energy calculations made by Saraiet al. (1988), which produced very similar roll andtwist values for DNA with and without introdu-cing propeller twisting. EL Hassan & Calladine(1996) have found a correlation between the slideparameter and the propeller twist angle. However,the fact that YR, YY and RY share the same slide-propeller twist correlation curve was not expectedfrom the original argument (see Figure 3.6 ofCalladine & Drew (1992), which suggests that noslide is necessary for propeller twisting of YY/RR,and Figures 3.10 and 3.11 of the same work, whichsuggest that sliding is necessary for propeller twist-ing of YR and RY to the same degree but in theopposite directions). It is dif®cult to ®nd outwhether the slide ®xes propeller twisting or vice
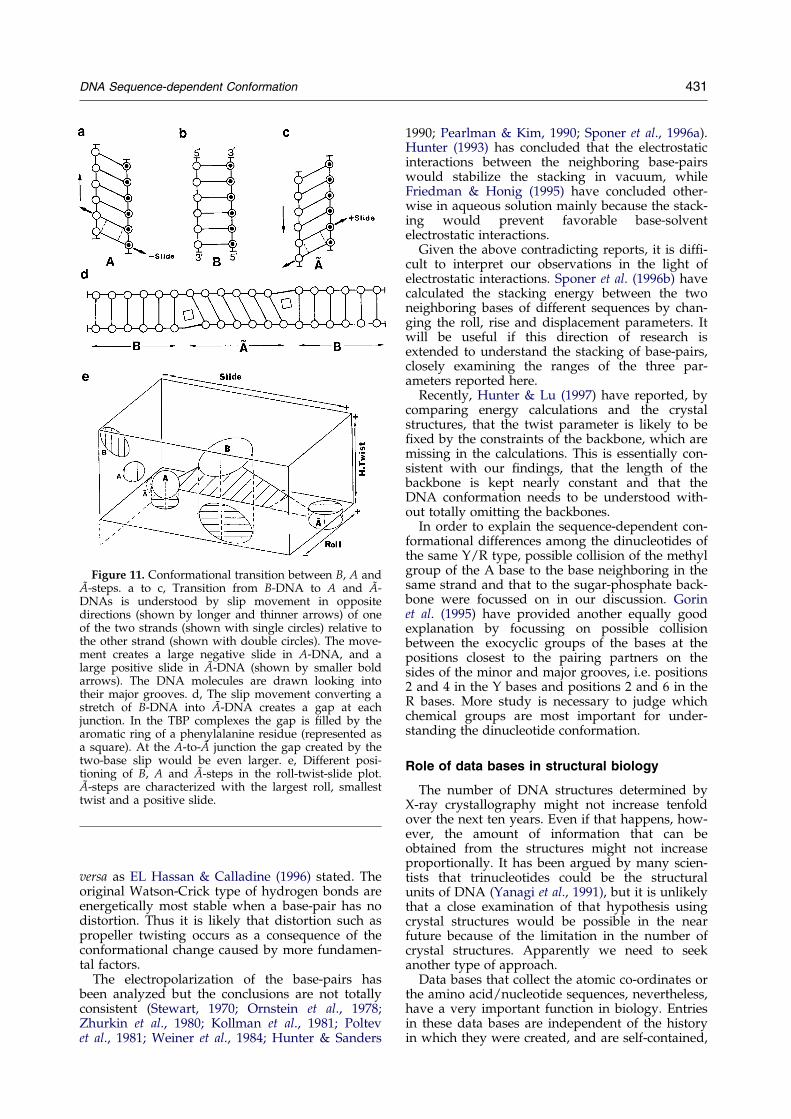
Figure 11. Conformational transition between B, A andAÄ -steps. a to c, Transition from B-DNA to A and AÄ -DNAs is understood by slip movement in oppositedirections (shown by longer and thinner arrows) of oneof the two strands (shown with single circles) relative tothe other strand (shown with double circles). The move-ment creates a large negative slide in A-DNA, and alarge positive slide in AÄ -DNA (shown by smaller boldarrows). The DNA molecules are drawn looking intotheir major grooves. d, The slip movement converting astretch of B-DNA into AÄ -DNA creates a gap at eachjunction. In the TBP complexes the gap is ®lled by thearomatic ring of a phenylalanine residue (represented asa square). At the A-to-AÄ junction the gap created by thetwo-base slip would be even larger. e, Different posi-tioning of B, A and AÄ -steps in the roll-twist-slide plot.AÄ -steps are characterized with the largest roll, smallesttwist and a positive slide.
DNA Sequence-dependent Conformation 431
versa as EL Hassan & Calladine (1996) stated. Theoriginal Watson-Crick type of hydrogen bonds areenergetically most stable when a base-pair has nodistortion. Thus it is likely that distortion such aspropeller twisting occurs as a consequence of theconformational change caused by more fundamen-tal factors.
The electropolarization of the base-pairs hasbeen analyzed but the conclusions are not totallyconsistent (Stewart, 1970; Ornstein et al., 1978;Zhurkin et al., 1980; Kollman et al., 1981; Poltevet al., 1981; Weiner et al., 1984; Hunter & Sanders
1990; Pearlman & Kim, 1990; Sponer et al., 1996a).Hunter (1993) has concluded that the electrostaticinteractions between the neighboring base-pairswould stabilize the stacking in vacuum, whileFriedman & Honig (1995) have concluded other-wise in aqueous solution mainly because the stack-ing would prevent favorable base-solventelectrostatic interactions.
Given the above contradicting reports, it is dif®-cult to interpret our observations in the light ofelectrostatic interactions. Sponer et al. (1996b) havecalculated the stacking energy between the twoneighboring bases of different sequences by chan-ging the roll, rise and displacement parameters. Itwill be useful if this direction of research isextended to understand the stacking of base-pairs,closely examining the ranges of the three par-ameters reported here.
Recently, Hunter & Lu (1997) have reported, bycomparing energy calculations and the crystalstructures, that the twist parameter is likely to be®xed by the constraints of the backbone, which aremissing in the calculations. This is essentially con-sistent with our ®ndings, that the length of thebackbone is kept nearly constant and that theDNA conformation needs to be understood with-out totally omitting the backbones.
In order to explain the sequence-dependent con-formational differences among the dinucleotides ofthe same Y/R type, possible collision of the methylgroup of the A base to the base neighboring in thesame strand and that to the sugar-phosphate back-bone were focussed on in our discussion. Gorinet al. (1995) have provided another equally goodexplanation by focussing on possible collisionbetween the exocyclic groups of the bases at thepositions closest to the pairing partners on thesides of the minor and major grooves, i.e. positions2 and 4 in the Y bases and positions 2 and 6 in theR bases. More study is necessary to judge whichchemical groups are most important for under-standing the dinucleotide conformation.
Role of data bases in structural biology
The number of DNA structures determined byX-ray crystallography might not increase tenfoldover the next ten years. Even if that happens, how-ever, the amount of information that can beobtained from the structures might not increaseproportionally. It has been argued by many scien-tists that trinucleotides could be the structuralunits of DNA (Yanagi et al., 1991), but it is unlikelythat a close examination of that hypothesis usingcrystal structures would be possible in the nearfuture because of the limitation in the number ofcrystal structures. Apparently we need to seekanother type of approach.
Data bases that collect the atomic co-ordinates orthe amino acid/nucleotide sequences, nevertheless,have a very important function in biology. Entriesin these data bases are independent of the historyin which they were created, and are self-contained,
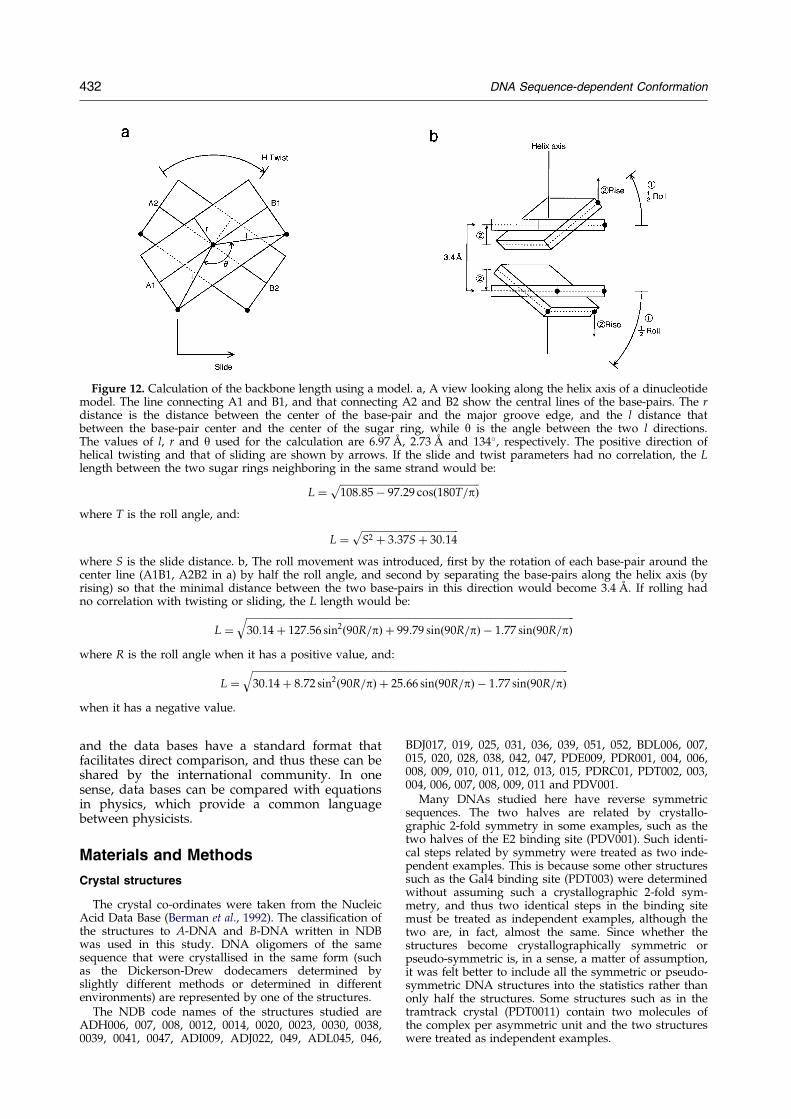
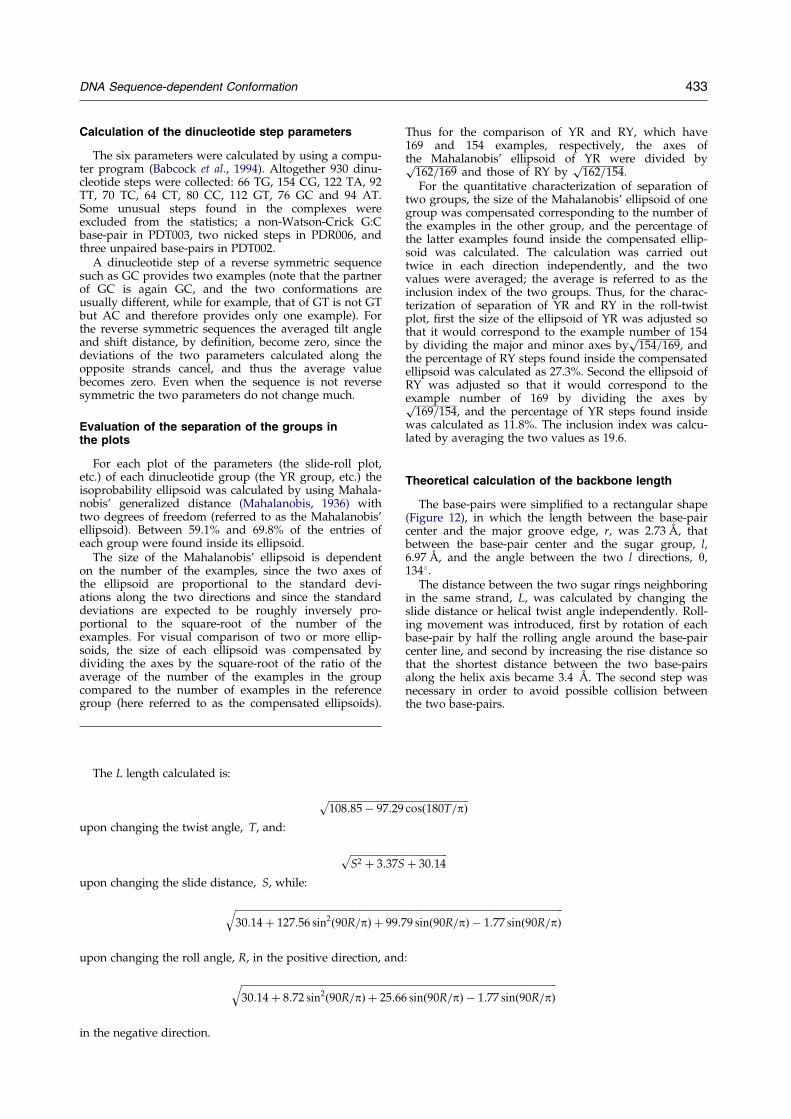
Figure 12. Calculation of the backbone length using a model. a, A view looking along the helix axis of a dinucleotidemodel. The line connecting A1 and B1, and that connecting A2 and B2 show the central lines of the base-pairs. The rdistance is the distance between the center of the base-pair and the major groove edge, and the l distance thatbetween the base-pair center and the center of the sugar ring, while y is the angle between the two l directions.The values of l, r and y used for the calculation are 6.97 AÊ , 2.73 AÊ and 134�, respectively. The positive direction ofhelical twisting and that of sliding are shown by arrows. If the slide and twist parameters had no correlation, the Llength between the two sugar rings neighboring in the same strand would be:
L ���������������������������������������������������������108:85ÿ 97:29 cos�180T=p�
pwhere T is the roll angle, and:
L ����������������������������������������S2 � 3:37S� 30:14
pwhere S is the slide distance. b, The roll movement was introduced, ®rst by the rotation of each base-pair around thecenter line (A1B1, A2B2 in a) by half the roll angle, and second by separating the base-pairs along the helix axis (byrising) so that the minimal distance between the two base-pairs in this direction would become 3.4 AÊ . If rolling hadno correlation with twisting or sliding, the L length would be:
L �������������������������������������������������������������������������������������������������������������������������������������30:14� 127:56 sin2�90R=p� � 99:79 sin�90R=p� ÿ 1:77 sin�90R=p�
qwhere R is the roll angle when it has a positive value, and:
L ��������������������������������������������������������������������������������������������������������������������������������30:14� 8:72 sin2�90R=p� � 25:66 sin�90R=p� ÿ 1:77 sin�90R=p�
qwhen it has a negative value.
432 DNA Sequence-dependent Conformation
and the data bases have a standard format thatfacilitates direct comparison, and thus these can beshared by the international community. In onesense, data bases can be compared with equationsin physics, which provide a common languagebetween physicists.
Materials and Methods
Crystal structures
The crystal co-ordinates were taken from the NucleicAcid Data Base (Berman et al., 1992). The classi®cation ofthe structures to A-DNA and B-DNA written in NDBwas used in this study. DNA oligomers of the samesequence that were crystallised in the same form (suchas the Dickerson-Drew dodecamers determined byslightly different methods or determined in differentenvironments) are represented by one of the structures.
The NDB code names of the structures studied areADH006, 007, 008, 0012, 0014, 0020, 0023, 0030, 0038,0039, 0041, 0047, ADI009, ADJ022, 049, ADL045, 046,
BDJ017, 019, 025, 031, 036, 039, 051, 052, BDL006, 007,015, 020, 028, 038, 042, 047, PDE009, PDR001, 004, 006,008, 009, 010, 011, 012, 013, 015, PDRC01, PDT002, 003,004, 006, 007, 008, 009, 011 and PDV001.
Many DNAs studied here have reverse symmetricsequences. The two halves are related by crystallo-graphic 2-fold symmetry in some examples, such as thetwo halves of the E2 binding site (PDV001). Such identi-cal steps related by symmetry were treated as two inde-pendent examples. This is because some other structuressuch as the Gal4 binding site (PDT003) were determinedwithout assuming such a crystallographic 2-fold sym-metry, and thus two identical steps in the binding sitemust be treated as independent examples, although thetwo are, in fact, almost the same. Since whether thestructures become crystallographically symmetric orpseudo-symmetric is, in a sense, a matter of assumption,it was felt better to include all the symmetric or pseudo-symmetric DNA structures into the statistics rather thanonly half the structures. Some structures such as in thetramtrack crystal (PDT0011) contain two molecules ofthe complex per asymmetric unit and the two structureswere treated as independent examples.
DNA Sequence-dependent Conformation 433
Calculation of the dinucleotide step parameters
The six parameters were calculated by using a compu-ter program (Babcock et al., 1994). Altogether 930 dinu-cleotide steps were collected: 66 TG, 154 CG, 122 TA, 92TT, 70 TC, 64 CT, 80 CC, 112 GT, 76 GC and 94 AT.Some unusual steps found in the complexes wereexcluded from the statistics; a non-Watson-Crick G:Cbase-pair in PDT003, two nicked steps in PDR006, andthree unpaired base-pairs in PDT002.
A dinucleotide step of a reverse symmetric sequencesuch as GC provides two examples (note that the partnerof GC is again GC, and the two conformations areusually different, while for example, that of GT is not GTbut AC and therefore provides only one example). Forthe reverse symmetric sequences the averaged tilt angleand shift distance, by de®nition, become zero, since thedeviations of the two parameters calculated along theopposite strands cancel, and thus the average valuebecomes zero. Even when the sequence is not reversesymmetric the two parameters do not change much.
Evaluation of the separation of the groups inthe plots
For each plot of the parameters (the slide-roll plot,etc.) of each dinucleotide group (the YR group, etc.) theisoprobability ellipsoid was calculated by using Mahala-nobis' generalized distance (Mahalanobis, 1936) withtwo degrees of freedom (referred to as the Mahalanobis'ellipsoid). Between 59.1% and 69.8% of the entries ofeach group were found inside its ellipsoid.
The size of the Mahalanobis' ellipsoid is dependenton the number of the examples, since the two axes ofthe ellipsoid are proportional to the standard devi-ations along the two directions and since the standarddeviations are expected to be roughly inversely pro-portional to the square-root of the number of theexamples. For visual comparison of two or more ellip-soids, the size of each ellipsoid was compensated bydividing the axes by the square-root of the ratio of theaverage of the number of the examples in the groupcompared to the number of examples in the referencegroup (here referred to as the compensated ellipsoids).
The L length calculated is:
����������������������������108:85ÿ 97:2
pupon changing the twist angle, T, and:
�������������������S2 � 3:37
pupon changing the slide distance, S, while:
�����������������������������������������������������������������30:14� 127:56 sin2�90R=p� � 99
qupon changing the roll angle, R, in the positive direction, an
���������������������������������������������������������������30:14� 8:72 sin2�90R=p� � 25:6
qin the negative direction.
Thus for the comparison of YR and RY, which have169 and 154 examples, respectively, the axes ofthe Mahalanobis' ellipsoid of YR were divided by�����������������
162=169p
and those of RY by�����������������162=154p
.For the quantitative characterization of separation of
two groups, the size of the Mahalanobis' ellipsoid of onegroup was compensated corresponding to the number ofthe examples in the other group, and the percentage ofthe latter examples found inside the compensated ellip-soid was calculated. The calculation was carried outtwice in each direction independently, and the twovalues were averaged; the average is referred to as theinclusion index of the two groups. Thus, for the charac-terization of separation of YR and RY in the roll-twistplot, ®rst the size of the ellipsoid of YR was adjusted sothat it would correspond to the example number of 154by dividing the major and minor axes by
�����������������154=169p
, andthe percentage of RY steps found inside the compensatedellipsoid was calculated as 27.3%. Second the ellipsoid ofRY was adjusted so that it would correspond to theexample number of 169 by dividing the axes by�����������������
169=154p
, and the percentage of YR steps found insidewas calculated as 11.8%. The inclusion index was calcu-lated by averaging the two values as 19.6.
Theoretical calculation of the backbone length
The base-pairs were simpli®ed to a rectangular shape(Figure 12), in which the length between the base-paircenter and the major groove edge, r, was 2.73 AÊ , thatbetween the base-pair center and the sugar group, l,6.97 AÊ , and the angle between the two l directions, y,134�.
The distance between the two sugar rings neighboringin the same strand, L, was calculated by changing theslide distance or helical twist angle independently. Roll-ing movement was introduced, ®rst by rotation of eachbase-pair by half the rolling angle around the base-paircenter line, and second by increasing the rise distance sothat the shortest distance between the two base-pairsalong the helix axis became 3.4 AÊ . The second step wasnecessary in order to avoid possible collision betweenthe two base-pairs.
����������������������������9 cos�180T=p�
��������������������S� 30:14
�������������������������������������������������������������������:79 sin�90R=p� ÿ 1:77 sin�90R=p�
d:
����������������������������������������������������������������6 sin�90R=p� ÿ 1:77 sin�90R=p�
434 DNA Sequence-dependent Conformation
Acknowledgements
We thank Dr J. T. Finch for his critical reading ofthe manuscript. This work was supported by the CREST(Core Research for Evolutional Science and Technology)Project of the Japan Science and Technology Corpor-ation.
References
Babcock, M. S., Pednault, E. P. D. & Olson, W. K.(1994). Nucleic acid structure analysis: mathematicsfor local Cartesian and helical structure parametersthat are truly comparable between structures. J. Mol.Biol. 237, 125±156.
Barber, A. M. & Zhurkin, V. B. (1990). CAP bindingsites reveal pyrimidine-purine pattern characteristicof DNA bending. J. Biomol. Struct. Dynam. 8, 213±232.
Berman, H. M., Olson, W. K., Beveridge, D. L.,Westbrook, J., Gelbin, A., Demeny, T., Hsieh, S.-H.,Srinivasan, A. R. & Schneider, B. (1992). The nucleicacid data base: a comprehensive relational database of three-dimensional structures of nucleicacids. Biophys. J. 63, 751±759.
Bhattacharyya, D. & Bansal, M. (1992). Groove widthand depth of B-DNA structures depend on localvariation in slide. J. Biomol. Struct. Dynam. 10, 213±226.
Calladine, C. R. (1982). Mechanics of sequence-depen-dent stacking of bases in B-DNA. J. Mol. Biol. 161,343±352.
Calladine, C. R. & Drew, H. R. (1984). A base-centredexplanation of the B-to-A transition in DNA. J. Mol.Biol. 178, 773±782.
Calladine, C. R. & Drew, H. R. (1992). UnderstandingDNA: The Molecule & How it Works, Academic Press,London.
Claverie, P., Pullman, B. & Caillet, J. (1996). Van derWaals-London interactions between stacked purinesand pyrimidines. J. Theoret. Biol. 12, 419±434.
Dickerson, R. E. (1989). De®nitions and nomenclature ofnucleic acid structure parameters. J. Mol. Biol. 205,787±791.
Dickerson, R. E. (1992). DNA structure from A to Z.Methods Enzymol. 211, 67±111.
Dickerson, R. E. (1997). Helix structure and molecularrecognition by DNA. In Oxford Handbook of NucleicAcid Structure (Neidle, S., ed.), Oxford UniversityPress, in the press.
Dickerson, R. E., Goodsell, D. S. & Neidle, S. (1994).``...the tyranny of the lattice...''. Proc. Natl Acad. Sci.USA, 91, 3579±3583.
EL Hassan, M. A. & Calladine, C. R. (1996). Propeller-twisting of base-pairs and the conformational mobi-lity of dinucleotide steps in DNA. J. Mol. Biol. 259,95±103.
EL Hassan, M. A. & Calladine, C. R. (1997). Confor-mational characteristics of DNA: empirical classi®-cations and a hypothesis for the conformationalbehaviour of dinucleotide steps. Phil. Trans. Roy.Soc. ser. A, 355, 43±100.
Friedman, R. A. & Honig, B. (1995). A free energy anal-ysis of nucleic acid base-stacking in aqueoussolution. Biophys. J. 69, 1528±1535.
Gorin, A. A., Zhurkin, V. B. & Olson, W. K. (1995).B-DNA twisting correlates with base-pairmorphology. J. Mol. Biol. 247, 34±48.
Grzeskowiak, K. (1996). Sequence-dependent structuralvariation in B-DNA. Chem. Biol. 3, 785±790.
Guckian, K. M., Schweitzer, B. A., Ren, R. X.-F., Sheils,L. J., Paris, P. L., Tahmassebi, D. C. & Kool, E. T.(1996). Experimental measurement of aromaticstacking af®nities in the context of duplex DNA.J. Am. Chem. Soc. 118, 8182±8183.
Guzikevich-Guerstein, G. G. & Shakked, Z. (1996). Anovel form of the DNA double helix imposed onthe TATA-box by the TATA-binding protein. NatureStruct. Biol. 3, 32±37.
Hegde, R. S., Grossman, S. R., Laimins, L. A. & Sigler,P. B. (1992). Crystal structure at 1.7 AÊ of the bovinepapilomavirus-1 E2 DNA-binding domains boundto its DNA target. Nature, 359, 505±512.
Heinemann, U., Alings, C. & Bansal, M. (1992). Doublehelix conformation, groove dimensions and ligandbinding potential of a G/C stretch in B-DNA.EMBO. J. 5, 1931±1939.
Hunter, C. A. (1993). Sequence-dependent DNA struc-ture: the role of base stacking interactions. J. Mol.Biol. 230, 1025±1054.
Hunter, C. A. & Lu, X.-J. (1997). DNA base-stackinginteractions: a comparison of theoretical calculationswith oligonucleotide X-ray crystal structures. J. Mol.Biol. 265, 603±619.
Hunter, C. A. & Sanders, J. K. M. (1990). The nature ofp-p interactions. J. Am. Chem. Soc. 112, 5525±5537.
Juo, Z. S., Chiu, T. K., Leiberman, P. M., Baikalor, I.,Berks, A. J. & Dickerson, R. E. (1996). How proteinsrecognize the TATA box. J. Mol. Biol. 261, 239±254.
Kim, J. L., Nikolov, D. B. & Burley, S. K. (1993). Co-crys-tal structure of TBP recognizing the minor grooveof a TATA element. Nature, 365, 520±527.
Kim, Y., Geiger, J. H., Hahn, S. & Sigler, P. (1993). Crys-tal structure of a yeast TBP/TATA-box complex.Nature, 365, 512±520.
Klug, A., Jack, A., Viswamitra, M. A., Kennard, O.,Shakked, Z. & Steitz, T. A. (1979). A hypothesis ona speci®c sequence-dependent conformation ofDNA and its relation to the binding of the lac-repressor protein. J. Mol. Biol. 131, 669±680.
Kollman, P. A., Weiner, P. K. & Dearing, A. (1981). Stu-dies on nucleotide conformations and interactions:the relative stabilities of double-helical B-DNAsequence isomers. Biopolymers, 20, 2583±2621.
Lebrun, A., Shakked, Z. & Lavery, R. (1997). Local DNAstretching mimics the distortion caused by theTATA box-binding protein. Proc. Natl Acad. Sci.USA, 94, 2993±2998.
Mahalanobis, P. C. (1936). On the generalised distancein statistics. Proc. Nat. Inst. Sci. India, 2, 49±55.
Mazur, J., Sarai, A. & Jernigan, R. L. (1989). Sequencedependence of the B-A conformational transition ofDNA. Biopolymers, 28, 1223±1233.
Olson, W. K. (1996). Simulating DNA at low resolution.Struct. Biol. 6, 242±256.
Olson, W. K. & Zhurkin, V. B. (1996). Twenty years ofDNA bending. Biol. Struct. Dynam., 341±370.
Ornstein, R. L., Rein, R., Breen, D. L. & MacElroy, R. D.(1978). An optimised potential function for the cal-culation of nucleic acid interaction energies I : basestacking. Biopolymers, 17, 2341±2360.
Parkinson, G., Wilson, C., Gunasekera, A., Ebright,Y. W., Ebright, R. E. & Berman, H. (1996a). Struc-ture of the CAP-DNA complex at 2.5 AÊ resolution:a complete picture of the protein-DNA interface.J. Mol. Biol. 260, 395±408.
DNA Sequence-dependent Conformation 435
Parkinson, G., Gunasekera, A., Vojtechovsky, J., Zhang,X., Kunkel, T. A., Berman, H. & Ebright, R. H.(1996b). Aromatic hydrogen bond in sequence-speci®c protein-DNA recognition. Nature Struct.Biol. 3, 837±841.
Pearlman, D. A. & Kim, S.-H. (1990). Atomic charges forDNA constituents derived from single-crystal X-raydiffraction data. J. Mol. Biol. 211, 171±187.
Poltev, V. I., Milova, L. A., Zhorov, B. S. & Govyrin,V. A. (1981). Simulation of conformational possibili-ties of DNA via calculation of non-bonded inter-actions of complementary dinucleotide phosphatecomplexes. Biopolymers, 20, 1±15.
Sarai, A., Mazur, J., Nussinov, R. & Jernigan, R. L.(1988). Origin of DNA helical structure and itssequence dependence. Biochemistry, 27, 8498±8502.
Schultz, S. C., Shields, G. C. & Steitz, T. A. (1991). Crys-tal structure of a CAP-DNA complex: the DNA isbent by 90�. Science, 253, 1001±1007.
Sponer, J. & Kypr, J. (1993). Relationships among rise,cup, roll and stagger in DNA suggested by empiri-cal potential studies of base stacking. J. Biomol.Struct. Dynam. 11, 027±041.
Sponer, J., Leszcynski, J. & Hobza, P. (1996a). Hydrogenbonding and stacking of DNA bases: A review ofquantum-chemical ab initio studies. J. Biomol. Struct.Dynam. 14, 117±135.
Sponer, J., Leszczynnski, J. & Hobza, P. (1996b). Natureof nucleic acid-base stacking: nonempirical ab initioand empirical potential characterization of 10stacked base dimers: comparison of stacked andH-bonded base pairs. J. Phys. Chem. 100, 5590±5596.
Stewart, R. F. (1970). Valence structure from X-ray dif-fraction daba: an L-shell protection method. J. Chem.Phys. 53, 205±213.
Suzuki, M. & Gerstein, M. (1995). Binding geometry ofa-helices that recognize DNA. Proteins: Struct.Funct. Genet. 23, 525±535.
Suzuki, M. & Yagi, N. (1995). Stereochemical basis ofDNA bending by transcription factors. Nucl. AcidsRes. 23, 2083±2091.
Suzuki, M., Yagi, N. & Gerstein, M. (1995). DNA recog-nition and superstructure formation by helix-turn-helix proteins. Protein Eng. 8, 329±338.
Suzuki, M., Yagi, N. & Finch, J. T. (1996a). Role of base-backbone and base-base interactions in alternatingDNA conformations. FEBS Letters, 379, 148±152.
Suzuki, M., Allen, M. D., Yagi, N. & Finch, J. T. (1996b).Analysis of co-crystal structures to identify thedeterminants of the orientation of TBP on theTATA box. Nucl. Acids Res. 24, 2767±2773.
Timsit, Y. & Moras, D. (1995). Self-®tting and self-modi-fying properties of the B-DNA molecule. J. Mol.Biol. 251, 629±647.
Weiner, S. J., Kollman, P. A., Case, D. A., Singh, U. C.,Ghio, C., Alagona, G., Profeta, S., Jr & Weiner, P.(1984). A new force ®eld for molecular mechanicalsimulation of nucleic acids and proteins. J. Am.Chem. Soc. 106, 765±784.
Yanagi, K., Prive, G. G. & Dickerson, R. E. (1991).Analysis of local helix geometry in three B-DNAdecamers and eight dodecamers. J. Mol. Biol. 217,201±214.
Young, M. A., Ravishanker, G., Breridge, D. L. &Berman, H. M. (1995). Analysis of local helix bend-ing in crystal structures of DNA oigonucleotidesand DNA-protein complexes. Biophys. J. 68, 2454±2468.
Zhurkin, V. B., Poltev, V. I. & Florentev, V. L. (1980).Atom-atom potential functions for conformationalcalculations of nucleic acids. J. Mol. Biol. 14, 882±895.
Edited by B. Honig
(Received 4 April 1997; received in revised form 15 September 1997; accepted 15 September 1997)