Embed Size (px)
Citation preview
Updated 5/9/2018 3:34:00 PM
How to Create a Service Area Map and Data Table Using the UDS Mapper
Contents Introduction .................................................................................................................................................. 2 Basic UDS Mapper Functionalities .............................................................................................................. 4
Accessing and Registering for the UDS Mapper ...................................................................................... 4 Welcome Screen ....................................................................................................................................... 5 Saving Maps/ Progress .............................................................................................................................. 6
Caching ................................................................................................................................................. 6 Share tool .............................................................................................................................................. 6
Adjusting the Map View, including Zooming .......................................................................................... 7 Using the Search Box ............................................................................................................................ 7 Manually Zooming................................................................................................................................ 8 Panning ................................................................................................................................................. 9
Highlighting Your Service Area .................................................................................................................. 10 Adding New or Additional Provider Sites .................................................................................................. 13
Drawing Tools ........................................................................................................................................ 13 Map My Data .......................................................................................................................................... 13
Manual Entry ...................................................................................................................................... 13 Batch Entry ......................................................................................................................................... 15
Adding Health Care Facilities Available in the UDS Mapper .................................................................... 18 Using the Wizard ....................................................................................................................................... 20 Other Map Elements ................................................................................................................................... 24
Adding Medically Underserved Areas/Populations ............................................................................... 24 Adding Labels ......................................................................................................................................... 25 Selecting a Main Map Background ......................................................................................................... 26 Outlining Your Service Area (Optional) ................................................................................................. 27
Creating a Data Table ................................................................................................................................. 30 Saving Your Completed Map and Data Table as a Document .................................................................... 31
Option A: Using the ‘Print’ Tool to Save Your Map/Data Table ............................................................ 31 Option A Example .................................................................................................................................. 33 Option B: Using a Screen Capture Tool to Save Your Map ................................................................... 33 Option B Example ................................................................................................................................... 35
How to Create a Service Area Map 2
Introduction
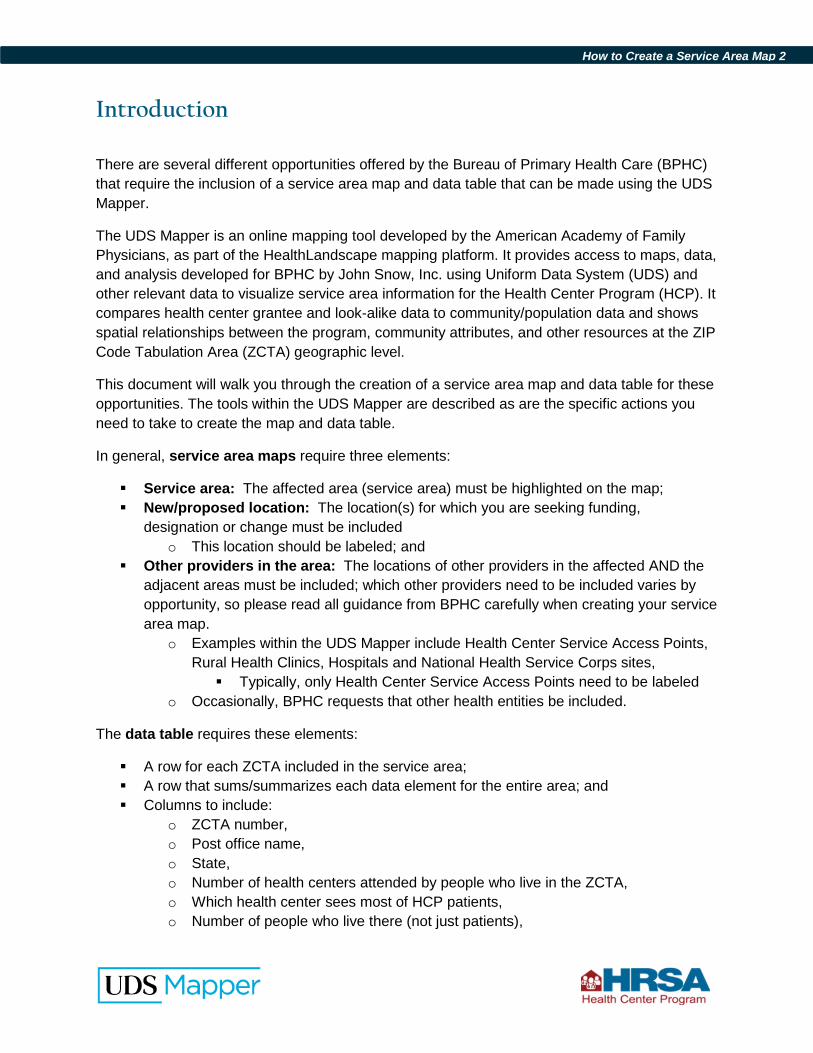
There are several different opportunities offered by the Bureau of Primary Health Care (BPHC) that require the inclusion of a service area map and data table that can be made using the UDS Mapper.
The UDS Mapper is an online mapping tool developed by the American Academy of Family Physicians, as part of the HealthLandscape mapping platform. It provides access to maps, data, and analysis developed for BPHC by John Snow, Inc. using Uniform Data System (UDS) and other relevant data to visualize service area information for the Health Center Program (HCP). It compares health center grantee and look-alike data to community/population data and shows spatial relationships between the program, community attributes, and other resources at the ZIP Code Tabulation Area (ZCTA) geographic level.
This document will walk you through the creation of a service area map and data table for these opportunities. The tools within the UDS Mapper are described as are the specific actions you need to take to create the map and data table.
In general, service area maps require three elements:
Service area: The affected area (service area) must be highlighted on the map; New/proposed location: The location(s) for which you are seeking funding,
designation or change must be included o This location should be labeled; and
Other providers in the area: The locations of other providers in the affected AND the adjacent areas must be included; which other providers need to be included varies by opportunity, so please read all guidance from BPHC carefully when creating your service area map.
o Examples within the UDS Mapper include Health Center Service Access Points, Rural Health Clinics, Hospitals and National Health Service Corps sites, Typically, only Health Center Service Access Points need to be labeled
o Occasionally, BPHC requests that other health entities be included.
The data table requires these elements:
A row for each ZCTA included in the service area; A row that sums/summarizes each data element for the entire area; and Columns to include:
o ZCTA number, o Post office name, o State, o Number of health centers attended by people who live in the ZCTA, o Which health center sees most of HCP patients, o Number of people who live there (not just patients),

How to Create a Service Area Map 3
o Number of people who live there who are low-income (below 200% of the Federal Poverty Level),
o Number of patients (count of people who went to any health center), o Percent of the people who live in the ZCTA who went to any health center
(penetration of the total population), and o Percent of low-income people who live in the ZCTA who went to any health
center (penetration of the low-income population).
While there are individual tools that you can use to create your service area map, in 2018 a new tool launched in the UDS Mapper that consolidates the steps to starting a service area map. Even though this Wizard is one of the first things you will encounter in the UDS Mapper (it can be found at the bottom of the Welcome screen) we recommend that you close it when first learning to make your service area map so that you understand how a service area map is crafted. That way, you can better understand what each step does and know how to make changes to the map, if necessary. Therefore, instructions to use the Wizard are included later in this document after describing the individual tools that can still be used to complete the same requirements.
This document lives on the UDS Mapper site: https://www.udsmapper.org in the Tutorials section. Please visit that page to see if this document has been recently updated. There also are other documents on that page which walk you through using every tool in the UDS Mapper in more detail than we have included in this document. Refer to those documents if you need more guidance. Last, if you need assistance, please contact the UDS Mapper support team by going to the UDS Mapper site to live chat with us or send us an email.
How to Create a Service Area Map 4
Basic UDS Mapper Functionalities
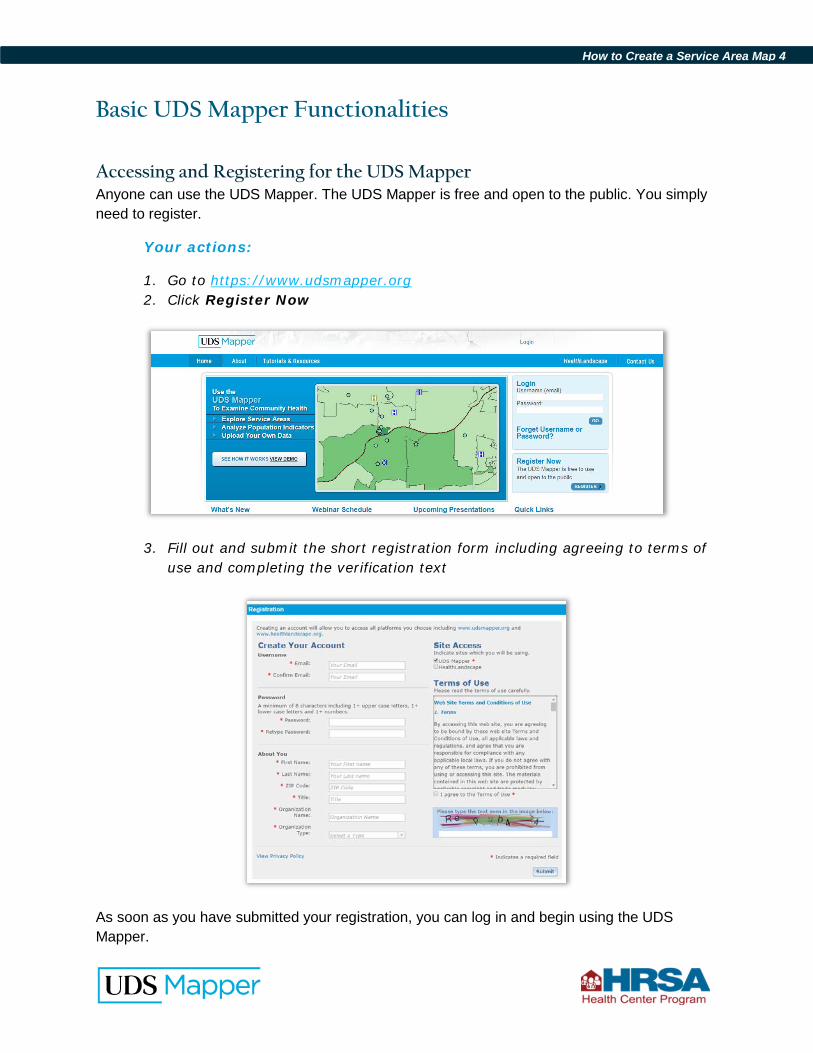
Accessing and Registering for the UDS Mapper Anyone can use the UDS Mapper. The UDS Mapper is free and open to the public. You simply need to register.
Your actions:
1. Go to https://www.udsmapper.org 2. Click Register Now
3. Fill out and submit the short registration form including agreeing to terms of use and completing the verification text
As soon as you have submitted your registration, you can log in and begin using the UDS Mapper.
How to Create a Service Area Map 5
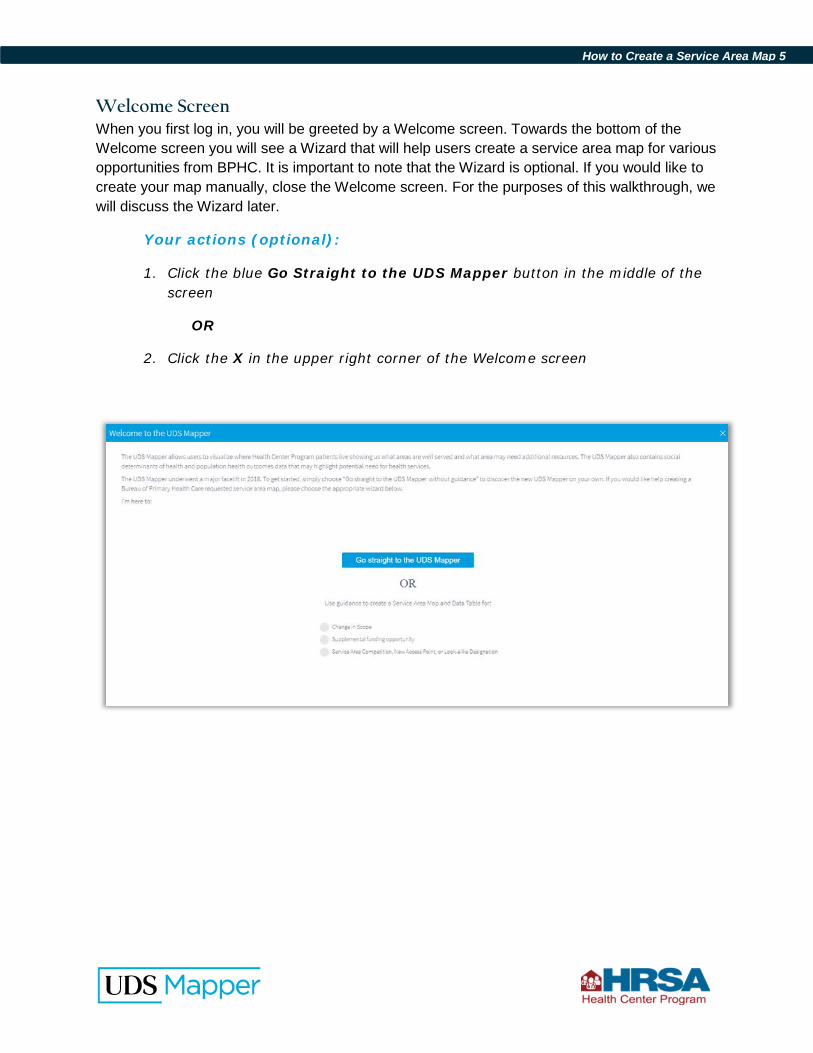
Welcome Screen When you first log in, you will be greeted by a Welcome screen. Towards the bottom of the Welcome screen you will see a Wizard that will help users create a service area map for various opportunities from BPHC. It is important to note that the Wizard is optional. If you would like to create your map manually, close the Welcome screen. For the purposes of this walkthrough, we will discuss the Wizard later.
Your actions (optional):
1. Click the blue Go Straight to the UDS Mapper button in the middle of the screen
OR
2. Click the X in the upper right corner of the Welcome screen
How to Create a Service Area Map 6
Saving Maps/ Progress There is no formal saving capability in the UDS Mapper but you can still stop what you are doing in the UDS Mapper and come back to it later. Here is how your map progress is saved.
Caching The UDS Mapper is cached in your browser (if you allow your browser to cache). This means that if you close the UDS Mapper or browser, and/or restart your computer, when you come in to the UDS Mapper the next time on the same computer and in the same browser, your work will still be there. Just pick up where you left off.
Your actions:
Make sure your browser allows caching if you want to take advantage of this feature
If you log in to the UDS Mapper on a different computer or via a different browser, you will NOT retain anything you worked on using the first computer or browser EXCEPT address sets you uploaded and saved in the Map My Data tool.
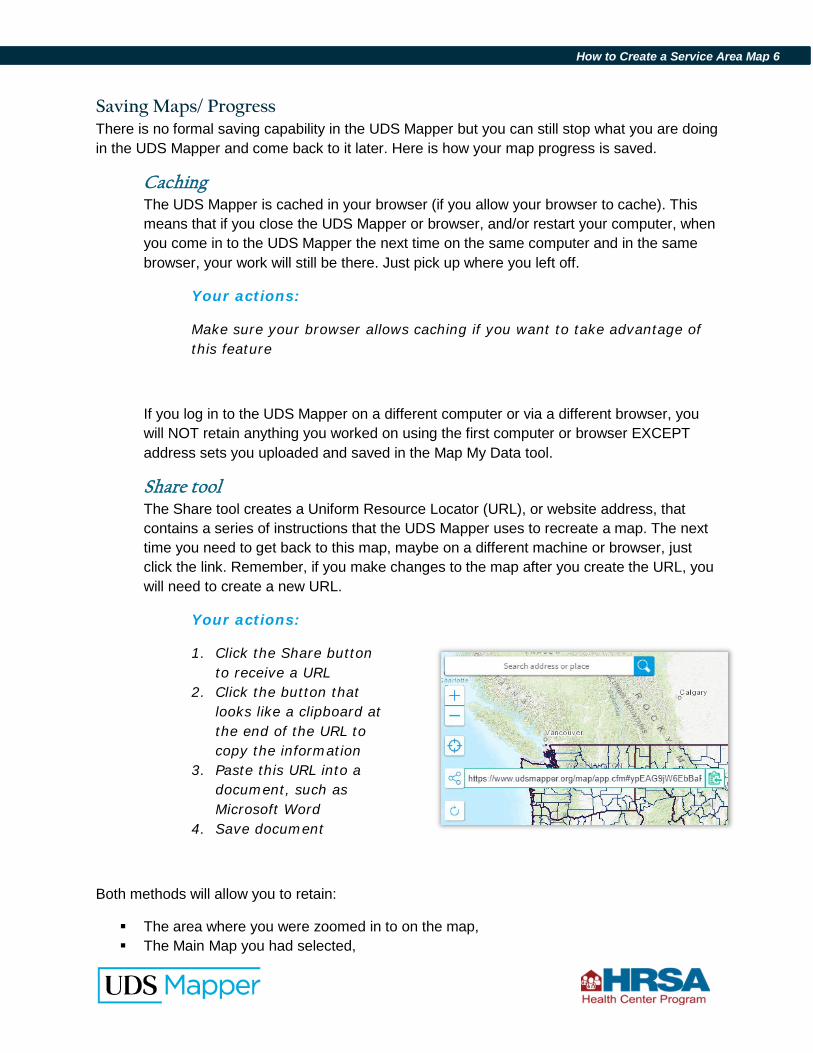
Share tool The Share tool creates a Uniform Resource Locator (URL), or website address, that contains a series of instructions that the UDS Mapper uses to recreate a map. The next time you need to get back to this map, maybe on a different machine or browser, just click the link. Remember, if you make changes to the map after you create the URL, you will need to create a new URL.
Your actions:
1. Click the Share button to receive a URL
2. Click the button that looks like a clipboard at the end of the URL to copy the information
3. Paste this URL into a document, such as Microsoft Word
4. Save document
Both methods will allow you to retain:
The area where you were zoomed in to on the map, The Main Map you had selected,
How to Create a Service Area Map 7
The basemap you had selected, and The features you had selected, including Medically Underserved Areas/Populations
(MUA/Ps), geographic boundaries and/or geographic labels, and health care facilities.
If you uploaded and saved a set of addresses using the Map My Data tool you will be able to quickly add those back to the map by going into that tool and restoring the points.
Adjusting the Map View, including Zooming When looking at the map, you may need to zoom in or out or otherwise move the map around. These functionalities are particularly important when you are creating and finalizing your service area map. You can adjust the map view using the search box or manually zooming and panning the map.
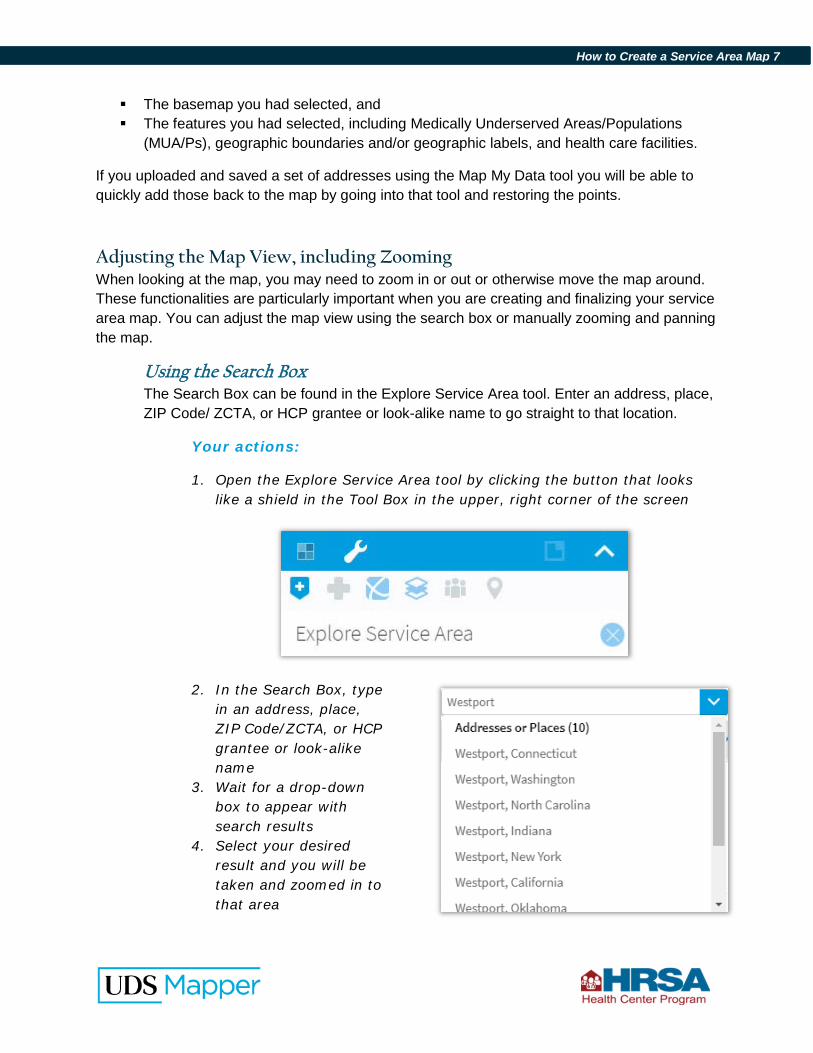
Using the Search Box The Search Box can be found in the Explore Service Area tool. Enter an address, place, ZIP Code/ ZCTA, or HCP grantee or look-alike name to go straight to that location.
Your actions:
1. Open the Explore Service Area tool by clicking the button that looks like a shield in the Tool Box in the upper, right corner of the screen
2. In the Search Box, type in an address, place, ZIP Code/ZCTA, or HCP grantee or look-alike name
3. Wait for a drop-down box to appear with search results
4. Select your desired result and you will be taken and zoomed in to that area
How to Create a Service Area Map 8
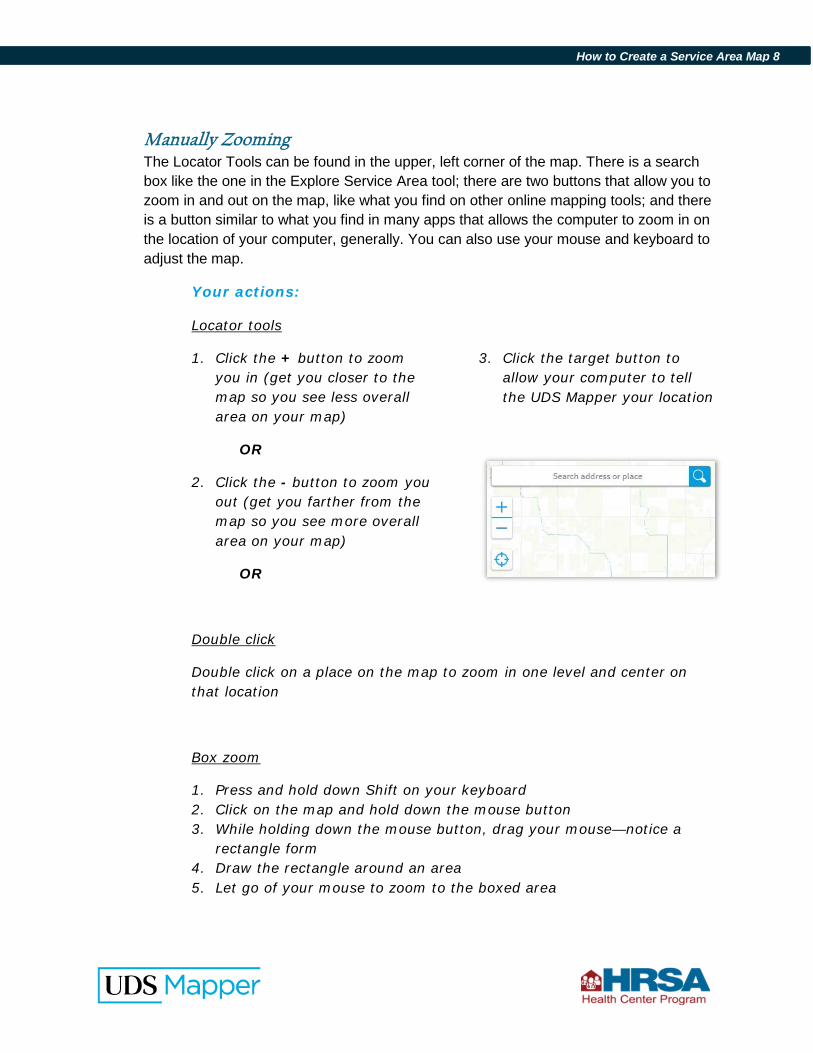
Manually Zooming The Locator Tools can be found in the upper, left corner of the map. There is a search box like the one in the Explore Service Area tool; there are two buttons that allow you to zoom in and out on the map, like what you find on other online mapping tools; and there is a button similar to what you find in many apps that allows the computer to zoom in on the location of your computer, generally. You can also use your mouse and keyboard to adjust the map.
Your actions:
Locator tools
1. Click the + button to zoom you in (get you closer to the map so you see less overall area on your map)
OR
2. Click the - button to zoom you out (get you farther from the map so you see more overall area on your map)
OR
3. Click the target button to allow your computer to tell the UDS Mapper your location
Double click
Double click on a place on the map to zoom in one level and center on that location
Box zoom
1. Press and hold down Shift on your keyboard 2. Click on the map and hold down the mouse button 3. While holding down the mouse button, drag your mouse—notice a
rectangle form 4. Draw the rectangle around an area 5. Let go of your mouse to zoom to the boxed area
How to Create a Service Area Map 9
Mouse wheel
If your mouse has a “wheel”: Scroll away to zoom in, or toward you to zoom out
Panning Once you are zoomed to the desired level, you may want to move or re-center your map.
Your actions:
1. Click on the map and hold down your mouse button (your cursor will become crossed arrows)
2. While holding down your mouse button, “pull” or “push” the map to bring the area you wish to see into view
3. Repeat as necessary until the map is centered on the desired location
How to Create a Service Area Map 10
Highlighting Your Service Area
For service area maps, you must select the ZCTAs that make up or approximate your service area. If you define your service area with a different geography, such as a County, you should select the ZCTAs that best approximate that geography.
You are not typically asked to include additional geography boundaries. We recommend not adding any boundaries that do not help you tell your story. If you define your service area with a geographic unit that is not ZCTAs, you may want to turn on those boundaries just to help you select the proper ZCTAs or leave them on if they clearly show your intended service area above and beyond the required ZCTA information.
Your actions (optional):
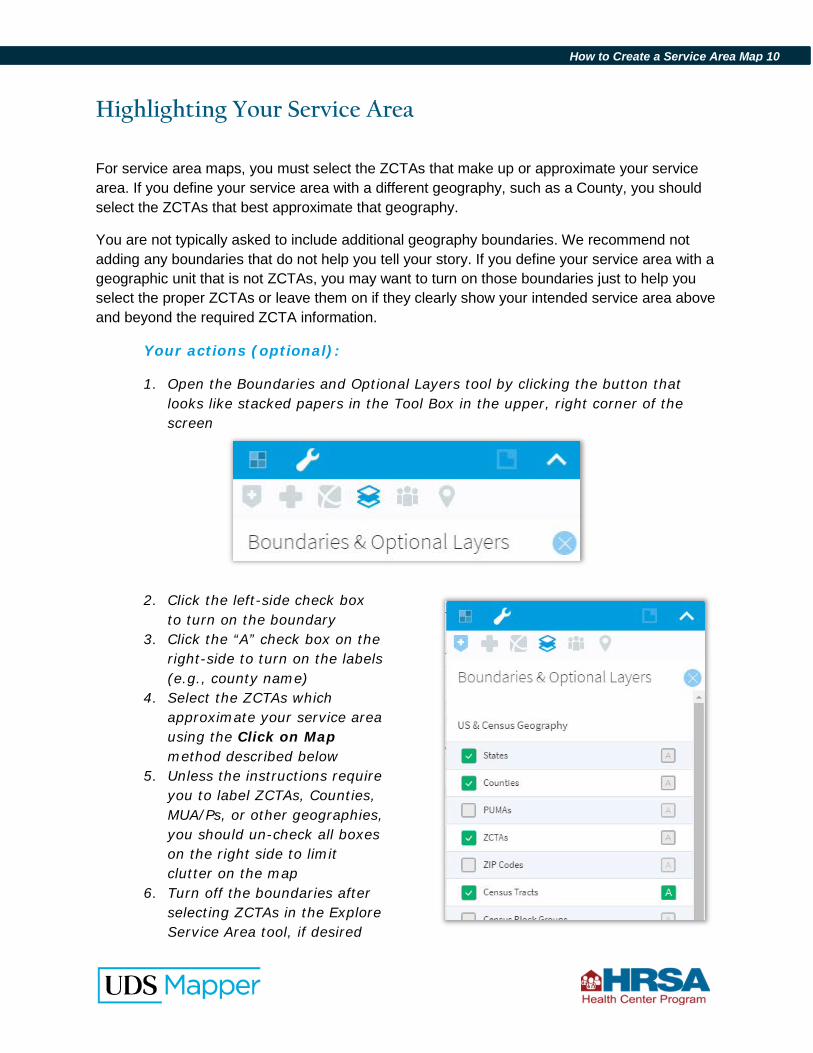
1. Open the Boundaries and Optional Layers tool by clicking the button that looks like stacked papers in the Tool Box in the upper, right corner of the screen
2. Click the left-side check box to turn on the boundary
3. Click the “A” check box on the right-side to turn on the labels (e.g., county name)
4. Select the ZCTAs which approximate your service area using the Click on Map method described below
5. Unless the instructions require you to label ZCTAs, Counties, MUA/Ps, or other geographies, you should un-check all boxes on the right side to limit clutter on the map
6. Turn off the boundaries after selecting ZCTAs in the Explore Service Area tool, if desired
How to Create a Service Area Map 11
ZCTAs are approximate area representations of U.S. Postal Service ZIP Codes, created by the US Census Bureau. See http://www.census.gov/geo/reference/gtc/gtc_zcta.html for information about ZCTAs. In most cases, ZCTAs and ZIP Codes will match. However, if you cannot find a ZIP Code where you think it should be on the map, you should click Tutorials and Resources and use the ZIP Code to ZCTA Crosswalk to determine which ZCTA to use in place of that ZIP Code.
Your actions:
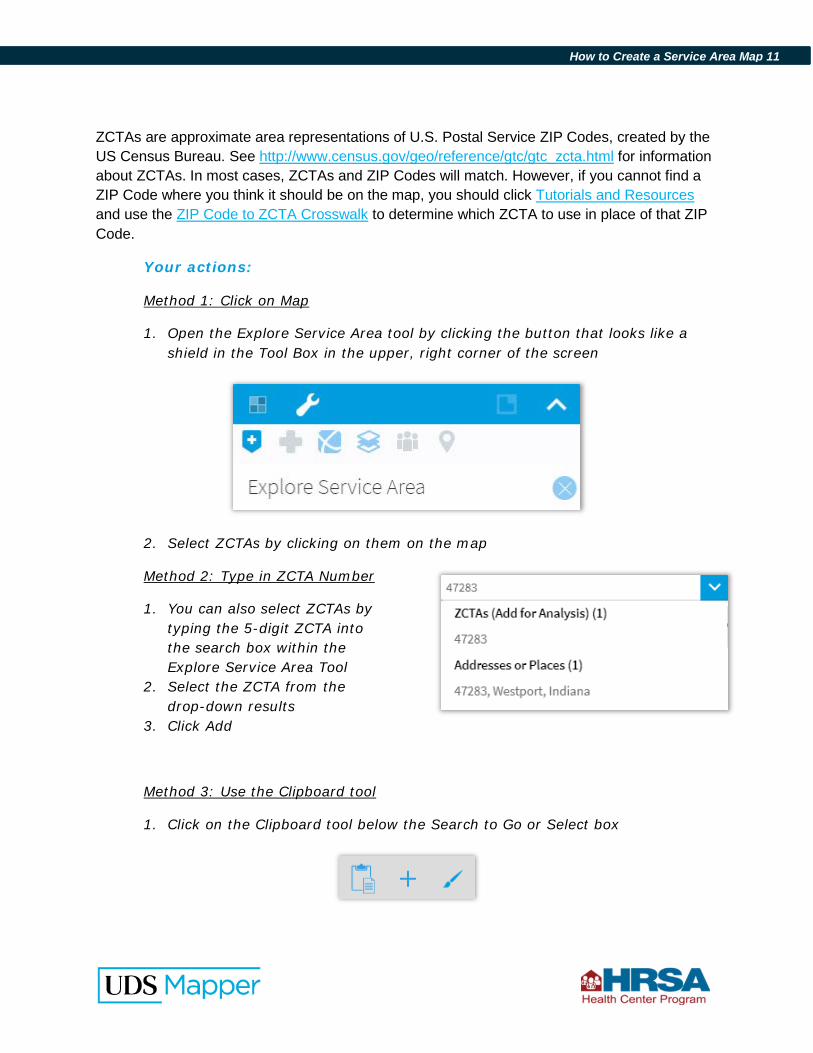
Method 1: Click on Map
1. Open the Explore Service Area tool by clicking the button that looks like a shield in the Tool Box in the upper, right corner of the screen
2. Select ZCTAs by clicking on them on the map
Method 2: Type in ZCTA Number
1. You can also select ZCTAs by typing the 5-digit ZCTA into the search box within the Explore Service Area Tool
2. Select the ZCTA from the drop-down results
3. Click Add
Method 3: Use the Clipboard tool
1. Click on the Clipboard tool below the Search to Go or Select box
How to Create a Service Area Map 12
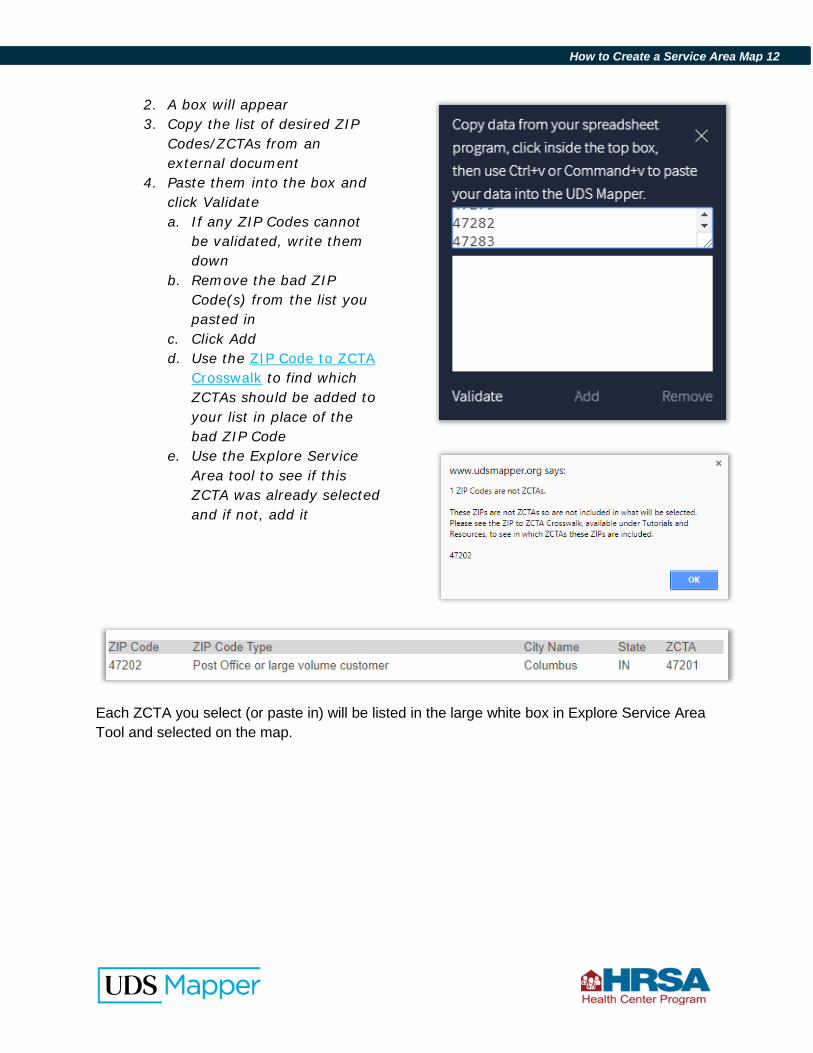
2. A box will appear 3. Copy the list of desired ZIP
Codes/ZCTAs from an external document
4. Paste them into the box and click Validate a. If any ZIP Codes cannot
be validated, write them down
b. Remove the bad ZIP Code(s) from the list you pasted in
c. Click Add d. Use the ZIP Code to ZCTA
Crosswalk to find which ZCTAs should be added to your list in place of the bad ZIP Code
e. Use the Explore Service Area tool to see if this ZCTA was already selected and if not, add it
Each ZCTA you select (or paste in) will be listed in the large white box in Explore Service Area Tool and selected on the map.
How to Create a Service Area Map 13
Adding New or Additional Provider Sites
For all applications you must add location(s) that are the focus of the application. Occasionally, the application instructions also require you to map other relevant providers that are not readily available in the UDS Mapper. These sites can be approximated using the Drawing Tools or pinpointed using the Map My Data tool.
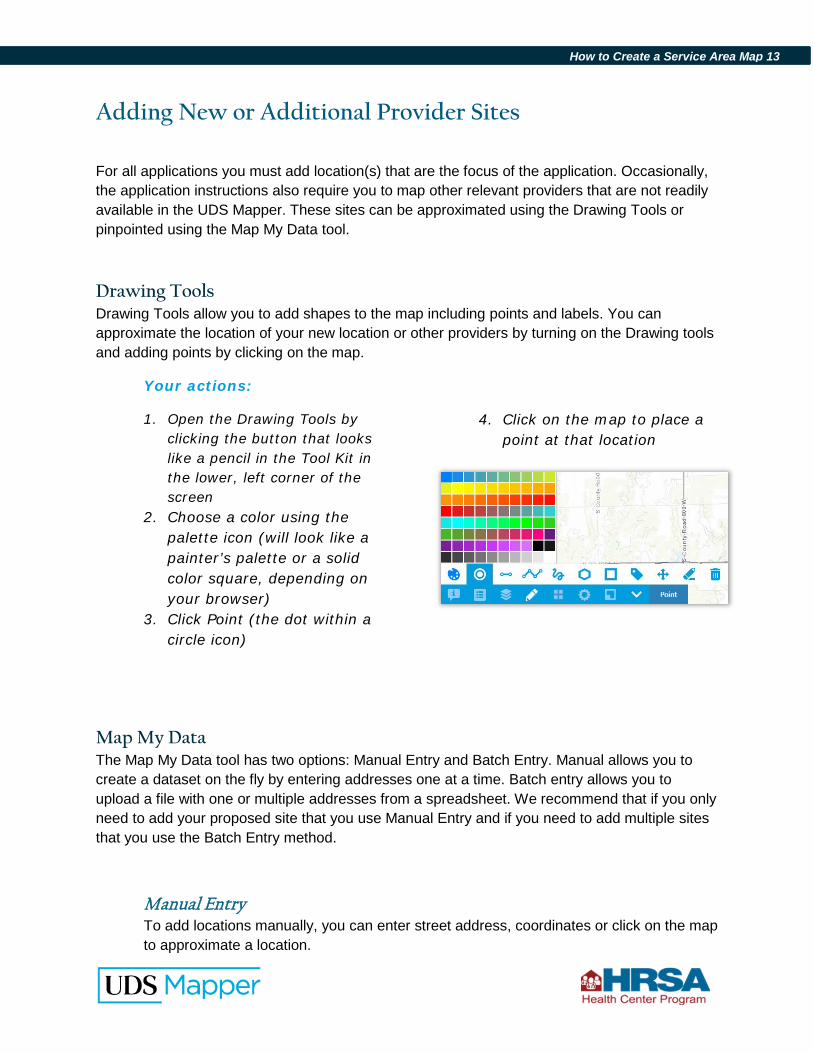
Drawing Tools Drawing Tools allow you to add shapes to the map including points and labels. You can approximate the location of your new location or other providers by turning on the Drawing tools and adding points by clicking on the map.
Your actions:
1. Open the Drawing Tools by clicking the button that looks like a pencil in the Tool Kit in the lower, left corner of the screen
2. Choose a color using the palette icon (will look like a painter’s palette or a solid color square, depending on your browser)
3. Click Point (the dot within a circle icon)
4. Click on the map to place a point at that location
Map My Data The Map My Data tool has two options: Manual Entry and Batch Entry. Manual allows you to create a dataset on the fly by entering addresses one at a time. Batch entry allows you to upload a file with one or multiple addresses from a spreadsheet. We recommend that if you only need to add your proposed site that you use Manual Entry and if you need to add multiple sites that you use the Batch Entry method.
Manual Entry To add locations manually, you can enter street address, coordinates or click on the map to approximate a location.
How to Create a Service Area Map 14
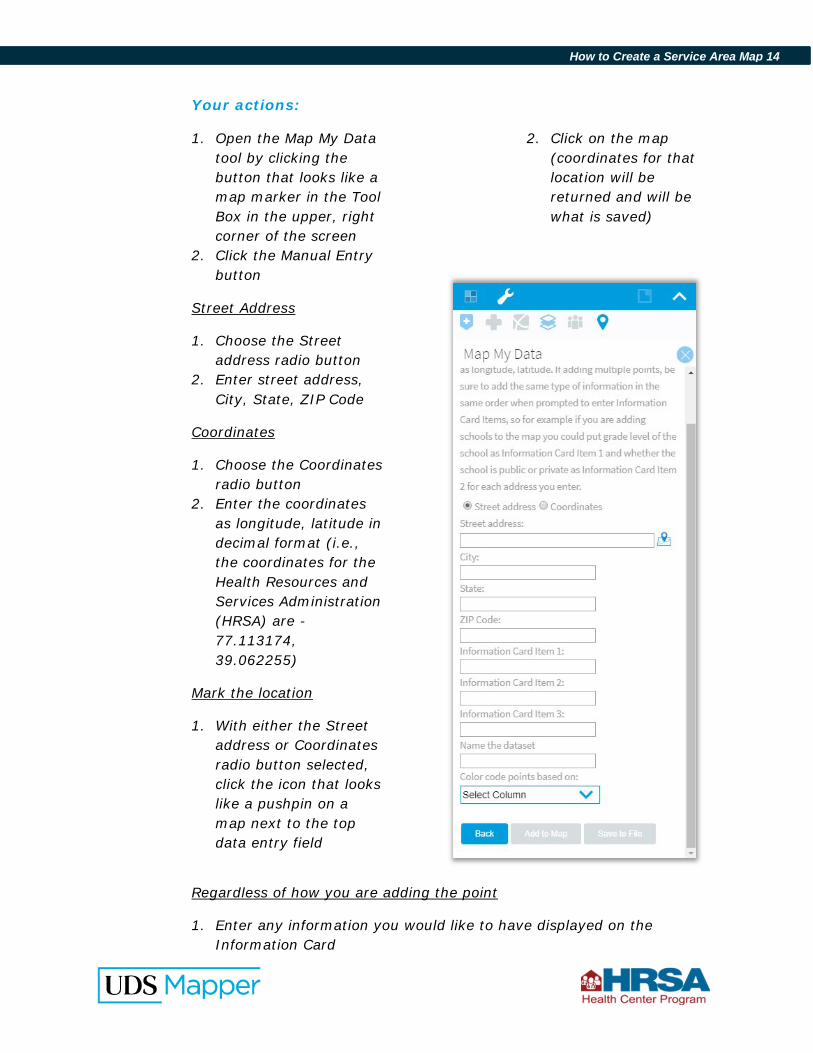
Your actions:
1. Open the Map My Data tool by clicking the button that looks like a map marker in the Tool Box in the upper, right corner of the screen
2. Click the Manual Entry button
Street Address
1. Choose the Street address radio button
2. Enter street address, City, State, ZIP Code
Coordinates
1. Choose the Coordinates radio button
2. Enter the coordinates as longitude, latitude in decimal format (i.e., the coordinates for the Health Resources and Services Administration (HRSA) are -77.113174, 39.062255)
Mark the location
1. With either the Street address or Coordinates radio button selected, click the icon that looks like a pushpin on a map next to the top data entry field
2. Click on the map (coordinates for that location will be returned and will be what is saved)
Regardless of how you are adding the point
1. Enter any information you would like to have displayed on the Information Card
How to Create a Service Area Map 15
a. If you are going to enter multiple sites manually into the same saved file, make sure you enter the same type of information each time in each of the Information Card Item lines. For example, put the type of location as Information Card Item 2, the name of the location as Information Card Item 2, etc.
2. Name your dataset (required, even if not saving the file) 3. Choose which attribute you would like to use to color code your points,
if any a. This is not necessary if adding only one location
4. Add to Map 5. Save your dataset
Batch Entry To add many addresses at one time, you will need to create a dataset.
Your actions:
If you already have a dataset ready, rearrange, if necessary
1. The first four columns must be in this order, and should be named a. Address b. City c. State d. ZIP Code
2. Additional columns can be added, if desired; in particular, we recommend you add a Type column if one does not exist already
3. If there are multiple sheets in the file, make sure the relevant one is the first one in the file (i.e., it is the left-most spreadsheet)
If you need to create a file from scratch
1. Minimize the UDS Mapper a. If you close the website, everything from the steps above will save
when you next log in, if you return on the same computer and internet browser
2. Determine the address of each location to be added; put new location and additional required providers, if any, on the same spreadsheet
3. Open a spreadsheet program (e.g., Microsoft Excel) 4. In the first row of the first column, type “Address” 5. Title the second column “City” 6. Title the third column “State” 7. Title the fourth column “ZIP Code”
How to Create a Service Area Map 16
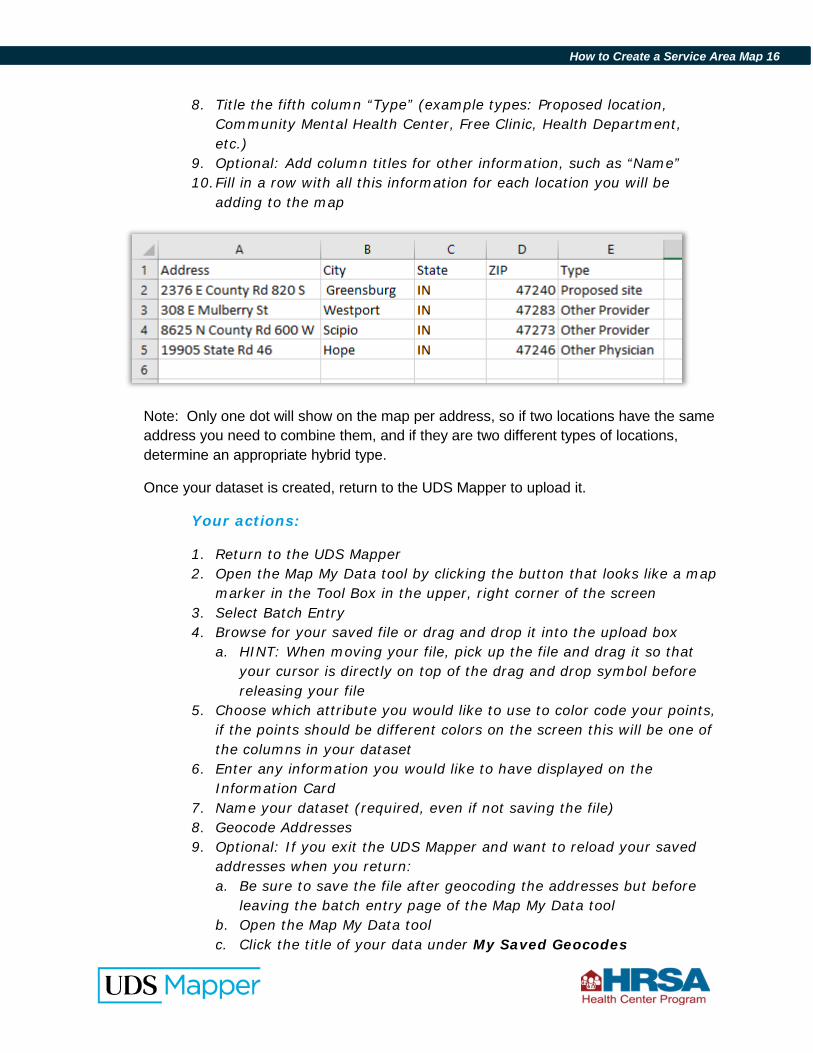
8. Title the fifth column “Type” (example types: Proposed location, Community Mental Health Center, Free Clinic, Health Department, etc.)
9. Optional: Add column titles for other information, such as “Name” 10. Fill in a row with all this information for each location you will be
adding to the map
Note: Only one dot will show on the map per address, so if two locations have the same address you need to combine them, and if they are two different types of locations, determine an appropriate hybrid type.
Once your dataset is created, return to the UDS Mapper to upload it.
Your actions:
1. Return to the UDS Mapper 2. Open the Map My Data tool by clicking the button that looks like a map
marker in the Tool Box in the upper, right corner of the screen 3. Select Batch Entry 4. Browse for your saved file or drag and drop it into the upload box
a. HINT: When moving your file, pick up the file and drag it so that your cursor is directly on top of the drag and drop symbol before releasing your file
5. Choose which attribute you would like to use to color code your points, if the points should be different colors on the screen this will be one of the columns in your dataset
6. Enter any information you would like to have displayed on the Information Card
7. Name your dataset (required, even if not saving the file) 8. Geocode Addresses 9. Optional: If you exit the UDS Mapper and want to reload your saved
addresses when you return: a. Be sure to save the file after geocoding the addresses but before
leaving the batch entry page of the Map My Data tool b. Open the Map My Data tool c. Click the title of your data under My Saved Geocodes
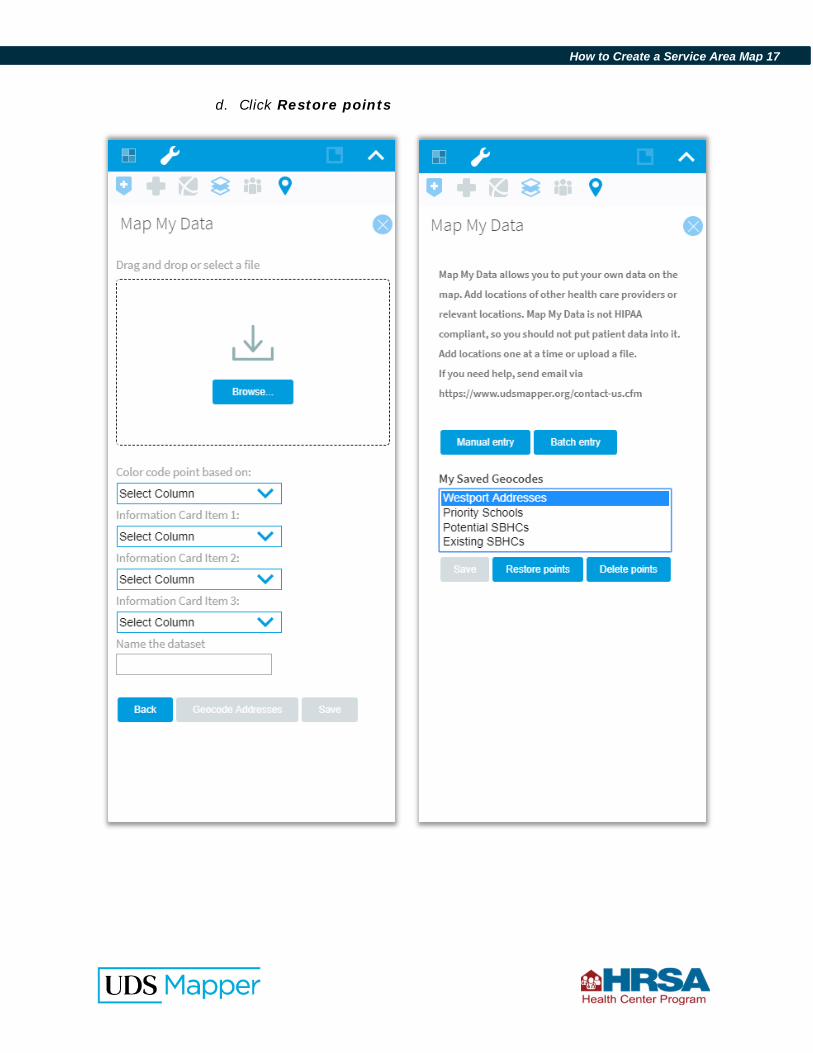
How to Create a Service Area Map 17
d. Click Restore points
How to Create a Service Area Map 18
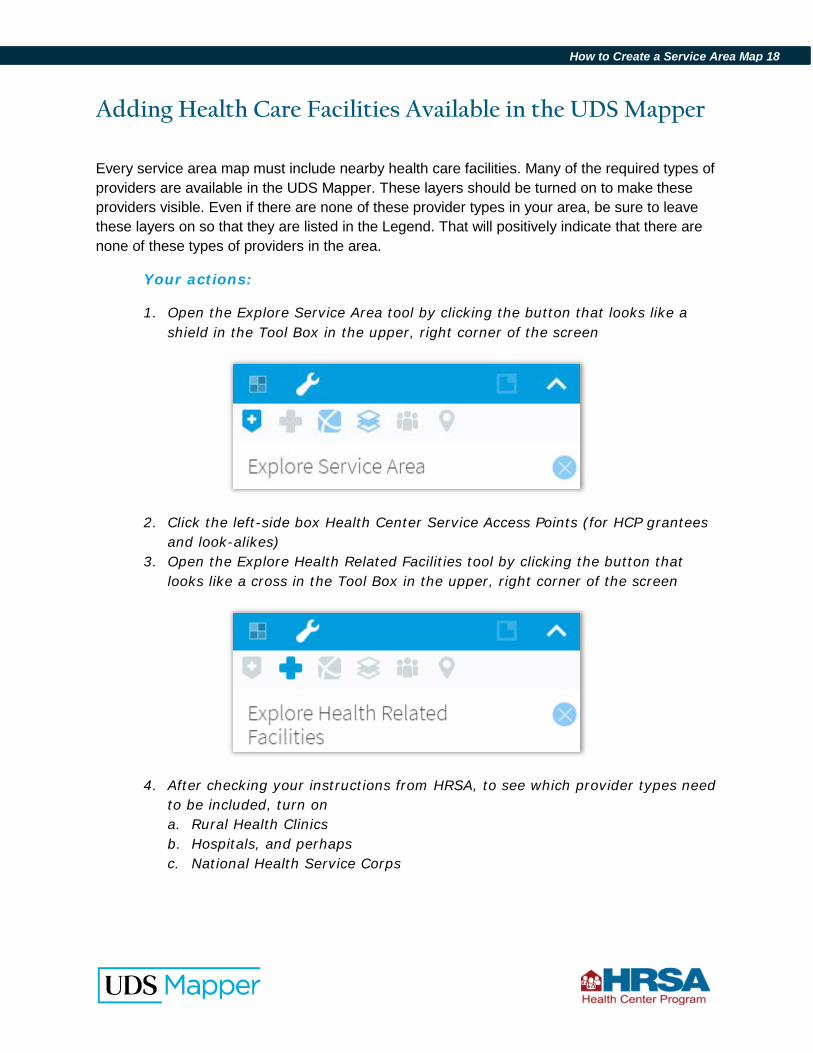
Adding Health Care Facilities Available in the UDS Mapper
Every service area map must include nearby health care facilities. Many of the required types of providers are available in the UDS Mapper. These layers should be turned on to make these providers visible. Even if there are none of these provider types in your area, be sure to leave these layers on so that they are listed in the Legend. That will positively indicate that there are none of these types of providers in the area.
Your actions:
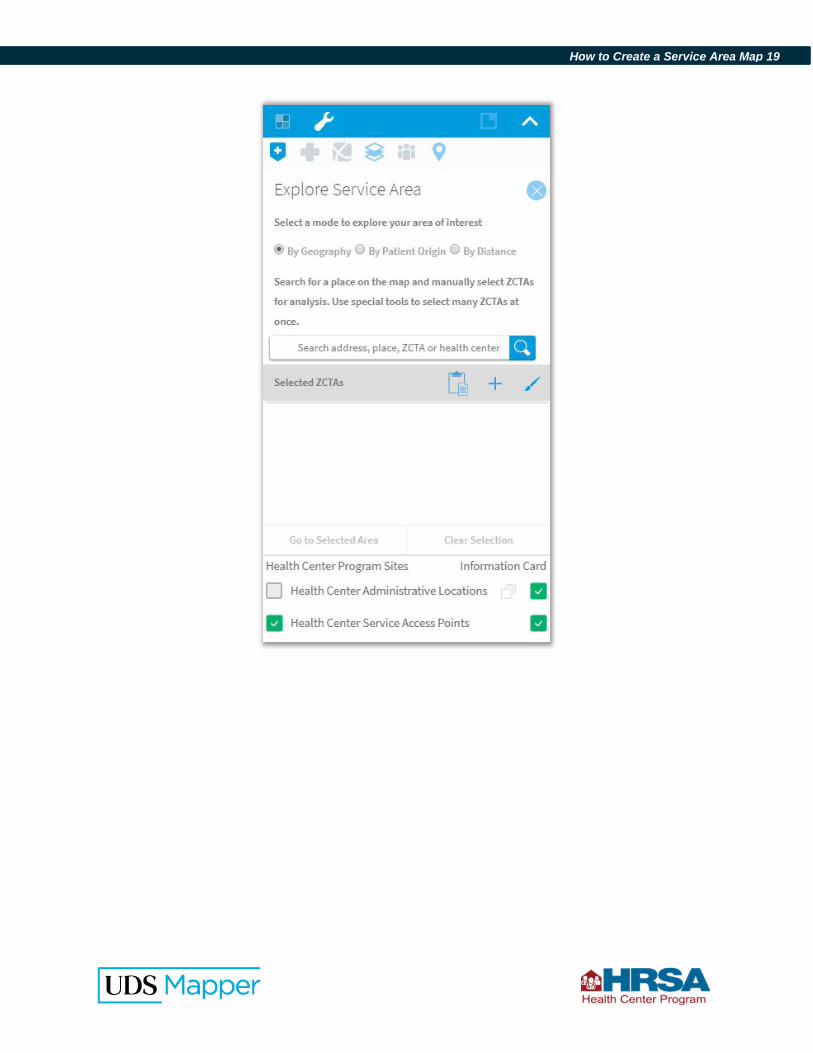
1. Open the Explore Service Area tool by clicking the button that looks like a shield in the Tool Box in the upper, right corner of the screen
2. Click the left-side box Health Center Service Access Points (for HCP grantees and look-alikes)
3. Open the Explore Health Related Facilities tool by clicking the button that looks like a cross in the Tool Box in the upper, right corner of the screen
4. After checking your instructions from HRSA, to see which provider types need to be included, turn on a. Rural Health Clinics b. Hospitals, and perhaps c. National Health Service Corps
How to Create a Service Area Map 19
How to Create a Service Area Map 20
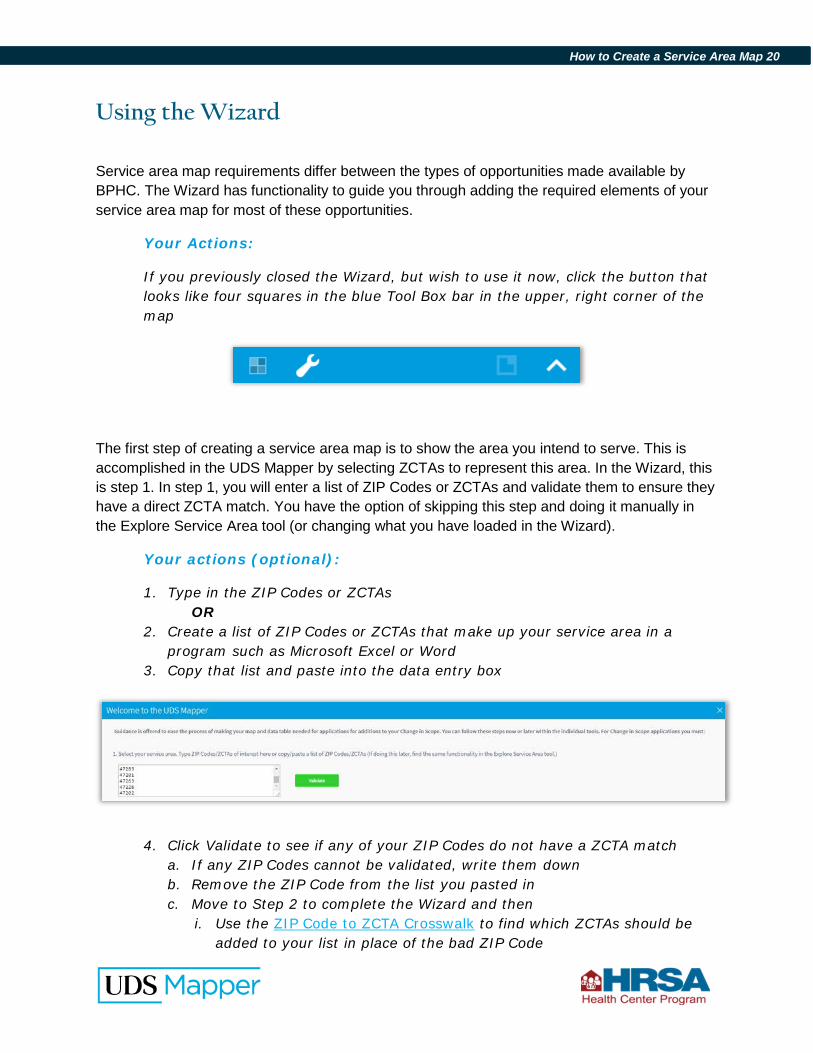
Using the Wizard
Service area map requirements differ between the types of opportunities made available by BPHC. The Wizard has functionality to guide you through adding the required elements of your service area map for most of these opportunities.
Your Actions:
If you previously closed the Wizard, but wish to use it now, click the button that looks like four squares in the blue Tool Box bar in the upper, right corner of the map
The first step of creating a service area map is to show the area you intend to serve. This is accomplished in the UDS Mapper by selecting ZCTAs to represent this area. In the Wizard, this is step 1. In step 1, you will enter a list of ZIP Codes or ZCTAs and validate them to ensure they have a direct ZCTA match. You have the option of skipping this step and doing it manually in the Explore Service Area tool (or changing what you have loaded in the Wizard).
Your actions (optional):
1. Type in the ZIP Codes or ZCTAs OR
2. Create a list of ZIP Codes or ZCTAs that make up your service area in a program such as Microsoft Excel or Word
3. Copy that list and paste into the data entry box
4. Click Validate to see if any of your ZIP Codes do not have a ZCTA match
a. If any ZIP Codes cannot be validated, write them down b. Remove the ZIP Code from the list you pasted in c. Move to Step 2 to complete the Wizard and then
i. Use the ZIP Code to ZCTA Crosswalk to find which ZCTAs should be added to your list in place of the bad ZIP Code
How to Create a Service Area Map 21
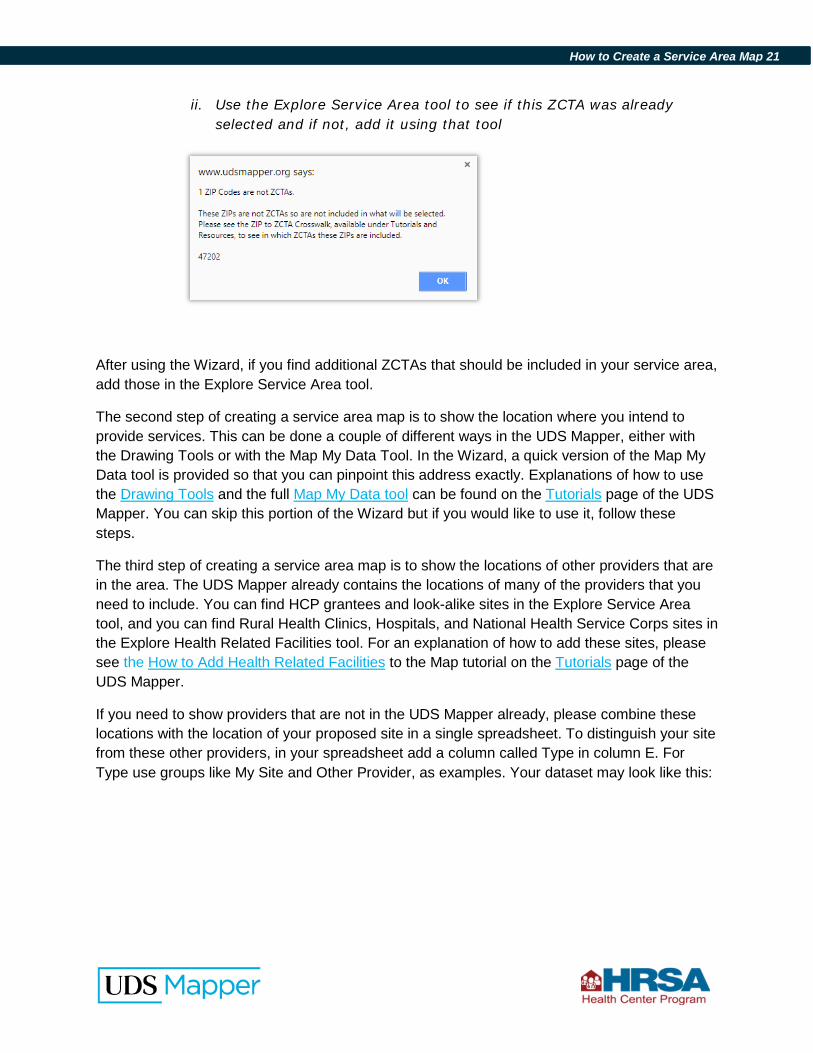
ii. Use the Explore Service Area tool to see if this ZCTA was already selected and if not, add it using that tool
After using the Wizard, if you find additional ZCTAs that should be included in your service area, add those in the Explore Service Area tool.
The second step of creating a service area map is to show the location where you intend to provide services. This can be done a couple of different ways in the UDS Mapper, either with the Drawing Tools or with the Map My Data Tool. In the Wizard, a quick version of the Map My Data tool is provided so that you can pinpoint this address exactly. Explanations of how to use the Drawing Tools and the full Map My Data tool can be found on the Tutorials page of the UDS Mapper. You can skip this portion of the Wizard but if you would like to use it, follow these steps.
The third step of creating a service area map is to show the locations of other providers that are in the area. The UDS Mapper already contains the locations of many of the providers that you need to include. You can find HCP grantees and look-alike sites in the Explore Service Area tool, and you can find Rural Health Clinics, Hospitals, and National Health Service Corps sites in the Explore Health Related Facilities tool. For an explanation of how to add these sites, please see the How to Add Health Related Facilities to the Map tutorial on the Tutorials page of the UDS Mapper.
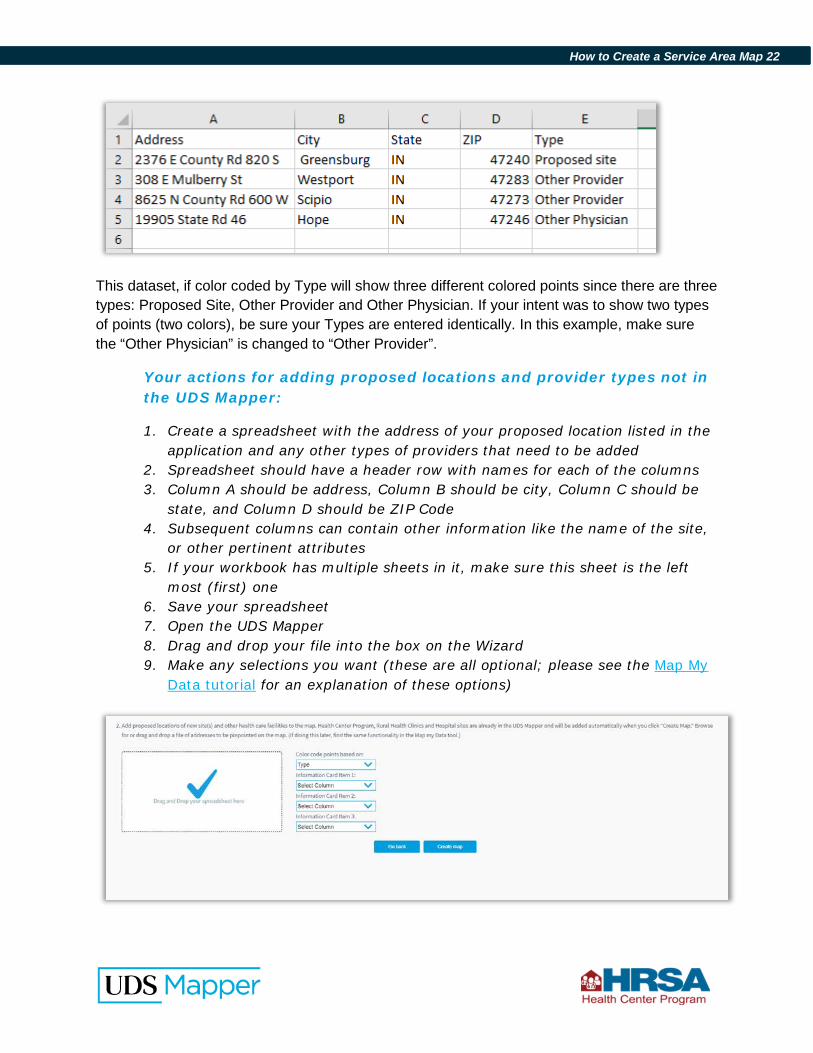
If you need to show providers that are not in the UDS Mapper already, please combine these locations with the location of your proposed site in a single spreadsheet. To distinguish your site from these other providers, in your spreadsheet add a column called Type in column E. For Type use groups like My Site and Other Provider, as examples. Your dataset may look like this:
How to Create a Service Area Map 22
This dataset, if color coded by Type will show three different colored points since there are three types: Proposed Site, Other Provider and Other Physician. If your intent was to show two types of points (two colors), be sure your Types are entered identically. In this example, make sure the “Other Physician” is changed to “Other Provider”.
Your actions for adding proposed locations and provider types not in the UDS Mapper:
1. Create a spreadsheet with the address of your proposed location listed in the application and any other types of providers that need to be added
2. Spreadsheet should have a header row with names for each of the columns 3. Column A should be address, Column B should be city, Column C should be
state, and Column D should be ZIP Code 4. Subsequent columns can contain other information like the name of the site,
or other pertinent attributes 5. If your workbook has multiple sheets in it, make sure this sheet is the left
most (first) one 6. Save your spreadsheet 7. Open the UDS Mapper 8. Drag and drop your file into the box on the Wizard 9. Make any selections you want (these are all optional; please see the Map My
Data tutorial for an explanation of these options)
How to Create a Service Area Map 23
Since the UDS Mapper already includes many of the facility types you need to include, when you click the Create Map button, the appropriate ones for the type of map you are creating will be turned on automatically. Please double check them with your instructions from HRSA to ensure the correct ones are selected and, if necessary, add or remove others.
Your actions:
Click Create Map button
When you click Create Map, if you selected ZCTAs, you should be zoomed in close to that area and the ZCTAs will be selected. If you uploaded data, you should see points on the map. If you chose a column in your dataset to color code the points, you should see different colors on the map, and you should see them listed in the Legend. Last, you will see the facilities of the types that are required for the opportunity for which you are creating this map:
HCP Grantee and Look-Alike Sites
Rural Health Clinics
Hospitals National Health Service Corps Sites
Change in Scope X X X Supplemental funding opportunity X X X
Service Area Competition, New Access Point, or Look-Alike Designation
X X X X
As of February 1, 2018, please double check your instructions from HRSA to ensure accuracy.
NOTE: The Wizard will not add required labels or MUA/Ps to your map; find instructions below for how to complete these steps.
How to Create a Service Area Map 24
Other Map Elements
The following map items are either not required on every map or are things we think you should consider when making your map.
Adding Medically Underserved Areas/Populations Typically, service area maps for New Access Points, Service Area Competitions, and Look-Alike designations require that you add MUA/Ps to your map. Read the instructions carefully to determine if this layer should be visible on your map.
Your actions:
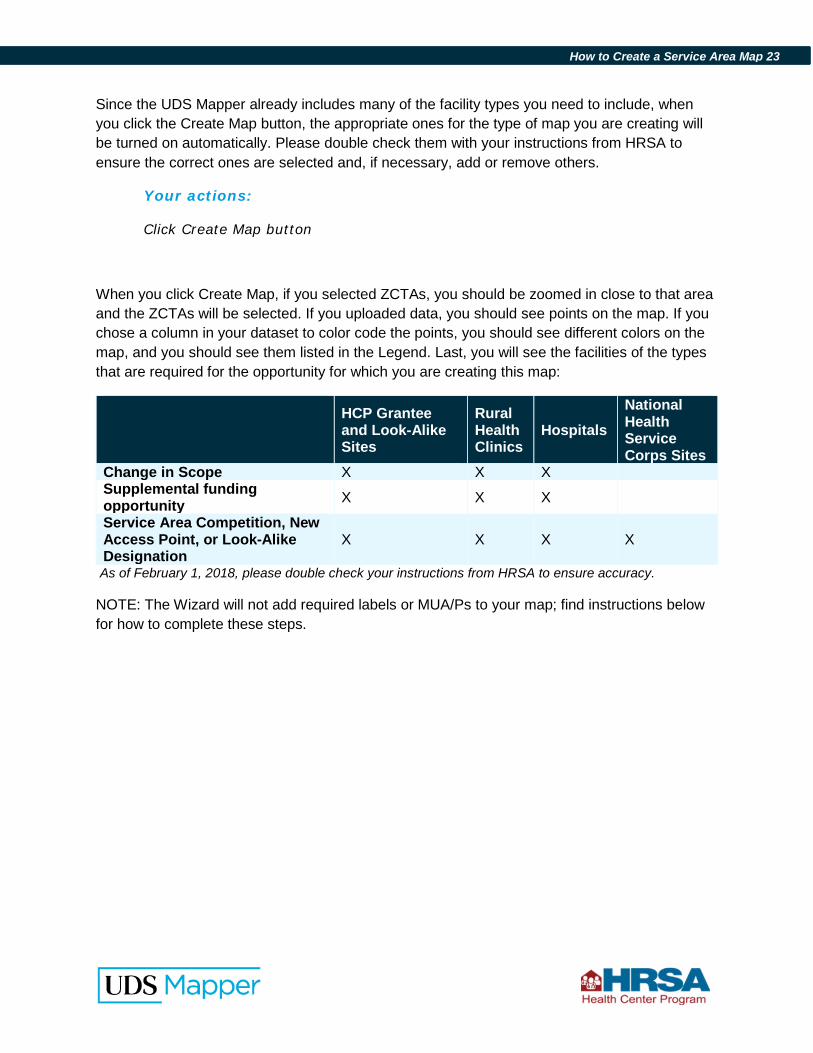
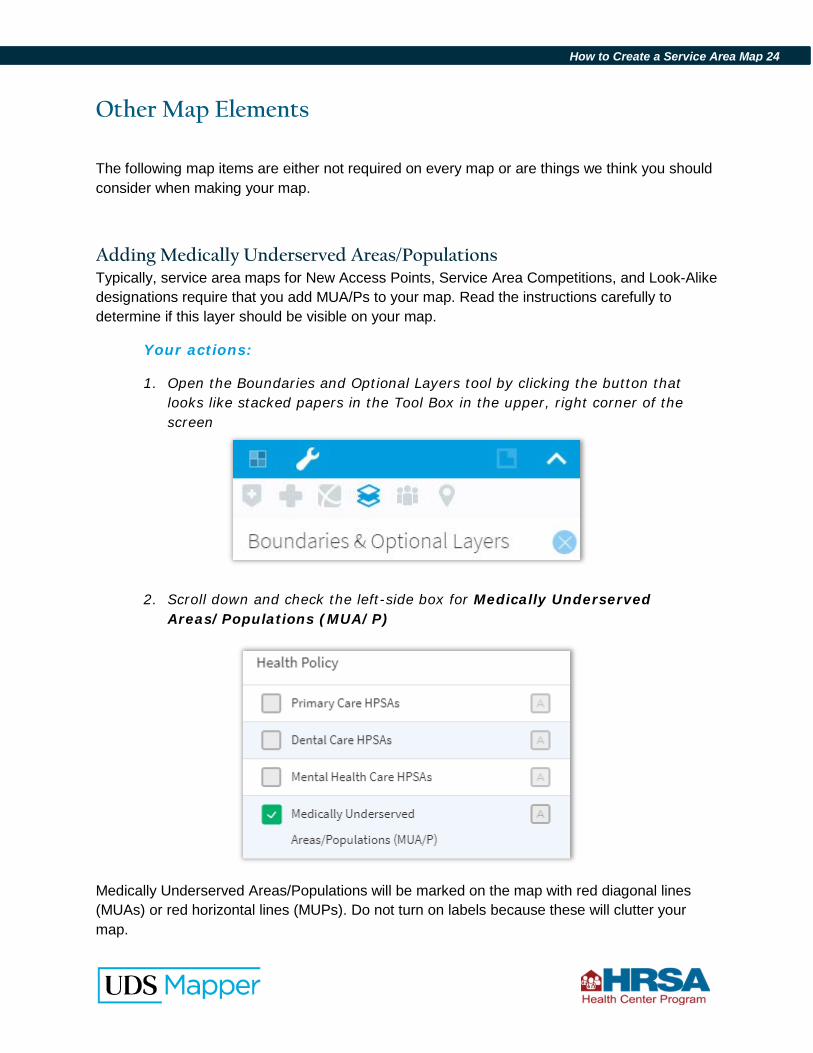
1. Open the Boundaries and Optional Layers tool by clicking the button that looks like stacked papers in the Tool Box in the upper, right corner of the screen
2. Scroll down and check the left-side box for Medically Underserved Areas/Populations (MUA/P)
Medically Underserved Areas/Populations will be marked on the map with red diagonal lines (MUAs) or red horizontal lines (MUPs). Do not turn on labels because these will clutter your map.
How to Create a Service Area Map 25
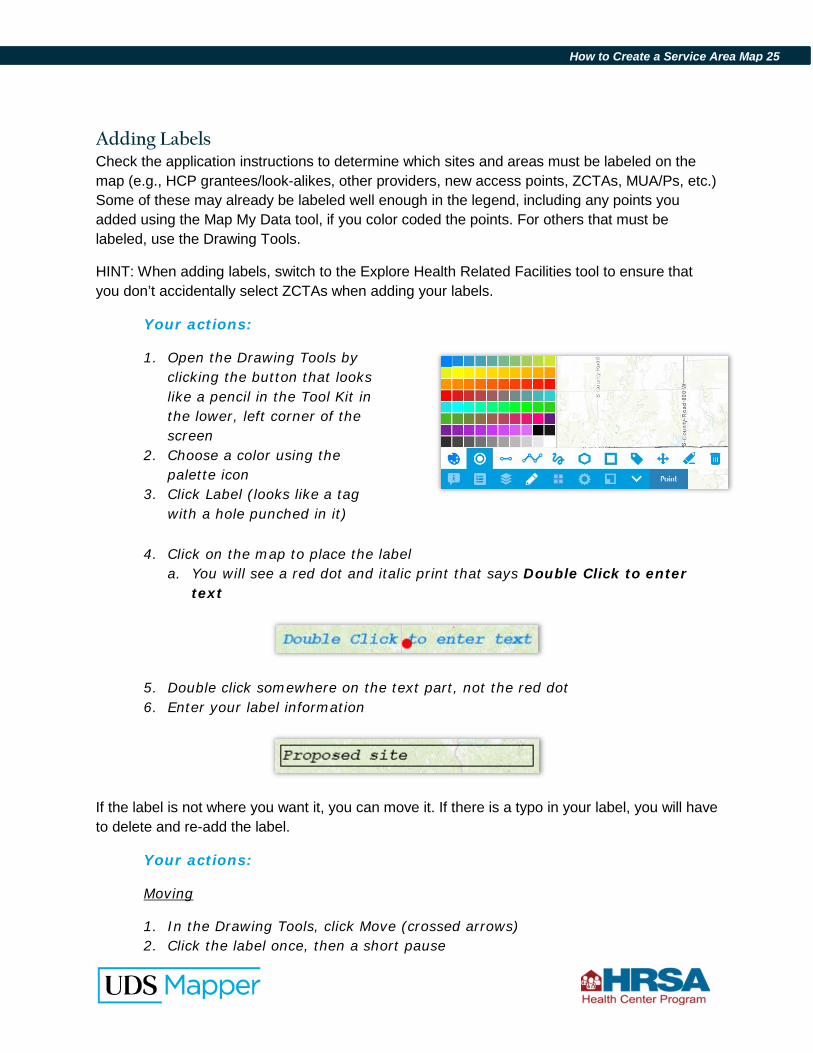
Adding Labels Check the application instructions to determine which sites and areas must be labeled on the map (e.g., HCP grantees/look-alikes, other providers, new access points, ZCTAs, MUA/Ps, etc.) Some of these may already be labeled well enough in the legend, including any points you added using the Map My Data tool, if you color coded the points. For others that must be labeled, use the Drawing Tools.
HINT: When adding labels, switch to the Explore Health Related Facilities tool to ensure that you don’t accidentally select ZCTAs when adding your labels.
Your actions:
1. Open the Drawing Tools by clicking the button that looks like a pencil in the Tool Kit in the lower, left corner of the screen
2. Choose a color using the palette icon
3. Click Label (looks like a tag with a hole punched in it)
4. Click on the map to place the label a. You will see a red dot and italic print that says Double Click to enter
text
5. Double click somewhere on the text part, not the red dot 6. Enter your label information
If the label is not where you want it, you can move it. If there is a typo in your label, you will have to delete and re-add the label.
Your actions:
Moving
1. In the Drawing Tools, click Move (crossed arrows) 2. Click the label once, then a short pause
How to Create a Service Area Map 26
3. Click and drag the label to where you want it
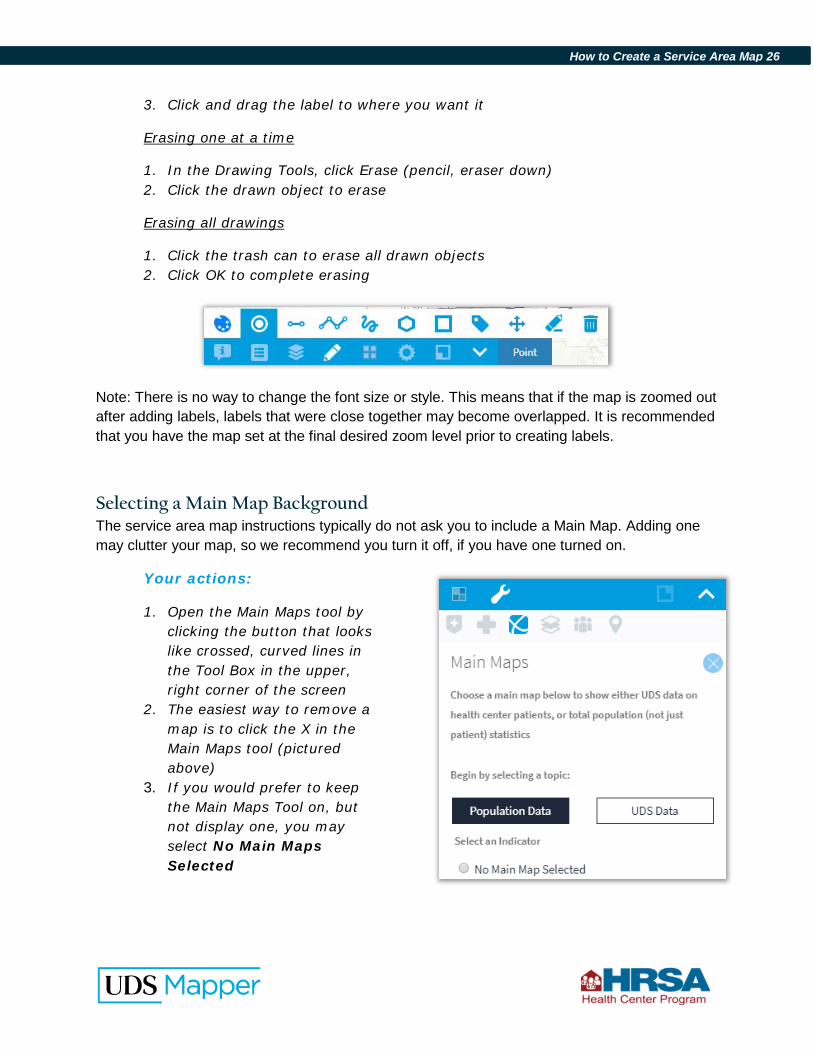
Erasing one at a time
1. In the Drawing Tools, click Erase (pencil, eraser down) 2. Click the drawn object to erase
Erasing all drawings
1. Click the trash can to erase all drawn objects 2. Click OK to complete erasing
Note: There is no way to change the font size or style. This means that if the map is zoomed out after adding labels, labels that were close together may become overlapped. It is recommended that you have the map set at the final desired zoom level prior to creating labels.
Selecting a Main Map Background The service area map instructions typically do not ask you to include a Main Map. Adding one may clutter your map, so we recommend you turn it off, if you have one turned on.
Your actions:
1. Open the Main Maps tool by clicking the button that looks like crossed, curved lines in the Tool Box in the upper, right corner of the screen
2. The easiest way to remove a map is to click the X in the Main Maps tool (pictured above)
3. If you would prefer to keep the Main Maps Tool on, but not display one, you may select No Main Maps Selected
How to Create a Service Area Map 27
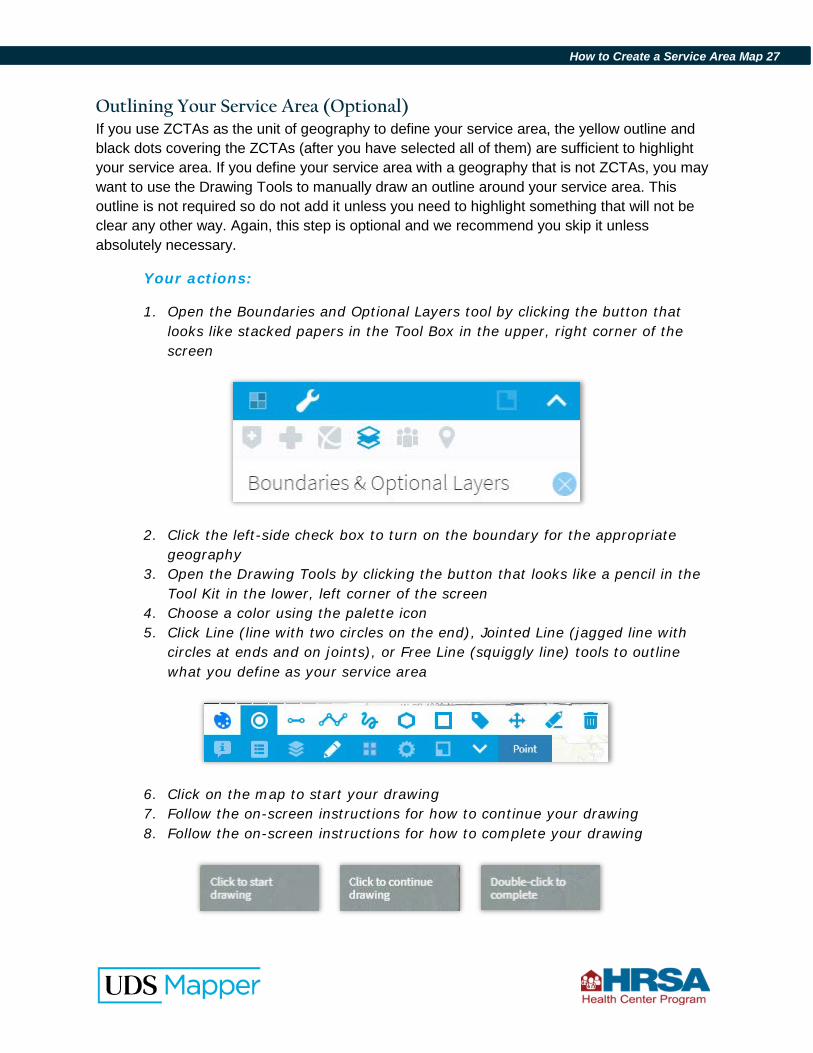
Outlining Your Service Area (Optional) If you use ZCTAs as the unit of geography to define your service area, the yellow outline and black dots covering the ZCTAs (after you have selected all of them) are sufficient to highlight your service area. If you define your service area with a geography that is not ZCTAs, you may want to use the Drawing Tools to manually draw an outline around your service area. This outline is not required so do not add it unless you need to highlight something that will not be clear any other way. Again, this step is optional and we recommend you skip it unless absolutely necessary.
Your actions:
1. Open the Boundaries and Optional Layers tool by clicking the button that looks like stacked papers in the Tool Box in the upper, right corner of the screen
2. Click the left-side check box to turn on the boundary for the appropriate geography
3. Open the Drawing Tools by clicking the button that looks like a pencil in the Tool Kit in the lower, left corner of the screen
4. Choose a color using the palette icon 5. Click Line (line with two circles on the end), Jointed Line (jagged line with
circles at ends and on joints), or Free Line (squiggly line) tools to outline what you define as your service area
6. Click on the map to start your drawing 7. Follow the on-screen instructions for how to continue your drawing 8. Follow the on-screen instructions for how to complete your drawing
How to Create a Service Area Map 28
Your final outline may be comprised of several different types of shapes (lines, jointed lines, free lines), so be sure to pick the best tool for each contour. Because it is easy to make a mistake, we recommend connecting shorter lines to complete the outline. that way if you make a mistake, you only need to erase a portion of the outline and not the whole thing. It will be difficult to move a mistake to make it fit properly, but you can try.
Your actions:
Moving
1. In the Drawing Tools, click Move (crossed arrows) 2. Click the drawn object once, then a short pause 3. Click and drag the drawn object to where you want it
Erasing one at a time
1. In the Drawing Tools, click Erase (pencil, eraser down) 2. Click the drawn object to erase
Erasing all drawings
1. Click the trash can to erase all drawn objects 2. Click OK to complete erasing
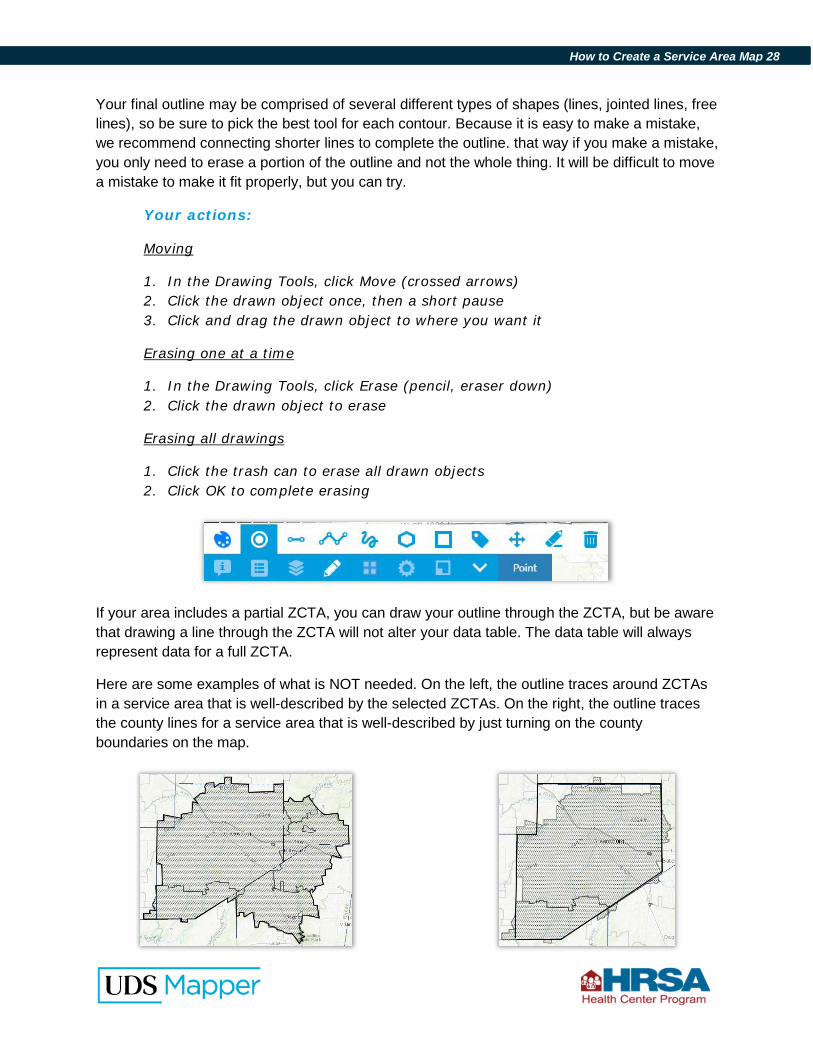
If your area includes a partial ZCTA, you can draw your outline through the ZCTA, but be aware that drawing a line through the ZCTA will not alter your data table. The data table will always represent data for a full ZCTA.
Here are some examples of what is NOT needed. On the left, the outline traces around ZCTAs in a service area that is well-described by the selected ZCTAs. On the right, the outline traces the county lines for a service area that is well-described by just turning on the county boundaries on the map.
How to Create a Service Area Map 29
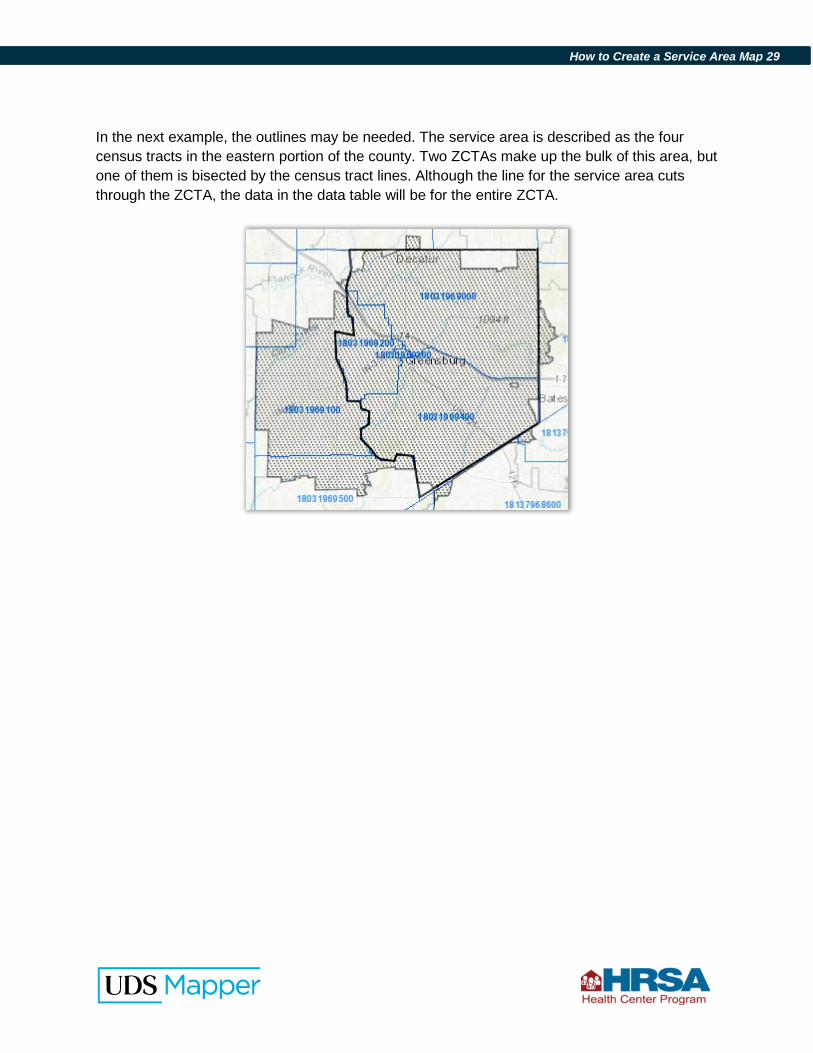
In the next example, the outlines may be needed. The service area is described as the four census tracts in the eastern portion of the county. Two ZCTAs make up the bulk of this area, but one of them is bisected by the census tract lines. Although the line for the service area cuts through the ZCTA, the data in the data table will be for the entire ZCTA.
How to Create a Service Area Map 30
Creating a Data Table
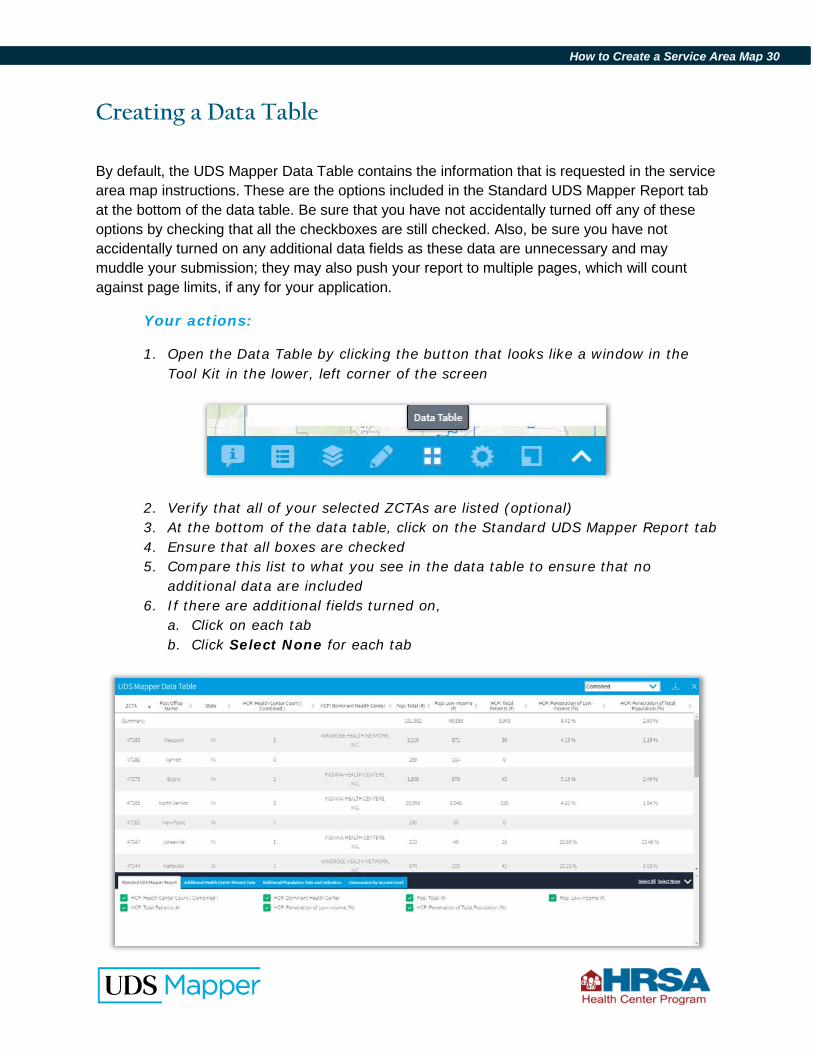
By default, the UDS Mapper Data Table contains the information that is requested in the service area map instructions. These are the options included in the Standard UDS Mapper Report tab at the bottom of the data table. Be sure that you have not accidentally turned off any of these options by checking that all the checkboxes are still checked. Also, be sure you have not accidentally turned on any additional data fields as these data are unnecessary and may muddle your submission; they may also push your report to multiple pages, which will count against page limits, if any for your application.
Your actions:
1. Open the Data Table by clicking the button that looks like a window in the Tool Kit in the lower, left corner of the screen
2. Verify that all of your selected ZCTAs are listed (optional) 3. At the bottom of the data table, click on the Standard UDS Mapper Report tab 4. Ensure that all boxes are checked 5. Compare this list to what you see in the data table to ensure that no
additional data are included 6. If there are additional fields turned on,
a. Click on each tab b. Click Select None for each tab
How to Create a Service Area Map 31
Saving Your Completed Map and Data Table as a Document
Now that you have your map and data table created, you need to get them out of the UDS Mapper. You can either print/save (option A) or do screen captures (option B).
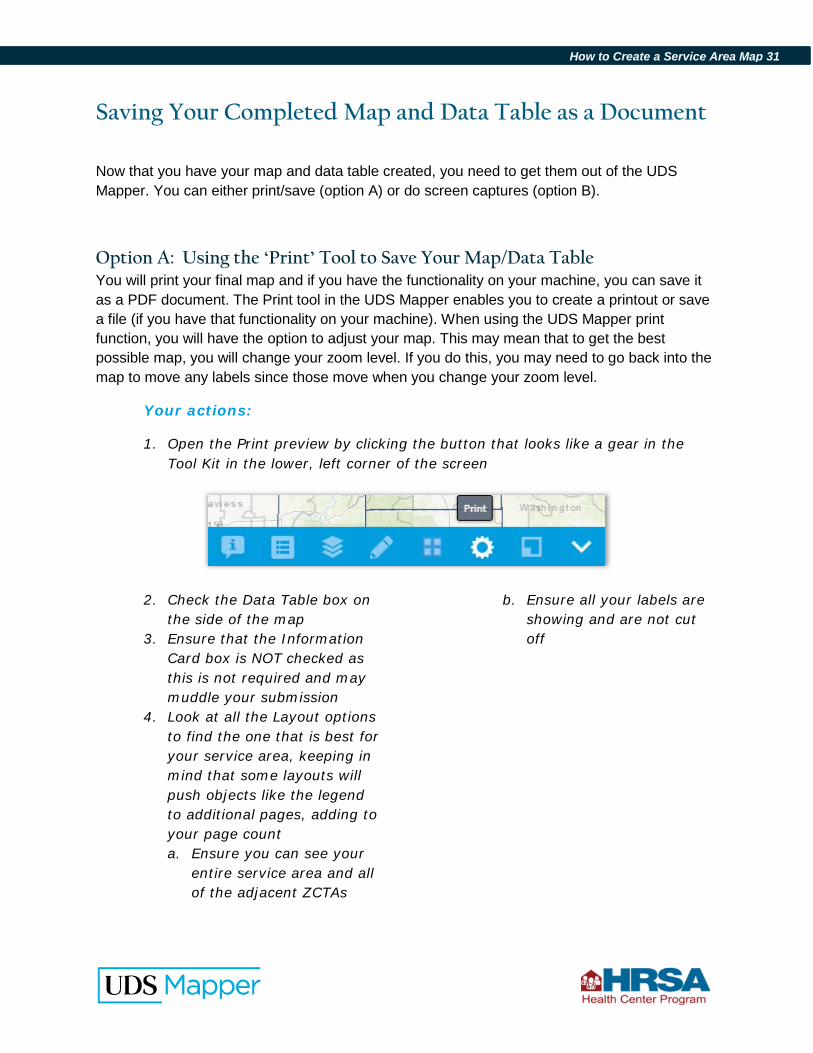
Option A: Using the ‘Print’ Tool to Save Your Map/Data Table You will print your final map and if you have the functionality on your machine, you can save it as a PDF document. The Print tool in the UDS Mapper enables you to create a printout or save a file (if you have that functionality on your machine). When using the UDS Mapper print function, you will have the option to adjust your map. This may mean that to get the best possible map, you will change your zoom level. If you do this, you may need to go back into the map to move any labels since those move when you change your zoom level.
Your actions:
1. Open the Print preview by clicking the button that looks like a gear in the Tool Kit in the lower, left corner of the screen
2. Check the Data Table box on the side of the map
3. Ensure that the Information Card box is NOT checked as this is not required and may muddle your submission
4. Look at all the Layout options to find the one that is best for your service area, keeping in mind that some layouts will push objects like the legend to additional pages, adding to your page count a. Ensure you can see your
entire service area and all of the adjacent ZCTAs
b. Ensure all your labels are showing and are not cut off
How to Create a Service Area Map 32
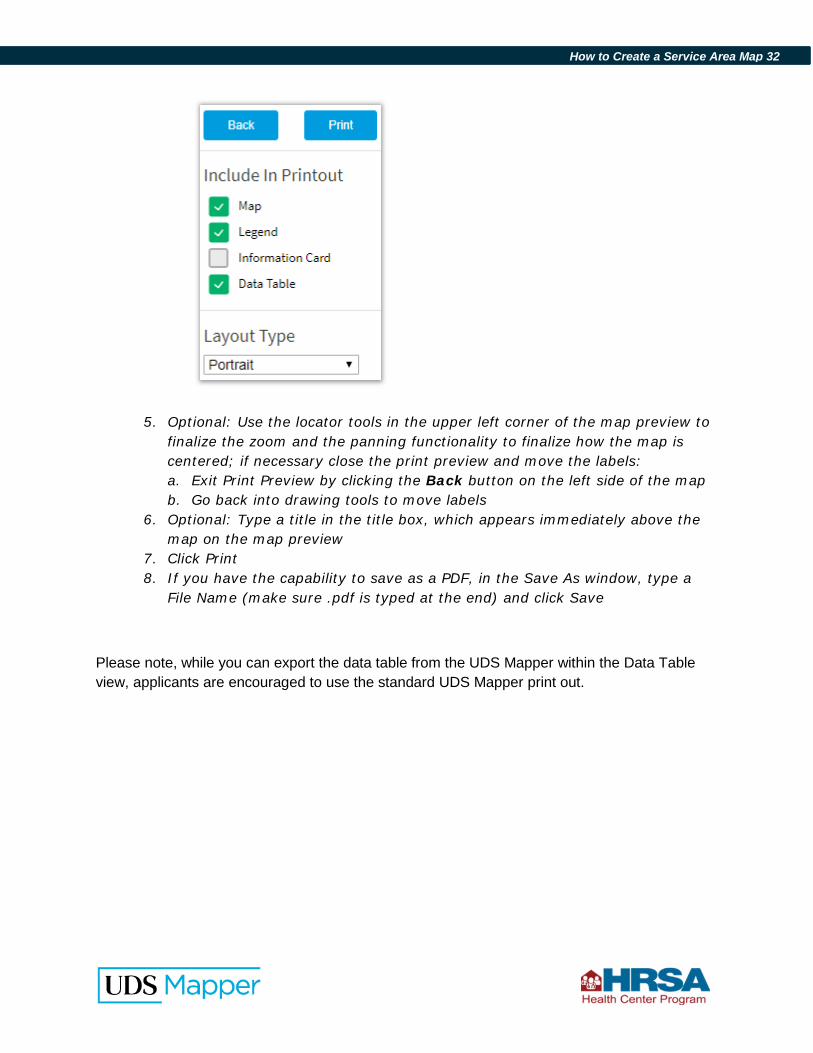
5. Optional: Use the locator tools in the upper left corner of the map preview to
finalize the zoom and the panning functionality to finalize how the map is centered; if necessary close the print preview and move the labels: a. Exit Print Preview by clicking the Back button on the left side of the map b. Go back into drawing tools to move labels
6. Optional: Type a title in the title box, which appears immediately above the map on the map preview
7. Click Print 8. If you have the capability to save as a PDF, in the Save As window, type a
File Name (make sure .pdf is typed at the end) and click Save
Please note, while you can export the data table from the UDS Mapper within the Data Table view, applicants are encouraged to use the standard UDS Mapper print out.
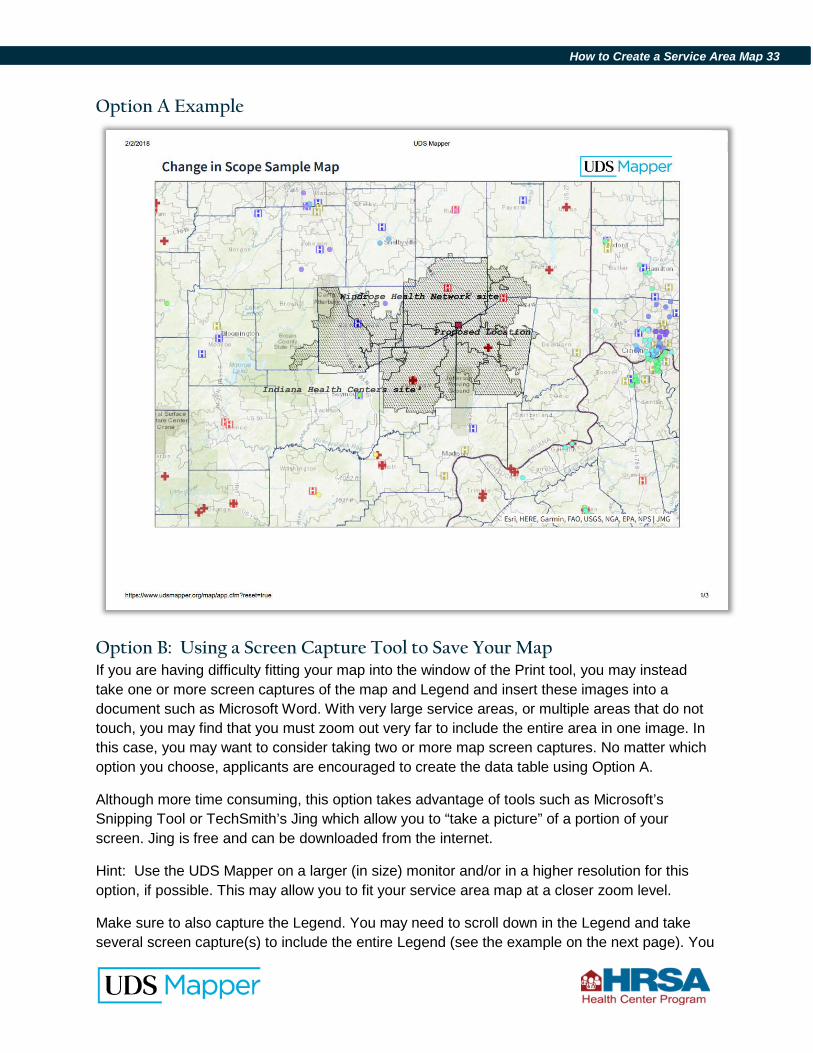
How to Create a Service Area Map 33
Option A Example
Option B: Using a Screen Capture Tool to Save Your Map If you are having difficulty fitting your map into the window of the Print tool, you may instead take one or more screen captures of the map and Legend and insert these images into a document such as Microsoft Word. With very large service areas, or multiple areas that do not touch, you may find that you must zoom out very far to include the entire area in one image. In this case, you may want to consider taking two or more map screen captures. No matter which option you choose, applicants are encouraged to create the data table using Option A.
Although more time consuming, this option takes advantage of tools such as Microsoft’s Snipping Tool or TechSmith’s Jing which allow you to “take a picture” of a portion of your screen. Jing is free and can be downloaded from the internet.
Hint: Use the UDS Mapper on a larger (in size) monitor and/or in a higher resolution for this option, if possible. This may allow you to fit your service area map at a closer zoom level.
Make sure to also capture the Legend. You may need to scroll down in the Legend and take several screen capture(s) to include the entire Legend (see the example on the next page). You
How to Create a Service Area Map 34
could even take individual screenshots of the legend items to customize placement on your final document.
Your actions:
1. Using your screen capture software, take an image of your service area including all ZCTAs and all adjacent ZCTAs
2. Using your screen capture software, take images of the legend a. We recommend taking separate images of each legend entry so that the
legend isn’t clunky when you add it to your document 3. Insert these images into your document and place them as desired to create
a final map with legend 4. Using the Print tool, print/save the data table for the service area
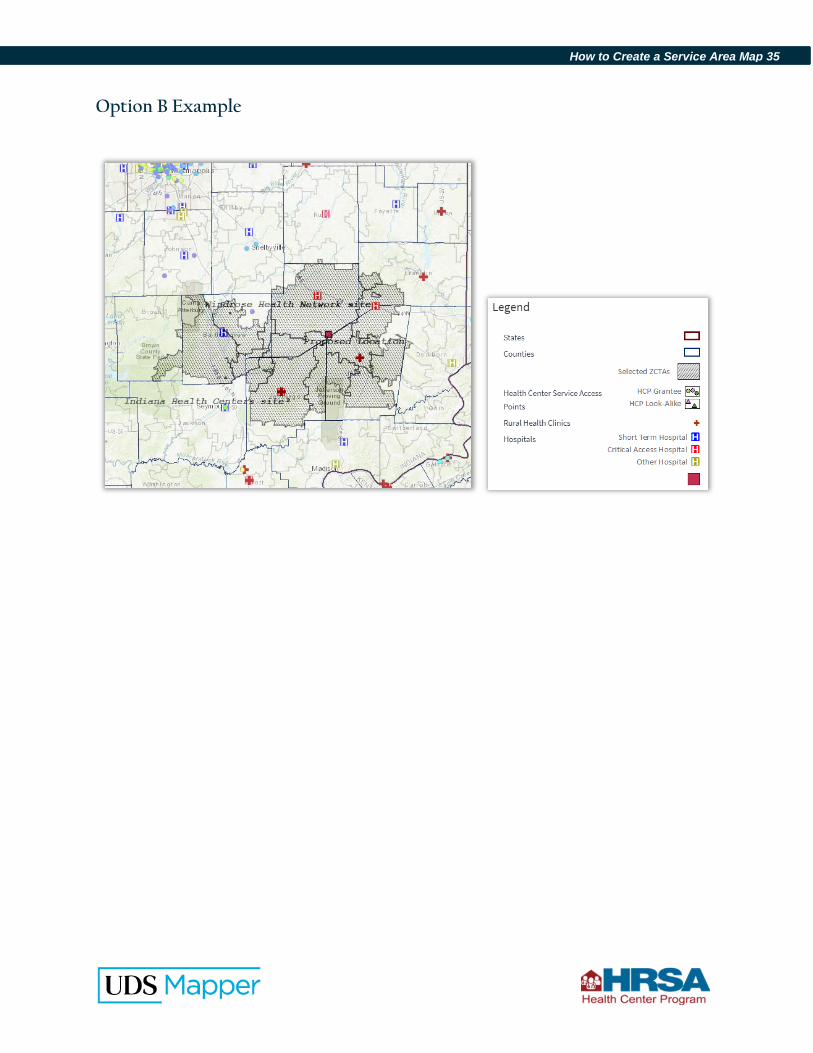
How to Create a Service Area Map 35
Option B Example