Embed Size (px)
Citation preview
- 1 -
Use and Experience ofGas Turbine On-line Diagnostics
Michael Scheidel,
Karlheinz Bender, Dr. Robert Taud
Siemens AG, Power Generation, Germany
0 Abstract
Ten years ago Gas Turbine (GT) Diagnostic Systems were ordered in less then 10 % of new
units. Today this has changed dramatically; almost all newly ordered gas turbines are
equipped with at least a basic Diagnostic System. A main reason is the constantly progressing
gas turbine technology.
To minimize the risk for vendor and customer, diagnostic benefit starts from the beginning of
gas turbine life time with product development and engineering, continues during plant shop
test, commissioning, acceptance test and warranty period and closes the loop with mainte-
nance and service .
- 1 -
The modular WIN_TS Diagnostic System connected to the I&C System has access to any of
the sensors and obtains between 300 and 1000 signals. Additionally to these signals with the
highest resolution of 1s, a high speed data acquisition for selected signals is included for ana-
logue and for binary signal analysis down to milliseconds. Together with Database, Archive
and Remote Access, these is the basic system frame, on top of which there are various tech-
nology modules.
There are for example thermodynamic, hot gas path, vibration and component life cycle
modules available for analysis and diagnostics.
Through remote access, the system is connected to a Diagnostic Center from which it is
commissioned and to where it sends data via a data container . By means of the Diagnostic
Center, the experts have the possibility to support any critical situation during commissioning
or service. Just some mouse clicks enable them to obtain data from gas turbines all over the
world.
The operating data taken from the Win_TS system are also very important for generation of
availability and reliability figures as well as fleet statistics.
Based on the evaluation of different vibration parameters out of Win_TS it is also possible to
contact engineering for support and remedies. Examples show how engineering advises in-
spections and how the early knowledge of the unit condition can significantly help to im-
prove the unit availability.
For the customer it is important to have access to the knowledge of the developers of his gas
turbine in critical situations through a diagnostic platform.
For the supplier the highest value is live feedback from his own „running technological sys-
tems“ in order to to optimize learning.
- 1 -
1 Power Plant Market and Role of Advanced Monitoring and Diagnostics Systems
In all world regions, the power generation market has been characterized in recent years by its
orientation towards utilization of gas turbines, both as simple cycle and combined cycle plant
applications. In these plant configuration, both proven or advanced gas turbines represent the
high tech piece of equipment at the core of the plant. Regardless of the overall plant configu-
ration and other extended equipment installed, the Return on Investment ultimately hinges on
the gas turbine. Hence it is essential to focus on this crucial core component.
One lever to do this is to employ advanced Monitoring and Diagnostics Technology. The ap-
proach presented in this paper was fully developed and implemented over recent years, in-
cluding input and feedback both from customers and gas turbine development. The goal is to
maximize investment security and returns throughout the complete plant life cycle. The criti-
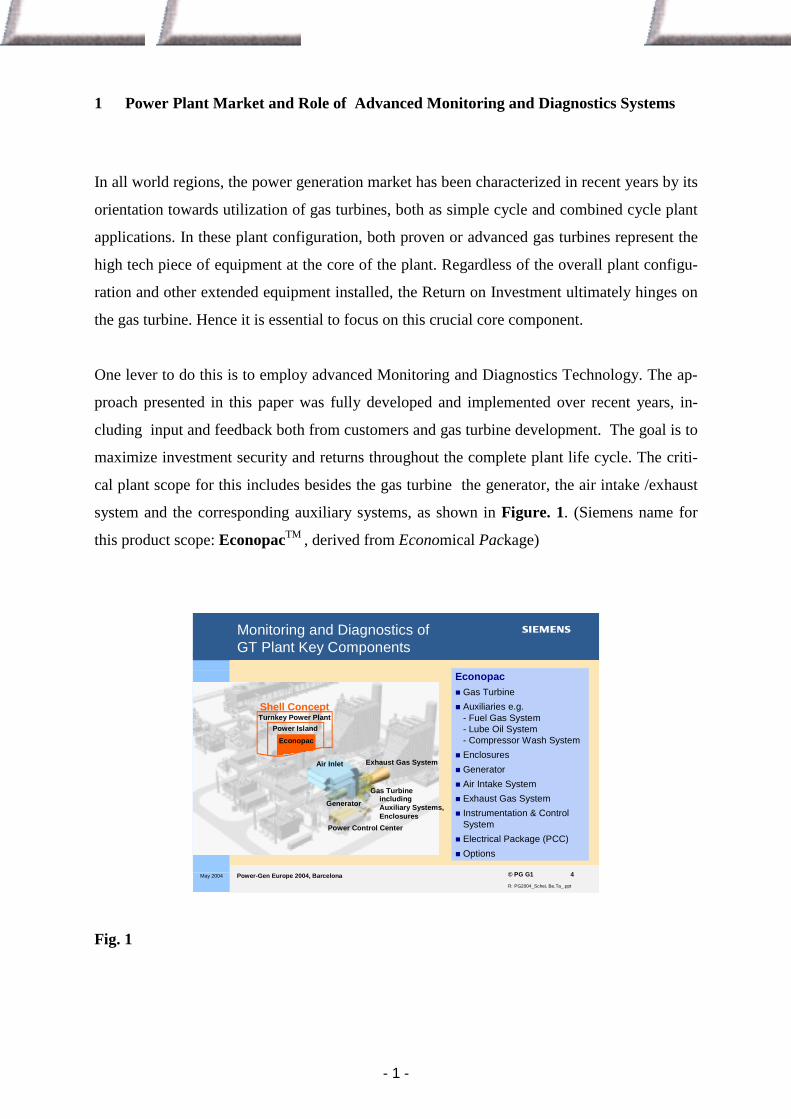
cal plant scope for this includes besides the gas turbine the generator, the air intake /exhaust
system and the corresponding auxiliary systems, as shown in Figure. 1. (Siemens name for
this product scope: EconopacTM , derived from Economical Package)
May 2004 © PG G1 4
R: PG2004_Schei, Be,Ta_.ppt
Power-Gen Europe 2004, Barcelona
Monitoring and Diagnostics ofGT Plant Key Components
Econopac� Gas Turbine� Auxiliaries e.g.
- Fuel Gas System - Lube Oil System- Compressor Wash System
� Enclosures� Generator� Air Intake System� Exhaust Gas System� Instrumentation & Control
System� Electrical Package (PCC)� Options
Shell ConceptTurnkey Power Plant
Power IslandEconopac
Air Inlet
Gas Turbine
Generator
Power Control Center
Exhaust Gas System
includingAuxiliary Systems,Enclosures
Fig. 1
- 1 -
Presented here, Monitoring and Diagnostics applied to the Econopac is the tool to back the
customer’s key generation technology and investment with matching state-of-the-art support
technology and processes. In essence it is advanced life-time support based on a high-tech
platform for monitoring, diagnostics and service, contributing to achieve high reliability.
May 2004 © PG G1 5
R: PG2004_Schei, Be,Ta_.ppt
Power-Gen Europe 2004, Barcelona
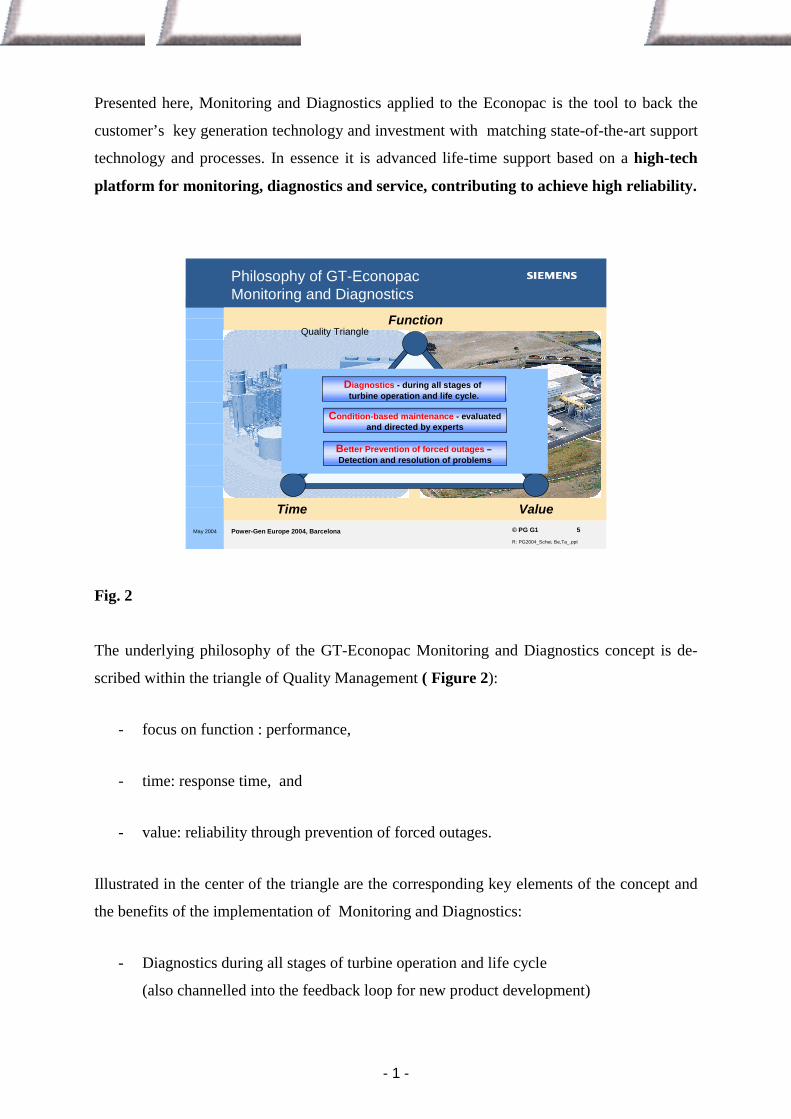
Philosophy of GT-Econopac Monitoring and Diagnostics
Function
Time Value
Diagnostics - during all stages of turbine operation and life cycle.
Condition-based maintenance - evaluatedand directed by experts
Better Prevention of forced outages –Detection and resolution of problems
Quality Triangle
Fig. 2
The underlying philosophy of the GT-Econopac Monitoring and Diagnostics concept is de-
scribed within the triangle of Quality Management ( Figure 2):
- focus on function : performance,
- time: response time, and
- value: reliability through prevention of forced outages.
Illustrated in the center of the triangle are the corresponding key elements of the concept and
the benefits of the implementation of Monitoring and Diagnostics:
- Diagnostics during all stages of turbine operation and life cycle
(also channelled into the feedback loop for new product development)
- 1 -
- Condition-based maintenance evaluated and directed by experts
- Detection and resolution of problems, more effective prevention of forced outages
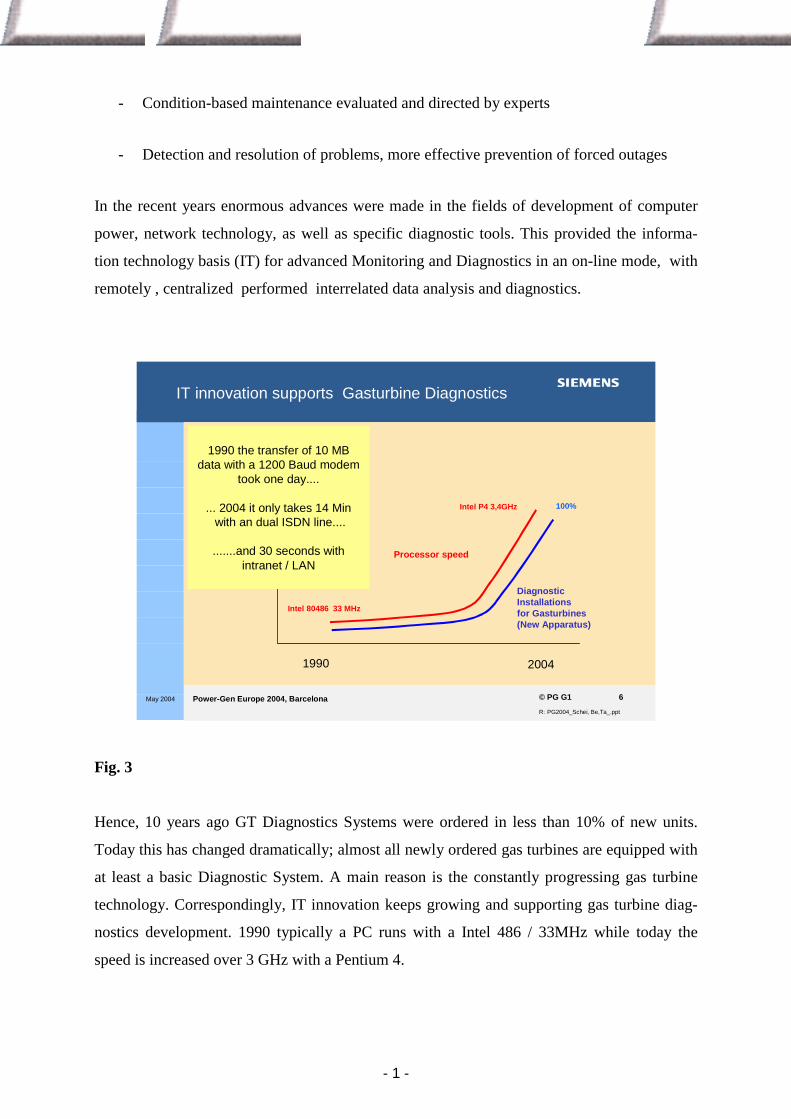
In the recent years enormous advances were made in the fields of development of computer
power, network technology, as well as specific diagnostic tools. This provided the informa-
tion technology basis (IT) for advanced Monitoring and Diagnostics in an on-line mode, with
remotely , centralized performed interrelated data analysis and diagnostics.
May 2004 © PG G1 6
R: PG2004_Schei, Be,Ta_.ppt
Power-Gen Europe 2004, Barcelona
% of GT (New Apparatus)
GHz ProcessorSpeed
IT innovation supports Gasturbine Diagnostics
Intel 80486 33 MHz
1990 2004
Intel P4 3,4GHz
Diagnostic Installationsfor Gasturbines(New Apparatus)
Processor speed
1990 the transfer of 10 MBdata with a 1200 Baud modem
took one day....
... 2004 it only takes 14 Minwith an dual ISDN line....
.......and 30 seconds with intranet / LAN
100%
Fig. 3
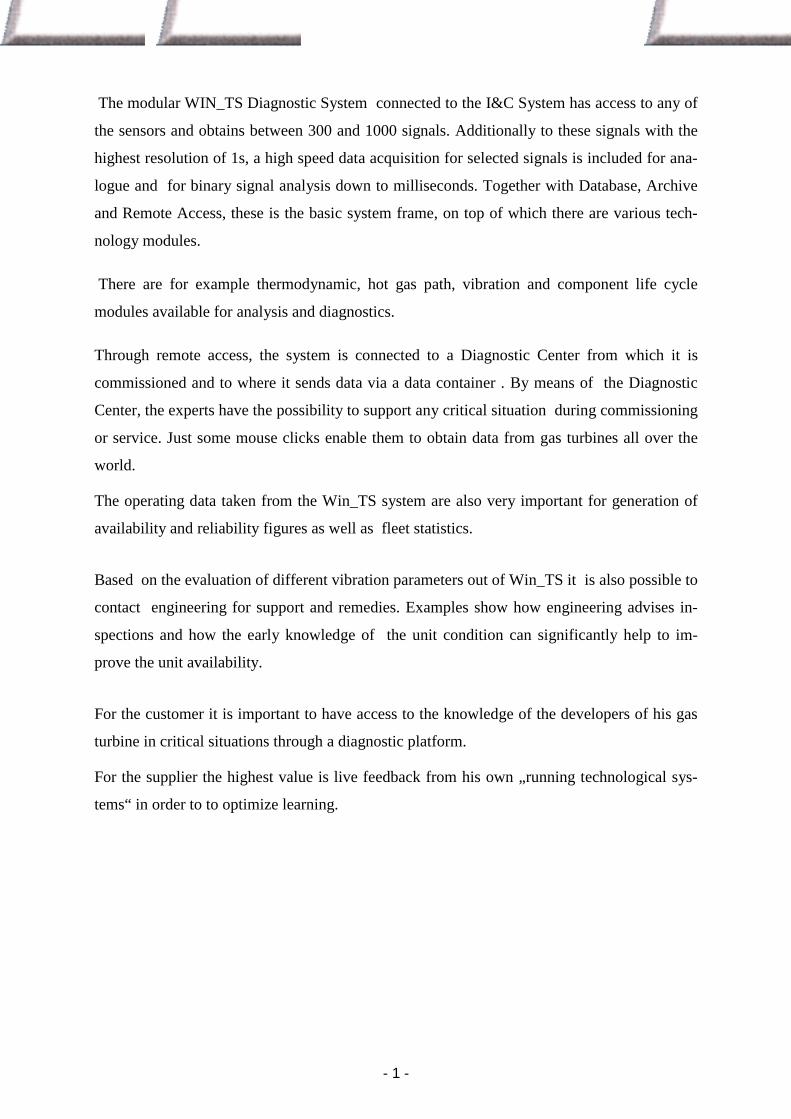
Hence, 10 years ago GT Diagnostics Systems were ordered in less than 10% of new units.
Today this has changed dramatically; almost all newly ordered gas turbines are equipped with
at least a basic Diagnostic System. A main reason is the constantly progressing gas turbine
technology. Correspondingly, IT innovation keeps growing and supporting gas turbine diag-
nostics development. 1990 typically a PC runs with a Intel 486 / 33MHz while today the
speed is increased over 3 GHz with a Pentium 4.
- 1 -
For example, 1990 the transfer of 10 MB data with a 1200 Baud modem took one day, 2004
it only takes 14 minutes with a dual ISDN line and just 30 seconds with intranet/LAN con-
nection. 10 MB is today a typical day file size for gas turbine data witch is transferred be-
tween fields and offices.
Figure 3 shows the increase of processor speed and Gas turbine Diagnostics installations in
new units.
2 Diagnostic System Platform: Task and Concept
May 2004 © PG G1 8
R: PG2004_Schei, Be,Ta_.ppt
Power-Gen Europe 2004, Barcelona
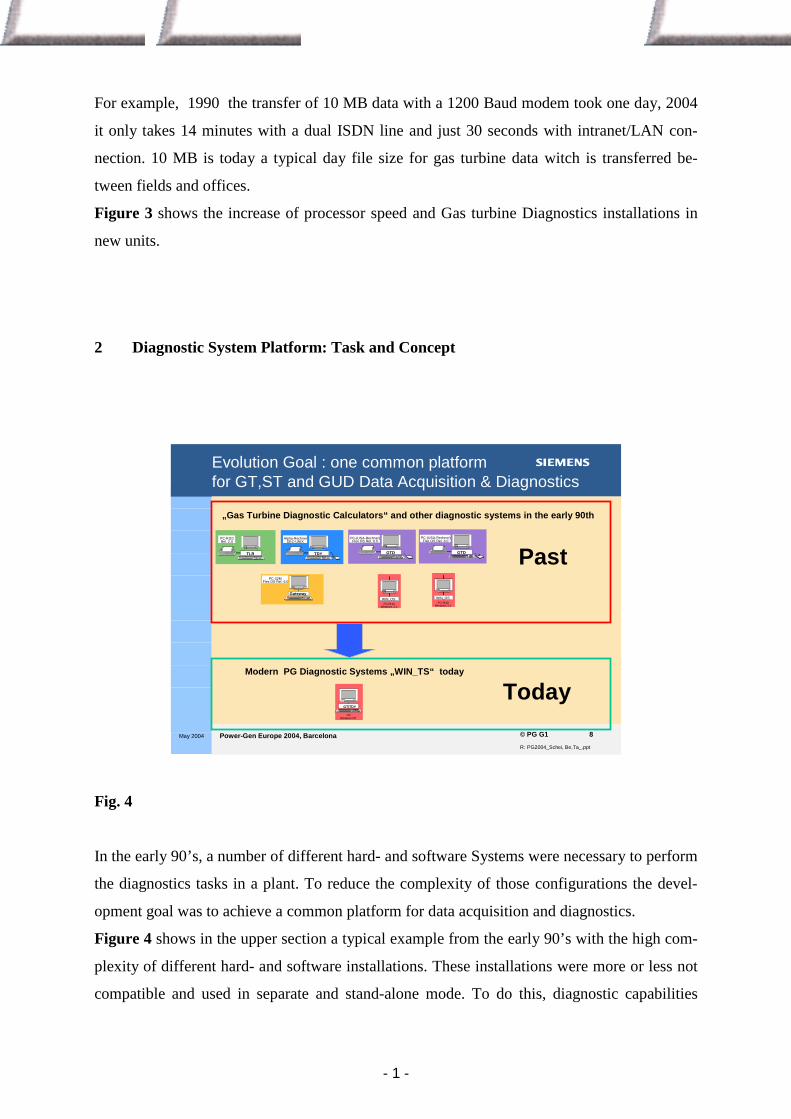
Evolution Goal : one common platformfor GT,ST and GUD Data Acquisition & Diagnostics
„Gas Turbine Diagnostic Calculators“ and other diagnostic systems in the early 90th
Modern PG Diagnostic Systems „WIN_TS“ today
PC-(USA-Rechner)Flex OS Rel. 6.0
GTD
WIN_OSPC-RI40
Windows 3.1
WIN_OSPC-RI40
Windows 3.1
Alpha-RechnerDEC-UNIX
PC-RI20Rel. 2.X
PC-32MFlex OS Rel. 6.0
Gateway
PC-(USA-Rechner)Flex OS Rel. 6.0
GTDTLR TDY Past
PCWindows NT
GT/TDY
Today
Fig. 4
In the early 90’s, a number of different hard- and software Systems were necessary to perform
the diagnostics tasks in a plant. To reduce the complexity of those configurations the devel-
opment goal was to achieve a common platform for data acquisition and diagnostics.
Figure 4 shows in the upper section a typical example from the early 90’s with the high com-
plexity of different hard- and software installations. These installations were more or less not
compatible and used in separate and stand-alone mode. To do this, diagnostic capabilities
- 1 -
were limited, time consuming and required a high formal software and hardware competence.
Shown in the lower section is the example for today, with the reached development goal,
while profit could be taken from the information technology evolution. Through one common
platform we can handle these different analysis and diagnostics tasks. In addition new diag-
nostic functions were incorporated in the same manner. One Windows-PC now exceeds the
tasks which were then performed by a number of computer devices.
May 2004 © PG G1 9
R: PG2004_Schei, Be,Ta_.ppt
Power-Gen Europe 2004, Barcelona
Diagnostic System Platform -one host for all Technologies
- Central access to all analysis modules - Integration of 3rd party products- Synergy and cost reduction of equipment and tools- Combination of different data in one database- One evaluation tool for technologists
Fig. 5
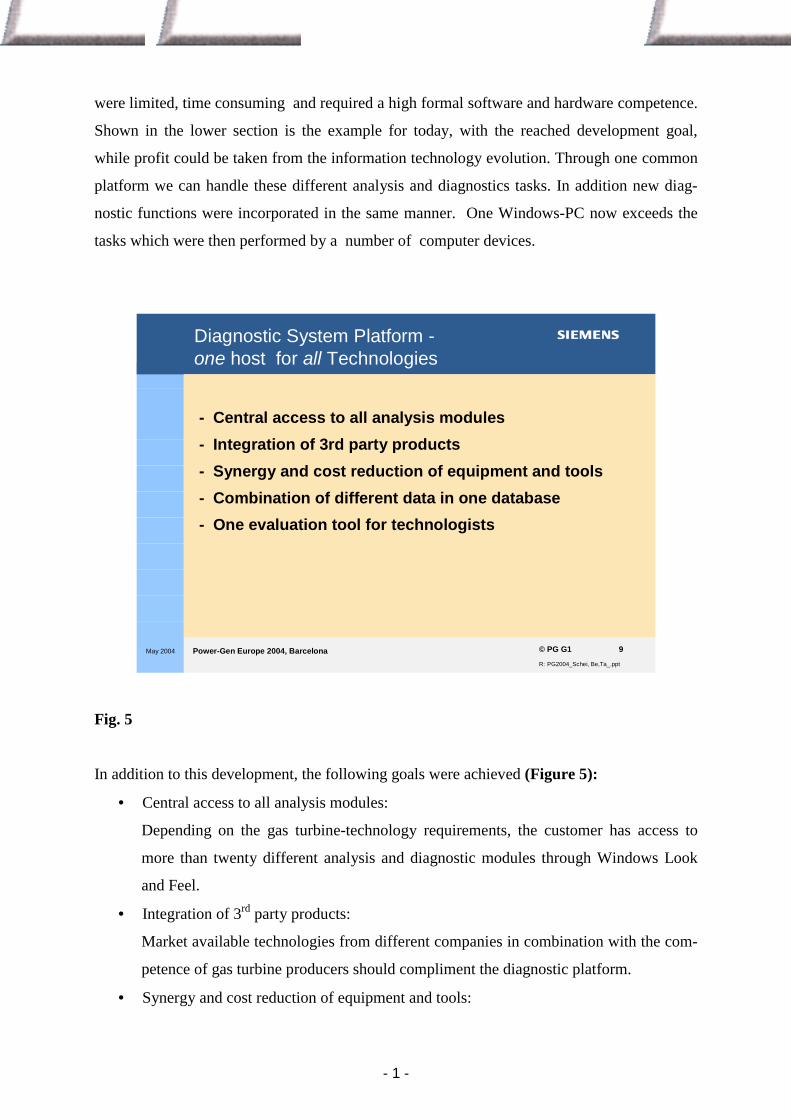
In addition to this development, the following goals were achieved (Figure 5):
• Central access to all analysis modules:
Depending on the gas turbine-technology requirements, the customer has access to
more than twenty different analysis and diagnostic modules through Windows Look
and Feel.
• Integration of 3rd party products:
Market available technologies from different companies in combination with the com-
petence of gas turbine producers should compliment the diagnostic platform.
• Synergy and cost reduction of equipment and tools:
- 1 -
Less hardware and software equipment, along with less administration effort provides
synergy and cost reduction and prevent computer farms around a gas turbine.
• Combination of different data in one database:
Combination of different data in one database allows more complex and interrelated
data conditioning, analysis and diagnostics.
• One evaluation tool for technologists:
There is a common tool used by the technologists for visual evaluation of different
kinds of data. This allows easy handling and focus on the technological evaluation and
interpretation.
May 2004 © PG G1 11
R: PG2004_Schei, Be,Ta_.ppt
Power-Gen Europe 2004, Barcelona
Typical Application GT On-line Monitoring and Diagnostics
GT experience reports
Bearing temperature
max. OTC after ignitionPre event recorder Operation hour counter
Operation logs
Temperature distribution
Step change vibration
Acoustics Analysis
Vibration Analysis
Humming
Thermodynamic GT
Coastdown time
Fig. 6
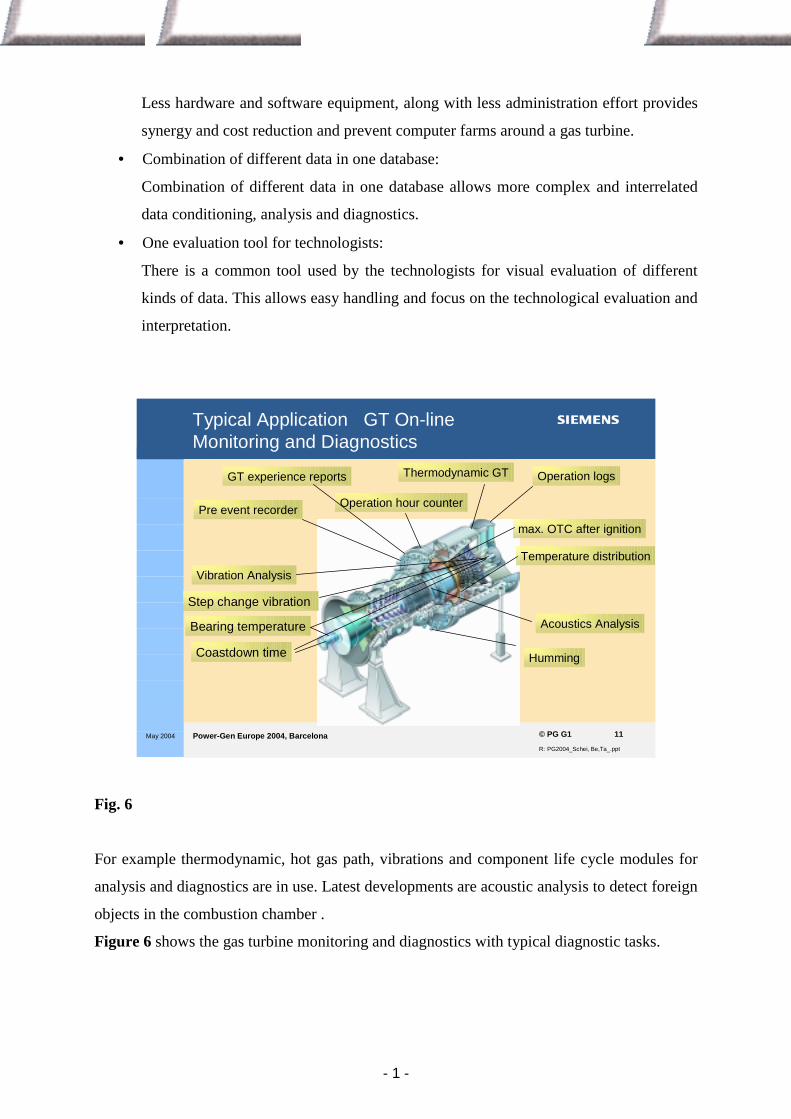
For example thermodynamic, hot gas path, vibrations and component life cycle modules for
analysis and diagnostics are in use. Latest developments are acoustic analysis to detect foreign
objects in the combustion chamber .
Figure 6 shows the gas turbine monitoring and diagnostics with typical diagnostic tasks.
- 1 -
May 2004 © PG G1 12
R: PG2004_Schei, Be,Ta_.ppt
Power-Gen Europe 2004, Barcelona
GT experience reports
Bearing temperature
max. OTC after ignitionPre event recorder Operation hour counter
Operation logs
Temperature distribution
Step change vibration
Acoustics Analysis
Vibration Analysis
Humming
Thermodynamic GT
Coastdown time
Windows NT
WIN_TS
Conceptional Goal:Integration off all Diagnostic Technologies
all diagnostic technologies into one
platform.
Fig. 7
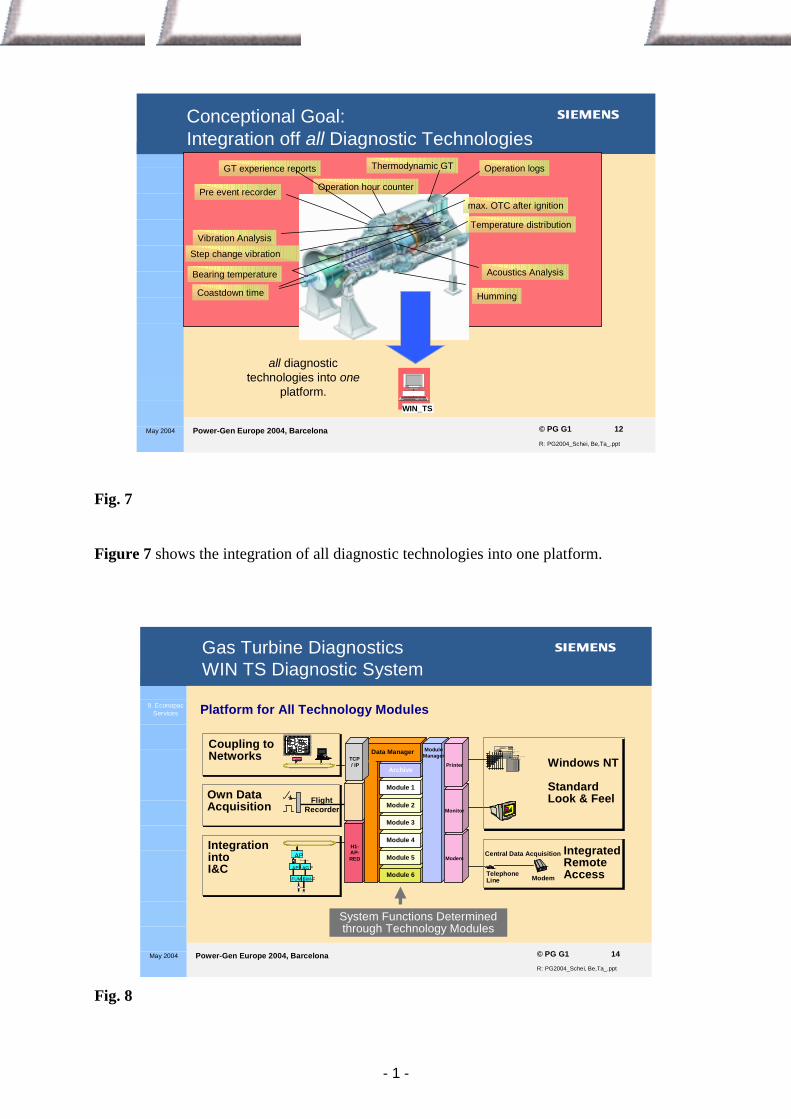
Figure 7 shows the integration of all diagnostic technologies into one platform.
May 2004 © PG G1 14
R: PG2004_Schei, Be,Ta_.ppt
Power-Gen Europe 2004, Barcelona
System Functions Determinedthrough Technology Modules
IntegrationintoI&C
AP
AG FAPF
FUM-FSIM-F
H1-AP-RED
Own DataAcquisition Flight
Recorder
Module 6
Module 5
Module 4
Module 3
Module 2
Module 1
Archive
Data Manager ModuleManager
Modem
Central Data Acquisition
Telephone Line
IntegratedRemoteAccess
Modem
ACCOU NTS RECEIVABLE LEDGER
Windows NT
StandardLook & Feel
ACCOU NT NO.SHEE T NO.
DATE INVO ICE NUMBER/DES CRIPTIONCHARG ESC REDITSBALANCEBALANCE FOR WARD
TERMS:
DATEACCO UNT NUMBER
(PLEASE DETACH AND RETU RN WITH YOUR RE MITTANCE)
PAY TH IS AMOUNT
DATE CHAR GES AND CREDITS BALANCEBALAN CE FORWARD
YOUR NAME H ERE123 EASY STRE ETDOWN TOWN, A LT. 00000PHONE 987/123 -4567
AMOUNT ENCLOSED $
Monitor
Printer
Coupling toNetworks
T T
T T
PM
OT TCP / IP
Gas Turbine DiagnosticsWIN TS Diagnostic System
Platform for All Technology Modules9. Econopac Services
Fig. 8
- 1 -
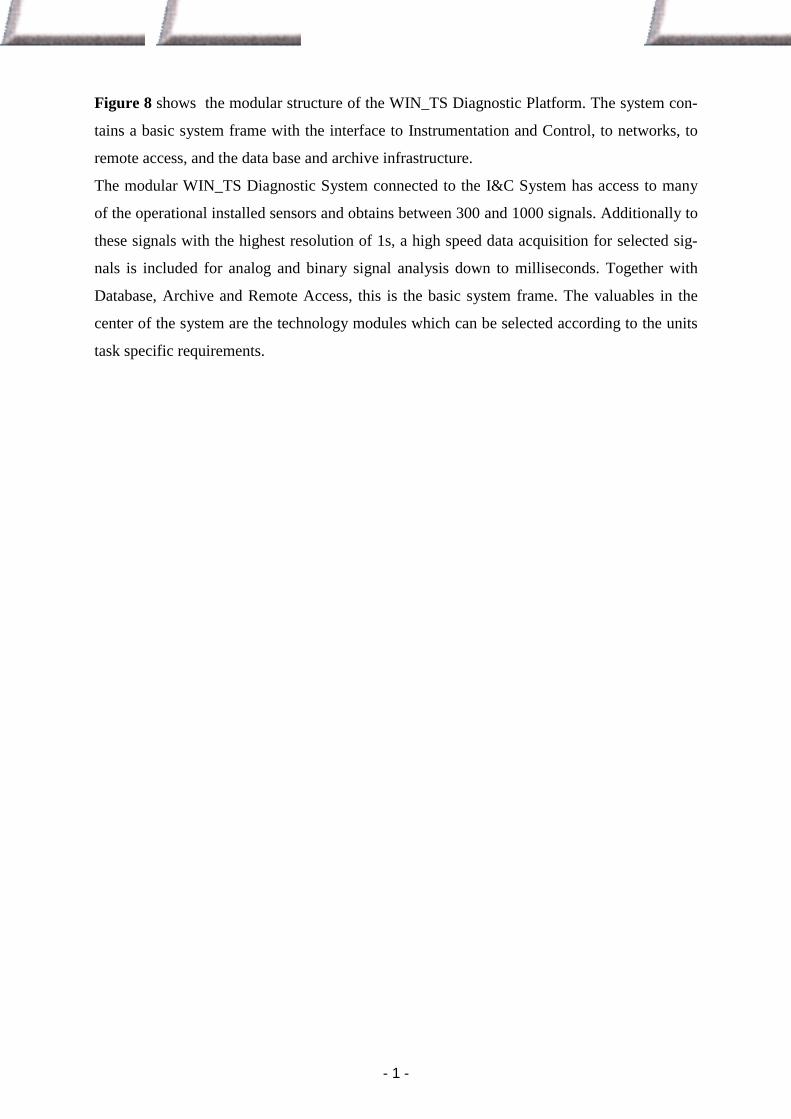
Figure 8 shows the modular structure of the WIN_TS Diagnostic Platform. The system con-
tains a basic system frame with the interface to Instrumentation and Control, to networks, to
remote access, and the data base and archive infrastructure.
The modular WIN_TS Diagnostic System connected to the I&C System has access to many
of the operational installed sensors and obtains between 300 and 1000 signals. Additionally to
these signals with the highest resolution of 1s, a high speed data acquisition for selected sig-
nals is included for analog and binary signal analysis down to milliseconds. Together with
Database, Archive and Remote Access, this is the basic system frame. The valuables in the
center of the system are the technology modules which can be selected according to the units
task specific requirements.
- 1 -
3. Diagnostic Network Operation: Configuration and Implementation
of the Feedback Cycle
May 2004 © PG G1 18
R: PG2004_Schei, Be,Ta_.ppt
Power-Gen Europe 2004, Barcelona
Network Configuration
On-Site Data AcquisitionLocal Data ArchiveLocal Diagnostic
Centralized DatabaseAdvanced DiagnosticsTechnical Experts
Vibration
Acoustics
Flugschreiber
Orlando
Erlangen
Periodic TransferEvent Based Notification
Fig. 9
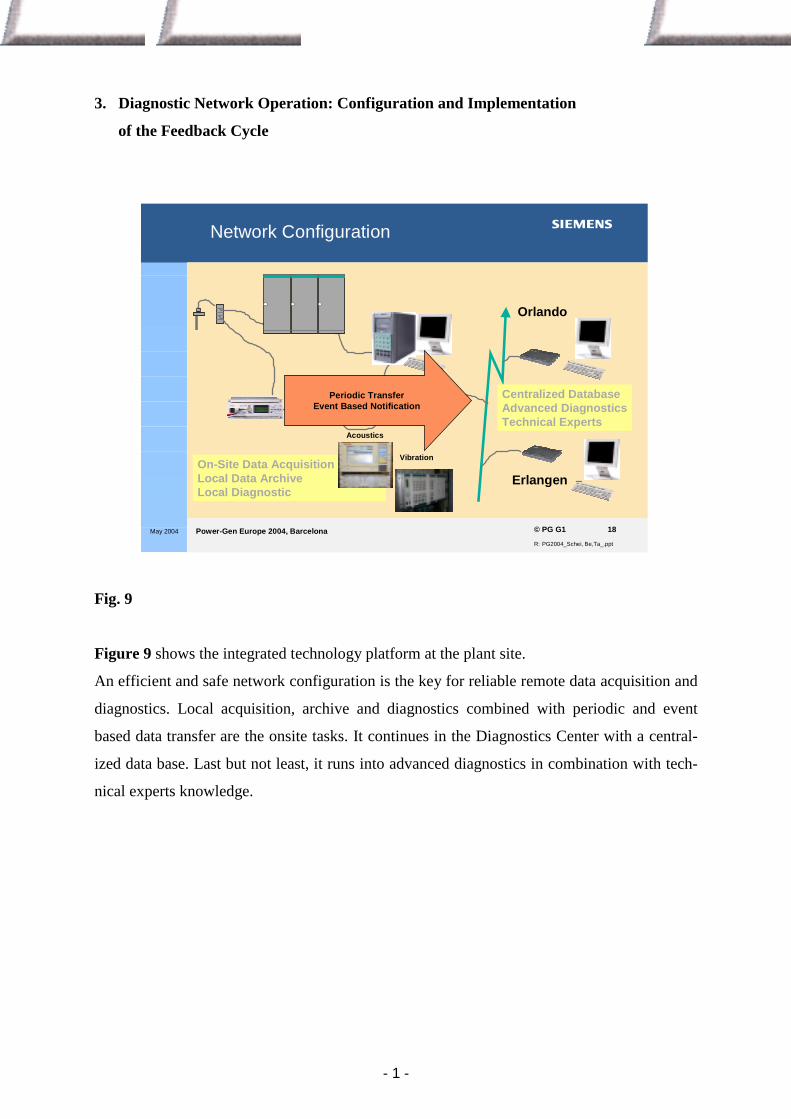
Figure 9 shows the integrated technology platform at the plant site.
An efficient and safe network configuration is the key for reliable remote data acquisition and
diagnostics. Local acquisition, archive and diagnostics combined with periodic and event
based data transfer are the onsite tasks. It continues in the Diagnostics Center with a central-
ized data base. Last but not least, it runs into advanced diagnostics in combination with tech-
nical experts knowledge.
- 1 -
May 2004 © PG G1 17
R: PG2004_Schei, Be,Ta_.ppt
Power-Gen Europe 2004, Barcelona
PG internal safe Intranet
Global Network Configuration Plant Diagnostics Integration into Siemens Intranet
PG Power DiagnosticsTM Center
WIN_TSWIN_TS WIN_TS
WIN_TS
CompetenceCenter GT
CompetenceCenter GT Competence
Center DTCompetence
Center DTCompetenceCenter GEN
CompetenceCenter GEN
CompetenceCenter -BoP
CompetenceCenter -BoP
Worldwide safe Modem Connections
Fig. 10
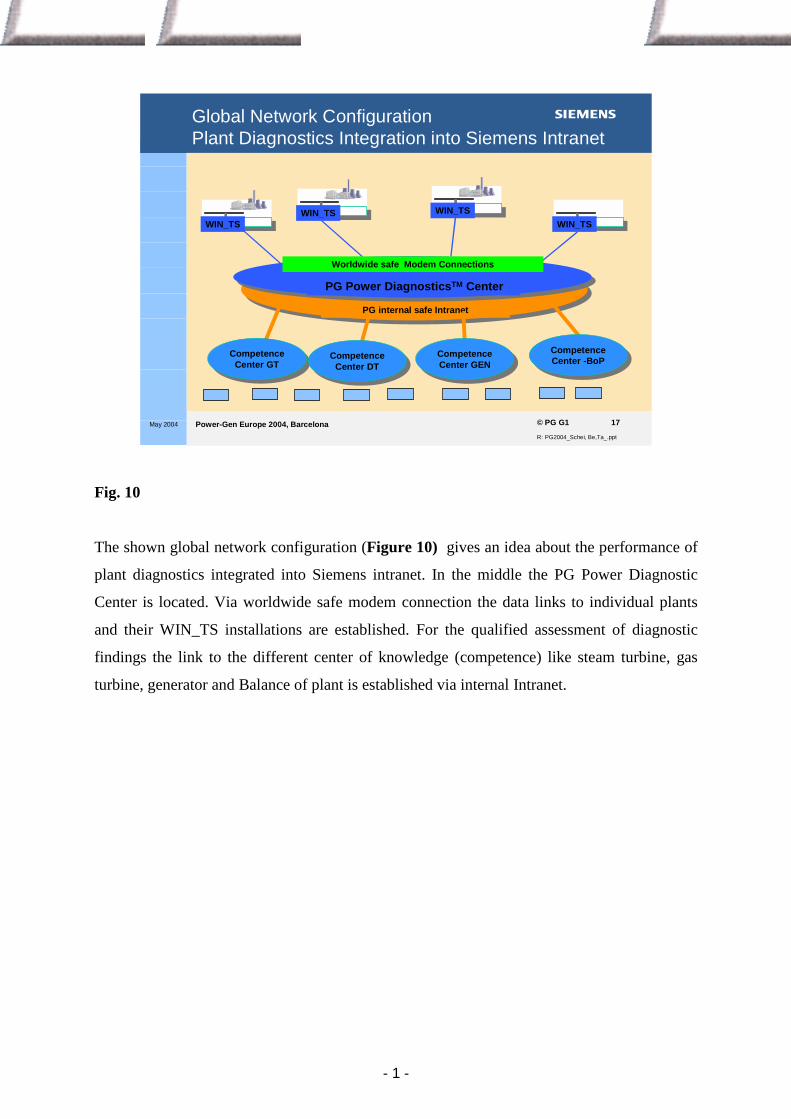
The shown global network configuration (Figure 10) gives an idea about the performance of
plant diagnostics integrated into Siemens intranet. In the middle the PG Power Diagnostic
Center is located. Via worldwide safe modem connection the data links to individual plants
and their WIN_TS installations are established. For the qualified assessment of diagnostic
findings the link to the different center of knowledge (competence) like steam turbine, gas
turbine, generator and Balance of plant is established via internal Intranet.
- 1 -
May 2004 © PG G1 19
R: PG2004_Schei, Be,Ta_.ppt
Power-Gen Europe 2004, Barcelona
Worldwide Implementation of WIN TS Gas Turbine Diagnostics
250 WIN TS Diagnostic Systems Installed for Gas Turbines * including steam turbines
350 WIN TS Diagnostic Systems installed worldwide*
> 120 installed
> 130 installed
60 Hz
50 Hz
Fig. 11
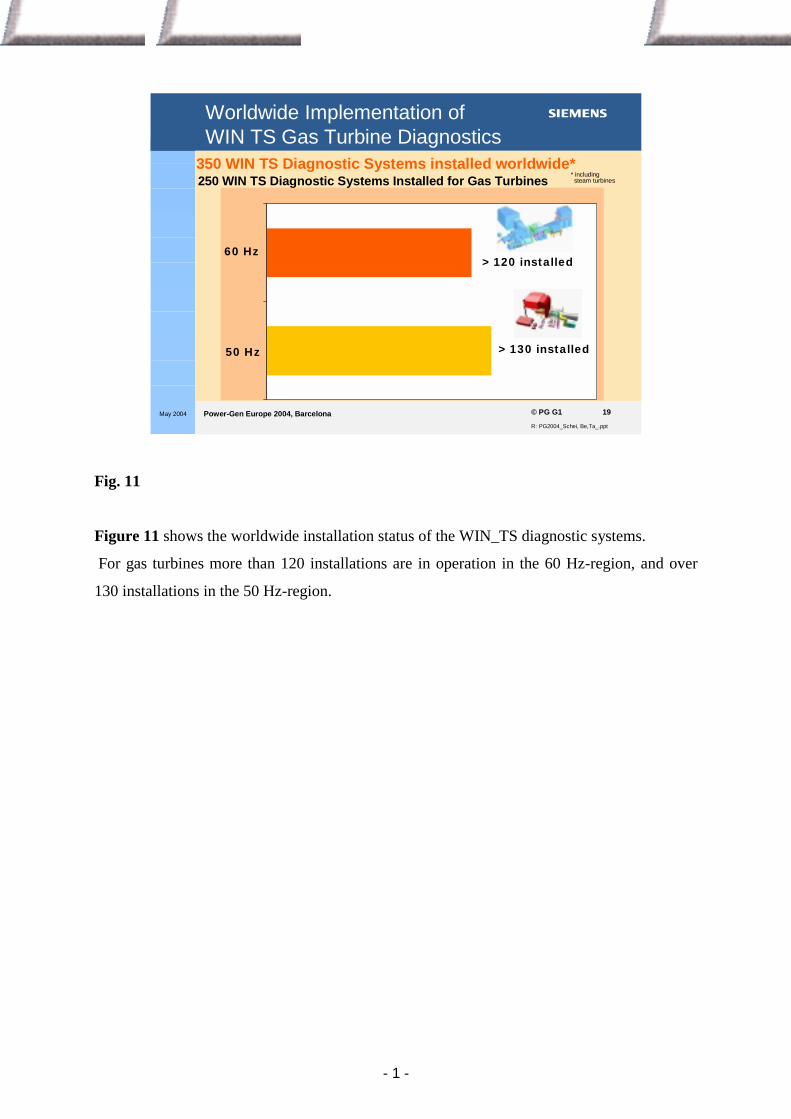
Figure 11 shows the worldwide installation status of the WIN_TS diagnostic systems.
For gas turbines more than 120 installations are in operation in the 60 Hz-region, and over
130 installations in the 50 Hz-region.
- 1 -
May 2004 © PG G1 21
R: PG2004_Schei, Be,Ta_.ppt
Power-Gen Europe 2004, Barcelona
It is important to receive at early stage continuous life data feedback from „running technological systems“ both for
- immediate Customer support
- product feedback
WIN_TS
SIEMENS PG
Service
Engineering
R&D
Erection/Commisioning
Benefits for Operation,Research and Development
Feedback Loop
Fig. 12
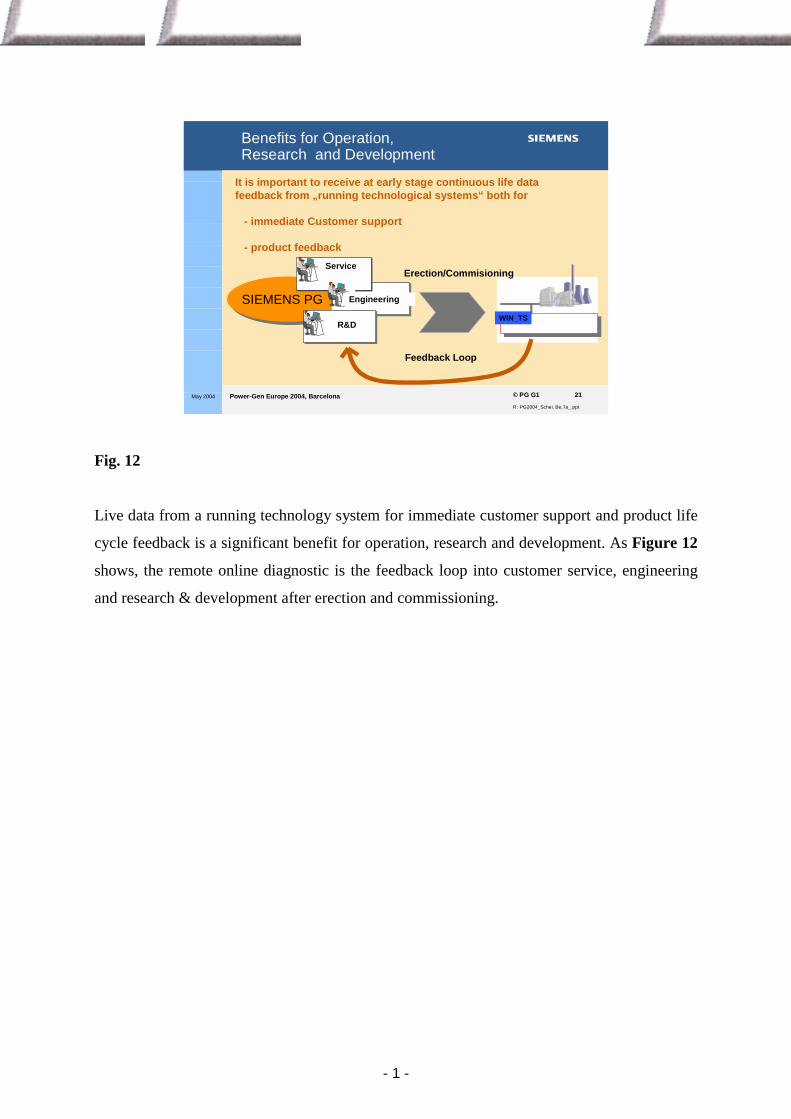
Live data from a running technology system for immediate customer support and product life
cycle feedback is a significant benefit for operation, research and development. As Figure 12
shows, the remote online diagnostic is the feedback loop into customer service, engineering
and research & development after erection and commissioning.
- 1 -
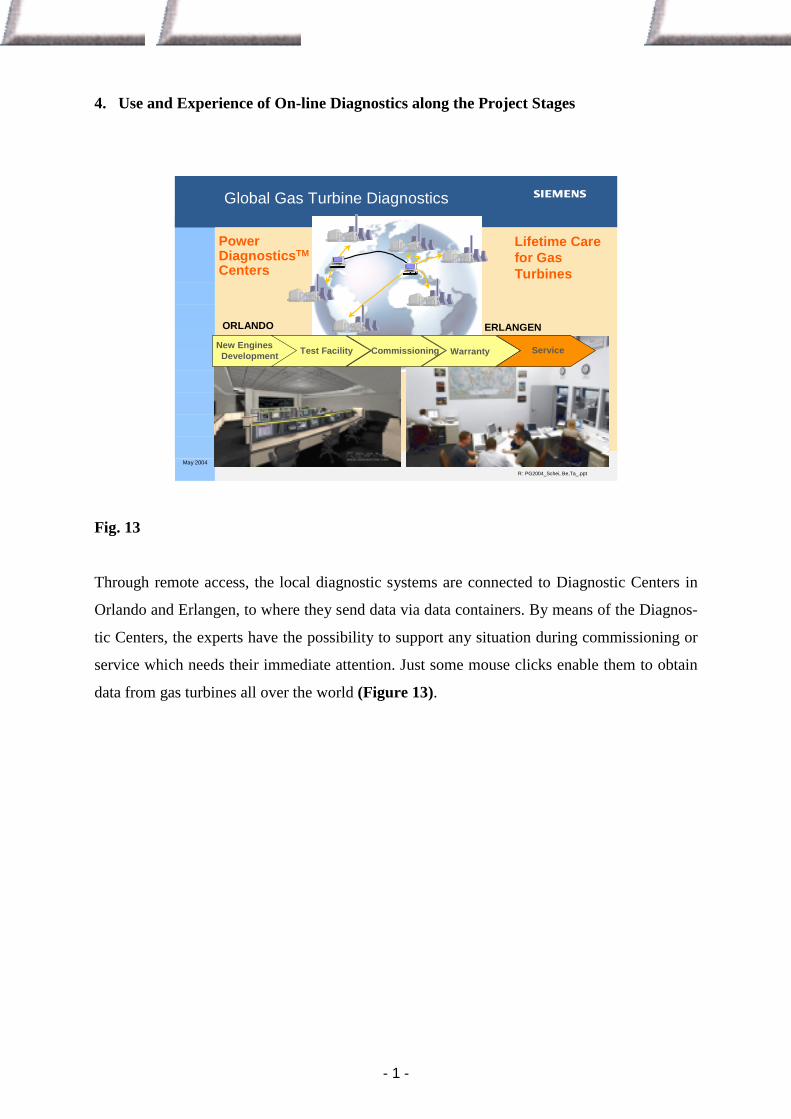
4. Use and Experience of On-line Diagnostics along the Project Stages
May 2004 © PG G1 23
R: PG2004_Schei, Be,Ta_.ppt
Power-Gen Europe 2004, Barcelona
Global Gas Turbine Diagnostics
ORLANDO ERLANGEN
Lifetime Care for Gas Turbines
Power DiagnosticsTM
Centers
Test Facility CommissioningNew EnginesDevelopment ServiceWarranty
Fig. 13
Through remote access, the local diagnostic systems are connected to Diagnostic Centers in
Orlando and Erlangen, to where they send data via data containers. By means of the Diagnos-
tic Centers, the experts have the possibility to support any situation during commissioning or
service which needs their immediate attention. Just some mouse clicks enable them to obtain
data from gas turbines all over the world (Figure 13).
- 1 -
May 2004 © PG G1 24
R: PG2004_Schei, Be,Ta_.ppt
Power-Gen Europe 2004, Barcelona
Test Facility
Tesing results and data accessible for technical experts in Competence Centers
Commissioning
• Less effort / replaces test equipment
• Automatic event Documentation with high time resolution for technical experts in Competence Centers
• Documentation of new engines fingerprint
New EnginesDevelopment
• Information about plant status and performance
• Automatic event Documentation for technical experts in Competence Centers
• Remote support for plant operators
Service
• Plants are monitored effectively by Power Diagnostic Centers
• Risk mitigation for LTP, O&M and LTM
• Detailed information of plant history and long term trends
• Conditon based Maintenance
• Fleet data accessible for technical experts in Competence Centers
• optimization of R&D efforts on new engines and upgrades
WarrantyPeriod
New Engines Service
Whole Lifetime Care for Gas Turbine Units
Fig. 14
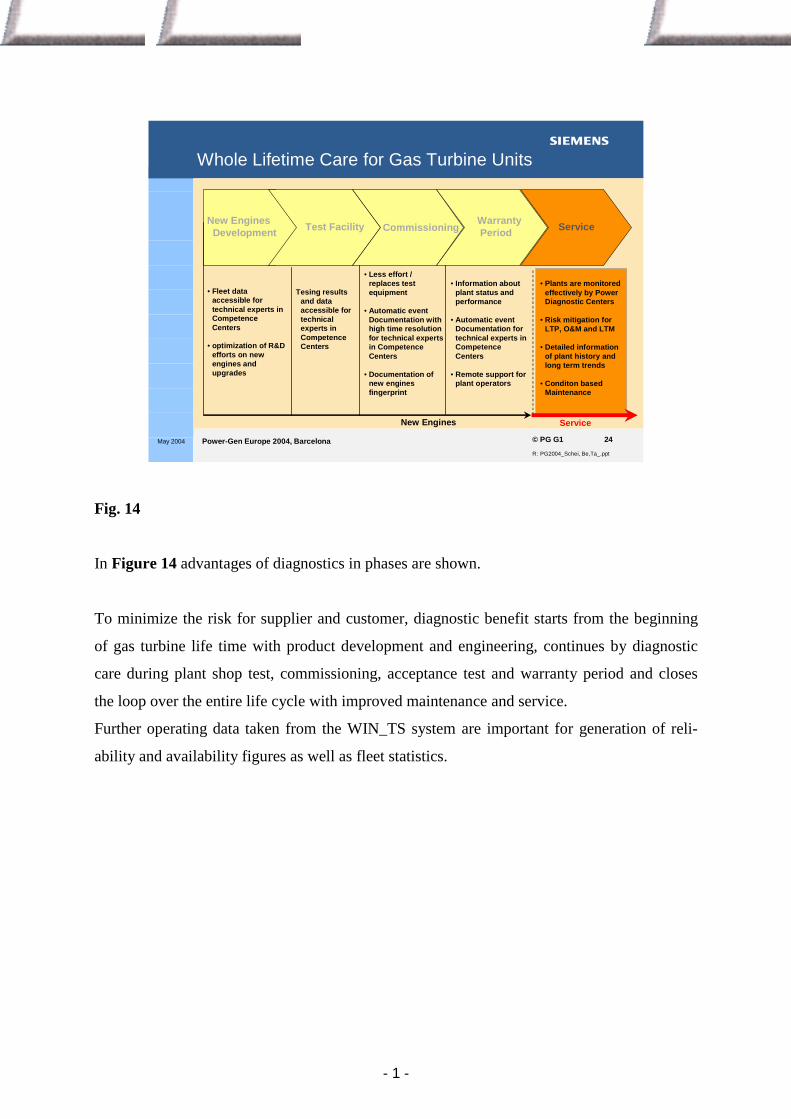
In Figure 14 advantages of diagnostics in phases are shown.
To minimize the risk for supplier and customer, diagnostic benefit starts from the beginning
of gas turbine life time with product development and engineering, continues by diagnostic
care during plant shop test, commissioning, acceptance test and warranty period and closes
the loop over the entire life cycle with improved maintenance and service.
Further operating data taken from the WIN_TS system are important for generation of reli-
ability and availability figures as well as fleet statistics.
- 1 -
May 2004 © PG G1 26
R: PG2004_Schei, Be,Ta_.ppt
Power-Gen Europe 2004, Barcelona
Test Facility CommissioningNew EnginesDevelopment
• Information about plant status and performance
• Automatic event Documentation for technical experts in Competence Centers
• Remote support for plant operators
Service
• Plants are monitored effectively by Power Diagnostic Centers
• Risk mitigation for LTP, O&M and LTM
• Detailed information of plant history and long term trends
• Conditon based Maintenance
WarrantyPeriod
New Engines Service
Use and Experiences of On-line Diagnostics
Example:
degradation analysis
Example: RemoteVibration Diagnostics
Fig. 15
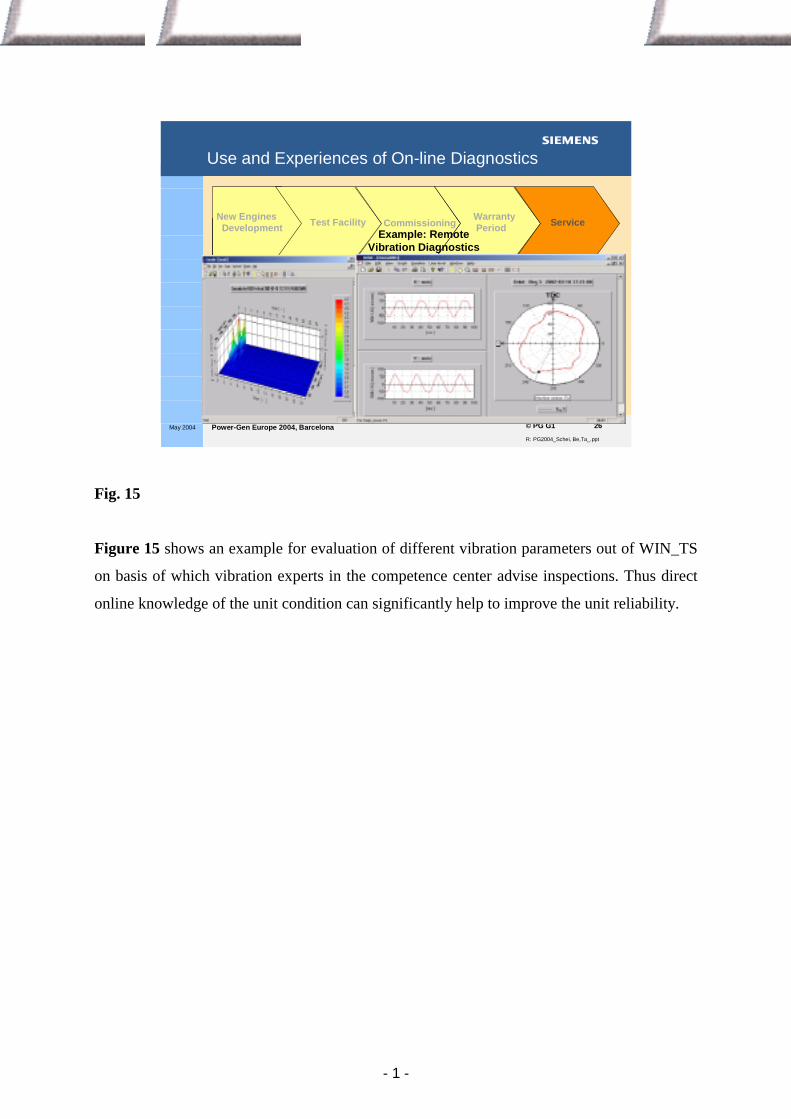
Figure 15 shows an example for evaluation of different vibration parameters out of WIN_TS
on basis of which vibration experts in the competence center advise inspections. Thus direct
online knowledge of the unit condition can significantly help to improve the unit reliability.
- 1 -
May 2004 © PG G1 27
R: PG2004_Schei, Be,Ta_.ppt
Power-Gen Europe 2004, Barcelona
Test Facility
Direct feedbackto engines developpersin G2 and G6
Commissioning
• Documentation of new engines fingerprint, automatically, with high time resolution
New EnginesDevelopment
• Detailed information is available about plant status and performance for warranty items
Service:
• Risk mitigation for LTP, O&M and LTM
• Detailed Information is available about plant status and performance to improve optimization during R&D engineering of new engines and MODs and UPs
WarrantyPeriod:
Ongoing GT / Econopac Development
degradation analysis
from G612
remoteTurbine
Balancingfrom G261 TM
GSW-DataServer
G-wide intranet access for comissioning data
Example:GT Experience
Report GEB
from G611
Fig. 16
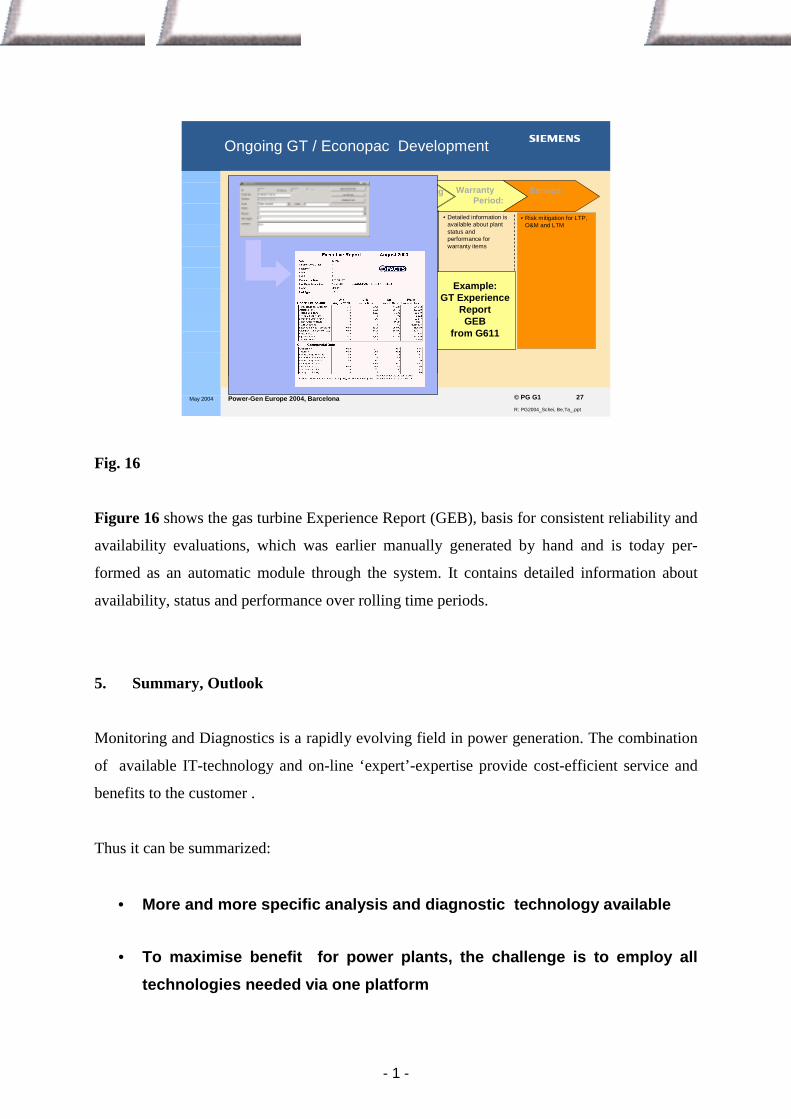
Figure 16 shows the gas turbine Experience Report (GEB), basis for consistent reliability and
availability evaluations, which was earlier manually generated by hand and is today per-
formed as an automatic module through the system. It contains detailed information about
availability, status and performance over rolling time periods.
5. Summary, Outlook
Monitoring and Diagnostics is a rapidly evolving field in power generation. The combination
of available IT-technology and on-line ‘expert’-expertise provide cost-efficient service and
benefits to the customer .
Thus it can be summarized:
• More and more specific analysis and diagnostic technology available
• To maximise benefit for power plants, the challenge is to employ alltechnologies needed via one platform
- 1 -
• Global network to a running fleet allows OEM experts fast data analysisand quick response to customer requirements
• On-line diagnostics - in combination with remote expert knowledge - isthe key to future condition based maintenance and provides cost effi-cient service to reliable plant operation.
For the customer it is important to have access to the knowledge of the developer of his gas
turbine in any situation at hand through a diagnostic platform.
For the equipment supplier it is strong value to have live feedback from his own “running
technological systems” to optimize learning.
And last but not least online diagnostics opens the path from Scheduled Maintenance to Con-
dition based Maintenance thus contributing to customers unit operation for highest profit.
- 1 -
Literature
[1] Volkmann, H.; Taud, R.: Application and Operating Experience with Econopacs
Equipped with Advanced Gas Turbines;
Power-Gen Europe 2003, Düsseldorf, May 6-8, 2003
[2] Bender, K.; Grühn, M.; Rukes, B.; Scheidel, M.: Online Remote Diagnosis of Tur-
bosets and Combined Cycle Power Plants;
VDI-Bericht Nr.: 1641, VDI-Verlag, Düsseldorf, 2001
[3] Adam, G.; Bode, A.: Ferndiagnose und Teleservicesystem für GUD-Kraftwerke;
VDI-Bericht Nr.: 1566, VDI-Verlag, Düsseldorf, 2000
[4] Brummel, H.-G.; Scheidel, M.; Thompson, E.: Gut behütet aus der Ferne;
Siemens Power Journal, Heft 1/00