Embed Size (px)
Citation preview
APPLIED AND ENVIRONMENTAL MICROBIOLOGY, Mar. 1977, p. 528-537Copyright © 1977 American Society for Microbiology
Vol. 33, No. 3Printed in U.S.A.
Use of Adencosine 5'-Triphosphate as an Indicator of theMicrobiota Biomass in Rumen Contents
C. W. FORSBERG* AND K. LAM
Department ofMicrobiology, College ofBiological Science, University ofGuelph, Guelph, Ontario, NIG 2Wl,Canada
Received for publication 20 September 1976
A number of techniques were tested for their efficiency in extracting adeno-sine 5'-triphosphate (ATP) from strained rumen fluid (SRF). Extraction with 0.6N H2SO4, using a modification of the procedure described by Lee et al. (1971),was the most efflcient and was better suited for extracting particulate samples.Neutralized extracts could not be stored frozen before assaying for ATP becauselarge losses were incurred. The inclusion of internal standards was necessary tocorrect for incomplete recovery of ATP. The ATP concentration in rumen con-tents from a cow receiving a ration of dried roughage (mainly alfalfa hay)ranged from 31 to 56 ,ug of ATP per g of contents. Approximately 75% of theATP was associated with the particulate material. The ATP was primarily ofmicrobial origin, since only traces ofATP were present in the feed and none wasfound in "cell-free" rumen fluid. Fractionation of the bacterial and protozoalpopulations in SRF resulted in the isolation of an enriched protozoal fractionwith a 10-fold higher ATP concentration than that of the separated rumenbacteria. The ATP pool sizes of nine functionally important rumen bacteria dur-ing the exponential phase of growth ranged from 1.1 to 17.6 ,ug of ATP per mgof dry weight. This information indicates that using ATP as a measure ofmicrobial biomass in rumen contents must be done with caution because ofpossible variations in the efficiency of extraction of ATP from rumen contentsand differences in the concentration of ATP in rumen microbes.
Currently used indicators of microbial bio-mass in rumen contents include the aminoacid 2,6-diaminopimelic acid for bacteria and2-aminoethylphosphonic acid for protozoa (8).2,6-Diaminopimelic occurs in the bacterial cellwall peptidoglycan and is absent from plantand animal tissues. 2-Aminoethylphosphonicacid is found only in protozoa and animal tissue(1, 12). In protozoa, 2-aminoethylphosphonicacid occurs in both lipids and proteins, whereasin higher animals it is confined mainly to lipidsand is probably a result ofdigestion and absorp-tion of protozoal matter (15). These specific in-dicators are intended for monitoring the bio-mass of bacteria and protozoa separately. How-ever, for studies where this separation is unnec-essary or undesirable, a more representativeand rapid assay would be advantageous. Fur-thermore, an indicator whose concentration isintimately related to the metabolic activity andviability of cells would be very useful for thestudy of factors affecting microbial numbersand activity in rumen contents.Adenosine 5'-triphosphate (ATP) is a well-
accepted indicator of microbial biomass in
aquatic and terrestrial environments (2, 6, 10).The primary reasons for measuring this cellu-lar constituent include: (i) ATP is present in allliving cells and absent from dead cells (11, 20);(ii) ATP is considered to be present in a uniformconcentration in all microbes (2, 10); and (iii)the analytical techniques for the extraction andassay ofATP are specific, relatively quick, easyto perform, and inexpensive. Because of theseunique features of ATP measurement, the fea-sibility of using this technique as a reliableindicator of microbial biomass in rumen con-tents was examined.
MATERIALS AND METHODSBacterial cultures, cultural conditions, and me-
dia. The anaerobic rumen bacteria listed in Table 9were generously provided by M. P. Bryant, Univer-sity of Illinois, Urbana, and K. J. Cheng, ResearchStation, Agriculture Canada, Lethbridge, Alberta.The anaerobic technique used for culturing the
bacteria was essentially that of Hungate (13) asmodified by Bryant (5). The rumen bacteria werecultured anaerobically in the artificial medium de-scribed by Scott and Dehority (21). The cultureswere stored at -65°C on agar slants. Before use in a
528
on May 7, 2018 by guest
http://aem.asm
.org/D
ownloaded from
ATP AS INDICATOR OF RUMEN MICROBIOTA BIOMASS 529
growth experiment, each culture was subculturedtwo or three times at 24-h intervals at 3700. Whenthe culture reached the late exponential phase ofgrowth during the last subculture, it was used toinoculate 300 ml of liquid medium to give a finalculture density of 20 ,.g of cells (dry weight)/ml. Thecultures were incubated stationary in a water bathat 370C. At given times of incubation, the culturewas mixed and fluid was removed anaerobically foroptical density (OD) measurements, calibration ofOD readings to dry weight, and extraction ofATP.The OD measurements were made using matched
cuvettes (13 by 100 mm) in a Spectronic 20 at 675 nm.The readings were corrected for deviations fromBeer's law using the tables of Toennies and Gallant(22). The OD values of each culture were correlatedwith the dry weight of cells by means of a separatecalibration curve for each culture relating the OD ofcells (harvested at an OD of 0.5 to 0.7 and washedtwice in water) to the dry weight after drying of analiquot to constant weight at 1050C. From the curvesit was determined that an OD reading of 1.0 wasequilvalent to 0.48 mg of Streptococcus bovis, 0.37mg of Bacteroides ruminicola, 0.36 mg of Seleno-monas ruminantium, 0.46 mg of Butyrivibrio fibri-solvens, 0.45 mg ofMegasphaera elsdenii, 0.43 mg ofRuminococcus albus, 0.36 mg ofBacteroides succino-genes, 0.58 mg of Bacteroides amylophilus, and 0.53mg ofEubacterium ruminantium per ml.Rumen microbiota. Rumen contents were ob-
tained from two fistulated cows. A Holstein cow wasinitially fed a ration of roughage plus a corn-basedsupplement (2:1), and later a ration of roughagealone. A Hereford cow used as a source of rumen con-tents for one experiment was fed a ration of rough-age plus rolled oats. The roughage was a mixture ofalfalfa and brome grass containing primarily al-falfa. The samples of rumen contents were collected3 to 4 h after feeding via the fistula and taken to thelaboratory in a prewarmed (370C) Thermos flask.Strained rumen fluid (SRF) was prepared by filtra-tion of rumen contents through four layers of surgi-cal gauze. The plant material retained by the gauzewas called the particulate material.
Methods for extracting ATP. (i) "Boiling" Trisbuffer. A 0.5-ml sample of SRF was transferred to ascrew-cap vial, and 4.5 ml of 0.04 Mtris(hydroxymethyl)aminomethane (Tris) buffer,pH 7.8, just off the boil, was added. The vial wasquickly sealed, and the contents were mixed andthen placed in a boiling water bath for 5 min withoccasional mixing. After cooling, the contents of thevial were centrifuged at 12,800 x g for 10 min (4C)and the supernatant was saved. A portion of thesupernatant was diluted to one-fifth of the originalconcentration with Tris buffer.
(ii) Chloroform (a modification of the method ofDhople and Hanks [9]). A 0.5-ml sample of SRF wasadded to a test tube containing 0.15 ml of chloro-form. The contents of the tube were mixed for 1 minwith a Vortex mixer, and the tube was placed in aboiling water bath for 5 min. During the last minuteof heating, the tube was shaken to facilitate vapori-zation of the chloroform. The solution was then
made up to 5 ml with 0.1 M NaHCO3 (pH 8.5) andcentrifuged at 12,800 x g for 10 min (4°C). A 1-mlsample of the supernatant was vacuum-evaporatedto remove residual CHCl3 and then made up to 10 mlwith 0.4 M Tris buffer, pH 7.8.
(iii) "Boiling" NaHCO3 buffer (6). Liquid sam-ples were handled as described in (i) except 8 ml of0.1 M NaHCO3 (pH 8.5), just off the boil, was addedin the place of Tris buffer. After the centrifugationstep, the supernatant was decanted and a portionwas diluted to one-tenth of the original concentra-tion with 0.4 M Tris buffer, pH 8.5. In the case ofparticulate material (total rumen contents orstrained particulate material), a 4- to 7-g samplewas washed into a preheated stainless-steel Waringblender jar with 125 ml of 0.1 M NaHCO3 (pH 8.5),just off the boil. The contents were mixed at 10,000rpm for 4 min. After cooling, a portion was treatedas described for liquid samples.
(iv) Cold 0.6 N H2S04 (a modification of themethod described by Lee et al. [171). This is thetechnique recommended for use. A 1-ml sample ofSRF was added to 4 ml of ice-cold 0.6 N H2SO4 in acentrifuge tube and mixed intermittently. The tubewas maintained for exactly 5 min in an ice bath andthen centrifuged at 39,000 x g for 10 min (40C). A 2-ml volume of the supernatant and 1.5 ml of a 10%(wt/vol) suspension of Na+-saturated cation-ex-change resin (Amberlite IR-120) suspended in waterwere immediately added to a test tube and mixed for30 s. Two milliliters of 0.5 M Tris buffer (pH 7.8) wasadded, and the contents were mixed while 1.0 to 1.2ml of 1 N NaOH was added (i.e., sufficient to adjustthe mixture to pH 7.8 in the absence of Tris buffer),followed by 10 to 15 ml of water. Samples wereprocessed to this stage without interruption. Theextract was separated from the resin by aspiration,and the resin was washed twice with 2-ml aliquots ofdistilled water. The combined extract and washeswere pooled and made to a volume of 25 ml withwater. In the case of particulate material (total ru-men contents or separated particulate material), a4- to 7-g sample of thoroughly mixed material wasadded to a centrifuge tube, 25 ml of 0.6 N H2S04 wasadded, and the contents were mixed vigorously. Thesubsequent manipulations were identical to thosefor processing samples of SRF.When a nonradioactive internal standard of ATP
was added to a liquid sample, 3 ml of 0.6 N H2SO4was first mixed with the 1-ml sample; then 1 ml of0.6 N H2SO4 containing the standard (100 nM ofnonradioactive ATP) was immediately added, andthe contents were mixed again. For particulate sam-ples, the sample was mixed with 20 ml of 0.6 NH2SO4, and then 5 ml of 0.6 N H2SO4 containing thestandard (750 nM nonradioactive ATP) was added.The H2SO4 solutions of ATP to be used as internalstandards were prepared immediately before use.
Radioisotope usage. [U-14C]ATP (ammoniumsalt, 554 mCi/mmol) was obtained from Amersham/Searle Corp., Oakville, Ontario. It was added with-out dilution to 0.6 N H2SO4 to give specific activitiesof 0.04 MCi/ml for addition to liquid samples and 0.1,uCi/ml for particulate samples. Neutralized sam-
VOL. 33, 1977
on May 7, 2018 by guest
http://aem.asm
.org/D
ownloaded from

530 FORSBERG AND LAM
ples were suspended in a dioxane-base scintillationfluid (4) for counting in a Beckman LS-255 scintilla-tion counter.
Separation of bacteria and protozoa. Two liters ofrumen fluid collected from the cow on a hay rationwas strained through six layers of surgical gauzeinto a prewarmed (370C) insulated container andquickly brought to the laboratory. All apparatusand glassware used were prewarmed to 370C. A bac-terial fraction, free from protozoa, was obtained byfirst centrifuging SRF at 175 x g for 5 min at 37°C tosediment the protozoa and feed particles. The super-natant containing bacteria was aspirated off andsampled for the measurement of ATP. Thirty milli-liters was added to each of four tubes, which werethen centrifuged at 39,000 x g for 5 min at 37°C tosediment the bacteria. The supernatant fluid waspoured off, and two cell pellets were separately ex-tracted with 20 ml of 0.6 N H2SO4; after mixing, 5 mlof each was added to 100 nmol of ATP (0.1 ml). Theextraction procedure was continued as describedabove for both the two 5-ml samples with internalstandard and the two 5-ml samples without. The othertwo cell pellets were washed twice at 40C with 25-mlvolumes of water, centrifuging each time at 27,000 xg for 10 min; then each pellet was made up to 10 mlwith water, and 5 ml was dried to constant weight at1050C.To obtain an enriched fraction of protozoa, two
750-ml volumes of SRF were added to 1-liter separa-tory funnels, pregassed with CO2. The head spacesof the funnels were gassed with C02, stoppered, andplaced in a 370C incubator for 60 min. The whitesediments in the funnels were collected, pooled, andsuspended in 45 ml of freshly prepared "cell-free"rumen fluid (prepared by two successive centrifuga-tions at 27,000 x g for 30 min, warmed to 37°C, andgassed with CO2). The protozoal suspension was di-vided equally among four tubes and centrifuged at175 x g for 8 min at 350C to sediment the protozoa,and the culture supernatant was carefully aspiratedoff each cell pellet. Two cell pellets were resus-pended in 10 ml of 0.6 N H2SO4 and treated asdescribed for the bacteria. The two remaining cellpellets were washed twice as described for the bacte-ria, and the dry weights were determined. Lysis ofthe bacterial and protozoal fractions during the wa-ter washes preceding the dry-weight determinationsdid not appear to occur because similar dry weightswere obtained when the cells were pretreated witheither glutaraldehyde or formaldehyde. Phase-con-trast microscopy revealed that the protozoa werecontaminated with a few bacteria. Further purifica-tion was not attempted to avoid disturbing the me-tabolism of the protozoa, which would lead to achanged ATP content.
Estimation of ATP. ATP was determined by thefirefly bioluminescence technique. The reactionmixture contained 0.02 to 0.5 nmol of ATP in 0.3 mlof 0.04 M Tris buffer, pH 7.8, and 0.2 ml of a freshlyprepared solution of 0.125 M sodium arsenate-0.05 Mmagnesium chloride solution, pH 7.8. The reactionwas started by addition of 0.1 ml of reconstitutedfirefly lantern extract (one vial of FLE-50 homoge-nized with 5 ml of water, centrifuged at 12,000 x g
APPL. ENVIRON. MICROBIOL.
for 15 min at 40C to remove particulate material andstored on ice; Sigma Chemical Co., St. Louis, Mo.).The intensity of the bioluminescence was recordedafter 30 s, using a Chem-Glow Photometer (Ameri-can Instruments Co., Silver Spring, Md.). The con-centration of ATP in experimental samples was de-termined by reference to a standard curve relatinglight intensity to ATP concentration prepared fromdisodium ATP. All experimental samples were as-sayed at three or four separate concentrations and insome cases with added internal standards of ATP tocheck for inhibition of light emission by componentspresent in extracts. Sodium carbonate inhibited lu-ciferase activity, but at the highest concentrationpresent in experimental samples it caused less than5% inhibition and was disregarded.
Extraction and measurement of the ATP poolsizes of bacteria. A 1-ml volume of culture wasmixed with 0.2 ml of 3.6 N H2S04 and set on ice for 20min. One milliliter of Na+-saturated cation-ex-change resin (Amberlite IR-120) suspended in waterwas added. The contents were shaken vigorouslyand then centrifuged at 12,000 x g for 15 min at 40Cto remove cell debris and resin. A 1.5-ml volume ofthe supernatant was removed, and the pH was ad-justed to 7.8. The solution was made 0.04 M withrespect to Tris buffer (pH 7.8) in a volume of 10 ml.When internal standards of ATP (100 nM in 0.1 ml)were added, they were mixed into the samples im-mediately after addition of the H2SO4. These ex-tracts were assayed for ATP by using minivials in aBeckman model LS-255 scintillation counter be-cause of its increased sensitivity over the Chem-Glow Photometer. The assay reagents used were thesame as those used with the Chem-Glow Photometerexcept that (i) the firefly lantern extract was agedfor 2 h at 40C, (ii) the volume of sample plus 0.04 MTris buffer (pH 7.8) was increased to 1.0 ml and thevolume of the arsenate-magnesium solution was in-creased to 0.6 ml, and (iii) 0.2 ml of firefly extractwas used to start the enzymatic assay. Each samplewas mixed and counted for three 0.1-min cycles,using gain and window settings used for countingtritium. The counts per minute recorded for thethird 0.1-min cycle was recorded. A standard curve,plotted on log-log graph paper, relating counts perminute to ATP concentration was prepared by as-saying a standard solution of ATP. The recovery ofadded internal standard usually ranged from 70 to105% and was used to correct the ATP concentra-tions to 100% recovery.
RESULTSExtraction techniques. The ATP content of
rumen fluid was determined by a variety oftechniques with the intention of selecting thebest method for the extraction of ATP. Theresults illustrated in Table 1, experiment 1, aretypical of those obtained in a number of experi-ments and show that hot 0.1 M NaHCO3 (pH8.5) with heating for 5 min gave the greatestrecovery of ATP. The efficiency of extraction bythis technique was compared with that of the
on May 7, 2018 by guest
http://aem.asm
.org/D
ownloaded from

ATP AS INDICATOR OF RUMEN MICROBIOTA BIOMASS
TABLE 1. Effect of extraction technique on theamount ofATP extracted from strained rumen fluid
from a cow on a ration of hay plus cereal
Expt Extraction technique 1Ag of ATP/mlno. of SRF
1 (i) Boiling 0.04 M Tris 69.5buffer, pH 7.8
(ii) Chloroform 31.1(iii) NaHCO3-chloroform- 40.5
blendinga(iv) BoilingNaHCO3 92.5
2 (iv) Boiling NaHCO3 120.7 ± 6.9b(v) Cold 0.6 N H2SO4 111.0 + 2.7
a Five milliliters of SRF plus 45 ml of 0.1 MNaHCO3 (20°C) were added to a blender. Fifteenmilliliters of CHCl3 was added, and the materialswere mixed for 5 min.
b Mean and the standard deviation. (iv, four sam-ples; v, five samples).
method described by Lee et al. (17) using cold0.6 N H2SO4. In the latter technique, after addi-tion of 0.6 N H2SO4 to the sample, the mixturewas incubated on ice for 60 min and the samplewas centrifuged to remove particulate mate-rial. A 2-ml volume of the clarified extract wastreated batchwise with two 0.5-ml amounts ofcation-exchange resin, and the pH was adjustedto 7.8 by titration with 1 N NaOH. The extractwas then made to a volume of 25 ml and 0.04 Mwith respect to Tris (pH 7.8). There was nosignificant difference (at the 95% confidencelevel) in the relative extraction efficiency be-tween the two methods (Table 1, experiment 2).The recoveries of ATP (100 nM) added as inter-nal standards to the NaHCO3 and H2SO4 ex-tractions were 94 and 105%, respectively. Inseparate experiments, the efflciency of theHC104 extraction technique published by Bag-nara and Finch (3) was compared with theH2S04 extraction technique for measuring ATPin the particulate fraction of rumen contents.Extraction with HC104 gave only 16% of theATP obtained using H2S04, and a comparablerecovery of internal standard was observed. Be-cause it is more convenient, the NaHCO3 ex-traction technique was used initially, and re-sults using this method are reported in Tables1, 2, and 3; however, because the H2SO4 extrac-tion technique was found to give higher recov-eries of ATP from particular samples, it wasused in the remainder of the study.To determine how the time of incubation af-
fected the ATP content of SRF, a sample wasextracted at intervals after removal of rumencontents from a cow. There was no detectablechange in the ATP content of the SRF over a160-min period (Table 2).The use of ATP as a reliable indicator of
microbial biomass in rumen contents dependsupon there being a low amount of ATP in thefeed consumed by the ruminant animal. TheATP content of a number of feed constituentswas determined by extraction with hot 0.1 MNaHCO3, using the procedure involving blend-ing. Less than 0.24 ug of ATP per g was ex-tracted from alfalfa hay, and no ATP was de-tected in either ground corn or the pelletedcorn-based supplement containing soybeanmeal, a complete vitamin mixture, and min-erals. Similar results were obtained using theH2SO4 extraction technique.Observed distribution ofATP in rumen con-
tents. The distribution of ATP between theSRF and particulate fraction ofrumen contentswas determined for the cow on a hay-corn-based
TABLE 2. Effect ofincubation at 37°C on the amountofATP extracted from strained rumen fluid from a
cow on a ration of hay plus cereala
Time interval (min) Ag of ATP/ml
1 104.3 ± 0.35 104.8 ± 3.8
10 103.9 ± 6.820 96.1 4.540 115.0 ± 1.480 95.7 ± 5.7160 110.6 ± 5.3
a A 300-ml volume of strained rumen fluid con-tained in a 500-ml round bottom flask was incubatedunder an atmosphere of carbon dioxide. TheNaHCO3 extraction technique was used to extractATP.
TABLE 3. Distribution ofATP in rumen contentsfrom cows on a ration of hay plus cereala
tLgofATP/gDistri-Expt Sample jug of ATP/g butionno. observed serve
1 Ration of hay + corn-based supplement
Mixed rumen contents 84.9b 100SRF 103.1 60Particulate material 48.3 17
2 Ration of hay + rolledoats
Mixed rumen contents 61.5 + 1.7c 100SRF 37.0 ± 4.0 31Particulate material 78.0 + 1.8 67Gauzed 2
a The NaHCO3 extraction technique was used for experi-ment 1, and the H2SO4 extraction technique of Table 1 wasused for experiment 2. In both cases the extracts were
assayed for ATP immediately after preparation.b Mean value of duplicates.c Mean and standard deviation of samples extracted and
assayed in triplicate.d The moist gauze with associated traces of rumen con-
tents was immersed in 200 ml of 0.6 N H2SO4, and the fluidwas processed as described for SRF samples.
VOL. 33, 1977 531
on May 7, 2018 by guest
http://aem.asm
.org/D
ownloaded from
532 FORSBERG AND LAM
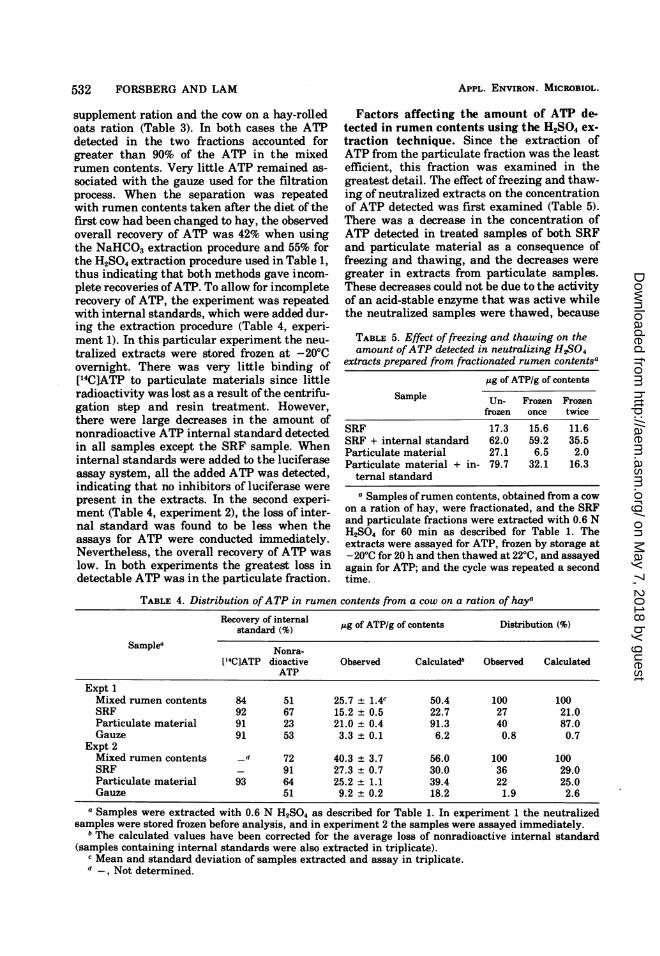
supplement ration and the cow on a hay-rolledoats ration (Table 3). In both cases the ATPdetected in the two fractions accounted forgreater than 90% of the ATP in the mixedrumen contents. Very little ATP remained as-sociated with the gauze used for the filtrationprocess. When the separation was repeatedwith rumen contents taken after the diet of thefirst cow had been changed to hay, the observedoverall recovery of ATP was 42% when usingthe NaHCO3 extraction procedure and 55% forthe H2SO4 extraction procedure used in Table 1,thus indicating that both methods gave incom-plete recoveries ofATP. To allow for incompleterecovery of ATP, the experiment was repeatedwith internal standards, which were added dur-ing the extraction procedure (Table 4, experi-ment 1). In this particular experiment the neu-tralized extracts were stored frozen at -20°Covernight. There was very little binding of[14C]ATP to particulate materials since littleradioactivity was lost as a result of the centrifu-gation step and resin treatment. However,there were large decreases in the amount ofnonradioactive ATP internal standard detectedin all samples except the SRF sample. Wheninternal standards were added to the luciferaseassay system, all the added ATP was detected,indicating that no inhibitors of luciferase werepresent in the extracts. In the second experi-ment (Table 4, experiment 2), the loss of inter-nal standard was found to be less when theassays for ATP were conducted immediately.Nevertheless, the overall recovery of ATP waslow. In both experiments the greatest loss indetectable ATP was in the particulate fraction.
Factors affecting the amount of ATP de-tected in rumen contents using the H2SO4 ex-traction technique. Since the extraction ofATP from the particulate fraction was the leastefficient, this fraction was examined in thegreatest detail. The effect of freezing and thaw-ing of neutralized extracts on the concentrationof ATP detected was first examined (Table 5).There was a decrease in the concentration ofATP detected in treated samples of both SRFand particulate material as a consequence offreezing and thawing, and the decreases weregreater in extracts from particulate samples.These decreases could not be due to the activityof an acid-stable enzyme that was active whilethe neutralized samples were thawed, because
TABLE 5. Effect offreezing and thawing on theamount ofATP detected in neutralizing H5S04
extracts prepared from fractionated rumen contentsa
,ug of ATP/g of contentsSample Un- Frozen Frozen
frozen once twice
SRF 17.3 15.6 11.6SRF + internal standard 62.0 59.2 35.5Particulate material 27.1 6.5 2.0Particulate material + in- 79.7 32.1 16.3
ternal standarda Samples ofrumen contents, obtained from a cow
on a ration of hay, were fractionated, and the SRFand particulate fractions were extracted with 0.6 NH2SO4 for 60 min as described for Table 1. Theextracts were assayed for ATP, frozen by storage at- 20°C for 20 h and then thawed at 22°C, and assayedagain for ATP; and the cycle was repeated a secondtime.
TABLE 4. Distribution ofATP in rumen contents from a cow on a ration of haya
Recovery of internal ,ug of ATP/g of contents Distribution (%)
Samplea -Nonra-['4C]ATP dioactive Observed Calculatedb Observed Calculated
ATPExpt 1Mixed rumen contents 84 51 25.7 ± 1.4c 50.4 100 100SRF 92 67 15.2 ± 0.5 22.7 27 21.0Particulate material 91 23 21.0 ± 0.4 91.3 40 87.0Gauze 91 53 3.3 ± 0.1 6.2 0.8 0.7
Expt 2Mixed rumen contents _d 72 40.3 ± 3.7 56.0 100 100SRF - 91 27.3 ± 0.7 30.0 36 29.0Particulate material 93 64 25.2 ± 1.1 39.4 22 25.0Gauze 51 9.2 + 0.2 18.2 1.9 2.6
a Samples were extracted with 0.6 N H2S04 as described for Table 1. In experiment 1 the neutralizedsamples were stored frozen before analysis, and in experiment 2 the samples were assayed immediately.
b The calculated values have been corrected for the average loss of nonradioactive internal standard(samples containing internal standards were also extracted in triplicate).
c Mean and standard deviation of samples extracted and assay in triplicate.d _, Not determined.
APPL. ENVIRON. MICROBIOL.
on May 7, 2018 by guest
http://aem.asm
.org/D
ownloaded from
ATP AS INDICATOR OF RUMEN MICROBIOTA BIOMASS 533
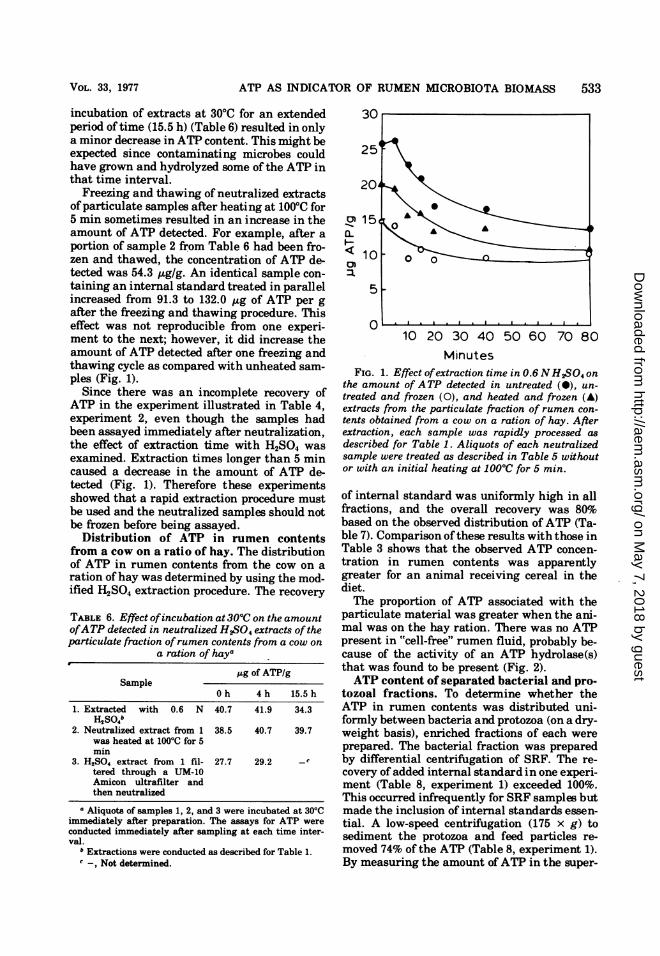
incubation of extracts at 30°C for an extendedperiod of time (15.5 h) (Table 6) resulted in onlya minor decrease inATP content. This might beexpected since contaminating microbes couldhave grown and hydrolyzed some of the ATP inthat time interval.
Freezing and thawing of neutralized extractsofparticulate samples after heating at 1000C for5 min sometimes resulted in an increase in theamount of ATP detected. For example, after aportion of sample 2 from Table 6 had been fro-zen and thawed, the concentration of ATP de-tected was 54.3 ,tg/g. An identical sample con-taining an internal standard treated in parallelincreased from 91.3 to 132.0 ,ug of ATP per gafter the freezing and thawing procedure. Thiseffect was not reproducible from one experi-ment to the next; however, it did increase theamount of ATP detected after one freezing andthawing cycle as compared with unheated sam-ples (Fig. 1).
Since there was an incomplete recovery ofATP in the experiment illustrated in Table 4,experiment 2, even though the samples hadbeen assayed immediately after neutralization,the effect of extraction time with H2SO4 wasexamined. Extraction times longer than 5 mincaused a decrease in the amount of ATP de-tected (Fig. 1). Therefore these experimentsshowed that a rapid extraction procedure mustbe used and the neutralized samples should notbe frozen before being assayed.
Distribution of ATP in rumen contentsfrom a cow on a ratio of hay. The distributionof ATP in rumen contents from the cow on aration ofhay was determined by using the mod-ified H2S04 extraction procedure. The recovery
TABLE 6. Effect ofincubation at 30°C on the amountofATP detected in neutralized H5S04 extracts of theparticulate fraction ofrumen contents from a cow on
a ration of haya
ug of ATP/gSample
Oh 4h 15.5h
1. Extracted with 0.6 N 40.7 41.9 34.3H2S04b
2. Neutralized extract from 1 38.5 40.7 39.7was heated at 100'C for 5min
3. H2SO4 extract from 1 fil- 27.7 29.2 -ctered through a UM-10Amicon ultrafilter andthen neutralized
a Aliquots of samples 1, 2, and 3 were incubated at 30'Cimmediately after preparation. The assays for ATP wereconducted immediately after sampling at each time inter-val.
b Extractions were conducted as described for Table 1.c -, Not determined.
30
25'
20O
011°0)
10 20 30 40 50 60 70 80
MinutesFIG. 1. Effect ofextraction time in 0.6 NH5$04 on
the amount of ATP detected in untreated (0), un-treated and frozen (0), and heated and frozen (v)extracts from the particulate fraction of rumen con-tents obtained from a cow on a ration of hay. Afterextraction, each sample was rapidly processed asdescribed for Table 1. Aliquots of each neutralizedsample were treated as described in Table 5 withoutor with an initial heating at 100°C for 5 min.
of internal standard was uniformly high in allfractions, and the overall recovery was 80%obased on the observed distribution of ATP (Ta-ble 7). Comparison of these results with those inTable 3 shows that the observed ATP concen-tration in rumen contents was apparentlygreater for an animal receiving cereal in thediet.The proportion of ATP associated with the
particulate material was greater when the ani-mal was on the hay ration. There was no ATPpresent in "cell-free" rumen fluid, probably be-cause of the activity of an ATP hydrolase(s)that was found to be present (Fig. 2).ATP content of separated bacterial and pro-
tozoal fractions. To determine whether theATP in rumen contents was distributed uni-formly between bacteria and protozoa (on a dry-weight basis), enriched fractions of each wereprepared. The bacterial fraction was preparedby differential centrifugation of SRF. The re-covery of added internal standard in one experi-ment (Table 8, experiment 1) exceeded 100%.This occurred infrequently for SRF samples butmade the inclusion of internal standards essen-tial. A low-speed centrifugation (175 x g) tosediment the protozoa and feed particles re-moved 74% of the ATP (Table 8, experiment 1).By measuring the amount of ATP in the super-
VOL. 33, 1977
on May 7, 2018 by guest
http://aem.asm
.org/D
ownloaded from

TABLE 7. Recovery and distribution ofATP in rumen contents from a cow on a ration of hay using themodified H2S04 extraction procedurea
Recovery of ,ug of ATP/g of contents Distribution (%)Sample internal
standard (%) Observed Calculatedb Observed Calculated
Mixed rumen contents 83.4 25.8 + 0.6c 31.0 100 100SRF 83.0 11.7 ± 0.3 14.1 23.0 23.3Particulate material 69.0 30.8 ± 2.9 44.6 53.0 65.0Gauze 82.4 17.7 ± 0.2 21.5 3.7 3.845,000 x g SRF supernate 0 0 0Recovery (%) 79.7 92.1
a Extraction procedure is outlined in Materials and Methods.b Calculated values have been corrected as described in Table 4.c Mean and standard deviation of samples extracted and assayed in triplicate.
0 20 40 60 80 100 120 140Minutes
FIG. 2. ATP hydrolase activity in "cell-free" rumenfluid from a cow on a ration of hay. Six milliliters ofrumen fluid supernatant taken after two successivecentrifugations at 45,000 x g for 30 min was mixedwith 200 nM ATP (0.2 ml), gassed with C02, andincubated at 37°C. One-milliliter samples were ex-
tracted with H2SO4.
natant and using this to compute the concen-tration of ATP in bacteria, the value obtained(2.10 ,ug ofATP/mg) was 28% higher than whenthe bacterial sediment after a high-speed cen-
trifugation was extracted (1.64 ,Ag of ATP/mg).The apparent decrease in the concentration ofATP in cells after centrifugation could be at-tributed in part to the loss of slime-encapsu-lated bacteria that formed a loose top layer overthe sedimented cells and as a result was lostwhen the supernatant was poured off.The protozoal fraction prepared by a combi-
nation gravity sedimentation and a subsequentlow-speed centrifugation step, designed to re-
move residual bacteria, contained 16.9 ,ug ofATP per mg of dry weight. This concentrationofATP was 10-fold higher than that observed inthe bacteria.ATP pool sizes of pure cultures of rumen
bacteria. To obtain information about the vari-ation in ATP pool sizes among rumen bacteria,the ATP concentration was determined for a
TABLE 8. ATP pool sizes of bacterial and protozoalfractions from strained rumen fluid from a cow on a
ration of hay
Recovery g Of "g ofof in- ATm ATP/mgFraction ternal calcu- (dry wt)
standard lateda calcula-ae teda
Expt 1SRF 142 9.3SRF after centrifuga- 151 2.4
tion at 175 x g for 5min
BacteriaBefore centrifugation 151 2.1Cell pellet 105 1.6
Protozoa 82 16.9Expt 2
BacteriaBefore centrifuga- 103 2.2
tion5
Cell pellet 84 1.6
a After correction of the values to 100% recovery.bATP content of SRF after a centrifugation of 470 x g for
4 min at 37'C to remove protozoa; expressed on the basis ofdry weight of washed bacteria prepared from an aliquot ofthe fluid. All other manipulations in experiments 1 and 2were carried out as described in Materials and Methods.
number of the functionally important species.Figure 3 illustrates the variation of the ATPcontent of Selenomonas ruminantium duringgrowth. The level of ATP was high during theearly exponential phase of growth and de-creased by half in the late exponential phase; itthen dropped off precipitously during the sta-tionary phase. This type of profile for ATP wastypical for all the species of bacteria studied(Table 9) except that the ATP pools of somespecies, e.g., Bacteroides amylophilus andRuminococcus albus, remained nearly con-stant during the exponential phase ofgrowh.
DISCUSSIONA number of methods were tested to deter-
mine their efficiency in extracting ATP fromeither SRF or its particulate fraction. The two
APPL. ENVIRON. MICROBIOL.534 FORSBERG AND LAM
on May 7, 2018 by guest
http://aem.asm
.org/D
ownloaded from

ATP AS INDICATOR OF RUMEN M[CROBIOTA BIOMASS 535
1.0
E 0.6c 0Q5
0.4L)O.3
0o 0.2
10
o U8- 6 Xn- 5 7t- 3 E
0)- 21
I 10 50 100 200 1200
MinutesFIG. 3. ATP pool size of Selenomonas ruminan-
tium during growth.
most efficient methods for extracting ATP were
those using boiling 0.1 M NaHCO3 (modifica-tion of the method by Christian et al. [6]) andcold 0.6 N H2SO4, described by Lee et al. (17).Both techniques gave incomplete recoveries ofATP when used to measure the ATP in particu-late materials from rumen contents of a cow on
a ration of hay. The recovery of ATP using theH2SO4 extraction procedure was the greater,and, since it was better suited for particulatesamples, the factors influencing the recovery ofATP by this technique were examined.The inclusion of [14C]ATP in the extraction of
ATP from whole rumen contents, SRF, andparticulate materials revealed that the low re-
covery of endogenous ATP was not caused bybinding ofATP to sedimentable materials. Thelowest recovery of added nonradioactive ATPoccurred when the strained particulate fractionofrumen contents was extracted, and the losseswere increased if samples were frozen beforeassay. By decreasing the time of extractionwith H2SO4 and assaying samples immediatelyafter extraction, the low recovery of measura-ble ATP was largely corrected.The apparent loss of ATP from neutralized
extracts of the particulate materials did notoccur when they were incubated at 300C. Heat-ing the neutralized extracts decreased theamount of ATP lost during freezing and thaw-ing; in fact, in some cases the concentration ofATP was actually increased. These observationsare consistent with the loss in ATP beingcaused by the extraction of a soluble compo-nent(s) from plant material, which forms com-
plexes with ATP, either in acid solution or dur-ing freezing and thawing, and thereby preventsthe reaction with luciferase. The higher recov-
ery of ATP in neutralized extracts prepared
from the SRF fraction and the decreased lossesresulting from freezing and thawing suggestthat the inhibitor was absent from the SRF.The greater proportion of the ATP in rumen
contents of the cow on a ration of hay pluscereal was present in the SRF fraction, whereasthe inverse was observed when the cow was ona hay ration. Seventy-four percent of the ATPin the SRF from the latter animal was sedi-mented by an extremely low centrifugal force(175 x g for 5 min), indicating that the bulk ofthe ATP was present in microbes associatedwith plant material and protozoa. From an ap-plied point of view, these observations suggestthat the proportion of microbial biomass pres-ent in SRF may depend upon the animal ration.Since the types of bacteria in the fluid and onthe particulate material are different (18), theuse of SRF in in vitro experiments could beopen to criticism because the population of mi-crobes in the inoculum is changed from wholerumen contents.To serve as a reliable indicator of microbial
biomass, ATP must be present at a uniformconcentration in viable microbes and absentfrom dead microbes and other materials. ATPwas absent from the animal ration (dried al-falfa hay and corn-based supplement) fed inthese experiments. The ATP content of freshgrass and silage has not been determined.Therefore, no recommendations can be madeabout the suitability of ATP as an indicator ofrumen microbial biomass for animals on rationsof fresh grass and silage. There presumably is acontinual sloughing of epithelial tissue fromthe rumen wall; however, because of the in-creased lysozomal activity in this tissue (16), itprobably is partially autolyzed and thereforedepleted in ATP.We found that ATP added to "cell-free" rumen
TABLE 9. ATP pool sizes of nine species of rumenbacteria during the exponential phase ofgrowth in
artificial medium
Genera- ug ofBacterium tion time ATP/mg
(min) (dry wt)aStreptococcus bovis S-b-3 24 17.6Bacteroides ruminicola subsp. rum- 57 6.5
inicola 23Selenomonas ruminantium strain D 57 3.9Butyrivibrio fibrisolvens Dl 80 2.8Megasphaera elsdenii B-159 94 4.5Ruminococcus albus B-199 95 1.1Bacteroides succinogenes S-85 107 1.8Bacteroides amylophilus 70 112 2.6Eubacterium ruminantium GA 195 127 3.5
a Each value is the average of three extractions at cul-ture OD readings of approximately 0.20, 0.40, and 0.70during exponential growth.
0.1
VOL. 33, 1977
on May 7, 2018 by guest
http://aem.asm
.org/D
ownloaded from

536 FORSBERG AND LAM
fluid gradually disappeared (t112 = 85 min; Fig.2). This loss in ATP was probably due to thepresence ofATP-hydrolyzing enzymes. Since noattempt was made to identify reaction products,this proposal cannot be confirmed. The ob-served absence ofATP in the supernatant fromcentrifuged rumen fluid supports this conten-tion. Thus, under our experimental conditions,the ATP in the rumen is limited to bacteria andprotozoa.The ATP concentration in the isolated proto-
zoal fraction was 10-fold higher than in thebacterial fraction. Although precautions weretaken to maintain anaerobiosis and a constanttemperature, the possibility cannot be excludedthat the values obtained, particularly for theprotozoa, were changed as a result of metabolicdisturbances that may have occurred duringthe separation procedure. For example, it hasbeen observed that exposure of Clostridiumacetobutylicum to aerobic conditions leads to afall in the ATP pool size (19).The ATP pool sizes of functionally important
rumen bacteria growing exponentially in artifi-cial media varied by a factor of 16, from 1.1 ,ugofATP per mg of dry weight for R. albus to 17.6,ug of ATP per mg for S. bovis. Most of thevalues were higher than that found for theisolated population of rumen bacteria. Barringsome effect related to the extraction proce-dures, this is expected for a number of reasons.The rumen contains many genera of bacteriathat undoubtedly have different ATP pool sizes.The different types of bacteria have differentdegrees of affinity for particulate material (18),whereas the isolated bacterial fraction con-tained only those free in solution. In the rumen,microbial growth may be limited by the availa-bility of carbohydrate (14), and for this reasonbacteria, and particularly those free in solu-tion, may be expected to have a decreased ATPpool size. This effect possibly is accentuated inanimals on a roughage diet. In Escherichiacoli, glucose-limited growth leads to lower poollevels of ATP (7).Whether ATP reflects the overall metabolic
activity of the rumen microbiota remains to bedetermined. The correlation of the concentra-tion of ATP in the microbial fraction through-out the day with feed intake and ration compo-sition should shed light on this subject.These data show that considerable caution
must be used in interpreting microbial biomassdata in rumen contents based on ATP concen-trations. ATP presumably can be used as anindicator of biomass where animals are receiv-ing a uniform ration free from ATP. However,
measurement of ATP in fractionated rumencontents can lead to discrepancies.
ACKNOWLEDGMENTSWe would like to thank J. Burton (Department of Nutri-
tion) for access to his fistulated cows.This investigation was supported by grants to C. W. F.
from Agriculture Canada and the Ontario Ministry of Agri-culture and Food.
LITERATURE CITED
1. Abou Akkada, A. R., D. A. Messmer, L. R. Fina, and E.E. Bartley. 1968. Distribution of 2-aminoethylphos-phonic acid in some rumen microorganisms. J. DairySci. 51:78-81.
2. Ausmus, B. S. 1973. The use of the ATP assay in terres-trial decomposition studies. Bull. Ecol. Res. Com-mun. 17:223-234.
3. Bagnara, A. S., and L. R. Finch. 1972. Quantitativeextraction and estimation of intracellular nucleosidetriphosphates from Escherichia coli. Anal. Biochem.45:24-34.
4. Bray, G. A. 1960. A simple efficient liquid scintillatorfor counting aqueous solutions in a liquid scintilla-tion counter. Anal. Biochem. 1:279-285.
5. Bryant, M. P. 1972. Commentary on the Hungate tech-nique for culture of anaerobic bacteria. Am. J. Clin.Nutr. 25:1324-1328.
6. Christian, R. R., K. Bancroft, and W. J. Wiebe. 1975.Distribution of microbial adenosine triphosphate insalt marsh sediments at Sapelo Island, Georgia. SoilSci. 119:89-97.
7. Cole, H. A., J. W. T. Wimpenny, and D. E. Hughes.1967. The ATP-pool in Escherichia coli. I. Measure-ment of the pool using a modified luciferase assay.Biochim. Biophys. Acta 143:445-453.
8. Czerkawski, J. W. 1974. Methods for determining 2,6-diaminopimelic acid and 2-aminoethyl-phosphonicacid in gut contents. J. Sci. Food Agric. 25:45-55.
9. Dhople, A. M., and J. H. Hanks. 1973. Quantitativeextraction of adenosine triphosphate from cultivableand host-grown microbes: calculation of adenosinetriphosphate pools. Appl. Microbiol. 26:399-403.
10. Holm-Hansen, 0. 1973. The use of ATP determinationsin ecological studies. Bull. Ecol. Res. Commun.17:215-222.
11. Holm-Hansen, O., and C. R. Booth. 1966. The measure-ment of adenosine triphosphate in the ocean and itsecological significance. Limnol. Oceanogr. 11:510-519.
12. Horiguchi, M., and M. Kandatsu. 1959. Isolation of 2-aminoethane phosphonic acid from rumen protozoa.Nature (London) 184:901-902.
13. Hungate, R. E. 1950. The anaerobic mesophilic cellulo-lytic bacteria. Bacteriol. Rev. 14:1-49.
14. Hungate, R. E. 1975. The rumen microbial ecosystem.Annu. Rev. Ecol. Syst. 6:39-65.
15. Kittredge, J. S., and E. Roberts. 1969. A carbon-phos-phorus bond in nature. Science 164:37-42.
16. Lavker, R. M., and A. G. Matoltsy. 1970. Formation ofhorny cells: the fate of cell organelles and differentia-tion products in ruminal epithelium. J. Cell Biol.44:501-512.
17. Lee, C. C., R. F. Harris, J. D. H. Williams, D. E.Armstrong, and J. K. Syers. 1971. Adenosine triphos-phate in lake sediments: I. Determination. Soil Sci.Soc. Am. Proc. 35:82-86.
18. Minato, H., A. Endo, M. Higuchi, Y. Ootomo, and T.Uemura. 1966. Ecological treatise on the rumen fer-mentation. I. The fractionation of bacteria attached
APPL. ENVIRON. MICROBIOL.
on May 7, 2018 by guest
http://aem.asm
.org/D
ownloaded from
ATP AS INDICATOR OF RUMEN MICROBIOTA BIOMASS
to the rumen digesta solids. J. Gen. Appl. Microbiol.12:39-52.
19. O'Brien, R. W., and J. G. Morris. 1971. Oxygen and thegrowth and metabolism of Clostridium acetobutyli-cum. J. Gen. Microbiol. 68:307-318.
20. Patterson, J. W., P. L. Brezonik, and H. D. Putnam.1970. Measurement and significance of adenosine tri-phosphate in activated sludge. Environ. Sci. Technol.
4:569-575.21. Scott, H. W., and B. A. Dehority. 1965. Vitamin re-
quirements of several cellulolytic rumen bacteria. J.Bacteriol; 89:1169-1175.
22. Toennies, G., and D. L. Gallant. 1949. The relationbetween photometric turbidity and bacterial concen-tration (Bacterimetric studies. IV). Growth 8:7-20.
VOL. 33, 1977 537
on May 7, 2018 by guest
http://aem.asm
.org/D
ownloaded from