Embed Size (px)
Citation preview

1
FY 2012
USDA/FNS SUPPLEMENTAL FOOD PROGRAMS DIVISION
WIC BREASTFEEDING DATA LOCAL AGENCY REPORT

2
2
Table of Contents
Abstract 3-4
Participation by Region 5
Two-Year Comparison 6
Breastfeeding Data by Local Agencies 7- 28
Alphabetical Listing of Breastfeeding Data by 29-53 Local Agencies
Highest % Fully Breastfed Infants 54-78

3
Breastfeeding promotion and support is a priority in the WIC Program and is a core component
of the nutrition services that the WIC Program provides to meet its mission of safeguarding the
health of low-income women, infants and children. Research continues to reinforce breastfeeding
as the best source of nutrition for infants as it provides numerous health, nutritional, economical
and emotional benefits to both mother and infant. The WIC Program has achieved many
accomplishments in promoting and supporting breastfeeding and continues to build upon these
successes through its various breastfeeding efforts. Breastfeeding rates are steadily improving
among WIC participants nationwide thanks to the efforts of WIC staff who provide the education
and support mothers need to successfully breastfeed. This is the third year that State and local
WIC agency breastfeeding performance measurements have been collected and published. This
year’s report is a compilation of fiscal year (FY) 2012 breastfeeding performance measurements
based on program participant data of the number of partially and fully breastfed infants for each
WIC State and local agency. The Healthy, Hunger-Free Kids Act of 2010 (the Act), Public Law
111-296, requires The Department of Agriculture to annually compile and publish breastfeeding
performance measurements.
The collection and publication of breastfeeding performance measurements is one of several
provisions in the Act that strengthens the WIC Program’s emphasis on breastfeeding promotion
and support and underscores the importance of exclusive, continued breastfeeding to the health
of WIC participants. This reporting requirement provides an exciting opportunity to help further
the efforts of WIC State and local agencies by highlighting agencies that demonstrate success in
breastfeeding through high breastfeeding rates and by motivating other agencies to strengthen
their breastfeeding promotion and support services with the goal of increasing their breastfeeding
rates. The breastfeeding performance measurements will be used in the process to determine
awardees for initiatives that recognize the exemplary performance of WIC State and local
agencies in breastfeeding such as the Loving Support Awards for Excellence and the WIC
Breastfeeding Performance Bonus Awards. Additionally, the collection of these data allows
WIC to track breastfeeding data trends in the WIC Program.
The data indicate an overall 0.8 percentage increase in the number of total WIC infants reported
as breastfed from 28.2% in FY 2011 to 29.0% in FY 2012. This increase in breastfeeding rates
represents the successful efforts of WIC State and local agencies in continuing to provide quality

2
4
breastfeeding services, including peer counseling, to WIC participants. Other highlights from
the FY 2012 WIC Breastfeeding Data Report include:
An average of almost 2.07 million infants participated in the WIC Program nationally.
Approximately 29% of infants were reported as breastfed nationally (12.1% were fully
breastfed and 16.9 % were partially breastfed).
The Northeast, Western and Southwest Regions’ performance measurements were above
the national average with 37.4%, 36.9%, and 34.1% of infants reported as breastfed
respectively.
In the Mountain Plains and Western regions, the percentage of fully breastfed infants is
higher than the percentage of partially breastfed infants.
Western Region had the greatest percentage of infants reported as fully breastfed –
20.6%.
The data indicate a 0.9 percentage point increase from 11.2% to 12.1% in fully breastfed.
The percentage of partially breastfed infants remained stable.

5
0.0%
5.0%
10.0%
15.0%
20.0%
25.0%
30.0%
NortheastRegion
MidAtlanticRegion
SoutheastRegion
MidwestRegion
SouthwestRegion
MountainPlainsRegion
WesternRegion
NationalTotal
% Fully Breastfed 9.1% 10.5% 8.3% 9.9% 8.9% 15.7% 20.6% 12.1%
% Partially Breastfed 28.3% 13.8% 15.0% 10.2% 25.2% 10.1% 16.4% 16.9%
9.1% 10.5%
8.3% 9.9%
8.9%
15.7%
20.6%
12.1%
28.3%
13.8% 15.0%
10.2%
25.2%
10.1%
16.4% 16.9%
% o
f In
fan
ts B
reas
tfe
d
Infant Breastfeeding Participation by Region FY 2012

6
NortheastRegion
MidAtlanticRegion
SoutheastRegion
MidwestRegion
SouthwestRegion
MountainPlainsRegion
WesternRegion
NationalTotal
FY 2011 8.4% 9.8% 7.2% 9.1% 8.5% 13.8% 19.7% 11.2%
FY 2012 9.1% 10.5% 8.3% 9.9% 8.9% 15.7% 20.6% 12.1%
8.4% 9.8% 7.2%
9.1% 8.5%
13.8%
19.7%
11.2% 9.1% 10.5%
8.3% 9.9%
8.9%
15.7%
20.6%
12.1%
% o
f Fu
lly B
reas
tfe
d In
fan
ts
Fully Breastfed Infants
NortheastRegion
MidAtlanticRegion
SoutheastRegion
MidwestRegion
SouthwestRegion
MountainPlainsRegion
WesternRegion
NationalTotal
FY 2011 28.0% 12.4% 16.3% 10.3% 23.7% 12.4% 16.6% 17.0%
FY 2012 28.3% 13.8% 15.0% 10.2% 25.2% 10.1% 16.4% 16.9%
28.0%
12.4%
16.3%
10.3%
23.7%
12.4%
16.6% 17.0%
28.3%
13.8% 15.0%
10.2%
25.2%
10.1%
16.4% 16.9%
% o
f P
arti
ally
Bre
astf
ed
Infa
nts
Partially Breastfed Infants
Two-Year Comparison, FY 2011 and FY 2012
NortheastRegion
MidAtlanticRegion
SoutheastRegion
MidwestRegion
SouthwestRegion
MountainPlains Region
WesternRegion
NationalTotal
FY 2011 36.4% 22.2% 23.5% 19.4% 32.3% 26.2% 36.2% 28.2%
FY 2012 37.4% 24.4% 23.4% 20.1% 34.1% 25.8% 36.9% 29.0%
36.4%
22.2% 23.5% 19.4%
32.3%
26.2%
36.2%
28.2%
37.4%
24.4% 23.4% 20.1%
34.1%
25.8%
36.9%
29.0%
% o
f To
tal B
reas
tfe
d In
fan
ts
Total Breastfed Infants

TVCCA WIC Program 106 237 343 746 1,089 9.7% 21.8% 31.5% 68.5%
Optimus Health Care WIC Program 79 483 562 1,324 1,886 4.2% 25.6% 29.8% 70.2%
Hartford Health Department 71 404 475 1,423 1,898 3.7% 21.3% 25.0% 75.0%
Hospital of St. Raphael 141 481 622 1,422 2,044 6.9% 23.5% 30.4% 69.6%
Stamford WIC Program 56 265 321 830 1,151 4.9% 23.0% 27.9% 72.1%
Waterbury Hlth Dept. WIC Program 64 266 330 1,122 1,452 4.4% 18.3% 22.7% 77.3%
Meriden WIC Program 109 175 284 635 919 11.9% 19.0% 30.9% 69.1%
Access/Windham WIC Program 65 72 137 441 578 11.2% 12.5% 23.7% 76.3%
Bristol Hospital WIC Program 71 194 265 884 1,149 6.2% 16.9% 23.1% 76.9%
Danbury WIC Program 65 198 263 325 588 11.1% 33.7% 44.7% 55.3%
Family Strides/Torrington WIC Program 35 63 98 195 293 11.9% 21.5% 33.4% 66.6%
East Hartford WIC Program 87 172 259 820 1,079 8.1% 15.9% 24.0% 76.0%
949 3,009 3,958 10,167 14,125 6.7% 21.3% 28.0% 72.0%
Aroostook County Action Program 52 10 62 344 406 12.8% 2.5% 15.3% 84.7%
City of Bangor, Health & Community
Services Department 149 21 170 615 785 19.0% 2.7% 21.7% 78.3%
MidCoast Maine Community Action
Program 120 17 137 395 532 22.6% 3.2% 25.8% 74.2%
Downeast Health Services, INC. 69 9 78 284 362 19.1% 2.5% 21.5% 78.5%
Health Reach Network 215 24 239 639 878 24.5% 2.7% 27.2% 72.8%
Peoples Regional Opportunity Program 157 15 172 683 855 18.4% 1.8% 20.1% 79.9%
Western Maine Cap 159 31 190 822 1,012 15.7% 3.1% 18.8% 81.2%
York County Community Action Corp. 172 32 204 625 829 20.7% 3.9% 24.6% 75.4%
1,094 159 1,253 4,406 5,659 19.3% 2.8% 22.1% 77.9%
Dorchester North WIC 72 164 236 163 399 18.0% 41.1% 59.1% 40.9%
Blue Hill Corridor WIC 52 136 188 258 446 11.7% 30.5% 42.2% 57.8%
South End WIC 61 238 299 324 623 9.8% 38.2% 48.0% 52.0%
Chelsea/Revere WIC 174 326 500 611 1,111 15.7% 29.3% 45.0% 55.0%
Jamaica Plain WIC 37 150 187 320 507 7.3% 29.6% 36.9% 63.1%
Roxbury WIC 43 131 174 305 479 9.0% 27.3% 36.3% 63.7%
Brighton/Roslindale WIC 110 102 212 261 473 23.3% 21.6% 44.8% 55.2%
Quincy WIC 127 241 368 658 1,026 12.4% 23.5% 35.9% 64.1%
South Boston WIC 15 37 52 77 129 11.6% 28.7% 40.3% 59.7%
Springfield South WIC 71 126 197 726 923 7.7% 13.7% 21.3% 78.7%
Framingham/Waltham WIC 117 284 401 573 974 12.0% 29.2% 41.2% 58.8%
Plymouth WIC 78 54 132 395 527 14.8% 10.2% 25.0% 75.0%
North Shore WIC 159 423 582 1,068 1,650 9.6% 25.6% 35.3% 64.7%
Holyyoke/Chicopee WIC 132 142 274 855 1,129 11.7% 12.6% 24.3% 75.7%
Lowell WIC 101 192 293 969 1,262 8.0% 15.2% 23.2% 76.8%
Lawrence WIC 123 439 562 934 1,496 8.2% 29.3% 37.6% 62.4%
Cambridge/Somerville WIC 174 307 481 414 895 19.4% 34.3% 53.7% 46.3%
Fall River WIC 92 46 138 739 877 10.5% 5.2% 15.7% 84.3%
Berkshire North WIC 78 55 133 386 519 15.0% 10.6% 25.6% 74.4%
New Bedford WIC 88 126 214 816 1,030 8.5% 12.2% 20.8% 79.2%
Northern Essex WIC 76 83 159 468 627 12.1% 13.2% 25.4% 74.6%
Worcester WIC 203 427 630 1,052 1,682 12.1% 25.4% 37.5% 62.5%
Franklin/Hampshire/North Quabbin WIC 124 74 198 340 538 23.0% 13.8% 36.8% 63.2%
North Central WIC 139 122 261 670 931 14.9% 13.1% 28.0% 72.0%
Brockton WIC 236 332 568 713 1,281 18.4% 25.9% 44.3% 55.7%
South Central WIC 138 105 243 760 1,003 13.8% 10.5% 24.2% 75.8%
Taunton/Attleboro WIC 112 62 174 562 736 15.2% 8.4% 23.6% 76.4%
North Suburban WIC 116 198 314 449 763 15.2% 26.0% 41.2% 58.8%
Cape Cod WIC 119 102 221 368 589 20.2% 17.3% 37.5% 62.5%
East Boston WIC 135 315 450 324 774 17.4% 40.7% 58.1% 41.9%
Berkshire South WIC 30 12 42 59 101 29.7% 11.9% 41.6% 58.4%
Outer Cape WIC 23 20 43 62 105 21.9% 19.0% 41.0% 59.0%
South Cove WIC 8 87 95 230 325 2.5% 26.8% 29.2% 70.8%
Springfield North WIC 99 154 253 1,026 1,279 7.7% 12.0% 19.8% 80.2%
Dorchester South WIC 70 231 301 427 728 9.6% 31.7% 41.3% 58.7%
3,532 6,042 9,574 18,358 27,932 12.6% 21.6% 34.3% 65.7%
Southwestern Comm Services 86 20 106 307 413 20.8% 4.8% 25.7% 74.3%
So New Hampshire SVS 238 150 388 1,598 1,986 12.0% 7.6% 19.5% 80.5%
Belknap-Merrimack CAP 224 74 298 789 1,087 20.6% 6.8% 27.4% 72.6%
Goodwin Community Health 133 30 163 475 638 20.8% 4.7% 25.5% 74.5%
681 274 955 3,169 4,124 16.5% 6.6% 23.2% 76.8%
Women's Health Center of Albany Medical
College 58 103 161 465 626 9.3% 16.5% 25.7% 74.3%
Warren County Health Services 46 29 75 235 310 14.8% 9.4% 24.2% 75.8%
Whitney M. Young, Jr. Health Center, Inc 44 118 162 470 632 7.0% 18.7% 25.6% 74.4%
Commission on Economic Opportunity 56 82 138 668 806 6.9% 10.2% 17.1% 82.9%
Schenectady County Public Health
Services 69 108 177 664 841 8.2% 12.8% 21.0% 79.0%
Fulmont Community Action Agency, Inc 35 55 90 476 566 6.2% 9.7% 15.9% 84.1%
Delaware Opportunities, Inc. 29 19 48 155 203 14.3% 9.4% 23.6% 76.4%
Schoharie County Community Action
Program 18 9 27 102 129 14.0% 7.0% 20.9% 79.1%
Opportunity For Chenango, Inc. 42 18 60 271 331 12.7% 5.4% 18.1% 81.9%
Opportunities For Otsego, Inc. 31 21 52 185 237 13.1% 8.9% 21.9% 78.1%
Catholic Charities of Columbia & Greene
Counties 43 62 105 373 478 9.0% 13.0% 22.0% 78.0%
Washington County Public Health Services 48 32 80 292 372 12.9% 8.6% 21.5% 78.5%
Cayuga County Health Department 48 25 73 334 407 11.8% 6.1% 17.9% 82.1%
Oswego County Opportunities, Inc 76 41 117 640 757 10.0% 5.4% 15.5% 84.5%
Anthony L. Jordan Health Center 55 158 213 890 1,103 5.0% 14.3% 19.3% 80.7%
Society for the Protection and Care of
Children 136 80 216 938 1,154 11.8% 6.9% 18.7% 81.3%
Cortland County Community Action
Program, Inc. 40 19 59 224 283 14.1% 6.7% 20.8% 79.2%
Tioga Opportunities Program, Inc 44 21 65 202 267 16.5% 7.9% 24.3% 75.7%
Partially
Breastfed
Total
Breastfed
Fully
Formula-Fed
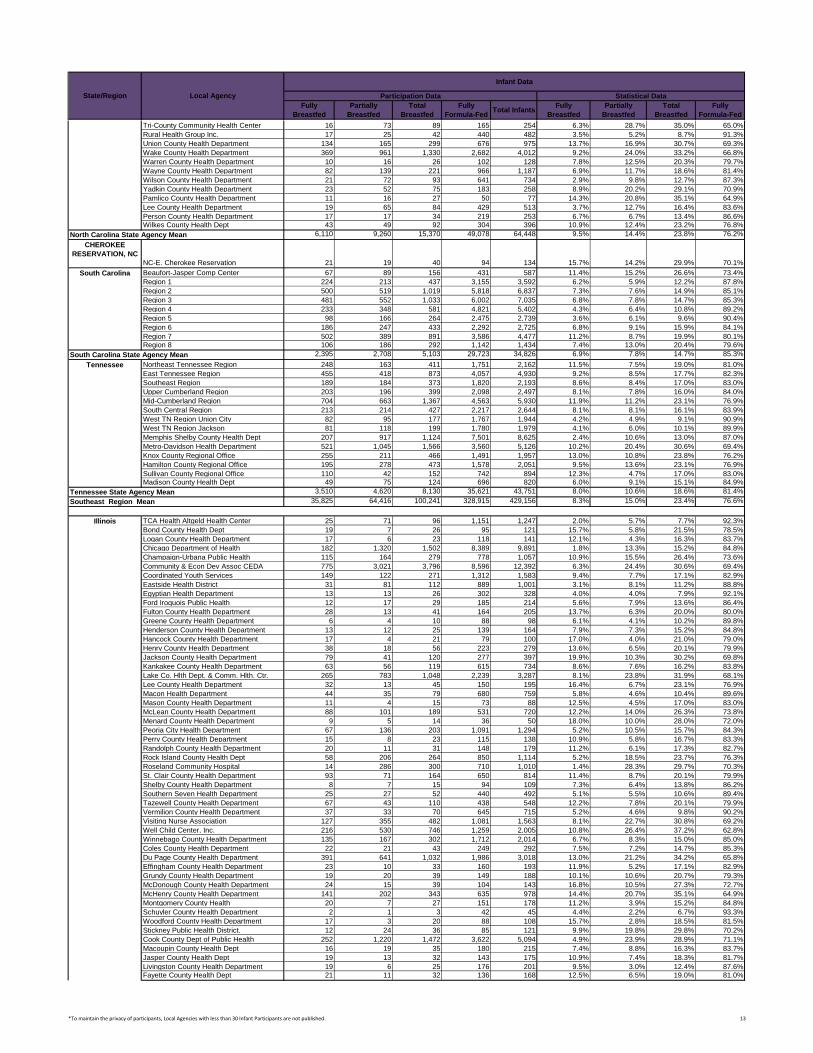
Breastfeeding Data by Local Agencies
FY 2012
State/Region Local Agency
Infant Data
Participation Data Statistical Data
Fully
Breastfed
Partially
Breastfed
Total
Breastfed
Connecticut
Connecticut State Agency Mean
Maine
Maine State Agency Mean
Massachusetts
Massachusetts State Agency Mean
Fully
Formula-Fed Total Infants
Fully
Breastfed
New Hampshire
New Hampshire State Agency Mean
New York
*To maintain the privacy of participants, Local Agencies with less than 30 Infant Participants are not published. 7

Partially
Breastfed
Total
Breastfed
Fully
Formula-Fed
State/Region Local Agency
Infant Data
Participation Data Statistical Data
Fully
Breastfed
Partially
Breastfed
Total
Breastfed
Connecticut
Fully
Formula-Fed Total Infants
Fully
Breastfed
Oneida County Health Department 89 197 286 1,142 1,428 6.2% 13.8% 20.0% 80.0%
Onondaga County Health Department 234 284 518 2,065 2,583 9.1% 11.0% 20.1% 79.9%
Broome County Health Department 165 105 270 837 1,107 14.9% 9.5% 24.4% 75.6%
North Country Children's Clinic 273 209 482 1,761 2,243 12.2% 9.3% 21.5% 78.5%
Essex County Public Health 24 15 39 131 170 14.1% 8.8% 22.9% 77.1%
Clinton County Department of Public Health 58 29 87 313 400 14.5% 7.3% 21.8% 78.3%
Tompkins County Health Department
Dept. 80 57 137 208 345 23.2% 16.5% 39.7% 60.3%
St. Regis Mohawk Services 9 8 17 43 60 15.0% 13.3% 28.3% 71.7%
Cattaraugus County Health Department 47 37 84 380 464 10.1% 8.0% 18.1% 81.9%
Catholic Charities of Buffalo 449 618 1,067 4,454 5,521 8.1% 11.2% 19.3% 80.7%
Livingston County Department of Health 63 27 90 287 377 16.7% 7.2% 23.9% 76.1%
Oak Orchard Community Health Center 76 64 140 524 664 11.4% 9.6% 21.1% 78.9%
Chemung County Health Department 62 47 109 578 687 9.0% 6.8% 15.9% 84.1%
Monroe County Health Department 199 284 483 1,735 2,218 9.0% 12.8% 21.8% 78.2%
ProAction of Steuben & Yates, Inc 67 29 96 413 509 13.2% 5.7% 18.9% 81.1%
Saratoga County EOC, Inc 57 46 103 380 483 11.8% 9.5% 21.3% 78.7%
Ulster County Health Department 64 80 144 421 565 11.3% 14.2% 25.5% 74.5%
Sullivan County Public Health Nursing
Service 61 79 140 333 473 12.9% 16.7% 29.6% 70.4%
Putnam County Health Department 21 76 97 134 231 9.1% 32.9% 42.0% 58.0%
Orange County Health Department 215 567 782 508 1,290 16.7% 44.0% 60.6% 39.4%
Rockland County Health Department 666 958 1,624 739 2,363 28.2% 40.5% 68.7% 31.3%
Hudson River Healthcare, Inc 155 303 458 778 1,236 12.5% 24.5% 37.1% 62.9%
Open Door Family Medical Center 92 227 319 156 475 19.4% 47.8% 67.2% 32.8%
Mt. Vernon Neighborhood Health Center,
Inc. 21 278 299 349 648 3.2% 42.9% 46.1% 53.9%
Sound Shore Medical Center 69 824 893 954 1,847 3.7% 44.6% 48.3% 51.7%
Westchester County Department of Health 167 896 1,063 1,129 2,192 7.6% 40.9% 48.5% 51.5%
East Harlem Council For Human Services,
Inc 4 125 129 125 254 1.6% 49.2% 50.8% 49.2%
William F. Ryan Community Health Center 50 201 251 496 747 6.7% 26.9% 33.6% 66.4%
Gouverneur Hospital (NYCHHC) 20 265 285 744 1,029 1.9% 25.8% 27.7% 72.3%
New York Downtown Hospital 10 81 91 263 354 2.8% 22.9% 25.7% 74.3%
St. Luke's-Roosevelt Hospital Center 28 147 175 301 476 5.9% 30.9% 36.8% 63.2%
Harlem Hospital (NYCHHC) 76 478 554 777 1,331 5.7% 35.9% 41.6% 58.4%
North Central Bronx Hospital (NYCHHC) 31 830 861 1,040 1,901 1.6% 43.7% 45.3% 54.7%
New York Presbyterian Medical Center 102 1,162 1,264 1,306 2,570 4.0% 45.2% 49.2% 50.8%
Morrisania Diagnostic and Treatment
Center (NYCHHC) 96 562 658 819 1,477 6.5% 38.1% 44.5% 55.5%
St. Barnabas Hospital 29 829 858 809 1,667 1.7% 49.7% 51.5% 48.5%
Bronx Lebanon Hospital Center 30 477 507 219 726 4.1% 65.7% 69.8% 30.2%
Morris Heights Health Center 24 789 813 753 1,566 1.5% 50.4% 51.9% 48.1%
Montefiore Medical Center 81 905 986 1,829 2,815 2.9% 32.1% 35.0% 65.0%
Urban Health Plan, Inc. 48 567 615 735 1,350 3.6% 42.0% 45.6% 54.4%
Maimonides Medical Center 168 857 1,025 1,099 2,124 7.9% 40.3% 48.3% 51.7%
Jamaica Hospital 48 845 893 1,364 2,257 2.1% 37.4% 39.6% 60.4%
Queens Hospital Center (NYCHHC) 88 781 869 999 1,868 4.7% 41.8% 46.5% 53.5%
Bedford Stuyvesant Family Health Center 26 287 313 386 699 3.7% 41.1% 44.8% 55.2%
Brownsville Community Development Corp. 23 274 297 668 965 2.4% 28.4% 30.8% 69.2%
Brookdale Hospital and Medical Center 15 540 555 551 1,106 1.4% 48.8% 50.2% 49.8%
Public Health Solutions 256 4,222 4,478 4,626 9,104 2.8% 46.4% 49.2% 50.8%
Lutheran Family Health Center 27 1,136 1,163 2,003 3,166 0.9% 35.9% 36.7% 63.3%
Wyckoff Heights Medical Center 104 577 681 1,013 1,694 6.1% 34.1% 40.2% 59.8%
Brooklyn Hospital Center 288 3,307 3,595 411 4,006 7.2% 82.6% 89.7% 10.3%
East New York Diagnostic and Treatment
Center (NYCHHC) 25 303 328 519 847 3.0% 35.8% 38.7% 61.3%
Kings County Hospital Center (NYCHHC) 75 1,336 1,411 1,569 2,980 2.5% 44.8% 47.3% 52.7%
Joseph P. Addabbo Family Health Center 33 385 418 798 1,216 2.7% 31.7% 34.4% 65.6%
Opportunity Development Association of
Williamsburg 566 669 1,235 258 1,493 37.9% 44.8% 82.7% 17.3%
Staten Island University Hospital 57 344 401 673 1,074 5.3% 32.0% 37.3% 62.7%
Elmhurst Hospital Center (NYCHHC) 216 839 1,055 799 1,854 11.7% 45.3% 56.9% 43.1%
Suffolk County Department of Health
Services 194 1,708 1,902 2,855 4,757 4.1% 35.9% 40.0% 60.0%
Nassau County Department of Health 98 1,202 1,300 1,807 3,107 3.2% 38.7% 41.8% 58.2%
Allegany County Department of Health 32 11 43 185 228 14.0% 4.8% 18.9% 81.1%
The Greather Hudson Valley Family Health
Center, Inc 32 173 205 573 778 4.1% 22.2% 26.3% 73.7%
Long Island Jewish Medical Center 46 266 312 317 629 7.3% 42.3% 49.6% 50.4%
Yeled V'Yalda Early Childhood Center 520 938 1,458 324 1,782 29.2% 52.6% 81.8% 18.2%
Coney Island Hospital (NYCHHC) 95 471 566 501 1,067 8.9% 44.1% 53.0% 47.0%
Planned Parenthood Mohawk Hudson 90 65 155 603 758 11.9% 8.6% 20.4% 79.6%
Research Foundation of SUNY Stony
Brook 57 246 303 797 1,100 5.2% 22.4% 27.5% 72.5%
Richmond University Medical Center 48 244 292 547 839 5.7% 29.1% 34.8% 65.2%
Catholic Charities of Rockville Center 29 239 268 275 543 5.3% 44.0% 49.4% 50.6%
Middletown Community Health Center 12 12 24 128 152 7.9% 7.9% 15.8% 84.2%
East Side WIC Program (NYCHHC) 330 1,174 1,504 1,068 2,572 12.8% 45.6% 58.5% 41.5%
North Brooklyn Health Network (NYCHHC) 46 529 575 1,012 1,587 2.9% 33.3% 36.2% 63.8%
Lincoln Hospital 71 976 1,047 880 1,927 3.7% 50.6% 54.3% 45.7%
Chautauqua County Health Department 89 63 152 691 843 10.6% 7.5% 18.0% 82.0%
Catholic Charities Brooklyn Neighborhood 33 404 437 512 949 3.5% 42.6% 46.0% 54.0%
Institute for Family Health 20 314 334 531 865 2.3% 36.3% 38.6% 61.4%
8,890 40,493 49,383 69,910 119,293 7.5% 33.9% 41.4% 58.6%
SENECA NATION,
NY Seneca Nation Health Department 1 6 7 36 43 2.3% 14.0% 16.3% 83.7%
Women and Infants Hospital 25 46 71 458 529 4.7% 8.7% 13.4% 86.6%
St. Joseph Health Services 15 32 47 267 314 4.8% 10.2% 15.0% 85.0%
New York
New York State Agency Mean
Rhode Island
*To maintain the privacy of participants, Local Agencies with less than 30 Infant Participants are not published. 8

Partially
Breastfed
Total
Breastfed
Fully
Formula-Fed
State/Region Local Agency
Infant Data
Participation Data Statistical Data
Fully
Breastfed
Partially
Breastfed
Total
Breastfed
Connecticut
Fully
Formula-Fed Total Infants
Fully
Breastfed
Eastbay Community Action Program 67 41 108 470 578 11.6% 7.1% 18.7% 81.3%
Tri-Town Health Center 48 21 69 305 374 12.8% 5.6% 18.4% 81.6%
West Bay Community Action, Inc. 41 30 71 382 453 9.1% 6.6% 15.7% 84.3%
Wood River Health Services 21 7 28 91 119 17.6% 5.9% 23.5% 76.5%
Family Health Services of Cranston 26 21 47 305 352 7.4% 6.0% 13.4% 86.6%
Thundermist Health Center 64 34 98 565 663 9.7% 5.1% 14.8% 85.2%
PCHC, INC 83 219 302 1,055 1,357 6.1% 16.1% 22.3% 77.7%
Children's Friend & Service 38 122 160 663 823 4.6% 14.8% 19.4% 80.6%
429 571 1,000 4,561 5,561 7.7% 10.3% 18.0% 82.0%
VT Dept Health Barre 77 32 109 179 288 26.7% 11.1% 37.8% 62.2%
VT Dept. Health Bennington 31 20 51 132 183 16.9% 10.9% 27.9% 72.1%
VT Department Health Brattleboro 50 14 64 82 146 34.2% 9.6% 43.8% 56.2%
VT Dept Health Burlington 153 88 241 272 513 29.8% 17.2% 47.0% 53.0%
VT Dept Health Middlebury 46 15 61 67 128 35.9% 11.7% 47.7% 52.3%
VT Dept Health Newport 58 13 71 138 209 27.8% 6.2% 34.0% 66.0%
VT Dept Health Rutland 65 28 93 223 316 20.6% 8.9% 29.4% 70.6%
VT Dept Health St. Albans 72 34 106 212 318 22.6% 10.7% 33.3% 66.7%
VT Dept Health St. Johnsbury 65 18 83 125 208 31.3% 8.7% 39.9% 60.1%
VT Dept Health Springfield 43 19 62 131 193 22.3% 9.8% 32.1% 67.9%
VT Dept Health White River 48 17 65 120 185 25.9% 9.2% 35.1% 64.9%
VT Dept of Health Morrisville 74 19 93 89 182 40.7% 10.4% 51.1% 48.9%
781 317 1,098 1,769 2,867 27.2% 11.1% 38.3% 61.7%
16,359 50,872 67,231 112,406 179,637 9.1% 28.3% 37.4% 62.6%
Division of Public Health/Milford Clinic 183 127 310 2,125 2,435 7.5% 5.2% 12.7% 87.3%
Division of Public Health/Hudson Clinic 168 251 419 2,716 3,135 5.4% 8.0% 13.4% 86.6%
350 378 728 4,841 5,569 6.3% 6.8% 13.1% 86.9%
Unity Health Care 103 371 474 1,837 2,311 4.5% 16.1% 20.5% 79.5%
Children's National Medical Center 97 217 314 885 1,199 8.1% 18.1% 26.2% 73.8%
Mary's Center for Maternal & Child Care 31 278 309 354 663 4.7% 41.9% 46.6% 53.4%
Howard University Hospital 32 72 104 506 610 5.2% 11.8% 17.0% 83.0%
263 938 1,201 3,582 4,783 5.5% 19.6% 25.1% 74.9%
Allegany County WIC Program 61 21 82 379 461 13.2% 4.6% 17.8% 82.2%
Anne Arundel County WIC Program 350 339 689 1,625 2,314 15.1% 14.6% 29.8% 70.2%
Baltimore County WIC Program 400 765 1,165 2,994 4,159 9.6% 18.4% 28.0% 72.0%
Caroline County WIC Program 111 82 193 539 732 15.2% 11.2% 26.4% 73.6%
Carroll County WIC Program 71 58 129 378 507 14.0% 11.4% 25.4% 74.6%
Harford County WIC Program 232 137 369 1,163 1,532 15.1% 8.9% 24.1% 75.9%
Montgomery Co. (Community Clinic Inc.)
WIC Program 681 2,995 3,676 3,012 6,688 10.2% 44.8% 55.0% 45.0%
Prince Georges County WIC Program 337 1,338 1,675 2,652 4,327 7.8% 30.9% 38.7% 61.3%
Washington County WIC Program 155 89 244 735 979 15.8% 9.1% 24.9% 75.1%
Wicomico County Health Department 123 205 328 1,006 1,334 9.2% 15.4% 24.6% 75.4%
Baltimore City WIC Program 256 551 807 3,698 4,505 5.7% 12.2% 17.9% 82.1%
Queen Anne's County WIC Program 43 28 71 243 314 13.7% 8.9% 22.6% 77.4%
Garrett County WIC Program 34 14 48 142 190 17.9% 7.4% 25.3% 74.7%
Charles County WIC Program 145 249 394 1,306 1,700 8.5% 14.6% 23.2% 76.8%
John's Hopkins WIC Program 175 472 647 1,736 2,383 7.3% 19.8% 27.2% 72.8%
Frederick County WIC Program 109 252 361 716 1,077 10.1% 23.4% 33.5% 66.5%
Howard County WIC Program 132 274 406 501 907 14.6% 30.2% 44.8% 55.2%
Greater Baden WIC Program 83 311 394 869 1,263 6.6% 24.6% 31.2% 68.8%
3,499 8,182 11,681 23,691 35,372 9.9% 23.1% 33.0% 67.0%
Atlantic City WIC Program 106 296 402 1,150 1,552 6.8% 19.1% 25.9% 74.1%
Burlington County WIC Program 178 174 352 902 1,254 14.2% 13.9% 28.1% 71.9%
Tri-County WIC Program 434 777 1,211 3,602 4,813 9.0% 16.1% 25.2% 74.8%
E. Orange WIC Program 91 398 489 842 1,331 6.8% 29.9% 36.7% 63.3%
Gloucester County WIC Program 87 110 197 745 942 9.2% 11.7% 20.9% 79.1%
Jersey City Dept Hum Res WIC Program 132 733 865 1,394 2,259 5.8% 32.4% 38.3% 61.7%
VNA of Central Jersey, Inc. 497 1,223 1,720 3,010 4,730 10.5% 25.9% 36.4% 63.6%
Newark WIC Program 132 1,094 1,226 1,777 3,003 4.4% 36.4% 40.8% 59.2%
N Hudson Community Action Corp. 265 826 1,091 1,139 2,230 11.9% 37.0% 48.9% 51.1%
Norwescap WIC Program 138 261 399 734 1,133 12.2% 23.0% 35.2% 64.8%
Plainfield WIC Program 39 205 244 636 880 4.4% 23.3% 27.7% 72.3%
St. Joseph's Hospital & Med Center 496 1,447 1,943 2,663 4,606 10.8% 31.4% 42.2% 57.8%
Children's Home Society of New Jersey's
Mercer WIC Program 249 354 603 1,122 1,725 14.4% 20.5% 35.0% 65.0%
UMDNJ WIC Program 63 509 572 780 1,352 4.7% 37.6% 42.3% 57.7%
Ocean County WIC Program 960 932 1,892 1,511 3,403 28.2% 27.4% 55.6% 44.4%
Passaic WIC Program 102 359 461 895 1,356 7.5% 26.5% 34.0% 66.0%
Trinitas Hospital WIC Program 149 669 818 1,138 1,956 7.6% 34.2% 41.8% 58.2%
4,120 10,366 14,486 24,039 38,525 10.7% 26.9% 37.6% 62.4%
Allegheny County Health Department 580 132 712 3,723 4,435 13.1% 3.0% 16.1% 83.9%
Broad Top Area Medical Center 101 7 108 386 494 20.4% 1.4% 21.9% 78.1%
Maternal & Family Hlth Svcs, Inc. 1,789 416 2,205 10,814 13,019 13.7% 3.2% 16.9% 83.1%
Crozer-Chester Medical Center 282 96 378 2,176 2,554 11.0% 3.8% 14.8% 85.2%
Community Progress Council, Inc. 220 49 269 1,304 1,573 14.0% 3.1% 17.1% 82.9%
Hamilton Health Ctrs 171 76 247 1,292 1,539 11.1% 4.9% 16.0% 84.0%
Fayette Co. Community Action Agency 63 5 68 683 751 8.4% 0.7% 9.1% 90.9%
Bucks County Health Department 243 55 298 1,079 1,377 17.6% 4.0% 21.6% 78.4%
Chester County Health Department 266 93 359 867 1,226 21.7% 7.6% 29.3% 70.7%
Bradford Hospital WIC Program 45 0 45 215 260 17.3% 0.0% 17.3% 82.7%
United Neighborhood Facilities Hlth Care
Corp. 323 38 361 1,405 1,766 18.3% 2.2% 20.4% 79.6%
Community Health Services, Inc. 206 9 215 637 852 24.2% 1.1% 25.2% 74.8%
Community Action Southwest 114 10 124 843 967 11.8% 1.0% 12.8% 87.2%
Home Nursing Agency, WIC Program 251 19 270 846 1,116 22.5% 1.7% 24.2% 75.8%
Comm Action Prog/Lanc Co. Inc. 364 88 452 1,656 2,108 17.3% 4.2% 21.4% 78.6%
Shenango Valley Urban League, Inc. 182 19 201 721 922 19.7% 2.1% 21.8% 78.2%
Comm Act. Partnership of Cambria Co. 106 16 122 534 656 16.2% 2.4% 18.6% 81.4%
N Cent Org Reg For Total Health 1,427 495 1,922 14,084 16,006 8.9% 3.1% 12.0% 88.0%
N Cent PA Reg Plng/Dev Commission 175 30 205 718 923 19.0% 3.3% 22.2% 77.8%
Bi-County WIC Program 189 18 207 642 849 22.3% 2.1% 24.4% 75.6%
Mon Valley Comm Hlth SVCS, Inc. 200 25 225 1,008 1,233 16.2% 2.0% 18.2% 81.8%
Vermont
Vermont State Agency Mean
Northeast Region Mean
Delaware
Delaware State Agency Mean
District of Columbia
Rhode Island
Rhode Island State Agency Mean
District of Columbia State Agency Mean
Maryland
Maryland State Agency Mean
New Jersey
New Jersey State Agency Mean
Pennsylvania
*To maintain the privacy of participants, Local Agencies with less than 30 Infant Participants are not published. 9

Partially
Breastfed
Total
Breastfed
Fully
Formula-Fed
State/Region Local Agency
Infant Data
Participation Data Statistical Data
Fully
Breastfed
Partially
Breastfed
Total
Breastfed
Connecticut
Fully
Formula-Fed Total Infants
Fully
Breastfed
Family Health Council of Central PA, Inc. 613 94 707 2,620 3,327 18.4% 2.8% 21.3% 78.7%
Adagio Health 450 55 505 2,073 2,578 17.5% 2.1% 19.6% 80.4%
So Central Comm Act Program 280 56 336 1,013 1,349 20.8% 4.2% 24.9% 75.1%
8,641 1,903 10,544 51,338 61,882 14.0% 3.1% 17.0% 83.0%
PUERTO RICO Puerto Rico WIC Program 3,615 4,702 8,317 31,060 39,377 9.2% 11.9% 21.1% 78.9%
Central Shenandoah District 152 177 329 870 1,199 12.7% 14.8% 27.4% 72.6%
Lord Fairfax District 118 133 251 783 1,034 11.4% 12.9% 24.3% 75.7%
Rappahannock Area District 129 200 329 1,184 1,513 8.5% 13.2% 21.7% 78.3%
Rappahannock-Rapidan District 68 87 155 594 749 9.1% 11.6% 20.7% 79.3%
Thomas Jefferson District 129 104 233 652 885 14.6% 11.8% 26.3% 73.7%
Alexandria District 64 254 318 433 751 8.5% 33.8% 42.3% 57.7%
Arlington District 48 351 399 259 658 7.3% 53.3% 60.6% 39.4%
Fairfax District 313 1,550 1,863 2,324 4,187 7.5% 37.0% 44.5% 55.5%
Loudoun District 56 209 265 389 654 8.6% 32.0% 40.5% 59.5%
Prince William District 103 484 587 1,300 1,887 5.5% 25.6% 31.1% 68.9%
Alleghany District 61 25 86 470 556 11.0% 4.5% 15.5% 84.5%
Central Virginia District 132 57 189 1,050 1,239 10.7% 4.6% 15.3% 84.7%
Cumberland Plateau 27 16 43 568 611 4.4% 2.6% 7.0% 93.0%
Pittsylvania-Danville District 35 29 64 584 648 5.4% 4.5% 9.9% 90.1%
West Piedmont District 68 53 121 770 891 7.6% 5.9% 13.6% 86.4%
Lenowisco District 29 15 44 565 609 4.8% 2.5% 7.2% 92.8%
Mount Rogers District 97 54 151 1,070 1,221 7.9% 4.4% 12.4% 87.6%
New River District 78 37 115 513 628 12.4% 5.9% 18.3% 81.7%
Roanoke District 80 87 167 789 956 8.4% 9.1% 17.5% 82.5%
Chesterfield District 105 121 226 1,232 1,458 7.2% 8.3% 15.5% 84.5%
Crater District 76 72 148 1,006 1,154 6.6% 6.2% 12.8% 87.2%
Chickahominy District 32 23 55 237 292 11.0% 7.9% 18.8% 81.2%
Henrico District 149 86 235 1,139 1,374 10.8% 6.3% 17.1% 82.9%
Piedmont District 41 32 73 571 644 6.4% 5.0% 11.3% 88.7%
Richmond City District 69 145 214 1,510 1,724 4.0% 8.4% 12.4% 87.6%
Southside District 21 23 44 443 487 4.3% 4.7% 9.0% 91.0%
Chesapeake District 114 92 206 870 1,076 10.6% 8.6% 19.1% 80.9%
Eastern Shore District 18 43 61 351 412 4.4% 10.4% 14.8% 85.2%
Hampton District 120 105 225 733 958 12.5% 11.0% 23.5% 76.5%
Norfolk District 108 100 208 1,841 2,049 5.3% 4.9% 10.2% 89.8%
Three Rivers District 47 37 84 535 619 7.6% 6.0% 13.6% 86.4%
Peninsula District 177 129 306 1,709 2,015 8.8% 6.4% 15.2% 84.8%
Western Tidewater District 53 19 72 687 759 7.0% 2.5% 9.5% 90.5%
Virginia Beach District 298 212 510 1,710 2,220 13.4% 9.5% 23.0% 77.0%
Portsmouth District 77 45 122 864 986 7.8% 4.6% 12.4% 87.6%
3,287 5,202 8,489 30,605 39,094 8.4% 13.3% 21.7% 78.3%
Dept. of Health-VI WIC Program 27 365 392 211 603 4.5% 60.5% 65.0% 35.0%
Dept. of Health-VI WIC Program 37 293 330 228 558 6.6% 52.5% 59.1% 40.9%
64 658 722 439 1,161 5.5% 56.7% 62.2% 37.8%
TSN/WIC Program 160 62 222 1,995 2,217 7.2% 2.8% 10.0% 90.0%
Central WV WIC 108 34 142 695 837 12.9% 4.1% 17.0% 83.0%
Monongalia County Health Department 168 57 225 1,250 1,475 11.4% 3.9% 15.3% 84.7%
Randolph/Elkins Health 142 47 189 751 940 15.1% 5.0% 20.1% 79.9%
Shenandoah Valley Medical System 152 66 218 1,041 1,259 12.1% 5.2% 17.3% 82.7%
Wheeling-Ohio County WIC 80 41 121 826 947 8.4% 4.3% 12.8% 87.2%
Mid-Ohio Valley WIC Agency 116 54 170 1,076 1,246 9.3% 4.3% 13.6% 86.4%
Valley Health Systems Inc WIC Program 257 90 347 2,267 2,614 9.8% 3.4% 13.3% 86.7%
1,184 451 1,635 9,901 11,536 10.3% 3.9% 14.2% 85.8%
25,022 32,780 57,802 179,496 237,298 10.5% 13.8% 24.4% 75.6%
Public Health Area 1 108 357 465 1,813 2,278 4.7% 15.7% 20.4% 79.6%
Public Health Area 2 350 592 942 4,643 5,585 6.3% 10.6% 16.9% 83.1%
Public Health Area 3 61 126 187 1,767 1,954 3.1% 6.4% 9.6% 90.4%
Public Health Area 4 179 514 693 3,862 4,555 3.9% 11.3% 15.2% 84.8%
Public Health Area 10 129 186 315 2,243 2,558 5.0% 7.3% 12.3% 87.7%
Public Health Area 11 140 249 389 3,169 3,558 3.9% 7.0% 10.9% 89.1%
Public Health Area 8 238 463 701 4,183 4,884 4.9% 9.5% 14.4% 85.6%
Public Health Area 9 158 220 378 2,218 2,596 6.1% 8.5% 14.6% 85.4%
Public Health Area 5 273 470 743 2,746 3,489 7.8% 13.5% 21.3% 78.7%
Public Health Area 6 148 264 412 2,280 2,692 5.5% 9.8% 15.3% 84.7%
Public Health Area 7 45 94 139 1,246 1,385 3.2% 6.8% 10.0% 90.0%
1,829 3,533 5,362 30,169 35,531 5.1% 9.9% 15.1% 84.9%
Bay County Health Department 229 195 424 1,382 1,806 12.7% 10.8% 23.5% 76.5%
Brevard County Health Dept 450 348 798 1,884 2,682 16.8% 13.0% 29.8% 70.2%
Broward County Hlth Department 1,522 2,695 4,217 6,700 10,917 13.9% 24.7% 38.6% 61.4%
Charlotte County Health Department 109 46 155 533 688 15.8% 6.7% 22.5% 77.5%
Citrus County Health Department 76 46 122 564 686 11.1% 6.7% 17.8% 82.2%
Clay County Health Department 124 103 227 652 879 14.1% 11.7% 25.8% 74.2%
Collier County Hlth Department 409 442 851 1,098 1,949 21.0% 22.7% 43.7% 56.3%
Dade County Health Department 1,662 4,895 6,557 10,805 17,362 9.6% 28.2% 37.8% 62.2%
Desoto County Health Department 36 64 100 227 327 11.0% 19.6% 30.6% 69.4%
Duval County Health Department 679 1,018 1,697 4,727 6,424 10.6% 15.8% 26.4% 73.6%
Escambia Co Hlth Department 296 194 490 1,867 2,357 12.6% 8.2% 20.8% 79.2%
Gadsden County Health Department 35 68 103 328 431 8.1% 15.8% 23.9% 76.1%
Hernando County Health Department 105 69 174 756 930 11.3% 7.4% 18.7% 81.3%
Highlands County Health Department 81 82 163 484 647 12.5% 12.7% 25.2% 74.8%
Hillsborough County Health Department 775 1,438 2,213 6,432 8,645 9.0% 16.6% 25.6% 74.4%
Indian River County Health Department 115 141 256 501 757 15.2% 18.6% 33.8% 66.2%
Jackson County Health Department 62 71 133 692 825 7.5% 8.6% 16.1% 83.9%
Lake County Health Department 172 288 460 1,252 1,712 10.0% 16.8% 26.9% 73.1%
Lee County Health Department 457 953 1,410 2,911 4,321 10.6% 22.1% 32.6% 67.4%
Leon County Health Department 189 255 444 1,544 1,988 9.5% 12.8% 22.3% 77.7%
Manatee County Health Department 205 347 552 1,364 1,916 10.7% 18.1% 28.8% 71.2%
Marion County Health Department 233 366 599 1,610 2,209 10.5% 16.6% 27.1% 72.9%
Martin County Health Department 102 138 240 416 656 15.5% 21.0% 36.6% 63.4%
Monroe County Health Department 49 83 132 189 321 15.3% 25.9% 41.1% 58.9%
Nassau County Health Department 131 90 221 499 720 18.2% 12.5% 30.7% 69.3%
Okaloosa County Health Department 205 151 356 911 1,267 16.2% 11.9% 28.1% 71.9%
Pennsylvania State Agency Mean
Virginia
Virginia State Agency Mean
Virgin Islands
Virgin Islands State Agency Mean
West Virginia
Pennsylvania
West Virginia State Agency Mean
Mid-Atlantic Region Mean
Alabama
Alabama State Agency Mean
Florida
*To maintain the privacy of participants, Local Agencies with less than 30 Infant Participants are not published. 10

Partially
Breastfed
Total
Breastfed
Fully
Formula-Fed
State/Region Local Agency
Infant Data
Participation Data Statistical Data
Fully
Breastfed
Partially
Breastfed
Total
Breastfed
Connecticut
Fully
Formula-Fed Total Infants
Fully
Breastfed
Okeechobee County Hlth Department 65 48 113 269 382 17.0% 12.6% 29.6% 70.4%
Orange County Health Department 809 1,918 2,727 5,615 8,342 9.7% 23.0% 32.7% 67.3%
Osceola County Hlth Department 441 387 828 1,929 2,757 16.0% 14.0% 30.0% 70.0%
Palm Beach County Health Department 765 1,980 2,745 4,394 7,139 10.7% 27.7% 38.5% 61.5%
Pasco County Health Department 305 242 547 1,801 2,348 13.0% 10.3% 23.3% 76.7%
Pinellas County Health Department 473 609 1,082 3,176 4,258 11.1% 14.3% 25.4% 74.6%
Polk County Health Department 523 891 1,414 3,545 4,959 10.5% 18.0% 28.5% 71.5%
Putnam County Health Department 63 61 124 552 676 9.3% 9.0% 18.3% 81.7%
St Johns County Health Department 128 62 190 413 603 21.2% 10.3% 31.5% 68.5%
St Lucie County Hlth Department 236 366 602 1,321 1,923 12.3% 19.0% 31.3% 68.7%
Santa Rosa County Health Department 128 46 174 616 790 16.2% 5.8% 22.0% 78.0%
Sarasota County Health Department 292 180 472 917 1,389 21.0% 13.0% 34.0% 66.0%
Seminole County Health Department 300 313 613 1,305 1,918 15.6% 16.3% 32.0% 68.0%
Volusia County Health Department 330 316 646 1,972 2,618 12.6% 12.1% 24.7% 75.3%
North Central FL WIC Project 408 358 766 2,764 3,530 11.6% 10.1% 21.7% 78.3%
University of Miami WIC Project 124 332 456 509 965 12.8% 34.4% 47.3% 52.7%
Flagler County Health Department 83 54 137 328 465 17.8% 11.6% 29.5% 70.5%
13,980 22,748 36,728 81,753 118,481 11.8% 19.2% 31.0% 69.0%
Dist./Unit 01-1 Northwest GA Hlth Dist. 233 724 957 3,339 4,296 5.4% 16.9% 22.3% 77.7%
Dist./Unit 01-2 Northwest Hlth District 340 503 843 2,087 2,930 11.6% 17.2% 28.8% 71.2%
Dist./Unit 02-0 North Health District 326 813 1,139 2,776 3,915 8.3% 20.8% 29.1% 70.9%
Dist./Unit 03-1 Metro West Hlth Dist. 476 1,325 1,801 2,763 4,564 10.4% 29.0% 39.5% 60.5%
Dist./Unit 03-2 Fulton Co. Hlth Dist. 108 768 876 2,981 3,857 2.8% 19.9% 22.7% 77.3%
Dist./Unit 03-3 Clayton Co. Hlth District 78 608 686 1,706 2,392 3.3% 25.4% 28.7% 71.3%
Dist/Unit 03-4 East Metro Hlth Dist. 425 1,965 2,390 4,477 6,867 6.2% 28.6% 34.8% 65.2%
Dist/Unit 03-5 Metro East Hlth District 298 1,943 2,241 3,634 5,875 5.1% 33.1% 38.1% 61.9%
Dist/Unit 04-0 LaGrange Hlth Services 344 714 1,058 4,199 5,257 6.5% 13.6% 20.1% 79.9%
Dist/Unit 05-1 South Central Hlth Dist. 43 36 79 1,109 1,188 3.6% 3.0% 6.6% 93.4%
Dist/Unit 05-1 North Central Hlth Dist. 138 310 448 3,863 4,311 3.2% 7.2% 10.4% 89.6%
Dist/Unit 06-0 East Central Hlth Dist. 232 461 693 2,858 3,551 6.5% 13.0% 19.5% 80.5%
Dist/Unit 07-0 West Central Hlth Dist 197 556 753 2,882 3,635 5.4% 15.3% 20.7% 79.3%
Dist/Unit 08-1 South Central Health Dist 114 101 215 2,097 2,312 4.9% 4.4% 9.3% 90.7%
Dist/Unit 08-2 Southwest Hlth District 126 403 529 2,861 3,390 3.7% 11.9% 15.6% 84.4%
Dist/Unit 09-2 Southeast Health District 426 709 1,135 3,712 4,847 8.8% 14.6% 23.4% 76.6%
Dist/Unit 09-3 Coastal Health District 158 467 625 2,838 3,463 4.6% 13.5% 18.0% 82.0%
Dist/Unit 10-0 Northeast Health District 217 314 531 2,184 2,715 8.0% 11.6% 19.6% 80.4%
Dist/Unit 11-0 Southside Hlthcare, Inc. 0 4 4 55 59 0.0% 6.8% 6.8% 93.2%
Grady Health System 48 238 286 1,079 1,365 3.5% 17.4% 21.0% 79.0%
4,325 12,960 17,285 53,501 70,786 6.1% 18.3% 24.4% 75.6%
Allen County Health Department 27 11 38 142 180 15.0% 6.1% 21.1% 78.9%
Anderson County Health Department 15 19 34 109 143 10.5% 13.3% 23.8% 76.2%
Bourbon County Health Department 16 36 52 128 180 8.9% 20.0% 28.9% 71.1%
Boyle County Health Department 23 20 43 152 195 11.8% 10.3% 22.1% 77.9%
Breathitt County Health Department 4 10 14 118 132 3.0% 7.6% 10.6% 89.4%
Bullitt County Health Department 42 131 173 281 454 9.3% 28.9% 38.1% 61.9%
Clark County Health Department 17 73 90 221 311 5.5% 23.5% 28.9% 71.1%
Estill County Health Department 9 12 21 110 131 6.9% 9.2% 16.0% 84.0%
Lexington-Fayette Co.Health Dept 214 491 705 1,212 1,917 11.2% 25.6% 36.8% 63.2%
Fleming County Health Department 7 14 21 101 122 5.7% 11.5% 17.2% 82.8%
Floyd County Health Department 13 48 61 399 460 2.8% 10.4% 13.3% 86.7%
Franklin County Health Department 44 72 116 251 367 12.0% 19.6% 31.6% 68.4%
Greenup County Health Department 11 39 50 198 248 4.4% 15.7% 20.2% 79.8%
Louisville-Jefferson Metro H. D. 366 1,869 2,235 2,310 4,545 8.1% 41.1% 49.2% 50.8%
Jessamine County Health Department 48 99 147 271 418 11.5% 23.7% 35.2% 64.8%
Johnson County Health Department 14 28 42 211 253 5.5% 11.1% 16.6% 83.4%
Knox County Health Department 30 29 59 275 334 9.0% 8.7% 17.7% 82.3%
Laurel County Health Department 63 38 101 387 488 12.9% 7.8% 20.7% 79.3%
Lewis County Health Department 9 22 31 103 134 6.7% 16.4% 23.1% 76.9%
Lincoln County Health Department 17 23 40 161 201 8.5% 11.4% 19.9% 80.1%
Madison County Health Department 57 134 191 423 614 9.3% 21.8% 31.1% 68.9%
Magoffin County Health Department 4 21 25 113 138 2.9% 15.2% 18.1% 81.9%
Martin County Health Department 5 19 24 121 145 3.4% 13.1% 16.6% 83.4%
Monroe County Health Department 13 5 18 72 90 14.4% 5.6% 20.0% 80.0%
Oldham County Health Department 25 56 81 112 193 13.0% 29.0% 42.0% 58.0%
Pike County Health Department 22 60 82 523 605 3.6% 9.9% 13.6% 86.4%
Powell County Health Department 9 32 41 92 133 6.8% 24.1% 30.8% 69.2%
Whitley County Health Department 45 49 94 469 563 8.0% 8.7% 16.7% 83.3%
Woodford County Health Department 21 12 33 117 150 14.0% 8.0% 22.0% 78.0%
Children and Youth Project 15 127 142 252 394 3.8% 32.2% 36.0% 64.0%
Lincoln Trail District 126 870 996 1,140 2,136 5.9% 40.7% 46.6% 53.4%
Barren River District 220 224 444 1,583 2,027 10.9% 11.1% 21.9% 78.1%
Purchase District 102 76 178 555 733 13.9% 10.4% 24.3% 75.7%
North Central District 30 185 215 364 579 5.2% 32.0% 37.1% 62.9%
Lake Cumberland District 160 183 343 1,598 1,941 8.2% 9.4% 17.7% 82.3%
Northern Kentucky District 238 565 803 1,848 2,651 9.0% 21.3% 30.3% 69.7%
Little Sandy District 23 42 65 307 372 6.2% 11.3% 17.5% 82.5%
Kentucky River District 54 104 158 870 1,028 5.3% 10.1% 15.4% 84.6%
Cumberland Valley District 67 140 207 1,048 1,255 5.3% 11.2% 16.5% 83.5%
Green River District 147 91 238 1,419 1,657 8.9% 5.5% 14.4% 85.6%
Wedco District 47 84 131 383 514 9.1% 16.3% 25.5% 74.5%
Gateway District 40 72 112 435 547 7.3% 13.2% 20.5% 79.5%
Three Rivers District 24 92 116 330 446 5.4% 20.6% 26.0% 74.0%
Pennyrile District 44 26 70 336 406 10.8% 6.4% 17.2% 82.8%
Buffalo Trace District 11 33 44 128 172 6.4% 19.2% 25.6% 74.4%
Park Duvalle Health Center 16 134 150 258 408 3.9% 32.8% 36.8% 63.2%
Muhlenberg County Health Department 19 7 26 210 236 8.1% 3.0% 11.0% 89.0%
Marshall County Health Department 25 15 40 157 197 12.7% 7.6% 20.3% 79.7%
Hopkins County Health Department 35 19 54 306 360 9.7% 5.3% 15.0% 85.0%
Christian County Health Department 172 133 305 920 1,225 14.0% 10.9% 24.9% 75.1%
Todd County Health Department 9 4 13 97 110 8.2% 3.6% 11.8% 88.2%
Bracken County Health Department 11 9 20 64 84 13.1% 10.7% 23.8% 76.2%
Montgomery County Health Department 27 38 65 184 249 10.8% 15.3% 26.1% 73.9%
Garrard County Health Department 16 16 32 122 154 10.4% 10.4% 20.8% 79.2%
Mercer County Health Department 20 24 44 156 200 10.0% 12.0% 22.0% 78.0%
Georgia
Georgia State Agency Mean
Kentucky
Florida
Florida State Agency Mean
*To maintain the privacy of participants, Local Agencies with less than 30 Infant Participants are not published. 11

Partially
Breastfed
Total
Breastfed
Fully
Formula-Fed
State/Region Local Agency
Infant Data
Participation Data Statistical Data
Fully
Breastfed
Partially
Breastfed
Total
Breastfed
Connecticut
Fully
Formula-Fed Total Infants
Fully
Breastfed
Breckinridge County Health Department 10 52 62 86 148 6.8% 35.1% 41.9% 58.1%
Ashland-Boyd County Health Dept. 27 55 82 329 411 6.6% 13.4% 20.0% 80.0%
Lawrence County Health Dept. 15 18 33 119 152 9.9% 11.8% 21.7% 78.3%
Calloway County Health Department 35 31 66 184 250 14.0% 12.4% 26.4% 73.6%
Graves County Health Department 36 50 86 258 344 10.5% 14.5% 25.0% 75.0%
3,007 6,984 9,991 25,230 35,221 8.5% 19.8% 28.4% 71.6%
District I WIC 69 102 171 2,410 2,581 2.7% 4.0% 6.6% 93.4%
District II WIC 104 274 378 2,954 3,332 3.1% 8.2% 11.3% 88.7%
District III WIC 31 112 143 2,509 2,652 1.2% 4.2% 5.4% 94.6%
District IV WIC 46 124 170 1,814 1,984 2.3% 6.3% 8.6% 91.4%
District V WIC 103 334 437 4,717 5,154 2.0% 6.5% 8.5% 91.5%
District VI WIC 50 105 155 1,871 2,026 2.5% 5.2% 7.7% 92.3%
District VII WIC 26 95 121 1,541 1,662 1.6% 5.7% 7.3% 92.7%
District VIII WIC 92 251 343 2,372 2,715 3.4% 9.2% 12.6% 87.4%
District IX WIC 126 176 302 3,369 3,671 3.4% 4.8% 8.2% 91.8%
648 1,575 2,223 23,556 25,779 2.5% 6.1% 8.6% 91.4%
CHOCTAW
RESERVATION, MS MS Choctaw Reservation Health Center 0 11 11 192 203 0.0% 5.4% 5.4% 94.6%
Alamance County Health Department 106 138 244 752 996 10.6% 13.9% 24.5% 75.5%
Alexander County Health Department 20 27 47 167 214 9.3% 12.6% 22.0% 78.0%
Anson County Health Dept 3 19 22 192 214 1.4% 8.9% 10.3% 89.7%
Appalachian District Health Department 89 32 121 242 363 24.5% 8.8% 33.3% 66.7%
Beaufort County Health Department 25 48 73 289 362 6.9% 13.3% 20.2% 79.8%
Bertie County Health Department 1 9 10 131 141 0.7% 6.4% 7.1% 92.9%
Bladen County Health Department 12 38 50 221 271 4.4% 14.0% 18.5% 81.5%
Brunswick County Health Department 44 64 108 457 565 7.8% 11.3% 19.1% 80.9%
Buncombe County Health Department 268 194 462 810 1,272 21.1% 15.3% 36.3% 63.7%
Burke County Health Department 55 58 113 477 590 9.3% 9.8% 19.2% 80.8%
Cabarrus Health Alliance 121 211 332 817 1,149 10.5% 18.4% 28.9% 71.1%
Caldwell County Health Department 52 71 123 414 537 9.7% 13.2% 22.9% 77.1%
Carteret County Health Department 36 34 70 280 350 10.3% 9.7% 20.0% 80.0%
Caswell County Health Department 13 13 26 117 143 9.1% 9.1% 18.2% 81.8%
Catawba County Health Department 124 143 267 798 1,065 11.6% 13.4% 25.1% 74.9%
Cherokee County Health Department 25 6 31 127 158 15.8% 3.8% 19.6% 80.4%
Clay County Health Department 13 9 22 34 56 23.2% 16.1% 39.3% 60.7%
Cleveland County Health Department 41 35 76 647 723 5.7% 4.8% 10.5% 89.5%
Columbus County Health Department 20 51 71 459 530 3.8% 9.6% 13.4% 86.6%
Craven County Health Department 103 83 186 705 891 11.6% 9.3% 20.9% 79.1%
Cumberland County Public Health Center 409 433 842 2,861 3,703 11.0% 11.7% 22.7% 77.3%
Dare County Health Department 46 38 84 122 206 22.3% 18.4% 40.8% 59.2%
Davidson County Health Department 104 120 224 811 1,035 10.0% 11.6% 21.6% 78.4%
Davie County Health Department 25 17 42 170 212 11.8% 8.0% 19.8% 80.2%
Duplin County Health Department 25 118 143 456 599 4.2% 19.7% 23.9% 76.1%
Edgecombe County Health Department 11 28 39 471 510 2.2% 5.5% 7.6% 92.4%
Franklin County Health Department 31 33 64 300 364 8.5% 9.1% 17.6% 82.4%
Gaston County Health Department 113 231 344 1,140 1,484 7.6% 15.6% 23.2% 76.8%
Graham County Health Department 7 0 7 66 73 9.6% 0.0% 9.6% 90.4%
Granville-Vance District Health Department 38 72 110 639 749 5.1% 9.6% 14.7% 85.3%
Greene County Health Department 15 24 39 141 180 8.3% 13.3% 21.7% 78.3%
Guilford County Health Department 397 590 987 2,341 3,328 11.9% 17.7% 29.7% 70.3%
Harnett County Health Department 45 90 135 612 747 6.0% 12.0% 18.1% 81.9%
Haywood County Health Department 60 28 88 261 349 17.2% 8.0% 25.2% 74.8%
Henderson County Health Department 100 89 189 366 555 18.0% 16.0% 34.1% 65.9%
Hertford County Health Department 11 11 22 185 207 5.3% 5.3% 10.6% 89.4%
Hoke County Health Department 30 60 90 367 457 6.6% 13.1% 19.7% 80.3%
Hyde County Health Department 3 3 6 29 35 8.6% 8.6% 17.1% 82.9%
Iredell County Health Department 79 102 181 743 924 8.5% 11.0% 19.6% 80.4%
Jackson County Health Department 31 23 54 135 189 16.4% 12.2% 28.6% 71.4%
Johnston County Health Department 75 149 224 816 1,040 7.2% 14.3% 21.5% 78.5%
Jones County Health Department 8 5 13 68 81 9.9% 6.2% 16.0% 84.0%
Lenoir Community Health Center 30 50 80 421 501 6.0% 10.0% 16.0% 84.0%
Lincoln Community Health Center 148 314 462 1,452 1,914 7.7% 16.4% 24.1% 75.9%
Lincoln County Health Department 49 39 88 347 435 11.3% 9.0% 20.2% 79.8%
Macon County Health Department 36 32 68 151 219 16.4% 14.6% 31.1% 68.9%
Madison County Health Department 30 14 44 94 138 21.7% 10.1% 31.9% 68.1%
Martin-Tyrell-Washington 11 20 31 277 308 3.6% 6.5% 10.1% 89.9%
Mecklenburg County Health Department 407 1,057 1,464 4,233 5,697 7.1% 18.6% 25.7% 74.3%
Montgomery County Health Department 13 50 63 210 273 4.8% 18.3% 23.1% 76.9%
Moore County Health Department 30 43 73 415 488 6.1% 8.8% 15.0% 85.0%
Nash County Health Department 26 77 103 727 830 3.1% 9.3% 12.4% 87.6%
New Hanover County Health Department 143 93 236 802 1,038 13.8% 9.0% 22.7% 77.3%
Northampton County Health Department 9 11 20 133 153 5.9% 7.2% 13.1% 86.9%
Onslow County Health Department 283 179 462 1,635 2,097 13.5% 8.5% 22.0% 78.0%
Piedmont Health Services 165 280 445 657 1,102 15.0% 25.4% 40.4% 59.6%
Albemarle Regional Health Services 51 49 100 567 667 7.6% 7.3% 15.0% 85.0%
Pender County Health Department 21 32 53 253 306 6.9% 10.5% 17.3% 82.7%
Pitt County Public Health Center 130 143 273 924 1,197 10.9% 11.9% 22.8% 77.2%
Randolph County Health Department 99 173 272 693 965 10.3% 17.9% 28.2% 71.8%
Forsyth County Health Department 365 617 982 1,575 2,557 14.3% 24.1% 38.4% 61.6%
Richmond County Health Department 17 40 57 375 432 3.9% 9.3% 13.2% 86.8%
Robeson County Health Department 34 145 179 1,176 1,355 2.5% 10.7% 13.2% 86.8%
Rockingham County Health Department 27 43 70 491 561 4.8% 7.7% 12.5% 87.5%
Rowan County Health Department 55 117 172 693 865 6.4% 13.5% 19.9% 80.1%
Rutherford, Polk, McDowell Health District 98 97 195 667 862 11.4% 11.3% 22.6% 77.4%
Sampson County Health Department 10 55 65 471 536 1.9% 10.3% 12.1% 87.9%
Scotland County Health Department 15 44 59 355 414 3.6% 10.6% 14.3% 85.7%
Stanly County Health Department 41 50 91 283 374 11.0% 13.4% 24.3% 75.7%
Stokes County Health Department 27 37 64 176 240 11.3% 15.4% 26.7% 73.3%
Surry County Health Department 34 82 116 379 495 6.9% 16.6% 23.4% 76.6%
Swain County Health Department 16 15 31 51 82 19.5% 18.3% 37.8% 62.2%
Toe River Health District 60 45 105 204 309 19.4% 14.6% 34.0% 66.0%
Transylvania County Health Department 38 23 61 101 162 23.5% 14.2% 37.7% 62.3%
Kentucky
Kentucky State Agency Mean
Mississippi
Mississippi State Agency Mean
North Carolina
*To maintain the privacy of participants, Local Agencies with less than 30 Infant Participants are not published. 12
Partially
Breastfed
Total
Breastfed
Fully
Formula-Fed
State/Region Local Agency
Infant Data
Participation Data Statistical Data
Fully
Breastfed
Partially
Breastfed
Total
Breastfed
Connecticut
Fully
Formula-Fed Total Infants
Fully
Breastfed
Tri-County Community Health Center 16 73 89 165 254 6.3% 28.7% 35.0% 65.0%
Rural Health Group Inc. 17 25 42 440 482 3.5% 5.2% 8.7% 91.3%
Union County Health Department 134 165 299 676 975 13.7% 16.9% 30.7% 69.3%
Wake County Health Department 369 961 1,330 2,682 4,012 9.2% 24.0% 33.2% 66.8%
Warren County Health Department 10 16 26 102 128 7.8% 12.5% 20.3% 79.7%
Wayne County Health Department 82 139 221 966 1,187 6.9% 11.7% 18.6% 81.4%
Wilson County Health Department 21 72 93 641 734 2.9% 9.8% 12.7% 87.3%
Yadkin County Health Department 23 52 75 183 258 8.9% 20.2% 29.1% 70.9%
Pamlico County Health Department 11 16 27 50 77 14.3% 20.8% 35.1% 64.9%
Lee County Health Department 19 65 84 429 513 3.7% 12.7% 16.4% 83.6%
Person County Health Department 17 17 34 219 253 6.7% 6.7% 13.4% 86.6%
Wilkes County Health Dept 43 49 92 304 396 10.9% 12.4% 23.2% 76.8%
6,110 9,260 15,370 49,078 64,448 9.5% 14.4% 23.8% 76.2%
CHEROKEE
RESERVATION, NC
NC-E. Cherokee Reservation 21 19 40 94 134 15.7% 14.2% 29.9% 70.1%
Beaufort-Jasper Comp Center 67 89 156 431 587 11.4% 15.2% 26.6% 73.4%
Region 1 224 213 437 3,155 3,592 6.2% 5.9% 12.2% 87.8%
Region 2 500 519 1,019 5,818 6,837 7.3% 7.6% 14.9% 85.1%
Region 3 481 552 1,033 6,002 7,035 6.8% 7.8% 14.7% 85.3%
Region 4 233 348 581 4,821 5,402 4.3% 6.4% 10.8% 89.2%
Region 5 98 166 264 2,475 2,739 3.6% 6.1% 9.6% 90.4%
Region 6 186 247 433 2,292 2,725 6.8% 9.1% 15.9% 84.1%
Region 7 502 389 891 3,586 4,477 11.2% 8.7% 19.9% 80.1%
Region 8 106 186 292 1,142 1,434 7.4% 13.0% 20.4% 79.6%
2,395 2,708 5,103 29,723 34,826 6.9% 7.8% 14.7% 85.3%
Northeast Tennessee Region 248 163 411 1,751 2,162 11.5% 7.5% 19.0% 81.0%
East Tennessee Region 455 418 873 4,057 4,930 9.2% 8.5% 17.7% 82.3%
Southeast Region 189 184 373 1,820 2,193 8.6% 8.4% 17.0% 83.0%
Upper Cumberland Region 203 196 399 2,098 2,497 8.1% 7.8% 16.0% 84.0%
Mid-Cumberland Region 704 663 1,367 4,563 5,930 11.9% 11.2% 23.1% 76.9%
South Central Region 213 214 427 2,217 2,644 8.1% 8.1% 16.1% 83.9%
West TN Region Union City 82 95 177 1,767 1,944 4.2% 4.9% 9.1% 90.9%
West TN Region Jackson 81 118 199 1,780 1,979 4.1% 6.0% 10.1% 89.9%
Memphis Shelby County Health Dept 207 917 1,124 7,501 8,625 2.4% 10.6% 13.0% 87.0%
Metro-Davidson Health Department 521 1,045 1,566 3,560 5,126 10.2% 20.4% 30.6% 69.4%
Knox County Regional Office 255 211 466 1,491 1,957 13.0% 10.8% 23.8% 76.2%
Hamilton County Regional Office 195 278 473 1,578 2,051 9.5% 13.6% 23.1% 76.9%
Sullivan County Regional Office 110 42 152 742 894 12.3% 4.7% 17.0% 83.0%
Madison County Health Dept 49 75 124 696 820 6.0% 9.1% 15.1% 84.9%
3,510 4,620 8,130 35,621 43,751 8.0% 10.6% 18.6% 81.4%
35,825 64,416 100,241 328,915 429,156 8.3% 15.0% 23.4% 76.6%
TCA Health Altgeld Health Center 25 71 96 1,151 1,247 2.0% 5.7% 7.7% 92.3%
Bond County Health Dept 19 7 26 95 121 15.7% 5.8% 21.5% 78.5%
Logan County Health Department 17 6 23 118 141 12.1% 4.3% 16.3% 83.7%
Chicago Department of Health 182 1,320 1,502 8,389 9,891 1.8% 13.3% 15.2% 84.8%
Champaign-Urbana Public Health 115 164 279 778 1,057 10.9% 15.5% 26.4% 73.6%
Community & Econ Dev Assoc CEDA 775 3,021 3,796 8,596 12,392 6.3% 24.4% 30.6% 69.4%
Coordinated Youth Services 149 122 271 1,312 1,583 9.4% 7.7% 17.1% 82.9%
Eastside Health District 31 81 112 889 1,001 3.1% 8.1% 11.2% 88.8%
Egyptian Health Department 13 13 26 302 328 4.0% 4.0% 7.9% 92.1%
Ford Iroquois Public Health 12 17 29 185 214 5.6% 7.9% 13.6% 86.4%
Fulton County Health Department 28 13 41 164 205 13.7% 6.3% 20.0% 80.0%
Greene County Health Department 6 4 10 88 98 6.1% 4.1% 10.2% 89.8%
Henderson County Health Department 13 12 25 139 164 7.9% 7.3% 15.2% 84.8%
Hancock County Health Department 17 4 21 79 100 17.0% 4.0% 21.0% 79.0%
Henry County Health Department 38 18 56 223 279 13.6% 6.5% 20.1% 79.9%
Jackson County Health Department 79 41 120 277 397 19.9% 10.3% 30.2% 69.8%
Kankakee County Health Department 63 56 119 615 734 8.6% 7.6% 16.2% 83.8%
Lake Co. Hlth Dept. & Comm. Hlth. Ctr. 265 783 1,048 2,239 3,287 8.1% 23.8% 31.9% 68.1%
Lee County Health Department 32 13 45 150 195 16.4% 6.7% 23.1% 76.9%
Macon Health Department 44 35 79 680 759 5.8% 4.6% 10.4% 89.6%
Mason County Health Department 11 4 15 73 88 12.5% 4.5% 17.0% 83.0%
McLean County Health Department 88 101 189 531 720 12.2% 14.0% 26.3% 73.8%
Menard County Health Department 9 5 14 36 50 18.0% 10.0% 28.0% 72.0%
Peoria City Health Department 67 136 203 1,091 1,294 5.2% 10.5% 15.7% 84.3%
Perry County Health Department 15 8 23 115 138 10.9% 5.8% 16.7% 83.3%
Randolph County Health Department 20 11 31 148 179 11.2% 6.1% 17.3% 82.7%
Rock Island County Health Dept 58 206 264 850 1,114 5.2% 18.5% 23.7% 76.3%
Roseland Community Hospital 14 286 300 710 1,010 1.4% 28.3% 29.7% 70.3%
St. Clair County Health Department 93 71 164 650 814 11.4% 8.7% 20.1% 79.9%
Shelby County Health Department 8 7 15 94 109 7.3% 6.4% 13.8% 86.2%
Southern Seven Health Department 25 27 52 440 492 5.1% 5.5% 10.6% 89.4%
Tazewell County Health Department 67 43 110 438 548 12.2% 7.8% 20.1% 79.9%
Vermilion County Health Department 37 33 70 645 715 5.2% 4.6% 9.8% 90.2%
Visiting Nurse Association 127 355 482 1,081 1,563 8.1% 22.7% 30.8% 69.2%
Well Child Center, Inc. 216 530 746 1,259 2,005 10.8% 26.4% 37.2% 62.8%
Winnebago County Health Department 135 167 302 1,712 2,014 6.7% 8.3% 15.0% 85.0%
Coles County Health Department 22 21 43 249 292 7.5% 7.2% 14.7% 85.3%
Du Page County Health Department 391 641 1,032 1,986 3,018 13.0% 21.2% 34.2% 65.8%
Effingham County Health Department 23 10 33 160 193 11.9% 5.2% 17.1% 82.9%
Grundy County Health Department 19 20 39 149 188 10.1% 10.6% 20.7% 79.3%
McDonough County Health Department 24 15 39 104 143 16.8% 10.5% 27.3% 72.7%
McHenry County Health Department 141 202 343 635 978 14.4% 20.7% 35.1% 64.9%
Montgomery County Health 20 7 27 151 178 11.2% 3.9% 15.2% 84.8%
Schuyler County Health Department 2 1 3 42 45 4.4% 2.2% 6.7% 93.3%
Woodford County Health Department 17 3 20 88 108 15.7% 2.8% 18.5% 81.5%
Stickney Public Health District. 12 24 36 85 121 9.9% 19.8% 29.8% 70.2%
Cook County Dept of Public Health 252 1,220 1,472 3,622 5,094 4.9% 23.9% 28.9% 71.1%
Macoupin County Health Dept 16 19 35 180 215 7.4% 8.8% 16.3% 83.7%
Jasper County Health Dept 19 13 32 143 175 10.9% 7.4% 18.3% 81.7%
Livingston County Health Department 19 6 25 176 201 9.5% 3.0% 12.4% 87.6%
Fayette County Health Dept 21 11 32 136 168 12.5% 6.5% 19.0% 81.0%
Southeast Region Mean
Illinois
North Carolina
North Carolina State Agency Mean
South Carolina
South Carolina State Agency Mean
Tennessee
Tennessee State Agency Mean
*To maintain the privacy of participants, Local Agencies with less than 30 Infant Participants are not published. 13

Partially
Breastfed
Total
Breastfed
Fully
Formula-Fed
State/Region Local Agency
Infant Data
Participation Data Statistical Data
Fully
Breastfed
Partially
Breastfed
Total
Breastfed
Connecticut
Fully
Formula-Fed Total Infants
Fully
Breastfed
Christian County Health Dept 11 10 21 189 210 5.2% 4.8% 10.0% 90.0%
Wabash County Health Dept 18 7 25 103 128 14.1% 5.5% 19.5% 80.5%
Lawrence County Health Dept 7 8 15 89 104 6.7% 7.7% 14.4% 85.6%
Cass County Health Dept 8 15 23 76 99 8.1% 15.2% 23.2% 76.8%
Bethel New Life, Inc. 21 81 102 727 829 2.5% 9.8% 12.3% 87.7%
Will County Health Dept 271 359 630 1,989 2,619 10.3% 13.7% 24.1% 75.9%
Cook Co Bureau of Health Services 5 84 89 355 444 1.1% 18.9% 20.0% 80.0%
Dewitt Piatt Bi County Health 28 8 36 111 147 19.0% 5.4% 24.5% 75.5%
Near North Health Service 120 746 866 1,404 2,270 5.3% 32.9% 38.1% 61.9%
Sinai Community Institute 55 523 578 2,723 3,301 1.7% 15.8% 17.5% 82.5%
Jersey County Health Dept 15 5 20 91 111 13.5% 4.5% 18.0% 82.0%
Pike County Health Dept 19 7 26 75 101 18.8% 6.9% 25.7% 74.3%
Clay County Health Dept 13 5 18 98 116 11.2% 4.3% 15.5% 84.5%
Boone County Health Dept 20 50 70 203 273 7.3% 18.3% 25.6% 74.4%
Dekalb County Health Dept 64 92 156 320 476 13.4% 19.3% 32.8% 67.2%
JoDaviess County Health Dept 65 28 93 246 339 19.2% 8.3% 27.4% 72.6%
Ogle County Health Dept 37 22 59 193 252 14.7% 8.7% 23.4% 76.6%
Stephenson County Health Dept 39 16 55 243 298 13.1% 5.4% 18.5% 81.5%
Whiteside County Health Dept 36 30 66 319 385 9.4% 7.8% 17.1% 82.9%
Bureau County Health Dept 20 16 36 156 192 10.4% 8.3% 18.8% 81.3%
Sangamon County Health Dept 91 114 205 904 1,109 8.2% 10.3% 18.5% 81.5%
Mercer County Health Dept 10 7 17 57 74 13.5% 9.5% 23.0% 77.0%
Crawford County Health Dept 15 7 22 112 134 11.2% 5.2% 16.4% 83.6%
Jefferson County Health Dept 19 19 38 229 267 7.1% 7.1% 14.2% 85.8%
Morgan County Health Dept 14 12 26 172 198 7.1% 6.1% 13.1% 86.9%
Wayne County Health Dept 23 6 29 127 156 14.7% 3.8% 18.6% 81.4%
Adams County Health Dept 48 22 70 351 421 11.4% 5.2% 16.6% 83.4%
Knox County Health Dept 45 18 63 271 334 13.5% 5.4% 18.9% 81.1%
Washington County Health Dept 5 2 7 47 54 9.3% 3.7% 13.0% 87.0%
Mile Square Health Center 15 22 37 179 216 6.9% 10.2% 17.1% 82.9%
Franklin Williamson Bi-County 56 27 83 656 739 7.6% 3.7% 11.2% 88.8%
Cumberland County Health Dept 10 3 13 51 64 15.6% 4.7% 20.3% 79.7%
Edgar County Health Dept 5 2 7 91 98 5.1% 2.0% 7.1% 92.9%
Kendall County Health & Human 40 47 87 226 313 12.8% 15.0% 27.8% 72.2%
Clark County Health Dept 13 4 17 87 104 12.5% 3.8% 16.3% 83.7%
Clinton County Health Dept 17 12 29 114 143 11.9% 8.4% 20.3% 79.7%
Marion County Health Dept 39 17 56 284 340 11.5% 5.0% 16.5% 83.5%
Marshall County Health Dept 4 3 7 46 53 7.5% 5.7% 13.2% 86.8%
Moultrie County Health Dept 6 3 9 61 70 8.6% 4.3% 12.9% 87.1%
LaSalle County Health Dept 61 45 106 497 603 10.1% 7.5% 17.6% 82.4%
Scott County Health Dept 4 2 6 27 33 12.1% 6.1% 18.2% 81.8%
Carroll County Health Dept 7 8 15 67 82 8.5% 9.8% 18.3% 81.7%
Douglas County Health Dept 11 3 14 81 95 11.6% 3.2% 14.7% 85.3%
Monroe County Health Department 7 3 10 35 45 15.6% 6.7% 22.2% 77.8%
Aunt Martha's Youth Service Center 13 46 59 112 171 7.6% 26.9% 34.5% 65.5%
5,314 12,507 17,821 58,338 76,159 7.0% 16.4% 23.4% 76.6%
Neighborhood Health Clinics, Inc 283 235 518 2,435 2,953 9.6% 8.0% 17.5% 82.5%
Bartholomew County Health Dept 44 36 80 405 485 9.1% 7.4% 16.5% 83.5%
PACE Community Action Agency 21 25 46 401 447 4.7% 5.6% 10.3% 89.7%
Dearborn County Hospital 30 21 51 444 495 6.1% 4.2% 10.3% 89.7%
Open Door Health Services, Inc. 77 29 106 632 738 10.4% 3.9% 14.4% 85.6%
East Chicago Health Dept 27 45 72 411 483 5.6% 9.3% 14.9% 85.1%
Elkhart County Health Dept 167 217 384 1,286 1,670 10.0% 13.0% 23.0% 77.0%
Vanderburgh County Health Dept 78 44 122 905 1,027 7.6% 4.3% 11.9% 88.1%
Interlocal Comm Action Program 32 13 45 229 274 11.7% 4.7% 16.4% 83.6%
Community & Family Services, Inc. 84 54 138 767 905 9.3% 6.0% 15.2% 84.8%
Madison County Health Dept. 70 51 121 716 837 8.4% 6.1% 14.5% 85.5%
Marion County Health Dept 519 1,107 1,626 6,883 8,509 6.1% 13.0% 19.1% 80.9%
St. Mary's Warrick Hospital, Inc. 28 20 48 424 472 5.9% 4.2% 10.2% 89.8%
Johnson Nichols Health Clinic, Inc. 24 21 45 239 284 8.5% 7.4% 15.8% 84.2%
New Hope Service, Inc. 96 79 175 994 1,169 8.2% 6.8% 15.0% 85.0%
Memorial Health Systems 175 201 376 1,348 1,724 10.2% 11.7% 21.8% 78.2%
CenterStone of Indiana, Inc. 61 51 112 748 860 7.1% 5.9% 13.0% 87.0%
Floyd County Health Dept 43 37 80 340 420 10.2% 8.8% 19.0% 81.0%
Northwest Family Services, Inc. 265 314 579 3,372 3,951 6.7% 7.9% 14.7% 85.3%
Western Indiana Community Action
Agency, Inc. 62 40 102 737 839 7.4% 4.8% 12.2% 87.8%
Jefferson County Health Dept 22 11 33 168 201 10.9% 5.5% 16.4% 83.6%
Indiana University Health Bloomington, Inc. 100 57 157 547 704 14.2% 8.1% 22.3% 77.7%
North Central Community Action Agencies,
Inc. 62 55 117 642 759 8.2% 7.2% 15.4% 84.6%
Clay County Health Dept 10 13 23 197 220 4.5% 5.9% 10.5% 89.5%
Dubois County Health Dept 17 27 44 179 223 7.6% 12.1% 19.7% 80.3%
Fulton County Health Dept 12 11 23 111 134 9.0% 8.2% 17.2% 82.8%
Gibson County Area Rehab Centers, Inc. 18 9 27 231 258 7.0% 3.5% 10.5% 89.5%
Hendricks Co. Health Foundation Inc. 40 25 65 345 410 9.8% 6.1% 15.9% 84.1%
St. Vincent Jennings Hospital, Inc. 15 12 27 189 216 6.9% 5.6% 12.5% 87.5%
Comm Action Program of West IN 42 19 61 454 515 8.2% 3.7% 11.8% 88.2%
Morgan Hospital & Medical Center 29 14 43 309 352 8.2% 4.0% 12.2% 87.8%
Starke County Health Dept 17 10 27 135 162 10.5% 6.2% 16.7% 83.3%
Tippecanoe County Health Dept 153 87 240 822 1,062 14.4% 8.2% 22.6% 77.4%
Indiana University Health White Memorial
Hospital, Inc. 23 25 48 213 261 8.8% 9.6% 18.4% 81.6%
Johnson County Health Dept 71 40 111 542 653 10.9% 6.1% 17.0% 83.0%
Blue River Services, Inc. 58 30 88 452 540 10.7% 5.6% 16.3% 83.7%
Marshall County Health Dept 46 24 70 257 327 14.1% 7.3% 21.4% 78.6%
St Vincent Dunn Hospital 14 17 31 241 272 5.1% 6.3% 11.4% 88.6%
LaGrange County Health Dept 16 11 27 92 119 13.4% 9.2% 22.7% 77.3%
Steuben County Health Dept 27 21 48 199 247 10.9% 8.5% 19.4% 80.6%
Indiana Health Centers, Inc. 188 185 373 2,103 2,476 7.6% 7.5% 15.1% 84.9%
Whitley County Health Department 24 10 34 127 161 14.9% 6.2% 21.1% 78.9%
Comm. Hlth. Interven. & Ed. Found., Inc. 5 3 8 70 78 6.4% 3.8% 10.3% 89.7%
Illinois
Illinois State Agency Mean
Indiana
*To maintain the privacy of participants, Local Agencies with less than 30 Infant Participants are not published. 14

Partially
Breastfed
Total
Breastfed
Fully
Formula-Fed
State/Region Local Agency
Infant Data
Participation Data Statistical Data
Fully
Breastfed
Partially
Breastfed
Total
Breastfed
Connecticut
Fully
Formula-Fed Total Infants
Fully
Breastfed
Arc Rehab Service, Inc. 23 7 30 148 178 12.9% 3.9% 16.9% 83.1%
Hancock Regional Hospital 31 13 44 218 262 11.8% 5.0% 16.8% 83.2%
Human Services, Inc. 56 25 81 430 511 11.0% 4.9% 15.9% 84.1%
Cardinal Services, Inc. 38 36 74 319 393 9.7% 9.2% 18.8% 81.2%
Hoosier Uplands Economic Development
Corporation 6 3 9 55 64 9.4% 4.7% 14.1% 85.9%
Area V Agency on Aging & Comm. Serv. 31 17 48 351 399 7.8% 4.3% 12.0% 88.0%
3,377 3,452 6,829 33,860 40,689 8.3% 8.5% 16.8% 83.2%
Bay County Health Dept 80 39 119 541 660 12.1% 5.9% 18.0% 82.0%
Intercare Community Health 605 281 886 2,324 3,210 18.8% 8.8% 27.6% 72.4%
Branch Hilldale St. Joe Comm. Hlth Agency 244 91 335 934 1,269 19.2% 7.2% 26.4% 73.6%
Calhoun County Health Dept 122 84 206 934 1,140 10.7% 7.4% 18.1% 81.9%
Central Mich District Health Dept WIC 213 83 296 904 1,200 17.8% 6.9% 24.7% 75.3%
Chippewa County Health Dept 74 15 89 187 276 26.8% 5.4% 32.2% 67.8%
Public Health Dept Menominee 54 19 73 294 367 14.7% 5.2% 19.9% 80.1%
Detroit Dept. of Health and Welliness 291 856 1,147 6,730 7,877 3.7% 10.9% 14.6% 85.4%
Dickinson Iron District Health Dept 55 14 69 185 254 21.7% 5.5% 27.2% 72.8%
District Health Dept #2 81 26 107 337 444 18.2% 5.9% 24.1% 75.9%
Northwest MI Comm Health Agency 184 40 224 485 709 26.0% 5.6% 31.6% 68.4%
District Health Dept #4 72 23 95 319 414 17.4% 5.6% 22.9% 77.1%
Genesee County Health Dept 221 161 382 2,683 3,065 7.2% 5.3% 12.5% 87.5%
Grand Traverse County Health Dept 183 41 224 360 584 31.3% 7.0% 38.4% 61.6%
Health Delivery, Inc. 28 44 72 450 522 5.4% 8.4% 13.8% 86.2%
Huron County Health Dept 27 8 35 158 193 14.0% 4.1% 18.1% 81.9%
Ingham County Health Dept 233 236 469 1,422 1,891 12.3% 12.5% 24.8% 75.2%
Ionia County Health Dept 74 23 97 333 430 17.2% 5.3% 22.6% 77.4%
Jackson County Health Dept 165 80 245 967 1,212 13.6% 6.6% 20.2% 79.8%
Kalamazoo County Human Services 126 78 204 498 702 17.9% 11.1% 29.1% 70.9%
Kalamazoo Family Health Center 111 71 182 703 885 12.5% 8.0% 20.6% 79.4%
Kent County Health Dept 642 470 1,112 3,602 4,714 13.6% 10.0% 23.6% 76.4%
Keweenaw Bay Indian Community 7 4 11 52 63 11.1% 6.3% 17.5% 82.5%
Lapeer County Health Dept 90 39 129 388 517 17.4% 7.5% 25.0% 75.0%
Community Action Agency 78 59 137 466 603 12.9% 9.8% 22.7% 77.3%
Livingston County Health Dept 99 41 140 412 552 17.9% 7.4% 25.4% 74.6%
Luce-Mackinac-Alger Dist Health Dept 27 11 38 150 188 14.4% 5.9% 20.2% 79.8%
Marquette County Health Dept 63 23 86 238 324 19.4% 7.1% 26.5% 73.5%
Mid Michigan District Health Dept 182 69 251 706 957 19.0% 7.2% 26.2% 73.8%
Monroe County Health Dept 99 56 155 667 822 12.0% 6.8% 18.9% 81.1%
Muskegon County Health Dept 249 114 363 1,410 1,773 14.0% 6.4% 20.5% 79.5%
Oakland County WIC Program 394 445 839 3,408 4,247 9.3% 10.5% 19.8% 80.2%
Saginaw County Health Dept 124 78 202 1,063 1,265 9.8% 6.2% 16.0% 84.0%
St. Clair County Health Dept 104 57 161 790 951 10.9% 6.0% 16.9% 83.1%
Sanailac County Health Dept 32 20 52 196 248 12.9% 8.1% 21.0% 79.0%
Shiawassee County Health Dept 77 51 128 349 477 16.1% 10.7% 26.8% 73.2%
Tuscola County Health Dept 60 12 72 287 359 16.7% 3.3% 20.1% 79.9%
Washtenaw Co. Public Hlth. WIC Clinic 242 193 435 949 1,384 17.5% 13.9% 31.4% 68.6%
Wayne County Health Dept 314 770 1,084 4,080 5,164 6.1% 14.9% 21.0% 79.0%
Western Up District Health Dept 72 30 102 239 341 21.1% 8.8% 29.9% 70.1%
District Health Dept #10 350 139 489 1,402 1,891 18.5% 7.4% 25.9% 74.1%
Macomb County Health Dept 184 216 400 2,409 2,809 6.6% 7.7% 14.2% 85.8%
Berrien County Health Dept 142 70 212 904 1,116 12.7% 6.3% 19.0% 81.0%
Benzie Leelanau District Health Dept 29 13 42 94 136 21.3% 9.6% 30.9% 69.1%
Detroit Urban League 112 259 371 3,089 3,460 3.2% 7.5% 10.7% 89.3%
MID MI Comm Action Agency 102 29 131 325 456 22.4% 6.4% 28.7% 71.3%
Barry-Eaton District Health Department 133 50 183 572 755 17.6% 6.6% 24.2% 75.8%
Downriver 112 87 199 641 840 13.3% 10.4% 23.7% 76.3%
7,358 5,713 13,071 50,635 63,706 11.5% 9.0% 20.5% 79.5%
Aitkin County Public Health 13 4 17 44 61 21.3% 6.6% 27.9% 72.1%
Anoka County Community Health &
Environmental Services 174 194 368 921 1,289 13.5% 15.1% 28.5% 71.5%
Cass Co Hlth, Hum & Vet Services 27 9 36 111 147 18.4% 6.1% 24.5% 75.5%
Clay County Health Dept 45 39 84 212 296 15.2% 13.2% 28.4% 71.6%
Dakota County Public Health Dept 208 398 606 958 1,564 13.3% 25.4% 38.7% 61.3%
Fond du Lac Tribal Council 14 7 21 62 83 16.9% 8.4% 25.3% 74.7%
Quin County CHS 60 17 77 263 340 17.6% 5.0% 22.6% 77.4%
St. Joseph Area Health Service, WIC 31 7 38 74 112 27.7% 6.3% 33.9% 66.1%
Leech Lake Band of Ojibwe 6 13 19 133 152 3.9% 8.6% 12.5% 87.5%
Mille Lacs Band of Ojibwe WIC Program 2 5 7 58 65 3.1% 7.7% 10.8% 89.2%
Hennepin County Human Srvcs & Public
Health Dept 629 1,577 2,206 2,876 5,082 12.4% 31.0% 43.4% 56.6%
Fillmore County Public Health 21 7 28 68 96 21.9% 7.3% 29.2% 70.8%
Olmsted County Health Dept 135 166 301 466 767 17.6% 21.6% 39.2% 60.8%
Otter Tail County Public Health 70 24 94 186 280 25.0% 8.6% 33.6% 66.4%
Polk County Public Health 36 14 50 141 191 18.8% 7.3% 26.2% 73.8%
St.Paul-Ramsey Couty Pubc Health WIC 394 919 1,313 2,763 4,076 9.7% 22.5% 32.2% 67.8%
Dodge County PHNS 15 10 25 72 97 15.5% 10.3% 25.8% 74.2%
Cottonwood Jackson CHS 20 12 32 118 150 13.3% 8.0% 21.3% 78.7%
Itasca County Public Health 51 11 62 172 234 21.8% 4.7% 26.5% 73.5%
Wadena County Public Health Dept 15 3 18 48 66 22.7% 4.5% 27.3% 72.7%
Washington County WIC Program, Dept of
Public Health and Environment 100 110 210 462 672 14.9% 16.4% 31.3% 68.8%
White Earth Health Reservation WIC 14 11 25 154 179 7.8% 6.1% 14.0% 86.0%
Horizon Community Health Board (Douglas
County) 34 16 50 128 178 19.1% 9.0% 28.1% 71.9%
Todd County PHNS 23 18 41 112 153 15.0% 11.8% 26.8% 73.2%
Mower County PHNS 40 51 91 216 307 13.0% 16.6% 29.6% 70.4%
Beltrami County Public Health 74 24 98 232 330 22.4% 7.3% 29.7% 70.3%
Crow Wing County Health Services 85 23 108 271 379 22.4% 6.1% 28.5% 71.5%
Morrison County Public Health 33 8 41 138 179 18.4% 4.5% 22.9% 77.1%
Lake County Health Dept 20 3 23 27 50 40.0% 6.0% 46.0% 54.0%
Scott-Carver-Dakota CAP Agency 107 97 204 366 570 18.8% 17.0% 35.8% 64.2%
Wright County Comm Action, Inc. 89 47 136 338 474 18.8% 9.9% 28.7% 71.3%
Indiana
Indiana State Agency Mean
Michigan
Michigan State Agency Mean
Minnesota
*To maintain the privacy of participants, Local Agencies with less than 30 Infant Participants are not published. 15

Partially
Breastfed
Total
Breastfed
Fully
Formula-Fed
State/Region Local Agency
Infant Data
Participation Data Statistical Data
Fully
Breastfed
Partially
Breastfed
Total
Breastfed
Connecticut
Fully
Formula-Fed Total Infants
Fully
Breastfed
Pine County Public Health & Human
Services 23 6 29 116 145 15.9% 4.1% 20.0% 80.0%
Steele County PHNS 34 37 71 146 217 15.7% 17.1% 32.7% 67.3%
Lyon County Public Health, Southwest
Health and Human Services 23 30 53 160 213 10.8% 14.1% 24.9% 75.1%
Nobles County Community Services 23 57 80 159 239 9.6% 23.8% 33.5% 66.5%
Countryside PHNS-Benson Off 52 29 81 238 319 16.3% 9.1% 25.4% 74.6%
Carlton County Health Services 31 12 43 122 165 18.8% 7.3% 26.1% 73.9%
Isanti County PHS 41 32 73 147 220 18.6% 14.5% 33.2% 66.8%
Freeborn County 35 19 54 163 217 16.1% 8.8% 24.9% 75.1%
Red Lake Comprehensive Health Services 5 10 15 167 182 2.7% 5.5% 8.2% 91.8%
Rice County WIC Program PHNS 44 82 126 222 348 12.6% 23.6% 36.2% 63.8%
Goodhue CHS 22 18 40 151 191 11.5% 9.4% 20.9% 79.1%
Winona County PHNS 38 17 55 135 190 20.0% 8.9% 28.9% 71.1%
Houston County PHNS 12 5 17 45 62 19.4% 8.1% 27.4% 72.6%
Chisago County Public Health SVC 36 14 50 121 171 21.1% 8.2% 29.2% 70.8%
Kanabec County PHNS 16 5 21 68 89 18.0% 5.6% 23.6% 76.4%
Mille Lacs County Community and
Veterans Services 31 11 42 100 142 21.8% 7.7% 29.6% 70.4%
Watonwan County Human Services 12 22 34 68 102 11.8% 21.6% 33.3% 66.7%
Benton County Public Health 26 15 41 155 196 13.3% 7.7% 20.9% 79.1%
Sherburne County Public Health Srv 71 38 109 247 356 19.9% 10.7% 30.6% 69.4%
Stearns County Public Health, WIC 121 129 250 479 729 16.6% 17.7% 34.3% 65.7%
Kandiyohi CHS 38 71 109 208 317 12.0% 22.4% 34.4% 65.6%
Nicollet County 24 18 42 93 135 17.8% 13.3% 31.1% 68.9%
Blue Earth County Government Center 62 40 102 180 282 22.0% 14.2% 36.2% 63.8%
Lakewood Nursing Service 5 2 7 15 22 22.7% 9.1% 31.8% 68.2%
Wilkin County PHNS 7 2 9 29 38 18.4% 5.3% 23.7% 76.3%
Brown County PHNS 26 9 35 102 137 19.0% 6.6% 25.5% 74.5%
Wabasha County Public Health Services 15 6 21 77 98 15.3% 6.1% 21.4% 78.6%
Horizon Community Health Board (Stevens
County) 13 3 16 35 51 25.5% 5.9% 31.4% 68.6%
Meeker County PHNS 30 5 35 96 131 22.9% 3.8% 26.7% 73.3%
Bloomington Public Health 144 116 260 368 628 22.9% 18.5% 41.4% 58.6%
Waseca County Public Health Services 16 7 23 81 104 15.4% 6.7% 22.1% 77.9%
LeSueur County Public Health Services 24 12 36 85 121 19.8% 9.9% 29.8% 70.2%
Koochiching County Public Health 14 2 16 47 63 22.2% 3.2% 25.4% 74.6%
Becker County WIC Program 39 16 55 142 197 19.8% 8.1% 27.9% 72.1%
St. Louis County Health Dept (Duluth
Office) 118 42 160 337 497 23.7% 8.5% 32.2% 67.8%
St. Louis County Health Department
(Virginia Office) 79 21 100 300 400 19.8% 5.3% 25.0% 75.0%
Redwood County PHNS 15 4 19 95 114 13.2% 3.5% 16.7% 83.3%
Renville County Public Health Services,
WIC 15 6 21 76 97 15.5% 6.2% 21.6% 78.4%
Horizon Community Health Board (Pope
County) 14 3 17 48 65 21.5% 4.6% 26.2% 73.8%
McLeod County PHNS 40 9 49 114 163 24.5% 5.5% 30.1% 69.9%
Sibley County Public Health and Human
Services 21 8 29 68 97 21.6% 8.2% 29.9% 70.1%
Faribault County Public Health Service 11 5 16 53 69 15.9% 7.2% 23.2% 76.8%
Martin County Public Health Service 18 12 30 84 114 15.8% 10.5% 26.3% 73.7%
Norman County 6 5 11 37 48 12.5% 10.4% 22.9% 77.1%
Pipestone County Public Health, Southwest
Health and Human Services 11 10 21 40 61 18.0% 16.4% 34.4% 65.6%
Murray County Public Health, Southwest
Health and Human Services 8 2 10 31 41 19.5% 4.9% 24.4% 75.6%
Children's Hospital WIC Program 60 244 304 165 469 12.8% 52.0% 64.8% 35.2%
Rock County Public Health, Southwest
Health and Human Services 8 7 15 50 65 12.3% 10.8% 23.1% 76.9%
4,178 5,123 9,301 18,513 27,814 15.0% 18.4% 33.4% 66.6%
Allen County WIC Program 94 15 109 721 830 11.3% 1.8% 13.1% 86.9%
Ashtabula County WIC Program 92 19 111 611 722 12.7% 2.6% 15.4% 84.6%
Butler County WIC Program 163 92 255 1,849 2,104 7.7% 4.4% 12.1% 87.9%
Clark County WIC Program 78 21 99 975 1,074 7.3% 2.0% 9.2% 90.8%
Clermont County WIC Program 94 29 123 862 985 9.5% 2.9% 12.5% 87.5%
Sandusky County WIC Program 35 8 43 346 389 9.0% 2.1% 11.1% 88.9%
Coshocton County WIC Program 32 6 38 215 253 12.6% 2.4% 15.0% 85.0%
Cuyahoga County WIC Program 737 208 945 7,273 8,218 9.0% 2.5% 11.5% 88.5%
Franklin County WIC Program 718 378 1,096 8,004 9,100 7.9% 4.2% 12.0% 88.0%
Preble County WIC Program 40 4 44 213 257 15.6% 1.6% 17.1% 82.9%
Warren County WIC Program 44 6 50 467 517 8.5% 1.2% 9.7% 90.3%
Darke/Mercer County WIC Program 64 19 83 442 525 12.2% 3.6% 15.8% 84.2%
Hamilton County WIC Program 356 216 572 5,018 5,590 6.4% 3.9% 10.2% 89.8%
Lawrence County WIC Program 20 10 30 483 513 3.9% 1.9% 5.8% 94.2%
Fulton/Henry County WIC Program 52 14 66 325 391 13.3% 3.6% 16.9% 83.1%
Lucas County WIC Program 311 111 422 3,065 3,487 8.9% 3.2% 12.1% 87.9%
Mahoning County WIC Program 83 55 138 1,256 1,394 6.0% 3.9% 9.9% 90.1%
Montgomery County WIC Program 367 104 471 2,964 3,435 10.7% 3.0% 13.7% 86.3%
Portage/Columbiana WIC Program 158 37 195 1,123 1,318 12.0% 2.8% 14.8% 85.2%
Ashland/Richland County WIC Program 107 23 130 912 1,042 10.3% 2.2% 12.5% 87.5%
Ross/Pickaway County WIC Program 62 16 78 771 849 7.3% 1.9% 9.2% 90.8%
Stark County WIC Program 188 45 233 1,745 1,978 9.5% 2.3% 11.8% 88.2%
Summit County WIC Program 283 92 375 2,548 2,923 9.7% 3.1% 12.8% 87.2%
Tuscarawas County WIC Program 44 15 59 431 490 9.0% 3.1% 12.0% 88.0%
Trumbull County WIC Program 99 30 129 1,140 1,269 7.8% 2.4% 10.2% 89.8%
Clinton County WIC Program 29 6 35 246 281 10.3% 2.1% 12.5% 87.5%
Knox County WIC Program 38 7 45 280 325 11.7% 2.2% 13.8% 86.2%
Pike County WIC Program 17 3 20 217 237 7.2% 1.3% 8.4% 91.6%
Lorain County WIC Program 119 27 146 1,344 1,490 8.0% 1.8% 9.8% 90.2%
Holmes County WIC Program 33 5 38 118 156 21.2% 3.2% 24.4% 75.6%
Erie/Huron County WIC Program 83 20 103 767 870 9.5% 2.3% 11.8% 88.2%
Logan County WIC Program 20 8 28 222 250 8.0% 3.2% 11.2% 88.8%
Muskingum County WIC Program 46 13 59 594 653 7.0% 2.0% 9.0% 91.0%
Minnesota
Minnesota State Agency Mean
Ohio
*To maintain the privacy of participants, Local Agencies with less than 30 Infant Participants are not published. 16

Partially
Breastfed
Total
Breastfed
Fully
Formula-Fed
State/Region Local Agency
Infant Data
Participation Data Statistical Data
Fully
Breastfed
Partially
Breastfed
Total
Breastfed
Connecticut
Fully
Formula-Fed Total Infants
Fully
Breastfed
Gallia County WIC Program 31 7 38 215 253 12.3% 2.8% 15.0% 85.0%
Harrison County WIC Program 7 1 8 86 94 7.4% 1.1% 8.5% 91.5%
Jefferson County WIC Program 22 16 38 347 385 5.7% 4.2% 9.9% 90.1%
HHWP County WIC Program 72 23 95 625 720 10.0% 3.2% 13.2% 86.8%
Wood County WIC Program 41 21 62 357 419 9.8% 5.0% 14.8% 85.2%
Marion County WIC Program 34 10 44 473 517 6.6% 1.9% 8.5% 91.5%
Miami County WIC Program 54 9 63 413 476 11.3% 1.9% 13.2% 86.8%
Greene County WIC Program 82 16 98 515 613 13.4% 2.6% 16.0% 84.0%
Crawford County WIC Program 36 8 44 268 312 11.5% 2.6% 14.1% 85.9%
Madison County WIC Program 21 6 27 201 228 9.2% 2.6% 11.8% 88.2%
Licking County WIC Program 83 14 97 787 884 9.4% 1.6% 11.0% 89.0%
Athens/Perry County WIC Program 84 11 95 491 586 14.3% 1.9% 16.2% 83.8%
Meigs County WIC Program 17 3 20 154 174 9.8% 1.7% 11.5% 88.5%
Auglaize County WIC Program 20 6 26 201 227 8.8% 2.6% 11.5% 88.5%
Wyandot County WIC Program 21 7 28 95 123 17.1% 5.7% 22.8% 77.2%
Defiance County WIC Program 22 4 26 220 246 8.9% 1.6% 10.6% 89.4%
Paulding County WIC Program 13 1 14 98 112 11.6% 0.9% 12.5% 87.5%
Champaign County WIC Program 28 7 35 159 194 14.4% 3.6% 18.0% 82.0%
Ottawa County WIC Program 12 10 22 131 153 7.8% 6.5% 14.4% 85.6%
Fayette County WIC Program 17 3 20 229 249 6.8% 1.2% 8.0% 92.0%
Wayne County WIC Program 83 23 106 427 533 15.6% 4.3% 19.9% 80.1%
Medina County WIC Program 71 21 92 386 478 14.9% 4.4% 19.2% 80.8%
Washington-Morgan WIC Program 24 5 29 408 437 5.5% 1.1% 6.6% 93.4%
Scioto County WIC Program 41 12 53 577 630 6.5% 1.9% 8.4% 91.6%
Seneca County WIC Program 42 13 55 340 395 10.6% 3.3% 13.9% 86.1%
Fairfield County WIC Program 55 12 67 537 604 9.1% 2.0% 11.1% 88.9%
Geauga County WIC Program 38 7 45 162 207 18.4% 3.4% 21.7% 78.3%
Delaware-Mo-Un-WIC Program 84 22 106 625 731 11.5% 3.0% 14.5% 85.5%
Williams County WIC Program 33 9 42 197 239 13.8% 3.8% 17.6% 82.4%
Van Wert County WIC Program 20 3 23 140 163 12.3% 1.8% 14.1% 85.9%
Adams/Brown County WIC Program 41 7 48 494 542 7.6% 1.3% 8.9% 91.1%
Highland County WIC Program 38 5 43 329 372 10.2% 1.3% 11.6% 88.4%
Jackson County WIC Program 20 3 23 215 238 8.4% 1.3% 9.7% 90.3%
Vinton County WIC Program 13 2 15 101 116 11.2% 1.7% 12.9% 87.1%
Guernsey County WIC Program 16 2 18 269 287 5.6% 0.7% 6.3% 93.7%
Monroe County WIC Program 11 3 14 93 107 10.3% 2.8% 13.1% 86.9%
Noble County WIC Program 14 3 17 78 95 14.7% 3.2% 17.9% 82.1%
Hocking County WIC Program 26 4 30 169 199 13.1% 2.0% 15.1% 84.9%
Belmont County WIC Program 32 5 37 357 394 8.1% 1.3% 9.4% 90.6%
Lake County WIC Program 77 40 117 850 967 8.0% 4.1% 12.1% 87.9%
Carroll County WIC Program 19 3 22 128 150 12.7% 2.0% 14.7% 85.3%
Shelby County WIC Program 24 5 29 225 254 9.4% 2.0% 11.4% 88.6%
6,239 2,051 8,290 60,714 69,004 9.0% 3.0% 12.0% 88.0%
Great Lakes Inter Tribal 26 19 45 198 243 10.7% 7.8% 18.5% 81.5%
N.E.W. Community Clinic 165 96 261 1,077 1,338 12.3% 7.2% 19.5% 80.5%
Menominee Tribal Clinic 9 11 20 80 100 9.0% 11.0% 20.0% 80.0%
MLK Heritage Health Center 44 41 85 673 758 5.8% 5.4% 11.2% 88.8%
Waukesha County Dept Hum Ser 87 49 136 413 549 15.8% 8.9% 24.8% 75.2%
South W Comm Action Program 36 16 52 186 238 15.1% 6.7% 21.8% 78.2%
La Clinica De Los Campesino 29 23 52 177 229 12.7% 10.0% 22.7% 77.3%
North W Comm Service Agency 35 10 45 198 243 14.4% 4.1% 18.5% 81.5%
Taylor County Hlth Dept 16 4 20 56 76 21.1% 5.3% 26.3% 73.7%
Outagamie Dept of Health & Human Svs 95 47 142 502 644 14.8% 7.3% 22.0% 78.0%
Oneida Community Health Center 20 6 26 116 142 14.1% 4.2% 18.3% 81.7%
Family Plan Health Services 121 36 157 660 817 14.8% 4.4% 19.2% 80.8%
Fond du Lac County Health Dept 87 25 112 329 441 19.7% 5.7% 25.4% 74.6%
Kenosha County Dept of Human Svs 126 60 186 812 998 12.6% 6.0% 18.6% 81.4%
La Crosse County Health Dept 76 39 115 402 517 14.7% 7.5% 22.2% 77.8%
Portage County Comm Human Service 61 12 73 201 274 22.3% 4.4% 26.6% 73.4%
Jackson County Public Health Service 15 11 26 79 105 14.3% 10.5% 24.8% 75.2%
Door County Health 26 11 37 85 122 21.3% 9.0% 30.3% 69.7%
Dunn County Health Dept 41 10 51 158 209 19.6% 4.8% 24.4% 75.6%
Juneau County Health Dept 40 15 55 202 257 15.6% 5.8% 21.4% 78.6%
Eau Claire City County Health Dept 91 37 128 391 519 17.5% 7.1% 24.7% 75.3%
Chippewa County WIC Project 55 24 79 212 291 18.9% 8.2% 27.1% 72.9%
Monroe County Health Dept 35 15 50 177 227 15.4% 6.6% 22.0% 78.0%
Price County Health Dept 12 4 16 55 71 16.9% 5.6% 22.5% 77.5%
Trempealeau County Health 17 21 38 108 146 11.6% 14.4% 26.0% 74.0%
Winnebago County WIC Project 100 48 148 499 647 15.5% 7.4% 22.9% 77.1%
Barron County Public Health 37 20 57 198 255 14.5% 7.8% 22.4% 77.6%
Walworth County Public Health 67 47 114 272 386 17.4% 12.2% 29.5% 70.5%
Vilas County Health Dept 7 2 9 30 39 17.9% 5.1% 23.1% 76.9%
St. Croix Human Service 52 16 68 173 241 21.6% 6.6% 28.2% 71.8%
Columbia County Chn Service 33 7 40 128 168 19.6% 4.2% 23.8% 76.2%
Aurora Health Care 31 49 80 630 710 4.4% 6.9% 11.3% 88.7%
West Allis Health Dept 41 35 76 291 367 11.2% 9.5% 20.7% 79.3%
Sixteenth Street Comm Hlth Ctr 215 256 471 960 1,431 15.0% 17.9% 32.9% 67.1%
Seeds of Health 63 75 138 436 574 11.0% 13.1% 24.0% 76.0%
Jefferson County Health Department 50 39 89 270 359 13.9% 10.9% 24.8% 75.2%
Nutrition & Health Assoc. 84 63 147 757 904 9.3% 7.0% 16.3% 83.7%
Buffalo County Dept of Health 17 9 26 62 88 19.3% 10.2% 29.5% 70.5%
Health and Nutrition Service 77 90 167 739 906 8.5% 9.9% 18.4% 81.6%
Oneida County Health Dept 20 10 30 105 135 14.8% 7.4% 22.2% 77.8%
Marinette County Health Dept 27 5 32 153 185 14.6% 2.7% 17.3% 82.7%
Shawano County Health Department 34 7 41 133 174 19.5% 4.0% 23.6% 76.4%
Sheboygan County Health 57 45 102 395 497 11.5% 9.1% 20.5% 79.5%
Manitowoc County Health Dept 50 20 70 262 332 15.1% 6.0% 21.1% 78.9%
Forest County Health Department 5 2 7 43 50 10.0% 4.0% 14.0% 86.0%
Burnett County Dept of HHS 12 4 16 56 72 16.7% 5.6% 22.2% 77.8%
Sawyer Co. Health & Human Services 17 5 22 64 86 19.8% 5.8% 25.6% 74.4%
Oconto County Health Dept 16 8 24 108 132 12.1% 6.1% 18.2% 81.8%
Wood County Health Department 59 21 80 275 355 16.6% 5.9% 22.5% 77.5%
City of Milwaukee 112 150 262 1,639 1,901 5.9% 7.9% 13.8% 86.2%
Public Health Madison and Dane County 278 236 514 1,071 1,585 17.5% 14.9% 32.4% 67.6%
Ohio
Ohio State Agency Mean
Wisconsin
*To maintain the privacy of participants, Local Agencies with less than 30 Infant Participants are not published. 17

Partially
Breastfed
Total
Breastfed
Fully
Formula-Fed
State/Region Local Agency
Infant Data
Participation Data Statistical Data
Fully
Breastfed
Partially
Breastfed
Total
Breastfed
Connecticut
Fully
Formula-Fed Total Infants
Fully
Breastfed
Vernon County Health Dept 32 9 41 99 140 22.9% 6.4% 29.3% 70.7%
Sauk County Dept of Health 74 23 97 225 322 23.0% 7.1% 30.1% 69.9%
Washburn County Health Dept 26 6 32 64 96 27.1% 6.3% 33.3% 66.7%
Rusk County Dept of HHS 12 3 15 64 79 15.2% 3.8% 19.0% 81.0%
Clark County Health Care Center 40 16 56 111 167 24.0% 9.6% 33.5% 66.5%
Kewaunee County Public Health
Department 12 4 16 55 71 16.9% 5.6% 22.5% 77.5%
Washington County Hlth Dept 59 26 85 227 312 18.9% 8.3% 27.2% 72.8%
Wee Care Day Care WIC 75 142 217 1,559 1,776 4.2% 8.0% 12.2% 87.8%
Waupaca County Dept Human Servs 33 12 45 161 206 16.0% 5.8% 21.8% 78.2%
Calumet County Health Dept 28 10 38 109 147 19.0% 6.8% 25.9% 74.1%
Dodge County WIC Project 66 23 89 215 304 21.7% 7.6% 29.3% 70.7%
Pierce County Public Hlth Dept 22 7 29 93 122 18.0% 5.7% 23.8% 76.2%
Polk County Health Dept 45 12 57 108 165 27.3% 7.3% 34.5% 65.5%
Grant County Health Dept 36 11 47 175 222 16.2% 5.0% 21.2% 78.8%
Bay Area WIC 46 10 56 117 173 26.6% 5.8% 32.4% 67.6%
Green County Health Dept 18 14 32 109 141 12.8% 9.9% 22.7% 77.3%
City of Racine Health Department 22 27 49 207 256 8.6% 10.5% 19.1% 80.9%
Cudahy Health Department 85 39 124 504 628 13.5% 6.2% 19.7% 80.3%
Ozaukee County Department of Health 47 15 62 187 249 18.9% 6.0% 24.9% 75.1%
3,680 2,310 5,990 21,602 27,592 13.3% 8.4% 21.7% 78.3%
30,147 31,155 61,302 243,664 304,966 9.9% 10.2% 20.1% 79.9%
AR Department of Health/WIC 1,869 919 2,788 21,713 24,501 7.6% 3.8% 11.4% 88.6%
Arkansas State
Agency Mean 1,869 919 2,788 21,713 24,501 7.6% 3.8% 11.4% 88.6%
Southern University School of Nursing
Health Care Center 5 11 16 339 355 1.4% 3.1% 4.5% 95.5%
North Caddo Medical Center 5 6 11 142 153 3.3% 3.9% 7.2% 92.8%
Teche Action Clinic 12 10 22 261 283 4.2% 3.5% 7.8% 92.2%
St Martin Parish Government 16 7 23 215 238 6.7% 2.9% 9.7% 90.3%
Capitol City Family Health Center 24 53 77 1,009 1,086 2.2% 4.9% 7.1% 92.9%
David Raines Community Health Center 9 25 34 994 1,028 0.9% 2.4% 3.3% 96.7%
St Charles Community Health Center 38 62 100 714 814 4.7% 7.6% 12.3% 87.7%
Outpatient Medical Center 9 15 24 201 225 4.0% 6.7% 10.7% 89.3%
Acadia Parish Police Jury 8 12 20 243 263 3.0% 4.6% 7.6% 92.4%
West Jefferson Medical Center 51 91 142 1,552 1,694 3.0% 5.4% 8.4% 91.6%
Bayou Comprehensive Health Foundation 11 10 21 239 260 4.2% 3.8% 8.1% 91.9%
New Orleans Health Department 54 133 187 1,687 1,874 2.9% 7.1% 10.0% 90.0%
Evangeline Parish Police Jury 2 4 6 123 129 1.6% 3.1% 4.7% 95.3%
LSUHSC Hlth Care Services Division 8 35 43 443 486 1.6% 7.2% 8.8% 91.2%
LSUHSC Shreveport Pediatrics 25 77 102 1,657 1,759 1.4% 4.4% 5.8% 94.2%
Parish of Ascension 86 137 223 1,621 1,844 4.7% 7.4% 12.1% 87.9%
St Landry Parish Police Jury 14 9 23 155 178 7.9% 5.1% 12.9% 87.1%
St Tammany Parish Hospital 65 61 126 426 552 11.8% 11.1% 22.8% 77.2%
Acadia Parish Health Unit/CROWLEY 11 7 18 229 247 4.5% 2.8% 7.3% 92.7%
Allen Parish Health Unit/OAKDALE 7 5 12 190 202 3.5% 2.5% 5.9% 94.1%
Ascension Parish Health
Unit/DONALDSONVILLE 2 4 6 149 155 1.3% 2.6% 3.9% 96.1%
Assumption Parish Heatlh
Unit/NAPOLEONVILLE 2 4 6 121 127 1.6% 3.1% 4.7% 95.3%
Avoyelles Parish Health Unit/MARKSVILLE 7 14 21 442 463 1.5% 3.0% 4.5% 95.5%
Beauregard Parish Health Unit/DERIDDER 15 13 28 289 317 4.7% 4.1% 8.8% 91.2%
Bienville Parish Health Unit/ARCADIA 3 4 7 133 140 2.1% 2.9% 5.0% 95.0%
Bossier Parish Hlth Unit/BOSSIER 14 34 48 434 482 2.9% 7.1% 10.0% 90.0%
Caddo Parish Helalth Unit/SHREVEPORT 22 51 73 698 771 2.9% 6.6% 9.5% 90.5%
Calcasieu Parish Health Unit/LAKE
CHARLES 58 87 145 1,217 1,362 4.3% 6.4% 10.6% 89.4%
Caldwell Parish Health Unit/COLUMBIA 3 2 5 119 124 2.4% 1.6% 4.0% 96.0%
Catahoula Parish Health Unit/JONESVILLE 2 2 4 93 97 2.1% 2.1% 4.1% 95.9%
Children Health Care Clinic of Acadiana 19 25 44 412 456 4.2% 5.5% 9.6% 90.4%
Claiborne Parish Health Unit/HOMER 7 10 17 128 145 4.8% 6.9% 11.7% 88.3%
Concordia Parish Health Unit/FERRIDAY 5 6 11 226 237 2.1% 2.5% 4.6% 95.4%
Desoto Parish Health Unit/MANSFIELD 5 6 11 240 251 2.0% 2.4% 4.4% 95.6%
East Baton Rouge Parish Health
Unit/BATON ROUGE 34 105 139 1,106 1,245 2.7% 8.4% 11.2% 88.8%
East Carroll Parish Health Unit/LAKE
PROVIDENCE 1 1 2 114 116 0.9% 0.9% 1.7% 98.3%
East Feliciana Parish Health Unit/CLINTON 12 9 21 193 214 5.6% 4.2% 9.8% 90.2%
Evangeline Parish Health Unit/VILLE
PLATTE 5 7 12 222 234 2.1% 3.0% 5.1% 94.9%
Franklin Parish Health Unit/WINNSBORO 4 6 10 225 235 1.7% 2.6% 4.3% 95.7%
Grant Parish Health Unit/COLFAX 9 6 15 134 149 6.0% 4.0% 10.1% 89.9%
Iberia Parish Health Unit/NEW IBERIA 18 23 41 674 715 2.5% 3.2% 5.7% 94.3%
Iberville Parish Health Unit/PLAQUEMINE 3 6 9 283 292 1.0% 2.1% 3.1% 96.9%
Jackson Parish Health Unit/JONESBORO 7 4 11 146 157 4.5% 2.5% 7.0% 93.0%
Jefferson Davis Parish Health
Unit/JENNINGS 15 15 30 290 320 4.7% 4.7% 9.4% 90.6%
Jefferson Parish Health Unit/METAIRIE 34 70 104 681 785 4.3% 8.9% 13.2% 86.8%
Lafayette Parish Health Unit/LAFAYETTE 58 77 135 1,081 1,216 4.8% 6.3% 11.1% 88.9%
Lafourche Parish Health Unit/THIBODAUX 27 28 55 640 695 3.9% 4.0% 7.9% 92.1%
Lasalle Parish Health Unit/JENA 3 4 7 86 93 3.2% 4.3% 7.5% 92.5%
Lincoln Parish Health Unit/RUSTON 18 17 35 288 323 5.6% 5.3% 10.8% 89.2%
Livingston Parrish Health Unit/Livingston 37 20 57 683 740 5.0% 2.7% 7.7% 92.3%
Madison Parish Health Unit/TALLULAH 4 4 8 183 191 2.1% 2.1% 4.2% 95.8%
Morehouse Parish Health Unit/BASTROP 5 7 12 275 287 1.7% 2.4% 4.2% 95.8%
Wisconsin State Agency Mean
Midwest Region Mean
Arkansas
Louisiana
Wisconsin
*To maintain the privacy of participants, Local Agencies with less than 30 Infant Participants are not published. 18

Partially
Breastfed
Total
Breastfed
Fully
Formula-Fed
State/Region Local Agency
Infant Data
Participation Data Statistical Data
Fully
Breastfed
Partially
Breastfed
Total
Breastfed
Connecticut
Fully
Formula-Fed Total Infants
Fully
Breastfed
Natchitoches Parish Health
Unit/NATCHITOCHES 7 10 17 212 229 3.1% 4.4% 7.4% 92.6%
Ouachita Parish Health Unit/MONROE 30 30 60 1,012 1,072 2.8% 2.8% 5.6% 94.4%
Pointe Coupee Parish Health Unit/NEW
ROADS 4 10 14 221 235 1.7% 4.3% 6.0% 94.0%
Rapides Parish Health Unit/ALEXANDRIA 38 71 109 1,141 1,250 3.0% 5.7% 8.7% 91.3%
Red River Parish Health Unit/COUSHATTA 0 1 1 133 134 0.0% 0.7% 0.7% 99.3%
Richland Parish Health Unit/RAYVILLE 2 5 7 219 226 0.9% 2.2% 3.1% 96.9%
Sabine Parish Health Unit/MANY 6 5 11 199 210 2.9% 2.4% 5.2% 94.8%
St Bernard Parish Health
Unit/CHALMETTE 19 25 44 388 432 4.4% 5.8% 10.2% 89.8%
St Helena Parish Health
Unit/GREENSBURG 4 5 9 136 145 2.8% 3.4% 6.2% 93.8%
St James Parish Health Unit/VACHERIE 3 2 5 167 172 1.7% 1.2% 2.9% 97.1%
St John Parish Health Unit/RESERVE 16 14 30 353 383 4.2% 3.7% 7.8% 92.2%
St Landry Parish Health Unit/OPELOUSAS 23 30 53 797 850 2.7% 3.5% 6.2% 93.8%
St Martin Parish Health Unit/ST
MARTINVILLE 8 8 16 244 260 3.1% 3.1% 6.2% 93.8%
St Mary Parish Health Unit/MORGAN CITY 5 17 22 220 242 2.1% 7.0% 9.1% 90.9%
Tangipahoa Parish Health Unit/HAMMOND 43 56 99 1,064 1,163 3.7% 4.8% 8.5% 91.5%
Tensas Parish Health Unit/ST JOSEPH 1 1 2 46 48 2.1% 2.1% 4.2% 95.8%
Terrebonne Parish Health Unit/HOUMA 14 18 32 429 461 3.0% 3.9% 6.9% 93.1%
Union Parish Health Unit/FARMERVILLE 8 9 17 183 200 4.0% 4.5% 8.5% 91.5%
Vermillion Parish Health Unit/ABBEVILLE 16 17 33 441 474 3.4% 3.6% 7.0% 93.0%
Vernon Parish Health Unit/LEESVILLE 38 14 52 409 461 8.2% 3.0% 11.3% 88.7%
Washington Parish Health
Unit/BOGALUSA 17 17 34 432 466 3.6% 3.6% 7.3% 92.7%
Webster Parish Health Unit/MINDEN 14 6 20 407 427 3.3% 1.4% 4.7% 95.3%
West Baton Rouge Parish Health
Unit/PORT ALLEN 11 15 26 271 297 3.7% 5.1% 8.8% 91.2%
West Carroll Parish Health Unit/OAK
GROVE 2 3 5 106 111 1.8% 2.7% 4.5% 95.5%
West Feliciana Parish Health Unit/ST
FRANCISVILLE 4 5 9 120 129 3.1% 3.9% 7.0% 93.0%
Winn Parish Health Unit/WINNFIELD 2 4 6 157 163 1.2% 2.5% 3.7% 96.3%
Arunavanthi T. Sangisetty, APM 22 33 55 557 612 3.6% 5.4% 9.0% 91.0%
LSUHCSD EA Conway Medical Center 1 3 4 88 92 1.1% 3.3% 4.3% 95.7%
St. Francis Medical Center 12 25 37 391 428 2.8% 5.8% 8.6% 91.4%
Crescent City WIC Services/Gretna 59 94 153 762 915 6.4% 10.3% 16.7% 83.3%
St. Charles Community Health
Center/Slidell WIC Clinic 56 42 98 668 766 7.3% 5.5% 12.8% 87.2%
Daughters of Charity Services of New
Orleans 78 141 219 1,466 1,685 4.6% 8.4% 13.0% 87.0%
1,380 1,985 3,365 35,278 38,643 3.6% 5.1% 8.7% 91.3%
First Nations Community Healthsource 78 31 109 215 324 24.1% 9.6% 33.6% 66.4%
First Choice Community Healthcare 343 167 510 1,590 2,100 16.3% 8.0% 24.3% 75.7%
WIC State Office 1,910 873 2,783 9,064 11,847 16.1% 7.4% 23.5% 76.5%
2,331 1,070 3,401 10,869 14,270 16.3% 7.5% 23.8% 76.2%
EIGHT NORTHERN,
NM Eight Northern Pueblo, NM 14 1 15 44 59 23.7% 1.7% 25.4% 74.6%
ISLETA PUEBLO,NM
ISLETA PUEBLO,NM 41 16 57 130 187 21.9% 8.6% 30.5% 69.5%
PUEBLO OF ZUNI,
NM PUEBLO OF ZUNI, NM 67 21 88 62 150 44.7% 14.0% 58.7% 41.3%
FIVE SANDOVAL
INDIAN, NM FIVE SANDOVAL INDIAN, NM 18 13 31 32 63 28.6% 20.6% 49.2% 50.8%
SANTO
DOMINGO,NM SANTO DOMINGO,NM 11 4 15 22 37 29.7% 10.8% 40.5% 59.5%
PUEBLO OF SAN
FELIPE, NM PUEBLO OF SAN FELIPE, NM 17 11 28 37 65 26.2% 16.9% 43.1% 56.9%
ACL HOSPITAL
BOARD, NM ACL HOSPITAL BOARD, NM 30 20 50 50 100 30.0% 20.0% 50.0% 50.0%
Oklahoma State Dept. of Health 1,575 757 2,332 10,379 12,711 12.4% 6.0% 18.3% 81.7%
Tulsa City-County Health 328 313 641 1,967 2,608 12.6% 12.0% 24.6% 75.4%
Morton Health Center 19 27 46 231 277 6.9% 9.7% 16.6% 83.4%
Oklahoma City - County Health Dept. 172 110 282 1,751 2,033 8.5% 5.4% 13.9% 86.1%
Mary Mahoney Health Center 15 6 21 118 139 10.8% 4.3% 15.1% 84.9%
Hope Center 76 39 115 269 384 19.8% 10.2% 29.9% 70.1%
Neighborhood Services (admi) 138 79 217 941 1,158 11.9% 6.8% 18.7% 81.3%
Variety Care 206 166 372 1,198 1,570 13.1% 10.6% 23.7% 76.3%
Planned Parenthood of Arkansas and
Eastern OK 113 31 144 582 726 15.6% 4.3% 19.8% 80.2%
Margaret Hudson Program 50 33 83 268 351 14.2% 9.4% 23.6% 76.4%
Seiling Area Medical Foundation 0 0 0 18 18 0.0% 0.0% 0.0% 100.0%
Oklahoma City Indian Clinic 33 32 65 142 207 15.9% 15.5% 31.4% 68.6%
Guiding Right, Inc. 48 26 74 268 342 14.0% 7.6% 21.6% 78.4%
2,778 1,622 4,400 18,178 22,578 12.3% 7.2% 19.5% 80.5%
CHOCTAW NATION,
OK OK Choctaw Nation WIC Program 89 43 132 943 1,075 8.3% 4.0% 12.3% 87.7%
CHICKASAW
NATION, OK OK Chickasaw Nation WIC Program 140 33 173 734 907 15.4% 3.6% 19.1% 80.9%
MUSCOGEE, OK OK Muscogee Creek Nation 62 15 77 482 559 11.1% 2.7% 13.8% 86.2%
CHEROKEE
NATION, OK OK Cherokee Nation WIC Program 139 59 198 1,743 1,941 7.2% 3.0% 10.2% 89.8%
CITIZEN
POTAWATOMI,OK OK Citizen Potawatomi Nation 38 10 48 254 302 12.6% 3.3% 15.9% 84.1%
OSAGE TRIBE, OK OK Osage Nation 85 45 130 888 1,018 8.3% 4.4% 12.8% 87.2%
Louisiana
Louisiana State Agency Mean
New Mexico
New Mexico State Agency Mean
Oklahoma
Oklahoma State Agency Mean
*To maintain the privacy of participants, Local Agencies with less than 30 Infant Participants are not published. 19

Partially
Breastfed
Total
Breastfed
Fully
Formula-Fed
State/Region Local Agency
Infant Data
Participation Data Statistical Data
Fully
Breastfed
Partially
Breastfed
Total
Breastfed
Connecticut
Fully
Formula-Fed Total Infants
Fully
Breastfed
OTOE-MISSOURIA,
OK OK Otoe-Missouria Tribe 12 5 17 104 121 9.9% 4.1% 14.0% 86.0%
INTER-TRIBAL
COUNCIL, OK OK Inter-Tribal Council 23 9 32 171 203 11.3% 4.4% 15.8% 84.2%
WCD
ENTERPRISES, OK OK WCD Enterprises 109 65 174 789 963 11.3% 6.7% 18.1% 81.9%
Austin/Travis County Health & Human
Services Dept 1,394 3,225 4,619 3,000 7,619 18.3% 42.3% 60.6% 39.4%
Cameron County Dept of Health and
Human Services 325 3,009 3,334 2,861 6,195 5.2% 48.6% 53.8% 46.2%
Su Clinica Familiar 15 54 69 219 288 5.2% 18.8% 24.0% 76.0%
Driscoll Childrens Hospital 184 715 899 1,135 2,034 9.0% 35.2% 44.2% 55.8%
City Of Dallas Housing & Community
Services Dept. 2,137 11,895 14,032 9,958 23,990 8.9% 49.6% 58.5% 41.5%
Grayson County Health Dept. 113 135 248 684 932 12.1% 14.5% 26.6% 73.4%
Galveston Co. Health District 67 445 512 1,143 1,655 4.0% 26.9% 30.9% 69.1%
Hildalgo County Health & human Services
Dept. 803 9,852 10,655 4,416 15,071 5.3% 65.4% 70.7% 29.3%
Laredo (City of) Health Department 152 1,859 2,011 3,055 5,066 3.0% 36.7% 39.7% 60.3%
UT Health Science Center at Houston 465 2,722 3,187 4,469 7,656 6.1% 35.6% 41.6% 58.4%
Vida Y Salud Health Systems, Inc 34 240 274 434 708 4.8% 33.9% 38.7% 61.3%
Regence Health Network, Inc. 154 189 343 1,130 1,473 10.5% 12.8% 23.3% 76.7%
Wichita Falls -Witchita County Public
Health District 140 155 295 866 1,161 12.1% 13.4% 25.4% 74.6%
Waco Mclennan Co Public Health District 165 366 531 1,575 2,106 7.8% 17.4% 25.2% 74.8%
United Medical Centers 54 517 571 366 937 5.8% 55.2% 60.9% 39.1%
Houston (City of) Dept. of Health & Human
Services 1,030 8,057 9,087 8,015 17,102 6.0% 47.1% 53.1% 46.9%
South Plains Community Action Assc., Inc. 569 719 1,288 4,575 5,863 9.7% 12.3% 22.0% 78.0%
Centro De Salud Familiar La Fe, Inc. 53 158 211 260 471 11.3% 33.5% 44.8% 55.2%
Ft. Bend Family Health Center Inc. 133 796 929 797 1,726 7.7% 46.1% 53.8% 46.2%
City of Port Arthur 31 235 266 640 906 3.4% 25.9% 29.4% 70.6%
Bell Co. Public Health District 590 903 1,493 2,982 4,475 13.2% 20.2% 33.4% 66.6%
Brazos Valley Community Action Agency 241 456 697 1,188 1,885 12.8% 24.2% 37.0% 63.0%
City of El Paso 1,235 3,163 4,398 5,819 10,217 12.1% 31.0% 43.0% 57.0%
Abilene-Taylor County Public Health Dist. 150 116 266 891 1,157 13.0% 10.0% 23.0% 77.0%
Denton County Health Department 443 949 1,392 1,898 3,290 13.5% 28.8% 42.3% 57.7%
City of San Marcos 356 483 839 1,372 2,211 16.1% 21.8% 37.9% 62.1%
Victoria City-County Health Department 97 144 241 1,008 1,249 7.8% 11.5% 19.3% 80.7%
Corpus Christi-Nueces County Public
Health District 99 291 390 847 1,237 8.0% 23.5% 31.5% 68.5%
Northeast Texas Public Health District 485 1,023 1,508 3,065 4,573 10.6% 22.4% 33.0% 67.0%
Beaumont Public Health Department 78 416 494 844 1,338 5.8% 31.1% 36.9% 63.1%
San Antonio Metropolitan Health District 963 2,104 3,067 8,212 11,279 8.5% 18.7% 27.2% 72.8%
Williamson County Cities Health District 330 560 890 1,090 1,980 16.7% 28.3% 44.9% 55.1%
Gonzales Community Health Center,
Women's Health and WIC 28 55 83 234 317 8.8% 17.4% 26.2% 73.8%
City of Del Rio 65 114 179 404 583 11.1% 19.6% 30.7% 69.3%
Cross Timbers Health Clinic 9 44 53 89 142 6.3% 31.0% 37.3% 62.7%
Brazoria County Health Department 193 405 598 1,105 1,703 11.3% 23.8% 35.1% 64.9%
Harris County Public Health &
Environmental Service 1,189 5,873 7,062 8,534 15,596 7.6% 37.7% 45.3% 54.7%
Frio County WIC 6 40 46 161 207 2.9% 19.3% 22.2% 77.8%
San Patricio County Health Department 53 112 165 541 706 7.5% 15.9% 23.4% 76.6%
Atascosa Health Center, Inc. 31 63 94 230 324 9.6% 19.4% 29.0% 71.0%
Tarrant County Health Department 1,401 3,892 5,293 9,197 14,490 9.7% 26.9% 36.5% 63.5%
San Angelo (City of) 146 127 273 806 1,079 13.5% 11.8% 25.3% 74.7%
Angelina County & Cities Health District 77 132 209 686 895 8.6% 14.7% 23.4% 76.6%
Barrio Comprehensive Family Health Care
Center 47 187 234 538 772 6.1% 24.2% 30.3% 69.7%
Matagorda County Hospital District 24 40 64 320 384 6.3% 10.4% 16.7% 83.3%
Jasper-Newton County Public Health
District 34 82 116 445 561 6.1% 14.6% 20.7% 79.3%
Paris/Lamar County Health Department 41 40 81 346 427 9.6% 9.4% 19.0% 81.0%
Hardin County Health Department 33 80 113 255 368 9.0% 21.7% 30.7% 69.3%
Medina County Health Department 53 34 87 323 410 12.9% 8.3% 21.2% 78.8%
Texarkana Bowie County Family Health
Center 45 37 82 686 768 5.9% 4.8% 10.7% 89.3%
Corsicana Navarro County Pub Health
District 26 85 111 389 500 5.2% 17.0% 22.2% 77.8%
Community Council of South Central TX,
Inc 87 60 147 488 635 13.7% 9.4% 23.1% 76.9%
Chambers County Health Department 13 28 41 124 165 7.9% 17.0% 24.8% 75.2%
Collin County Health Care Services 390 1,017 1,407 1,473 2,880 13.5% 35.3% 48.9% 51.1%
El Centro Del Barrio, Inc.. 241 446 687 2,097 2,784 8.7% 16.0% 24.7% 75.3%
Brownwood-Brown County Health
Department 37 37 74 221 295 12.5% 12.5% 25.1% 74.9%
North TX Home Hlth Serv. Inc. DBA
Outreach Hlth Service 1,154 2,049 3,203 6,409 9,612 12.0% 21.3% 33.3% 66.7%
UT Medical Branch at Galveston (UTMB) 769 3,632 4,401 4,192 8,593 8.9% 42.3% 51.2% 48.8%
Health Services Regions 9/10 54 90 144 423 567 9.5% 15.9% 25.4% 74.6%
Health Service Regions 6/5 South 181 941 1,122 1,290 2,412 7.5% 39.0% 46.5% 53.5%
Health Service Regions 4/5 217 585 802 1,411 2,213 9.8% 26.4% 36.2% 63.8%
Health Service Region 11 89 224 313 902 1,215 7.3% 18.4% 25.8% 74.2%
Christus Santa Rosa Health Care 202 312 514 800 1,314 15.4% 23.7% 39.1% 60.9%
Los Barrios Unidos Community Clinic 93 506 599 537 1,136 8.2% 44.5% 52.7% 47.3%
Hill Country Memorial Hospital, WIC
Administration Office 73 181 254 269 523 14.0% 34.6% 48.6% 51.4%
Milam County Health Department 27 17 44 181 225 12.0% 7.6% 19.6% 80.4%
St. Joseph Regional Health Center 29 46 75 240 315 9.2% 14.6% 23.8% 76.2%
Community Care Foundation, Inc. 54 123 177 558 735 7.3% 16.7% 24.1% 75.9%
Longview Wellness Centers, Inc. dba
Wellness Pointe 149 388 537 935 1,472 10.1% 26.4% 36.5% 63.5%
Texas
*To maintain the privacy of participants, Local Agencies with less than 30 Infant Participants are not published. 20

Partially
Breastfed
Total
Breastfed
Fully
Formula-Fed
State/Region Local Agency
Infant Data
Participation Data Statistical Data
Fully
Breastfed
Partially
Breastfed
Total
Breastfed
Connecticut
Fully
Formula-Fed Total Infants
Fully
Breastfed
Tejas Health Care Center 18 75 93 118 211 8.5% 35.5% 44.1% 55.9%
Amarillo (City of) 222 361 583 1,515 2,098 10.6% 17.2% 27.8% 72.2%
20,682 78,506 99,188 128,285 227,473 9.1% 34.5% 43.6% 56.4%
29,932 84,471 114,403 220,808 335,211 8.9% 25.2% 34.1% 65.9%
Valley Wide Health Services 62 21 83 253 336 18.5% 6.3% 24.7% 75.3%
Bent County Nursing Service 4 2 6 26 32 12.5% 6.3% 18.8% 81.3%
Boulder County Public Health Dept 205 115 320 501 821 25.0% 14.0% 39.0% 61.0%
Summit County Nursing Service 32 8 40 47 87 36.8% 9.2% 46.0% 54.0%
Delta County Health Dept 27 3 30 75 105 25.7% 2.9% 28.6% 71.4%
El Paso County Dept of Health & E 593 259 852 2,790 3,642 16.3% 7.1% 23.4% 76.6%
Upper Arkansas Area COG 82 14 96 216 312 26.3% 4.5% 30.8% 69.2%
Gunnison County Public Health 21 6 27 22 49 42.9% 12.2% 55.1% 44.9%
Jefferson Cty Dept of Health & Env 323 129 452 1,114 1,566 20.6% 8.2% 28.9% 71.1%
Larimer Cty Dept of Health & Env 231 74 305 634 939 24.6% 7.9% 32.5% 67.5%
Las Animas/Huerfano Health Dept 14 4 18 102 120 11.7% 3.3% 15.0% 85.0%
Montezuma County Health Dept 37 8 45 76 121 30.6% 6.6% 37.2% 62.8%
Montrose County Nursing Service 37 29 66 176 242 15.3% 12.0% 27.3% 72.7%
Northeast Colorado Health Dept 51 20 71 450 521 9.8% 3.8% 13.6% 86.4%
Otero County Health Dept 26 7 33 173 206 12.6% 3.4% 16.0% 84.0%
Prowers County Nursing Service 18 5 23 92 115 15.7% 4.3% 20.0% 80.0%
Pueblo City/County Health Dept 235 54 289 828 1,117 21.0% 4.8% 25.9% 74.1%
Northwest Colorado VNA 34 12 46 87 133 25.6% 9.0% 34.6% 65.4%
San Juan Basin Health Dept 76 7 83 141 224 33.9% 3.1% 37.1% 62.9%
Tri-County Health Dept 935 758 1,693 4,804 6,497 14.4% 11.7% 26.1% 73.9%
Teller County Public Health/ENV. 14 4 18 41 59 23.7% 6.8% 30.5% 69.5%
Kit Carson Cty Health & Hum Serv 13 5 18 41 59 22.0% 8.5% 30.5% 69.5%
Lincoln County Public Health 6 3 9 26 35 17.1% 8.6% 25.7% 74.3%
Grand County Public Health Nursing 13 3 16 15 31 41.9% 9.7% 51.6% 48.4%
Garfield County Nursing Services 77 47 124 155 279 27.6% 16.8% 44.4% 55.6%
Eagle County Nursing Services 41 56 97 108 205 20.0% 27.3% 47.3% 52.7%
Mesa County Health Dept 131 43 174 511 685 19.1% 6.3% 25.4% 74.6%
Sunrise Community Health Center 206 106 312 803 1,115 18.5% 9.5% 28.0% 72.0%
Park County Nursing Service 15 4 19 22 41 36.6% 9.8% 46.3% 53.7%
Broomfield Co Hlth & Human SVS 28 6 34 71 105 26.7% 5.7% 32.4% 67.6%
Denver Health Medical Center 508 479 987 2,348 3,335 15.2% 14.4% 29.6% 70.4%
4,134 2,303 6,437 16,817 23,254 17.8% 9.9% 27.7% 72.3%
UTE MOUNTAIN, CO
Ute Mountain Tribe WIC Program 2 7 9 31 40 5.0% 17.5% 22.5% 77.5%
Broadlawns WIC Office 298 411 709 1,834 2,543 11.7% 16.2% 27.9% 72.1%
New Opportunities 61 46 107 339 446 13.7% 10.3% 24.0% 76.0%
Hawkeye Area Comm Action Prog 141 122 263 932 1,195 11.8% 10.2% 22.0% 78.0%
Hillcrest Family Services 103 71 174 761 935 11.0% 7.6% 18.6% 81.4%
Edgerton Women's Health Center 118 105 223 869 1,092 10.8% 9.6% 20.4% 79.6%
MATURA Action Corp 47 38 85 380 465 10.1% 8.2% 18.3% 81.7%
Mid-Iowa Comm Action 185 156 341 1,042 1,383 13.4% 11.3% 24.7% 75.3%
Mid-Sioux Opportunities 70 45 115 287 402 17.4% 11.2% 28.6% 71.4%
North Iowa Community Action 77 51 128 529 657 11.7% 7.8% 19.5% 80.5%
Visiting Nurse Association - Dubuque 65 32 97 259 356 18.3% 9.0% 27.2% 72.8%
Operation Threshold 152 139 291 944 1,235 12.3% 11.3% 23.6% 76.4%
Comm. Action of Southeast Iowa 106 93 199 746 945 11.2% 9.8% 21.1% 78.9%
American Home Finding 54 68 122 488 610 8.9% 11.1% 20.0% 80.0%
Upper Des Moines Opportunity 72 67 139 460 599 12.0% 11.2% 23.2% 76.8%
West Central Community Action 60 46 106 376 482 12.4% 9.5% 22.0% 78.0%
Johnson County Public Health 119 116 235 435 670 17.8% 17.3% 35.1% 64.9%
Pottawattamie County 88 69 157 517 674 13.1% 10.2% 23.3% 76.7%
Marion County Public Health 58 35 93 372 465 12.5% 7.5% 20.0% 80.0%
Webster County Health Department 66 57 123 378 501 13.2% 11.4% 24.6% 75.4%
Siouxland District Health Dept 90 99 189 766 955 9.4% 10.4% 19.8% 80.2%
2,028 1,866 3,894 12,713 16,607 12.2% 11.2% 23.4% 76.6%
Douglas County Health Dept 89 66 155 279 434 20.5% 15.2% 35.7% 64.3%
Wyandotte County Health Dept 202 318 520 1,257 1,777 11.4% 17.9% 29.3% 70.7%
Southwest Kansas WIC Program 61 129 190 519 709 8.6% 18.2% 26.8% 73.2%
Riley County Health Dept 164 99 263 626 889 18.4% 11.1% 29.6% 70.4%
Reno County Health Dept 60 37 97 388 485 12.4% 7.6% 20.0% 80.0%
Saline County Health Dept 52 44 96 356 452 11.5% 9.7% 21.2% 78.8%
Shawnee County Health Agency 156 137 293 1,020 1,313 11.9% 10.4% 22.3% 77.7%
Sedgwick County Health Dept 414 428 842 2,959 3,801 10.9% 11.3% 22.2% 77.8%
Miami County Health Dept 18 11 29 118 147 12.2% 7.5% 19.7% 80.3%
Leavenworth Co. Health Dept 43 18 61 273 334 12.9% 5.4% 18.3% 81.7%
Ford County Health Dept 44 106 150 410 560 7.9% 18.9% 26.8% 73.2%
Butler County Health Dept 35 19 54 169 223 15.7% 8.5% 24.2% 75.8%
Lyon County Health Dept 36 32 68 204 272 13.2% 11.8% 25.0% 75.0%
Sherman County Health Dept 20 9 29 92 121 16.5% 7.4% 24.0% 76.0%
Cowley County Health Dept 22 20 42 260 302 7.3% 6.6% 13.9% 86.1%
Harvey County Health Dept 43 30 73 147 220 19.5% 13.6% 33.2% 66.8%
Osborne County Health Dept 50 26 76 234 310 16.1% 8.4% 24.5% 75.5%
Chautauqua County Health Dept 3 1 4 33 37 8.1% 2.7% 10.8% 89.2%
Johnson County Health Dept 265 243 508 1,147 1,655 16.0% 14.7% 30.7% 69.3%
Barton County Health Dept 47 19 66 270 336 14.0% 5.7% 19.6% 80.4%
S.Central KS Coal Public Health 38 21 59 173 232 16.4% 9.1% 25.4% 74.6%
Wilson County Health Dept 12 5 17 62 79 15.2% 6.3% 21.5% 78.5%
Marion County Health Dept 16 8 24 49 73 21.9% 11.0% 32.9% 67.1%
Scott County Health Dept 13 7 20 41 61 21.3% 11.5% 32.8% 67.2%
Neosho County Health Dept 17 12 29 103 132 12.9% 9.1% 22.0% 78.0%
Crawford County Health 39 26 65 395 460 8.5% 5.7% 14.1% 85.9%
Cherokee County Health Dept 51 36 87 497 584 8.7% 6.2% 14.9% 85.1%
Franklin County Health Dept 19 12 31 138 169 11.2% 7.1% 18.3% 81.7%
Geary County Health Dept 41 31 72 246 318 12.9% 9.7% 22.6% 77.4%
Sek Multi-County Health Dept 9 6 15 46 61 14.8% 9.8% 24.6% 75.4%
Sumner County Health Dept 14 4 18 120 138 10.1% 2.9% 13.0% 87.0%
Jefferson County Health Dept 10 4 14 43 57 17.5% 7.0% 24.6% 75.4%
NE KS Multi-County Board of Health 34 18 52 229 281 12.1% 6.4% 18.5% 81.5%
Graham County Health Dept 7 3 10 33 43 16.3% 7.0% 23.3% 76.7%
Colorado
Colorado State Agency Mean
Iowa
Iowa State Agency Mean
Kansas
Texas
Texas State Agency Mean
Southwest Region Mean
*To maintain the privacy of participants, Local Agencies with less than 30 Infant Participants are not published. 21

Partially
Breastfed
Total
Breastfed
Fully
Formula-Fed
State/Region Local Agency
Infant Data
Participation Data Statistical Data
Fully
Breastfed
Partially
Breastfed
Total
Breastfed
Connecticut
Fully
Formula-Fed Total Infants
Fully
Breastfed
Seward County WIC Program 45 66 111 260 371 12.1% 17.8% 29.9% 70.1%
Marshall County Health Department 10 4 14 32 46 21.7% 8.7% 30.4% 69.6%
Linn County Health Dept (SEK) 10 6 16 45 61 16.4% 9.8% 26.2% 73.8%
Dickinson County Health Department 13 7 20 86 106 12.3% 6.6% 18.9% 81.1%
Stevens County Health Department 10 5 15 45 60 16.7% 8.3% 25.0% 75.0%
Cloud County Health Department 24 13 37 111 148 16.2% 8.8% 25.0% 75.0%
Lincoln County Health Department 14 9 23 79 102 13.7% 8.8% 22.5% 77.5%
Meade County Health Department 18 4 22 60 82 22.0% 4.9% 26.8% 73.2%
2,299 2,104 4,403 13,742 18,145 12.7% 11.6% 24.3% 75.7%
Andrew County Health Dept. 15 4 19 68 87 17.2% 4.6% 21.8% 78.2%
St. Joseph City of Health Department 69 37 106 571 677 10.2% 5.5% 15.7% 84.3%
Nodaway County Health Center 17 4 21 73 94 18.1% 4.3% 22.3% 77.7%
Carroll County Health Dept 10 3 13 46 59 16.9% 5.1% 22.0% 78.0%
Clinton County Health Dept 22 6 28 105 133 16.5% 4.5% 21.1% 78.9%
Daviess County Health Dept 6 2 8 38 46 13.0% 4.3% 17.4% 82.6%
Harrison County Health Dept 14 3 17 66 83 16.9% 3.6% 20.5% 79.5%
Johnson County Community Health
Services 87 47 134 268 402 21.6% 11.7% 33.3% 66.7%
Tri County Health Dept 13 4 17 61 78 16.7% 5.1% 21.8% 78.2%
Chariton County Health Center 5 2 7 24 31 16.1% 6.5% 22.6% 77.4%
Clark County Health Dept 6 2 8 48 56 10.7% 3.6% 14.3% 85.7%
Grundy County Health Dept 13 2 15 64 79 16.5% 2.5% 19.0% 81.0%
Lewis County Health Dept 8 3 11 54 65 12.3% 4.6% 16.9% 83.1%
Linn County Health Dept 10 4 14 71 85 11.8% 4.7% 16.5% 83.5%
Livingston County Health Center 13 2 15 85 100 13.0% 2.0% 15.0% 85.0%
Macon County Health Dept 10 5 15 63 78 12.8% 6.4% 19.2% 80.8%
Marion County Health Dept & Home Health
Agency 22 11 33 185 218 10.1% 5.0% 15.1% 84.9%
Monroe County Health Dept 5 5 10 41 51 9.8% 9.8% 19.6% 80.4%
Pike County Health Dept 16 2 18 106 124 12.9% 1.6% 14.5% 85.5%
Ralls County Health Dept 4 0 4 28 32 12.5% 0.0% 12.5% 87.5%
Randolph County Health Dept 28 6 34 149 183 15.3% 3.3% 18.6% 81.4%
Saline County Health Dept 29 19 48 163 211 13.7% 9.0% 22.7% 77.3%
Shelby County Health Dept 8 1 9 34 43 18.6% 2.3% 20.9% 79.1%
Sullivan County Health Dept 3 5 8 49 57 5.3% 8.8% 14.0% 86.0%
Audrain City County Health Unit 22 10 32 143 175 12.6% 5.7% 18.3% 81.7%
Columbia Health Dept of Public Health &
Human Service 108 81 189 527 716 15.1% 11.3% 26.4% 73.6%
Callaway County Health Dept 18 5 23 126 149 12.1% 3.4% 15.4% 84.6%
Camden County Health Dept 46 14 60 175 235 19.6% 6.0% 25.5% 74.5%
Cole County Health Dept 93 19 112 354 466 20.0% 4.1% 24.0% 76.0%
Cooper County Public Health Center 10 2 12 63 75 13.3% 2.7% 16.0% 84.0%
Crawford County Nursing Services/Health
Department 21 4 25 140 165 12.7% 2.4% 15.2% 84.8%
Dent County Health Center 16 3 19 96 115 13.9% 2.6% 16.5% 83.5%
Gasconade County Health Department 10 4 14 69 83 12.0% 4.8% 16.9% 83.1%
Howard County Public Hlth Dept 6 1 7 44 51 11.8% 2.0% 13.7% 86.3%
Laclede County Health Dept 54 18 72 252 324 16.7% 5.6% 22.2% 77.8%
Lincoln County Health Dept 27 14 41 239 280 9.6% 5.0% 14.6% 85.4%
Miller County Health Center 21 9 30 151 181 11.6% 5.0% 16.6% 83.4%
Moniteau County Health Center 8 6 14 59 73 11.0% 8.2% 19.2% 80.8%
Montgomery County Health Dept 14 2 16 73 89 15.7% 2.2% 18.0% 82.0%
Morgan County Health Center 21 3 24 112 136 15.4% 2.2% 17.6% 82.4%
Pettis County Health Center 63 34 97 300 397 15.9% 8.6% 24.4% 75.6%
Phelps County Health Dept 65 31 96 260 356 18.3% 8.7% 27.0% 73.0%
Pulaski County Health Dept 83 15 98 324 422 19.7% 3.6% 23.2% 76.8%
Washington County Health Dept 27 9 36 223 259 10.4% 3.5% 13.9% 86.1%
Butler County Health Dept 57 24 81 377 458 12.4% 5.2% 17.7% 82.3%
Cape Girardeau County Public Health
Center 43 18 61 395 456 9.4% 3.9% 13.4% 86.6%
Carter County Health Center 8 2 10 50 60 13.3% 3.3% 16.7% 83.3%
Bollinger County Health Center 20 3 23 87 110 18.2% 2.7% 20.9% 79.1%
Iron County Health Dept 7 3 10 91 101 6.9% 3.0% 9.9% 90.1%
Madison County Health Dept 18 2 20 89 109 16.5% 1.8% 18.3% 81.7%
Oregon County Health Dept 13 2 15 99 114 11.4% 1.8% 13.2% 86.8%
Pemiscot County Health Center 6 6 12 221 233 2.6% 2.6% 5.2% 94.8%
Perry County Health Dept 13 3 16 90 106 12.3% 2.8% 15.1% 84.9%
Reynolds County Health Center 6 1 7 27 34 17.6% 2.9% 20.6% 79.4%
Ripley County Health Center 15 3 18 105 123 12.2% 2.4% 14.6% 85.4%
Scott County Health Dept 20 18 38 313 351 5.7% 5.1% 10.8% 89.2%
Shannon County Health Center 17 2 19 48 67 25.4% 3.0% 28.4% 71.6%
Ste Genevieve County Health Dept 18 2 20 78 98 18.4% 2.0% 20.4% 79.6%
St Francois County Health Center 51 22 73 422 495 10.3% 4.4% 14.7% 85.3%
Wayne County Health Center 13 3 16 84 100 13.0% 3.0% 16.0% 84.0%
Barry Co Health Dept 48 23 71 295 366 13.1% 6.3% 19.4% 80.6%
Barton County Health Dept 13 2 15 69 84 15.5% 2.4% 17.9% 82.1%
Bates County Health Center 14 4 18 94 112 12.5% 3.6% 16.1% 83.9%
Benton County Health Dept 13 2 15 74 89 14.6% 2.2% 16.9% 83.1%
Douglas County Health Dept 20 6 26 83 109 18.3% 5.5% 23.9% 76.1%
Christian County Health Dept 75 17 92 271 363 20.7% 4.7% 25.3% 74.7%
Dade County Health Dept 6 2 8 37 45 13.3% 4.4% 17.8% 82.2%
Dallas County Health Dept 14 3 17 77 94 14.9% 3.2% 18.1% 81.9%
Springfield-Greene Co Hlth Dept 401 141 542 1,388 1,930 20.8% 7.3% 28.1% 71.9%
Henry County Health Center 24 5 29 127 156 15.4% 3.2% 18.6% 81.4%
Hickory County Dept 8 1 9 40 49 16.3% 2.0% 18.4% 81.6%
Joplin City Health Dept 145 57 202 776 978 14.8% 5.8% 20.7% 79.3%
Lawrence County Health Dept 40 14 54 188 242 16.5% 5.8% 22.3% 77.7%
McDonald County Health Dept 24 22 46 171 217 11.1% 10.1% 21.2% 78.8%
Newton County Health Dept 75 31 106 311 417 18.0% 7.4% 25.4% 74.6%
Polk County Health Center 48 14 62 163 225 21.3% 6.2% 27.6% 72.4%
St Clair County Health Center 17 2 19 42 61 27.9% 3.3% 31.1% 68.9%
Stone County Health Dept 29 9 38 119 157 18.5% 5.7% 24.2% 75.8%
Vernon County Health Dept 24 8 32 107 139 17.3% 5.8% 23.0% 77.0%
Webster County Health Unit 37 10 47 153 200 18.5% 5.0% 23.5% 76.5%
Kansas
Kansas State Agency Mean
Missouri
*To maintain the privacy of participants, Local Agencies with less than 30 Infant Participants are not published. 22

Partially
Breastfed
Total
Breastfed
Fully
Formula-Fed
State/Region Local Agency
Infant Data
Participation Data Statistical Data
Fully
Breastfed
Partially
Breastfed
Total
Breastfed
Connecticut
Fully
Formula-Fed Total Infants
Fully
Breastfed
Cass County Health Dept 49 26 75 298 373 13.1% 7.0% 20.1% 79.9%
Clay County Public Health Center 104 40 144 533 677 15.4% 5.9% 21.3% 78.7%
Ray County Health Dept 10 8 18 122 140 7.1% 5.7% 12.9% 87.1%
St Charles Co Dept. of Community Health
& Environment 63 41 104 446 550 11.5% 7.5% 18.9% 81.1%
Jefferson-Franklin CAC 121 44 165 885 1,050 11.5% 4.2% 15.7% 84.3%
St. Louis Human Dev Corp. 23 4 27 51 78 29.5% 5.1% 34.6% 65.4%
St. Louis County DOCHMC 933 714 1,647 7,308 8,955 10.4% 8.0% 18.4% 81.6%
Platte County Health Dept 78 41 119 293 412 18.9% 10.0% 28.9% 71.1%
Mississippi County Health Dept 7 1 8 141 149 4.7% 0.7% 5.4% 94.6%
New Madrid County Health Dept 5 2 7 132 139 3.6% 1.4% 5.0% 95.0%
Ozark County Health Dept 13 3 16 41 57 22.8% 5.3% 28.1% 71.9%
Dunklin County Health Dept 24 12 36 328 364 6.6% 3.3% 9.9% 90.1%
Texas County Health Dept 29 9 38 119 157 18.5% 5.7% 24.2% 75.8%
Franklin County Dept of Health 61 22 83 435 518 11.8% 4.2% 16.0% 84.0%
Stoddard County Health Dept 17 10 27 192 219 7.8% 4.6% 12.3% 87.7%
Taney County Health Dept 75 40 115 318 433 17.3% 9.2% 26.6% 73.4%
Cedar County Health Dept 18 5 23 86 109 16.5% 4.6% 21.1% 78.9%
Family Care Health Center 86 71 157 498 655 13.1% 10.8% 24.0% 76.0%
Grace Hill Neighborhood Health Centers,
Inc. 162 249 411 1,625 2,036 8.0% 12.2% 20.2% 79.8%
Swope Health Services 79 63 142 635 777 10.2% 8.1% 18.3% 81.7%
Truman Medical Center WIC 512 394 906 2,684 3,590 14.3% 11.0% 25.2% 74.8%
People's Health Center 156 181 337 1,700 2,037 7.7% 8.9% 16.5% 83.5%
Samuel U Rodgers Health Center, Inc. 94 151 245 471 716 13.1% 21.1% 34.2% 65.8%
St. Lukes Hospital WIC Clinic 44 66 110 318 428 10.3% 15.4% 25.7% 74.3%
Wright County Health Dept 34 8 42 147 189 18.0% 4.2% 22.2% 77.8%
Northeast Comm Action Center 65 34 99 384 483 13.5% 7.0% 20.5% 79.5%
Howell County Hlth Dept. (SCPHSG) 81 13 94 308 402 20.1% 3.2% 23.4% 76.6%
Crescent Clinic-WIC 59 63 122 411 533 11.1% 11.8% 22.9% 77.1%
Caldwell County Health Center 3 1 4 41 45 6.7% 2.2% 8.9% 91.1%
Adair County Health Department 37 9 46 117 163 22.7% 5.5% 28.2% 71.8%
Kansas City Health Department 18 16 34 106 140 12.9% 11.4% 24.3% 75.7%
Osage County Health Department 8 1 9 35 44 18.2% 2.3% 20.5% 79.5%
5,028 2,816 7,844 29,792 37,636 13.4% 7.5% 20.8% 79.2%
Broadwater County WIC 9 3 12 31 43 20.9% 7.0% 27.9% 72.1%
Cascade County WIC Program 117 23 140 345 485 24.1% 4.7% 28.9% 71.1%
Custer (Rosebud) County WIC 35 11 46 117 163 21.5% 6.7% 28.2% 71.8%
Dawson County WIC Program 8 1 9 32 41 19.5% 2.4% 22.0% 78.0%
Deer Lodge County WIC Program 29 6 35 69 104 27.9% 5.8% 33.7% 66.3%
Flathead County WIC Program 114 42 156 246 402 28.4% 10.4% 38.8% 61.2%
Gallatin County WIC Program 111 18 129 134 263 42.2% 6.8% 49.0% 51.0%
Hill County WIC Program 13 9 22 70 92 14.1% 9.8% 23.9% 76.1%
Lake County WIC Program 27 13 40 86 126 21.4% 10.3% 31.7% 68.3%
Lewis and Clark County WIC 62 17 79 178 257 24.1% 6.6% 30.7% 69.3%
Lincoln County WIC Program 26 5 31 59 90 28.9% 5.6% 34.4% 65.6%
Missoula County WIC Program 171 47 218 288 506 33.8% 9.3% 43.1% 56.9%
Ravalli County WIC Program 52 12 64 63 127 40.9% 9.4% 50.4% 49.6%
Sanders County WIC Program 13 5 18 38 56 23.2% 8.9% 32.1% 67.9%
Sheridan County WIC Program 6 5 11 33 44 13.6% 11.4% 25.0% 75.0%
Silver Bow County WIC Program 39 14 53 149 202 19.3% 6.9% 26.2% 73.8%
Fergus County WIC 18 4 22 33 55 32.7% 7.3% 40.0% 60.0%
Teton County WIC Program 21 8 29 59 88 23.9% 9.1% 33.0% 67.0%
Valley County WIC Program 6 2 8 31 39 15.4% 5.1% 20.5% 79.5%
Riverstone County WIC Program 143 63 206 551 757 18.9% 8.3% 27.2% 72.8%
Fort Peck Tribal Health Dept 9 8 17 135 152 5.9% 5.3% 11.2% 88.8%
Northern Cheyenne Tribe (Lame Deer) 21 19 40 65 105 20.0% 18.1% 38.1% 61.9%
Blackfeet Tribe (Glacier Co.) 19 2 21 137 158 12.0% 1.3% 13.3% 86.7%
Crow Tribe 12 5 17 86 103 11.7% 4.9% 16.5% 83.5%
Confederated Salish & Kootenai Tribes
(Flathead Res) 11 8 19 65 84 13.1% 9.5% 22.6% 77.4%
Fort Belknap Community Council 9 9 18 56 74 12.2% 12.2% 24.3% 75.7%
Rocky Boy WIC 4 5 9 62 71 5.6% 7.0% 12.7% 87.3%
1,101 360 1,461 3,218 4,679 23.5% 7.7% 31.2% 68.8%
Central Nebraska Community Services 43 25 68 205 273 15.8% 9.2% 24.9% 75.1%
Douglas County Health Dept 359 782 1,141 2,751 3,892 9.2% 20.1% 29.3% 70.7%
Family Health Services/WIC 24 18 42 297 339 7.1% 5.3% 12.4% 87.6%
NE Nebraska Family Health Services 42 20 62 199 261 16.1% 7.7% 23.8% 76.2%
Northeast Nebraska Community Action
Partnership 96 93 189 626 815 11.8% 11.4% 23.2% 76.8%
Central District Health Dept. 70 97 167 348 515 13.6% 18.8% 32.4% 67.6%
Blue Valley Community Action 15 38 53 142 195 7.7% 19.5% 27.2% 72.8%
Comm. Action Partnership of MID-NE 92 106 198 598 796 11.6% 13.3% 24.9% 75.1%
Community Action Partnership of Western
Nebraska 43 22 65 256 321 13.4% 6.9% 20.2% 79.8%
Peoples Family Health Services 48 33 81 281 362 13.3% 9.1% 22.4% 77.6%
East-Central District Health Dept 24 31 55 311 366 6.6% 8.5% 15.0% 85.0%
Western Comm. Health Resources 19 15 34 101 135 14.1% 11.1% 25.2% 74.8%
Family Service WIC Program 90 85 175 426 601 15.0% 14.1% 29.1% 70.9%
Lincoln/Lancaster County Health Dept 101 125 226 611 837 12.1% 14.9% 27.0% 73.0%
1,065 1,492 2,557 7,151 9,708 11.0% 15.4% 26.3% 73.7%
OMAHA TRIBE,NE Omaha Nation WIC 0 3 3 63 66 0.0% 4.5% 4.5% 95.5%
WINNEBAGO
TRIBE,NE Winnebago 0 3 3 43 46 0.0% 6.5% 6.5% 93.5%
Turtle Mountain Band of Chiippewa 14 16 30 162 192 7.3% 8.3% 15.6% 84.4%
Fargo/Cass Public Health 132 115 247 438 685 19.3% 16.8% 36.1% 63.9%
Southwestern District Health Unit 27 8 35 72 107 25.2% 7.5% 32.7% 67.3%
Central Valley Health Unit 11 16 27 77 104 10.6% 15.4% 26.0% 74.0%
Upper MO District Health Unit 21 8 29 78 107 19.6% 7.5% 27.1% 72.9%
Walsh County WIC Program 5 8 13 56 69 7.2% 11.6% 18.8% 81.2%
City-County Health Dept 7 4 11 35 46 15.2% 8.7% 23.9% 76.1%
Richland County 11 11 22 56 78 14.1% 14.1% 28.2% 71.8%
MeritCare Union Hospital 7 4 11 31 42 16.7% 9.5% 26.2% 73.8%
Nebraska
Nebraska State Agency Mean
North Dakota
Missouri
Missouri State Agency Mean
Montana
Montana State Agency Mean
*To maintain the privacy of participants, Local Agencies with less than 30 Infant Participants are not published. 23

Partially
Breastfed
Total
Breastfed
Fully
Formula-Fed
State/Region Local Agency
Infant Data
Participation Data Statistical Data
Fully
Breastfed
Partially
Breastfed
Total
Breastfed
Connecticut
Fully
Formula-Fed Total Infants
Fully
Breastfed
Custer Bismarck WIC 85 41 126 337 463 18.4% 8.9% 27.2% 72.8%
Spirit Lake Sioux Nation 4 3 7 106 113 3.5% 2.7% 6.2% 93.8%
First District Health Unit 88 35 123 294 417 21.1% 8.4% 29.5% 70.5%
Valley Health and WIC 84 46 130 221 351 23.9% 13.1% 37.0% 63.0%
Lake Region District Health Unit 10 9 19 88 107 9.3% 8.4% 17.8% 82.2%
Rolette County 6 5 11 49 60 10.0% 8.3% 18.3% 81.7%
546 342 888 2,213 3,101 17.6% 11.0% 28.6% 71.4%
STANDING ROCK,
ND Standing Rock Sioux Tribe WIC 5 17 22 147 169 3.0% 10.1% 13.0% 87.0%
THREE AFFILIATED
TRIBES, ND Three Affiliated Tribes 1 4 5 92 97 1.0% 4.1% 5.2% 94.8%
Beadle County WIC Program 17 35 52 146 198 8.6% 17.7% 26.3% 73.7%
Buffalo County WIC Program 2 3 5 43 48 4.2% 6.3% 10.4% 89.6%
Bon Homme County WIC Program 7 4 11 22 33 21.2% 12.1% 33.3% 66.7%
Bennett County WIC Program 3 8 11 35 46 6.5% 17.4% 23.9% 76.1%
Brown County WIC Program 30 8 38 164 202 14.9% 4.0% 18.8% 81.2%
Brookings County WIC Program 28 19 47 77 124 22.6% 15.3% 37.9% 62.1%
Butte County WIC Program 15 5 20 42 62 24.2% 8.1% 32.3% 67.7%
Brule County WIC Program 6 3 9 27 36 16.7% 8.3% 25.0% 75.0%
Codington County WIC Program 26 7 33 140 173 15.0% 4.0% 19.1% 80.9%
Charles Mix County WIC Program 10 11 21 94 115 8.7% 9.6% 18.3% 81.7%
Custer County WIC Program 5 4 9 23 32 15.6% 12.5% 28.1% 71.9%
Clay County WIC Program 12 5 17 44 61 19.7% 8.2% 27.9% 72.1%
Davison County WIC Program 19 10 29 93 122 15.6% 8.2% 23.8% 76.2%
Fall River County WIC Program 7 5 12 23 35 20.0% 14.3% 34.3% 65.7%
Grant County WIC Program 4 3 7 24 31 12.9% 9.7% 22.6% 77.4%
Hamlin County WIC Program 21 1 22 21 43 48.8% 2.3% 51.2% 48.8%
Hughes County WIC Program 12 1 13 76 89 13.5% 1.1% 14.6% 85.4%
Jackson County WIC Program 3 1 4 27 31 9.7% 3.2% 12.9% 87.1%
Lake County WIC Program 9 2 11 34 45 20.0% 4.4% 24.4% 75.6%
Lincoln County WIC Program 6 3 9 26 35 17.1% 8.6% 25.7% 74.3%
Lawrence WIC Program 18 9 27 67 94 19.1% 9.6% 28.7% 71.3%
Lyman County WIC Program 3 3 6 45 51 5.9% 5.9% 11.8% 88.2%
Meade County WIC Program 16 5 21 52 73 21.9% 6.8% 28.8% 71.2%
Minnehaha County WIC Program 102 120 222 835 1,057 9.6% 11.4% 21.0% 79.0%
Moody County WIC Program 3 1 4 29 33 9.1% 3.0% 12.1% 87.9%
Pennington County WIC Program 125 81 206 593 799 15.6% 10.1% 25.8% 74.2%
Roberts County WIC Program 8 11 19 107 126 6.3% 8.7% 15.1% 84.9%
Shannon County WIC Program/IHS
Hospital Building, PO Box 1988 21 34 55 241 296 7.1% 11.5% 18.6% 81.4%
Tripp/Todd County WIC Program 6 1 7 30 37 16.2% 2.7% 18.9% 81.1%
Turner County WIC Program/Pioneer
Memorial Hospital 6 2 8 36 44 13.6% 4.5% 18.2% 81.8%
Union County WIC Program 2 3 5 31 36 5.6% 8.3% 13.9% 86.1%
Walworth County WIC Program/Mobridge
Regional Hospital 2 3 5 26 31 6.5% 9.7% 16.1% 83.9%
Yankton County WIC Program 10 7 17 89 106 9.4% 6.6% 16.0% 84.0%
619 438 1,057 3,622 4,679 13.2% 9.4% 22.6% 77.4%
CHEYENNE RIVER,
SD Cheyenne River WIC Program 9 10 19 126 145 6.2% 6.9% 13.1% 86.9%
ROSEBUD
SIOUX,SD Rosebud Sioux WIC Program 31 62 93 225 318 9.7% 19.5% 29.2% 70.8%
Wasatch City/County Health Dept 34 14 48 66 114 29.8% 12.3% 42.1% 57.9%
Bear River Health Dept 326 98 424 665 1,089 29.9% 9.0% 38.9% 61.1%
Southeastern Utah Dist. Health Dept 77 26 103 241 344 22.4% 7.6% 29.9% 70.1%
Central Utah Public Health Dept 114 31 145 315 460 24.8% 6.7% 31.5% 68.5%
Summit City/County Health Dept 33 37 70 64 134 24.6% 27.6% 52.2% 47.8%
Utah County Health Dept 1,077 357 1,434 1,394 2,828 38.1% 12.6% 50.7% 49.3%
Tri-County Health Dept 34 9 43 133 176 19.3% 5.1% 24.4% 75.6%
Weber-Morgan Dist Health Dept 295 122 417 1,094 1,511 19.5% 8.1% 27.6% 72.4%
Davis County Health Dept 314 93 407 879 1,286 24.4% 7.2% 31.6% 68.4%
Salt Lake Valley Health Dept 1,323 876 2,199 3,635 5,834 22.7% 15.0% 37.7% 62.3%
Tooele County Health Dept WIC 73 50 123 253 376 19.4% 13.3% 32.7% 67.3%
Southwest Utah Public Health Dept. 308 99 407 674 1,081 28.5% 9.2% 37.7% 62.3%
4,006 1,811 5,817 9,412 15,229 26.3% 11.9% 38.2% 61.8%
Natrona County WIC Program 67 21 88 323 411 16.3% 5.1% 21.4% 78.6%
Laramie County WIC Program 92 31 123 404 527 17.5% 5.9% 23.3% 76.7%
Sheridan County WIC Program 48 8 56 106 162 29.6% 4.9% 34.6% 65.4%
Sweetwater County WIC Program 37 14 51 145 196 18.9% 7.1% 26.0% 74.0%
Albany County WIC Program 73 13 86 84 170 42.9% 7.6% 50.6% 49.4%
Carbon County WIC Program 13 8 21 58 79 16.5% 10.1% 26.6% 73.4%
Goshen County WIC Program 29 9 38 62 100 29.0% 9.0% 38.0% 62.0%
Platte County WIC 7 1 8 31 39 17.9% 2.6% 20.5% 79.5%
Fremont County WIC Program 21 6 27 99 126 16.7% 4.8% 21.4% 78.6%
Fremont County WIC Program 9 2 11 40 51 17.6% 3.9% 21.6% 78.4%
Big Horn/Park County WIC Program 37 6 43 101 144 25.7% 4.2% 29.9% 70.1%
FE Warren WIC Program 27 5 32 49 81 33.3% 6.2% 39.5% 60.5%
Converse County WIC Program 7 1 8 46 54 13.0% 1.9% 14.8% 85.2%
Campbell County WIC Program 58 13 71 225 296 19.6% 4.4% 24.0% 76.0%
Uinta County WIC Program 31 9 40 119 159 19.5% 5.7% 25.2% 74.8%
Washakie County WIC Program 26 6 32 70 102 25.5% 5.9% 31.4% 68.6%
Weston County WIC Program 12 4 16 38 54 22.2% 7.4% 29.6% 70.4%
Teton County WIC Program 30 22 52 47 99 30.3% 22.2% 52.5% 47.5%
North Lincoln Co WIC Program 16 3 19 31 50 32.0% 6.0% 38.0% 62.0%
640 182 822 2,076 2,898 22.1% 6.3% 28.4% 71.6%
NORTHERN
ARAPAHO,WY Northern Arapahoe 8 19 27 86 113 7.1% 16.8% 23.9% 76.1%
SHOSHONE TRIBE
WY Eastern Shoshone 7 7 14 56 70 10.0% 10.0% 20.0% 80.0%
21,528 13,846 35,374 101,644 137,018 15.7% 10.1% 25.8% 74.2%
Municipality of Anchorage 262 153 415 1,017 1,432 18.3% 10.7% 29.0% 71.0%
Resource Center for Parents & Children 249 118 367 457 824 30.2% 14.3% 44.5% 55.5%
Wyoming
Wyoming State Agency Mean
Mountain Plains Region Mean
Alaska
North Dakota
North Dakota State Agency Mean
South Dakota
South Dakota State Agency Mean
Utah
Utah State Agency Mean
*To maintain the privacy of participants, Local Agencies with less than 30 Infant Participants are not published. 24

Partially
Breastfed
Total
Breastfed
Fully
Formula-Fed
State/Region Local Agency
Infant Data
Participation Data Statistical Data
Fully
Breastfed
Partially
Breastfed
Total
Breastfed
Connecticut
Fully
Formula-Fed Total Infants
Fully
Breastfed
Southeast Alaska Regional Health
Consortium 132 66 198 226 424 31.1% 15.6% 46.7% 53.3%
Yukon-Kuskokwim Health Corp. 84 203 287 258 545 15.4% 37.2% 52.7% 47.3%
Norton Sound Health Corp. 26 30 56 100 156 16.7% 19.2% 35.9% 64.1%
North Slope Borough 19 18 37 70 107 17.8% 16.8% 34.6% 65.4%
Tanana Chiefs Conference 66 57 123 142 265 24.9% 21.5% 46.4% 53.6%
Kodiak Area Native Association 34 19 53 60 113 30.1% 16.8% 46.9% 53.1%
Native Village of EYAK - Valdez 26 7 33 27 60 43.3% 11.7% 55.0% 45.0%
Alaska Family Services - Kenai 185 44 229 242 471 39.3% 9.3% 48.6% 51.4%
Maniilag Association WIC 22 23 45 130 175 12.6% 13.1% 25.7% 74.3%
Anchorage Armed Services YMCA 167 38 205 310 515 32.4% 7.4% 39.8% 60.2%
Bristol Bay Area Health Corp. 28 38 66 56 122 23.0% 31.1% 54.1% 45.9%
Alaska Family Services - Wasilla 211 30 241 314 555 38.0% 5.4% 43.4% 56.6%
Cook Inlet Tribal Council Inc. 74 29 103 154 257 28.8% 11.3% 40.1% 59.9%
1,551 869 2,420 3,532 5,952 26.1% 14.6% 40.7% 59.3%
AMERICAN SAMOA Dept. of Human & Social Services 69 639 708 408 1,116 6.2% 57.3% 63.4% 36.6%
Apache County Health Department 24 7 31 74 105 22.9% 6.7% 29.5% 70.5%
Cochise County Dept Health 125 121 246 657 903 13.8% 13.4% 27.2% 72.8%
Coconino County Health Dept 307 121 428 356 784 39.2% 15.4% 54.6% 45.4%
Gila County Health Dept 48 33 81 196 277 17.3% 11.9% 29.2% 70.8%
Graham County Dept Health 38 24 62 208 270 14.1% 8.9% 23.0% 77.0%
Greenlee County Health Dept 9 9 18 44 62 14.5% 14.5% 29.0% 71.0%
Maricopa County Dept Public Health 1,632 3,362 4,994 12,395 17,389 9.4% 19.3% 28.7% 71.3%
Mohave County WIC Program 138 149 287 847 1,134 12.2% 13.1% 25.3% 74.7%
Navajo County WIC Program 80 51 131 279 410 19.5% 12.4% 32.0% 68.0%
Pima County Health Department 406 433 839 2,253 3,092 13.1% 14.0% 27.1% 72.9%
Pinal County Health Department 241 261 502 1,426 1,928 12.5% 13.5% 26.0% 74.0%
Yavapai County Department 236 187 423 561 984 24.0% 19.0% 43.0% 57.0%
Yuma County WIC Program 205 331 536 1,597 2,133 9.6% 15.5% 25.1% 74.9%
Cocopah Tribe WIC Program 3 3 6 45 51 5.9% 5.9% 11.8% 88.2%
Marana Health Center 226 271 497 1,106 1,603 14.1% 16.9% 31.0% 69.0%
Adelante Healthcare 411 724 1,135 2,504 3,639 11.3% 19.9% 31.2% 68.8%
El Rio Health Center 79 128 207 566 773 10.2% 16.6% 26.8% 73.2%
Mariposa Community Health Center 48 76 124 421 545 8.8% 13.9% 22.8% 77.2%
St. Elizabeth's Health Center 24 41 65 91 156 15.4% 26.3% 41.7% 58.3%
Mountain Park Health Center 744 1,257 2,001 3,939 5,940 12.5% 21.2% 33.7% 66.3%
5,025 7,589 12,614 29,582 42,196 11.9% 18.0% 29.9% 70.1%
NAVAJO TRIBE, AZ Navajo Nation WIC Program 449 538 987 1,447 2,434 18.4% 22.1% 40.6% 59.4%
Gila River Indian Community 31 19 50 246 296 10.5% 6.4% 16.9% 83.1%
Tohono O'Odham Nation 25 21 46 187 233 10.7% 9.0% 19.7% 80.3%
Salt River Pima-Maricopa Indian
Community 16 10 26 125 151 10.6% 6.6% 17.2% 82.8%
San Carlos Apache Tribe 16 1 17 247 264 6.1% 0.4% 6.4% 93.6%
White Mountain Apache Tribe 33 26 59 192 251 13.1% 10.4% 23.5% 76.5%
Hopi Tribe 24 18 42 50 92 26.1% 19.6% 45.7% 54.3%
Hualapai Tribe 4 3 7 32 39 10.3% 7.7% 17.9% 82.1%
Pascua Yaqui Tribe 22 14 36 181 217 10.1% 6.5% 16.6% 83.4%
Native Health 150 62 212 503 715 21.0% 8.7% 29.7% 70.3%
Colorado River Indian Tribes 16 8 24 134 158 10.1% 5.1% 15.2% 84.8%
341 185 526 1,916 2,442 14.0% 7.6% 21.5% 78.5%
Alliance Medical Center 126 40 166 95 261 48.3% 15.3% 63.6% 36.4%
Alameda County Health Care Services
Agency 1,376 749 2,125 2,354 4,479 30.7% 16.7% 47.4% 52.6%
Community Medical Centers, Inc. 454 305 759 732 1,491 30.4% 20.5% 50.9% 49.1%
American Red Cross 1,701 1,489 3,190 4,104 7,294 23.3% 20.4% 43.7% 56.3%
Antelope Valley Healthcare District 660 378 1,038 2,783 3,821 17.3% 9.9% 27.2% 72.8%
Butte County DPH 391 141 532 851 1,383 28.3% 10.2% 38.5% 61.5%
City of Berkeley 91 42 133 110 243 37.4% 17.3% 54.7% 45.3%
E-Center 162 78 240 279 519 31.2% 15.0% 46.2% 53.8%
Madera County DPH 474 264 738 1,016 1,754 27.0% 15.1% 42.1% 57.9%
Clinicas De Salud Del Pueblo 258 238 496 1,356 1,852 13.9% 12.9% 26.8% 73.2%
Clinica Sierra Vista, INC. 995 1,237 2,232 5,995 8,227 12.1% 15.0% 27.1% 72.9%
Contra Costa County Hlth Service 1,039 1,077 2,116 2,619 4,735 21.9% 22.7% 44.7% 55.3%
Delta Hlth Care & Mgt. Serv Corp 646 329 975 1,895 2,870 22.5% 11.5% 34.0% 66.0%
El Dorado Co Dept. Comm Srvs 183 98 281 321 602 30.4% 16.3% 46.7% 53.3%
Gardner Family Care Corp. 488 535 1,023 1,400 2,423 20.1% 22.1% 42.2% 57.8%
Community Bridges 593 464 1,057 785 1,842 32.2% 25.2% 57.4% 42.6%
Fresno County EOC 705 809 1,514 5,545 7,059 10.0% 11.5% 21.4% 78.6%
Northeast Valley Hlth Corp. 2,754 2,928 5,682 7,339 13,021 21.2% 22.5% 43.6% 56.4%
Axis Community Health 114 93 207 238 445 25.6% 20.9% 46.5% 53.5%
County of Humboldt 272 147 419 472 891 30.5% 16.5% 47.0% 53.0%
Indian Hlth Ctr. Santa Clara 202 123 325 341 666 30.3% 18.5% 48.8% 51.2%
County of Inyo DHHS 21 11 32 49 81 25.9% 13.6% 39.5% 60.5%
Comm. Action Partnership of Kern 575 498 1,073 2,753 3,826 15.0% 13.0% 28.0% 72.0%
Kings County Dept. of Public Health 277 196 473 1,218 1,691 16.4% 11.6% 28.0% 72.0%
La Clinica De La Raza, Inc. 258 243 501 450 951 27.1% 25.6% 52.7% 47.3%
City of Long Beach DHHS 809 889 1,698 3,456 5,154 15.7% 17.2% 32.9% 67.1%
Marin County HHS, Montecito 308 128 436 178 614 50.2% 20.8% 71.0% 29.0%
County of Mendocino 245 101 346 327 673 36.4% 15.0% 51.4% 48.6%
Merced County Community Action Board 624 575 1,199 2,323 3,522 17.7% 16.3% 34.0% 66.0%
Scripps Mercy Hospital 514 331 845 775 1,620 31.7% 20.4% 52.2% 47.8%
Monterey County 1,112 872 1,984 2,205 4,189 26.5% 20.8% 47.4% 52.6%
The Resource Connection of Amador and
Calaveras Counties 106 21 127 172 299 35.5% 7.0% 42.5% 57.5%
Napa County Hlth & Human Srvcs 256 141 397 345 742 34.5% 19.0% 53.5% 46.5%
Nevada County DPH 165 38 203 128 331 49.8% 11.5% 61.3% 38.7%
North County Health Services 925 357 1,282 1,007 2,289 40.4% 15.6% 56.0% 44.0%
Northeastern Rural Health Clinics, Inc. 48 15 63 145 208 23.1% 7.2% 30.3% 69.7%
County of Orange Health Care Agency 985 1,110 2,095 3,369 5,464 18.0% 20.3% 38.3% 61.7%
Pasadena Public Health Dept. 259 184 443 553 996 26.0% 18.5% 44.5% 55.5%
Placer County Dept of HHS 309 140 449 526 975 31.7% 14.4% 46.1% 53.9%
Plumas Rural Services, Inc. 32 11 43 42 85 37.6% 12.9% 50.6% 49.4%
Public Health Foundation Enterprises, Inc. 10,473 11,460 21,933 34,762 56,695 18.5% 20.2% 38.7% 61.3%
Arizona State Agency Mean
INTER TRIBAL
COUNCIL,AZ
INTER TRIBAL COUNCIL,AZ Mean
California
Alaska
Alaska State Agency Mean
Arizona
*To maintain the privacy of participants, Local Agencies with less than 30 Infant Participants are not published. 25

Partially
Breastfed
Total
Breastfed
Fully
Formula-Fed
State/Region Local Agency
Infant Data
Participation Data Statistical Data
Fully
Breastfed
Partially
Breastfed
Total
Breastfed
Connecticut
Fully
Formula-Fed Total Infants
Fully
Breastfed
County of Riverside Hlth Srvcs 5,255 1,420 6,675 11,848 18,523 28.4% 7.7% 36.0% 64.0%
Riverside-San Bernadino Indian Hlth 46 13 59 140 199 23.1% 6.5% 29.6% 70.4%
Sacramento County Dept. of HHS 1,708 726 2,434 4,009 6,443 26.5% 11.3% 37.8% 62.2%
San Benito Health Foundation 89 105 194 252 446 20.0% 23.5% 43.5% 56.5%
San Bernardino County DPH 2,610 1,735 4,345 12,764 17,109 15.3% 10.1% 25.4% 74.6%
San Diego State University Research
Foundation 1,675 1,930 3,605 3,799 7,404 22.6% 26.1% 48.7% 51.3%
City & County of San Francisco DPH 593 1,317 1,910 1,033 2,943 20.1% 44.8% 64.9% 35.1%
San Joaquin Public Hlth Srvcs 351 322 673 1,751 2,424 14.5% 13.3% 27.8% 72.2%
County of San Luis Obispo 362 150 512 468 980 36.9% 15.3% 52.2% 47.8%
San Mateo County Health System 672 682 1,354 1,434 2,788 24.1% 24.5% 48.6% 51.4%
San Ysidro Health Center 768 1,736 2,504 690 3,194 24.0% 54.4% 78.4% 21.6%
Santa Barbara Co. PHD 1,172 600 1,772 1,765 3,537 33.1% 17.0% 50.1% 49.9%
Santa Clara County 1,221 838 2,059 2,505 4,564 26.8% 18.4% 45.1% 54.9%
County of Shasta, HHSA, PHD 399 126 525 766 1,291 30.9% 9.8% 40.7% 59.3%
County of Siskiyou Public Health and
Community Dev Dept 88 30 118 151 269 32.7% 11.2% 43.9% 56.1%
Solano County Health & Social Services
Dept. 499 346 845 1,486 2,331 21.4% 14.8% 36.3% 63.7%
Sonoma County Indian Health Project, Inc. 51 17 68 78 146 34.9% 11.6% 46.6% 53.4%
County of Sonoma DHS 707 363 1,070 787 1,857 38.1% 19.5% 57.6% 42.4%
Stanislaus County Hlth Srvcs Agy 891 479 1,370 3,271 4,641 19.2% 10.3% 29.5% 70.5%
Sutter Co Human Srvcs Dept. 191 87 278 501 779 24.5% 11.2% 35.7% 64.3%
Tiburcio Vasquez Health Center 344 237 581 637 1,218 28.2% 19.5% 47.7% 52.3%
Tuolumne County Health Dept. 107 17 124 126 250 42.8% 6.8% 49.6% 50.4%
United Health Centers of San Joaquin
Valley 651 629 1,280 3,087 4,367 14.9% 14.4% 29.3% 70.7%
United Indian Health Services, Inc. 92 25 117 96 213 43.2% 11.7% 54.9% 45.1%
Native American Health Center, Inc. 183 111 294 209 503 36.4% 22.1% 58.4% 41.6%
Ventura County Health Care Agency 878 993 1,871 3,246 5,117 17.2% 19.4% 36.6% 63.4%
Watts Healthcare Corporation 442 583 1,025 2,813 3,838 11.5% 15.2% 26.7% 73.3%
West Oakland Health Council, Inc. 41 46 87 151 238 17.2% 19.3% 36.6% 63.4%
Yolo County DPH 302 187 489 615 1,104 27.4% 16.9% 44.3% 55.7%
Community Resource Project, Inc. 1,237 612 1,849 2,708 4,557 27.1% 13.4% 40.6% 59.4%
Trinity Co. Health & Human Srvcs 29 4 33 28 61 47.5% 6.6% 54.1% 45.9%
LA Biomed Research Inst @ Harbor UCLA
Med Ctr 2,438 2,994 5,432 11,219 16,651 14.6% 18.0% 32.6% 67.4%
Ampla Health (Del Norte Clinics) 241 94 335 659 994 24.2% 9.5% 33.7% 66.3%
Planned Parenthood of Orange & San
Bernardino Counties 487 595 1,082 2,194 3,276 14.9% 18.2% 33.0% 67.0%
Camino Health Center 322 356 678 731 1,409 22.9% 25.3% 48.1% 51.9%
Central Valley Indian Health, Inc. 100 59 159 294 453 22.1% 13.0% 35.1% 64.9%
Toiyabe Indian Health Project, Inc. 28 2 30 27 57 49.1% 3.5% 52.6% 47.4%
County of Tulare Health and Human
Services Agency 950 648 1,598 4,230 5,828 16.3% 11.1% 27.4% 72.6%
Glenn County Health Services 88 31 119 146 265 33.2% 11.7% 44.9% 55.1%
Tehama County Health Services 146 54 200 335 535 27.3% 10.1% 37.4% 62.6%
Mono County Health Department 20 17 37 29 66 30.3% 25.8% 56.1% 43.9%
Inland Behavioral and Health Services, Inc. 61 39 100 304 404 15.1% 9.7% 24.8% 75.2%
60,523 50,241 110,764 178,801 289,565 20.9% 17.4% 38.3% 61.7%
GUAM DEPT OF
ADMINISTRATION Guam WIC Program 301 282 583 1,280 1,863 16.2% 15.1% 31.3% 68.7%
Community Clinic of Maui 85 51 136 340 476 17.9% 10.7% 28.6% 71.4%
Kalihi Palama Health Center 97 133 230 596 826 11.7% 16.1% 27.8% 72.2%
Kokua Kalihi Valley Health Center 51 41 92 269 361 14.1% 11.4% 25.5% 74.5%
Waianae Coast Comp Health Center 176 80 256 802 1,058 16.6% 7.6% 24.2% 75.8%
Waimanalo 38 26 64 129 193 19.7% 13.5% 33.2% 66.8%
Hawaii WIC Program 175 88 263 574 837 20.9% 10.5% 31.4% 68.6%
Windward WIC Program 175 99 274 402 676 25.9% 14.6% 40.5% 59.5%
Kauai WIC Program 89 29 118 260 378 23.5% 7.7% 31.2% 68.8%
Maui WIC Program 98 43 141 228 369 26.6% 11.7% 38.2% 61.8%
Leeward WIC Program 140 123 263 648 911 15.4% 13.5% 28.9% 71.1%
Kapiolani Health Center WIC 126 52 178 266 444 28.4% 11.7% 40.1% 59.9%
Wahiawa WIC Program 189 72 261 624 885 21.4% 8.1% 29.5% 70.5%
Honolulu WIC Program 126 48 174 224 398 31.7% 12.1% 43.7% 56.3%
Bay Clinic 105 29 134 202 336 31.3% 8.6% 39.9% 60.1%
Kona WIC Program 102 35 137 207 344 29.7% 10.2% 39.8% 60.2%
Maui Family Support Services 9 3 12 27 39 23.1% 7.7% 30.8% 69.2%
Molokai Community Health Center 25 33 58 80 138 18.1% 23.9% 42.0% 58.0%
1,793 968 2,761 5,830 8,591 20.9% 11.3% 32.1% 67.9%
Panhandle Health District 351 78 429 598 1,027 34.2% 7.6% 41.8% 58.2%
North Central District 166 29 195 258 453 36.6% 6.4% 43.0% 57.0%
Southwest District Health 532 160 692 1,268 1,960 27.1% 8.2% 35.3% 64.7%
Central District Health Department 472 150 622 1,038 1,660 28.4% 9.0% 37.5% 62.5%
South Central Public Health District 411 139 550 979 1,529 26.9% 9.1% 36.0% 64.0%
Southeastern Idaho Public Health 437 93 530 781 1,311 33.3% 7.1% 40.4% 59.6%
Eastern Idaho Public Health District 704 154 858 1,040 1,898 37.1% 8.1% 45.2% 54.8%
Nimiipu Health 14 5 19 33 52 26.9% 9.6% 36.5% 63.5%
Benewah Medical Center 10 1 11 25 36 27.8% 2.8% 30.6% 69.4%
3,098 808 3,906 6,020 9,926 31.2% 8.1% 39.4% 60.6%
Washoe County District 199 132 331 1,018 1,349 14.8% 9.8% 24.5% 75.5%
Sunrise Foundation 181 577 758 2,115 2,873 6.3% 20.1% 26.4% 73.6%
Battle Mountain Family Resource 3 2 5 27 32 9.4% 6.3% 15.6% 84.4%
Family Rosource Centers of NE Nevada 14 11 25 154 179 7.8% 6.1% 14.0% 86.0%
Little Peoples Head Start 10 7 17 35 52 19.2% 13.5% 32.7% 67.3%
Lyon County Human Services 49 20 69 182 251 19.5% 8.0% 27.5% 72.5%
Carson City - Ron Wood WIC 42 27 69 166 235 17.9% 11.5% 29.4% 70.6%
Saint Mary's Foundation 139 131 270 637 907 15.3% 14.4% 29.8% 70.2%
NV Health Centers 598 1,727 2,325 5,154 7,479 8.0% 23.1% 31.1% 68.9%
Catholic Charities 139 79 218 1,106 1,324 10.5% 6.0% 16.5% 83.5%
Carson City Health & Human Services 55 32 87 172 259 21.2% 12.4% 33.6% 66.4%
Pershing County 49 39 88 251 339 14.5% 11.5% 26.0% 74.0%
Hawaii State Agency Mean
Idaho
Idaho State Agency Mean
Nevada
California
California State Agency Mean
Hawaii
*To maintain the privacy of participants, Local Agencies with less than 30 Infant Participants are not published. 26

Partially
Breastfed
Total
Breastfed
Fully
Formula-Fed
State/Region Local Agency
Infant Data
Participation Data Statistical Data
Fully
Breastfed
Partially
Breastfed
Total
Breastfed
Connecticut
Fully
Formula-Fed Total Infants
Fully
Breastfed
Urban League 72 146 218 1,009 1,227 5.9% 11.9% 17.8% 82.2%
Saint Rose Dominican Hospitals 148 113 261 604 865 17.1% 13.1% 30.2% 69.8%
Nye County WIC 27 23 50 194 244 11.1% 9.4% 20.5% 79.5%
1,730 3,067 4,797 12,856 17,653 9.8% 17.4% 27.2% 72.8%
INTER-TRIBAL, NV Inter-Tribal, NV 42 30 72 214 286 14.7% 10.5% 25.2% 74.8%
Baker County Health Department 34 5 39 67 106 32.1% 4.7% 36.8% 63.2%
Benton County Health Department 142 29 171 167 338 42.0% 8.6% 50.6% 49.4%
Clatsop County Health and Human
Services 40 15 55 53 108 37.0% 13.9% 50.9% 49.1%
The Public Health Foundation of Columbia
County 363 123 486 850 1,336 27.2% 9.2% 36.4% 63.6%
Coos County Health Department 78 26 104 177 281 27.8% 9.3% 37.0% 63.0%
Crook County Health Department 75 16 91 194 285 26.3% 5.6% 31.9% 68.1%
Curry County Health Department 45 8 53 84 137 32.8% 5.8% 38.7% 61.3%
Deschutes County Health Department 333 63 396 516 912 36.5% 6.9% 43.4% 56.6%
Douglas County Health Department 202 37 239 524 763 26.5% 4.8% 31.3% 68.7%
Grant County Health Department 10 2 12 26 38 26.3% 5.3% 31.6% 68.4%
Harney County Health Department 8 5 13 24 37 21.6% 13.5% 35.1% 64.9%
Hood River County Health 72 44 116 86 202 35.6% 21.8% 57.4% 42.6%
Jackson County Health Department 459 114 573 833 1,406 32.6% 8.1% 40.8% 59.2%
Jefferson County Health Department 36 17 53 98 151 23.8% 11.3% 35.1% 64.9%
Josephine County Health Department 207 33 240 359 599 34.6% 5.5% 40.1% 59.9%
Klamath County Health Department 122 30 152 433 585 20.9% 5.1% 26.0% 74.0%
Lake County Health Department 8 3 11 36 47 17.0% 6.4% 23.4% 76.6%
Lane County WIC Program 754 138 892 954 1,846 40.8% 7.5% 48.3% 51.7%
Lincoln County Health and Human Services 92 37 129 180 309 29.8% 12.0% 41.7% 58.3%
Linn County Health Department 236 52 288 581 869 27.2% 6.0% 33.1% 66.9%
Malheur County Health Department 37 37 74 235 309 12.0% 12.0% 23.9% 76.1%
Marion County Health Department 482 150 632 1,301 1,933 24.9% 7.8% 32.7% 67.3%
Multnomah County Health Department 1,261 439 1,700 2,572 4,272 29.5% 10.3% 39.8% 60.2%
Polk County Health Department 75 21 96 207 303 24.8% 6.9% 31.7% 68.3%
Tillamook County Health Department 33 18 51 95 146 22.6% 12.3% 34.9% 65.1%
Center for Human Development Inc. 47 9 56 135 191 24.6% 4.7% 29.3% 70.7%
North Central Public Health District 54 19 73 141 214 25.2% 8.9% 34.1% 65.9%
Washington County HHS 807 369 1,176 1,392 2,568 31.4% 14.4% 45.8% 54.2%
Salud Medical Center-Yakima Valley 459 232 691 1,165 1,856 24.7% 12.5% 37.2% 62.8%
Confederate Tribes of Warm Springs 110 27 137 256 393 28.0% 6.9% 34.9% 65.1%
Confederate Tribes of Umatilla 26 7 33 78 111 23.4% 6.3% 29.7% 70.3%
Umatilla Morrow Headstart 141 72 213 683 896 15.7% 8.0% 23.8% 76.2%
6,859 2,201 9,060 14,535 23,595 29.1% 9.3% 38.4% 61.6%
Asotin County Health District 34 8 42 86 128 26.6% 6.3% 32.8% 67.2%
Whatcom County Health Department 157 39 196 236 432 36.3% 9.0% 45.4% 54.6%
Benton-Franklin Health District 274 164 438 1,060 1,498 18.3% 10.9% 29.2% 70.8%
Chelan-Douglas Health District 29 12 41 140 181 16.0% 6.6% 22.7% 77.3%
Clallam County HHS 103 30 133 146 279 36.9% 10.8% 47.7% 52.3%
Colville Confederated Tribes 25 6 31 75 106 23.6% 5.7% 29.2% 70.8%
Cowlitz Family Health Center 168 42 210 576 786 21.4% 5.3% 26.7% 73.3%
Grays Harbor County Public H & SS 79 35 114 233 347 22.8% 10.1% 32.9% 67.1%
Jefferson County Public Health 40 5 45 35 80 50.0% 6.3% 56.3% 43.8%
Kitsap Community Resources 310 102 412 760 1,172 26.5% 8.7% 35.2% 64.8%
Community Health of Central Washington 53 20 73 95 168 31.5% 11.9% 43.5% 56.5%
Lewis County Public Health and Social
Services 103 45 148 396 544 18.9% 8.3% 27.2% 72.8%
Lummi Nation 12 6 18 39 57 21.1% 10.5% 31.6% 68.4%
Multicare Health System 706 269 975 2,135 3,110 22.7% 8.6% 31.4% 68.6%
CAC of Lewis/Mason/Thurston Counties 153 72 225 375 600 25.5% 12.0% 37.5% 62.5%
Nooksack Indian Tribe 14 1 15 28 43 32.6% 2.3% 34.9% 65.1%
NE Tri-County Health District 74 9 83 154 237 31.2% 3.8% 35.0% 65.0%
Columbia Valley Comm Health 151 110 261 392 653 23.1% 16.8% 40.0% 60.0%
Pacific County Public Health & Human
Services 25 9 34 70 104 24.0% 8.7% 32.7% 67.3%
Pregnancy Aid Outreach Program 392 163 555 753 1,308 30.0% 12.5% 42.4% 57.6%
Puyallup Tribal Health Authority 23 7 30 73 103 22.3% 6.8% 29.1% 70.9%
San Juan County Health Department 23 4 27 11 38 60.5% 10.5% 71.1% 28.9%
Public Health Seattle & King County 1,915 1,407 3,322 4,082 7,404 25.9% 19.0% 44.9% 55.1%
Seattle Indian Health Board 26 17 43 45 88 29.5% 19.3% 48.9% 51.1%
Skagit County Community 251 106 357 370 727 34.5% 14.6% 49.1% 50.9%
Skagit County Public Health Dept 29 13 42 44 86 33.7% 15.1% 48.8% 51.2%
Spokane Regional Health District 643 218 861 1,568 2,429 26.5% 9.0% 35.4% 64.6%
Walla Walla County Health Department 46 26 72 122 194 23.7% 13.4% 37.1% 62.9%
Tri-Cities Community Health 121 125 246 498 744 16.3% 16.8% 33.1% 66.9%
West Central Community Center 150 57 207 387 594 25.3% 9.6% 34.8% 65.2%
Whitman County Health Department 69 19 88 65 153 45.1% 12.4% 57.5% 42.5%
Yakama Nation 24 9 33 112 145 16.6% 6.2% 22.8% 77.2%
Yakima Neighborhood Health Services 140 170 310 670 980 14.3% 17.3% 31.6% 68.4%
Yakima Valley Farmworkers Clinic 409 396 805 1,523 2,328 17.6% 17.0% 34.6% 65.4%
Klickitat County Health Department 43 11 54 70 124 34.7% 8.9% 43.5% 56.5%
Lincoln County Public Health Department 13 2 15 17 32 40.6% 6.3% 46.9% 53.1%
Adams County Health Department 9 4 13 46 59 15.3% 6.8% 22.0% 78.0%
United General Hospital 67 22 89 147 236 28.4% 9.3% 37.7% 62.3%
Moses Lake Community Health Center 160 132 292 516 808 19.8% 16.3% 36.1% 63.9%
South Puget Intertribal Planning Agency 10 2 12 37 49 20.4% 4.1% 24.5% 75.5%
Franciscan Medical Group 345 164 509 1,064 1,573 21.9% 10.4% 32.4% 67.6%
Columbia Basin Health Association 87 170 257 296 553 15.7% 30.7% 46.5% 53.5%
Tulalip Health Clinic 4 1 5 39 44 9.1% 2.3% 11.4% 88.6%
Family Health Centers 117 49 166 181 347 33.7% 14.1% 47.8% 52.2%
Island County Public Health 58 15 73 110 183 31.7% 8.2% 39.9% 60.1%
Harrison Medical Center 12 3 15 53 68 17.6% 4.4% 22.1% 77.9%
Sea Mar 1,354 506 1,860 2,454 4,314 31.4% 11.7% 43.1% 56.9%
Mattawa Community Medical Clinic 9 22 31 23 54 16.7% 40.7% 57.4% 42.6%
Skamania County Health Dept 13 2 15 20 35 37.1% 5.7% 42.9% 57.1%
Snohomish Health District 432 272 704 922 1,626 26.6% 16.7% 43.3% 56.7%
Nevada
Nevada State Agency Mean
Oregon
Oregon State Agency Mean
Washington
*To maintain the privacy of participants, Local Agencies with less than 30 Infant Participants are not published. 27
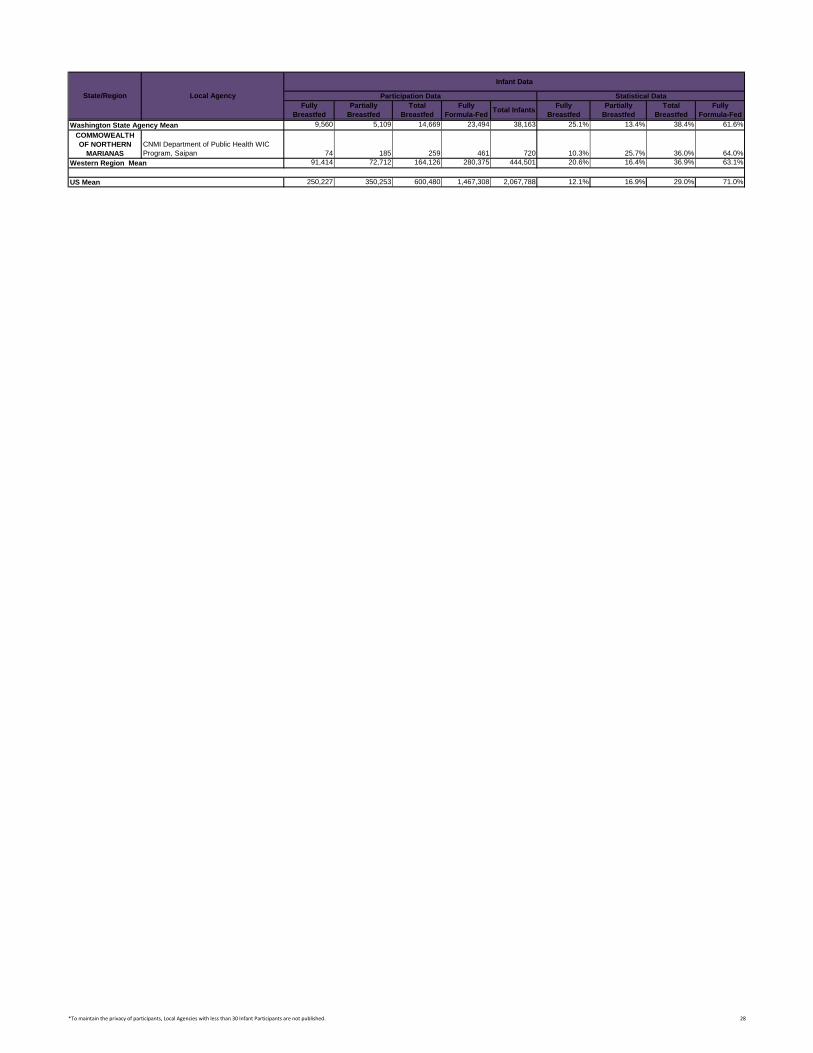
Partially
Breastfed
Total
Breastfed
Fully
Formula-Fed
State/Region Local Agency
Infant Data
Participation Data Statistical Data
Fully
Breastfed
Partially
Breastfed
Total
Breastfed
Connecticut
Fully
Formula-Fed Total Infants
Fully
Breastfed
9,560 5,109 14,669 23,494 38,163 25.1% 13.4% 38.4% 61.6%
COMMOWEALTH
OF NORTHERN
MARIANAS
CNMI Department of Public Health WIC
Program, Saipan 74 185 259 461 720 10.3% 25.7% 36.0% 64.0%
91,414 72,712 164,126 280,375 444,501 20.6% 16.4% 36.9% 63.1%
250,227 350,253 600,480 1,467,308 2,067,788 12.1% 16.9% 29.0% 71.0%US Mean
Washington State Agency Mean
Western Region Mean
*To maintain the privacy of participants, Local Agencies with less than 30 Infant Participants are not published. 28

Abilene-Taylor County Public
Health Dist. 150 116 266 891 1,157 13.0% 10.0% 23.0% 77.0%
Acadia Parish Health
Unit/CROWLEY 11 7 18 229 247 4.5% 2.8% 7.3% 92.7%
Acadia Parish Police Jury 8 12 20 243 263 3.0% 4.6% 7.6% 92.4%
Access/Windham WIC Program 65 72 137 441 578 11.2% 12.5% 23.7% 76.3%
ACL HOSPITAL BOARD, NM 30 20 50 50 100 30.0% 20.0% 50.0% 50.0%
Adagio Health 450 55 505 2,073 2,578 17.5% 2.1% 19.6% 80.4%
Adair County Health Department 37 9 46 117 163 22.7% 5.5% 28.2% 71.8%
Adams County Health
Department 9 4 13 46 59 15.3% 6.8% 22.0% 78.0%
Adams County Health Dept 48 22 70 351 421 11.4% 5.2% 16.6% 83.4%
Adams/Brown County WIC
Program 41 7 48 494 542 7.6% 1.3% 8.9% 91.1%
Adelante Healthcare 411 724 1,135 2,504 3,639 11.3% 19.9% 31.2% 68.8%
Aitkin County Public Health 13 4 17 44 61 21.3% 6.6% 27.9% 72.1%
Alamance County Health
Department 106 138 244 752 996 10.6% 13.9% 24.5% 75.5%
Alameda County Health Care
Services Agency 1,376 749 2,125 2,354 4,479 30.7% 16.7% 47.4% 52.6%
Alaska Family Services - Kenai 185 44 229 242 471 39.3% 9.3% 48.6% 51.4%
Alaska Family Services - Wasilla 211 30 241 314 555 38.0% 5.4% 43.4% 56.6%
Albany County WIC Program 73 13 86 84 170 42.9% 7.6% 50.6% 49.4%
Albemarle Regional Health
Services 51 49 100 567 667 7.6% 7.3% 15.0% 85.0%
Alexander County Health
Department 20 27 47 167 214 9.3% 12.6% 22.0% 78.0%
Alexandria District 64 254 318 433 751 8.5% 33.8% 42.3% 57.7%
Allegany County Department of
Health 32 11 43 185 228 14.0% 4.8% 18.9% 81.1%
Allegany County WIC Program 61 21 82 379 461 13.2% 4.6% 17.8% 82.2%
Alleghany District 61 25 86 470 556 11.0% 4.5% 15.5% 84.5%
Allegheny County Health
Department 580 132 712 3,723 4,435 13.1% 3.0% 16.1% 83.9%
Allen County Health Department 27 11 38 142 180 15.0% 6.1% 21.1% 78.9%
Allen County WIC Program 94 15 109 721 830 11.3% 1.8% 13.1% 86.9%
Allen Parish Health
Unit/OAKDALE 7 5 12 190 202 3.5% 2.5% 5.9% 94.1%
Alliance Medical Center 126 40 166 95 261 48.3% 15.3% 63.6% 36.4%
Amarillo (City of) 222 361 583 1,515 2,098 10.6% 17.2% 27.8% 72.2%
American Home Finding 54 68 122 488 610 8.9% 11.1% 20.0% 80.0%
American Red Cross 1,701 1,489 3,190 4,104 7,294 23.3% 20.4% 43.7% 56.3%
Ampla Health (Del Norte Clinics) 241 94 335 659 994 24.2% 9.5% 33.7% 66.3%
Anchorage Armed Services
YMCA 167 38 205 310 515 32.4% 7.4% 39.8% 60.2%
Anderson County Health
Department 15 19 34 109 143 10.5% 13.3% 23.8% 76.2%
Andrew County Health Dept. 15 4 19 68 87 17.2% 4.6% 21.8% 78.2%
Angelina County & Cities Health
District 77 132 209 686 895 8.6% 14.7% 23.4% 76.6%
Anne Arundel County WIC
Program 350 339 689 1,625 2,314 15.1% 14.6% 29.8% 70.2%
Anoka County Community
Health & Environmental
Services 174 194 368 921 1,289 13.5% 15.1% 28.5% 71.5%
Anson County Health Dept 3 19 22 192 214 1.4% 8.9% 10.3% 89.7%
Antelope Valley Healthcare
District 660 378 1,038 2,783 3,821 17.3% 9.9% 27.2% 72.8%
Anthony L. Jordan Health
Center 55 158 213 890 1,103 5.0% 14.3% 19.3% 80.7%
Apache County Health
Department 24 7 31 74 105 22.9% 6.7% 29.5% 70.5%
Appalachian District Health
Department 89 32 121 242 363 24.5% 8.8% 33.3% 66.7%
AR Department of Health/WIC 1,869 919 2,788 21,713 24,501 7.6% 3.8% 11.4% 88.6%
Arc Rehab Service, Inc. 23 7 30 148 178 12.9% 3.9% 16.9% 83.1%
Area V Agency on Aging &
Comm. Serv. 31 17 48 351 399 7.8% 4.3% 12.0% 88.0%
Arlington District 48 351 399 259 658 7.3% 53.3% 60.6% 39.4%
Aroostook County Action
Program 52 10 62 344 406 12.8% 2.5% 15.3% 84.7%
Arunavanthi T. Sangisetty, APM 22 33 55 557 612 3.6% 5.4% 9.0% 91.0%
Ascension Parish Health
Unit/DONALDSONVILLE 2 4 6 149 155 1.3% 2.6% 3.9% 96.1%
Ashland/Richland County WIC
Program 107 23 130 912 1,042 10.3% 2.2% 12.5% 87.5%
Ashland-Boyd County Health
Dept. 27 55 82 329 411 6.6% 13.4% 20.0% 80.0%
Ashtabula County WIC Program 92 19 111 611 722 12.7% 2.6% 15.4% 84.6%
Asotin County Health District 34 8 42 86 128 26.6% 6.3% 32.8% 67.2%
Assumption Parish Heatlh
Unit/NAPOLEONVILLE 2 4 6 121 127 1.6% 3.1% 4.7% 95.3%
Atascosa Health Center, Inc. 31 63 94 230 324 9.6% 19.4% 29.0% 71.0%
Athens/Perry County WIC
Program 84 11 95 491 586 14.3% 1.9% 16.2% 83.8%
Atlantic City WIC Program 106 296 402 1,150 1,552 6.8% 19.1% 25.9% 74.1%
Audrain City County Health Unit 22 10 32 143 175 12.6% 5.7% 18.3% 81.7%
Auglaize County WIC Program 20 6 26 201 227 8.8% 2.6% 11.5% 88.5%
Aunt Martha's Youth Service
Center 13 46 59 112 171 7.6% 26.9% 34.5% 65.5%
Aurora Health Care 31 49 80 630 710 4.4% 6.9% 11.3% 88.7%
Austin/Travis County Health &
Human Services Dept 1,394 3,225 4,619 3,000 7,619 18.3% 42.3% 60.6% 39.4%
Avoyelles Parish Health
Unit/MARKSVILLE 7 14 21 442 463 1.5% 3.0% 4.5% 95.5%
Axis Community Health 114 93 207 238 445 25.6% 20.9% 46.5% 53.5%
Fully Breastfed Partially Breastfed Total Breastfed Fully Formula-Fed
Alphabetical Listing of Breastfeeding Data by Local Agency
Local Agency
Infant Data
Participation Data Statistical Data
Fully Breastfed Partially Breastfed Total Breastfed Fully Formula-Fed Total Infants
FY 2012
*To maintain the privacy of participants, Local Agencies with less than 30 Infant Participants are not published. 29

Fully Breastfed Partially Breastfed Total Breastfed Fully Formula-Fed
Local Agency
Infant Data
Participation Data Statistical Data
Fully Breastfed Partially Breastfed Total Breastfed Fully Formula-Fed Total Infants
Baker County Health
Department 34 5 39 67 106 32.1% 4.7% 36.8% 63.2%
Baltimore City WIC Program 256 551 807 3,698 4,505 5.7% 12.2% 17.9% 82.1%
Baltimore County WIC Program 400 765 1,165 2,994 4,159 9.6% 18.4% 28.0% 72.0%
Barren River District 220 224 444 1,583 2,027 10.9% 11.1% 21.9% 78.1%
Barrio Comprehensive Family
Health Care Center 47 187 234 538 772 6.1% 24.2% 30.3% 69.7%
Barron County Public Health 37 20 57 198 255 14.5% 7.8% 22.4% 77.6%
Barry Co Health Dept 48 23 71 295 366 13.1% 6.3% 19.4% 80.6%
Barry-Eaton District Health
Department 133 50 183 572 755 17.6% 6.6% 24.2% 75.8%
Bartholomew County Health
Dept 44 36 80 405 485 9.1% 7.4% 16.5% 83.5%
Barton County Health Dept 13 2 15 69 84 15.5% 2.4% 17.9% 82.1%
Barton County Health Dept 47 19 66 270 336 14.0% 5.7% 19.6% 80.4%
Bates County Health Center 14 4 18 94 112 12.5% 3.6% 16.1% 83.9%
Battle Mountain Family
Resource 3 2 5 27 32 9.4% 6.3% 15.6% 84.4%
Bay Area WIC 46 10 56 117 173 26.6% 5.8% 32.4% 67.6%
Bay Clinic 105 29 134 202 336 31.3% 8.6% 39.9% 60.1%
Bay County Health Department 229 195 424 1,382 1,806 12.7% 10.8% 23.5% 76.5%
Bay County Health Dept 80 39 119 541 660 12.1% 5.9% 18.0% 82.0%
Bayou Comprehensive Health
Foundation 11 10 21 239 260 4.2% 3.8% 8.1% 91.9%
Beadle County WIC Program 17 35 52 146 198 8.6% 17.7% 26.3% 73.7%
Bear River Health Dept 326 98 424 665 1,089 29.9% 9.0% 38.9% 61.1%
Beaufort County Health
Department 25 48 73 289 362 6.9% 13.3% 20.2% 79.8%
Beaufort-Jasper Comp Center 67 89 156 431 587 11.4% 15.2% 26.6% 73.4%
Beaumont Public Health
Department 78 416 494 844 1,338 5.8% 31.1% 36.9% 63.1%
Beauregard Parish Health
Unit/DERIDDER 15 13 28 289 317 4.7% 4.1% 8.8% 91.2%
Becker County WIC Program 39 16 55 142 197 19.8% 8.1% 27.9% 72.1%
Bedford Stuyvesant Family
Health Center 26 287 313 386 699 3.7% 41.1% 44.8% 55.2%
Belknap-Merrimack CAP 224 74 298 789 1,087 20.6% 6.8% 27.4% 72.6%
Bell Co. Public Health District 590 903 1,493 2,982 4,475 13.2% 20.2% 33.4% 66.6%
Belmont County WIC Program 32 5 37 357 394 8.1% 1.3% 9.4% 90.6%
Beltrami County Public Health 74 24 98 232 330 22.4% 7.3% 29.7% 70.3%
Benewah Medical Center 10 1 11 25 36 27.8% 2.8% 30.6% 69.4%
Bennett County WIC Program 3 8 11 35 46 6.5% 17.4% 23.9% 76.1%
Bent County Nursing Service 4 2 6 26 32 12.5% 6.3% 18.8% 81.3%
Benton County Health
Department 142 29 171 167 338 42.0% 8.6% 50.6% 49.4%
Benton County Health Dept 13 2 15 74 89 14.6% 2.2% 16.9% 83.1%
Benton County Public Health 26 15 41 155 196 13.3% 7.7% 20.9% 79.1%
Benton-Franklin Health District 274 164 438 1,060 1,498 18.3% 10.9% 29.2% 70.8%
Benzie Leelanau District Health
Dept 29 13 42 94 136 21.3% 9.6% 30.9% 69.1%
Berkshire North WIC 78 55 133 386 519 15.0% 10.6% 25.6% 74.4%
Berkshire South WIC 30 12 42 59 101 29.7% 11.9% 41.6% 58.4%
Berrien County Health Dept 142 70 212 904 1,116 12.7% 6.3% 19.0% 81.0%
Bertie County Health
Department 1 9 10 131 141 0.7% 6.4% 7.1% 92.9%
Bethel New Life, Inc. 21 81 102 727 829 2.5% 9.8% 12.3% 87.7%
Bi-County WIC Program 189 18 207 642 849 22.3% 2.1% 24.4% 75.6%
Bienville Parish Health
Unit/ARCADIA 3 4 7 133 140 2.1% 2.9% 5.0% 95.0%
Big Horn/Park County WIC
Program 37 6 43 101 144 25.7% 4.2% 29.9% 70.1%
Blackfeet Tribe (Glacier Co.) 19 2 21 137 158 12.0% 1.3% 13.3% 86.7%
Bladen County Health
Department 12 38 50 221 271 4.4% 14.0% 18.5% 81.5%
Bloomington Public Health 144 116 260 368 628 22.9% 18.5% 41.4% 58.6%
Blue Earth County Government
Center 62 40 102 180 282 22.0% 14.2% 36.2% 63.8%
Blue Hill Corridor WIC 52 136 188 258 446 11.7% 30.5% 42.2% 57.8%
Blue River Services, Inc. 58 30 88 452 540 10.7% 5.6% 16.3% 83.7%
Blue Valley Community Action 15 38 53 142 195 7.7% 19.5% 27.2% 72.8%
Bollinger County Health Center 20 3 23 87 110 18.2% 2.7% 20.9% 79.1%
Bon Homme County WIC
Program 7 4 11 22 33 21.2% 12.1% 33.3% 66.7%
Bond County Health Dept 19 7 26 95 121 15.7% 5.8% 21.5% 78.5%
Boone County Health Dept 20 50 70 203 273 7.3% 18.3% 25.6% 74.4%
Bossier Parish Hlth
Unit/BOSSIER 14 34 48 434 482 2.9% 7.1% 10.0% 90.0%
Boulder County Public Health
Dept 205 115 320 501 821 25.0% 14.0% 39.0% 61.0%
Bourbon County Health
Department 16 36 52 128 180 8.9% 20.0% 28.9% 71.1%
Boyle County Health
Department 23 20 43 152 195 11.8% 10.3% 22.1% 77.9%
Bracken County Health
Department 11 9 20 64 84 13.1% 10.7% 23.8% 76.2%
Bradford Hospital WIC Program 45 - 45 215 260 17.3% 0.0% 17.3% 82.7%
Branch Hilldale St. Joe Comm.
Hlth Agency 244 91 335 934 1,269 19.2% 7.2% 26.4% 73.6%
Brazoria County Health
Department 193 405 598 1,105 1,703 11.3% 23.8% 35.1% 64.9%
Brazos Valley Community
Action Agency 241 456 697 1,188 1,885 12.8% 24.2% 37.0% 63.0%
Breathitt County Health
Department 4 10 14 118 132 3.0% 7.6% 10.6% 89.4%
Breckinridge County Health
Department 10 52 62 86 148 6.8% 35.1% 41.9% 58.1%
Brevard County Health Dept 450 348 798 1,884 2,682 16.8% 13.0% 29.8% 70.2%
Brighton/Roslindale WIC 110 102 212 261 473 23.3% 21.6% 44.8% 55.2%
Bristol Bay Area Health Corp. 28 38 66 56 122 23.0% 31.1% 54.1% 45.9%
Bristol Hospital WIC Program 71 194 265 884 1,149 6.2% 16.9% 23.1% 76.9%
Broad Top Area Medical Center 101 7 108 386 494 20.4% 1.4% 21.9% 78.1%
Broadlawns WIC Office 298 411 709 1,834 2,543 11.7% 16.2% 27.9% 72.1%
Broadwater County WIC 9 3 12 31 43 20.9% 7.0% 27.9% 72.1%
Brockton WIC 236 332 568 713 1,281 18.4% 25.9% 44.3% 55.7%
*To maintain the privacy of participants, Local Agencies with less than 30 Infant Participants are not published. 30

Fully Breastfed Partially Breastfed Total Breastfed Fully Formula-Fed
Local Agency
Infant Data
Participation Data Statistical Data
Fully Breastfed Partially Breastfed Total Breastfed Fully Formula-Fed Total Infants
Bronx Lebanon Hospital Center 30 477 507 219 726 4.1% 65.7% 69.8% 30.2%
Brookdale Hospital and Medical
Center 15 540 555 551 1,106 1.4% 48.8% 50.2% 49.8%
Brookings County WIC Program 28 19 47 77 124 22.6% 15.3% 37.9% 62.1%
Brooklyn Hospital Center 288 3,307 3,595 411 4,006 7.2% 82.6% 89.7% 10.3%
Broome County Health
Department 165 105 270 837 1,107 14.9% 9.5% 24.4% 75.6%
Broomfield Co Hlth & Human
SVS 28 6 34 71 105 26.7% 5.7% 32.4% 67.6%
Broward County Hlth
Department 1,522 2,695 4,217 6,700 10,917 13.9% 24.7% 38.6% 61.4%
Brown County PHNS 26 9 35 102 137 19.0% 6.6% 25.5% 74.5%
Brown County WIC Program 30 8 38 164 202 14.9% 4.0% 18.8% 81.2%
Brownsville Community
Development Corp. 23 274 297 668 965 2.4% 28.4% 30.8% 69.2%
Brownwood-Brown County
Health Department 37 37 74 221 295 12.5% 12.5% 25.1% 74.9%
Brule County WIC Program 6 3 9 27 36 16.7% 8.3% 25.0% 75.0%
Brunswick County Health
Department 44 64 108 457 565 7.8% 11.3% 19.1% 80.9%
Bucks County Health
Department 243 55 298 1,079 1,377 17.6% 4.0% 21.6% 78.4%
Buffalo County Dept of Health 17 9 26 62 88 19.3% 10.2% 29.5% 70.5%
Buffalo County WIC Program 2 3 5 43 48 4.2% 6.3% 10.4% 89.6%
Buffalo Trace District 11 33 44 128 172 6.4% 19.2% 25.6% 74.4%
Bullitt County Health
Department 42 131 173 281 454 9.3% 28.9% 38.1% 61.9%
Buncombe County Health
Department 268 194 462 810 1,272 21.1% 15.3% 36.3% 63.7%
Bureau County Health Dept 20 16 36 156 192 10.4% 8.3% 18.8% 81.3%
Burke County Health
Department 55 58 113 477 590 9.3% 9.8% 19.2% 80.8%
Burlington County WIC Program 178 174 352 902 1,254 14.2% 13.9% 28.1% 71.9%
Burnett County Dept of HHS 12 4 16 56 72 16.7% 5.6% 22.2% 77.8%
Butler County Health Dept 35 19 54 169 223 15.7% 8.5% 24.2% 75.8%
Butler County Health Dept 57 24 81 377 458 12.4% 5.2% 17.7% 82.3%
Butler County WIC Program 163 92 255 1,849 2,104 7.7% 4.4% 12.1% 87.9%
Butte County DPH 391 141 532 851 1,383 28.3% 10.2% 38.5% 61.5%
Butte County WIC Program 15 5 20 42 62 24.2% 8.1% 32.3% 67.7%
Cabarrus Health Alliance 121 211 332 817 1,149 10.5% 18.4% 28.9% 71.1%
CAC of Lewis/Mason/Thurston
Counties 153 72 225 375 600 25.5% 12.0% 37.5% 62.5%
Caddo Parish Helalth
Unit/SHREVEPORT 22 51 73 698 771 2.9% 6.6% 9.5% 90.5%
Calcasieu Parish Health
Unit/LAKE CHARLES 58 87 145 1,217 1,362 4.3% 6.4% 10.6% 89.4%
Caldwell County Health Center 3 1 4 41 45 6.7% 2.2% 8.9% 91.1%
Caldwell County Health
Department 52 71 123 414 537 9.7% 13.2% 22.9% 77.1%
Caldwell Parish Health
Unit/COLUMBIA 3 2 5 119 124 2.4% 1.6% 4.0% 96.0%
Calhoun County Health Dept 122 84 206 934 1,140 10.7% 7.4% 18.1% 81.9%
Callaway County Health Dept 18 5 23 126 149 12.1% 3.4% 15.4% 84.6%
Calloway County Health
Department 35 31 66 184 250 14.0% 12.4% 26.4% 73.6%
Calumet County Health Dept 28 10 38 109 147 19.0% 6.8% 25.9% 74.1%
Cambridge/Somerville WIC 174 307 481 414 895 19.4% 34.3% 53.7% 46.3%
Camden County Health Dept 46 14 60 175 235 19.6% 6.0% 25.5% 74.5%
Cameron County Dept of Health
and Human Services 325 3,009 3,334 2,861 6,195 5.2% 48.6% 53.8% 46.2%
Camino Health Center 322 356 678 731 1,409 22.9% 25.3% 48.1% 51.9%
Campbell County WIC Program 58 13 71 225 296 19.6% 4.4% 24.0% 76.0%
Cape Cod WIC 119 102 221 368 589 20.2% 17.3% 37.5% 62.5%
Cape Girardeau County Public
Health Center 43 18 61 395 456 9.4% 3.9% 13.4% 86.6%
Capitol City Family Health
Center 24 53 77 1,009 1,086 2.2% 4.9% 7.1% 92.9%
Carbon County WIC Program 13 8 21 58 79 16.5% 10.1% 26.6% 73.4%
Cardinal Services, Inc. 38 36 74 319 393 9.7% 9.2% 18.8% 81.2%
Carlton County Health Services 31 12 43 122 165 18.8% 7.3% 26.1% 73.9%
Caroline County WIC Program 111 82 193 539 732 15.2% 11.2% 26.4% 73.6%
Carroll County Health Dept 10 3 13 46 59 16.9% 5.1% 22.0% 78.0%
Carroll County Health Dept 7 8 15 67 82 8.5% 9.8% 18.3% 81.7%
Carroll County WIC Program 71 58 129 378 507 14.0% 11.4% 25.4% 74.6%
Carroll County WIC Program 19 3 22 128 150 12.7% 2.0% 14.7% 85.3%
Carson City - Ron Wood WIC 42 27 69 166 235 17.9% 11.5% 29.4% 70.6%
Carson City Health & Human
Services 55 32 87 172 259 21.2% 12.4% 33.6% 66.4%
Carter County Health Center 8 2 10 50 60 13.3% 3.3% 16.7% 83.3%
Carteret County Health
Department 36 34 70 280 350 10.3% 9.7% 20.0% 80.0%
Cascade County WIC Program 117 23 140 345 485 24.1% 4.7% 28.9% 71.1%
Cass Co Hlth, Hum & Vet
Services 27 9 36 111 147 18.4% 6.1% 24.5% 75.5%
Cass County Health Dept 49 26 75 298 373 13.1% 7.0% 20.1% 79.9%
Cass County Health Dept 8 15 23 76 99 8.1% 15.2% 23.2% 76.8%
Caswell County Health
Department 13 13 26 117 143 9.1% 9.1% 18.2% 81.8%
Catahoula Parish Health
Unit/JONESVILLE 2 2 4 93 97 2.1% 2.1% 4.1% 95.9%
Catawba County Health
Department 124 143 267 798 1,065 11.6% 13.4% 25.1% 74.9%
Catholic Charities 139 79 218 1,106 1,324 10.5% 6.0% 16.5% 83.5%
Catholic Charities Brooklyn
Neighborhood 33 404 437 512 949 3.5% 42.6% 46.0% 54.0%
Catholic Charities of Buffalo 449 618 1,067 4,454 5,521 8.1% 11.2% 19.3% 80.7%
Catholic Charities of Columbia &
Greene Counties 43 62 105 373 478 9.0% 13.0% 22.0% 78.0%
Catholic Charities of Rockville
Center 29 239 268 275 543 5.3% 44.0% 49.4% 50.6%
Cattaraugus County Health
Department 47 37 84 380 464 10.1% 8.0% 18.1% 81.9%
*To maintain the privacy of participants, Local Agencies with less than 30 Infant Participants are not published. 31

Fully Breastfed Partially Breastfed Total Breastfed Fully Formula-Fed
Local Agency
Infant Data
Participation Data Statistical Data
Fully Breastfed Partially Breastfed Total Breastfed Fully Formula-Fed Total Infants
Cayuga County Health
Department 48 25 73 334 407 11.8% 6.1% 17.9% 82.1%
Cedar County Health Dept 18 5 23 86 109 16.5% 4.6% 21.1% 78.9%
Center for Human Development
Inc. 47 9 56 135 191 24.6% 4.7% 29.3% 70.7%
CenterStone of Indiana, Inc. 61 51 112 748 860 7.1% 5.9% 13.0% 87.0%
Central District Health
Department 472 150 622 1,038 1,660 28.4% 9.0% 37.5% 62.5%
Central District Health Dept. 70 97 167 348 515 13.6% 18.8% 32.4% 67.6%
Central Mich District Health
Dept WIC 213 83 296 904 1,200 17.8% 6.9% 24.7% 75.3%
Central Nebraska Community
Services 43 25 68 205 273 15.8% 9.2% 24.9% 75.1%
Central Shenandoah District 152 177 329 870 1,199 12.7% 14.8% 27.4% 72.6%
Central Utah Public Health Dept 114 31 145 315 460 24.8% 6.7% 31.5% 68.5%
Central Valley Health Unit 11 16 27 77 104 10.6% 15.4% 26.0% 74.0%
Central Valley Indian Health,
Inc. 100 59 159 294 453 22.1% 13.0% 35.1% 64.9%
Central Virginia District 132 57 189 1,050 1,239 10.7% 4.6% 15.3% 84.7%
Central WV WIC 108 34 142 695 837 12.9% 4.1% 17.0% 83.0%
Centro De Salud Familiar La Fe,
Inc. 53 158 211 260 471 11.3% 33.5% 44.8% 55.2%
Chambers County Health
Department 13 28 41 124 165 7.9% 17.0% 24.8% 75.2%
Champaign County WIC
Program 28 7 35 159 194 14.4% 3.6% 18.0% 82.0%
Champaign-Urbana Public
Health 115 164 279 778 1,057 10.9% 15.5% 26.4% 73.6%
Chariton County Health Center 5 2 7 24 31 16.1% 6.5% 22.6% 77.4%
Charles County WIC Program 145 249 394 1,306 1,700 8.5% 14.6% 23.2% 76.8%
Charles Mix County WIC
Program 10 11 21 94 115 8.7% 9.6% 18.3% 81.7%
Charlotte County Health
Department 109 46 155 533 688 15.8% 6.7% 22.5% 77.5%
Chautauqua County Health
Department 89 63 152 691 843 10.6% 7.5% 18.0% 82.0%
Chautauqua County Health Dept 3 1 4 33 37 8.1% 2.7% 10.8% 89.2%
Chelan-Douglas Health District 29 12 41 140 181 16.0% 6.6% 22.7% 77.3%
Chelsea/Revere WIC 174 326 500 611 1,111 15.7% 29.3% 45.0% 55.0%
Chemung County Health
Department 62 47 109 578 687 9.0% 6.8% 15.9% 84.1%
Cherokee County Health
Department 25 6 31 127 158 15.8% 3.8% 19.6% 80.4%
Cherokee County Health Dept 51 36 87 497 584 8.7% 6.2% 14.9% 85.1%
Chesapeake District 114 92 206 870 1,076 10.6% 8.6% 19.1% 80.9%
Chester County Health
Department 266 93 359 867 1,226 21.7% 7.6% 29.3% 70.7%
Chesterfield District 105 121 226 1,232 1,458 7.2% 8.3% 15.5% 84.5%
Cheyenne River WIC Program 9 10 19 126 145 6.2% 6.9% 13.1% 86.9%
Chicago Department of Health 182 1,320 1,502 8,389 9,891 1.8% 13.3% 15.2% 84.8%
Chickahominy District 32 23 55 237 292 11.0% 7.9% 18.8% 81.2%
Children and Youth Project 15 127 142 252 394 3.8% 32.2% 36.0% 64.0%
Children Health Care Clinic of
Acadiana 19 25 44 412 456 4.2% 5.5% 9.6% 90.4%
Children's Friend & Service 38 122 160 663 823 4.6% 14.8% 19.4% 80.6%
Children's Home Society of New
Jersey's Mercer WIC Program 249 354 603 1,122 1,725 14.4% 20.5% 35.0% 65.0%
Children's Hospital WIC
Program 60 244 304 165 469 12.8% 52.0% 64.8% 35.2%
Children's National Medical
Center 97 217 314 885 1,199 8.1% 18.1% 26.2% 73.8%
Chippewa County Health Dept 74 15 89 187 276 26.8% 5.4% 32.2% 67.8%
Chippewa County WIC Project 55 24 79 212 291 18.9% 8.2% 27.1% 72.9%
Chisago County Public Health
SVC 36 14 50 121 171 21.1% 8.2% 29.2% 70.8%
Christian County Health
Department 172 133 305 920 1,225 14.0% 10.9% 24.9% 75.1%
Christian County Health Dept 75 17 92 271 363 20.7% 4.7% 25.3% 74.7%
Christian County Health Dept 11 10 21 189 210 5.2% 4.8% 10.0% 90.0%
Christus Santa Rosa Health
Care 202 312 514 800 1,314 15.4% 23.7% 39.1% 60.9%
Citrus County Health
Department 76 46 122 564 686 11.1% 6.7% 17.8% 82.2%
City & County of San Francisco
DPH 593 1,317 1,910 1,033 2,943 20.1% 44.8% 64.9% 35.1%
City of Bangor, Health &
Community Services
Department 149 21 170 615 785 19.0% 2.7% 21.7% 78.3%
City of Berkeley 91 42 133 110 243 37.4% 17.3% 54.7% 45.3%
City Of Dallas Housing &
Community Services Dept. 2,137 11,895 14,032 9,958 23,990 8.9% 49.6% 58.5% 41.5%
City of Del Rio 65 114 179 404 583 11.1% 19.6% 30.7% 69.3%
City of El Paso 1,235 3,163 4,398 5,819 10,217 12.1% 31.0% 43.0% 57.0%
City of Long Beach DHHS 809 889 1,698 3,456 5,154 15.7% 17.2% 32.9% 67.1%
City of Milwaukee 112 150 262 1,639 1,901 5.9% 7.9% 13.8% 86.2%
City of Port Arthur 31 235 266 640 906 3.4% 25.9% 29.4% 70.6%
City of Racine Health
Department 22 27 49 207 256 8.6% 10.5% 19.1% 80.9%
City of San Marcos 356 483 839 1,372 2,211 16.1% 21.8% 37.9% 62.1%
City-County Health Dept 7 4 11 35 46 15.2% 8.7% 23.9% 76.1%
Claiborne Parish Health
Unit/HOMER 7 10 17 128 145 4.8% 6.9% 11.7% 88.3%
Clallam County HHS 103 30 133 146 279 36.9% 10.8% 47.7% 52.3%
Clark County Health Care
Center 40 16 56 111 167 24.0% 9.6% 33.5% 66.5%
Clark County Health Department 17 73 90 221 311 5.5% 23.5% 28.9% 71.1%
Clark County Health Dept 13 4 17 87 104 12.5% 3.8% 16.3% 83.7%
Clark County Health Dept 6 2 8 48 56 10.7% 3.6% 14.3% 85.7%
Clark County WIC Program 78 21 99 975 1,074 7.3% 2.0% 9.2% 90.8%
Clatsop County Health and
Human Services 40 15 55 53 108 37.0% 13.9% 50.9% 49.1%
Clay County Health Department 13 9 22 34 56 23.2% 16.1% 39.3% 60.7%
*To maintain the privacy of participants, Local Agencies with less than 30 Infant Participants are not published. 32

Fully Breastfed Partially Breastfed Total Breastfed Fully Formula-Fed
Local Agency
Infant Data
Participation Data Statistical Data
Fully Breastfed Partially Breastfed Total Breastfed Fully Formula-Fed Total Infants
Clay County Health Department 124 103 227 652 879 14.1% 11.7% 25.8% 74.2%
Clay County Health Dept 45 39 84 212 296 15.2% 13.2% 28.4% 71.6%
Clay County Health Dept 13 5 18 98 116 11.2% 4.3% 15.5% 84.5%
Clay County Health Dept 10 13 23 197 220 4.5% 5.9% 10.5% 89.5%
Clay County Public Health
Center 104 40 144 533 677 15.4% 5.9% 21.3% 78.7%
Clay County WIC Program 12 5 17 44 61 19.7% 8.2% 27.9% 72.1%
Clermont County WIC Program 94 29 123 862 985 9.5% 2.9% 12.5% 87.5%
Cleveland County Health
Department 41 35 76 647 723 5.7% 4.8% 10.5% 89.5%
Clinica Sierra Vista, INC. 995 1,237 2,232 5,995 8,227 12.1% 15.0% 27.1% 72.9%
Clinicas De Salud Del Pueblo 258 238 496 1,356 1,852 13.9% 12.9% 26.8% 73.2%
Clinton County Department of
Public Health 58 29 87 313 400 14.5% 7.3% 21.8% 78.3%
Clinton County Health Dept 22 6 28 105 133 16.5% 4.5% 21.1% 78.9%
Clinton County Health Dept 17 12 29 114 143 11.9% 8.4% 20.3% 79.7%
Clinton County WIC Program 29 6 35 246 281 10.3% 2.1% 12.5% 87.5%
Cloud County Health
Department 24 13 37 111 148 16.2% 8.8% 25.0% 75.0%
CNMI Department of Public
Health WIC Program, Saipan 74 185 259 461 720 10.3% 25.7% 36.0% 64.0%
Cochise County Dept Health 125 121 246 657 903 13.8% 13.4% 27.2% 72.8%
Coconino County Health Dept 307 121 428 356 784 39.2% 15.4% 54.6% 45.4%
Cocopah Tribe WIC Program 3 3 6 45 51 5.9% 5.9% 11.8% 88.2%
Codington County WIC Program 26 7 33 140 173 15.0% 4.0% 19.1% 80.9%
Cole County Health Dept 93 19 112 354 466 20.0% 4.1% 24.0% 76.0%
Coles County Health
Department 22 21 43 249 292 7.5% 7.2% 14.7% 85.3%
Collier County Hlth Department 409 442 851 1,098 1,949 21.0% 22.7% 43.7% 56.3%
Collin County Health Care
Services 390 1,017 1,407 1,473 2,880 13.5% 35.3% 48.9% 51.1%
Colorado River Indian Tribes 16 8 24 134 158 10.1% 5.1% 15.2% 84.8%
Columbia Basin Health
Association 87 170 257 296 553 15.7% 30.7% 46.5% 53.5%
Columbia County Chn Service 33 7 40 128 168 19.6% 4.2% 23.8% 76.2%
Columbia Health Dept of Public
Health & Human Service 108 81 189 527 716 15.1% 11.3% 26.4% 73.6%
Columbia Valley Comm Health 151 110 261 392 653 23.1% 16.8% 40.0% 60.0%
Columbus County Health
Department 20 51 71 459 530 3.8% 9.6% 13.4% 86.6%
Colville Confederated Tribes 25 6 31 75 106 23.6% 5.7% 29.2% 70.8%
Comm Act. Partnership of
Cambria Co. 106 16 122 534 656 16.2% 2.4% 18.6% 81.4%
Comm Action Prog/Lanc Co.
Inc. 364 88 452 1,656 2,108 17.3% 4.2% 21.4% 78.6%
Comm Action Program of West
IN 42 19 61 454 515 8.2% 3.7% 11.8% 88.2%
Comm. Action of Southeast
Iowa 106 93 199 746 945 11.2% 9.8% 21.1% 78.9%
Comm. Action Partnership of
Kern 575 498 1,073 2,753 3,826 15.0% 13.0% 28.0% 72.0%
Comm. Action Partnership of
MID-NE 92 106 198 598 796 11.6% 13.3% 24.9% 75.1%
Comm. Hlth. Interven. & Ed.
Found., Inc. 5 3 8 70 78 6.4% 3.8% 10.3% 89.7%
Commission on Economic
Opportunity 56 82 138 668 806 6.9% 10.2% 17.1% 82.9%
Community & Econ Dev Assoc
CEDA 775 3,021 3,796 8,596 12,392 6.3% 24.4% 30.6% 69.4%
Community & Family Services,
Inc. 84 54 138 767 905 9.3% 6.0% 15.2% 84.8%
Community Action Agency 78 59 137 466 603 12.9% 9.8% 22.7% 77.3%
Community Action Partnership
of Western Nebraska 43 22 65 256 321 13.4% 6.9% 20.2% 79.8%
Community Action Southwest 114 10 124 843 967 11.8% 1.0% 12.8% 87.2%
Community Bridges 593 464 1,057 785 1,842 32.2% 25.2% 57.4% 42.6%
Community Care Foundation,
Inc. 54 123 177 558 735 7.3% 16.7% 24.1% 75.9%
Community Clinic of Maui 85 51 136 340 476 17.9% 10.7% 28.6% 71.4%
Community Council of South
Central TX, Inc 87 60 147 488 635 13.7% 9.4% 23.1% 76.9%
Community Health of Central
Washington 53 20 73 95 168 31.5% 11.9% 43.5% 56.5%
Community Health Services,
Inc. 206 9 215 637 852 24.2% 1.1% 25.2% 74.8%
Community Medical Centers,
Inc. 454 305 759 732 1,491 30.4% 20.5% 50.9% 49.1%
Community Progress Council,
Inc. 220 49 269 1,304 1,573 14.0% 3.1% 17.1% 82.9%
Community Resource Project,
Inc. 1,237 612 1,849 2,708 4,557 27.1% 13.4% 40.6% 59.4%
Concordia Parish Health
Unit/FERRIDAY 5 6 11 226 237 2.1% 2.5% 4.6% 95.4%
Coney Island Hospital
(NYCHHC) 95 471 566 501 1,067 8.9% 44.1% 53.0% 47.0%
Confederate Tribes of Umatilla 26 7 33 78 111 23.4% 6.3% 29.7% 70.3%
Confederate Tribes of Warm
Springs 110 27 137 256 393 28.0% 6.9% 34.9% 65.1%
Confederated Salish & Kootenai
Tribes (Flathead Res) 11 8 19 65 84 13.1% 9.5% 22.6% 77.4%
Contra Costa County Hlth
Service 1,039 1,077 2,116 2,619 4,735 21.9% 22.7% 44.7% 55.3%
Converse County WIC Program 7 1 8 46 54 13.0% 1.9% 14.8% 85.2%
Cook Co Bureau of Health
Services 5 84 89 355 444 1.1% 18.9% 20.0% 80.0%
Cook County Dept of Public
Health 252 1,220 1,472 3,622 5,094 4.9% 23.9% 28.9% 71.1%
Cook Inlet Tribal Council Inc. 74 29 103 154 257 28.8% 11.3% 40.1% 59.9%
Cooper County Public Health
Center 10 2 12 63 75 13.3% 2.7% 16.0% 84.0%
Coordinated Youth Services 149 122 271 1,312 1,583 9.4% 7.7% 17.1% 82.9%
*To maintain the privacy of participants, Local Agencies with less than 30 Infant Participants are not published. 33

Fully Breastfed Partially Breastfed Total Breastfed Fully Formula-Fed
Local Agency
Infant Data
Participation Data Statistical Data
Fully Breastfed Partially Breastfed Total Breastfed Fully Formula-Fed Total Infants
Coos County Health Department 78 26 104 177 281 27.8% 9.3% 37.0% 63.0%
Corpus Christi-Nueces County
Public Health District 99 291 390 847 1,237 8.0% 23.5% 31.5% 68.5%
Corsicana Navarro County Pub
Health District 26 85 111 389 500 5.2% 17.0% 22.2% 77.8%
Cortland County Community
Action Program, Inc. 40 19 59 224 283 14.1% 6.7% 20.8% 79.2%
Coshocton County WIC
Program 32 6 38 215 253 12.6% 2.4% 15.0% 85.0%
Cottonwood Jackson CHS 20 12 32 118 150 13.3% 8.0% 21.3% 78.7%
Countryside PHNS-Benson Off 52 29 81 238 319 16.3% 9.1% 25.4% 74.6%
County of Humboldt 272 147 419 472 891 30.5% 16.5% 47.0% 53.0%
County of Inyo DHHS 21 11 32 49 81 25.9% 13.6% 39.5% 60.5%
County of Mendocino 245 101 346 327 673 36.4% 15.0% 51.4% 48.6%
County of Orange Health Care
Agency 985 1,110 2,095 3,369 5,464 18.0% 20.3% 38.3% 61.7%
County of Riverside Hlth Srvcs 5,255 1,420 6,675 11,848 18,523 28.4% 7.7% 36.0% 64.0%
County of San Luis Obispo 362 150 512 468 980 36.9% 15.3% 52.2% 47.8%
County of Shasta, HHSA, PHD 399 126 525 766 1,291 30.9% 9.8% 40.7% 59.3%
County of Siskiyou Public
Health and Community Dev
Dept 88 30 118 151 269 32.7% 11.2% 43.9% 56.1%
County of Sonoma DHS 707 363 1,070 787 1,857 38.1% 19.5% 57.6% 42.4%
County of Tulare Health and
Human Services Agency 950 648 1,598 4,230 5,828 16.3% 11.1% 27.4% 72.6%
Cowley County Health Dept 22 20 42 260 302 7.3% 6.6% 13.9% 86.1%
Cowlitz Family Health Center 168 42 210 576 786 21.4% 5.3% 26.7% 73.3%
Crater District 76 72 148 1,006 1,154 6.6% 6.2% 12.8% 87.2%
Craven County Health
Department 103 83 186 705 891 11.6% 9.3% 20.9% 79.1%
Crawford County Health 39 26 65 395 460 8.5% 5.7% 14.1% 85.9%
Crawford County Health Dept 15 7 22 112 134 11.2% 5.2% 16.4% 83.6%
Crawford County Nursing
Services/Health Department 21 4 25 140 165 12.7% 2.4% 15.2% 84.8%
Crawford County WIC Program 36 8 44 268 312 11.5% 2.6% 14.1% 85.9%
Crescent City WIC
Services/Gretna 59 94 153 762 915 6.4% 10.3% 16.7% 83.3%
Crescent Clinic-WIC 59 63 122 411 533 11.1% 11.8% 22.9% 77.1%
Crook County Health
Department 75 16 91 194 285 26.3% 5.6% 31.9% 68.1%
Cross Timbers Health Clinic 9 44 53 89 142 6.3% 31.0% 37.3% 62.7%
Crow Tribe 12 5 17 86 103 11.7% 4.9% 16.5% 83.5%
Crow Wing County Health
Services 85 23 108 271 379 22.4% 6.1% 28.5% 71.5%
Crozer-Chester Medical Center 282 96 378 2,176 2,554 11.0% 3.8% 14.8% 85.2%
Cudahy Health Department 85 39 124 504 628 13.5% 6.2% 19.7% 80.3%
Cumberland County Health Dept 10 3 13 51 64 15.6% 4.7% 20.3% 79.7%
Cumberland County Public
Health Center 409 433 842 2,861 3,703 11.0% 11.7% 22.7% 77.3%
Cumberland Plateau 27 16 43 568 611 4.4% 2.6% 7.0% 93.0%
Cumberland Valley District 67 140 207 1,048 1,255 5.3% 11.2% 16.5% 83.5%
Curry County Health
Department 45 8 53 84 137 32.8% 5.8% 38.7% 61.3%
Custer Bismarck WIC 85 41 126 337 463 18.4% 8.9% 27.2% 72.8%
Custer (Rosebud) County WIC 35 11 46 117 163 21.5% 6.7% 28.2% 71.8%
Custer County WIC Program 5 4 9 23 32 15.6% 12.5% 28.1% 71.9%
Cuyahoga County WIC Program 737 208 945 7,273 8,218 9.0% 2.5% 11.5% 88.5%
Dade County Health
Department 1,662 4,895 6,557 10,805 17,362 9.6% 28.2% 37.8% 62.2%
Dade County Health Dept 6 2 8 37 45 13.3% 4.4% 17.8% 82.2%
Dakota County Public Health
Dept 208 398 606 958 1,564 13.3% 25.4% 38.7% 61.3%
Dallas County Health Dept 14 3 17 77 94 14.9% 3.2% 18.1% 81.9%
Danbury WIC Program 65 198 263 325 588 11.1% 33.7% 44.7% 55.3%
Dare County Health Department 46 38 84 122 206 22.3% 18.4% 40.8% 59.2%
Darke/Mercer County WIC
Program 64 19 83 442 525 12.2% 3.6% 15.8% 84.2%
Daughters of Charity Services of
New Orleans 78 141 219 1,466 1,685 4.6% 8.4% 13.0% 87.0%
David Raines Community Health
Center 9 25 34 994 1,028 0.9% 2.4% 3.3% 96.7%
Davidson County Health
Department 104 120 224 811 1,035 10.0% 11.6% 21.6% 78.4%
Davie County Health
Department 25 17 42 170 212 11.8% 8.0% 19.8% 80.2%
Daviess County Health Dept 6 2 8 38 46 13.0% 4.3% 17.4% 82.6%
Davis County Health Dept 314 93 407 879 1,286 24.4% 7.2% 31.6% 68.4%
Davison County WIC Program 19 10 29 93 122 15.6% 8.2% 23.8% 76.2%
Dawson County WIC Program 8 1 9 32 41 19.5% 2.4% 22.0% 78.0%
Dearborn County Hospital 30 21 51 444 495 6.1% 4.2% 10.3% 89.7%
Deer Lodge County WIC
Program 29 6 35 69 104 27.9% 5.8% 33.7% 66.3%
Defiance County WIC Program 22 4 26 220 246 8.9% 1.6% 10.6% 89.4%
Dekalb County Health Dept 64 92 156 320 476 13.4% 19.3% 32.8% 67.2%
Delaware Opportunities, Inc. 29 19 48 155 203 14.3% 9.4% 23.6% 76.4%
Delaware-Mo-Un-WIC Program 84 22 106 625 731 11.5% 3.0% 14.5% 85.5%
Delta County Health Dept 27 3 30 75 105 25.7% 2.9% 28.6% 71.4%
Delta Hlth Care & Mgt. Serv
Corp 646 329 975 1,895 2,870 22.5% 11.5% 34.0% 66.0%
Dent County Health Center 16 3 19 96 115 13.9% 2.6% 16.5% 83.5%
Denton County Health
Department 443 949 1,392 1,898 3,290 13.5% 28.8% 42.3% 57.7%
Denver Health Medical Center 508 479 987 2,348 3,335 15.2% 14.4% 29.6% 70.4%
Dept. of Health-VI WIC Program 37 293 330 228 558 6.6% 52.5% 59.1% 40.9%
Dept. of Health-VI WIC Program 27 365 392 211 603 4.5% 60.5% 65.0% 35.0%
Dept. of Human & Social
Services 69 639 708 408 1,116 6.2% 57.3% 63.4% 36.6%
Deschutes County Health
Department 333 63 396 516 912 36.5% 6.9% 43.4% 56.6%
Desoto County Health
Department 36 64 100 227 327 11.0% 19.6% 30.6% 69.4%
*To maintain the privacy of participants, Local Agencies with less than 30 Infant Participants are not published. 34

Fully Breastfed Partially Breastfed Total Breastfed Fully Formula-Fed
Local Agency
Infant Data
Participation Data Statistical Data
Fully Breastfed Partially Breastfed Total Breastfed Fully Formula-Fed Total Infants
Desoto Parish Health
Unit/MANSFIELD 5 6 11 240 251 2.0% 2.4% 4.4% 95.6%
Detroit Dept. of Health and
Welliness 291 856 1,147 6,730 7,877 3.7% 10.9% 14.6% 85.4%
Detroit Urban League 112 259 371 3,089 3,460 3.2% 7.5% 10.7% 89.3%
Dewitt Piatt Bi County Health 28 8 36 111 147 19.0% 5.4% 24.5% 75.5%
Dickinson County Health
Department 13 7 20 86 106 12.3% 6.6% 18.9% 81.1%
Dickinson Iron District Health
Dept 55 14 69 185 254 21.7% 5.5% 27.2% 72.8%
Dist./Unit 01-1 Northwest GA
Hlth Dist. 233 724 957 3,339 4,296 5.4% 16.9% 22.3% 77.7%
Dist./Unit 01-2 Northwest Hlth
District 340 503 843 2,087 2,930 11.6% 17.2% 28.8% 71.2%
Dist./Unit 02-0 North Health
District 326 813 1,139 2,776 3,915 8.3% 20.8% 29.1% 70.9%
Dist./Unit 03-1 Metro West Hlth
Dist. 476 1,325 1,801 2,763 4,564 10.4% 29.0% 39.5% 60.5%
Dist./Unit 03-2 Fulton Co. Hlth
Dist. 108 768 876 2,981 3,857 2.8% 19.9% 22.7% 77.3%
Dist./Unit 03-3 Clayton Co. Hlth
District 78 608 686 1,706 2,392 3.3% 25.4% 28.7% 71.3%
Dist/Unit 03-4 East Metro Hlth
Dist. 425 1,965 2,390 4,477 6,867 6.2% 28.6% 34.8% 65.2%
Dist/Unit 03-5 Metro East Hlth
District 298 1,943 2,241 3,634 5,875 5.1% 33.1% 38.1% 61.9%
Dist/Unit 04-0 LaGrange Hlth
Services 344 714 1,058 4,199 5,257 6.5% 13.6% 20.1% 79.9%
Dist/Unit 05-1 North Central Hlth
Dist. 138 310 448 3,863 4,311 3.2% 7.2% 10.4% 89.6%
Dist/Unit 05-1 South Central
Hlth Dist. 43 36 79 1,109 1,188 3.6% 3.0% 6.6% 93.4%
Dist/Unit 06-0 East Central Hlth
Dist. 232 461 693 2,858 3,551 6.5% 13.0% 19.5% 80.5%
Dist/Unit 07-0 West Central Hlth
Dist 197 556 753 2,882 3,635 5.4% 15.3% 20.7% 79.3%
Dist/Unit 08-1 South Central
Health Dist 114 101 215 2,097 2,312 4.9% 4.4% 9.3% 90.7%
Dist/Unit 08-2 Southwest Hlth
District 126 403 529 2,861 3,390 3.7% 11.9% 15.6% 84.4%
Dist/Unit 09-2 Southeast Health
District 426 709 1,135 3,712 4,847 8.8% 14.6% 23.4% 76.6%
Dist/Unit 09-3 Coastal Health
District 158 467 625 2,838 3,463 4.6% 13.5% 18.0% 82.0%
Dist/Unit 10-0 Northeast Health
District 217 314 531 2,184 2,715 8.0% 11.6% 19.6% 80.4%
Dist/Unit 11-0 Southside
Hlthcare, Inc. - 4 4 55 59 0.0% 6.8% 6.8% 93.2%
District Health Dept #10 350 139 489 1,402 1,891 18.5% 7.4% 25.9% 74.1%
District Health Dept #2 81 26 107 337 444 18.2% 5.9% 24.1% 75.9%
District Health Dept #4 72 23 95 319 414 17.4% 5.6% 22.9% 77.1%
District I WIC 69 102 171 2,410 2,581 2.7% 4.0% 6.6% 93.4%
District II WIC 104 274 378 2,954 3,332 3.1% 8.2% 11.3% 88.7%
District III WIC 31 112 143 2,509 2,652 1.2% 4.2% 5.4% 94.6%
District IV WIC 46 124 170 1,814 1,984 2.3% 6.3% 8.6% 91.4%
District IX WIC 126 176 302 3,369 3,671 3.4% 4.8% 8.2% 91.8%
District V WIC 103 334 437 4,717 5,154 2.0% 6.5% 8.5% 91.5%
District VI WIC 50 105 155 1,871 2,026 2.5% 5.2% 7.7% 92.3%
District VII WIC 26 95 121 1,541 1,662 1.6% 5.7% 7.3% 92.7%
District VIII WIC 92 251 343 2,372 2,715 3.4% 9.2% 12.6% 87.4%
Division of Public
Health/Hudson Clinic 168 251 419 2,716 3,135 5.4% 8.0% 13.4% 86.6%
Division of Public Health/Milford
Clinic 183 127 310 2,125 2,435 7.5% 5.2% 12.7% 87.3%
Dodge County PHNS 15 10 25 72 97 15.5% 10.3% 25.8% 74.2%
Dodge County WIC Project 66 23 89 215 304 21.7% 7.6% 29.3% 70.7%
Door County Health 26 11 37 85 122 21.3% 9.0% 30.3% 69.7%
Dorchester North WIC 72 164 236 163 399 18.0% 41.1% 59.1% 40.9%
Dorchester South WIC 70 231 301 427 728 9.6% 31.7% 41.3% 58.7%
Douglas County Health
Department 202 37 239 524 763 26.5% 4.8% 31.3% 68.7%
Douglas County Health Dept 89 66 155 279 434 20.5% 15.2% 35.7% 64.3%
Douglas County Health Dept 20 6 26 83 109 18.3% 5.5% 23.9% 76.1%
Douglas County Health Dept 11 3 14 81 95 11.6% 3.2% 14.7% 85.3%
Douglas County Health Dept 359 782 1,141 2,751 3,892 9.2% 20.1% 29.3% 70.7%
Downeast Health Services, INC. 69 9 78 284 362 19.1% 2.5% 21.5% 78.5%
Downriver 112 87 199 641 840 13.3% 10.4% 23.7% 76.3%
Driscoll Childrens Hospital 184 715 899 1,135 2,034 9.0% 35.2% 44.2% 55.8%
Du Page County Health
Department 391 641 1,032 1,986 3,018 13.0% 21.2% 34.2% 65.8%
Dubois County Health Dept 17 27 44 179 223 7.6% 12.1% 19.7% 80.3%
Dunklin County Health Dept 24 12 36 328 364 6.6% 3.3% 9.9% 90.1%
Dunn County Health Dept 41 10 51 158 209 19.6% 4.8% 24.4% 75.6%
Duplin County Health
Department 25 118 143 456 599 4.2% 19.7% 23.9% 76.1%
Duval County Health
Department 679 1,018 1,697 4,727 6,424 10.6% 15.8% 26.4% 73.6%
E. Orange WIC Program 91 398 489 842 1,331 6.8% 29.9% 36.7% 63.3%
Eagle County Nursing Services 41 56 97 108 205 20.0% 27.3% 47.3% 52.7%
East Baton Rouge Parish Health
Unit/BATON ROUGE 34 105 139 1,106 1,245 2.7% 8.4% 11.2% 88.8%
East Boston WIC 135 315 450 324 774 17.4% 40.7% 58.1% 41.9%
East Carroll Parish Health
Unit/LAKE PROVIDENCE 1 1 2 114 116 0.9% 0.9% 1.7% 98.3%
East Chicago Health Dept 27 45 72 411 483 5.6% 9.3% 14.9% 85.1%
East Feliciana Parish Health
Unit/CLINTON 12 9 21 193 214 5.6% 4.2% 9.8% 90.2%
East Harlem Council For Human
Services, Inc 4 125 129 125 254 1.6% 49.2% 50.8% 49.2%
East Hartford WIC Program 87 172 259 820 1,079 8.1% 15.9% 24.0% 76.0%
East New York Diagnostic and
Treatment Center (NYCHHC) 25 303 328 519 847 3.0% 35.8% 38.7% 61.3%
East Side WIC Program
(NYCHHC) 330 1,174 1,504 1,068 2,572 12.8% 45.6% 58.5% 41.5%
East Tennessee Region 455 418 873 4,057 4,930 9.2% 8.5% 17.7% 82.3%
*To maintain the privacy of participants, Local Agencies with less than 30 Infant Participants are not published. 35

Fully Breastfed Partially Breastfed Total Breastfed Fully Formula-Fed
Local Agency
Infant Data
Participation Data Statistical Data
Fully Breastfed Partially Breastfed Total Breastfed Fully Formula-Fed Total Infants
Eastbay Community Action
Program 67 41 108 470 578 11.6% 7.1% 18.7% 81.3%
East-Central District Health Dept 24 31 55 311 366 6.6% 8.5% 15.0% 85.0%
Eastern Idaho Public Health
District 704 154 858 1,040 1,898 37.1% 8.1% 45.2% 54.8%
Eastern Shore District 18 43 61 351 412 4.4% 10.4% 14.8% 85.2%
Eastern Shoshone 7 7 14 56 70 10.0% 10.0% 20.0% 80.0%
Eastside Health District 31 81 112 889 1,001 3.1% 8.1% 11.2% 88.8%
Eau Claire City County Health
Dept 91 37 128 391 519 17.5% 7.1% 24.7% 75.3%
E-Center 162 78 240 279 519 31.2% 15.0% 46.2% 53.8%
Edgar County Health Dept 5 2 7 91 98 5.1% 2.0% 7.1% 92.9%
Edgecombe County Health
Department 11 28 39 471 510 2.2% 5.5% 7.6% 92.4%
Edgerton Women's Health
Center 118 105 223 869 1,092 10.8% 9.6% 20.4% 79.6%
Effingham County Health
Department 23 10 33 160 193 11.9% 5.2% 17.1% 82.9%
Egyptian Health Department 13 13 26 302 328 4.0% 4.0% 7.9% 92.1%
Eight Northern Pueblo, NM 14 1 15 44 59 23.7% 1.7% 25.4% 74.6%
El Centro Del Barrio, Inc.. 241 446 687 2,097 2,784 8.7% 16.0% 24.7% 75.3%
El Dorado Co Dept. Comm Srvs 183 98 281 321 602 30.4% 16.3% 46.7% 53.3%
El Paso County Dept of Health
& E 593 259 852 2,790 3,642 16.3% 7.1% 23.4% 76.6%
El Rio Health Center 79 128 207 566 773 10.2% 16.6% 26.8% 73.2%
Elkhart County Health Dept 167 217 384 1,286 1,670 10.0% 13.0% 23.0% 77.0%
Elmhurst Hospital Center
(NYCHHC) 216 839 1,055 799 1,854 11.7% 45.3% 56.9% 43.1%
Erie/Huron County WIC
Program 83 20 103 767 870 9.5% 2.3% 11.8% 88.2%
Escambia Co Hlth Department 296 194 490 1,867 2,357 12.6% 8.2% 20.8% 79.2%
Essex County Public Health 24 15 39 131 170 14.1% 8.8% 22.9% 77.1%
Estill County Health Department 9 12 21 110 131 6.9% 9.2% 16.0% 84.0%
Evangeline Parish Health
Unit/VILLE PLATTE 5 7 12 222 234 2.1% 3.0% 5.1% 94.9%
Evangeline Parish Police Jury 2 4 6 123 129 1.6% 3.1% 4.7% 95.3%
Fairfax District 313 1,550 1,863 2,324 4,187 7.5% 37.0% 44.5% 55.5%
Fairfield County WIC Program 55 12 67 537 604 9.1% 2.0% 11.1% 88.9%
Fall River County WIC Program 7 5 12 23 35 20.0% 14.3% 34.3% 65.7%
Fall River WIC 92 46 138 739 877 10.5% 5.2% 15.7% 84.3%
Family Care Health Center 86 71 157 498 655 13.1% 10.8% 24.0% 76.0%
Family Health Centers 117 49 166 181 347 33.7% 14.1% 47.8% 52.2%
Family Health Council of Central
PA, Inc. 613 94 707 2,620 3,327 18.4% 2.8% 21.3% 78.7%
Family Health Services of
Cranston 26 21 47 305 352 7.4% 6.0% 13.4% 86.6%
Family Health Services/WIC 24 18 42 297 339 7.1% 5.3% 12.4% 87.6%
Family Plan Health Services 121 36 157 660 817 14.8% 4.4% 19.2% 80.8%
Family Rosource Centers of NE
Nevada 14 11 25 154 179 7.8% 6.1% 14.0% 86.0%
Family Service WIC Program 90 85 175 426 601 15.0% 14.1% 29.1% 70.9%
Family Strides/Torrington WIC
Program 35 63 98 195 293 11.9% 21.5% 33.4% 66.6%
Fargo/Cass Public Health 132 115 247 438 685 19.3% 16.8% 36.1% 63.9%
Faribault County Public Health
Service 11 5 16 53 69 15.9% 7.2% 23.2% 76.8%
Fayette Co. Community Action
Agency 63 5 68 683 751 8.4% 0.7% 9.1% 90.9%
Fayette County Health Dept 21 11 32 136 168 12.5% 6.5% 19.0% 81.0%
Fayette County WIC Program 17 3 20 229 249 6.8% 1.2% 8.0% 92.0%
FE Warren WIC Program 27 5 32 49 81 33.3% 6.2% 39.5% 60.5%
Fergus County WIC 18 4 22 33 55 32.7% 7.3% 40.0% 60.0%
Fillmore County Public Health 21 7 28 68 96 21.9% 7.3% 29.2% 70.8%
First Choice Community
Healthcare 343 167 510 1,590 2,100 16.3% 8.0% 24.3% 75.7%
First District Health Unit 88 35 123 294 417 21.1% 8.4% 29.5% 70.5%
First Nations Community
Healthsource 78 31 109 215 324 24.1% 9.6% 33.6% 66.4%
FIVE SANDOVAL INDIAN, NM 18 13 31 32 63 28.6% 20.6% 49.2% 50.8%
Flagler County Health
Department 83 54 137 328 465 17.8% 11.6% 29.5% 70.5%
Flathead County WIC Program 114 42 156 246 402 28.4% 10.4% 38.8% 61.2%
Fleming County Health
Department 7 14 21 101 122 5.7% 11.5% 17.2% 82.8%
Floyd County Health
Department 13 48 61 399 460 2.8% 10.4% 13.3% 86.7%
Floyd County Health Dept 43 37 80 340 420 10.2% 8.8% 19.0% 81.0%
Fond du Lac County Health
Dept 87 25 112 329 441 19.7% 5.7% 25.4% 74.6%
Fond du Lac Tribal Council 14 7 21 62 83 16.9% 8.4% 25.3% 74.7%
Ford County Health Dept 44 106 150 410 560 7.9% 18.9% 26.8% 73.2%
Ford Iroquois Public Health 12 17 29 185 214 5.6% 7.9% 13.6% 86.4%
Forest County Health
Department 5 2 7 43 50 10.0% 4.0% 14.0% 86.0%
Forsyth County Health
Department 365 617 982 1,575 2,557 14.3% 24.1% 38.4% 61.6%
Fort Belknap Community
Council 9 9 18 56 74 12.2% 12.2% 24.3% 75.7%
Fort Peck Tribal Health Dept 9 8 17 135 152 5.9% 5.3% 11.2% 88.8%
Framingham/Waltham WIC 117 284 401 573 974 12.0% 29.2% 41.2% 58.8%
Franciscan Medical Group 345 164 509 1,064 1,573 21.9% 10.4% 32.4% 67.6%
Franklin County Dept of Health 61 22 83 435 518 11.8% 4.2% 16.0% 84.0%
Franklin County Health
Department 44 72 116 251 367 12.0% 19.6% 31.6% 68.4%
Franklin County Health
Department 31 33 64 300 364 8.5% 9.1% 17.6% 82.4%
Franklin County Health Dept 19 12 31 138 169 11.2% 7.1% 18.3% 81.7%
Franklin County WIC Program 718 378 1,096 8,004 9,100 7.9% 4.2% 12.0% 88.0%
Franklin Parish Health
Unit/WINNSBORO 4 6 10 225 235 1.7% 2.6% 4.3% 95.7%
Franklin Williamson Bi-County 56 27 83 656 739 7.6% 3.7% 11.2% 88.8%
Franklin/Hampshire/North
Quabbin WIC 124 74 198 340 538 23.0% 13.8% 36.8% 63.2%
*To maintain the privacy of participants, Local Agencies with less than 30 Infant Participants are not published. 36

Fully Breastfed Partially Breastfed Total Breastfed Fully Formula-Fed
Local Agency
Infant Data
Participation Data Statistical Data
Fully Breastfed Partially Breastfed Total Breastfed Fully Formula-Fed Total Infants
Frederick County WIC Program 109 252 361 716 1,077 10.1% 23.4% 33.5% 66.5%
Freeborn County 35 19 54 163 217 16.1% 8.8% 24.9% 75.1%
Fremont County WIC Program 9 2 11 40 51 17.6% 3.9% 21.6% 78.4%
Fremont County WIC Program 21 6 27 99 126 16.7% 4.8% 21.4% 78.6%
Fresno County EOC 705 809 1,514 5,545 7,059 10.0% 11.5% 21.4% 78.6%
Frio County WIC 6 40 46 161 207 2.9% 19.3% 22.2% 77.8%
Ft. Bend Family Health Center
Inc. 133 796 929 797 1,726 7.7% 46.1% 53.8% 46.2%
Fulmont Community Action
Agency, Inc 35 55 90 476 566 6.2% 9.7% 15.9% 84.1%
Fulton County Health
Department 28 13 41 164 205 13.7% 6.3% 20.0% 80.0%
Fulton County Health Dept 12 11 23 111 134 9.0% 8.2% 17.2% 82.8%
Fulton/Henry County WIC
Program 52 14 66 325 391 13.3% 3.6% 16.9% 83.1%
Gadsden County Health
Department 35 68 103 328 431 8.1% 15.8% 23.9% 76.1%
Gallatin County WIC Program 111 18 129 134 263 42.2% 6.8% 49.0% 51.0%
Gallia County WIC Program 31 7 38 215 253 12.3% 2.8% 15.0% 85.0%
Galveston Co. Health District 67 445 512 1,143 1,655 4.0% 26.9% 30.9% 69.1%
Gardner Family Care Corp. 488 535 1,023 1,400 2,423 20.1% 22.1% 42.2% 57.8%
Garfield County Nursing
Services 77 47 124 155 279 27.6% 16.8% 44.4% 55.6%
Garrard County Health
Department 16 16 32 122 154 10.4% 10.4% 20.8% 79.2%
Garrett County WIC Program 34 14 48 142 190 17.9% 7.4% 25.3% 74.7%
Gasconade County Health
Department 10 4 14 69 83 12.0% 4.8% 16.9% 83.1%
Gaston County Health
Department 113 231 344 1,140 1,484 7.6% 15.6% 23.2% 76.8%
Gateway District 40 72 112 435 547 7.3% 13.2% 20.5% 79.5%
Geary County Health Dept 41 31 72 246 318 12.9% 9.7% 22.6% 77.4%
Geauga County WIC Program 38 7 45 162 207 18.4% 3.4% 21.7% 78.3%
Genesee County Health Dept 221 161 382 2,683 3,065 7.2% 5.3% 12.5% 87.5%
Gibson County Area Rehab
Centers, Inc. 18 9 27 231 258 7.0% 3.5% 10.5% 89.5%
Gila County Health Dept 48 33 81 196 277 17.3% 11.9% 29.2% 70.8%
Gila River Indian Community 31 19 50 246 296 10.5% 6.4% 16.9% 83.1%
Glenn County Health Services 88 31 119 146 265 33.2% 11.7% 44.9% 55.1%
Gloucester County WIC
Program 87 110 197 745 942 9.2% 11.7% 20.9% 79.1%
Gonzales Community Health
Center, Women's Health and
WIC 28 55 83 234 317 8.8% 17.4% 26.2% 73.8%
Goodhue CHS 22 18 40 151 191 11.5% 9.4% 20.9% 79.1%
Goodwin Community Health 133 30 163 475 638 20.8% 4.7% 25.5% 74.5%
Goshen County WIC Program 29 9 38 62 100 29.0% 9.0% 38.0% 62.0%
Gouverneur Hospital (NYCHHC) 20 265 285 744 1,029 1.9% 25.8% 27.7% 72.3%
Grace Hill Neighborhood Health
Centers, Inc. 162 249 411 1,625 2,036 8.0% 12.2% 20.2% 79.8%
Grady Health System 48 238 286 1,079 1,365 3.5% 17.4% 21.0% 79.0%
Graham County Dept Health 38 24 62 208 270 14.1% 8.9% 23.0% 77.0%
Graham County Health
Department 7 - 7 66 73 9.6% 0.0% 9.6% 90.4%
Graham County Health Dept 7 3 10 33 43 16.3% 7.0% 23.3% 76.7%
Grand County Public Health
Nursing 13 3 16 15 31 41.9% 9.7% 51.6% 48.4%
Grand Traverse County Health
Dept 183 41 224 360 584 31.3% 7.0% 38.4% 61.6%
Grant County Health
Department 10 2 12 26 38 26.3% 5.3% 31.6% 68.4%
Grant County Health Dept 36 11 47 175 222 16.2% 5.0% 21.2% 78.8%
Grant County WIC Program 4 3 7 24 31 12.9% 9.7% 22.6% 77.4%
Grant Parish Health
Unit/COLFAX 9 6 15 134 149 6.0% 4.0% 10.1% 89.9%
Granville-Vance District Health
Department 38 72 110 639 749 5.1% 9.6% 14.7% 85.3%
Graves County Health
Department 36 50 86 258 344 10.5% 14.5% 25.0% 75.0%
Grays Harbor County Public H &
SS 79 35 114 233 347 22.8% 10.1% 32.9% 67.1%
Grayson County Health Dept. 113 135 248 684 932 12.1% 14.5% 26.6% 73.4%
Great Lakes Inter Tribal 26 19 45 198 243 10.7% 7.8% 18.5% 81.5%
Greater Baden WIC Program 83 311 394 869 1,263 6.6% 24.6% 31.2% 68.8%
Green County Health Dept 18 14 32 109 141 12.8% 9.9% 22.7% 77.3%
Green River District 147 91 238 1,419 1,657 8.9% 5.5% 14.4% 85.6%
Greene County Health
Department 15 24 39 141 180 8.3% 13.3% 21.7% 78.3%
Greene County Health
Department 6 4 10 88 98 6.1% 4.1% 10.2% 89.8%
Greene County WIC Program 82 16 98 515 613 13.4% 2.6% 16.0% 84.0%
Greenlee County Health Dept 9 9 18 44 62 14.5% 14.5% 29.0% 71.0%
Greenup County Health
Department 11 39 50 198 248 4.4% 15.7% 20.2% 79.8%
Grundy County Health
Department 19 20 39 149 188 10.1% 10.6% 20.7% 79.3%
Grundy County Health Dept 13 2 15 64 79 16.5% 2.5% 19.0% 81.0%
Guam WIC Program 301 282 583 1,280 1,863 16.2% 15.1% 31.3% 68.7%
Guernsey County WIC Program 16 2 18 269 287 5.6% 0.7% 6.3% 93.7%
Guiding Right, Inc. 48 26 74 268 342 14.0% 7.6% 21.6% 78.4%
Guilford County Health
Department 397 590 987 2,341 3,328 11.9% 17.7% 29.7% 70.3%
Gunnison County Public Health 21 6 27 22 49 42.9% 12.2% 55.1% 44.9%
Hamilton County Regional
Office 195 278 473 1,578 2,051 9.5% 13.6% 23.1% 76.9%
Hamilton County WIC Program 356 216 572 5,018 5,590 6.4% 3.9% 10.2% 89.8%
Hamilton Health Ctrs 171 76 247 1,292 1,539 11.1% 4.9% 16.0% 84.0%
Hamlin County WIC Program 21 1 22 21 43 48.8% 2.3% 51.2% 48.8%
Hampton District 120 105 225 733 958 12.5% 11.0% 23.5% 76.5%
Hancock County Health
Department 17 4 21 79 100 17.0% 4.0% 21.0% 79.0%
Hancock Regional Hospital 31 13 44 218 262 11.8% 5.0% 16.8% 83.2%
*To maintain the privacy of participants, Local Agencies with less than 30 Infant Participants are not published. 37

Fully Breastfed Partially Breastfed Total Breastfed Fully Formula-Fed
Local Agency
Infant Data
Participation Data Statistical Data
Fully Breastfed Partially Breastfed Total Breastfed Fully Formula-Fed Total Infants
Hardin County Health
Department 33 80 113 255 368 9.0% 21.7% 30.7% 69.3%
Harford County WIC Program 232 137 369 1,163 1,532 15.1% 8.9% 24.1% 75.9%
Harlem Hospital (NYCHHC) 76 478 554 777 1,331 5.7% 35.9% 41.6% 58.4%
Harnett County Health
Department 45 90 135 612 747 6.0% 12.0% 18.1% 81.9%
Harney County Health
Department 8 5 13 24 37 21.6% 13.5% 35.1% 64.9%
Harris County Public Health &
Environmental Service 1,189 5,873 7,062 8,534 15,596 7.6% 37.7% 45.3% 54.7%
Harrison County Health Dept 14 3 17 66 83 16.9% 3.6% 20.5% 79.5%
Harrison County WIC Program 7 1 8 86 94 7.4% 1.1% 8.5% 91.5%
Harrison Medical Center 12 3 15 53 68 17.6% 4.4% 22.1% 77.9%
Hartford Health Department 71 404 475 1,423 1,898 3.7% 21.3% 25.0% 75.0%
Harvey County Health Dept 43 30 73 147 220 19.5% 13.6% 33.2% 66.8%
Hawaii WIC Program 175 88 263 574 837 20.9% 10.5% 31.4% 68.6%
Hawkeye Area Comm Action
Prog 141 122 263 932 1,195 11.8% 10.2% 22.0% 78.0%
Haywood County Health
Department 60 28 88 261 349 17.2% 8.0% 25.2% 74.8%
Health and Nutrition Service 77 90 167 739 906 8.5% 9.9% 18.4% 81.6%
Health Delivery, Inc. 28 44 72 450 522 5.4% 8.4% 13.8% 86.2%
Health Reach Network 215 24 239 639 878 24.5% 2.7% 27.2% 72.8%
Health Service Region 11 89 224 313 902 1,215 7.3% 18.4% 25.8% 74.2%
Health Service Regions 4/5 217 585 802 1,411 2,213 9.8% 26.4% 36.2% 63.8%
Health Service Regions 6/5
South 181 941 1,122 1,290 2,412 7.5% 39.0% 46.5% 53.5%
Health Services Regions 9/10 54 90 144 423 567 9.5% 15.9% 25.4% 74.6%
Henderson County Health
Department 100 89 189 366 555 18.0% 16.0% 34.1% 65.9%
Henderson County Health
Department 13 12 25 139 164 7.9% 7.3% 15.2% 84.8%
Hendricks Co. Health
Foundation Inc. 40 25 65 345 410 9.8% 6.1% 15.9% 84.1%
Hennepin County Human Srvcs
& Public Health Dept 629 1,577 2,206 2,876 5,082 12.4% 31.0% 43.4% 56.6%
Henrico District 149 86 235 1,139 1,374 10.8% 6.3% 17.1% 82.9%
Henry County Health Center 24 5 29 127 156 15.4% 3.2% 18.6% 81.4%
Henry County Health
Department 38 18 56 223 279 13.6% 6.5% 20.1% 79.9%
Hernando County Health
Department 105 69 174 756 930 11.3% 7.4% 18.7% 81.3%
Hertford County Health
Department 11 11 22 185 207 5.3% 5.3% 10.6% 89.4%
HHWP County WIC Program 72 23 95 625 720 10.0% 3.2% 13.2% 86.8%
Hickory County Dept 8 1 9 40 49 16.3% 2.0% 18.4% 81.6%
Highland County WIC Program 38 5 43 329 372 10.2% 1.3% 11.6% 88.4%
Highlands County Health
Department 81 82 163 484 647 12.5% 12.7% 25.2% 74.8%
Hildalgo County Health &
human Services Dept. 803 9,852 10,655 4,416 15,071 5.3% 65.4% 70.7% 29.3%
Hill Country Memorial Hospital,
WIC Administration Office 73 181 254 269 523 14.0% 34.6% 48.6% 51.4%
Hill County WIC Program 13 9 22 70 92 14.1% 9.8% 23.9% 76.1%
Hillcrest Family Services 103 71 174 761 935 11.0% 7.6% 18.6% 81.4%
Hillsborough County Health
Department 775 1,438 2,213 6,432 8,645 9.0% 16.6% 25.6% 74.4%
Hocking County WIC Program 26 4 30 169 199 13.1% 2.0% 15.1% 84.9%
Hoke County Health Department 30 60 90 367 457 6.6% 13.1% 19.7% 80.3%
Holmes County WIC Program 33 5 38 118 156 21.2% 3.2% 24.4% 75.6%
Holyyoke/Chicopee WIC 132 142 274 855 1,129 11.7% 12.6% 24.3% 75.7%
Home Nursing Agency, WIC
Program 251 19 270 846 1,116 22.5% 1.7% 24.2% 75.8%
Honolulu WIC Program 126 48 174 224 398 31.7% 12.1% 43.7% 56.3%
Hood River County Health 72 44 116 86 202 35.6% 21.8% 57.4% 42.6%
Hoosier Uplands Economic
Development Corporation 6 3 9 55 64 9.4% 4.7% 14.1% 85.9%
Hope Center 76 39 115 269 384 19.8% 10.2% 29.9% 70.1%
Hopi Tribe 24 18 42 50 92 26.1% 19.6% 45.7% 54.3%
Hopkins County Health
Department 35 19 54 306 360 9.7% 5.3% 15.0% 85.0%
Horizon Community Health
Board (Douglas County) 34 16 50 128 178 19.1% 9.0% 28.1% 71.9%
Horizon Community Health
Board (Pope County) 14 3 17 48 65 21.5% 4.6% 26.2% 73.8%
Horizon Community Health
Board (Stevens County) 13 3 16 35 51 25.5% 5.9% 31.4% 68.6%
Hospital of St. Raphael 141 481 622 1,422 2,044 6.9% 23.5% 30.4% 69.6%
Houston (City of) Dept. of
Health & Human Services 1,030 8,057 9,087 8,015 17,102 6.0% 47.1% 53.1% 46.9%
Houston County PHNS 12 5 17 45 62 19.4% 8.1% 27.4% 72.6%
Howard County Public Hlth Dept 6 1 7 44 51 11.8% 2.0% 13.7% 86.3%
Howard County WIC Program 132 274 406 501 907 14.6% 30.2% 44.8% 55.2%
Howard University Hospital 32 72 104 506 610 5.2% 11.8% 17.0% 83.0%
Howell County Hlth Dept.
(SCPHSG) 81 13 94 308 402 20.1% 3.2% 23.4% 76.6%
Hualapai Tribe 4 3 7 32 39 10.3% 7.7% 17.9% 82.1%
Hudson River Healthcare, Inc 155 303 458 778 1,236 12.5% 24.5% 37.1% 62.9%
Hughes County WIC Program 12 1 13 76 89 13.5% 1.1% 14.6% 85.4%
Human Services, Inc. 56 25 81 430 511 11.0% 4.9% 15.9% 84.1%
Huron County Health Dept 27 8 35 158 193 14.0% 4.1% 18.1% 81.9%
Hyde County Health Department 3 3 6 29 35 8.6% 8.6% 17.1% 82.9%
Iberia Parish Health Unit/NEW
IBERIA 18 23 41 674 715 2.5% 3.2% 5.7% 94.3%
Iberville Parish Health
Unit/PLAQUEMINE 3 6 9 283 292 1.0% 2.1% 3.1% 96.9%
Indian Hlth Ctr. Santa Clara 202 123 325 341 666 30.3% 18.5% 48.8% 51.2%
Indian River County Health
Department 115 141 256 501 757 15.2% 18.6% 33.8% 66.2%
Indiana Health Centers, Inc. 188 185 373 2,103 2,476 7.6% 7.5% 15.1% 84.9%
Indiana University Health
Bloomington, Inc. 100 57 157 547 704 14.2% 8.1% 22.3% 77.7%
Indiana University Health White
Memorial Hospital, Inc. 23 25 48 213 261 8.8% 9.6% 18.4% 81.6%
*To maintain the privacy of participants, Local Agencies with less than 30 Infant Participants are not published. 38

Fully Breastfed Partially Breastfed Total Breastfed Fully Formula-Fed
Local Agency
Infant Data
Participation Data Statistical Data
Fully Breastfed Partially Breastfed Total Breastfed Fully Formula-Fed Total Infants
Ingham County Health Dept 233 236 469 1,422 1,891 12.3% 12.5% 24.8% 75.2%
Inland Behavioral and Health
Services, Inc. 61 39 100 304 404 15.1% 9.7% 24.8% 75.2%
Institute for Family Health 20 314 334 531 865 2.3% 36.3% 38.6% 61.4%
Intercare Community Health 605 281 886 2,324 3,210 18.8% 8.8% 27.6% 72.4%
Interlocal Comm Action
Program 32 13 45 229 274 11.7% 4.7% 16.4% 83.6%
Inter-Tribal, NV 42 30 72 214 286 14.7% 10.5% 25.2% 74.8%
Ionia County Health Dept 74 23 97 333 430 17.2% 5.3% 22.6% 77.4%
Iredell County Health
Department 79 102 181 743 924 8.5% 11.0% 19.6% 80.4%
Iron County Health Dept 7 3 10 91 101 6.9% 3.0% 9.9% 90.1%
Isanti County PHS 41 32 73 147 220 18.6% 14.5% 33.2% 66.8%
Island County Public Health 58 15 73 110 183 31.7% 8.2% 39.9% 60.1%
ISLETA PUEBLO,NM 41 16 57 130 187 21.9% 8.6% 30.5% 69.5%
Itasca County Public Health 51 11 62 172 234 21.8% 4.7% 26.5% 73.5%
Jackson County Health
Department 459 114 573 833 1,406 32.6% 8.1% 40.8% 59.2%
Jackson County Health
Department 79 41 120 277 397 19.9% 10.3% 30.2% 69.8%
Jackson County Health
Department 31 23 54 135 189 16.4% 12.2% 28.6% 71.4%
Jackson County Health
Department 62 71 133 692 825 7.5% 8.6% 16.1% 83.9%
Jackson County Health Dept 165 80 245 967 1,212 13.6% 6.6% 20.2% 79.8%
Jackson County Public Health
Service 15 11 26 79 105 14.3% 10.5% 24.8% 75.2%
Jackson County WIC Program 20 3 23 215 238 8.4% 1.3% 9.7% 90.3%
Jackson County WIC Program 3 1 4 27 31 9.7% 3.2% 12.9% 87.1%
Jackson Parish Health
Unit/JONESBORO 7 4 11 146 157 4.5% 2.5% 7.0% 93.0%
Jamaica Hospital 48 845 893 1,364 2,257 2.1% 37.4% 39.6% 60.4%
Jamaica Plain WIC 37 150 187 320 507 7.3% 29.6% 36.9% 63.1%
Jasper County Health Dept 19 13 32 143 175 10.9% 7.4% 18.3% 81.7%
Jasper-Newton County Public
Health District 34 82 116 445 561 6.1% 14.6% 20.7% 79.3%
Jefferson County Health
Department 36 17 53 98 151 23.8% 11.3% 35.1% 64.9%
Jefferson County Health
Department 50 39 89 270 359 13.9% 10.9% 24.8% 75.2%
Jefferson County Health Dept 10 4 14 43 57 17.5% 7.0% 24.6% 75.4%
Jefferson County Health Dept 22 11 33 168 201 10.9% 5.5% 16.4% 83.6%
Jefferson County Health Dept 19 19 38 229 267 7.1% 7.1% 14.2% 85.8%
Jefferson County Public Health 40 5 45 35 80 50.0% 6.3% 56.3% 43.8%
Jefferson County WIC Program 22 16 38 347 385 5.7% 4.2% 9.9% 90.1%
Jefferson Cty Dept of Health &
Env 323 129 452 1,114 1,566 20.6% 8.2% 28.9% 71.1%
Jefferson Davis Parish Health
Unit/JENNINGS 15 15 30 290 320 4.7% 4.7% 9.4% 90.6%
Jefferson Parish Health
Unit/METAIRIE 34 70 104 681 785 4.3% 8.9% 13.2% 86.8%
Jefferson-Franklin CAC 121 44 165 885 1,050 11.5% 4.2% 15.7% 84.3%
Jersey City Dept Hum Res WIC
Program 132 733 865 1,394 2,259 5.8% 32.4% 38.3% 61.7%
Jersey County Health Dept 15 5 20 91 111 13.5% 4.5% 18.0% 82.0%
Jessamine County Health
Department 48 99 147 271 418 11.5% 23.7% 35.2% 64.8%
JoDaviess County Health Dept 65 28 93 246 339 19.2% 8.3% 27.4% 72.6%
John's Hopkins WIC Program 175 472 647 1,736 2,383 7.3% 19.8% 27.2% 72.8%
Johnson County Community
Health Services 87 47 134 268 402 21.6% 11.7% 33.3% 66.7%
Johnson County Health
Department 14 28 42 211 253 5.5% 11.1% 16.6% 83.4%
Johnson County Health Dept 265 243 508 1,147 1,655 16.0% 14.7% 30.7% 69.3%
Johnson County Health Dept 71 40 111 542 653 10.9% 6.1% 17.0% 83.0%
Johnson County Public Health 119 116 235 435 670 17.8% 17.3% 35.1% 64.9%
Johnson Nichols Health Clinic,
Inc. 24 21 45 239 284 8.5% 7.4% 15.8% 84.2%
Johnston County Health
Department 75 149 224 816 1,040 7.2% 14.3% 21.5% 78.5%
Jones County Health
Department 8 5 13 68 81 9.9% 6.2% 16.0% 84.0%
Joplin City Health Dept 145 57 202 776 978 14.8% 5.8% 20.7% 79.3%
Joseph P. Addabbo Family
Health Center 33 385 418 798 1,216 2.7% 31.7% 34.4% 65.6%
Josephine County Health
Department 207 33 240 359 599 34.6% 5.5% 40.1% 59.9%
Juneau County Health Dept 40 15 55 202 257 15.6% 5.8% 21.4% 78.6%
Kalamazoo County Human
Services 126 78 204 498 702 17.9% 11.1% 29.1% 70.9%
Kalamazoo Family Health
Center 111 71 182 703 885 12.5% 8.0% 20.6% 79.4%
Kalihi Palama Health Center 97 133 230 596 826 11.7% 16.1% 27.8% 72.2%
Kanabec County PHNS 16 5 21 68 89 18.0% 5.6% 23.6% 76.4%
Kandiyohi CHS 38 71 109 208 317 12.0% 22.4% 34.4% 65.6%
Kankakee County Health
Department 63 56 119 615 734 8.6% 7.6% 16.2% 83.8%
Kansas City Health Department 18 16 34 106 140 12.9% 11.4% 24.3% 75.7%
Kapiolani Health Center WIC 126 52 178 266 444 28.4% 11.7% 40.1% 59.9%
Kauai WIC Program 89 29 118 260 378 23.5% 7.7% 31.2% 68.8%
Kendall County Health & Human 40 47 87 226 313 12.8% 15.0% 27.8% 72.2%
Kenosha County Dept of Human
Svs 126 60 186 812 998 12.6% 6.0% 18.6% 81.4%
Kent County Health Dept 642 470 1,112 3,602 4,714 13.6% 10.0% 23.6% 76.4%
Kentucky River District 54 104 158 870 1,028 5.3% 10.1% 15.4% 84.6%
Kewaunee County Public Health
Department 12 4 16 55 71 16.9% 5.6% 22.5% 77.5%
Keweenaw Bay Indian
Community 7 4 11 52 63 11.1% 6.3% 17.5% 82.5%
Kings County Dept. of Public
Health 277 196 473 1,218 1,691 16.4% 11.6% 28.0% 72.0%
Kings County Hospital Center
(NYCHHC) 75 1,336 1,411 1,569 2,980 2.5% 44.8% 47.3% 52.7%
Kit Carson Cty Health & Hum
Serv 13 5 18 41 59 22.0% 8.5% 30.5% 69.5%
*To maintain the privacy of participants, Local Agencies with less than 30 Infant Participants are not published. 39

Fully Breastfed Partially Breastfed Total Breastfed Fully Formula-Fed
Local Agency
Infant Data
Participation Data Statistical Data
Fully Breastfed Partially Breastfed Total Breastfed Fully Formula-Fed Total Infants
Kitsap Community Resources 310 102 412 760 1,172 26.5% 8.7% 35.2% 64.8%
Klamath County Health
Department 122 30 152 433 585 20.9% 5.1% 26.0% 74.0%
Klickitat County Health
Department 43 11 54 70 124 34.7% 8.9% 43.5% 56.5%
Knox County Health Department 30 29 59 275 334 9.0% 8.7% 17.7% 82.3%
Knox County Health Dept 45 18 63 271 334 13.5% 5.4% 18.9% 81.1%
Knox County Regional Office 255 211 466 1,491 1,957 13.0% 10.8% 23.8% 76.2%
Knox County WIC Program 38 7 45 280 325 11.7% 2.2% 13.8% 86.2%
Kodiak Area Native Association 34 19 53 60 113 30.1% 16.8% 46.9% 53.1%
Kokua Kalihi Valley Health
Center 51 41 92 269 361 14.1% 11.4% 25.5% 74.5%
Kona WIC Program 102 35 137 207 344 29.7% 10.2% 39.8% 60.2%
Koochiching County Public
Health 14 2 16 47 63 22.2% 3.2% 25.4% 74.6%
La Clinica De Los Campesino 29 23 52 177 229 12.7% 10.0% 22.7% 77.3%
LA Biomed Research Inst @
Harbor UCLA Med Ctr 2,438 2,994 5,432 11,219 16,651 14.6% 18.0% 32.6% 67.4%
La Clinica De La Raza, Inc. 258 243 501 450 951 27.1% 25.6% 52.7% 47.3%
La Crosse County Health Dept 76 39 115 402 517 14.7% 7.5% 22.2% 77.8%
Laclede County Health Dept 54 18 72 252 324 16.7% 5.6% 22.2% 77.8%
Lafayette Parish Health
Unit/LAFAYETTE 58 77 135 1,081 1,216 4.8% 6.3% 11.1% 88.9%
Lafourche Parish Health
Unit/THIBODAUX 27 28 55 640 695 3.9% 4.0% 7.9% 92.1%
LaGrange County Health Dept 16 11 27 92 119 13.4% 9.2% 22.7% 77.3%
Lake Co. Hlth Dept. & Comm.
Hlth. Ctr. 265 783 1,048 2,239 3,287 8.1% 23.8% 31.9% 68.1%
Lake County Health Department 172 288 460 1,252 1,712 10.0% 16.8% 26.9% 73.1%
Lake County Health Department 8 3 11 36 47 17.0% 6.4% 23.4% 76.6%
Lake County Health Dept 20 3 23 27 50 40.0% 6.0% 46.0% 54.0%
Lake County WIC Program 27 13 40 86 126 21.4% 10.3% 31.7% 68.3%
Lake County WIC Program 77 40 117 850 967 8.0% 4.1% 12.1% 87.9%
Lake County WIC Program 9 2 11 34 45 20.0% 4.4% 24.4% 75.6%
Lake Cumberland District 160 183 343 1,598 1,941 8.2% 9.4% 17.7% 82.3%
Lake Region District Health Unit 10 9 19 88 107 9.3% 8.4% 17.8% 82.2%
Lane County WIC Program 754 138 892 954 1,846 40.8% 7.5% 48.3% 51.7%
Lapeer County Health Dept 90 39 129 388 517 17.4% 7.5% 25.0% 75.0%
Laramie County WIC Program 92 31 123 404 527 17.5% 5.9% 23.3% 76.7%
Laredo (City of) Health
Department 152 1,859 2,011 3,055 5,066 3.0% 36.7% 39.7% 60.3%
Larimer Cty Dept of Health &
Env 231 74 305 634 939 24.6% 7.9% 32.5% 67.5%
Las Animas/Huerfano Health
Dept 14 4 18 102 120 11.7% 3.3% 15.0% 85.0%
LaSalle County Health Dept 61 45 106 497 603 10.1% 7.5% 17.6% 82.4%
Lasalle Parish Health Unit/JENA 3 4 7 86 93 3.2% 4.3% 7.5% 92.5%
Laurel County Health
Department 63 38 101 387 488 12.9% 7.8% 20.7% 79.3%
Lawrence County Health Dept 40 14 54 188 242 16.5% 5.8% 22.3% 77.7%
Lawrence County Health Dept 7 8 15 89 104 6.7% 7.7% 14.4% 85.6%
Lawrence County Health Dept. 15 18 33 119 152 9.9% 11.8% 21.7% 78.3%
Lawrence County WIC Program 20 10 30 483 513 3.9% 1.9% 5.8% 94.2%
Lawrence WIC 123 439 562 934 1,496 8.2% 29.3% 37.6% 62.4%
Lawrence WIC Program 18 9 27 67 94 19.1% 9.6% 28.7% 71.3%
Leavenworth Co. Health Dept 43 18 61 273 334 12.9% 5.4% 18.3% 81.7%
Lee County Health Department 32 13 45 150 195 16.4% 6.7% 23.1% 76.9%
Lee County Health Department 457 953 1,410 2,911 4,321 10.6% 22.1% 32.6% 67.4%
Lee County Health Department 19 65 84 429 513 3.7% 12.7% 16.4% 83.6%
Leech Lake Band of Ojibwe 6 13 19 133 152 3.9% 8.6% 12.5% 87.5%
Leeward WIC Program 140 123 263 648 911 15.4% 13.5% 28.9% 71.1%
Lenoir Community Health
Center 30 50 80 421 501 6.0% 10.0% 16.0% 84.0%
Lenowisco District 29 15 44 565 609 4.8% 2.5% 7.2% 92.8%
Leon County Health Department 189 255 444 1,544 1,988 9.5% 12.8% 22.3% 77.7%
LeSueur County Public Health
Services 24 12 36 85 121 19.8% 9.9% 29.8% 70.2%
Lewis and Clark County WIC 62 17 79 178 257 24.1% 6.6% 30.7% 69.3%
Lewis County Health
Department 9 22 31 103 134 6.7% 16.4% 23.1% 76.9%
Lewis County Health Dept 8 3 11 54 65 12.3% 4.6% 16.9% 83.1%
Lewis County Public Health and
Social Services 103 45 148 396 544 18.9% 8.3% 27.2% 72.8%
Lexington-Fayette Co.Health
Dept 214 491 705 1,212 1,917 11.2% 25.6% 36.8% 63.2%
Licking County WIC Program 83 14 97 787 884 9.4% 1.6% 11.0% 89.0%
Lincoln Community Health
Center 148 314 462 1,452 1,914 7.7% 16.4% 24.1% 75.9%
Lincoln County Health and
Human Services 92 37 129 180 309 29.8% 12.0% 41.7% 58.3%
Lincoln County Health
Department 14 9 23 79 102 13.7% 8.8% 22.5% 77.5%
Lincoln County Health
Department 49 39 88 347 435 11.3% 9.0% 20.2% 79.8%
Lincoln County Health
Department 17 23 40 161 201 8.5% 11.4% 19.9% 80.1%
Lincoln County Health Dept 27 14 41 239 280 9.6% 5.0% 14.6% 85.4%
Lincoln County Public Health 6 3 9 26 35 17.1% 8.6% 25.7% 74.3%
Lincoln County Public Health
Department 13 2 15 17 32 40.6% 6.3% 46.9% 53.1%
Lincoln County WIC Program 26 5 31 59 90 28.9% 5.6% 34.4% 65.6%
Lincoln County WIC Program 6 3 9 26 35 17.1% 8.6% 25.7% 74.3%
Lincoln Hospital 71 976 1,047 880 1,927 3.7% 50.6% 54.3% 45.7%
Lincoln Parish Health
Unit/RUSTON 18 17 35 288 323 5.6% 5.3% 10.8% 89.2%
Lincoln Trail District 126 870 996 1,140 2,136 5.9% 40.7% 46.6% 53.4%
Lincoln/Lancaster County
Health Dept 101 125 226 611 837 12.1% 14.9% 27.0% 73.0%
Linn County Health Department 236 52 288 581 869 27.2% 6.0% 33.1% 66.9%
*To maintain the privacy of participants, Local Agencies with less than 30 Infant Participants are not published. 40

Fully Breastfed Partially Breastfed Total Breastfed Fully Formula-Fed
Local Agency
Infant Data
Participation Data Statistical Data
Fully Breastfed Partially Breastfed Total Breastfed Fully Formula-Fed Total Infants
Linn County Health Dept 10 4 14 71 85 11.8% 4.7% 16.5% 83.5%
Linn County Health Dept (SEK) 10 6 16 45 61 16.4% 9.8% 26.2% 73.8%
Little Peoples Head Start 10 7 17 35 52 19.2% 13.5% 32.7% 67.3%
Little Sandy District 23 42 65 307 372 6.2% 11.3% 17.5% 82.5%
Livingston County Department
of Health 63 27 90 287 377 16.7% 7.2% 23.9% 76.1%
Livingston County Health Center 13 2 15 85 100 13.0% 2.0% 15.0% 85.0%
Livingston County Health
Department 19 6 25 176 201 9.5% 3.0% 12.4% 87.6%
Livingston County Health Dept 99 41 140 412 552 17.9% 7.4% 25.4% 74.6%
Livingston Parrish Health
Unit/Livingston 37 20 57 683 740 5.0% 2.7% 7.7% 92.3%
Logan County Health
Department 17 6 23 118 141 12.1% 4.3% 16.3% 83.7%
Logan County WIC Program 20 8 28 222 250 8.0% 3.2% 11.2% 88.8%
Long Island Jewish Medical
Center 46 266 312 317 629 7.3% 42.3% 49.6% 50.4%
Longview Wellness Centers,
Inc. dba Wellness Pointe 149 388 537 935 1,472 10.1% 26.4% 36.5% 63.5%
Lorain County WIC Program 119 27 146 1,344 1,490 8.0% 1.8% 9.8% 90.2%
Lord Fairfax District 118 133 251 783 1,034 11.4% 12.9% 24.3% 75.7%
Los Barrios Unidos Community
Clinic 93 506 599 537 1,136 8.2% 44.5% 52.7% 47.3%
Loudoun District 56 209 265 389 654 8.6% 32.0% 40.5% 59.5%
Louisville-Jefferson Metro H. D. 366 1,869 2,235 2,310 4,545 8.1% 41.1% 49.2% 50.8%
Lowell WIC 101 192 293 969 1,262 8.0% 15.2% 23.2% 76.8%
LSUHCSD EA Conway Medical
Center 1 3 4 88 92 1.1% 3.3% 4.3% 95.7%
LSUHSC Hlth Care Services
Division 8 35 43 443 486 1.6% 7.2% 8.8% 91.2%
LSUHSC Shreveport Pediatrics 25 77 102 1,657 1,759 1.4% 4.4% 5.8% 94.2%
Lucas County WIC Program 311 111 422 3,065 3,487 8.9% 3.2% 12.1% 87.9%
Luce-Mackinac-Alger Dist
Health Dept 27 11 38 150 188 14.4% 5.9% 20.2% 79.8%
Lummi Nation 12 6 18 39 57 21.1% 10.5% 31.6% 68.4%
Lutheran Family Health Center 27 1,136 1,163 2,003 3,166 0.9% 35.9% 36.7% 63.3%
Lyman County WIC Program 3 3 6 45 51 5.9% 5.9% 11.8% 88.2%
Lyon County Health Dept 36 32 68 204 272 13.2% 11.8% 25.0% 75.0%
Lyon County Human Services 49 20 69 182 251 19.5% 8.0% 27.5% 72.5%
Lyon County Public Health,
Southwest Health and Human
Services 23 30 53 160 213 10.8% 14.1% 24.9% 75.1%
Macomb County Health Dept 184 216 400 2,409 2,809 6.6% 7.7% 14.2% 85.8%
Macon County Health
Department 36 32 68 151 219 16.4% 14.6% 31.1% 68.9%
Macon County Health Dept 10 5 15 63 78 12.8% 6.4% 19.2% 80.8%
Macon Health Department 44 35 79 680 759 5.8% 4.6% 10.4% 89.6%
Macoupin County Health Dept 16 19 35 180 215 7.4% 8.8% 16.3% 83.7%
Madera County DPH 474 264 738 1,016 1,754 27.0% 15.1% 42.1% 57.9%
Madison County Health
Department 30 14 44 94 138 21.7% 10.1% 31.9% 68.1%
Madison County Health
Department 57 134 191 423 614 9.3% 21.8% 31.1% 68.9%
Madison County Health Dept 18 2 20 89 109 16.5% 1.8% 18.3% 81.7%
Madison County Health Dept 49 75 124 696 820 6.0% 9.1% 15.1% 84.9%
Madison County Health Dept. 70 51 121 716 837 8.4% 6.1% 14.5% 85.5%
Madison County WIC Program 21 6 27 201 228 9.2% 2.6% 11.8% 88.2%
Madison Parish Health
Unit/TALLULAH 4 4 8 183 191 2.1% 2.1% 4.2% 95.8%
Magoffin County Health
Department 4 21 25 113 138 2.9% 15.2% 18.1% 81.9%
Mahoning County WIC Program 83 55 138 1,256 1,394 6.0% 3.9% 9.9% 90.1%
Maimonides Medical Center 168 857 1,025 1,099 2,124 7.9% 40.3% 48.3% 51.7%
Malheur County Health
Department 37 37 74 235 309 12.0% 12.0% 23.9% 76.1%
Manatee County Health
Department 205 347 552 1,364 1,916 10.7% 18.1% 28.8% 71.2%
Maniilag Association WIC 22 23 45 130 175 12.6% 13.1% 25.7% 74.3%
Manitowoc County Health Dept 50 20 70 262 332 15.1% 6.0% 21.1% 78.9%
Marana Health Center 226 271 497 1,106 1,603 14.1% 16.9% 31.0% 69.0%
Margaret Hudson Program 50 33 83 268 351 14.2% 9.4% 23.6% 76.4%
Maricopa County Dept Public
Health 1,632 3,362 4,994 12,395 17,389 9.4% 19.3% 28.7% 71.3%
Marin County HHS, Montecito 308 128 436 178 614 50.2% 20.8% 71.0% 29.0%
Marinette County Health Dept 27 5 32 153 185 14.6% 2.7% 17.3% 82.7%
Marion County Health
Department 482 150 632 1,301 1,933 24.9% 7.8% 32.7% 67.3%
Marion County Health
Department 233 366 599 1,610 2,209 10.5% 16.6% 27.1% 72.9%
Marion County Health Dept 16 8 24 49 73 21.9% 11.0% 32.9% 67.1%
Marion County Health Dept 39 17 56 284 340 11.5% 5.0% 16.5% 83.5%
Marion County Health Dept 519 1,107 1,626 6,883 8,509 6.1% 13.0% 19.1% 80.9%
Marion County Health Dept &
Home Health Agency 22 11 33 185 218 10.1% 5.0% 15.1% 84.9%
Marion County Public Health 58 35 93 372 465 12.5% 7.5% 20.0% 80.0%
Marion County WIC Program 34 10 44 473 517 6.6% 1.9% 8.5% 91.5%
Mariposa Community Health
Center 48 76 124 421 545 8.8% 13.9% 22.8% 77.2%
Marquette County Health Dept 63 23 86 238 324 19.4% 7.1% 26.5% 73.5%
Marshall County Health
Department 25 15 40 157 197 12.7% 7.6% 20.3% 79.7%
Marshall County Health
Department 10 4 14 32 46 21.7% 8.7% 30.4% 69.6%
Marshall County Health Dept 46 24 70 257 327 14.1% 7.3% 21.4% 78.6%
Marshall County Health Dept 4 3 7 46 53 7.5% 5.7% 13.2% 86.8%
Martin County Health
Department 102 138 240 416 656 15.5% 21.0% 36.6% 63.4%
Martin County Health
Department 5 19 24 121 145 3.4% 13.1% 16.6% 83.4%
Martin County Public Health
Service 18 12 30 84 114 15.8% 10.5% 26.3% 73.7%
Martin-Tyrell-Washington 11 20 31 277 308 3.6% 6.5% 10.1% 89.9%
Mary Mahoney Health Center 15 6 21 118 139 10.8% 4.3% 15.1% 84.9%
Mary's Center for Maternal &
Child Care 31 278 309 354 663 4.7% 41.9% 46.6% 53.4%
*To maintain the privacy of participants, Local Agencies with less than 30 Infant Participants are not published. 41

Fully Breastfed Partially Breastfed Total Breastfed Fully Formula-Fed
Local Agency
Infant Data
Participation Data Statistical Data
Fully Breastfed Partially Breastfed Total Breastfed Fully Formula-Fed Total Infants
Mason County Health
Department 11 4 15 73 88 12.5% 4.5% 17.0% 83.0%
Matagorda County Hospital
District 24 40 64 320 384 6.3% 10.4% 16.7% 83.3%
Maternal & Family Hlth Svcs,
Inc. 1,789 416 2,205 10,814 13,019 13.7% 3.2% 16.9% 83.1%
Mattawa Community Medical
Clinic 9 22 31 23 54 16.7% 40.7% 57.4% 42.6%
MATURA Action Corp 47 38 85 380 465 10.1% 8.2% 18.3% 81.7%
Maui Family Support Services 9 3 12 27 39 23.1% 7.7% 30.8% 69.2%
Maui WIC Program 98 43 141 228 369 26.6% 11.7% 38.2% 61.8%
McDonald County Health Dept 24 22 46 171 217 11.1% 10.1% 21.2% 78.8%
McDonough County Health
Department 24 15 39 104 143 16.8% 10.5% 27.3% 72.7%
McHenry County Health
Department 141 202 343 635 978 14.4% 20.7% 35.1% 64.9%
McLean County Health
Department 88 101 189 531 720 12.2% 14.0% 26.3% 73.8%
McLeod County PHNS 40 9 49 114 163 24.5% 5.5% 30.1% 69.9%
Meade County Health
Department 18 4 22 60 82 22.0% 4.9% 26.8% 73.2%
Meade County WIC Program 16 5 21 52 73 21.9% 6.8% 28.8% 71.2%
Mecklenburg County Health
Department 407 1,057 1,464 4,233 5,697 7.1% 18.6% 25.7% 74.3%
Medina County Health
Department 53 34 87 323 410 12.9% 8.3% 21.2% 78.8%
Medina County WIC Program 71 21 92 386 478 14.9% 4.4% 19.2% 80.8%
Meeker County PHNS 30 5 35 96 131 22.9% 3.8% 26.7% 73.3%
Meigs County WIC Program 17 3 20 154 174 9.8% 1.7% 11.5% 88.5%
Memorial Health Systems 175 201 376 1,348 1,724 10.2% 11.7% 21.8% 78.2%
Memphis Shelby County Health
Dept 207 917 1,124 7,501 8,625 2.4% 10.6% 13.0% 87.0%
Menard County Health
Department 9 5 14 36 50 18.0% 10.0% 28.0% 72.0%
Menominee Tribal Clinic 9 11 20 80 100 9.0% 11.0% 20.0% 80.0%
Merced County Community
Action Board 624 575 1,199 2,323 3,522 17.7% 16.3% 34.0% 66.0%
Mercer County Health
Department 20 24 44 156 200 10.0% 12.0% 22.0% 78.0%
Mercer County Health Dept 10 7 17 57 74 13.5% 9.5% 23.0% 77.0%
Meriden WIC Program 109 175 284 635 919 11.9% 19.0% 30.9% 69.1%
MeritCare Union Hospital 7 4 11 31 42 16.7% 9.5% 26.2% 73.8%
Mesa County Health Dept 131 43 174 511 685 19.1% 6.3% 25.4% 74.6%
Metro-Davidson Health
Department 521 1,045 1,566 3,560 5,126 10.2% 20.4% 30.6% 69.4%
Miami County Health Dept 18 11 29 118 147 12.2% 7.5% 19.7% 80.3%
Miami County WIC Program 54 9 63 413 476 11.3% 1.9% 13.2% 86.8%
MID MI Comm Action Agency 102 29 131 325 456 22.4% 6.4% 28.7% 71.3%
Mid Michigan District Health
Dept 182 69 251 706 957 19.0% 7.2% 26.2% 73.8%
MidCoast Maine Community
Action Program 120 17 137 395 532 22.6% 3.2% 25.8% 74.2%
Mid-Cumberland Region 704 663 1,367 4,563 5,930 11.9% 11.2% 23.1% 76.9%
Middletown Community Health
Center 12 12 24 128 152 7.9% 7.9% 15.8% 84.2%
Mid-Iowa Comm Action 185 156 341 1,042 1,383 13.4% 11.3% 24.7% 75.3%
Mid-Ohio Valley WIC Agency 116 54 170 1,076 1,246 9.3% 4.3% 13.6% 86.4%
Mid-Sioux Opportunities 70 45 115 287 402 17.4% 11.2% 28.6% 71.4%
Milam County Health
Department 27 17 44 181 225 12.0% 7.6% 19.6% 80.4%
Mile Square Health Center 15 22 37 179 216 6.9% 10.2% 17.1% 82.9%
Mille Lacs Band of Ojibwe WIC
Program 2 5 7 58 65 3.1% 7.7% 10.8% 89.2%
Mille Lacs County Community
and Veterans Services 31 11 42 100 142 21.8% 7.7% 29.6% 70.4%
Miller County Health Center 21 9 30 151 181 11.6% 5.0% 16.6% 83.4%
Minnehaha County WIC
Program 102 120 222 835 1,057 9.6% 11.4% 21.0% 79.0%
Mississippi County Health Dept 7 1 8 141 149 4.7% 0.7% 5.4% 94.6%
Missoula County WIC Program 171 47 218 288 506 33.8% 9.3% 43.1% 56.9%
MLK Heritage Health Center 44 41 85 673 758 5.8% 5.4% 11.2% 88.8%
Mohave County WIC Program 138 149 287 847 1,134 12.2% 13.1% 25.3% 74.7%
Molokai Community Health
Center 25 33 58 80 138 18.1% 23.9% 42.0% 58.0%
Mon Valley Comm Hlth SVCS,
Inc. 200 25 225 1,008 1,233 16.2% 2.0% 18.2% 81.8%
Moniteau County Health Center 8 6 14 59 73 11.0% 8.2% 19.2% 80.8%
Mono County Health
Department 20 17 37 29 66 30.3% 25.8% 56.1% 43.9%
Monongalia County Health
Department 168 57 225 1,250 1,475 11.4% 3.9% 15.3% 84.7%
Monroe County Health
Department 49 83 132 189 321 15.3% 25.9% 41.1% 58.9%
Monroe County Health
Department 13 5 18 72 90 14.4% 5.6% 20.0% 80.0%
Monroe County Health
Department 199 284 483 1,735 2,218 9.0% 12.8% 21.8% 78.2%
Monroe County Health
Department 7 3 10 35 45 15.6% 6.7% 22.2% 77.8%
Monroe County Health Dept 35 15 50 177 227 15.4% 6.6% 22.0% 78.0%
Monroe County Health Dept 99 56 155 667 822 12.0% 6.8% 18.9% 81.1%
Monroe County Health Dept 5 5 10 41 51 9.8% 9.8% 19.6% 80.4%
Monroe County WIC Program 11 3 14 93 107 10.3% 2.8% 13.1% 86.9%
Montefiore Medical Center 81 905 986 1,829 2,815 2.9% 32.1% 35.0% 65.0%
Monterey County 1,112 872 1,984 2,205 4,189 26.5% 20.8% 47.4% 52.6%
Montezuma County Health Dept 37 8 45 76 121 30.6% 6.6% 37.2% 62.8%
Montgomery Co. (Community
Clinic Inc.) WIC Program 681 2,995 3,676 3,012 6,688 10.2% 44.8% 55.0% 45.0%
Montgomery County Health 20 7 27 151 178 11.2% 3.9% 15.2% 84.8%
Montgomery County Health
Department 27 38 65 184 249 10.8% 15.3% 26.1% 73.9%
Montgomery County Health
Department 13 50 63 210 273 4.8% 18.3% 23.1% 76.9%
Montgomery County Health
Dept 14 2 16 73 89 15.7% 2.2% 18.0% 82.0%
*To maintain the privacy of participants, Local Agencies with less than 30 Infant Participants are not published. 42

Fully Breastfed Partially Breastfed Total Breastfed Fully Formula-Fed
Local Agency
Infant Data
Participation Data Statistical Data
Fully Breastfed Partially Breastfed Total Breastfed Fully Formula-Fed Total Infants
Montgomery County WIC
Program 367 104 471 2,964 3,435 10.7% 3.0% 13.7% 86.3%
Montrose County Nursing
Service 37 29 66 176 242 15.3% 12.0% 27.3% 72.7%
Moody County WIC Program 3 1 4 29 33 9.1% 3.0% 12.1% 87.9%
Moore County Health
Department 30 43 73 415 488 6.1% 8.8% 15.0% 85.0%
Morehouse Parish Health
Unit/BASTROP 5 7 12 275 287 1.7% 2.4% 4.2% 95.8%
Morgan County Health Center 21 3 24 112 136 15.4% 2.2% 17.6% 82.4%
Morgan County Health Dept 14 12 26 172 198 7.1% 6.1% 13.1% 86.9%
Morgan Hospital & Medical
Center 29 14 43 309 352 8.2% 4.0% 12.2% 87.8%
Morris Heights Health Center 24 789 813 753 1,566 1.5% 50.4% 51.9% 48.1%
Morrisania Diagnostic and
Treatment Center (NYCHHC) 96 562 658 819 1,477 6.5% 38.1% 44.5% 55.5%
Morrison County Public Health 33 8 41 138 179 18.4% 4.5% 22.9% 77.1%
Morton Health Center 19 27 46 231 277 6.9% 9.7% 16.6% 83.4%
Moses Lake Community Health
Center 160 132 292 516 808 19.8% 16.3% 36.1% 63.9%
Moultrie County Health Dept 6 3 9 61 70 8.6% 4.3% 12.9% 87.1%
Mount Rogers District 97 54 151 1,070 1,221 7.9% 4.4% 12.4% 87.6%
Mountain Park Health Center 744 1,257 2,001 3,939 5,940 12.5% 21.2% 33.7% 66.3%
Mower County PHNS 40 51 91 216 307 13.0% 16.6% 29.6% 70.4%
MS Choctaw Reservation Health
Center - 11 11 192 203 0.0% 5.4% 5.4% 94.6%
Mt. Vernon Neighborhood
Health Center, Inc. 21 278 299 349 648 3.2% 42.9% 46.1% 53.9%
Muhlenberg County Health
Department 19 7 26 210 236 8.1% 3.0% 11.0% 89.0%
Multicare Health System 706 269 975 2,135 3,110 22.7% 8.6% 31.4% 68.6%
Multnomah County Health
Department 1,261 439 1,700 2,572 4,272 29.5% 10.3% 39.8% 60.2%
Municipality of Anchorage 262 153 415 1,017 1,432 18.3% 10.7% 29.0% 71.0%
Murray County Public Health,
Southwest Health and Human
Services 8 2 10 31 41 19.5% 4.9% 24.4% 75.6%
Muskegon County Health Dept 249 114 363 1,410 1,773 14.0% 6.4% 20.5% 79.5%
Muskingum County WIC
Program 46 13 59 594 653 7.0% 2.0% 9.0% 91.0%
N Cent Org Reg For Total
Health 1,427 495 1,922 14,084 16,006 8.9% 3.1% 12.0% 88.0%
N Cent PA Reg Plng/Dev
Commission 175 30 205 718 923 19.0% 3.3% 22.2% 77.8%
N Hudson Community Action
Corp. 265 826 1,091 1,139 2,230 11.9% 37.0% 48.9% 51.1%
N.E.W. Community Clinic 165 96 261 1,077 1,338 12.3% 7.2% 19.5% 80.5%
Napa County Hlth & Human
Srvcs 256 141 397 345 742 34.5% 19.0% 53.5% 46.5%
Nash County Health Department 26 77 103 727 830 3.1% 9.3% 12.4% 87.6%
Nassau County Department of
Health 98 1,202 1,300 1,807 3,107 3.2% 38.7% 41.8% 58.2%
Nassau County Health
Department 131 90 221 499 720 18.2% 12.5% 30.7% 69.3%
Natchitoches Parish Health
Unit/NATCHITOCHES 7 10 17 212 229 3.1% 4.4% 7.4% 92.6%
Native American Health Center,
Inc. 183 111 294 209 503 36.4% 22.1% 58.4% 41.6%
Native Health 150 62 212 503 715 21.0% 8.7% 29.7% 70.3%
Native Village of EYAK - Valdez 26 7 33 27 60 43.3% 11.7% 55.0% 45.0%
Natrona County WIC Program 67 21 88 323 411 16.3% 5.1% 21.4% 78.6%
Navajo County WIC Program 80 51 131 279 410 19.5% 12.4% 32.0% 68.0%
Navajo Nation WIC Program 449 538 987 1,447 2,434 18.4% 22.1% 40.6% 59.4%
NC-E. Cherokee Reservation 21 19 40 94 134 15.7% 14.2% 29.9% 70.1%
NE KS Multi-County Board of
Health 34 18 52 229 281 12.1% 6.4% 18.5% 81.5%
NE Nebraska Family Health
Services 42 20 62 199 261 16.1% 7.7% 23.8% 76.2%
NE Tri-County Health District 74 9 83 154 237 31.2% 3.8% 35.0% 65.0%
Near North Health Service 120 746 866 1,404 2,270 5.3% 32.9% 38.1% 61.9%
Neighborhood Health Clinics,
Inc 283 235 518 2,435 2,953 9.6% 8.0% 17.5% 82.5%
Neighborhood Services (admi) 138 79 217 941 1,158 11.9% 6.8% 18.7% 81.3%
Neosho County Health Dept 17 12 29 103 132 12.9% 9.1% 22.0% 78.0%
Nevada County DPH 165 38 203 128 331 49.8% 11.5% 61.3% 38.7%
New Bedford WIC 88 126 214 816 1,030 8.5% 12.2% 20.8% 79.2%
New Hanover County Health
Department 143 93 236 802 1,038 13.8% 9.0% 22.7% 77.3%
New Hope Service, Inc. 96 79 175 994 1,169 8.2% 6.8% 15.0% 85.0%
New Madrid County Health Dept 5 2 7 132 139 3.6% 1.4% 5.0% 95.0%
New Opportunities 61 46 107 339 446 13.7% 10.3% 24.0% 76.0%
New Orleans Health Department 54 133 187 1,687 1,874 2.9% 7.1% 10.0% 90.0%
New River District 78 37 115 513 628 12.4% 5.9% 18.3% 81.7%
New York Downtown Hospital 10 81 91 263 354 2.8% 22.9% 25.7% 74.3%
New York Presbyterian Medical
Center 102 1,162 1,264 1,306 2,570 4.0% 45.2% 49.2% 50.8%
Newark WIC Program 132 1,094 1,226 1,777 3,003 4.4% 36.4% 40.8% 59.2%
Newton County Health Dept 75 31 106 311 417 18.0% 7.4% 25.4% 74.6%
Nicollet County 24 18 42 93 135 17.8% 13.3% 31.1% 68.9%
Nimiipu Health 14 5 19 33 52 26.9% 9.6% 36.5% 63.5%
Noble County WIC Program 14 3 17 78 95 14.7% 3.2% 17.9% 82.1%
Nobles County Community
Services 23 57 80 159 239 9.6% 23.8% 33.5% 66.5%
Nodaway County Health Center 17 4 21 73 94 18.1% 4.3% 22.3% 77.7%
Nooksack Indian Tribe 14 1 15 28 43 32.6% 2.3% 34.9% 65.1%
Norfolk District 108 100 208 1,841 2,049 5.3% 4.9% 10.2% 89.8%
Norman County 6 5 11 37 48 12.5% 10.4% 22.9% 77.1%
North Brooklyn Health Network
(NYCHHC) 46 529 575 1,012 1,587 2.9% 33.3% 36.2% 63.8%
North Caddo Medical Center 5 6 11 142 153 3.3% 3.9% 7.2% 92.8%
North Central Bronx Hospital
(NYCHHC) 31 830 861 1,040 1,901 1.6% 43.7% 45.3% 54.7%
*To maintain the privacy of participants, Local Agencies with less than 30 Infant Participants are not published. 43

Fully Breastfed Partially Breastfed Total Breastfed Fully Formula-Fed
Local Agency
Infant Data
Participation Data Statistical Data
Fully Breastfed Partially Breastfed Total Breastfed Fully Formula-Fed Total Infants
North Central Community Action
Agencies, Inc. 62 55 117 642 759 8.2% 7.2% 15.4% 84.6%
North Central District 166 29 195 258 453 36.6% 6.4% 43.0% 57.0%
North Central District 30 185 215 364 579 5.2% 32.0% 37.1% 62.9%
North Central FL WIC Project 408 358 766 2,764 3,530 11.6% 10.1% 21.7% 78.3%
North Central Public Health
District 54 19 73 141 214 25.2% 8.9% 34.1% 65.9%
North Central WIC 139 122 261 670 931 14.9% 13.1% 28.0% 72.0%
North Country Children's Clinic 273 209 482 1,761 2,243 12.2% 9.3% 21.5% 78.5%
North County Health Services 925 357 1,282 1,007 2,289 40.4% 15.6% 56.0% 44.0%
North Iowa Community Action 77 51 128 529 657 11.7% 7.8% 19.5% 80.5%
North Lincoln Co WIC Program 16 3 19 31 50 32.0% 6.0% 38.0% 62.0%
North Shore WIC 159 423 582 1,068 1,650 9.6% 25.6% 35.3% 64.7%
North Slope Borough 19 18 37 70 107 17.8% 16.8% 34.6% 65.4%
North Suburban WIC 116 198 314 449 763 15.2% 26.0% 41.2% 58.8%
North TX Home Hlth Serv. Inc.
DBA Outreach Hlth Service 1,154 2,049 3,203 6,409 9,612 12.0% 21.3% 33.3% 66.7%
North W Comm Service Agency 35 10 45 198 243 14.4% 4.1% 18.5% 81.5%
Northampton County Health
Department 9 11 20 133 153 5.9% 7.2% 13.1% 86.9%
Northeast Colorado Health Dept 51 20 71 450 521 9.8% 3.8% 13.6% 86.4%
Northeast Comm Action Center 65 34 99 384 483 13.5% 7.0% 20.5% 79.5%
Northeast Nebraska Community
Action Partnership 96 93 189 626 815 11.8% 11.4% 23.2% 76.8%
Northeast Tennessee Region 248 163 411 1,751 2,162 11.5% 7.5% 19.0% 81.0%
Northeast Texas Public Health
District 485 1,023 1,508 3,065 4,573 10.6% 22.4% 33.0% 67.0%
Northeast Valley Hlth Corp. 2,754 2,928 5,682 7,339 13,021 21.2% 22.5% 43.6% 56.4%
Northeastern Rural Health
Clinics, Inc. 48 15 63 145 208 23.1% 7.2% 30.3% 69.7%
Northern Arapahoe 8 19 27 86 113 7.1% 16.8% 23.9% 76.1%
Northern Cheyenne Tribe (Lame
Deer) 21 19 40 65 105 20.0% 18.1% 38.1% 61.9%
Northern Essex WIC 76 83 159 468 627 12.1% 13.2% 25.4% 74.6%
Northern Kentucky District 238 565 803 1,848 2,651 9.0% 21.3% 30.3% 69.7%
Northwest Colorado VNA 34 12 46 87 133 25.6% 9.0% 34.6% 65.4%
Northwest Family Services, Inc. 265 314 579 3,372 3,951 6.7% 7.9% 14.7% 85.3%
Northwest MI Comm Health
Agency 184 40 224 485 709 26.0% 5.6% 31.6% 68.4%
Norton Sound Health Corp. 26 30 56 100 156 16.7% 19.2% 35.9% 64.1%
Norwescap WIC Program 138 261 399 734 1,133 12.2% 23.0% 35.2% 64.8%
Nutrition & Health Assoc. 84 63 147 757 904 9.3% 7.0% 16.3% 83.7%
NV Health Centers 598 1,727 2,325 5,154 7,479 8.0% 23.1% 31.1% 68.9%
Nye County WIC 27 23 50 194 244 11.1% 9.4% 20.5% 79.5%
Oak Orchard Community Health
Center 76 64 140 524 664 11.4% 9.6% 21.1% 78.9%
Oakland County WIC Program 394 445 839 3,408 4,247 9.3% 10.5% 19.8% 80.2%
Ocean County WIC Program 960 932 1,892 1,511 3,403 28.2% 27.4% 55.6% 44.4%
Oconto County Health Dept 16 8 24 108 132 12.1% 6.1% 18.2% 81.8%
Ogle County Health Dept 37 22 59 193 252 14.7% 8.7% 23.4% 76.6%
OK Cherokee Nation WIC
Program 139 59 198 1,743 1,941 7.2% 3.0% 10.2% 89.8%
OK Chickasaw Nation WIC
Program 140 33 173 734 907 15.4% 3.6% 19.1% 80.9%
OK Choctaw Nation WIC
Program 89 43 132 943 1,075 8.3% 4.0% 12.3% 87.7%
OK Citizen Potawatomi Nation 38 10 48 254 302 12.6% 3.3% 15.9% 84.1%
OK Inter-Tribal Council 23 9 32 171 203 11.3% 4.4% 15.8% 84.2%
OK Muscogee Creek Nation 62 15 77 482 559 11.1% 2.7% 13.8% 86.2%
OK Osage Nation 85 45 130 888 1,018 8.3% 4.4% 12.8% 87.2%
OK Otoe-Missouria Tribe 12 5 17 104 121 9.9% 4.1% 14.0% 86.0%
OK WCD Enterprises 109 65 174 789 963 11.3% 6.7% 18.1% 81.9%
Okaloosa County Health
Department 205 151 356 911 1,267 16.2% 11.9% 28.1% 71.9%
Okeechobee County Hlth
Department 65 48 113 269 382 17.0% 12.6% 29.6% 70.4%
Oklahoma City - County Health
Dept. 172 110 282 1,751 2,033 8.5% 5.4% 13.9% 86.1%
Oklahoma City Indian Clinic 33 32 65 142 207 15.9% 15.5% 31.4% 68.6%
Oklahoma State Dept. of Health 1,575 757 2,332 10,379 12,711 12.4% 6.0% 18.3% 81.7%
Oldham County Health
Department 25 56 81 112 193 13.0% 29.0% 42.0% 58.0%
Olmsted County Health Dept 135 166 301 466 767 17.6% 21.6% 39.2% 60.8%
Omaha Nation WIC - 3 3 63 66 0.0% 4.5% 4.5% 95.5%
Oneida Community Health
Center 20 6 26 116 142 14.1% 4.2% 18.3% 81.7%
Oneida County Health
Department 89 197 286 1,142 1,428 6.2% 13.8% 20.0% 80.0%
Oneida County Health Dept 20 10 30 105 135 14.8% 7.4% 22.2% 77.8%
Onondaga County Health
Department 234 284 518 2,065 2,583 9.1% 11.0% 20.1% 79.9%
Onslow County Health
Department 283 179 462 1,635 2,097 13.5% 8.5% 22.0% 78.0%
Open Door Family Medical
Center 92 227 319 156 475 19.4% 47.8% 67.2% 32.8%
Open Door Health Services, Inc. 77 29 106 632 738 10.4% 3.9% 14.4% 85.6%
Operation Threshold 152 139 291 944 1,235 12.3% 11.3% 23.6% 76.4%
Opportunities For Otsego, Inc. 31 21 52 185 237 13.1% 8.9% 21.9% 78.1%
Opportunity Development
Association of Williamsburg 566 669 1,235 258 1,493 37.9% 44.8% 82.7% 17.3%
Opportunity For Chenango, Inc. 42 18 60 271 331 12.7% 5.4% 18.1% 81.9%
Optimus Health Care WIC
Program 79 483 562 1,324 1,886 4.2% 25.6% 29.8% 70.2%
Orange County Health
Department 215 567 782 508 1,290 16.7% 44.0% 60.6% 39.4%
Orange County Health
Department 809 1,918 2,727 5,615 8,342 9.7% 23.0% 32.7% 67.3%
Oregon County Health Dept 13 2 15 99 114 11.4% 1.8% 13.2% 86.8%
Osage County Health
Department 8 1 9 35 44 18.2% 2.3% 20.5% 79.5%
Osborne County Health Dept 50 26 76 234 310 16.1% 8.4% 24.5% 75.5%
*To maintain the privacy of participants, Local Agencies with less than 30 Infant Participants are not published. 44

Fully Breastfed Partially Breastfed Total Breastfed Fully Formula-Fed
Local Agency
Infant Data
Participation Data Statistical Data
Fully Breastfed Partially Breastfed Total Breastfed Fully Formula-Fed Total Infants
Osceola County Hlth
Department 441 387 828 1,929 2,757 16.0% 14.0% 30.0% 70.0%
Oswego County Opportunities,
Inc 76 41 117 640 757 10.0% 5.4% 15.5% 84.5%
Otero County Health Dept 26 7 33 173 206 12.6% 3.4% 16.0% 84.0%
Ottawa County WIC Program 12 10 22 131 153 7.8% 6.5% 14.4% 85.6%
Otter Tail County Public Health 70 24 94 186 280 25.0% 8.6% 33.6% 66.4%
Ouachita Parish Health
Unit/MONROE 30 30 60 1,012 1,072 2.8% 2.8% 5.6% 94.4%
Outagamie Dept of Health &
Human Svs 95 47 142 502 644 14.8% 7.3% 22.0% 78.0%
Outer Cape WIC 23 20 43 62 105 21.9% 19.0% 41.0% 59.0%
Outpatient Medical Center 9 15 24 201 225 4.0% 6.7% 10.7% 89.3%
Ozark County Health Dept 13 3 16 41 57 22.8% 5.3% 28.1% 71.9%
Ozaukee County Department of
Health 47 15 62 187 249 18.9% 6.0% 24.9% 75.1%
PACE Community Action
Agency 21 25 46 401 447 4.7% 5.6% 10.3% 89.7%
Pacific County Public Health &
Human Services 25 9 34 70 104 24.0% 8.7% 32.7% 67.3%
Palm Beach County Health
Department 765 1,980 2,745 4,394 7,139 10.7% 27.7% 38.5% 61.5%
Pamlico County Health
Department 11 16 27 50 77 14.3% 20.8% 35.1% 64.9%
Panhandle Health District 351 78 429 598 1,027 34.2% 7.6% 41.8% 58.2%
Paris/Lamar County Health
Department 41 40 81 346 427 9.6% 9.4% 19.0% 81.0%
Parish of Ascension 86 137 223 1,621 1,844 4.7% 7.4% 12.1% 87.9%
Park County Nursing Service 15 4 19 22 41 36.6% 9.8% 46.3% 53.7%
Park Duvalle Health Center 16 134 150 258 408 3.9% 32.8% 36.8% 63.2%
Pasadena Public Health Dept. 259 184 443 553 996 26.0% 18.5% 44.5% 55.5%
Pasco County Health
Department 305 242 547 1,801 2,348 13.0% 10.3% 23.3% 76.7%
Pascua Yaqui Tribe 22 14 36 181 217 10.1% 6.5% 16.6% 83.4%
Passaic WIC Program 102 359 461 895 1,356 7.5% 26.5% 34.0% 66.0%
Paulding County WIC Program 13 1 14 98 112 11.6% 0.9% 12.5% 87.5%
PCHC, INC 83 219 302 1,055 1,357 6.1% 16.1% 22.3% 77.7%
Pemiscot County Health Center 6 6 12 221 233 2.6% 2.6% 5.2% 94.8%
Pender County Health
Department 21 32 53 253 306 6.9% 10.5% 17.3% 82.7%
Peninsula District 177 129 306 1,709 2,015 8.8% 6.4% 15.2% 84.8%
Pennington County WIC
Program 125 81 206 593 799 15.6% 10.1% 25.8% 74.2%
Pennyrile District 44 26 70 336 406 10.8% 6.4% 17.2% 82.8%
Peoples Family Health Services 48 33 81 281 362 13.3% 9.1% 22.4% 77.6%
People's Health Center 156 181 337 1,700 2,037 7.7% 8.9% 16.5% 83.5%
Peoples Regional Opportunity
Program 157 15 172 683 855 18.4% 1.8% 20.1% 79.9%
Peoria City Health Department 67 136 203 1,091 1,294 5.2% 10.5% 15.7% 84.3%
Perry County Health
Department 15 8 23 115 138 10.9% 5.8% 16.7% 83.3%
Perry County Health Dept 13 3 16 90 106 12.3% 2.8% 15.1% 84.9%
Pershing County 49 39 88 251 339 14.5% 11.5% 26.0% 74.0%
Person County Health
Department 17 17 34 219 253 6.7% 6.7% 13.4% 86.6%
Pettis County Health Center 63 34 97 300 397 15.9% 8.6% 24.4% 75.6%
Phelps County Health Dept 65 31 96 260 356 18.3% 8.7% 27.0% 73.0%
Piedmont District 41 32 73 571 644 6.4% 5.0% 11.3% 88.7%
Piedmont Health Services 165 280 445 657 1,102 15.0% 25.4% 40.4% 59.6%
Pierce County Public Hlth Dept 22 7 29 93 122 18.0% 5.7% 23.8% 76.2%
Pike County Health Department 22 60 82 523 605 3.6% 9.9% 13.6% 86.4%
Pike County Health Dept 19 7 26 75 101 18.8% 6.9% 25.7% 74.3%
Pike County Health Dept 16 2 18 106 124 12.9% 1.6% 14.5% 85.5%
Pike County WIC Program 17 3 20 217 237 7.2% 1.3% 8.4% 91.6%
Pima County Health Department 406 433 839 2,253 3,092 13.1% 14.0% 27.1% 72.9%
Pinal County Health Department 241 261 502 1,426 1,928 12.5% 13.5% 26.0% 74.0%
Pine County Public Health &
Human Services 23 6 29 116 145 15.9% 4.1% 20.0% 80.0%
Pinellas County Health
Department 473 609 1,082 3,176 4,258 11.1% 14.3% 25.4% 74.6%
Pipestone County Public Health,
Southwest Health and Human
Services 11 10 21 40 61 18.0% 16.4% 34.4% 65.6%
Pitt County Public Health Center 130 143 273 924 1,197 10.9% 11.9% 22.8% 77.2%
Pittsylvania-Danville District 35 29 64 584 648 5.4% 4.5% 9.9% 90.1%
Placer County Dept of HHS 309 140 449 526 975 31.7% 14.4% 46.1% 53.9%
Plainfield WIC Program 39 205 244 636 880 4.4% 23.3% 27.7% 72.3%
Planned Parenthood Mohawk
Hudson 90 65 155 603 758 11.9% 8.6% 20.4% 79.6%
Planned Parenthood of
Arkansas and Eastern OK 113 31 144 582 726 15.6% 4.3% 19.8% 80.2%
Planned Parenthood of Orange
& San Bernardino Counties 487 595 1,082 2,194 3,276 14.9% 18.2% 33.0% 67.0%
Platte County Health Dept 78 41 119 293 412 18.9% 10.0% 28.9% 71.1%
Platte County WIC 7 1 8 31 39 17.9% 2.6% 20.5% 79.5%
Plumas Rural Services, Inc. 32 11 43 42 85 37.6% 12.9% 50.6% 49.4%
Plymouth WIC 78 54 132 395 527 14.8% 10.2% 25.0% 75.0%
Pointe Coupee Parish Health
Unit/NEW ROADS 4 10 14 221 235 1.7% 4.3% 6.0% 94.0%
Polk County Health Center 48 14 62 163 225 21.3% 6.2% 27.6% 72.4%
Polk County Health Department 75 21 96 207 303 24.8% 6.9% 31.7% 68.3%
Polk County Health Department 523 891 1,414 3,545 4,959 10.5% 18.0% 28.5% 71.5%
Polk County Health Dept 45 12 57 108 165 27.3% 7.3% 34.5% 65.5%
Polk County Public Health 36 14 50 141 191 18.8% 7.3% 26.2% 73.8%
Portage County Comm Human
Service 61 12 73 201 274 22.3% 4.4% 26.6% 73.4%
Portage/Columbiana WIC
Program 158 37 195 1,123 1,318 12.0% 2.8% 14.8% 85.2%
*To maintain the privacy of participants, Local Agencies with less than 30 Infant Participants are not published. 45

Fully Breastfed Partially Breastfed Total Breastfed Fully Formula-Fed
Local Agency
Infant Data
Participation Data Statistical Data
Fully Breastfed Partially Breastfed Total Breastfed Fully Formula-Fed Total Infants
Portsmouth District 77 45 122 864 986 7.8% 4.6% 12.4% 87.6%
Pottawattamie County 88 69 157 517 674 13.1% 10.2% 23.3% 76.7%
Powell County Health
Department 9 32 41 92 133 6.8% 24.1% 30.8% 69.2%
Preble County WIC Program 40 4 44 213 257 15.6% 1.6% 17.1% 82.9%
Pregnancy Aid Outreach
Program 392 163 555 753 1,308 30.0% 12.5% 42.4% 57.6%
Price County Health Dept 12 4 16 55 71 16.9% 5.6% 22.5% 77.5%
Prince Georges County WIC
Program 337 1,338 1,675 2,652 4,327 7.8% 30.9% 38.7% 61.3%
Prince William District 103 484 587 1,300 1,887 5.5% 25.6% 31.1% 68.9%
ProAction of Steuben & Yates,
Inc 67 29 96 413 509 13.2% 5.7% 18.9% 81.1%
Prowers County Nursing Service 18 5 23 92 115 15.7% 4.3% 20.0% 80.0%
Public Health Area 1 108 357 465 1,813 2,278 4.7% 15.7% 20.4% 79.6%
Public Health Area 10 129 186 315 2,243 2,558 5.0% 7.3% 12.3% 87.7%
Public Health Area 11 140 249 389 3,169 3,558 3.9% 7.0% 10.9% 89.1%
Public Health Area 2 350 592 942 4,643 5,585 6.3% 10.6% 16.9% 83.1%
Public Health Area 3 61 126 187 1,767 1,954 3.1% 6.4% 9.6% 90.4%
Public Health Area 4 179 514 693 3,862 4,555 3.9% 11.3% 15.2% 84.8%
Public Health Area 5 273 470 743 2,746 3,489 7.8% 13.5% 21.3% 78.7%
Public Health Area 6 148 264 412 2,280 2,692 5.5% 9.8% 15.3% 84.7%
Public Health Area 7 45 94 139 1,246 1,385 3.2% 6.8% 10.0% 90.0%
Public Health Area 8 238 463 701 4,183 4,884 4.9% 9.5% 14.4% 85.6%
Public Health Area 9 158 220 378 2,218 2,596 6.1% 8.5% 14.6% 85.4%
Public Health Dept Menominee 54 19 73 294 367 14.7% 5.2% 19.9% 80.1%
Public Health Foundation
Enterprises, Inc. 10,473 11,460 21,933 34,762 56,695 18.5% 20.2% 38.7% 61.3%
Public Health Madison and
Dane County 278 236 514 1,071 1,585 17.5% 14.9% 32.4% 67.6%
Public Health Seattle & King
County 1,915 1,407 3,322 4,082 7,404 25.9% 19.0% 44.9% 55.1%
Public Health Solutions 256 4,222 4,478 4,626 9,104 2.8% 46.4% 49.2% 50.8%
Pueblo City/County Health Dept 235 54 289 828 1,117 21.0% 4.8% 25.9% 74.1%
PUEBLO OF SAN FELIPE, NM 17 11 28 37 65 26.2% 16.9% 43.1% 56.9%
PUEBLO OF ZUNI, NM 67 21 88 62 150 44.7% 14.0% 58.7% 41.3%
Puerto Rico WIC Program 3,615 4,702 8,317 31,060 39,377 9.2% 11.9% 21.1% 78.9%
Pulaski County Health Dept 83 15 98 324 422 19.7% 3.6% 23.2% 76.8%
Purchase District 102 76 178 555 733 13.9% 10.4% 24.3% 75.7%
Putnam County Health
Department 63 61 124 552 676 9.3% 9.0% 18.3% 81.7%
Putnam County Health
Department 21 76 97 134 231 9.1% 32.9% 42.0% 58.0%
Puyallup Tribal Health Authority 23 7 30 73 103 22.3% 6.8% 29.1% 70.9%
Queen Anne's County WIC
Program 43 28 71 243 314 13.7% 8.9% 22.6% 77.4%
Queens Hospital Center
(NYCHHC) 88 781 869 999 1,868 4.7% 41.8% 46.5% 53.5%
Quin County CHS 60 17 77 263 340 17.6% 5.0% 22.6% 77.4%
Quincy WIC 127 241 368 658 1,026 12.4% 23.5% 35.9% 64.1%
Ralls County Health Dept 4 - 4 28 32 12.5% 0.0% 12.5% 87.5%
Randolph County Health
Department 20 11 31 148 179 11.2% 6.1% 17.3% 82.7%
Randolph County Health
Department 99 173 272 693 965 10.3% 17.9% 28.2% 71.8%
Randolph County Health Dept 28 6 34 149 183 15.3% 3.3% 18.6% 81.4%
Randolph/Elkins Health 142 47 189 751 940 15.1% 5.0% 20.1% 79.9%
Rapides Parish Health
Unit/ALEXANDRIA 38 71 109 1,141 1,250 3.0% 5.7% 8.7% 91.3%
Rappahannock Area District 129 200 329 1,184 1,513 8.5% 13.2% 21.7% 78.3%
Rappahannock-Rapidan District 68 87 155 594 749 9.1% 11.6% 20.7% 79.3%
Ravalli County WIC Program 52 12 64 63 127 40.9% 9.4% 50.4% 49.6%
Ray County Health Dept 10 8 18 122 140 7.1% 5.7% 12.9% 87.1%
Red Lake Comprehensive
Health Services 5 10 15 167 182 2.7% 5.5% 8.2% 91.8%
Red River Parish Health
Unit/COUSHATTA - 1 1 133 134 0.0% 0.7% 0.7% 99.3%
Redwood County PHNS 15 4 19 95 114 13.2% 3.5% 16.7% 83.3%
Regence Health Network, Inc. 154 189 343 1,130 1,473 10.5% 12.8% 23.3% 76.7%
Region 1 224 213 437 3,155 3,592 6.2% 5.9% 12.2% 87.8%
Region 2 500 519 1,019 5,818 6,837 7.3% 7.6% 14.9% 85.1%
Region 3 481 552 1,033 6,002 7,035 6.8% 7.8% 14.7% 85.3%
Region 4 233 348 581 4,821 5,402 4.3% 6.4% 10.8% 89.2%
Region 5 98 166 264 2,475 2,739 3.6% 6.1% 9.6% 90.4%
Region 6 186 247 433 2,292 2,725 6.8% 9.1% 15.9% 84.1%
Region 7 502 389 891 3,586 4,477 11.2% 8.7% 19.9% 80.1%
Region 8 106 186 292 1,142 1,434 7.4% 13.0% 20.4% 79.6%
Reno County Health Dept 60 37 97 388 485 12.4% 7.6% 20.0% 80.0%
Renville County Public Health
Services, WIC 15 6 21 76 97 15.5% 6.2% 21.6% 78.4%
Research Foundation of SUNY
Stony Brook 57 246 303 797 1,100 5.2% 22.4% 27.5% 72.5%
Resource Center for Parents &
Children 249 118 367 457 824 30.2% 14.3% 44.5% 55.5%
Reynolds County Health Center 6 1 7 27 34 17.6% 2.9% 20.6% 79.4%
Rice County WIC Program
PHNS 44 82 126 222 348 12.6% 23.6% 36.2% 63.8%
Richland County 11 11 22 56 78 14.1% 14.1% 28.2% 71.8%
Richland Parish Health
Unit/RAYVILLE 2 5 7 219 226 0.9% 2.2% 3.1% 96.9%
Richmond City District 69 145 214 1,510 1,724 4.0% 8.4% 12.4% 87.6%
Richmond County Health
Department 17 40 57 375 432 3.9% 9.3% 13.2% 86.8%
Richmond University Medical
Center 48 244 292 547 839 5.7% 29.1% 34.8% 65.2%
Riley County Health Dept 164 99 263 626 889 18.4% 11.1% 29.6% 70.4%
Ripley County Health Center 15 3 18 105 123 12.2% 2.4% 14.6% 85.4%
Riverside-San Bernadino Indian
Hlth 46 13 59 140 199 23.1% 6.5% 29.6% 70.4%
Riverstone County WIC
Program 143 63 206 551 757 18.9% 8.3% 27.2% 72.8%
Roanoke District 80 87 167 789 956 8.4% 9.1% 17.5% 82.5%
Roberts County WIC Program 8 11 19 107 126 6.3% 8.7% 15.1% 84.9%
*To maintain the privacy of participants, Local Agencies with less than 30 Infant Participants are not published. 46

Fully Breastfed Partially Breastfed Total Breastfed Fully Formula-Fed
Local Agency
Infant Data
Participation Data Statistical Data
Fully Breastfed Partially Breastfed Total Breastfed Fully Formula-Fed Total Infants
Robeson County Health
Department 34 145 179 1,176 1,355 2.5% 10.7% 13.2% 86.8%
Rock County Public Health,
Southwest Health and Human
Services 8 7 15 50 65 12.3% 10.8% 23.1% 76.9%
Rock Island County Health Dept 58 206 264 850 1,114 5.2% 18.5% 23.7% 76.3%
Rockingham County Health
Department 27 43 70 491 561 4.8% 7.7% 12.5% 87.5%
Rockland County Health
Department 666 958 1,624 739 2,363 28.2% 40.5% 68.7% 31.3%
Rocky Boy WIC 4 5 9 62 71 5.6% 7.0% 12.7% 87.3%
Rolette County 6 5 11 49 60 10.0% 8.3% 18.3% 81.7%
Rosebud Sioux WIC Program 31 62 93 225 318 9.7% 19.5% 29.2% 70.8%
Roseland Community Hospital 14 286 300 710 1,010 1.4% 28.3% 29.7% 70.3%
Ross/Pickaway County WIC
Program 62 16 78 771 849 7.3% 1.9% 9.2% 90.8%
Rowan County Health
Department 55 117 172 693 865 6.4% 13.5% 19.9% 80.1%
Roxbury WIC 43 131 174 305 479 9.0% 27.3% 36.3% 63.7%
Rural Health Group Inc. 17 25 42 440 482 3.5% 5.2% 8.7% 91.3%
Rusk County Dept of HHS 12 3 15 64 79 15.2% 3.8% 19.0% 81.0%
Rutherford, Polk, McDowell
Health District 98 97 195 667 862 11.4% 11.3% 22.6% 77.4%
S.Central KS Coal Public Health 38 21 59 173 232 16.4% 9.1% 25.4% 74.6%
Sabine Parish Health
Unit/MANY 6 5 11 199 210 2.9% 2.4% 5.2% 94.8%
Sacramento County Dept. of
HHS 1,708 726 2,434 4,009 6,443 26.5% 11.3% 37.8% 62.2%
Saginaw County Health Dept 124 78 202 1,063 1,265 9.8% 6.2% 16.0% 84.0%
Saint Mary's Foundation 139 131 270 637 907 15.3% 14.4% 29.8% 70.2%
Saint Rose Dominican Hospitals 148 113 261 604 865 17.1% 13.1% 30.2% 69.8%
Saline County Health Dept 29 19 48 163 211 13.7% 9.0% 22.7% 77.3%
Saline County Health Dept 52 44 96 356 452 11.5% 9.7% 21.2% 78.8%
Salt Lake Valley Health Dept 1,323 876 2,199 3,635 5,834 22.7% 15.0% 37.7% 62.3%
Salt River Pima-Maricopa Indian
Community 16 10 26 125 151 10.6% 6.6% 17.2% 82.8%
Salud Medical Center-Yakima
Valley 459 232 691 1,165 1,856 24.7% 12.5% 37.2% 62.8%
Sampson County Health
Department 10 55 65 471 536 1.9% 10.3% 12.1% 87.9%
Samuel U Rodgers Health
Center, Inc. 94 151 245 471 716 13.1% 21.1% 34.2% 65.8%
San Angelo (City of) 146 127 273 806 1,079 13.5% 11.8% 25.3% 74.7%
San Antonio Metropolitan Health
District 963 2,104 3,067 8,212 11,279 8.5% 18.7% 27.2% 72.8%
San Benito Health Foundation 89 105 194 252 446 20.0% 23.5% 43.5% 56.5%
San Bernardino County DPH 2,610 1,735 4,345 12,764 17,109 15.3% 10.1% 25.4% 74.6%
San Carlos Apache Tribe 16 1 17 247 264 6.1% 0.4% 6.4% 93.6%
San Diego State University
Research Foundation 1,675 1,930 3,605 3,799 7,404 22.6% 26.1% 48.7% 51.3%
San Joaquin Public Hlth Srvcs 351 322 673 1,751 2,424 14.5% 13.3% 27.8% 72.2%
San Juan Basin Health Dept 76 7 83 141 224 33.9% 3.1% 37.1% 62.9%
San Juan County Health
Department 23 4 27 11 38 60.5% 10.5% 71.1% 28.9%
San Mateo County Health
System 672 682 1,354 1,434 2,788 24.1% 24.5% 48.6% 51.4%
San Patricio County Health
Department 53 112 165 541 706 7.5% 15.9% 23.4% 76.6%
San Ysidro Health Center 768 1,736 2,504 690 3,194 24.0% 54.4% 78.4% 21.6%
Sanailac County Health Dept 32 20 52 196 248 12.9% 8.1% 21.0% 79.0%
Sanders County WIC Program 13 5 18 38 56 23.2% 8.9% 32.1% 67.9%
Sandusky County WIC Program 35 8 43 346 389 9.0% 2.1% 11.1% 88.9%
Sangamon County Health Dept 91 114 205 904 1,109 8.2% 10.3% 18.5% 81.5%
Santa Barbara Co. PHD 1,172 600 1,772 1,765 3,537 33.1% 17.0% 50.1% 49.9%
Santa Clara County 1,221 838 2,059 2,505 4,564 26.8% 18.4% 45.1% 54.9%
Santa Rosa County Health
Department 128 46 174 616 790 16.2% 5.8% 22.0% 78.0%
SANTO DOMINGO,NM 11 4 15 22 37 29.7% 10.8% 40.5% 59.5%
Sarasota County Health
Department 292 180 472 917 1,389 21.0% 13.0% 34.0% 66.0%
Saratoga County EOC, Inc 57 46 103 380 483 11.8% 9.5% 21.3% 78.7%
Sauk County Dept of Health 74 23 97 225 322 23.0% 7.1% 30.1% 69.9%
Sawyer Co. Health & Human
Services 17 5 22 64 86 19.8% 5.8% 25.6% 74.4%
Schenectady County Public
Health Services 69 108 177 664 841 8.2% 12.8% 21.0% 79.0%
Schoharie County Community
Action Program 18 9 27 102 129 14.0% 7.0% 20.9% 79.1%
Schuyler County Health
Department 2 1 3 42 45 4.4% 2.2% 6.7% 93.3%
Scioto County WIC Program 41 12 53 577 630 6.5% 1.9% 8.4% 91.6%
Scotland County Health
Department 15 44 59 355 414 3.6% 10.6% 14.3% 85.7%
Scott County Health Dept 13 7 20 41 61 21.3% 11.5% 32.8% 67.2%
Scott County Health Dept 20 18 38 313 351 5.7% 5.1% 10.8% 89.2%
Scott County Health Dept 4 2 6 27 33 12.1% 6.1% 18.2% 81.8%
Scott-Carver-Dakota CAP
Agency 107 97 204 366 570 18.8% 17.0% 35.8% 64.2%
Scripps Mercy Hospital 514 331 845 775 1,620 31.7% 20.4% 52.2% 47.8%
Sea Mar 1,354 506 1,860 2,454 4,314 31.4% 11.7% 43.1% 56.9%
Seattle Indian Health Board 26 17 43 45 88 29.5% 19.3% 48.9% 51.1%
Sedgwick County Health Dept 414 428 842 2,959 3,801 10.9% 11.3% 22.2% 77.8%
Seeds of Health 63 75 138 436 574 11.0% 13.1% 24.0% 76.0%
Sek Multi-County Health Dept 9 6 15 46 61 14.8% 9.8% 24.6% 75.4%
Seminole County Health
Department 300 313 613 1,305 1,918 15.6% 16.3% 32.0% 68.0%
Seneca County WIC Program 42 13 55 340 395 10.6% 3.3% 13.9% 86.1%
Seneca Nation Health
Department 1 6 7 36 43 2.3% 14.0% 16.3% 83.7%
Seward County WIC Program 45 66 111 260 371 12.1% 17.8% 29.9% 70.1%
Shannon County Health Center 17 2 19 48 67 25.4% 3.0% 28.4% 71.6%
*To maintain the privacy of participants, Local Agencies with less than 30 Infant Participants are not published. 47
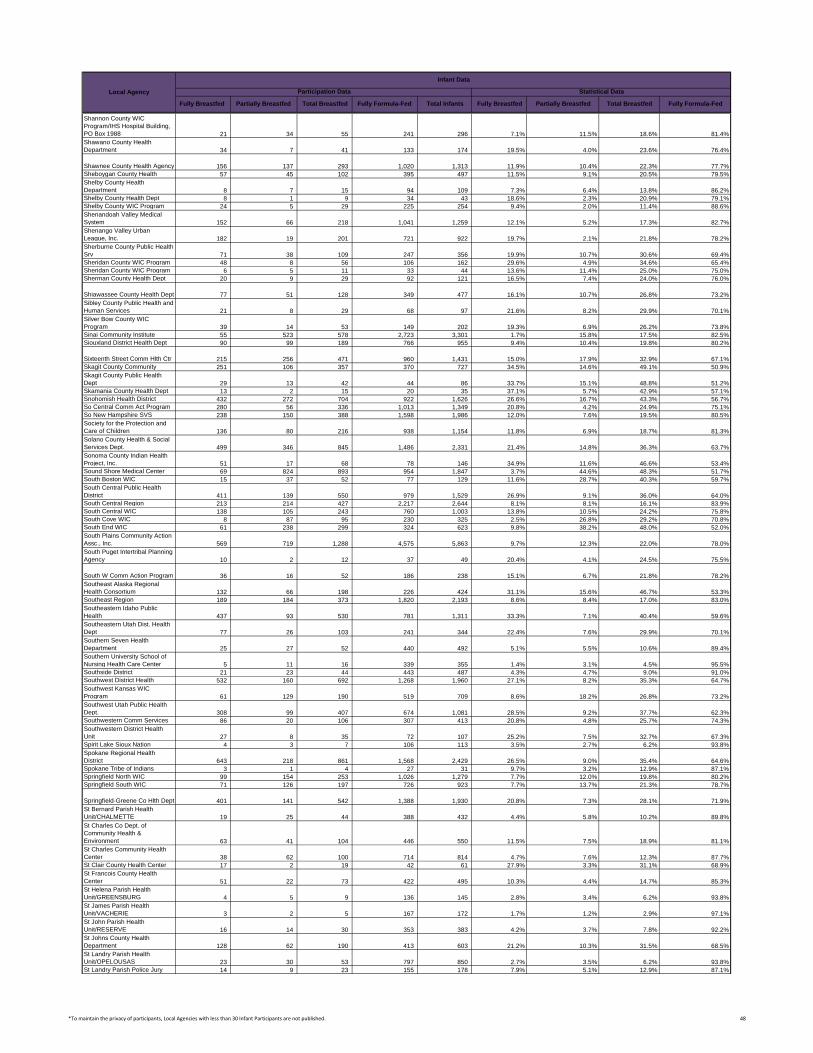
Fully Breastfed Partially Breastfed Total Breastfed Fully Formula-Fed
Local Agency
Infant Data
Participation Data Statistical Data
Fully Breastfed Partially Breastfed Total Breastfed Fully Formula-Fed Total Infants
Shannon County WIC
Program/IHS Hospital Building,
PO Box 1988 21 34 55 241 296 7.1% 11.5% 18.6% 81.4%
Shawano County Health
Department 34 7 41 133 174 19.5% 4.0% 23.6% 76.4%
Shawnee County Health Agency 156 137 293 1,020 1,313 11.9% 10.4% 22.3% 77.7%
Sheboygan County Health 57 45 102 395 497 11.5% 9.1% 20.5% 79.5%
Shelby County Health
Department 8 7 15 94 109 7.3% 6.4% 13.8% 86.2%
Shelby County Health Dept 8 1 9 34 43 18.6% 2.3% 20.9% 79.1%
Shelby County WIC Program 24 5 29 225 254 9.4% 2.0% 11.4% 88.6%
Shenandoah Valley Medical
System 152 66 218 1,041 1,259 12.1% 5.2% 17.3% 82.7%
Shenango Valley Urban
League, Inc. 182 19 201 721 922 19.7% 2.1% 21.8% 78.2%
Sherburne County Public Health
Srv 71 38 109 247 356 19.9% 10.7% 30.6% 69.4%
Sheridan County WIC Program 48 8 56 106 162 29.6% 4.9% 34.6% 65.4%
Sheridan County WIC Program 6 5 11 33 44 13.6% 11.4% 25.0% 75.0%
Sherman County Health Dept 20 9 29 92 121 16.5% 7.4% 24.0% 76.0%
Shiawassee County Health Dept 77 51 128 349 477 16.1% 10.7% 26.8% 73.2%
Sibley County Public Health and
Human Services 21 8 29 68 97 21.6% 8.2% 29.9% 70.1%
Silver Bow County WIC
Program 39 14 53 149 202 19.3% 6.9% 26.2% 73.8%
Sinai Community Institute 55 523 578 2,723 3,301 1.7% 15.8% 17.5% 82.5%
Siouxland District Health Dept 90 99 189 766 955 9.4% 10.4% 19.8% 80.2%
Sixteenth Street Comm Hlth Ctr 215 256 471 960 1,431 15.0% 17.9% 32.9% 67.1%
Skagit County Community 251 106 357 370 727 34.5% 14.6% 49.1% 50.9%
Skagit County Public Health
Dept 29 13 42 44 86 33.7% 15.1% 48.8% 51.2%
Skamania County Health Dept 13 2 15 20 35 37.1% 5.7% 42.9% 57.1%
Snohomish Health District 432 272 704 922 1,626 26.6% 16.7% 43.3% 56.7%
So Central Comm Act Program 280 56 336 1,013 1,349 20.8% 4.2% 24.9% 75.1%
So New Hampshire SVS 238 150 388 1,598 1,986 12.0% 7.6% 19.5% 80.5%
Society for the Protection and
Care of Children 136 80 216 938 1,154 11.8% 6.9% 18.7% 81.3%
Solano County Health & Social
Services Dept. 499 346 845 1,486 2,331 21.4% 14.8% 36.3% 63.7%
Sonoma County Indian Health
Project, Inc. 51 17 68 78 146 34.9% 11.6% 46.6% 53.4%
Sound Shore Medical Center 69 824 893 954 1,847 3.7% 44.6% 48.3% 51.7%
South Boston WIC 15 37 52 77 129 11.6% 28.7% 40.3% 59.7%
South Central Public Health
District 411 139 550 979 1,529 26.9% 9.1% 36.0% 64.0%
South Central Region 213 214 427 2,217 2,644 8.1% 8.1% 16.1% 83.9%
South Central WIC 138 105 243 760 1,003 13.8% 10.5% 24.2% 75.8%
South Cove WIC 8 87 95 230 325 2.5% 26.8% 29.2% 70.8%
South End WIC 61 238 299 324 623 9.8% 38.2% 48.0% 52.0%
South Plains Community Action
Assc., Inc. 569 719 1,288 4,575 5,863 9.7% 12.3% 22.0% 78.0%
South Puget Intertribal Planning
Agency 10 2 12 37 49 20.4% 4.1% 24.5% 75.5%
South W Comm Action Program 36 16 52 186 238 15.1% 6.7% 21.8% 78.2%
Southeast Alaska Regional
Health Consortium 132 66 198 226 424 31.1% 15.6% 46.7% 53.3%
Southeast Region 189 184 373 1,820 2,193 8.6% 8.4% 17.0% 83.0%
Southeastern Idaho Public
Health 437 93 530 781 1,311 33.3% 7.1% 40.4% 59.6%
Southeastern Utah Dist. Health
Dept 77 26 103 241 344 22.4% 7.6% 29.9% 70.1%
Southern Seven Health
Department 25 27 52 440 492 5.1% 5.5% 10.6% 89.4%
Southern University School of
Nursing Health Care Center 5 11 16 339 355 1.4% 3.1% 4.5% 95.5%
Southside District 21 23 44 443 487 4.3% 4.7% 9.0% 91.0%
Southwest District Health 532 160 692 1,268 1,960 27.1% 8.2% 35.3% 64.7%
Southwest Kansas WIC
Program 61 129 190 519 709 8.6% 18.2% 26.8% 73.2%
Southwest Utah Public Health
Dept. 308 99 407 674 1,081 28.5% 9.2% 37.7% 62.3%
Southwestern Comm Services 86 20 106 307 413 20.8% 4.8% 25.7% 74.3%
Southwestern District Health
Unit 27 8 35 72 107 25.2% 7.5% 32.7% 67.3%
Spirit Lake Sioux Nation 4 3 7 106 113 3.5% 2.7% 6.2% 93.8%
Spokane Regional Health
District 643 218 861 1,568 2,429 26.5% 9.0% 35.4% 64.6%
Spokane Tribe of Indians 3 1 4 27 31 9.7% 3.2% 12.9% 87.1%
Springfield North WIC 99 154 253 1,026 1,279 7.7% 12.0% 19.8% 80.2%
Springfield South WIC 71 126 197 726 923 7.7% 13.7% 21.3% 78.7%
Springfield-Greene Co Hlth Dept 401 141 542 1,388 1,930 20.8% 7.3% 28.1% 71.9%
St Bernard Parish Health
Unit/CHALMETTE 19 25 44 388 432 4.4% 5.8% 10.2% 89.8%
St Charles Co Dept. of
Community Health &
Environment 63 41 104 446 550 11.5% 7.5% 18.9% 81.1%
St Charles Community Health
Center 38 62 100 714 814 4.7% 7.6% 12.3% 87.7%
St Clair County Health Center 17 2 19 42 61 27.9% 3.3% 31.1% 68.9%
St Francois County Health
Center 51 22 73 422 495 10.3% 4.4% 14.7% 85.3%
St Helena Parish Health
Unit/GREENSBURG 4 5 9 136 145 2.8% 3.4% 6.2% 93.8%
St James Parish Health
Unit/VACHERIE 3 2 5 167 172 1.7% 1.2% 2.9% 97.1%
St John Parish Health
Unit/RESERVE 16 14 30 353 383 4.2% 3.7% 7.8% 92.2%
St Johns County Health
Department 128 62 190 413 603 21.2% 10.3% 31.5% 68.5%
St Landry Parish Health
Unit/OPELOUSAS 23 30 53 797 850 2.7% 3.5% 6.2% 93.8%
St Landry Parish Police Jury 14 9 23 155 178 7.9% 5.1% 12.9% 87.1%
*To maintain the privacy of participants, Local Agencies with less than 30 Infant Participants are not published. 48

Fully Breastfed Partially Breastfed Total Breastfed Fully Formula-Fed
Local Agency
Infant Data
Participation Data Statistical Data
Fully Breastfed Partially Breastfed Total Breastfed Fully Formula-Fed Total Infants
St Lucie County Hlth
Department 236 366 602 1,321 1,923 12.3% 19.0% 31.3% 68.7%
St Martin Parish Government 16 7 23 215 238 6.7% 2.9% 9.7% 90.3%
St Martin Parish Health Unit/ST
MARTINVILLE 8 8 16 244 260 3.1% 3.1% 6.2% 93.8%
St Mary Parish Health
Unit/MORGAN CITY 5 17 22 220 242 2.1% 7.0% 9.1% 90.9%
St Tammany Parish Hospital 65 61 126 426 552 11.8% 11.1% 22.8% 77.2%
St Vincent Dunn Hospital 14 17 31 241 272 5.1% 6.3% 11.4% 88.6%
St. Barnabas Hospital 29 829 858 809 1,667 1.7% 49.7% 51.5% 48.5%
St. Charles Community Health
Center/Slidell WIC Clinic 56 42 98 668 766 7.3% 5.5% 12.8% 87.2%
St. Clair County Health
Department 93 71 164 650 814 11.4% 8.7% 20.1% 79.9%
St. Clair County Health Dept 104 57 161 790 951 10.9% 6.0% 16.9% 83.1%
St. Croix Human Service 52 16 68 173 241 21.6% 6.6% 28.2% 71.8%
St. Elizabeth's Health Center 24 41 65 91 156 15.4% 26.3% 41.7% 58.3%
St. Francis Medical Center 12 25 37 391 428 2.8% 5.8% 8.6% 91.4%
St. Joseph Area Health Service,
WIC 31 7 38 74 112 27.7% 6.3% 33.9% 66.1%
St. Joseph City of Health
Department 69 37 106 571 677 10.2% 5.5% 15.7% 84.3%
St. Joseph Health Services 15 32 47 267 314 4.8% 10.2% 15.0% 85.0%
St. Joseph Regional Health
Center 29 46 75 240 315 9.2% 14.6% 23.8% 76.2%
St. Joseph's Hospital & Med
Center 496 1,447 1,943 2,663 4,606 10.8% 31.4% 42.2% 57.8%
St. Louis County DOCHMC 933 714 1,647 7,308 8,955 10.4% 8.0% 18.4% 81.6%
St. Louis County Health
Department (Virginia Office) 79 21 100 300 400 19.8% 5.3% 25.0% 75.0%
St. Louis County Health Dept
(Duluth Office) 118 42 160 337 497 23.7% 8.5% 32.2% 67.8%
St. Louis Human Dev Corp. 23 4 27 51 78 29.5% 5.1% 34.6% 65.4%
St. Lukes Hospital WIC Clinic 44 66 110 318 428 10.3% 15.4% 25.7% 74.3%
St. Luke's-Roosevelt Hospital
Center 28 147 175 301 476 5.9% 30.9% 36.8% 63.2%
St. Mary's Warrick Hospital, Inc. 28 20 48 424 472 5.9% 4.2% 10.2% 89.8%
St. Regis Mohawk Services 9 8 17 43 60 15.0% 13.3% 28.3% 71.7%
St. Vincent Jennings Hospital,
Inc. 15 12 27 189 216 6.9% 5.6% 12.5% 87.5%
St.Paul-Ramsey Couty Pubc
Health WIC 394 919 1,313 2,763 4,076 9.7% 22.5% 32.2% 67.8%
Stamford WIC Program 56 265 321 830 1,151 4.9% 23.0% 27.9% 72.1%
Standing Rock Sioux Tribe WIC 5 17 22 147 169 3.0% 10.1% 13.0% 87.0%
Stanislaus County Hlth Srvcs
Agy 891 479 1,370 3,271 4,641 19.2% 10.3% 29.5% 70.5%
Stanly County Health
Department 41 50 91 283 374 11.0% 13.4% 24.3% 75.7%
Stark County WIC Program 188 45 233 1,745 1,978 9.5% 2.3% 11.8% 88.2%
Starke County Health Dept 17 10 27 135 162 10.5% 6.2% 16.7% 83.3%
Staten Island University Hospital 57 344 401 673 1,074 5.3% 32.0% 37.3% 62.7%
Ste Genevieve County Health
Dept 18 2 20 78 98 18.4% 2.0% 20.4% 79.6%
Stearns County Public Health,
WIC 121 129 250 479 729 16.6% 17.7% 34.3% 65.7%
Steele County PHNS 34 37 71 146 217 15.7% 17.1% 32.7% 67.3%
Stephenson County Health Dept 39 16 55 243 298 13.1% 5.4% 18.5% 81.5%
Steuben County Health Dept 27 21 48 199 247 10.9% 8.5% 19.4% 80.6%
Stevens County Health
Department 10 5 15 45 60 16.7% 8.3% 25.0% 75.0%
Stickney Public Health District. 12 24 36 85 121 9.9% 19.8% 29.8% 70.2%
Stoddard County Health Dept 17 10 27 192 219 7.8% 4.6% 12.3% 87.7%
Stokes County Health
Department 27 37 64 176 240 11.3% 15.4% 26.7% 73.3%
Stone County Health Dept 29 9 38 119 157 18.5% 5.7% 24.2% 75.8%
Su Clinica Familiar 15 54 69 219 288 5.2% 18.8% 24.0% 76.0%
Suffolk County Department of
Health Services 194 1,708 1,902 2,855 4,757 4.1% 35.9% 40.0% 60.0%
Sullivan County Health Dept 3 5 8 49 57 5.3% 8.8% 14.0% 86.0%
Sullivan County Public Health
Nursing Service 61 79 140 333 473 12.9% 16.7% 29.6% 70.4%
Sullivan County Regional Office 110 42 152 742 894 12.3% 4.7% 17.0% 83.0%
Summit City/County Health Dept 33 37 70 64 134 24.6% 27.6% 52.2% 47.8%
Summit County Nursing Service 32 8 40 47 87 36.8% 9.2% 46.0% 54.0%
Summit County WIC Program 283 92 375 2,548 2,923 9.7% 3.1% 12.8% 87.2%
Sumner County Health Dept 14 4 18 120 138 10.1% 2.9% 13.0% 87.0%
Sunrise Community Health
Center 206 106 312 803 1,115 18.5% 9.5% 28.0% 72.0%
Sunrise Foundation 181 577 758 2,115 2,873 6.3% 20.1% 26.4% 73.6%
Surry County Health
Department 34 82 116 379 495 6.9% 16.6% 23.4% 76.6%
Sutter Co Human Srvcs Dept. 191 87 278 501 779 24.5% 11.2% 35.7% 64.3%
Swain County Health
Department 16 15 31 51 82 19.5% 18.3% 37.8% 62.2%
Sweetwater County WIC
Program 37 14 51 145 196 18.9% 7.1% 26.0% 74.0%
Swope Health Services 79 63 142 635 777 10.2% 8.1% 18.3% 81.7%
Tanana Chiefs Conference 66 57 123 142 265 24.9% 21.5% 46.4% 53.6%
Taney County Health Dept 75 40 115 318 433 17.3% 9.2% 26.6% 73.4%
Tangipahoa Parish Health
Unit/HAMMOND 43 56 99 1,064 1,163 3.7% 4.8% 8.5% 91.5%
Tarrant County Health
Department 1,401 3,892 5,293 9,197 14,490 9.7% 26.9% 36.5% 63.5%
Taunton/Attleboro WIC 112 62 174 562 736 15.2% 8.4% 23.6% 76.4%
Taylor County Hlth Dept 16 4 20 56 76 21.1% 5.3% 26.3% 73.7%
Tazewell County Health
Department 67 43 110 438 548 12.2% 7.8% 20.1% 79.9%
TCA Health Altgeld Health
Center 25 71 96 1,151 1,247 2.0% 5.7% 7.7% 92.3%
Teche Action Clinic 12 10 22 261 283 4.2% 3.5% 7.8% 92.2%
*To maintain the privacy of participants, Local Agencies with less than 30 Infant Participants are not published. 49

Fully Breastfed Partially Breastfed Total Breastfed Fully Formula-Fed
Local Agency
Infant Data
Participation Data Statistical Data
Fully Breastfed Partially Breastfed Total Breastfed Fully Formula-Fed Total Infants
Tehama County Health Services 146 54 200 335 535 27.3% 10.1% 37.4% 62.6%
Tejas Health Care Center 18 75 93 118 211 8.5% 35.5% 44.1% 55.9%
Teller County Public
Health/ENV. 14 4 18 41 59 23.7% 6.8% 30.5% 69.5%
Tensas Parish Health Unit/ST
JOSEPH 1 1 2 46 48 2.1% 2.1% 4.2% 95.8%
Terrebonne Parish Health
Unit/HOUMA 14 18 32 429 461 3.0% 3.9% 6.9% 93.1%
Teton County WIC Program 30 22 52 47 99 30.3% 22.2% 52.5% 47.5%
Teton County WIC Program 21 8 29 59 88 23.9% 9.1% 33.0% 67.0%
Texarkana Bowie County Family
Health Center 45 37 82 686 768 5.9% 4.8% 10.7% 89.3%
Texas County Health Dept 29 9 38 119 157 18.5% 5.7% 24.2% 75.8%
The Greather Hudson Valley
Family Health Center, Inc 32 173 205 573 778 4.1% 22.2% 26.3% 73.7%
The Public Health Foundation of
Columbia County 363 123 486 850 1,336 27.2% 9.2% 36.4% 63.6%
The Resource Connection of
Amador and Calaveras Counties 106 21 127 172 299 35.5% 7.0% 42.5% 57.5%
Thomas Jefferson District 129 104 233 652 885 14.6% 11.8% 26.3% 73.7%
Three Affiliated Tribes 1 4 5 92 97 1.0% 4.1% 5.2% 94.8%
Three Rivers District 47 37 84 535 619 7.6% 6.0% 13.6% 86.4%
Three Rivers District 24 92 116 330 446 5.4% 20.6% 26.0% 74.0%
Thundermist Health Center 64 34 98 565 663 9.7% 5.1% 14.8% 85.2%
Tiburcio Vasquez Health Center 344 237 581 637 1,218 28.2% 19.5% 47.7% 52.3%
Tillamook County Health
Department 33 18 51 95 146 22.6% 12.3% 34.9% 65.1%
Tioga Opportunities Program,
Inc 44 21 65 202 267 16.5% 7.9% 24.3% 75.7%
Tippecanoe County Health Dept 153 87 240 822 1,062 14.4% 8.2% 22.6% 77.4%
Todd County Health Department 9 4 13 97 110 8.2% 3.6% 11.8% 88.2%
Todd County PHNS 23 18 41 112 153 15.0% 11.8% 26.8% 73.2%
Toe River Health District 60 45 105 204 309 19.4% 14.6% 34.0% 66.0%
Tohono O'Odham Nation 25 21 46 187 233 10.7% 9.0% 19.7% 80.3%
Toiyabe Indian Health Project,
Inc. 28 2 30 27 57 49.1% 3.5% 52.6% 47.4%
Tompkins County Health
Department Dept. 80 57 137 208 345 23.2% 16.5% 39.7% 60.3%
Tooele County Health Dept WIC 73 50 123 253 376 19.4% 13.3% 32.7% 67.3%
Transylvania County Health
Department 38 23 61 101 162 23.5% 14.2% 37.7% 62.3%
Trempealeau County Health 17 21 38 108 146 11.6% 14.4% 26.0% 74.0%
Tri County Health Dept 13 4 17 61 78 16.7% 5.1% 21.8% 78.2%
Tri-Cities Community Health 121 125 246 498 744 16.3% 16.8% 33.1% 66.9%
Tri-County Community Health
Center 16 73 89 165 254 6.3% 28.7% 35.0% 65.0%
Tri-County Health Dept 34 9 43 133 176 19.3% 5.1% 24.4% 75.6%
Tri-County Health Dept 935 758 1,693 4,804 6,497 14.4% 11.7% 26.1% 73.9%
Tri-County WIC Program 434 777 1,211 3,602 4,813 9.0% 16.1% 25.2% 74.8%
Trinitas Hospital WIC Program 149 669 818 1,138 1,956 7.6% 34.2% 41.8% 58.2%
Trinity Co. Health & Human
Srvcs 29 4 33 28 61 47.5% 6.6% 54.1% 45.9%
Tripp/Todd County WIC
Program 6 1 7 30 37 16.2% 2.7% 18.9% 81.1%
Tri-Town Health Center 48 21 69 305 374 12.8% 5.6% 18.4% 81.6%
Truman Medical Center WIC 512 394 906 2,684 3,590 14.3% 11.0% 25.2% 74.8%
Trumbull County WIC Program 99 30 129 1,140 1,269 7.8% 2.4% 10.2% 89.8%
TSN/WIC Program 160 62 222 1,995 2,217 7.2% 2.8% 10.0% 90.0%
Tulalip Health Clinic 4 1 5 39 44 9.1% 2.3% 11.4% 88.6%
Tulsa City-County Health 328 313 641 1,967 2,608 12.6% 12.0% 24.6% 75.4%
Tuolumne County Health Dept. 107 17 124 126 250 42.8% 6.8% 49.6% 50.4%
Turner County WIC
Program/Pioneer Memorial
Hospital 6 2 8 36 44 13.6% 4.5% 18.2% 81.8%
Turtle Mountain Band of
Chiippewa 14 16 30 162 192 7.3% 8.3% 15.6% 84.4%
Tuscarawas County WIC
Program 44 15 59 431 490 9.0% 3.1% 12.0% 88.0%
Tuscola County Health Dept 60 12 72 287 359 16.7% 3.3% 20.1% 79.9%
TVCCA WIC Program 106 237 343 746 1,089 9.7% 21.8% 31.5% 68.5%
Uinta County WIC Program 31 9 40 119 159 19.5% 5.7% 25.2% 74.8%
Ulster County Health
Department 64 80 144 421 565 11.3% 14.2% 25.5% 74.5%
Umatilla Morrow Headstart 141 72 213 683 896 15.7% 8.0% 23.8% 76.2%
UMDNJ WIC Program 63 509 572 780 1,352 4.7% 37.6% 42.3% 57.7%
Union County Health
Department 134 165 299 676 975 13.7% 16.9% 30.7% 69.3%
Union County WIC Program 2 3 5 31 36 5.6% 8.3% 13.9% 86.1%
Union Parish Health
Unit/FARMERVILLE 8 9 17 183 200 4.0% 4.5% 8.5% 91.5%
United General Hospital 67 22 89 147 236 28.4% 9.3% 37.7% 62.3%
United Health Centers of San
Joaquin Valley 651 629 1,280 3,087 4,367 14.9% 14.4% 29.3% 70.7%
United Indian Health Services,
Inc. 92 25 117 96 213 43.2% 11.7% 54.9% 45.1%
United Medical Centers 54 517 571 366 937 5.8% 55.2% 60.9% 39.1%
United Neighborhood Facilities
Hlth Care Corp. 323 38 361 1,405 1,766 18.3% 2.2% 20.4% 79.6%
Unity Health Care 103 371 474 1,837 2,311 4.5% 16.1% 20.5% 79.5%
University of Miami WIC Project 124 332 456 509 965 12.8% 34.4% 47.3% 52.7%
Upper Arkansas Area COG 82 14 96 216 312 26.3% 4.5% 30.8% 69.2%
Upper Cumberland Region 203 196 399 2,098 2,497 8.1% 7.8% 16.0% 84.0%
Upper Des Moines Opportunity 72 67 139 460 599 12.0% 11.2% 23.2% 76.8%
Upper MO District Health Unit 21 8 29 78 107 19.6% 7.5% 27.1% 72.9%
Urban Health Plan, Inc. 48 567 615 735 1,350 3.6% 42.0% 45.6% 54.4%
Urban League 72 146 218 1,009 1,227 5.9% 11.9% 17.8% 82.2%
UT Health Science Center at
Houston 465 2,722 3,187 4,469 7,656 6.1% 35.6% 41.6% 58.4%
UT Medical Branch at Galveston
(UTMB) 769 3,632 4,401 4,192 8,593 8.9% 42.3% 51.2% 48.8%
Utah County Health Dept 1,077 357 1,434 1,394 2,828 38.1% 12.6% 50.7% 49.3%
*To maintain the privacy of participants, Local Agencies with less than 30 Infant Participants are not published. 50

Fully Breastfed Partially Breastfed Total Breastfed Fully Formula-Fed
Local Agency
Infant Data
Participation Data Statistical Data
Fully Breastfed Partially Breastfed Total Breastfed Fully Formula-Fed Total Infants
Ute Mountain Tribe WIC
Program 2 7 9 31 40 5.0% 17.5% 22.5% 77.5%
Valley County WIC Program 6 2 8 31 39 15.4% 5.1% 20.5% 79.5%
Valley Health and WIC 84 46 130 221 351 23.9% 13.1% 37.0% 63.0%
Valley Health Systems Inc WIC
Program 257 90 347 2,267 2,614 9.8% 3.4% 13.3% 86.7%
Valley Wide Health Services 62 21 83 253 336 18.5% 6.3% 24.7% 75.3%
Van Wert County WIC Program 20 3 23 140 163 12.3% 1.8% 14.1% 85.9%
Vanderburgh County Health
Dept 78 44 122 905 1,027 7.6% 4.3% 11.9% 88.1%
Variety Care 206 166 372 1,198 1,570 13.1% 10.6% 23.7% 76.3%
Ventura County Health Care
Agency 878 993 1,871 3,246 5,117 17.2% 19.4% 36.6% 63.4%
Vermilion County Health
Department 37 33 70 645 715 5.2% 4.6% 9.8% 90.2%
Vermillion Parish Health
Unit/ABBEVILLE 16 17 33 441 474 3.4% 3.6% 7.0% 93.0%
Vernon County Health Dept 32 9 41 99 140 22.9% 6.4% 29.3% 70.7%
Vernon County Health Dept 24 8 32 107 139 17.3% 5.8% 23.0% 77.0%
Vernon Parish Health
Unit/LEESVILLE 38 14 52 409 461 8.2% 3.0% 11.3% 88.7%
Victoria City-County Health
Department 97 144 241 1,008 1,249 7.8% 11.5% 19.3% 80.7%
Vida Y Salud Health Systems,
Inc 34 240 274 434 708 4.8% 33.9% 38.7% 61.3%
Vilas County Health Dept 7 2 9 30 39 17.9% 5.1% 23.1% 76.9%
Vinton County WIC Program 13 2 15 101 116 11.2% 1.7% 12.9% 87.1%
Virginia Beach District 298 212 510 1,710 2,220 13.4% 9.5% 23.0% 77.0%
Visiting Nurse Association 127 355 482 1,081 1,563 8.1% 22.7% 30.8% 69.2%
Visiting Nurse Association -
Dubuque 65 32 97 259 356 18.3% 9.0% 27.2% 72.8%
VNA of Central Jersey, Inc. 497 1,223 1,720 3,010 4,730 10.5% 25.9% 36.4% 63.6%
Volusia County Health
Department 330 316 646 1,972 2,618 12.6% 12.1% 24.7% 75.3%
VT Department Health
Brattleboro 50 14 64 82 146 34.2% 9.6% 43.8% 56.2%
VT Dept Health Barre 77 32 109 179 288 26.7% 11.1% 37.8% 62.2%
VT Dept Health Burlington 153 88 241 272 513 29.8% 17.2% 47.0% 53.0%
VT Dept Health Middlebury 46 15 61 67 128 35.9% 11.7% 47.7% 52.3%
VT Dept Health Newport 58 13 71 138 209 27.8% 6.2% 34.0% 66.0%
VT Dept Health Rutland 65 28 93 223 316 20.6% 8.9% 29.4% 70.6%
VT Dept Health Springfield 43 19 62 131 193 22.3% 9.8% 32.1% 67.9%
VT Dept Health St. Albans 72 34 106 212 318 22.6% 10.7% 33.3% 66.7%
VT Dept Health St. Johnsbury 65 18 83 125 208 31.3% 8.7% 39.9% 60.1%
VT Dept Health White River 48 17 65 120 185 25.9% 9.2% 35.1% 64.9%
VT Dept of Health Morrisville 74 19 93 89 182 40.7% 10.4% 51.1% 48.9%
VT Dept. Health Bennington 31 20 51 132 183 16.9% 10.9% 27.9% 72.1%
Wabash County Health Dept 18 7 25 103 128 14.1% 5.5% 19.5% 80.5%
Wabasha County Public Health
Services 15 6 21 77 98 15.3% 6.1% 21.4% 78.6%
Waco Mclennan Co Public
Health District 165 366 531 1,575 2,106 7.8% 17.4% 25.2% 74.8%
Wadena County Public Health
Dept 15 3 18 48 66 22.7% 4.5% 27.3% 72.7%
Wahiawa WIC Program 189 72 261 624 885 21.4% 8.1% 29.5% 70.5%
Waianae Coast Comp Health
Center 176 80 256 802 1,058 16.6% 7.6% 24.2% 75.8%
Waimanalo 38 26 64 129 193 19.7% 13.5% 33.2% 66.8%
Wake County Health
Department 369 961 1,330 2,682 4,012 9.2% 24.0% 33.2% 66.8%
Walla Walla County Health
Department 46 26 72 122 194 23.7% 13.4% 37.1% 62.9%
Walsh County WIC Program 5 8 13 56 69 7.2% 11.6% 18.8% 81.2%
Walworth County Public Health 67 47 114 272 386 17.4% 12.2% 29.5% 70.5%
Walworth County WIC
Program/Mobridge Regional
Hospital 2 3 5 26 31 6.5% 9.7% 16.1% 83.9%
Warren County Health
Department 10 16 26 102 128 7.8% 12.5% 20.3% 79.7%
Warren County Health Services 46 29 75 235 310 14.8% 9.4% 24.2% 75.8%
Warren County WIC Program 44 6 50 467 517 8.5% 1.2% 9.7% 90.3%
Wasatch City/County Health
Dept 34 14 48 66 114 29.8% 12.3% 42.1% 57.9%
Waseca County Public Health
Services 16 7 23 81 104 15.4% 6.7% 22.1% 77.9%
Washakie County WIC Program 26 6 32 70 102 25.5% 5.9% 31.4% 68.6%
Washburn County Health Dept 26 6 32 64 96 27.1% 6.3% 33.3% 66.7%
Washington County Health Dept 27 9 36 223 259 10.4% 3.5% 13.9% 86.1%
Washington County Health Dept 5 2 7 47 54 9.3% 3.7% 13.0% 87.0%
Washington County HHS 807 369 1,176 1,392 2,568 31.4% 14.4% 45.8% 54.2%
Washington County Hlth Dept 59 26 85 227 312 18.9% 8.3% 27.2% 72.8%
Washington County Public
Health Services 48 32 80 292 372 12.9% 8.6% 21.5% 78.5%
Washington County WIC
Program 155 89 244 735 979 15.8% 9.1% 24.9% 75.1%
Washington County WIC
Program, Dept of Public Health
and Environment 100 110 210 462 672 14.9% 16.4% 31.3% 68.8%
Washington Parish Health
Unit/BOGALUSA 17 17 34 432 466 3.6% 3.6% 7.3% 92.7%
Washington-Morgan WIC
Program 24 5 29 408 437 5.5% 1.1% 6.6% 93.4%
Washoe County District 199 132 331 1,018 1,349 14.8% 9.8% 24.5% 75.5%
Washtenaw Co. Public Hlth.
WIC Clinic 242 193 435 949 1,384 17.5% 13.9% 31.4% 68.6%
Waterbury Hlth Dept. WIC
Program 64 266 330 1,122 1,452 4.4% 18.3% 22.7% 77.3%
Watonwan County Human
Services 12 22 34 68 102 11.8% 21.6% 33.3% 66.7%
Watts Healthcare Corporation 442 583 1,025 2,813 3,838 11.5% 15.2% 26.7% 73.3%
*To maintain the privacy of participants, Local Agencies with less than 30 Infant Participants are not published. 51

Fully Breastfed Partially Breastfed Total Breastfed Fully Formula-Fed
Local Agency
Infant Data
Participation Data Statistical Data
Fully Breastfed Partially Breastfed Total Breastfed Fully Formula-Fed Total Infants
Waukesha County Dept Hum
Ser 87 49 136 413 549 15.8% 8.9% 24.8% 75.2%
Waupaca County Dept Human
Servs 33 12 45 161 206 16.0% 5.8% 21.8% 78.2%
Wayne County Health Center 13 3 16 84 100 13.0% 3.0% 16.0% 84.0%
Wayne County Health
Department 82 139 221 966 1,187 6.9% 11.7% 18.6% 81.4%
Wayne County Health Dept 23 6 29 127 156 14.7% 3.8% 18.6% 81.4%
Wayne County Health Dept 314 770 1,084 4,080 5,164 6.1% 14.9% 21.0% 79.0%
Wayne County WIC Program 83 23 106 427 533 15.6% 4.3% 19.9% 80.1%
Weber-Morgan Dist Health Dept 295 122 417 1,094 1,511 19.5% 8.1% 27.6% 72.4%
Webster County Health
Department 66 57 123 378 501 13.2% 11.4% 24.6% 75.4%
Webster County Health Unit 37 10 47 153 200 18.5% 5.0% 23.5% 76.5%
Webster Parish Health
Unit/MINDEN 14 6 20 407 427 3.3% 1.4% 4.7% 95.3%
Wedco District 47 84 131 383 514 9.1% 16.3% 25.5% 74.5%
Wee Care Day Care WIC 75 142 217 1,559 1,776 4.2% 8.0% 12.2% 87.8%
Well Child Center, Inc. 216 530 746 1,259 2,005 10.8% 26.4% 37.2% 62.8%
West Allis Health Dept 41 35 76 291 367 11.2% 9.5% 20.7% 79.3%
West Baton Rouge Parish
Health Unit/PORT ALLEN 11 15 26 271 297 3.7% 5.1% 8.8% 91.2%
West Bay Community Action,
Inc. 41 30 71 382 453 9.1% 6.6% 15.7% 84.3%
West Carroll Parish Health
Unit/OAK GROVE 2 3 5 106 111 1.8% 2.7% 4.5% 95.5%
West Central Community Action 60 46 106 376 482 12.4% 9.5% 22.0% 78.0%
West Central Community Center 150 57 207 387 594 25.3% 9.6% 34.8% 65.2%
West Feliciana Parish Health
Unit/ST FRANCISVILLE 4 5 9 120 129 3.1% 3.9% 7.0% 93.0%
West Jefferson Medical Center 51 91 142 1,552 1,694 3.0% 5.4% 8.4% 91.6%
West Oakland Health Council,
Inc. 41 46 87 151 238 17.2% 19.3% 36.6% 63.4%
West Piedmont District 68 53 121 770 891 7.6% 5.9% 13.6% 86.4%
West TN Region Jackson 81 118 199 1,780 1,979 4.1% 6.0% 10.1% 89.9%
West TN Region Union City 82 95 177 1,767 1,944 4.2% 4.9% 9.1% 90.9%
Westchester County
Department of Health 167 896 1,063 1,129 2,192 7.6% 40.9% 48.5% 51.5%
Western Comm. Health
Resources 19 15 34 101 135 14.1% 11.1% 25.2% 74.8%
Western Indiana Community
Action Agency, Inc. 62 40 102 737 839 7.4% 4.8% 12.2% 87.8%
Western Maine Cap 159 31 190 822 1,012 15.7% 3.1% 18.8% 81.2%
Western Tidewater District 53 19 72 687 759 7.0% 2.5% 9.5% 90.5%
Western Up District Health Dept 72 30 102 239 341 21.1% 8.8% 29.9% 70.1%
Weston County WIC Program 12 4 16 38 54 22.2% 7.4% 29.6% 70.4%
Whatcom County Health
Department 157 39 196 236 432 36.3% 9.0% 45.4% 54.6%
Wheeling-Ohio County WIC 80 41 121 826 947 8.4% 4.3% 12.8% 87.2%
White Earth Health Reservation
WIC 14 11 25 154 179 7.8% 6.1% 14.0% 86.0%
White Mountain Apache Tribe 33 26 59 192 251 13.1% 10.4% 23.5% 76.5%
Whiteside County Health Dept 36 30 66 319 385 9.4% 7.8% 17.1% 82.9%
Whitley County Health
Department 24 10 34 127 161 14.9% 6.2% 21.1% 78.9%
Whitley County Health
Department 45 49 94 469 563 8.0% 8.7% 16.7% 83.3%
Whitman County Health
Department 69 19 88 65 153 45.1% 12.4% 57.5% 42.5%
Whitney M. Young, Jr. Health
Center, Inc 44 118 162 470 632 7.0% 18.7% 25.6% 74.4%
WIC State Office 1,910 873 2,783 9,064 11,847 16.1% 7.4% 23.5% 76.5%
Wichita Falls -Witchita County
Public Health District 140 155 295 866 1,161 12.1% 13.4% 25.4% 74.6%
Wicomico County Health
Department 123 205 328 1,006 1,334 9.2% 15.4% 24.6% 75.4%
Wilkes County Health Dept 43 49 92 304 396 10.9% 12.4% 23.2% 76.8%
Wilkin County PHNS 7 2 9 29 38 18.4% 5.3% 23.7% 76.3%
Will County Health Dept 271 359 630 1,989 2,619 10.3% 13.7% 24.1% 75.9%
William F. Ryan Community
Health Center 50 201 251 496 747 6.7% 26.9% 33.6% 66.4%
Williams County WIC Program 33 9 42 197 239 13.8% 3.8% 17.6% 82.4%
Williamson County Cities Health
District 330 560 890 1,090 1,980 16.7% 28.3% 44.9% 55.1%
Wilson County Health
Department 21 72 93 641 734 2.9% 9.8% 12.7% 87.3%
Wilson County Health Dept 12 5 17 62 79 15.2% 6.3% 21.5% 78.5%
Windward WIC Program 175 99 274 402 676 25.9% 14.6% 40.5% 59.5%
Winn Parish Health
Unit/WINNFIELD 2 4 6 157 163 1.2% 2.5% 3.7% 96.3%
Winnebago - 3 3 43 46 0.0% 6.5% 6.5% 93.5%
Winnebago County Health
Department 135 167 302 1,712 2,014 6.7% 8.3% 15.0% 85.0%
Winnebago County WIC Project 100 48 148 499 647 15.5% 7.4% 22.9% 77.1%
Winona County PHNS 38 17 55 135 190 20.0% 8.9% 28.9% 71.1%
Women and Infants Hospital 25 46 71 458 529 4.7% 8.7% 13.4% 86.6%
Women's Health Center of
Albany Medical College 58 103 161 465 626 9.3% 16.5% 25.7% 74.3%
Wood County Health
Department 59 21 80 275 355 16.6% 5.9% 22.5% 77.5%
Wood County WIC Program 41 21 62 357 419 9.8% 5.0% 14.8% 85.2%
Wood River Health Services 21 7 28 91 119 17.6% 5.9% 23.5% 76.5%
Woodford County Health
Department 17 3 20 88 108 15.7% 2.8% 18.5% 81.5%
Woodford County Health
Department 21 12 33 117 150 14.0% 8.0% 22.0% 78.0%
Worcester WIC 203 427 630 1,052 1,682 12.1% 25.4% 37.5% 62.5%
Wright County Comm Action,
Inc. 89 47 136 338 474 18.8% 9.9% 28.7% 71.3%
Wright County Health Dept 34 8 42 147 189 18.0% 4.2% 22.2% 77.8%
Wyandot County WIC Program 21 7 28 95 123 17.1% 5.7% 22.8% 77.2%
Wyandotte County Health Dept 202 318 520 1,257 1,777 11.4% 17.9% 29.3% 70.7%
*To maintain the privacy of participants, Local Agencies with less than 30 Infant Participants are not published. 52

Fully Breastfed Partially Breastfed Total Breastfed Fully Formula-Fed
Local Agency
Infant Data
Participation Data Statistical Data
Fully Breastfed Partially Breastfed Total Breastfed Fully Formula-Fed Total Infants
Wyckoff Heights Medical Center 104 577 681 1,013 1,694 6.1% 34.1% 40.2% 59.8%
Yadkin County Health
Department 23 52 75 183 258 8.9% 20.2% 29.1% 70.9%
Yakama Nation 24 9 33 112 145 16.6% 6.2% 22.8% 77.2%
Yakima Neighborhood Health
Services 140 170 310 670 980 14.3% 17.3% 31.6% 68.4%
Yakima Valley Farmworkers
Clinic 409 396 805 1,523 2,328 17.6% 17.0% 34.6% 65.4%
Yankton County WIC Program 10 7 17 89 106 9.4% 6.6% 16.0% 84.0%
Yavapai County Department 236 187 423 561 984 24.0% 19.0% 43.0% 57.0%
Yeled V'Yalda Early Childhood
Center 520 938 1,458 324 1,782 29.2% 52.6% 81.8% 18.2%
Yolo County DPH 302 187 489 615 1,104 27.4% 16.9% 44.3% 55.7%
York County Community Action
Corp. 172 32 204 625 829 20.7% 3.9% 24.6% 75.4%
Yukon-Kuskokwim Health Corp. 84 203 287 258 545 15.4% 37.2% 52.7% 47.3%
Yuma County WIC Program 205 331 536 1,597 2,133 9.6% 15.5% 25.1% 74.9%
*To maintain the privacy of participants, Local Agencies with less than 30 Infant Participants are not published. 53

San Juan County Health
Department 23 4 27 11 38 60.5% 10.5% 71.1% 28.9%
Marin County HHS, Montecito 308 128 436 178 614 50.2% 20.8% 71.0% 29.0%
Jefferson County Public Health 40 5 45 35 80 50.0% 6.3% 56.3% 43.8%
Nevada County DPH 165 38 203 128 331 49.8% 11.5% 61.3% 38.7%
Toiyabe Indian Health Project,
Inc. 28 2 30 27 57 49.1% 3.5% 52.6% 47.4%
Hamlin County WIC Program 21 1 22 21 43 48.8% 2.3% 51.2% 48.8%
Alliance Medical Center 126 40 166 95 261 48.3% 15.3% 63.6% 36.4%
Trinity Co. Health & Human
Srvcs 29 4 33 28 61 47.5% 6.6% 54.1% 45.9%
Whitman County Health
Department 69 19 88 65 153 45.1% 12.4% 57.5% 42.5%
PUEBLO OF ZUNI, NM 67 21 88 62 150 44.7% 14.0% 58.7% 41.3%
Native Village of EYAK - Valdez 26 7 33 27 60 43.3% 11.7% 55.0% 45.0%
United Indian Health Services,
Inc. 92 25 117 96 213 43.2% 11.7% 54.9% 45.1%
Albany County WIC Program 73 13 86 84 170 42.9% 7.6% 50.6% 49.4%
Gunnison County Public Health 21 6 27 22 49 42.9% 12.2% 55.1% 44.9%
Tuolumne County Health Dept. 107 17 124 126 250 42.8% 6.8% 49.6% 50.4%
Gallatin County WIC Program 111 18 129 134 263 42.2% 6.8% 49.0% 51.0%
Benton County Health
Department 142 29 171 167 338 42.0% 8.6% 50.6% 49.4%
Grand County Public Health
Nursing 13 3 16 15 31 41.9% 9.7% 51.6% 48.4%
Ravalli County WIC Program 52 12 64 63 127 40.9% 9.4% 50.4% 49.6%
Lane County WIC Program 754 138 892 954 1,846 40.8% 7.5% 48.3% 51.7%
VT Dept of Health Morrisville 74 19 93 89 182 40.7% 10.4% 51.1% 48.9%
Lincoln County Public Health
Department 13 2 15 17 32 40.6% 6.3% 46.9% 53.1%
North County Health Services 925 357 1,282 1,007 2,289 40.4% 15.6% 56.0% 44.0%
Lake County Health Dept 20 3 23 27 50 40.0% 6.0% 46.0% 54.0%
Alaska Family Services - Kenai 185 44 229 242 471 39.3% 9.3% 48.6% 51.4%
Coconino County Health Dept 307 121 428 356 784 39.2% 15.4% 54.6% 45.4%
Utah County Health Dept 1,077 357 1,434 1,394 2,828 38.1% 12.6% 50.7% 49.3%
County of Sonoma DHS 707 363 1,070 787 1,857 38.1% 19.5% 57.6% 42.4%
Alaska Family Services - Wasilla 211 30 241 314 555 38.0% 5.4% 43.4% 56.6%
Opportunity Development
Association of Williamsburg 566 669 1,235 258 1,493 37.9% 44.8% 82.7% 17.3%
Plumas Rural Services, Inc. 32 11 43 42 85 37.6% 12.9% 50.6% 49.4%
City of Berkeley 91 42 133 110 243 37.4% 17.3% 54.7% 45.3%
Skamania County Health Dept 13 2 15 20 35 37.1% 5.7% 42.9% 57.1%
Eastern Idaho Public Health
District 704 154 858 1,040 1,898 37.1% 8.1% 45.2% 54.8%
Clatsop County Health and
Human Services 40 15 55 53 108 37.0% 13.9% 50.9% 49.1%
County of San Luis Obispo 362 150 512 468 980 36.9% 15.3% 52.2% 47.8%
Clallam County HHS 103 30 133 146 279 36.9% 10.8% 47.7% 52.3%
Summit County Nursing Service 32 8 40 47 87 36.8% 9.2% 46.0% 54.0%
North Central District 166 29 195 258 453 36.6% 6.4% 43.0% 57.0%
Park County Nursing Service 15 4 19 22 41 36.6% 9.8% 46.3% 53.7%
Deschutes County Health
Department 333 63 396 516 912 36.5% 6.9% 43.4% 56.6%
County of Mendocino 245 101 346 327 673 36.4% 15.0% 51.4% 48.6%
Native American Health Center,
Inc. 183 111 294 209 503 36.4% 22.1% 58.4% 41.6%
Whatcom County Health
Department 157 39 196 236 432 36.3% 9.0% 45.4% 54.6%
VT Dept Health Middlebury 46 15 61 67 128 35.9% 11.7% 47.7% 52.3%
Hood River County Health 72 44 116 86 202 35.6% 21.8% 57.4% 42.6%
The Resource Connection of
Amador and Calaveras Counties 106 21 127 172 299 35.5% 7.0% 42.5% 57.5%
Sonoma County Indian Health
Project, Inc. 51 17 68 78 146 34.9% 11.6% 46.6% 53.4%
Klickitat County Health
Department 43 11 54 70 124 34.7% 8.9% 43.5% 56.5%
Josephine County Health
Department 207 33 240 359 599 34.6% 5.5% 40.1% 59.9%
Skagit County Community 251 106 357 370 727 34.5% 14.6% 49.1% 50.9%
Napa County Hlth & Human
Srvcs 256 141 397 345 742 34.5% 19.0% 53.5% 46.5%
VT Department Health
Brattleboro 50 14 64 82 146 34.2% 9.6% 43.8% 56.2%
Panhandle Health District 351 78 429 598 1,027 34.2% 7.6% 41.8% 58.2%
San Juan Basin Health Dept 76 7 83 141 224 33.9% 3.1% 37.1% 62.9%
Missoula County WIC Program 171 47 218 288 506 33.8% 9.3% 43.1% 56.9%
Skagit County Public Health
Dept 29 13 42 44 86 33.7% 15.1% 48.8% 51.2%
Family Health Centers 117 49 166 181 347 33.7% 14.1% 47.8% 52.2%
FE Warren WIC Program 27 5 32 49 81 33.3% 6.2% 39.5% 60.5%
Southeastern Idaho Public
Health 437 93 530 781 1,311 33.3% 7.1% 40.4% 59.6%
Glenn County Health Services 88 31 119 146 265 33.2% 11.7% 44.9% 55.1%
Santa Barbara Co. PHD 1,172 600 1,772 1,765 3,537 33.1% 17.0% 50.1% 49.9%
Curry County Health
Department 45 8 53 84 137 32.8% 5.8% 38.7% 61.3%
Fergus County WIC 18 4 22 33 55 32.7% 7.3% 40.0% 60.0%
County of Siskiyou Public
Health and Community Dev
Dept 88 30 118 151 269 32.7% 11.2% 43.9% 56.1%
Jackson County Health
Department 459 114 573 833 1,406 32.6% 8.1% 40.8% 59.2%
Nooksack Indian Tribe 14 1 15 28 43 32.6% 2.3% 34.9% 65.1%
Anchorage Armed Services
YMCA 167 38 205 310 515 32.4% 7.4% 39.8% 60.2%
Community Bridges 593 464 1,057 785 1,842 32.2% 25.2% 57.4% 42.6%
Fully Formula-Fed
Highest % Fully Breastfed Infants by Local Agency
FY 2012
Local Agency
Infant Data
Participation Data Statistical Data
Fully Breastfed Partially Breastfed Total Breastfed Fully Formula-Fed Total Infants Fully Breastfed Partially Breastfed Total Breastfed
*To maintain the privacy of participants, Local Agencies with less than 30 Infant Participants are not published. 54

Fully Formula-Fed
Local Agency
Infant Data
Participation Data Statistical Data
Fully Breastfed Partially Breastfed Total Breastfed Fully Formula-Fed Total Infants Fully Breastfed Partially Breastfed Total Breastfed
Baker County Health
Department 34 5 39 67 106 32.1% 4.7% 36.8% 63.2%
North Lincoln Co WIC Program 16 3 19 31 50 32.0% 6.0% 38.0% 62.0%
Scripps Mercy Hospital 514 331 845 775 1,620 31.7% 20.4% 52.2% 47.8%
Island County Public Health 58 15 73 110 183 31.7% 8.2% 39.9% 60.1%
Placer County Dept of HHS 309 140 449 526 975 31.7% 14.4% 46.1% 53.9%
Honolulu WIC Program 126 48 174 224 398 31.7% 12.1% 43.7% 56.3%
Community Health of Central
Washington 53 20 73 95 168 31.5% 11.9% 43.5% 56.5%
Washington County HHS 807 369 1,176 1,392 2,568 31.4% 14.4% 45.8% 54.2%
Sea Mar 1,354 506 1,860 2,454 4,314 31.4% 11.7% 43.1% 56.9%
Grand Traverse County Health
Dept 183 41 224 360 584 31.3% 7.0% 38.4% 61.6%
Bay Clinic 105 29 134 202 336 31.3% 8.6% 39.9% 60.1%
VT Dept Health St. Johnsbury 65 18 83 125 208 31.3% 8.7% 39.9% 60.1%
NE Tri-County Health District 74 9 83 154 237 31.2% 3.8% 35.0% 65.0%
E-Center 162 78 240 279 519 31.2% 15.0% 46.2% 53.8%
Southeast Alaska Regional
Health Consortium 132 66 198 226 424 31.1% 15.6% 46.7% 53.3%
County of Shasta, HHSA, PHD 399 126 525 766 1,291 30.9% 9.8% 40.7% 59.3%
Alameda County Health Care
Services Agency 1,376 749 2,125 2,354 4,479 30.7% 16.7% 47.4% 52.6%
Montezuma County Health Dept 37 8 45 76 121 30.6% 6.6% 37.2% 62.8%
County of Humboldt 272 147 419 472 891 30.5% 16.5% 47.0% 53.0%
Community Medical Centers,
Inc. 454 305 759 732 1,491 30.4% 20.5% 50.9% 49.1%
El Dorado Co Dept. Comm Srvs 183 98 281 321 602 30.4% 16.3% 46.7% 53.3%
Indian Hlth Ctr. Santa Clara 202 123 325 341 666 30.3% 18.5% 48.8% 51.2%
Mono County Health
Department 20 17 37 29 66 30.3% 25.8% 56.1% 43.9%
Teton County WIC Program 30 22 52 47 99 30.3% 22.2% 52.5% 47.5%
Resource Center for Parents &
Children 249 118 367 457 824 30.2% 14.3% 44.5% 55.5%
Kodiak Area Native Association 34 19 53 60 113 30.1% 16.8% 46.9% 53.1%
ACL HOSPITAL BOARD, NM 30 20 50 50 100 30.0% 20.0% 50.0% 50.0%
Pregnancy Aid Outreach
Program 392 163 555 753 1,308 30.0% 12.5% 42.4% 57.6%
Bear River Health Dept 326 98 424 665 1,089 29.9% 9.0% 38.9% 61.1%
VT Dept Health Burlington 153 88 241 272 513 29.8% 17.2% 47.0% 53.0%
Wasatch City/County Health
Dept 34 14 48 66 114 29.8% 12.3% 42.1% 57.9%
Lincoln County Health and
Human Services 92 37 129 180 309 29.8% 12.0% 41.7% 58.3%
SANTO DOMINGO,NM 11 4 15 22 37 29.7% 10.8% 40.5% 59.5%
Berkshire South WIC 30 12 42 59 101 29.7% 11.9% 41.6% 58.4%
Kona WIC Program 102 35 137 207 344 29.7% 10.2% 39.8% 60.2%
Sheridan County WIC Program 48 8 56 106 162 29.6% 4.9% 34.6% 65.4%
Seattle Indian Health Board 26 17 43 45 88 29.5% 19.3% 48.9% 51.1%
Multnomah County Health
Department 1,261 439 1,700 2,572 4,272 29.5% 10.3% 39.8% 60.2%
St. Louis Human Dev Corp. 23 4 27 51 78 29.5% 5.1% 34.6% 65.4%
Yeled V'Yalda Early Childhood
Center 520 938 1,458 324 1,782 29.2% 52.6% 81.8% 18.2%
Goshen County WIC Program 29 9 38 62 100 29.0% 9.0% 38.0% 62.0%
Lincoln County WIC Program 26 5 31 59 90 28.9% 5.6% 34.4% 65.6%
Cook Inlet Tribal Council Inc. 74 29 103 154 257 28.8% 11.3% 40.1% 59.9%
FIVE SANDOVAL INDIAN, NM 18 13 31 32 63 28.6% 20.6% 49.2% 50.8%
Southwest Utah Public Health
Dept. 308 99 407 674 1,081 28.5% 9.2% 37.7% 62.3%
Central District Health
Department 472 150 622 1,038 1,660 28.4% 9.0% 37.5% 62.5%
United General Hospital 67 22 89 147 236 28.4% 9.3% 37.7% 62.3%
Kapiolani Health Center WIC 126 52 178 266 444 28.4% 11.7% 40.1% 59.9%
County of Riverside Hlth Srvcs 5,255 1,420 6,675 11,848 18,523 28.4% 7.7% 36.0% 64.0%
Flathead County WIC Program 114 42 156 246 402 28.4% 10.4% 38.8% 61.2%
Butte County DPH 391 141 532 851 1,383 28.3% 10.2% 38.5% 61.5%
Tiburcio Vasquez Health Center 344 237 581 637 1,218 28.2% 19.5% 47.7% 52.3%
Ocean County WIC Program 960 932 1,892 1,511 3,403 28.2% 27.4% 55.6% 44.4%
Rockland County Health
Department 666 958 1,624 739 2,363 28.2% 40.5% 68.7% 31.3%
Confederate Tribes of Warm
Springs 110 27 137 256 393 28.0% 6.9% 34.9% 65.1%
Deer Lodge County WIC
Program 29 6 35 69 104 27.9% 5.8% 33.7% 66.3%
St Clair County Health Center 17 2 19 42 61 27.9% 3.3% 31.1% 68.9%
Benewah Medical Center 10 1 11 25 36 27.8% 2.8% 30.6% 69.4%
Coos County Health Department 78 26 104 177 281 27.8% 9.3% 37.0% 63.0%
VT Dept Health Newport 58 13 71 138 209 27.8% 6.2% 34.0% 66.0%
St. Joseph Area Health Service,
WIC 31 7 38 74 112 27.7% 6.3% 33.9% 66.1%
Garfield County Nursing
Services 77 47 124 155 279 27.6% 16.8% 44.4% 55.6%
Yolo County DPH 302 187 489 615 1,104 27.4% 16.9% 44.3% 55.7%
Tehama County Health Services 146 54 200 335 535 27.3% 10.1% 37.4% 62.6%
Polk County Health Dept 45 12 57 108 165 27.3% 7.3% 34.5% 65.5%
The Public Health Foundation of
Columbia County 363 123 486 850 1,336 27.2% 9.2% 36.4% 63.6%
Linn County Health Department 236 52 288 581 869 27.2% 6.0% 33.1% 66.9%
Community Resource Project,
Inc. 1,237 612 1,849 2,708 4,557 27.1% 13.4% 40.6% 59.4%
Southwest District Health 532 160 692 1,268 1,960 27.1% 8.2% 35.3% 64.7%
La Clinica De La Raza, Inc. 258 243 501 450 951 27.1% 25.6% 52.7% 47.3%
Washburn County Health Dept 26 6 32 64 96 27.1% 6.3% 33.3% 66.7%
Madera County DPH 474 264 738 1,016 1,754 27.0% 15.1% 42.1% 57.9%
Nimiipu Health 14 5 19 33 52 26.9% 9.6% 36.5% 63.5%
*To maintain the privacy of participants, Local Agencies with less than 30 Infant Participants are not published. 55

Fully Formula-Fed
Local Agency
Infant Data
Participation Data Statistical Data
Fully Breastfed Partially Breastfed Total Breastfed Fully Formula-Fed Total Infants Fully Breastfed Partially Breastfed Total Breastfed
South Central Public Health
District 411 139 550 979 1,529 26.9% 9.1% 36.0% 64.0%
Chippewa County Health Dept 74 15 89 187 276 26.8% 5.4% 32.2% 67.8%
Santa Clara County 1,221 838 2,059 2,505 4,564 26.8% 18.4% 45.1% 54.9%
VT Dept Health Barre 77 32 109 179 288 26.7% 11.1% 37.8% 62.2%
Broomfield Co Hlth & Human
SVS 28 6 34 71 105 26.7% 5.7% 32.4% 67.6%
Bay Area WIC 46 10 56 117 173 26.6% 5.8% 32.4% 67.6%
Snohomish Health District 432 272 704 922 1,626 26.6% 16.7% 43.3% 56.7%
Asotin County Health District 34 8 42 86 128 26.6% 6.3% 32.8% 67.2%
Maui WIC Program 98 43 141 228 369 26.6% 11.7% 38.2% 61.8%
Monterey County 1,112 872 1,984 2,205 4,189 26.5% 20.8% 47.4% 52.6%
Sacramento County Dept. of
HHS 1,708 726 2,434 4,009 6,443 26.5% 11.3% 37.8% 62.2%
Douglas County Health
Department 202 37 239 524 763 26.5% 4.8% 31.3% 68.7%
Spokane Regional Health
District 643 218 861 1,568 2,429 26.5% 9.0% 35.4% 64.6%
Kitsap Community Resources 310 102 412 760 1,172 26.5% 8.7% 35.2% 64.8%
Crook County Health
Department 75 16 91 194 285 26.3% 5.6% 31.9% 68.1%
Grant County Health
Department 10 2 12 26 38 26.3% 5.3% 31.6% 68.4%
Upper Arkansas Area COG 82 14 96 216 312 26.3% 4.5% 30.8% 69.2%
PUEBLO OF SAN FELIPE, NM 17 11 28 37 65 26.2% 16.9% 43.1% 56.9%
Hopi Tribe 24 18 42 50 92 26.1% 19.6% 45.7% 54.3%
Pasadena Public Health Dept. 259 184 443 553 996 26.0% 18.5% 44.5% 55.5%
Northwest MI Comm Health
Agency 184 40 224 485 709 26.0% 5.6% 31.6% 68.4%
VT Dept Health White River 48 17 65 120 185 25.9% 9.2% 35.1% 64.9%
County of Inyo DHHS 21 11 32 49 81 25.9% 13.6% 39.5% 60.5%
Windward WIC Program 175 99 274 402 676 25.9% 14.6% 40.5% 59.5%
Public Health Seattle & King
County 1,915 1,407 3,322 4,082 7,404 25.9% 19.0% 44.9% 55.1%
Delta County Health Dept 27 3 30 75 105 25.7% 2.9% 28.6% 71.4%
Big Horn/Park County WIC
Program 37 6 43 101 144 25.7% 4.2% 29.9% 70.1%
Axis Community Health 114 93 207 238 445 25.6% 20.9% 46.5% 53.5%
Northwest Colorado VNA 34 12 46 87 133 25.6% 9.0% 34.6% 65.4%
CAC of Lewis/Mason/Thurston
Counties 153 72 225 375 600 25.5% 12.0% 37.5% 62.5%
Horizon Community Health
Board (Stevens County) 13 3 16 35 51 25.5% 5.9% 31.4% 68.6%
Washakie County WIC Program 26 6 32 70 102 25.5% 5.9% 31.4% 68.6%
Shannon County Health Center 17 2 19 48 67 25.4% 3.0% 28.4% 71.6%
West Central Community Center 150 57 207 387 594 25.3% 9.6% 34.8% 65.2%
North Central Public Health
District 54 19 73 141 214 25.2% 8.9% 34.1% 65.9%
Southwestern District Health
Unit 27 8 35 72 107 25.2% 7.5% 32.7% 67.3%
Otter Tail County Public Health 70 24 94 186 280 25.0% 8.6% 33.6% 66.4%
Boulder County Public Health
Dept 205 115 320 501 821 25.0% 14.0% 39.0% 61.0%
Marion County Health
Department 482 150 632 1,301 1,933 24.9% 7.8% 32.7% 67.3%
Tanana Chiefs Conference 66 57 123 142 265 24.9% 21.5% 46.4% 53.6%
Central Utah Public Health Dept 114 31 145 315 460 24.8% 6.7% 31.5% 68.5%
Polk County Health Department 75 21 96 207 303 24.8% 6.9% 31.7% 68.3%
Salud Medical Center-Yakima
Valley 459 232 691 1,165 1,856 24.7% 12.5% 37.2% 62.8%
Summit City/County Health Dept 33 37 70 64 134 24.6% 27.6% 52.2% 47.8%
Center for Human Development
Inc. 47 9 56 135 191 24.6% 4.7% 29.3% 70.7%
Larimer Cty Dept of Health &
Env 231 74 305 634 939 24.6% 7.9% 32.5% 67.5%
McLeod County PHNS 40 9 49 114 163 24.5% 5.5% 30.1% 69.9%
Sutter Co Human Srvcs Dept. 191 87 278 501 779 24.5% 11.2% 35.7% 64.3%
Appalachian District Health
Department 89 32 121 242 363 24.5% 8.8% 33.3% 66.7%
Health Reach Network 215 24 239 639 878 24.5% 2.7% 27.2% 72.8%
Davis County Health Dept 314 93 407 879 1,286 24.4% 7.2% 31.6% 68.4%
Ampla Health (Del Norte Clinics) 241 94 335 659 994 24.2% 9.5% 33.7% 66.3%
Butte County WIC Program 15 5 20 42 62 24.2% 8.1% 32.3% 67.7%
Community Health Services,
Inc. 206 9 215 637 852 24.2% 1.1% 25.2% 74.8%
Lewis and Clark County WIC 62 17 79 178 257 24.1% 6.6% 30.7% 69.3%
Cascade County WIC Program 117 23 140 345 485 24.1% 4.7% 28.9% 71.1%
San Mateo County Health
System 672 682 1,354 1,434 2,788 24.1% 24.5% 48.6% 51.4%
First Nations Community
Healthsource 78 31 109 215 324 24.1% 9.6% 33.6% 66.4%
San Ysidro Health Center 768 1,736 2,504 690 3,194 24.0% 54.4% 78.4% 21.6%
Pacific County Public Health &
Human Services 25 9 34 70 104 24.0% 8.7% 32.7% 67.3%
Yavapai County Department 236 187 423 561 984 24.0% 19.0% 43.0% 57.0%
Clark County Health Care
Center 40 16 56 111 167 24.0% 9.6% 33.5% 66.5%
Valley Health and WIC 84 46 130 221 351 23.9% 13.1% 37.0% 63.0%
Teton County WIC Program 21 8 29 59 88 23.9% 9.1% 33.0% 67.0%
Jefferson County Health
Department 36 17 53 98 151 23.8% 11.3% 35.1% 64.9%
St. Louis County Health Dept
(Duluth Office) 118 42 160 337 497 23.7% 8.5% 32.2% 67.8%
Eight Northern Pueblo, NM 14 1 15 44 59 23.7% 1.7% 25.4% 74.6%
Teller County Public
Health/ENV. 14 4 18 41 59 23.7% 6.8% 30.5% 69.5%
*To maintain the privacy of participants, Local Agencies with less than 30 Infant Participants are not published. 56

Fully Formula-Fed
Local Agency
Infant Data
Participation Data Statistical Data
Fully Breastfed Partially Breastfed Total Breastfed Fully Formula-Fed Total Infants Fully Breastfed Partially Breastfed Total Breastfed
Walla Walla County Health
Department 46 26 72 122 194 23.7% 13.4% 37.1% 62.9%
Colville Confederated Tribes 25 6 31 75 106 23.6% 5.7% 29.2% 70.8%
Kauai WIC Program 89 29 118 260 378 23.5% 7.7% 31.2% 68.8%
Transylvania County Health
Department 38 23 61 101 162 23.5% 14.2% 37.7% 62.3%
Confederate Tribes of Umatilla 26 7 33 78 111 23.4% 6.3% 29.7% 70.3%
American Red Cross 1,701 1,489 3,190 4,104 7,294 23.3% 20.4% 43.7% 56.3%
Brighton/Roslindale WIC 110 102 212 261 473 23.3% 21.6% 44.8% 55.2%
Clay County Health Department 13 9 22 34 56 23.2% 16.1% 39.3% 60.7%
Sanders County WIC Program 13 5 18 38 56 23.2% 8.9% 32.1% 67.9%
Tompkins County Health
Department Dept. 80 57 137 208 345 23.2% 16.5% 39.7% 60.3%
Columbia Valley Comm Health 151 110 261 392 653 23.1% 16.8% 40.0% 60.0%
Riverside-San Bernadino Indian
Hlth 46 13 59 140 199 23.1% 6.5% 29.6% 70.4%
Maui Family Support Services 9 3 12 27 39 23.1% 7.7% 30.8% 69.2%
Northeastern Rural Health
Clinics, Inc. 48 15 63 145 208 23.1% 7.2% 30.3% 69.7%
Franklin/Hampshire/North
Quabbin WIC 124 74 198 340 538 23.0% 13.8% 36.8% 63.2%
Sauk County Dept of Health 74 23 97 225 322 23.0% 7.1% 30.1% 69.9%
Bristol Bay Area Health Corp. 28 38 66 56 122 23.0% 31.1% 54.1% 45.9%
Bloomington Public Health 144 116 260 368 628 22.9% 18.5% 41.4% 58.6%
Meeker County PHNS 30 5 35 96 131 22.9% 3.8% 26.7% 73.3%
Apache County Health
Department 24 7 31 74 105 22.9% 6.7% 29.5% 70.5%
Vernon County Health Dept 32 9 41 99 140 22.9% 6.4% 29.3% 70.7%
Camino Health Center 322 356 678 731 1,409 22.9% 25.3% 48.1% 51.9%
Ozark County Health Dept 13 3 16 41 57 22.8% 5.3% 28.1% 71.9%
Grays Harbor County Public H &
SS 79 35 114 233 347 22.8% 10.1% 32.9% 67.1%
Wadena County Public Health
Dept 15 3 18 48 66 22.7% 4.5% 27.3% 72.7%
Multicare Health System 706 269 975 2,135 3,110 22.7% 8.6% 31.4% 68.6%
Adair County Health Department 37 9 46 117 163 22.7% 5.5% 28.2% 71.8%
Salt Lake Valley Health Dept 1,323 876 2,199 3,635 5,834 22.7% 15.0% 37.7% 62.3%
VT Dept Health St. Albans 72 34 106 212 318 22.6% 10.7% 33.3% 66.7%
San Diego State University
Research Foundation 1,675 1,930 3,605 3,799 7,404 22.6% 26.1% 48.7% 51.3%
Tillamook County Health
Department 33 18 51 95 146 22.6% 12.3% 34.9% 65.1%
Brookings County WIC Program 28 19 47 77 124 22.6% 15.3% 37.9% 62.1%
MidCoast Maine Community
Action Program 120 17 137 395 532 22.6% 3.2% 25.8% 74.2%
Delta Hlth Care & Mgt. Serv
Corp 646 329 975 1,895 2,870 22.5% 11.5% 34.0% 66.0%
Home Nursing Agency, WIC
Program 251 19 270 846 1,116 22.5% 1.7% 24.2% 75.8%
Crow Wing County Health
Services 85 23 108 271 379 22.4% 6.1% 28.5% 71.5%
Beltrami County Public Health 74 24 98 232 330 22.4% 7.3% 29.7% 70.3%
Southeastern Utah Dist. Health
Dept 77 26 103 241 344 22.4% 7.6% 29.9% 70.1%
MID MI Comm Action Agency 102 29 131 325 456 22.4% 6.4% 28.7% 71.3%
Dare County Health Department 46 38 84 122 206 22.3% 18.4% 40.8% 59.2%
Puyallup Tribal Health Authority 23 7 30 73 103 22.3% 6.8% 29.1% 70.9%
VT Dept Health Springfield 43 19 62 131 193 22.3% 9.8% 32.1% 67.9%
Portage County Comm Human
Service 61 12 73 201 274 22.3% 4.4% 26.6% 73.4%
Bi-County WIC Program 189 18 207 642 849 22.3% 2.1% 24.4% 75.6%
Koochiching County Public
Health 14 2 16 47 63 22.2% 3.2% 25.4% 74.6%
Weston County WIC Program 12 4 16 38 54 22.2% 7.4% 29.6% 70.4%
Central Valley Indian Health,
Inc. 100 59 159 294 453 22.1% 13.0% 35.1% 64.9%
Kit Carson Cty Health & Hum
Serv 13 5 18 41 59 22.0% 8.5% 30.5% 69.5%
Blue Earth County Government
Center 62 40 102 180 282 22.0% 14.2% 36.2% 63.8%
Meade County Health
Department 18 4 22 60 82 22.0% 4.9% 26.8% 73.2%
Contra Costa County Hlth
Service 1,039 1,077 2,116 2,619 4,735 21.9% 22.7% 44.7% 55.3%
Franciscan Medical Group 345 164 509 1,064 1,573 21.9% 10.4% 32.4% 67.6%
ISLETA PUEBLO,NM 41 16 57 130 187 21.9% 8.6% 30.5% 69.5%
Marion County Health Dept 16 8 24 49 73 21.9% 11.0% 32.9% 67.1%
Meade County WIC Program 16 5 21 52 73 21.9% 6.8% 28.8% 71.2%
Outer Cape WIC 23 20 43 62 105 21.9% 19.0% 41.0% 59.0%
Fillmore County Public Health 21 7 28 68 96 21.9% 7.3% 29.2% 70.8%
Mille Lacs County Community
and Veterans Services 31 11 42 100 142 21.8% 7.7% 29.6% 70.4%
Itasca County Public Health 51 11 62 172 234 21.8% 4.7% 26.5% 73.5%
Madison County Health
Department 30 14 44 94 138 21.7% 10.1% 31.9% 68.1%
Marshall County Health
Department 10 4 14 32 46 21.7% 8.7% 30.4% 69.6%
Dodge County WIC Project 66 23 89 215 304 21.7% 7.6% 29.3% 70.7%
Chester County Health
Department 266 93 359 867 1,226 21.7% 7.6% 29.3% 70.7%
Dickinson Iron District Health
Dept 55 14 69 185 254 21.7% 5.5% 27.2% 72.8%
Sibley County Public Health and
Human Services 21 8 29 68 97 21.6% 8.2% 29.9% 70.1%
Johnson County Community
Health Services 87 47 134 268 402 21.6% 11.7% 33.3% 66.7%
Harney County Health
Department 8 5 13 24 37 21.6% 13.5% 35.1% 64.9%
St. Croix Human Service 52 16 68 173 241 21.6% 6.6% 28.2% 71.8%
Horizon Community Health
Board (Pope County) 14 3 17 48 65 21.5% 4.6% 26.2% 73.8%
Custer (Rosebud) County WIC 35 11 46 117 163 21.5% 6.7% 28.2% 71.8%
*To maintain the privacy of participants, Local Agencies with less than 30 Infant Participants are not published. 57

Fully Formula-Fed
Local Agency
Infant Data
Participation Data Statistical Data
Fully Breastfed Partially Breastfed Total Breastfed Fully Formula-Fed Total Infants Fully Breastfed Partially Breastfed Total Breastfed
Lake County WIC Program 27 13 40 86 126 21.4% 10.3% 31.7% 68.3%
Solano County Health & Social
Services Dept. 499 346 845 1,486 2,331 21.4% 14.8% 36.3% 63.7%
Cowlitz Family Health Center 168 42 210 576 786 21.4% 5.3% 26.7% 73.3%
Wahiawa WIC Program 189 72 261 624 885 21.4% 8.1% 29.5% 70.5%
Polk County Health Center 48 14 62 163 225 21.3% 6.2% 27.6% 72.4%
Benzie Leelanau District Health
Dept 29 13 42 94 136 21.3% 9.6% 30.9% 69.1%
Aitkin County Public Health 13 4 17 44 61 21.3% 6.6% 27.9% 72.1%
Door County Health 26 11 37 85 122 21.3% 9.0% 30.3% 69.7%
Scott County Health Dept 13 7 20 41 61 21.3% 11.5% 32.8% 67.2%
Carson City Health & Human
Services 55 32 87 172 259 21.2% 12.4% 33.6% 66.4%
St Johns County Health
Department 128 62 190 413 603 21.2% 10.3% 31.5% 68.5%
Bon Homme County WIC
Program 7 4 11 22 33 21.2% 12.1% 33.3% 66.7%
Holmes County WIC Program 33 5 38 118 156 21.2% 3.2% 24.4% 75.6%
Northeast Valley Hlth Corp. 2,754 2,928 5,682 7,339 13,021 21.2% 22.5% 43.6% 56.4%
Western Up District Health Dept 72 30 102 239 341 21.1% 8.8% 29.9% 70.1%
First District Health Unit 88 35 123 294 417 21.1% 8.4% 29.5% 70.5%
Buncombe County Health
Department 268 194 462 810 1,272 21.1% 15.3% 36.3% 63.7%
Chisago County Public Health
SVC 36 14 50 121 171 21.1% 8.2% 29.2% 70.8%
Lummi Nation 12 6 18 39 57 21.1% 10.5% 31.6% 68.4%
Taylor County Hlth Dept 16 4 20 56 76 21.1% 5.3% 26.3% 73.7%
Pueblo City/County Health Dept 235 54 289 828 1,117 21.0% 4.8% 25.9% 74.1%
Sarasota County Health
Department 292 180 472 917 1,389 21.0% 13.0% 34.0% 66.0%
Collier County Hlth Department 409 442 851 1,098 1,949 21.0% 22.7% 43.7% 56.3%
Native Health 150 62 212 503 715 21.0% 8.7% 29.7% 70.3%
Broadwater County WIC 9 3 12 31 43 20.9% 7.0% 27.9% 72.1%
Hawaii WIC Program 175 88 263 574 837 20.9% 10.5% 31.4% 68.6%
Klamath County Health
Department 122 30 152 433 585 20.9% 5.1% 26.0% 74.0%
Goodwin Community Health 133 30 163 475 638 20.8% 4.7% 25.5% 74.5%
Southwestern Comm Services 86 20 106 307 413 20.8% 4.8% 25.7% 74.3%
Springfield-Greene Co Hlth Dept 401 141 542 1,388 1,930 20.8% 7.3% 28.1% 71.9%
So Central Comm Act Program 280 56 336 1,013 1,349 20.8% 4.2% 24.9% 75.1%
York County Community Action
Corp. 172 32 204 625 829 20.7% 3.9% 24.6% 75.4%
Christian County Health Dept 75 17 92 271 363 20.7% 4.7% 25.3% 74.7%
Jefferson Cty Dept of Health &
Env 323 129 452 1,114 1,566 20.6% 8.2% 28.9% 71.1%
Belknap-Merrimack CAP 224 74 298 789 1,087 20.6% 6.8% 27.4% 72.6%
VT Dept Health Rutland 65 28 93 223 316 20.6% 8.9% 29.4% 70.6%
Douglas County Health Dept 89 66 155 279 434 20.5% 15.2% 35.7% 64.3%
Broad Top Area Medical Center 101 7 108 386 494 20.4% 1.4% 21.9% 78.1%
South Puget Intertribal Planning
Agency 10 2 12 37 49 20.4% 4.1% 24.5% 75.5%
Cape Cod WIC 119 102 221 368 589 20.2% 17.3% 37.5% 62.5%
City & County of San Francisco
DPH 593 1,317 1,910 1,033 2,943 20.1% 44.8% 64.9% 35.1%
Howell County Hlth Dept.
(SCPHSG) 81 13 94 308 402 20.1% 3.2% 23.4% 76.6%
Gardner Family Care Corp. 488 535 1,023 1,400 2,423 20.1% 22.1% 42.2% 57.8%
Eagle County Nursing Services 41 56 97 108 205 20.0% 27.3% 47.3% 52.7%
Fall River County WIC Program 7 5 12 23 35 20.0% 14.3% 34.3% 65.7%
Lake County WIC Program 9 2 11 34 45 20.0% 4.4% 24.4% 75.6%
Northern Cheyenne Tribe (Lame
Deer) 21 19 40 65 105 20.0% 18.1% 38.1% 61.9%
Winona County PHNS 38 17 55 135 190 20.0% 8.9% 28.9% 71.1%
Cole County Health Dept 93 19 112 354 466 20.0% 4.1% 24.0% 76.0%
San Benito Health Foundation 89 105 194 252 446 20.0% 23.5% 43.5% 56.5%
Sherburne County Public Health
Srv 71 38 109 247 356 19.9% 10.7% 30.6% 69.4%
Jackson County Health
Department 79 41 120 277 397 19.9% 10.3% 30.2% 69.8%
LeSueur County Public Health
Services 24 12 36 85 121 19.8% 9.9% 29.8% 70.2%
Moses Lake Community Health
Center 160 132 292 516 808 19.8% 16.3% 36.1% 63.9%
Becker County WIC Program 39 16 55 142 197 19.8% 8.1% 27.9% 72.1%
Hope Center 76 39 115 269 384 19.8% 10.2% 29.9% 70.1%
Sawyer Co. Health & Human
Services 17 5 22 64 86 19.8% 5.8% 25.6% 74.4%
St. Louis County Health
Department (Virginia Office) 79 21 100 300 400 19.8% 5.3% 25.0% 75.0%
Shenango Valley Urban
League, Inc. 182 19 201 721 922 19.7% 2.1% 21.8% 78.2%
Fond du Lac County Health
Dept 87 25 112 329 441 19.7% 5.7% 25.4% 74.6%
Waimanalo 38 26 64 129 193 19.7% 13.5% 33.2% 66.8%
Clay County WIC Program 12 5 17 44 61 19.7% 8.2% 27.9% 72.1%
Pulaski County Health Dept 83 15 98 324 422 19.7% 3.6% 23.2% 76.8%
Columbia County Chn Service 33 7 40 128 168 19.6% 4.2% 23.8% 76.2%
Upper MO District Health Unit 21 8 29 78 107 19.6% 7.5% 27.1% 72.9%
Dunn County Health Dept 41 10 51 158 209 19.6% 4.8% 24.4% 75.6%
Campbell County WIC Program 58 13 71 225 296 19.6% 4.4% 24.0% 76.0%
Camden County Health Dept 46 14 60 175 235 19.6% 6.0% 25.5% 74.5%
Harvey County Health Dept 43 30 73 147 220 19.5% 13.6% 33.2% 66.8%
Shawano County Health
Department 34 7 41 133 174 19.5% 4.0% 23.6% 76.4%
Weber-Morgan Dist Health Dept 295 122 417 1,094 1,511 19.5% 8.1% 27.6% 72.4%
Lyon County Human Services 49 20 69 182 251 19.5% 8.0% 27.5% 72.5%
Dawson County WIC Program 8 1 9 32 41 19.5% 2.4% 22.0% 78.0%
*To maintain the privacy of participants, Local Agencies with less than 30 Infant Participants are not published. 58

Fully Formula-Fed
Local Agency
Infant Data
Participation Data Statistical Data
Fully Breastfed Partially Breastfed Total Breastfed Fully Formula-Fed Total Infants Fully Breastfed Partially Breastfed Total Breastfed
Murray County Public Health,
Southwest Health and Human
Services 8 2 10 31 41 19.5% 4.9% 24.4% 75.6%
Navajo County WIC Program 80 51 131 279 410 19.5% 12.4% 32.0% 68.0%
Swain County Health
Department 16 15 31 51 82 19.5% 18.3% 37.8% 62.2%
Uinta County WIC Program 31 9 40 119 159 19.5% 5.7% 25.2% 74.8%
Marquette County Health Dept 63 23 86 238 324 19.4% 7.1% 26.5% 73.5%
Cambridge/Somerville WIC 174 307 481 414 895 19.4% 34.3% 53.7% 46.3%
Toe River Health District 60 45 105 204 309 19.4% 14.6% 34.0% 66.0%
Tooele County Health Dept WIC 73 50 123 253 376 19.4% 13.3% 32.7% 67.3%
Open Door Family Medical
Center 92 227 319 156 475 19.4% 47.8% 67.2% 32.8%
Houston County PHNS 12 5 17 45 62 19.4% 8.1% 27.4% 72.6%
Buffalo County Dept of Health 17 9 26 62 88 19.3% 10.2% 29.5% 70.5%
Tri-County Health Dept 34 9 43 133 176 19.3% 5.1% 24.4% 75.6%
Silver Bow County WIC
Program 39 14 53 149 202 19.3% 6.9% 26.2% 73.8%
Fargo/Cass Public Health 132 115 247 438 685 19.3% 16.8% 36.1% 63.9%
Little Peoples Head Start 10 7 17 35 52 19.2% 13.5% 32.7% 67.3%
Branch Hilldale St. Joe Comm.
Hlth Agency 244 91 335 934 1,269 19.2% 7.2% 26.4% 73.6%
Stanislaus County Hlth Srvcs
Agy 891 479 1,370 3,271 4,641 19.2% 10.3% 29.5% 70.5%
JoDaviess County Health Dept 65 28 93 246 339 19.2% 8.3% 27.4% 72.6%
Lawrence WIC Program 18 9 27 67 94 19.1% 9.6% 28.7% 71.3%
Mesa County Health Dept 131 43 174 511 685 19.1% 6.3% 25.4% 74.6%
Horizon Community Health
Board (Douglas County) 34 16 50 128 178 19.1% 9.0% 28.1% 71.9%
Downeast Health Services, INC. 69 9 78 284 362 19.1% 2.5% 21.5% 78.5%
Calumet County Health Dept 28 10 38 109 147 19.0% 6.8% 25.9% 74.1%
Dewitt Piatt Bi County Health 28 8 36 111 147 19.0% 5.4% 24.5% 75.5%
Mid Michigan District Health
Dept 182 69 251 706 957 19.0% 7.2% 26.2% 73.8%
City of Bangor, Health &
Community Services
Department 149 21 170 615 785 19.0% 2.7% 21.7% 78.3%
Brown County PHNS 26 9 35 102 137 19.0% 6.6% 25.5% 74.5%
N Cent PA Reg Plng/Dev
Commission 175 30 205 718 923 19.0% 3.3% 22.2% 77.8%
Lewis County Public Health and
Social Services 103 45 148 396 544 18.9% 8.3% 27.2% 72.8%
Platte County Health Dept 78 41 119 293 412 18.9% 10.0% 28.9% 71.1%
Washington County Hlth Dept 59 26 85 227 312 18.9% 8.3% 27.2% 72.8%
Chippewa County WIC Project 55 24 79 212 291 18.9% 8.2% 27.1% 72.9%
Riverstone County WIC
Program 143 63 206 551 757 18.9% 8.3% 27.2% 72.8%
Sweetwater County WIC
Program 37 14 51 145 196 18.9% 7.1% 26.0% 74.0%
Ozaukee County Department of
Health 47 15 62 187 249 18.9% 6.0% 24.9% 75.1%
Polk County Public Health 36 14 50 141 191 18.8% 7.3% 26.2% 73.8%
Intercare Community Health 605 281 886 2,324 3,210 18.8% 8.8% 27.6% 72.4%
Pike County Health Dept 19 7 26 75 101 18.8% 6.9% 25.7% 74.3%
Carlton County Health Services 31 12 43 122 165 18.8% 7.3% 26.1% 73.9%
Wright County Comm Action,
Inc. 89 47 136 338 474 18.8% 9.9% 28.7% 71.3%
Scott-Carver-Dakota CAP
Agency 107 97 204 366 570 18.8% 17.0% 35.8% 64.2%
Isanti County PHS 41 32 73 147 220 18.6% 14.5% 33.2% 66.8%
Shelby County Health Dept 8 1 9 34 43 18.6% 2.3% 20.9% 79.1%
District Health Dept #10 350 139 489 1,402 1,891 18.5% 7.4% 25.9% 74.1%
Webster County Health Unit 37 10 47 153 200 18.5% 5.0% 23.5% 76.5%
Sunrise Community Health
Center 206 106 312 803 1,115 18.5% 9.5% 28.0% 72.0%
Public Health Foundation
Enterprises, Inc. 10,473 11,460 21,933 34,762 56,695 18.5% 20.2% 38.7% 61.3%
Stone County Health Dept 29 9 38 119 157 18.5% 5.7% 24.2% 75.8%
Texas County Health Dept 29 9 38 119 157 18.5% 5.7% 24.2% 75.8%
Valley Wide Health Services 62 21 83 253 336 18.5% 6.3% 24.7% 75.3%
Riley County Health Dept 164 99 263 626 889 18.4% 11.1% 29.6% 70.4%
Navajo Nation WIC Program 449 538 987 1,447 2,434 18.4% 22.1% 40.6% 59.4%
Morrison County Public Health 33 8 41 138 179 18.4% 4.5% 22.9% 77.1%
Family Health Council of Central
PA, Inc. 613 94 707 2,620 3,327 18.4% 2.8% 21.3% 78.7%
Brockton WIC 236 332 568 713 1,281 18.4% 25.9% 44.3% 55.7%
Wilkin County PHNS 7 2 9 29 38 18.4% 5.3% 23.7% 76.3%
Cass Co Hlth, Hum & Vet
Services 27 9 36 111 147 18.4% 6.1% 24.5% 75.5%
Ste Genevieve County Health
Dept 18 2 20 78 98 18.4% 2.0% 20.4% 79.6%
Peoples Regional Opportunity
Program 157 15 172 683 855 18.4% 1.8% 20.1% 79.9%
Custer Bismarck WIC 85 41 126 337 463 18.4% 8.9% 27.2% 72.8%
Geauga County WIC Program 38 7 45 162 207 18.4% 3.4% 21.7% 78.3%
Douglas County Health Dept 20 6 26 83 109 18.3% 5.5% 23.9% 76.1%
Austin/Travis County Health &
Human Services Dept 1,394 3,225 4,619 3,000 7,619 18.3% 42.3% 60.6% 39.4%
Municipality of Anchorage 262 153 415 1,017 1,432 18.3% 10.7% 29.0% 71.0%
Benton-Franklin Health District 274 164 438 1,060 1,498 18.3% 10.9% 29.2% 70.8%
United Neighborhood Facilities
Hlth Care Corp. 323 38 361 1,405 1,766 18.3% 2.2% 20.4% 79.6%
Phelps County Health Dept 65 31 96 260 356 18.3% 8.7% 27.0% 73.0%
Visiting Nurse Association -
Dubuque 65 32 97 259 356 18.3% 9.0% 27.2% 72.8%
District Health Dept #2 81 26 107 337 444 18.2% 5.9% 24.1% 75.9%
Nassau County Health
Department 131 90 221 499 720 18.2% 12.5% 30.7% 69.3%
Bollinger County Health Center 20 3 23 87 110 18.2% 2.7% 20.9% 79.1%
Osage County Health
Department 8 1 9 35 44 18.2% 2.3% 20.5% 79.5%
Molokai Community Health
Center 25 33 58 80 138 18.1% 23.9% 42.0% 58.0%
*To maintain the privacy of participants, Local Agencies with less than 30 Infant Participants are not published. 59

Fully Formula-Fed
Local Agency
Infant Data
Participation Data Statistical Data
Fully Breastfed Partially Breastfed Total Breastfed Fully Formula-Fed Total Infants Fully Breastfed Partially Breastfed Total Breastfed
Nodaway County Health Center 17 4 21 73 94 18.1% 4.3% 22.3% 77.7%
Dorchester North WIC 72 164 236 163 399 18.0% 41.1% 59.1% 40.9%
Pierce County Public Hlth Dept 22 7 29 93 122 18.0% 5.7% 23.8% 76.2%
Pipestone County Public Health,
Southwest Health and Human
Services 11 10 21 40 61 18.0% 16.4% 34.4% 65.6%
County of Orange Health Care
Agency 985 1,110 2,095 3,369 5,464 18.0% 20.3% 38.3% 61.7%
Henderson County Health
Department 100 89 189 366 555 18.0% 16.0% 34.1% 65.9%
Menard County Health
Department 9 5 14 36 50 18.0% 10.0% 28.0% 72.0%
Wright County Health Dept 34 8 42 147 189 18.0% 4.2% 22.2% 77.8%
Newton County Health Dept 75 31 106 311 417 18.0% 7.4% 25.4% 74.6%
Kanabec County PHNS 16 5 21 68 89 18.0% 5.6% 23.6% 76.4%
Kalamazoo County Human
Services 126 78 204 498 702 17.9% 11.1% 29.1% 70.9%
Platte County WIC 7 1 8 31 39 17.9% 2.6% 20.5% 79.5%
Vilas County Health Dept 7 2 9 30 39 17.9% 5.1% 23.1% 76.9%
Livingston County Health Dept 99 41 140 412 552 17.9% 7.4% 25.4% 74.6%
Garrett County WIC Program 34 14 48 142 190 17.9% 7.4% 25.3% 74.7%
Carson City - Ron Wood WIC 42 27 69 166 235 17.9% 11.5% 29.4% 70.6%
Community Clinic of Maui 85 51 136 340 476 17.9% 10.7% 28.6% 71.4%
Flagler County Health
Department 83 54 137 328 465 17.8% 11.6% 29.5% 70.5%
Nicollet County 24 18 42 93 135 17.8% 13.3% 31.1% 68.9%
Johnson County Public Health 119 116 235 435 670 17.8% 17.3% 35.1% 64.9%
North Slope Borough 19 18 37 70 107 17.8% 16.8% 34.6% 65.4%
Central Mich District Health
Dept WIC 213 83 296 904 1,200 17.8% 6.9% 24.7% 75.3%
Merced County Community
Action Board 624 575 1,199 2,323 3,522 17.7% 16.3% 34.0% 66.0%
Bucks County Health
Department 243 55 298 1,079 1,377 17.6% 4.0% 21.6% 78.4%
Fremont County WIC Program 9 2 11 40 51 17.6% 3.9% 21.6% 78.4%
Harrison Medical Center 12 3 15 53 68 17.6% 4.4% 22.1% 77.9%
Quin County CHS 60 17 77 263 340 17.6% 5.0% 22.6% 77.4%
Reynolds County Health Center 6 1 7 27 34 17.6% 2.9% 20.6% 79.4%
Wood River Health Services 21 7 28 91 119 17.6% 5.9% 23.5% 76.5%
Barry-Eaton District Health
Department 133 50 183 572 755 17.6% 6.6% 24.2% 75.8%
Olmsted County Health Dept 135 166 301 466 767 17.6% 21.6% 39.2% 60.8%
Yakima Valley Farmworkers
Clinic 409 396 805 1,523 2,328 17.6% 17.0% 34.6% 65.4%
Jefferson County Health Dept 10 4 14 43 57 17.5% 7.0% 24.6% 75.4%
Public Health Madison and
Dane County 278 236 514 1,071 1,585 17.5% 14.9% 32.4% 67.6%
Eau Claire City County Health
Dept 91 37 128 391 519 17.5% 7.1% 24.7% 75.3%
Washtenaw Co. Public Hlth.
WIC Clinic 242 193 435 949 1,384 17.5% 13.9% 31.4% 68.6%
Laramie County WIC Program 92 31 123 404 527 17.5% 5.9% 23.3% 76.7%
Adagio Health 450 55 505 2,073 2,578 17.5% 2.1% 19.6% 80.4%
East Boston WIC 135 315 450 324 774 17.4% 40.7% 58.1% 41.9%
Mid-Sioux Opportunities 70 45 115 287 402 17.4% 11.2% 28.6% 71.4%
Lapeer County Health Dept 90 39 129 388 517 17.4% 7.5% 25.0% 75.0%
District Health Dept #4 72 23 95 319 414 17.4% 5.6% 22.9% 77.1%
Walworth County Public Health 67 47 114 272 386 17.4% 12.2% 29.5% 70.5%
Gila County Health Dept 48 33 81 196 277 17.3% 11.9% 29.2% 70.8%
Taney County Health Dept 75 40 115 318 433 17.3% 9.2% 26.6% 73.4%
Bradford Hospital WIC Program 45 - 45 215 260 17.3% 0.0% 17.3% 82.7%
Antelope Valley Healthcare
District 660 378 1,038 2,783 3,821 17.3% 9.9% 27.2% 72.8%
Comm Action Prog/Lanc Co.
Inc. 364 88 452 1,656 2,108 17.3% 4.2% 21.4% 78.6%
Vernon County Health Dept 24 8 32 107 139 17.3% 5.8% 23.0% 77.0%
Andrew County Health Dept. 15 4 19 68 87 17.2% 4.6% 21.8% 78.2%
West Oakland Health Council,
Inc. 41 46 87 151 238 17.2% 19.3% 36.6% 63.4%
Ionia County Health Dept 74 23 97 333 430 17.2% 5.3% 22.6% 77.4%
Haywood County Health
Department 60 28 88 261 349 17.2% 8.0% 25.2% 74.8%
Ventura County Health Care
Agency 878 993 1,871 3,246 5,117 17.2% 19.4% 36.6% 63.4%
Lincoln County Public Health 6 3 9 26 35 17.1% 8.6% 25.7% 74.3%
Lincoln County WIC Program 6 3 9 26 35 17.1% 8.6% 25.7% 74.3%
Saint Rose Dominican Hospitals 148 113 261 604 865 17.1% 13.1% 30.2% 69.8%
Wyandot County WIC Program 21 7 28 95 123 17.1% 5.7% 22.8% 77.2%
Lake County Health Department 8 3 11 36 47 17.0% 6.4% 23.4% 76.6%
Okeechobee County Hlth
Department 65 48 113 269 382 17.0% 12.6% 29.6% 70.4%
Hancock County Health
Department 17 4 21 79 100 17.0% 4.0% 21.0% 79.0%
Carroll County Health Dept 10 3 13 46 59 16.9% 5.1% 22.0% 78.0%
VT Dept. Health Bennington 31 20 51 132 183 16.9% 10.9% 27.9% 72.1%
Kewaunee County Public Health
Department 12 4 16 55 71 16.9% 5.6% 22.5% 77.5%
Price County Health Dept 12 4 16 55 71 16.9% 5.6% 22.5% 77.5%
Fond du Lac Tribal Council 14 7 21 62 83 16.9% 8.4% 25.3% 74.7%
Harrison County Health Dept 14 3 17 66 83 16.9% 3.6% 20.5% 79.5%
McDonough County Health
Department 24 15 39 104 143 16.8% 10.5% 27.3% 72.7%
Brevard County Health Dept 450 348 798 1,884 2,682 16.8% 13.0% 29.8% 70.2%
Tuscola County Health Dept 60 12 72 287 359 16.7% 3.3% 20.1% 79.9%
Livingston County Department
of Health 63 27 90 287 377 16.7% 7.2% 23.9% 76.1%
Brule County WIC Program 6 3 9 27 36 16.7% 8.3% 25.0% 75.0%
Burnett County Dept of HHS 12 4 16 56 72 16.7% 5.6% 22.2% 77.8%
Fremont County WIC Program 21 6 27 99 126 16.7% 4.8% 21.4% 78.6%
Laclede County Health Dept 54 18 72 252 324 16.7% 5.6% 22.2% 77.8%
*To maintain the privacy of participants, Local Agencies with less than 30 Infant Participants are not published. 60

Fully Formula-Fed
Local Agency
Infant Data
Participation Data Statistical Data
Fully Breastfed Partially Breastfed Total Breastfed Fully Formula-Fed Total Infants Fully Breastfed Partially Breastfed Total Breastfed
Mattawa Community Medical
Clinic 9 22 31 23 54 16.7% 40.7% 57.4% 42.6%
MeritCare Union Hospital 7 4 11 31 42 16.7% 9.5% 26.2% 73.8%
Norton Sound Health Corp. 26 30 56 100 156 16.7% 19.2% 35.9% 64.1%
Orange County Health
Department 215 567 782 508 1,290 16.7% 44.0% 60.6% 39.4%
Stevens County Health
Department 10 5 15 45 60 16.7% 8.3% 25.0% 75.0%
Tri County Health Dept 13 4 17 61 78 16.7% 5.1% 21.8% 78.2%
Williamson County Cities Health
District 330 560 890 1,090 1,980 16.7% 28.3% 44.9% 55.1%
Waianae Coast Comp Health
Center 176 80 256 802 1,058 16.6% 7.6% 24.2% 75.8%
Wood County Health
Department 59 21 80 275 355 16.6% 5.9% 22.5% 77.5%
Stearns County Public Health,
WIC 121 129 250 479 729 16.6% 17.7% 34.3% 65.7%
Yakama Nation 24 9 33 112 145 16.6% 6.2% 22.8% 77.2%
Clinton County Health Dept 22 6 28 105 133 16.5% 4.5% 21.1% 78.9%
Lawrence County Health Dept 40 14 54 188 242 16.5% 5.8% 22.3% 77.7%
Sherman County Health Dept 20 9 29 92 121 16.5% 7.4% 24.0% 76.0%
Cedar County Health Dept 18 5 23 86 109 16.5% 4.6% 21.1% 78.9%
Madison County Health Dept 18 2 20 89 109 16.5% 1.8% 18.3% 81.7%
Tioga Opportunities Program,
Inc 44 21 65 202 267 16.5% 7.9% 24.3% 75.7%
Carbon County WIC Program 13 8 21 58 79 16.5% 10.1% 26.6% 73.4%
Grundy County Health Dept 13 2 15 64 79 16.5% 2.5% 19.0% 81.0%
Macon County Health
Department 36 32 68 151 219 16.4% 14.6% 31.1% 68.9%
Lee County Health Department 32 13 45 150 195 16.4% 6.7% 23.1% 76.9%
Jackson County Health
Department 31 23 54 135 189 16.4% 12.2% 28.6% 71.4%
Linn County Health Dept (SEK) 10 6 16 45 61 16.4% 9.8% 26.2% 73.8%
Kings County Dept. of Public
Health 277 196 473 1,218 1,691 16.4% 11.6% 28.0% 72.0%
S.Central KS Coal Public Health 38 21 59 173 232 16.4% 9.1% 25.4% 74.6%
First Choice Community
Healthcare 343 167 510 1,590 2,100 16.3% 8.0% 24.3% 75.7%
Hickory County Dept 8 1 9 40 49 16.3% 2.0% 18.4% 81.6%
Natrona County WIC Program 67 21 88 323 411 16.3% 5.1% 21.4% 78.6%
Countryside PHNS-Benson Off 52 29 81 238 319 16.3% 9.1% 25.4% 74.6%
County of Tulare Health and
Human Services Agency 950 648 1,598 4,230 5,828 16.3% 11.1% 27.4% 72.6%
El Paso County Dept of Health
& E 593 259 852 2,790 3,642 16.3% 7.1% 23.4% 76.6%
Graham County Health Dept 7 3 10 33 43 16.3% 7.0% 23.3% 76.7%
Tri-Cities Community Health 121 125 246 498 744 16.3% 16.8% 33.1% 66.9%
Mon Valley Comm Hlth SVCS,
Inc. 200 25 225 1,008 1,233 16.2% 2.0% 18.2% 81.8%
Cloud County Health
Department 24 13 37 111 148 16.2% 8.8% 25.0% 75.0%
Grant County Health Dept 36 11 47 175 222 16.2% 5.0% 21.2% 78.8%
Tripp/Todd County WIC
Program 6 1 7 30 37 16.2% 2.7% 18.9% 81.1%
Santa Rosa County Health
Department 128 46 174 616 790 16.2% 5.8% 22.0% 78.0%
Okaloosa County Health
Department 205 151 356 911 1,267 16.2% 11.9% 28.1% 71.9%
Comm Act. Partnership of
Cambria Co. 106 16 122 534 656 16.2% 2.4% 18.6% 81.4%
Guam WIC Program 301 282 583 1,280 1,863 16.2% 15.1% 31.3% 68.7%
Shiawassee County Health Dept 77 51 128 349 477 16.1% 10.7% 26.8% 73.2%
Chariton County Health Center 5 2 7 24 31 16.1% 6.5% 22.6% 77.4%
Freeborn County 35 19 54 163 217 16.1% 8.8% 24.9% 75.1%
Osborne County Health Dept 50 26 76 234 310 16.1% 8.4% 24.5% 75.5%
WIC State Office 1,910 873 2,783 9,064 11,847 16.1% 7.4% 23.5% 76.5%
City of San Marcos 356 483 839 1,372 2,211 16.1% 21.8% 37.9% 62.1%
NE Nebraska Family Health
Services 42 20 62 199 261 16.1% 7.7% 23.8% 76.2%
Chelan-Douglas Health District 29 12 41 140 181 16.0% 6.6% 22.7% 77.3%
Waupaca County Dept Human
Servs 33 12 45 161 206 16.0% 5.8% 21.8% 78.2%
Johnson County Health Dept 265 243 508 1,147 1,655 16.0% 14.7% 30.7% 69.3%
Osceola County Hlth
Department 441 387 828 1,929 2,757 16.0% 14.0% 30.0% 70.0%
Faribault County Public Health
Service 11 5 16 53 69 15.9% 7.2% 23.2% 76.8%
Oklahoma City Indian Clinic 33 32 65 142 207 15.9% 15.5% 31.4% 68.6%
Pettis County Health Center 63 34 97 300 397 15.9% 8.6% 24.4% 75.6%
Pine County Public Health &
Human Services 23 6 29 116 145 15.9% 4.1% 20.0% 80.0%
Waukesha County Dept Hum
Ser 87 49 136 413 549 15.8% 8.9% 24.8% 75.2%
Charlotte County Health
Department 109 46 155 533 688 15.8% 6.7% 22.5% 77.5%
Washington County WIC
Program 155 89 244 735 979 15.8% 9.1% 24.9% 75.1%
Cherokee County Health
Department 25 6 31 127 158 15.8% 3.8% 19.6% 80.4%
Martin County Public Health
Service 18 12 30 84 114 15.8% 10.5% 26.3% 73.7%
Central Nebraska Community
Services 43 25 68 205 273 15.8% 9.2% 24.9% 75.1%
Woodford County Health
Department 17 3 20 88 108 15.7% 2.8% 18.5% 81.5%
Umatilla Morrow Headstart 141 72 213 683 896 15.7% 8.0% 23.8% 76.2%
Columbia Basin Health
Association 87 170 257 296 553 15.7% 30.7% 46.5% 53.5%
Montgomery County Health
Dept 14 2 16 73 89 15.7% 2.2% 18.0% 82.0%
*To maintain the privacy of participants, Local Agencies with less than 30 Infant Participants are not published. 61

Fully Formula-Fed
Local Agency
Infant Data
Participation Data Statistical Data
Fully Breastfed Partially Breastfed Total Breastfed Fully Formula-Fed Total Infants Fully Breastfed Partially Breastfed Total Breastfed
Western Maine Cap 159 31 190 822 1,012 15.7% 3.1% 18.8% 81.2%
Bond County Health Dept 19 7 26 95 121 15.7% 5.8% 21.5% 78.5%
City of Long Beach DHHS 809 889 1,698 3,456 5,154 15.7% 17.2% 32.9% 67.1%
Butler County Health Dept 35 19 54 169 223 15.7% 8.5% 24.2% 75.8%
NC-E. Cherokee Reservation 21 19 40 94 134 15.7% 14.2% 29.9% 70.1%
Steele County PHNS 34 37 71 146 217 15.7% 17.1% 32.7% 67.3%
Chelsea/Revere WIC 174 326 500 611 1,111 15.7% 29.3% 45.0% 55.0%
Prowers County Nursing Service 18 5 23 92 115 15.7% 4.3% 20.0% 80.0%
Pennington County WIC
Program 125 81 206 593 799 15.6% 10.1% 25.8% 74.2%
Seminole County Health
Department 300 313 613 1,305 1,918 15.6% 16.3% 32.0% 68.0%
Cumberland County Health Dept 10 3 13 51 64 15.6% 4.7% 20.3% 79.7%
Custer County WIC Program 5 4 9 23 32 15.6% 12.5% 28.1% 71.9%
Davison County WIC Program 19 10 29 93 122 15.6% 8.2% 23.8% 76.2%
Wayne County WIC Program 83 23 106 427 533 15.6% 4.3% 19.9% 80.1%
Planned Parenthood of
Arkansas and Eastern OK 113 31 144 582 726 15.6% 4.3% 19.8% 80.2%
Juneau County Health Dept 40 15 55 202 257 15.6% 5.8% 21.4% 78.6%
Preble County WIC Program 40 4 44 213 257 15.6% 1.6% 17.1% 82.9%
Monroe County Health
Department 7 3 10 35 45 15.6% 6.7% 22.2% 77.8%
Martin County Health
Department 102 138 240 416 656 15.5% 21.0% 36.6% 63.4%
Barton County Health Dept 13 2 15 69 84 15.5% 2.4% 17.9% 82.1%
Dodge County PHNS 15 10 25 72 97 15.5% 10.3% 25.8% 74.2%
Renville County Public Health
Services, WIC 15 6 21 76 97 15.5% 6.2% 21.6% 78.4%
Winnebago County WIC Project 100 48 148 499 647 15.5% 7.4% 22.9% 77.1%
Morgan County Health Center 21 3 24 112 136 15.4% 2.2% 17.6% 82.4%
OK Chickasaw Nation WIC
Program 140 33 173 734 907 15.4% 3.6% 19.1% 80.9%
Monroe County Health Dept 35 15 50 177 227 15.4% 6.6% 22.0% 78.0%
Yukon-Kuskokwim Health Corp. 84 203 287 258 545 15.4% 37.2% 52.7% 47.3%
Henry County Health Center 24 5 29 127 156 15.4% 3.2% 18.6% 81.4%
St. Elizabeth's Health Center 24 41 65 91 156 15.4% 26.3% 41.7% 58.3%
Valley County WIC Program 6 2 8 31 39 15.4% 5.1% 20.5% 79.5%
Waseca County Public Health
Services 16 7 23 81 104 15.4% 6.7% 22.1% 77.9%
Christus Santa Rosa Health
Care 202 312 514 800 1,314 15.4% 23.7% 39.1% 60.9%
Leeward WIC Program 140 123 263 648 911 15.4% 13.5% 28.9% 71.1%
Clay County Public Health
Center 104 40 144 533 677 15.4% 5.9% 21.3% 78.7%
Saint Mary's Foundation 139 131 270 637 907 15.3% 14.4% 29.8% 70.2%
Wabasha County Public Health
Services 15 6 21 77 98 15.3% 6.1% 21.4% 78.6%
Randolph County Health Dept 28 6 34 149 183 15.3% 3.3% 18.6% 81.4%
Montrose County Nursing
Service 37 29 66 176 242 15.3% 12.0% 27.3% 72.7%
Monroe County Health
Department 49 83 132 189 321 15.3% 25.9% 41.1% 58.9%
San Bernardino County DPH 2,610 1,735 4,345 12,764 17,109 15.3% 10.1% 25.4% 74.6%
Adams County Health
Department 9 4 13 46 59 15.3% 6.8% 22.0% 78.0%
Denver Health Medical Center 508 479 987 2,348 3,335 15.2% 14.4% 29.6% 70.4%
City-County Health Dept 7 4 11 35 46 15.2% 8.7% 23.9% 76.1%
Taunton/Attleboro WIC 112 62 174 562 736 15.2% 8.4% 23.6% 76.4%
North Suburban WIC 116 198 314 449 763 15.2% 26.0% 41.2% 58.8%
Clay County Health Dept 45 39 84 212 296 15.2% 13.2% 28.4% 71.6%
Indian River County Health
Department 115 141 256 501 757 15.2% 18.6% 33.8% 66.2%
Rusk County Dept of HHS 12 3 15 64 79 15.2% 3.8% 19.0% 81.0%
Wilson County Health Dept 12 5 17 62 79 15.2% 6.3% 21.5% 78.5%
Caroline County WIC Program 111 82 193 539 732 15.2% 11.2% 26.4% 73.6%
Harford County WIC Program 232 137 369 1,163 1,532 15.1% 8.9% 24.1% 75.9%
South W Comm Action Program 36 16 52 186 238 15.1% 6.7% 21.8% 78.2%
Anne Arundel County WIC
Program 350 339 689 1,625 2,314 15.1% 14.6% 29.8% 70.2%
Randolph/Elkins Health 142 47 189 751 940 15.1% 5.0% 20.1% 79.9%
Inland Behavioral and Health
Services, Inc. 61 39 100 304 404 15.1% 9.7% 24.8% 75.2%
Columbia Health Dept of Public
Health & Human Service 108 81 189 527 716 15.1% 11.3% 26.4% 73.6%
Manitowoc County Health Dept 50 20 70 262 332 15.1% 6.0% 21.1% 78.9%
Todd County PHNS 23 18 41 112 153 15.0% 11.8% 26.8% 73.2%
Berkshire North WIC 78 55 133 386 519 15.0% 10.6% 25.6% 74.4%
Codington County WIC Program 26 7 33 140 173 15.0% 4.0% 19.1% 80.9%
Comm. Action Partnership of
Kern 575 498 1,073 2,753 3,826 15.0% 13.0% 28.0% 72.0%
Sixteenth Street Comm Hlth Ctr 215 256 471 960 1,431 15.0% 17.9% 32.9% 67.1%
Allen County Health Department 27 11 38 142 180 15.0% 6.1% 21.1% 78.9%
St. Regis Mohawk Services 9 8 17 43 60 15.0% 13.3% 28.3% 71.7%
Family Service WIC Program 90 85 175 426 601 15.0% 14.1% 29.1% 70.9%
Piedmont Health Services 165 280 445 657 1,102 15.0% 25.4% 40.4% 59.6%
North Central WIC 139 122 261 670 931 14.9% 13.1% 28.0% 72.0%
United Health Centers of San
Joaquin Valley 651 629 1,280 3,087 4,367 14.9% 14.4% 29.3% 70.7%
Whitley County Health
Department 24 10 34 127 161 14.9% 6.2% 21.1% 78.9%
Broome County Health
Department 165 105 270 837 1,107 14.9% 9.5% 24.4% 75.6%
Dallas County Health Dept 14 3 17 77 94 14.9% 3.2% 18.1% 81.9%
Washington County WIC
Program, Dept of Public Health
and Environment 100 110 210 462 672 14.9% 16.4% 31.3% 68.8%
*To maintain the privacy of participants, Local Agencies with less than 30 Infant Participants are not published. 62

Fully Formula-Fed
Local Agency
Infant Data
Participation Data Statistical Data
Fully Breastfed Partially Breastfed Total Breastfed Fully Formula-Fed Total Infants Fully Breastfed Partially Breastfed Total Breastfed
Planned Parenthood of Orange
& San Bernardino Counties 487 595 1,082 2,194 3,276 14.9% 18.2% 33.0% 67.0%
Medina County WIC Program 71 21 92 386 478 14.9% 4.4% 19.2% 80.8%
Brown County WIC Program 30 8 38 164 202 14.9% 4.0% 18.8% 81.2%
Warren County Health Services 46 29 75 235 310 14.8% 9.4% 24.2% 75.8%
Joplin City Health Dept 145 57 202 776 978 14.8% 5.8% 20.7% 79.3%
Oneida County Health Dept 20 10 30 105 135 14.8% 7.4% 22.2% 77.8%
Family Plan Health Services 121 36 157 660 817 14.8% 4.4% 19.2% 80.8%
Plymouth WIC 78 54 132 395 527 14.8% 10.2% 25.0% 75.0%
Sek Multi-County Health Dept 9 6 15 46 61 14.8% 9.8% 24.6% 75.4%
Washoe County District 199 132 331 1,018 1,349 14.8% 9.8% 24.5% 75.5%
Outagamie Dept of Health &
Human Svs 95 47 142 502 644 14.8% 7.3% 22.0% 78.0%
Wayne County Health Dept 23 6 29 127 156 14.7% 3.8% 18.6% 81.4%
Noble County WIC Program 14 3 17 78 95 14.7% 3.2% 17.9% 82.1%
Public Health Dept Menominee 54 19 73 294 367 14.7% 5.2% 19.9% 80.1%
La Crosse County Health Dept 76 39 115 402 517 14.7% 7.5% 22.2% 77.8%
Inter-Tribal, NV 42 30 72 214 286 14.7% 10.5% 25.2% 74.8%
Ogle County Health Dept 37 22 59 193 252 14.7% 8.7% 23.4% 76.6%
LA Biomed Research Inst @
Harbor UCLA Med Ctr 2,438 2,994 5,432 11,219 16,651 14.6% 18.0% 32.6% 67.4%
Benton County Health Dept 13 2 15 74 89 14.6% 2.2% 16.9% 83.1%
Marinette County Health Dept 27 5 32 153 185 14.6% 2.7% 17.3% 82.7%
Thomas Jefferson District 129 104 233 652 885 14.6% 11.8% 26.3% 73.7%
Howard County WIC Program 132 274 406 501 907 14.6% 30.2% 44.8% 55.2%
Greenlee County Health Dept 9 9 18 44 62 14.5% 14.5% 29.0% 71.0%
Barron County Public Health 37 20 57 198 255 14.5% 7.8% 22.4% 77.6%
Clinton County Department of
Public Health 58 29 87 313 400 14.5% 7.3% 21.8% 78.3%
San Joaquin Public Hlth Srvcs 351 322 673 1,751 2,424 14.5% 13.3% 27.8% 72.2%
Pershing County 49 39 88 251 339 14.5% 11.5% 26.0% 74.0%
Monroe County Health
Department 13 5 18 72 90 14.4% 5.6% 20.0% 80.0%
Children's Home Society of New
Jersey's Mercer WIC Program 249 354 603 1,122 1,725 14.4% 20.5% 35.0% 65.0%
Champaign County WIC
Program 28 7 35 159 194 14.4% 3.6% 18.0% 82.0%
McHenry County Health
Department 141 202 343 635 978 14.4% 20.7% 35.1% 64.9%
Tippecanoe County Health Dept 153 87 240 822 1,062 14.4% 8.2% 22.6% 77.4%
North W Comm Service Agency 35 10 45 198 243 14.4% 4.1% 18.5% 81.5%
Tri-County Health Dept 935 758 1,693 4,804 6,497 14.4% 11.7% 26.1% 73.9%
Luce-Mackinac-Alger Dist
Health Dept 27 11 38 150 188 14.4% 5.9% 20.2% 79.8%
Athens/Perry County WIC
Program 84 11 95 491 586 14.3% 1.9% 16.2% 83.8%
Delaware Opportunities, Inc. 29 19 48 155 203 14.3% 9.4% 23.6% 76.4%
Jackson County Public Health
Service 15 11 26 79 105 14.3% 10.5% 24.8% 75.2%
Pamlico County Health
Department 11 16 27 50 77 14.3% 20.8% 35.1% 64.9%
Yakima Neighborhood Health
Services 140 170 310 670 980 14.3% 17.3% 31.6% 68.4%
Forsyth County Health
Department 365 617 982 1,575 2,557 14.3% 24.1% 38.4% 61.6%
Truman Medical Center WIC 512 394 906 2,684 3,590 14.3% 11.0% 25.2% 74.8%
Margaret Hudson Program 50 33 83 268 351 14.2% 9.4% 23.6% 76.4%
Indiana University Health
Bloomington, Inc. 100 57 157 547 704 14.2% 8.1% 22.3% 77.7%
Burlington County WIC Program 178 174 352 902 1,254 14.2% 13.9% 28.1% 71.9%
Cortland County Community
Action Program, Inc. 40 19 59 224 283 14.1% 6.7% 20.8% 79.2%
Hill County WIC Program 13 9 22 70 92 14.1% 9.8% 23.9% 76.1%
Kokua Kalihi Valley Health
Center 51 41 92 269 361 14.1% 11.4% 25.5% 74.5%
Essex County Public Health 24 15 39 131 170 14.1% 8.8% 22.9% 77.1%
Clay County Health Department 124 103 227 652 879 14.1% 11.7% 25.8% 74.2%
Richland County 11 11 22 56 78 14.1% 14.1% 28.2% 71.8%
Marana Health Center 226 271 497 1,106 1,603 14.1% 16.9% 31.0% 69.0%
Oneida Community Health
Center 20 6 26 116 142 14.1% 4.2% 18.3% 81.7%
Graham County Dept Health 38 24 62 208 270 14.1% 8.9% 23.0% 77.0%
Western Comm. Health
Resources 19 15 34 101 135 14.1% 11.1% 25.2% 74.8%
Marshall County Health Dept 46 24 70 257 327 14.1% 7.3% 21.4% 78.6%
Wabash County Health Dept 18 7 25 103 128 14.1% 5.5% 19.5% 80.5%
Muskegon County Health Dept 249 114 363 1,410 1,773 14.0% 6.4% 20.5% 79.5%
Christian County Health
Department 172 133 305 920 1,225 14.0% 10.9% 24.9% 75.1%
Allegany County Department of
Health 32 11 43 185 228 14.0% 4.8% 18.9% 81.1%
Guiding Right, Inc. 48 26 74 268 342 14.0% 7.6% 21.6% 78.4%
Carroll County WIC Program 71 58 129 378 507 14.0% 11.4% 25.4% 74.6%
Calloway County Health
Department 35 31 66 184 250 14.0% 12.4% 26.4% 73.6%
Woodford County Health
Department 21 12 33 117 150 14.0% 8.0% 22.0% 78.0%
Huron County Health Dept 27 8 35 158 193 14.0% 4.1% 18.1% 81.9%
Barton County Health Dept 47 19 66 270 336 14.0% 5.7% 19.6% 80.4%
Community Progress Council,
Inc. 220 49 269 1,304 1,573 14.0% 3.1% 17.1% 82.9%
Hill Country Memorial Hospital,
WIC Administration Office 73 181 254 269 523 14.0% 34.6% 48.6% 51.4%
Schoharie County Community
Action Program 18 9 27 102 129 14.0% 7.0% 20.9% 79.1%
Broward County Hlth
Department 1,522 2,695 4,217 6,700 10,917 13.9% 24.7% 38.6% 61.4%
*To maintain the privacy of participants, Local Agencies with less than 30 Infant Participants are not published. 63

Fully Formula-Fed
Local Agency
Infant Data
Participation Data Statistical Data
Fully Breastfed Partially Breastfed Total Breastfed Fully Formula-Fed Total Infants Fully Breastfed Partially Breastfed Total Breastfed
Clinicas De Salud Del Pueblo 258 238 496 1,356 1,852 13.9% 12.9% 26.8% 73.2%
Jefferson County Health
Department 50 39 89 270 359 13.9% 10.9% 24.8% 75.2%
Purchase District 102 76 178 555 733 13.9% 10.4% 24.3% 75.7%
Dent County Health Center 16 3 19 96 115 13.9% 2.6% 16.5% 83.5%
Cochise County Dept Health 125 121 246 657 903 13.8% 13.4% 27.2% 72.8%
Williams County WIC Program 33 9 42 197 239 13.8% 3.8% 17.6% 82.4%
New Hanover County Health
Department 143 93 236 802 1,038 13.8% 9.0% 22.7% 77.3%
South Central WIC 138 105 243 760 1,003 13.8% 10.5% 24.2% 75.8%
Saline County Health Dept 29 19 48 163 211 13.7% 9.0% 22.7% 77.3%
Union County Health
Department 134 165 299 676 975 13.7% 16.9% 30.7% 69.3%
Maternal & Family Hlth Svcs,
Inc. 1,789 416 2,205 10,814 13,019 13.7% 3.2% 16.9% 83.1%
Lincoln County Health
Department 14 9 23 79 102 13.7% 8.8% 22.5% 77.5%
Community Council of South
Central TX, Inc 87 60 147 488 635 13.7% 9.4% 23.1% 76.9%
Queen Anne's County WIC
Program 43 28 71 243 314 13.7% 8.9% 22.6% 77.4%
New Opportunities 61 46 107 339 446 13.7% 10.3% 24.0% 76.0%
Fulton County Health
Department 28 13 41 164 205 13.7% 6.3% 20.0% 80.0%
Sheridan County WIC Program 6 5 11 33 44 13.6% 11.4% 25.0% 75.0%
Turner County WIC
Program/Pioneer Memorial
Hospital 6 2 8 36 44 13.6% 4.5% 18.2% 81.8%
Henry County Health
Department 38 18 56 223 279 13.6% 6.5% 20.1% 79.9%
Kent County Health Dept 642 470 1,112 3,602 4,714 13.6% 10.0% 23.6% 76.4%
Jackson County Health Dept 165 80 245 967 1,212 13.6% 6.6% 20.2% 79.8%
Central District Health Dept. 70 97 167 348 515 13.6% 18.8% 32.4% 67.6%
Collin County Health Care
Services 390 1,017 1,407 1,473 2,880 13.5% 35.3% 48.9% 51.1%
Cudahy Health Department 85 39 124 504 628 13.5% 6.2% 19.7% 80.3%
San Angelo (City of) 146 127 273 806 1,079 13.5% 11.8% 25.3% 74.7%
Jersey County Health Dept 15 5 20 91 111 13.5% 4.5% 18.0% 82.0%
Mercer County Health Dept 10 7 17 57 74 13.5% 9.5% 23.0% 77.0%
Anoka County Community
Health & Environmental
Services 174 194 368 921 1,289 13.5% 15.1% 28.5% 71.5%
Onslow County Health
Department 283 179 462 1,635 2,097 13.5% 8.5% 22.0% 78.0%
Hughes County WIC Program 12 1 13 76 89 13.5% 1.1% 14.6% 85.4%
Knox County Health Dept 45 18 63 271 334 13.5% 5.4% 18.9% 81.1%
Denton County Health
Department 443 949 1,392 1,898 3,290 13.5% 28.8% 42.3% 57.7%
Northeast Comm Action Center 65 34 99 384 483 13.5% 7.0% 20.5% 79.5%
Dekalb County Health Dept 64 92 156 320 476 13.4% 19.3% 32.8% 67.2%
LaGrange County Health Dept 16 11 27 92 119 13.4% 9.2% 22.7% 77.3%
Virginia Beach District 298 212 510 1,710 2,220 13.4% 9.5% 23.0% 77.0%
Community Action Partnership
of Western Nebraska 43 22 65 256 321 13.4% 6.9% 20.2% 79.8%
Greene County WIC Program 82 16 98 515 613 13.4% 2.6% 16.0% 84.0%
Mid-Iowa Comm Action 185 156 341 1,042 1,383 13.4% 11.3% 24.7% 75.3%
Carter County Health Center 8 2 10 50 60 13.3% 3.3% 16.7% 83.3%
Cooper County Public Health
Center 10 2 12 63 75 13.3% 2.7% 16.0% 84.0%
Cottonwood Jackson CHS 20 12 32 118 150 13.3% 8.0% 21.3% 78.7%
Dade County Health Dept 6 2 8 37 45 13.3% 4.4% 17.8% 82.2%
Downriver 112 87 199 641 840 13.3% 10.4% 23.7% 76.3%
Dakota County Public Health
Dept 208 398 606 958 1,564 13.3% 25.4% 38.7% 61.3%
Fulton/Henry County WIC
Program 52 14 66 325 391 13.3% 3.6% 16.9% 83.1%
Benton County Public Health 26 15 41 155 196 13.3% 7.7% 20.9% 79.1%
Peoples Family Health Services 48 33 81 281 362 13.3% 9.1% 22.4% 77.6%
Lyon County Health Dept 36 32 68 204 272 13.2% 11.8% 25.0% 75.0%
Allegany County WIC Program 61 21 82 379 461 13.2% 4.6% 17.8% 82.2%
Bell Co. Public Health District 590 903 1,493 2,982 4,475 13.2% 20.2% 33.4% 66.6%
Webster County Health
Department 66 57 123 378 501 13.2% 11.4% 24.6% 75.4%
ProAction of Steuben & Yates,
Inc 67 29 96 413 509 13.2% 5.7% 18.9% 81.1%
Redwood County PHNS 15 4 19 95 114 13.2% 3.5% 16.7% 83.3%
White Mountain Apache Tribe 33 26 59 192 251 13.1% 10.4% 23.5% 76.5%
Cass County Health Dept 49 26 75 298 373 13.1% 7.0% 20.1% 79.9%
Pima County Health Department 406 433 839 2,253 3,092 13.1% 14.0% 27.1% 72.9%
Family Care Health Center 86 71 157 498 655 13.1% 10.8% 24.0% 76.0%
Samuel U Rodgers Health
Center, Inc. 94 151 245 471 716 13.1% 21.1% 34.2% 65.8%
Variety Care 206 166 372 1,198 1,570 13.1% 10.6% 23.7% 76.3%
Barry Co Health Dept 48 23 71 295 366 13.1% 6.3% 19.4% 80.6%
Bracken County Health
Department 11 9 20 64 84 13.1% 10.7% 23.8% 76.2%
Confederated Salish & Kootenai
Tribes (Flathead Res) 11 8 19 65 84 13.1% 9.5% 22.6% 77.4%
Stephenson County Health Dept 39 16 55 243 298 13.1% 5.4% 18.5% 81.5%
Opportunities For Otsego, Inc. 31 21 52 185 237 13.1% 8.9% 21.9% 78.1%
Allegheny County Health
Department 580 132 712 3,723 4,435 13.1% 3.0% 16.1% 83.9%
Hocking County WIC Program 26 4 30 169 199 13.1% 2.0% 15.1% 84.9%
Pottawattamie County 88 69 157 517 674 13.1% 10.2% 23.3% 76.7%
Daviess County Health Dept 6 2 8 38 46 13.0% 4.3% 17.4% 82.6%
Knox County Regional Office 255 211 466 1,491 1,957 13.0% 10.8% 23.8% 76.2%
Mower County PHNS 40 51 91 216 307 13.0% 16.6% 29.6% 70.4%
Livingston County Health Center 13 2 15 85 100 13.0% 2.0% 15.0% 85.0%
Wayne County Health Center 13 3 16 84 100 13.0% 3.0% 16.0% 84.0%
Pasco County Health
Department 305 242 547 1,801 2,348 13.0% 10.3% 23.3% 76.7%
*To maintain the privacy of participants, Local Agencies with less than 30 Infant Participants are not published. 64

Fully Formula-Fed
Local Agency
Infant Data
Participation Data Statistical Data
Fully Breastfed Partially Breastfed Total Breastfed Fully Formula-Fed Total Infants Fully Breastfed Partially Breastfed Total Breastfed
Abilene-Taylor County Public
Health Dist. 150 116 266 891 1,157 13.0% 10.0% 23.0% 77.0%
Converse County WIC Program 7 1 8 46 54 13.0% 1.9% 14.8% 85.2%
Du Page County Health
Department 391 641 1,032 1,986 3,018 13.0% 21.2% 34.2% 65.8%
Oldham County Health
Department 25 56 81 112 193 13.0% 29.0% 42.0% 58.0%
Community Action Agency 78 59 137 466 603 12.9% 9.8% 22.7% 77.3%
Medina County Health
Department 53 34 87 323 410 12.9% 8.3% 21.2% 78.8%
Arc Rehab Service, Inc. 23 7 30 148 178 12.9% 3.9% 16.9% 83.1%
Laurel County Health
Department 63 38 101 387 488 12.9% 7.8% 20.7% 79.3%
Central WV WIC 108 34 142 695 837 12.9% 4.1% 17.0% 83.0%
Grant County WIC Program 4 3 7 24 31 12.9% 9.7% 22.6% 77.4%
Pike County Health Dept 16 2 18 106 124 12.9% 1.6% 14.5% 85.5%
Sanailac County Health Dept 32 20 52 196 248 12.9% 8.1% 21.0% 79.0%
Washington County Public
Health Services 48 32 80 292 372 12.9% 8.6% 21.5% 78.5%
Sullivan County Public Health
Nursing Service 61 79 140 333 473 12.9% 16.7% 29.6% 70.4%
Geary County Health Dept 41 31 72 246 318 12.9% 9.7% 22.6% 77.4%
Neosho County Health Dept 17 12 29 103 132 12.9% 9.1% 22.0% 78.0%
Leavenworth Co. Health Dept 43 18 61 273 334 12.9% 5.4% 18.3% 81.7%
Kansas City Health Department 18 16 34 106 140 12.9% 11.4% 24.3% 75.7%
University of Miami WIC Project 124 332 456 509 965 12.8% 34.4% 47.3% 52.7%
Tri-Town Health Center 48 21 69 305 374 12.8% 5.6% 18.4% 81.6%
East Side WIC Program
(NYCHHC) 330 1,174 1,504 1,068 2,572 12.8% 45.6% 58.5% 41.5%
Macon County Health Dept 10 5 15 63 78 12.8% 6.4% 19.2% 80.8%
Aroostook County Action
Program 52 10 62 344 406 12.8% 2.5% 15.3% 84.7%
Children's Hospital WIC
Program 60 244 304 165 469 12.8% 52.0% 64.8% 35.2%
Brazos Valley Community
Action Agency 241 456 697 1,188 1,885 12.8% 24.2% 37.0% 63.0%
Kendall County Health & Human 40 47 87 226 313 12.8% 15.0% 27.8% 72.2%
Green County Health Dept 18 14 32 109 141 12.8% 9.9% 22.7% 77.3%
Ashtabula County WIC Program 92 19 111 611 722 12.7% 2.6% 15.4% 84.6%
Crawford County Nursing
Services/Health Department 21 4 25 140 165 12.7% 2.4% 15.2% 84.8%
Berrien County Health Dept 142 70 212 904 1,116 12.7% 6.3% 19.0% 81.0%
Marshall County Health
Department 25 15 40 157 197 12.7% 7.6% 20.3% 79.7%
Opportunity For Chenango, Inc. 42 18 60 271 331 12.7% 5.4% 18.1% 81.9%
Bay County Health Department 229 195 424 1,382 1,806 12.7% 10.8% 23.5% 76.5%
Central Shenandoah District 152 177 329 870 1,199 12.7% 14.8% 27.4% 72.6%
Carroll County WIC Program 19 3 22 128 150 12.7% 2.0% 14.7% 85.3%
La Clinica De Los Campesino 29 23 52 177 229 12.7% 10.0% 22.7% 77.3%
Coshocton County WIC
Program 32 6 38 215 253 12.6% 2.4% 15.0% 85.0%
Rice County WIC Program
PHNS 44 82 126 222 348 12.6% 23.6% 36.2% 63.8%
Kenosha County Dept of Human
Svs 126 60 186 812 998 12.6% 6.0% 18.6% 81.4%
Otero County Health Dept 26 7 33 173 206 12.6% 3.4% 16.0% 84.0%
Volusia County Health
Department 330 316 646 1,972 2,618 12.6% 12.1% 24.7% 75.3%
OK Citizen Potawatomi Nation 38 10 48 254 302 12.6% 3.3% 15.9% 84.1%
Tulsa City-County Health 328 313 641 1,967 2,608 12.6% 12.0% 24.6% 75.4%
Audrain City County Health Unit 22 10 32 143 175 12.6% 5.7% 18.3% 81.7%
Maniilag Association WIC 22 23 45 130 175 12.6% 13.1% 25.7% 74.3%
Escambia Co Hlth Department 296 194 490 1,867 2,357 12.6% 8.2% 20.8% 79.2%
Brownwood-Brown County
Health Department 37 37 74 221 295 12.5% 12.5% 25.1% 74.9%
Kalamazoo Family Health
Center 111 71 182 703 885 12.5% 8.0% 20.6% 79.4%
Hudson River Healthcare, Inc 155 303 458 778 1,236 12.5% 24.5% 37.1% 62.9%
Hampton District 120 105 225 733 958 12.5% 11.0% 23.5% 76.5%
Mountain Park Health Center 744 1,257 2,001 3,939 5,940 12.5% 21.2% 33.7% 66.3%
Highlands County Health
Department 81 82 163 484 647 12.5% 12.7% 25.2% 74.8%
Bates County Health Center 14 4 18 94 112 12.5% 3.6% 16.1% 83.9%
Bent County Nursing Service 4 2 6 26 32 12.5% 6.3% 18.8% 81.3%
Clark County Health Dept 13 4 17 87 104 12.5% 3.8% 16.3% 83.7%
Fayette County Health Dept 21 11 32 136 168 12.5% 6.5% 19.0% 81.0%
Mason County Health
Department 11 4 15 73 88 12.5% 4.5% 17.0% 83.0%
Norman County 6 5 11 37 48 12.5% 10.4% 22.9% 77.1%
Pinal County Health Department 241 261 502 1,426 1,928 12.5% 13.5% 26.0% 74.0%
Ralls County Health Dept 4 - 4 28 32 12.5% 0.0% 12.5% 87.5%
Marion County Public Health 58 35 93 372 465 12.5% 7.5% 20.0% 80.0%
West Central Community Action 60 46 106 376 482 12.4% 9.5% 22.0% 78.0%
Butler County Health Dept 57 24 81 377 458 12.4% 5.2% 17.7% 82.3%
New River District 78 37 115 513 628 12.4% 5.9% 18.3% 81.7%
Oklahoma State Dept. of Health 1,575 757 2,332 10,379 12,711 12.4% 6.0% 18.3% 81.7%
Quincy WIC 127 241 368 658 1,026 12.4% 23.5% 35.9% 64.1%
Hennepin County Human Srvcs
& Public Health Dept 629 1,577 2,206 2,876 5,082 12.4% 31.0% 43.4% 56.6%
Reno County Health Dept 60 37 97 388 485 12.4% 7.6% 20.0% 80.0%
N.E.W. Community Clinic 165 96 261 1,077 1,338 12.3% 7.2% 19.5% 80.5%
Ingham County Health Dept 233 236 469 1,422 1,891 12.3% 12.5% 24.8% 75.2%
Lewis County Health Dept 8 3 11 54 65 12.3% 4.6% 16.9% 83.1%
Operation Threshold 152 139 291 944 1,235 12.3% 11.3% 23.6% 76.4%
*To maintain the privacy of participants, Local Agencies with less than 30 Infant Participants are not published. 65

Fully Formula-Fed
Local Agency
Infant Data
Participation Data Statistical Data
Fully Breastfed Partially Breastfed Total Breastfed Fully Formula-Fed Total Infants Fully Breastfed Partially Breastfed Total Breastfed
Rock County Public Health,
Southwest Health and Human
Services 8 7 15 50 65 12.3% 10.8% 23.1% 76.9%
Sullivan County Regional Office 110 42 152 742 894 12.3% 4.7% 17.0% 83.0%
St Lucie County Hlth
Department 236 366 602 1,321 1,923 12.3% 19.0% 31.3% 68.7%
Van Wert County WIC Program 20 3 23 140 163 12.3% 1.8% 14.1% 85.9%
Dickinson County Health
Department 13 7 20 86 106 12.3% 6.6% 18.9% 81.1%
Perry County Health Dept 13 3 16 90 106 12.3% 2.8% 15.1% 84.9%
Gallia County WIC Program 31 7 38 215 253 12.3% 2.8% 15.0% 85.0%
Miami County Health Dept 18 11 29 118 147 12.2% 7.5% 19.7% 80.3%
Tazewell County Health
Department 67 43 110 438 548 12.2% 7.8% 20.1% 79.9%
McLean County Health
Department 88 101 189 531 720 12.2% 14.0% 26.3% 73.8%
Ripley County Health Center 15 3 18 105 123 12.2% 2.4% 14.6% 85.4%
Darke/Mercer County WIC
Program 64 19 83 442 525 12.2% 3.6% 15.8% 84.2%
Norwescap WIC Program 138 261 399 734 1,133 12.2% 23.0% 35.2% 64.8%
North Country Children's Clinic 273 209 482 1,761 2,243 12.2% 9.3% 21.5% 78.5%
Mohave County WIC Program 138 149 287 847 1,134 12.2% 13.1% 25.3% 74.7%
Fort Belknap Community
Council 9 9 18 56 74 12.2% 12.2% 24.3% 75.7%
Seward County WIC Program 45 66 111 260 371 12.1% 17.8% 29.9% 70.1%
Grayson County Health Dept. 113 135 248 684 932 12.1% 14.5% 26.6% 73.4%
Bay County Health Dept 80 39 119 541 660 12.1% 5.9% 18.0% 82.0%
Northern Essex WIC 76 83 159 468 627 12.1% 13.2% 25.4% 74.6%
Oconto County Health Dept 16 8 24 108 132 12.1% 6.1% 18.2% 81.8%
Scott County Health Dept 4 2 6 27 33 12.1% 6.1% 18.2% 81.8%
NE KS Multi-County Board of
Health 34 18 52 229 281 12.1% 6.4% 18.5% 81.5%
Clinica Sierra Vista, INC. 995 1,237 2,232 5,995 8,227 12.1% 15.0% 27.1% 72.9%
City of El Paso 1,235 3,163 4,398 5,819 10,217 12.1% 31.0% 43.0% 57.0%
Callaway County Health Dept 18 5 23 126 149 12.1% 3.4% 15.4% 84.6%
Shenandoah Valley Medical
System 152 66 218 1,041 1,259 12.1% 5.2% 17.3% 82.7%
Worcester WIC 203 427 630 1,052 1,682 12.1% 25.4% 37.5% 62.5%
Lincoln/Lancaster County
Health Dept 101 125 226 611 837 12.1% 14.9% 27.0% 73.0%
Wichita Falls -Witchita County
Public Health District 140 155 295 866 1,161 12.1% 13.4% 25.4% 74.6%
Logan County Health
Department 17 6 23 118 141 12.1% 4.3% 16.3% 83.7%
Gasconade County Health
Department 10 4 14 69 83 12.0% 4.8% 16.9% 83.1%
Monroe County Health Dept 99 56 155 667 822 12.0% 6.8% 18.9% 81.1%
Blackfeet Tribe (Glacier Co.) 19 2 21 137 158 12.0% 1.3% 13.3% 86.7%
Upper Des Moines Opportunity 72 67 139 460 599 12.0% 11.2% 23.2% 76.8%
Framingham/Waltham WIC 117 284 401 573 974 12.0% 29.2% 41.2% 58.8%
North TX Home Hlth Serv. Inc.
DBA Outreach Hlth Service 1,154 2,049 3,203 6,409 9,612 12.0% 21.3% 33.3% 66.7%
Milam County Health
Department 27 17 44 181 225 12.0% 7.6% 19.6% 80.4%
Franklin County Health
Department 44 72 116 251 367 12.0% 19.6% 31.6% 68.4%
Portage/Columbiana WIC
Program 158 37 195 1,123 1,318 12.0% 2.8% 14.8% 85.2%
Kandiyohi CHS 38 71 109 208 317 12.0% 22.4% 34.4% 65.6%
So New Hampshire SVS 238 150 388 1,598 1,986 12.0% 7.6% 19.5% 80.5%
Malheur County Health
Department 37 37 74 235 309 12.0% 12.0% 23.9% 76.1%
Family Strides/Torrington WIC
Program 35 63 98 195 293 11.9% 21.5% 33.4% 66.6%
Guilford County Health
Department 397 590 987 2,341 3,328 11.9% 17.7% 29.7% 70.3%
Effingham County Health
Department 23 10 33 160 193 11.9% 5.2% 17.1% 82.9%
Neighborhood Services (admi) 138 79 217 941 1,158 11.9% 6.8% 18.7% 81.3%
Clinton County Health Dept 17 12 29 114 143 11.9% 8.4% 20.3% 79.7%
N Hudson Community Action
Corp. 265 826 1,091 1,139 2,230 11.9% 37.0% 48.9% 51.1%
Shawnee County Health Agency 156 137 293 1,020 1,313 11.9% 10.4% 22.3% 77.7%
Planned Parenthood Mohawk
Hudson 90 65 155 603 758 11.9% 8.6% 20.4% 79.6%
Mid-Cumberland Region 704 663 1,367 4,563 5,930 11.9% 11.2% 23.1% 76.9%
Meriden WIC Program 109 175 284 635 919 11.9% 19.0% 30.9% 69.1%
Hancock Regional Hospital 31 13 44 218 262 11.8% 5.0% 16.8% 83.2%
Saratoga County EOC, Inc 57 46 103 380 483 11.8% 9.5% 21.3% 78.7%
Hawkeye Area Comm Action
Prog 141 122 263 932 1,195 11.8% 10.2% 22.0% 78.0%
Boyle County Health
Department 23 20 43 152 195 11.8% 10.3% 22.1% 77.9%
Cayuga County Health
Department 48 25 73 334 407 11.8% 6.1% 17.9% 82.1%
Davie County Health
Department 25 17 42 170 212 11.8% 8.0% 19.8% 80.2%
Community Action Southwest 114 10 124 843 967 11.8% 1.0% 12.8% 87.2%
Society for the Protection and
Care of Children 136 80 216 938 1,154 11.8% 6.9% 18.7% 81.3%
Northeast Nebraska Community
Action Partnership 96 93 189 626 815 11.8% 11.4% 23.2% 76.8%
Franklin County Dept of Health 61 22 83 435 518 11.8% 4.2% 16.0% 84.0%
St Tammany Parish Hospital 65 61 126 426 552 11.8% 11.1% 22.8% 77.2%
Howard County Public Hlth Dept 6 1 7 44 51 11.8% 2.0% 13.7% 86.3%
Linn County Health Dept 10 4 14 71 85 11.8% 4.7% 16.5% 83.5%
Watonwan County Human
Services 12 22 34 68 102 11.8% 21.6% 33.3% 66.7%
Kalihi Palama Health Center 97 133 230 596 826 11.7% 16.1% 27.8% 72.2%
North Iowa Community Action 77 51 128 529 657 11.7% 7.8% 19.5% 80.5%
*To maintain the privacy of participants, Local Agencies with less than 30 Infant Participants are not published. 66

Fully Formula-Fed
Local Agency
Infant Data
Participation Data Statistical Data
Fully Breastfed Partially Breastfed Total Breastfed Fully Formula-Fed Total Infants Fully Breastfed Partially Breastfed Total Breastfed
Broadlawns WIC Office 298 411 709 1,834 2,543 11.7% 16.2% 27.9% 72.1%
Knox County WIC Program 38 7 45 280 325 11.7% 2.2% 13.8% 86.2%
Holyyoke/Chicopee WIC 132 142 274 855 1,129 11.7% 12.6% 24.3% 75.7%
Interlocal Comm Action
Program 32 13 45 229 274 11.7% 4.7% 16.4% 83.6%
Las Animas/Huerfano Health
Dept 14 4 18 102 120 11.7% 3.3% 15.0% 85.0%
Blue Hill Corridor WIC 52 136 188 258 446 11.7% 30.5% 42.2% 57.8%
Crow Tribe 12 5 17 86 103 11.7% 4.9% 16.5% 83.5%
Elmhurst Hospital Center
(NYCHHC) 216 839 1,055 799 1,854 11.7% 45.3% 56.9% 43.1%
Trempealeau County Health 17 21 38 108 146 11.6% 14.4% 26.0% 74.0%
Catawba County Health
Department 124 143 267 798 1,065 11.6% 13.4% 25.1% 74.9%
South Boston WIC 15 37 52 77 129 11.6% 28.7% 40.3% 59.7%
Paulding County WIC Program 13 1 14 98 112 11.6% 0.9% 12.5% 87.5%
Dist./Unit 01-2 Northwest Hlth
District 340 503 843 2,087 2,930 11.6% 17.2% 28.8% 71.2%
Miller County Health Center 21 9 30 151 181 11.6% 5.0% 16.6% 83.4%
Eastbay Community Action
Program 67 41 108 470 578 11.6% 7.1% 18.7% 81.3%
Douglas County Health Dept 11 3 14 81 95 11.6% 3.2% 14.7% 85.3%
Craven County Health
Department 103 83 186 705 891 11.6% 9.3% 20.9% 79.1%
North Central FL WIC Project 408 358 766 2,764 3,530 11.6% 10.1% 21.7% 78.3%
Comm. Action Partnership of
MID-NE 92 106 198 598 796 11.6% 13.3% 24.9% 75.1%
Crawford County WIC Program 36 8 44 268 312 11.5% 2.6% 14.1% 85.9%
Jefferson-Franklin CAC 121 44 165 885 1,050 11.5% 4.2% 15.7% 84.3%
Goodhue CHS 22 18 40 151 191 11.5% 9.4% 20.9% 79.1%
Watts Healthcare Corporation 442 583 1,025 2,813 3,838 11.5% 15.2% 26.7% 73.3%
Saline County Health Dept 52 44 96 356 452 11.5% 9.7% 21.2% 78.8%
Delaware-Mo-Un-WIC Program 84 22 106 625 731 11.5% 3.0% 14.5% 85.5%
Jessamine County Health
Department 48 99 147 271 418 11.5% 23.7% 35.2% 64.8%
Northeast Tennessee Region 248 163 411 1,751 2,162 11.5% 7.5% 19.0% 81.0%
Marion County Health Dept 39 17 56 284 340 11.5% 5.0% 16.5% 83.5%
Sheboygan County Health 57 45 102 395 497 11.5% 9.1% 20.5% 79.5%
St Charles Co Dept. of
Community Health &
Environment 63 41 104 446 550 11.5% 7.5% 18.9% 81.1%
Oak Orchard Community Health
Center 76 64 140 524 664 11.4% 9.6% 21.1% 78.9%
St. Clair County Health
Department 93 71 164 650 814 11.4% 8.7% 20.1% 79.9%
Beaufort-Jasper Comp Center 67 89 156 431 587 11.4% 15.2% 26.6% 73.4%
Lord Fairfax District 118 133 251 783 1,034 11.4% 12.9% 24.3% 75.7%
Oregon County Health Dept 13 2 15 99 114 11.4% 1.8% 13.2% 86.8%
Adams County Health Dept 48 22 70 351 421 11.4% 5.2% 16.6% 83.4%
Monongalia County Health
Department 168 57 225 1,250 1,475 11.4% 3.9% 15.3% 84.7%
Rutherford, Polk, McDowell
Health District 98 97 195 667 862 11.4% 11.3% 22.6% 77.4%
Wyandotte County Health Dept 202 318 520 1,257 1,777 11.4% 17.9% 29.3% 70.7%
Miami County WIC Program 54 9 63 413 476 11.3% 1.9% 13.2% 86.8%
Brazoria County Health
Department 193 405 598 1,105 1,703 11.3% 23.8% 35.1% 64.9%
OK Inter-Tribal Council 23 9 32 171 203 11.3% 4.4% 15.8% 84.2%
Ulster County Health
Department 64 80 144 421 565 11.3% 14.2% 25.5% 74.5%
Allen County WIC Program 94 15 109 721 830 11.3% 1.8% 13.1% 86.9%
OK WCD Enterprises 109 65 174 789 963 11.3% 6.7% 18.1% 81.9%
Adelante Healthcare 411 724 1,135 2,504 3,639 11.3% 19.9% 31.2% 68.8%
Hernando County Health
Department 105 69 174 756 930 11.3% 7.4% 18.7% 81.3%
Lincoln County Health
Department 49 39 88 347 435 11.3% 9.0% 20.2% 79.8%
Centro De Salud Familiar La Fe,
Inc. 53 158 211 260 471 11.3% 33.5% 44.8% 55.2%
Stokes County Health
Department 27 37 64 176 240 11.3% 15.4% 26.7% 73.3%
Access/Windham WIC Program 65 72 137 441 578 11.2% 12.5% 23.7% 76.3%
Franklin County Health Dept 19 12 31 138 169 11.2% 7.1% 18.3% 81.7%
Montgomery County Health 20 7 27 151 178 11.2% 3.9% 15.2% 84.8%
Comm. Action of Southeast
Iowa 106 93 199 746 945 11.2% 9.8% 21.1% 78.9%
Region 7 502 389 891 3,586 4,477 11.2% 8.7% 19.9% 80.1%
Clay County Health Dept 13 5 18 98 116 11.2% 4.3% 15.5% 84.5%
Vinton County WIC Program 13 2 15 101 116 11.2% 1.7% 12.9% 87.1%
Crawford County Health Dept 15 7 22 112 134 11.2% 5.2% 16.4% 83.6%
Randolph County Health
Department 20 11 31 148 179 11.2% 6.1% 17.3% 82.7%
West Allis Health Dept 41 35 76 291 367 11.2% 9.5% 20.7% 79.3%
Lexington-Fayette Co.Health
Dept 214 491 705 1,212 1,917 11.2% 25.6% 36.8% 63.2%
City of Del Rio 65 114 179 404 583 11.1% 19.6% 30.7% 69.3%
Hamilton Health Ctrs 171 76 247 1,292 1,539 11.1% 4.9% 16.0% 84.0%
Keweenaw Bay Indian
Community 7 4 11 52 63 11.1% 6.3% 17.5% 82.5%
Pinellas County Health
Department 473 609 1,082 3,176 4,258 11.1% 14.3% 25.4% 74.6%
OK Muscogee Creek Nation 62 15 77 482 559 11.1% 2.7% 13.8% 86.2%
Citrus County Health
Department 76 46 122 564 686 11.1% 6.7% 17.8% 82.2%
Crescent Clinic-WIC 59 63 122 411 533 11.1% 11.8% 22.9% 77.1%
Nye County WIC 27 23 50 194 244 11.1% 9.4% 20.5% 79.5%
McDonald County Health Dept 24 22 46 171 217 11.1% 10.1% 21.2% 78.8%
Danbury WIC Program 65 198 263 325 588 11.1% 33.7% 44.7% 55.3%
Cumberland County Public
Health Center 409 433 842 2,861 3,703 11.0% 11.7% 22.7% 77.3%
Crozer-Chester Medical Center 282 96 378 2,176 2,554 11.0% 3.8% 14.8% 85.2%
*To maintain the privacy of participants, Local Agencies with less than 30 Infant Participants are not published. 67

Fully Formula-Fed
Local Agency
Infant Data
Participation Data Statistical Data
Fully Breastfed Partially Breastfed Total Breastfed Fully Formula-Fed Total Infants Fully Breastfed Partially Breastfed Total Breastfed
Hillcrest Family Services 103 71 174 761 935 11.0% 7.6% 18.6% 81.4%
Desoto County Health
Department 36 64 100 227 327 11.0% 19.6% 30.6% 69.4%
Seeds of Health 63 75 138 436 574 11.0% 13.1% 24.0% 76.0%
Alleghany District 61 25 86 470 556 11.0% 4.5% 15.5% 84.5%
Stanly County Health
Department 41 50 91 283 374 11.0% 13.4% 24.3% 75.7%
Chickahominy District 32 23 55 237 292 11.0% 7.9% 18.8% 81.2%
Human Services, Inc. 56 25 81 430 511 11.0% 4.9% 15.9% 84.1%
Moniteau County Health Center 8 6 14 59 73 11.0% 8.2% 19.2% 80.8%
Jefferson County Health Dept 22 11 33 168 201 10.9% 5.5% 16.4% 83.6%
St. Clair County Health Dept 104 57 161 790 951 10.9% 6.0% 16.9% 83.1%
Steuben County Health Dept 27 21 48 199 247 10.9% 8.5% 19.4% 80.6%
Sedgwick County Health Dept 414 428 842 2,959 3,801 10.9% 11.3% 22.2% 77.8%
Champaign-Urbana Public
Health 115 164 279 778 1,057 10.9% 15.5% 26.4% 73.6%
Johnson County Health Dept 71 40 111 542 653 10.9% 6.1% 17.0% 83.0%
Perry County Health
Department 15 8 23 115 138 10.9% 5.8% 16.7% 83.3%
Pitt County Public Health Center 130 143 273 924 1,197 10.9% 11.9% 22.8% 77.2%
Wilkes County Health Dept 43 49 92 304 396 10.9% 12.4% 23.2% 76.8%
Jasper County Health Dept 19 13 32 143 175 10.9% 7.4% 18.3% 81.7%
Barren River District 220 224 444 1,583 2,027 10.9% 11.1% 21.9% 78.1%
Henrico District 149 86 235 1,139 1,374 10.8% 6.3% 17.1% 82.9%
Montgomery County Health
Department 27 38 65 184 249 10.8% 15.3% 26.1% 73.9%
Pennyrile District 44 26 70 336 406 10.8% 6.4% 17.2% 82.8%
Edgerton Women's Health
Center 118 105 223 869 1,092 10.8% 9.6% 20.4% 79.6%
Lyon County Public Health,
Southwest Health and Human
Services 23 30 53 160 213 10.8% 14.1% 24.9% 75.1%
Mary Mahoney Health Center 15 6 21 118 139 10.8% 4.3% 15.1% 84.9%
Well Child Center, Inc. 216 530 746 1,259 2,005 10.8% 26.4% 37.2% 62.8%
St. Joseph's Hospital & Med
Center 496 1,447 1,943 2,663 4,606 10.8% 31.4% 42.2% 57.8%
Blue River Services, Inc. 58 30 88 452 540 10.7% 5.6% 16.3% 83.7%
Tohono O'Odham Nation 25 21 46 187 233 10.7% 9.0% 19.7% 80.3%
Palm Beach County Health
Department 765 1,980 2,745 4,394 7,139 10.7% 27.7% 38.5% 61.5%
Clark County Health Dept 6 2 8 48 56 10.7% 3.6% 14.3% 85.7%
Calhoun County Health Dept 122 84 206 934 1,140 10.7% 7.4% 18.1% 81.9%
Great Lakes Inter Tribal 26 19 45 198 243 10.7% 7.8% 18.5% 81.5%
Manatee County Health
Department 205 347 552 1,364 1,916 10.7% 18.1% 28.8% 71.2%
Montgomery County WIC
Program 367 104 471 2,964 3,435 10.7% 3.0% 13.7% 86.3%
Central Virginia District 132 57 189 1,050 1,239 10.7% 4.6% 15.3% 84.7%
Alamance County Health
Department 106 138 244 752 996 10.6% 13.9% 24.5% 75.5%
Seneca County WIC Program 42 13 55 340 395 10.6% 3.3% 13.9% 86.1%
Northeast Texas Public Health
District 485 1,023 1,508 3,065 4,573 10.6% 22.4% 33.0% 67.0%
Salt River Pima-Maricopa Indian
Community 16 10 26 125 151 10.6% 6.6% 17.2% 82.8%
Chesapeake District 114 92 206 870 1,076 10.6% 8.6% 19.1% 80.9%
Amarillo (City of) 222 361 583 1,515 2,098 10.6% 17.2% 27.8% 72.2%
Central Valley Health Unit 11 16 27 77 104 10.6% 15.4% 26.0% 74.0%
Lee County Health Department 457 953 1,410 2,911 4,321 10.6% 22.1% 32.6% 67.4%
Duval County Health
Department 679 1,018 1,697 4,727 6,424 10.6% 15.8% 26.4% 73.6%
Chautauqua County Health
Department 89 63 152 691 843 10.6% 7.5% 18.0% 82.0%
Marion County Health
Department 233 366 599 1,610 2,209 10.5% 16.6% 27.1% 72.9%
Polk County Health Department 523 891 1,414 3,545 4,959 10.5% 18.0% 28.5% 71.5%
Cabarrus Health Alliance 121 211 332 817 1,149 10.5% 18.4% 28.9% 71.1%
VNA of Central Jersey, Inc. 497 1,223 1,720 3,010 4,730 10.5% 25.9% 36.4% 63.6%
Catholic Charities 139 79 218 1,106 1,324 10.5% 6.0% 16.5% 83.5%
Starke County Health Dept 17 10 27 135 162 10.5% 6.2% 16.7% 83.3%
Fall River WIC 92 46 138 739 877 10.5% 5.2% 15.7% 84.3%
Anderson County Health
Department 15 19 34 109 143 10.5% 13.3% 23.8% 76.2%
Gila River Indian Community 31 19 50 246 296 10.5% 6.4% 16.9% 83.1%
Graves County Health
Department 36 50 86 258 344 10.5% 14.5% 25.0% 75.0%
Regence Health Network, Inc. 154 189 343 1,130 1,473 10.5% 12.8% 23.3% 76.7%
Open Door Health Services, Inc. 77 29 106 632 738 10.4% 3.9% 14.4% 85.6%
Dist./Unit 03-1 Metro West Hlth
Dist. 476 1,325 1,801 2,763 4,564 10.4% 29.0% 39.5% 60.5%
Washington County Health Dept 27 9 36 223 259 10.4% 3.5% 13.9% 86.1%
St. Louis County DOCHMC 933 714 1,647 7,308 8,955 10.4% 8.0% 18.4% 81.6%
Bureau County Health Dept 20 16 36 156 192 10.4% 8.3% 18.8% 81.3%
Garrard County Health
Department 16 16 32 122 154 10.4% 10.4% 20.8% 79.2%
Will County Health Dept 271 359 630 1,989 2,619 10.3% 13.7% 24.1% 75.9%
Clinton County WIC Program 29 6 35 246 281 10.3% 2.1% 12.5% 87.5%
St Francois County Health
Center 51 22 73 422 495 10.3% 4.4% 14.7% 85.3%
Carteret County Health
Department 36 34 70 280 350 10.3% 9.7% 20.0% 80.0%
Monroe County WIC Program 11 3 14 93 107 10.3% 2.8% 13.1% 86.9%
St. Lukes Hospital WIC Clinic 44 66 110 318 428 10.3% 15.4% 25.7% 74.3%
CNMI Department of Public
Health WIC Program, Saipan 74 185 259 461 720 10.3% 25.7% 36.0% 64.0%
Ashland/Richland County WIC
Program 107 23 130 912 1,042 10.3% 2.2% 12.5% 87.5%
Randolph County Health
Department 99 173 272 693 965 10.3% 17.9% 28.2% 71.8%
Hualapai Tribe 4 3 7 32 39 10.3% 7.7% 17.9% 82.1%
Floyd County Health Dept 43 37 80 340 420 10.2% 8.8% 19.0% 81.0%
El Rio Health Center 79 128 207 566 773 10.2% 16.6% 26.8% 73.2%
*To maintain the privacy of participants, Local Agencies with less than 30 Infant Participants are not published. 68

Fully Formula-Fed
Local Agency
Infant Data
Participation Data Statistical Data
Fully Breastfed Partially Breastfed Total Breastfed Fully Formula-Fed Total Infants Fully Breastfed Partially Breastfed Total Breastfed
Highland County WIC Program 38 5 43 329 372 10.2% 1.3% 11.6% 88.4%
St. Joseph City of Health
Department 69 37 106 571 677 10.2% 5.5% 15.7% 84.3%
Montgomery Co. (Community
Clinic Inc.) WIC Program 681 2,995 3,676 3,012 6,688 10.2% 44.8% 55.0% 45.0%
Swope Health Services 79 63 142 635 777 10.2% 8.1% 18.3% 81.7%
Metro-Davidson Health
Department 521 1,045 1,566 3,560 5,126 10.2% 20.4% 30.6% 69.4%
Memorial Health Systems 175 201 376 1,348 1,724 10.2% 11.7% 21.8% 78.2%
Sumner County Health Dept 14 4 18 120 138 10.1% 2.9% 13.0% 87.0%
Pascua Yaqui Tribe 22 14 36 181 217 10.1% 6.5% 16.6% 83.4%
Cattaraugus County Health
Department 47 37 84 380 464 10.1% 8.0% 18.1% 81.9%
Colorado River Indian Tribes 16 8 24 134 158 10.1% 5.1% 15.2% 84.8%
Longview Wellness Centers,
Inc. dba Wellness Pointe 149 388 537 935 1,472 10.1% 26.4% 36.5% 63.5%
Frederick County WIC Program 109 252 361 716 1,077 10.1% 23.4% 33.5% 66.5%
LaSalle County Health Dept 61 45 106 497 603 10.1% 7.5% 17.6% 82.4%
MATURA Action Corp 47 38 85 380 465 10.1% 8.2% 18.3% 81.7%
Grundy County Health
Department 19 20 39 149 188 10.1% 10.6% 20.7% 79.3%
Marion County Health Dept &
Home Health Agency 22 11 33 185 218 10.1% 5.0% 15.1% 84.9%
Davidson County Health
Department 104 120 224 811 1,035 10.0% 11.6% 21.6% 78.4%
Lake County Health Department 172 288 460 1,252 1,712 10.0% 16.8% 26.9% 73.1%
Oswego County Opportunities,
Inc 76 41 117 640 757 10.0% 5.4% 15.5% 84.5%
Eastern Shoshone 7 7 14 56 70 10.0% 10.0% 20.0% 80.0%
Elkhart County Health Dept 167 217 384 1,286 1,670 10.0% 13.0% 23.0% 77.0%
Forest County Health
Department 5 2 7 43 50 10.0% 4.0% 14.0% 86.0%
HHWP County WIC Program 72 23 95 625 720 10.0% 3.2% 13.2% 86.8%
Mercer County Health
Department 20 24 44 156 200 10.0% 12.0% 22.0% 78.0%
Rolette County 6 5 11 49 60 10.0% 8.3% 18.3% 81.7%
Fresno County EOC 705 809 1,514 5,545 7,059 10.0% 11.5% 21.4% 78.6%
OK Otoe-Missouria Tribe 12 5 17 104 121 9.9% 4.1% 14.0% 86.0%
Stickney Public Health District. 12 24 36 85 121 9.9% 19.8% 29.8% 70.2%
Jones County Health
Department 8 5 13 68 81 9.9% 6.2% 16.0% 84.0%
Lawrence County Health Dept. 15 18 33 119 152 9.9% 11.8% 21.7% 78.3%
Valley Health Systems Inc WIC
Program 257 90 347 2,267 2,614 9.8% 3.4% 13.3% 86.7%
Health Service Regions 4/5 217 585 802 1,411 2,213 9.8% 26.4% 36.2% 63.8%
Monroe County Health Dept 5 5 10 41 51 9.8% 9.8% 19.6% 80.4%
Saginaw County Health Dept 124 78 202 1,063 1,265 9.8% 6.2% 16.0% 84.0%
South End WIC 61 238 299 324 623 9.8% 38.2% 48.0% 52.0%
Northeast Colorado Health Dept 51 20 71 450 521 9.8% 3.8% 13.6% 86.4%
Wood County WIC Program 41 21 62 357 419 9.8% 5.0% 14.8% 85.2%
Meigs County WIC Program 17 3 20 154 174 9.8% 1.7% 11.5% 88.5%
Hendricks Co. Health
Foundation Inc. 40 25 65 345 410 9.8% 6.1% 15.9% 84.1%
Rosebud Sioux WIC Program 31 62 93 225 318 9.7% 19.5% 29.2% 70.8%
TVCCA WIC Program 106 237 343 746 1,089 9.7% 21.8% 31.5% 68.5%
Hopkins County Health
Department 35 19 54 306 360 9.7% 5.3% 15.0% 85.0%
South Plains Community Action
Assc., Inc. 569 719 1,288 4,575 5,863 9.7% 12.3% 22.0% 78.0%
Orange County Health
Department 809 1,918 2,727 5,615 8,342 9.7% 23.0% 32.7% 67.3%
Caldwell County Health
Department 52 71 123 414 537 9.7% 13.2% 22.9% 77.1%
Summit County WIC Program 283 92 375 2,548 2,923 9.7% 3.1% 12.8% 87.2%
Jackson County WIC Program 3 1 4 27 31 9.7% 3.2% 12.9% 87.1%
Spokane Tribe of Indians 3 1 4 27 31 9.7% 3.2% 12.9% 87.1%
Cardinal Services, Inc. 38 36 74 319 393 9.7% 9.2% 18.8% 81.2%
Tarrant County Health
Department 1,401 3,892 5,293 9,197 14,490 9.7% 26.9% 36.5% 63.5%
St.Paul-Ramsey Couty Pubc
Health WIC 394 919 1,313 2,763 4,076 9.7% 22.5% 32.2% 67.8%
Thundermist Health Center 64 34 98 565 663 9.7% 5.1% 14.8% 85.2%
Minnehaha County WIC
Program 102 120 222 835 1,057 9.6% 11.4% 21.0% 79.0%
Lincoln County Health Dept 27 14 41 239 280 9.6% 5.0% 14.6% 85.4%
North Shore WIC 159 423 582 1,068 1,650 9.6% 25.6% 35.3% 64.7%
Nobles County Community
Services 23 57 80 159 239 9.6% 23.8% 33.5% 66.5%
Baltimore County WIC Program 400 765 1,165 2,994 4,159 9.6% 18.4% 28.0% 72.0%
Dorchester South WIC 70 231 301 427 728 9.6% 31.7% 41.3% 58.7%
Yuma County WIC Program 205 331 536 1,597 2,133 9.6% 15.5% 25.1% 74.9%
Paris/Lamar County Health
Department 41 40 81 346 427 9.6% 9.4% 19.0% 81.0%
Graham County Health
Department 7 - 7 66 73 9.6% 0.0% 9.6% 90.4%
Neighborhood Health Clinics,
Inc 283 235 518 2,435 2,953 9.6% 8.0% 17.5% 82.5%
Dade County Health
Department 1,662 4,895 6,557 10,805 17,362 9.6% 28.2% 37.8% 62.2%
Atascosa Health Center, Inc. 31 63 94 230 324 9.6% 19.4% 29.0% 71.0%
Clermont County WIC Program 94 29 123 862 985 9.5% 2.9% 12.5% 87.5%
Erie/Huron County WIC
Program 83 20 103 767 870 9.5% 2.3% 11.8% 88.2%
Health Services Regions 9/10 54 90 144 423 567 9.5% 15.9% 25.4% 74.6%
Hamilton County Regional
Office 195 278 473 1,578 2,051 9.5% 13.6% 23.1% 76.9%
Leon County Health Department 189 255 444 1,544 1,988 9.5% 12.8% 22.3% 77.7%
Stark County WIC Program 188 45 233 1,745 1,978 9.5% 2.3% 11.8% 88.2%
Livingston County Health
Department 19 6 25 176 201 9.5% 3.0% 12.4% 87.6%
*To maintain the privacy of participants, Local Agencies with less than 30 Infant Participants are not published. 69

Fully Formula-Fed
Local Agency
Infant Data
Participation Data Statistical Data
Fully Breastfed Partially Breastfed Total Breastfed Fully Formula-Fed Total Infants Fully Breastfed Partially Breastfed Total Breastfed
Shelby County WIC Program 24 5 29 225 254 9.4% 2.0% 11.4% 88.6%
Yankton County WIC Program 10 7 17 89 106 9.4% 6.6% 16.0% 84.0%
Cape Girardeau County Public
Health Center 43 18 61 395 456 9.4% 3.9% 13.4% 86.6%
Siouxland District Health Dept 90 99 189 766 955 9.4% 10.4% 19.8% 80.2%
Coordinated Youth Services 149 122 271 1,312 1,583 9.4% 7.7% 17.1% 82.9%
Licking County WIC Program 83 14 97 787 884 9.4% 1.6% 11.0% 89.0%
Maricopa County Dept Public
Health 1,632 3,362 4,994 12,395 17,389 9.4% 19.3% 28.7% 71.3%
Battle Mountain Family
Resource 3 2 5 27 32 9.4% 6.3% 15.6% 84.4%
Hoosier Uplands Economic
Development Corporation 6 3 9 55 64 9.4% 4.7% 14.1% 85.9%
Whiteside County Health Dept 36 30 66 319 385 9.4% 7.8% 17.1% 82.9%
Alexander County Health
Department 20 27 47 167 214 9.3% 12.6% 22.0% 78.0%
Lake Region District Health Unit 10 9 19 88 107 9.3% 8.4% 17.8% 82.2%
Burke County Health
Department 55 58 113 477 590 9.3% 9.8% 19.2% 80.8%
Putnam County Health
Department 63 61 124 552 676 9.3% 9.0% 18.3% 81.7%
Mid-Ohio Valley WIC Agency 116 54 170 1,076 1,246 9.3% 4.3% 13.6% 86.4%
Nutrition & Health Assoc. 84 63 147 757 904 9.3% 7.0% 16.3% 83.7%
Madison County Health
Department 57 134 191 423 614 9.3% 21.8% 31.1% 68.9%
Community & Family Services,
Inc. 84 54 138 767 905 9.3% 6.0% 15.2% 84.8%
Oakland County WIC Program 394 445 839 3,408 4,247 9.3% 10.5% 19.8% 80.2%
Women's Health Center of
Albany Medical College 58 103 161 465 626 9.3% 16.5% 25.7% 74.3%
Washington County Health Dept 5 2 7 47 54 9.3% 3.7% 13.0% 87.0%
Bullitt County Health
Department 42 131 173 281 454 9.3% 28.9% 38.1% 61.9%
Gloucester County WIC
Program 87 110 197 745 942 9.2% 11.7% 20.9% 79.1%
East Tennessee Region 455 418 873 4,057 4,930 9.2% 8.5% 17.7% 82.3%
Douglas County Health Dept 359 782 1,141 2,751 3,892 9.2% 20.1% 29.3% 70.7%
Wicomico County Health
Department 123 205 328 1,006 1,334 9.2% 15.4% 24.6% 75.4%
Madison County WIC Program 21 6 27 201 228 9.2% 2.6% 11.8% 88.2%
St. Joseph Regional Health
Center 29 46 75 240 315 9.2% 14.6% 23.8% 76.2%
Wake County Health
Department 369 961 1,330 2,682 4,012 9.2% 24.0% 33.2% 66.8%
Puerto Rico WIC Program 3,615 4,702 8,317 31,060 39,377 9.2% 11.9% 21.1% 78.9%
Wedco District 47 84 131 383 514 9.1% 16.3% 25.5% 74.5%
Fairfield County WIC Program 55 12 67 537 604 9.1% 2.0% 11.1% 88.9%
Caswell County Health
Department 13 13 26 117 143 9.1% 9.1% 18.2% 81.8%
Moody County WIC Program 3 1 4 29 33 9.1% 3.0% 12.1% 87.9%
Putnam County Health
Department 21 76 97 134 231 9.1% 32.9% 42.0% 58.0%
Tulalip Health Clinic 4 1 5 39 44 9.1% 2.3% 11.4% 88.6%
Rappahannock-Rapidan District 68 87 155 594 749 9.1% 11.6% 20.7% 79.3%
Bartholomew County Health
Dept 44 36 80 405 485 9.1% 7.4% 16.5% 83.5%
Onondaga County Health
Department 234 284 518 2,065 2,583 9.1% 11.0% 20.1% 79.9%
West Bay Community Action,
Inc. 41 30 71 382 453 9.1% 6.6% 15.7% 84.3%
Driscoll Childrens Hospital 184 715 899 1,135 2,034 9.0% 35.2% 44.2% 55.8%
Chemung County Health
Department 62 47 109 578 687 9.0% 6.8% 15.9% 84.1%
Tri-County WIC Program 434 777 1,211 3,602 4,813 9.0% 16.1% 25.2% 74.8%
Menominee Tribal Clinic 9 11 20 80 100 9.0% 11.0% 20.0% 80.0%
Sandusky County WIC Program 35 8 43 346 389 9.0% 2.1% 11.1% 88.9%
Catholic Charities of Columbia &
Greene Counties 43 62 105 373 478 9.0% 13.0% 22.0% 78.0%
Knox County Health Department 30 29 59 275 334 9.0% 8.7% 17.7% 82.3%
Tuscarawas County WIC
Program 44 15 59 431 490 9.0% 3.1% 12.0% 88.0%
Northern Kentucky District 238 565 803 1,848 2,651 9.0% 21.3% 30.3% 69.7%
Roxbury WIC 43 131 174 305 479 9.0% 27.3% 36.3% 63.7%
Monroe County Health
Department 199 284 483 1,735 2,218 9.0% 12.8% 21.8% 78.2%
Cuyahoga County WIC Program 737 208 945 7,273 8,218 9.0% 2.5% 11.5% 88.5%
Hardin County Health
Department 33 80 113 255 368 9.0% 21.7% 30.7% 69.3%
Hillsborough County Health
Department 775 1,438 2,213 6,432 8,645 9.0% 16.6% 25.6% 74.4%
Fulton County Health Dept 12 11 23 111 134 9.0% 8.2% 17.2% 82.8%
UT Medical Branch at Galveston
(UTMB) 769 3,632 4,401 4,192 8,593 8.9% 42.3% 51.2% 48.8%
Defiance County WIC Program 22 4 26 220 246 8.9% 1.6% 10.6% 89.4%
Lucas County WIC Program 311 111 422 3,065 3,487 8.9% 3.2% 12.1% 87.9%
N Cent Org Reg For Total
Health 1,427 495 1,922 14,084 16,006 8.9% 3.1% 12.0% 88.0%
Yadkin County Health
Department 23 52 75 183 258 8.9% 20.2% 29.1% 70.9%
City Of Dallas Housing &
Community Services Dept. 2,137 11,895 14,032 9,958 23,990 8.9% 49.6% 58.5% 41.5%
Coney Island Hospital
(NYCHHC) 95 471 566 501 1,067 8.9% 44.1% 53.0% 47.0%
Bourbon County Health
Department 16 36 52 128 180 8.9% 20.0% 28.9% 71.1%
Green River District 147 91 238 1,419 1,657 8.9% 5.5% 14.4% 85.6%
American Home Finding 54 68 122 488 610 8.9% 11.1% 20.0% 80.0%
Gonzales Community Health
Center, Women's Health and
WIC 28 55 83 234 317 8.8% 17.4% 26.2% 73.8%
*To maintain the privacy of participants, Local Agencies with less than 30 Infant Participants are not published. 70

Fully Formula-Fed
Local Agency
Infant Data
Participation Data Statistical Data
Fully Breastfed Partially Breastfed Total Breastfed Fully Formula-Fed Total Infants Fully Breastfed Partially Breastfed Total Breastfed
Indiana University Health White
Memorial Hospital, Inc. 23 25 48 213 261 8.8% 9.6% 18.4% 81.6%
Auglaize County WIC Program 20 6 26 201 227 8.8% 2.6% 11.5% 88.5%
Mariposa Community Health
Center 48 76 124 421 545 8.8% 13.9% 22.8% 77.2%
Dist/Unit 09-2 Southeast Health
District 426 709 1,135 3,712 4,847 8.8% 14.6% 23.4% 76.6%
Peninsula District 177 129 306 1,709 2,015 8.8% 6.4% 15.2% 84.8%
Cherokee County Health Dept 51 36 87 497 584 8.7% 6.2% 14.9% 85.1%
Charles Mix County WIC
Program 10 11 21 94 115 8.7% 9.6% 18.3% 81.7%
El Centro Del Barrio, Inc.. 241 446 687 2,097 2,784 8.7% 16.0% 24.7% 75.3%
Southeast Region 189 184 373 1,820 2,193 8.6% 8.4% 17.0% 83.0%
Southwest Kansas WIC
Program 61 129 190 519 709 8.6% 18.2% 26.8% 73.2%
Angelina County & Cities Health
District 77 132 209 686 895 8.6% 14.7% 23.4% 76.6%
City of Racine Health
Department 22 27 49 207 256 8.6% 10.5% 19.1% 80.9%
Beadle County WIC Program 17 35 52 146 198 8.6% 17.7% 26.3% 73.7%
Kankakee County Health
Department 63 56 119 615 734 8.6% 7.6% 16.2% 83.8%
Hyde County Health Department 3 3 6 29 35 8.6% 8.6% 17.1% 82.9%
Moultrie County Health Dept 6 3 9 61 70 8.6% 4.3% 12.9% 87.1%
Loudoun District 56 209 265 389 654 8.6% 32.0% 40.5% 59.5%
Iredell County Health
Department 79 102 181 743 924 8.5% 11.0% 19.6% 80.4%
New Bedford WIC 88 126 214 816 1,030 8.5% 12.2% 20.8% 79.2%
San Antonio Metropolitan Health
District 963 2,104 3,067 8,212 11,279 8.5% 18.7% 27.2% 72.8%
Carroll County Health Dept 7 8 15 67 82 8.5% 9.8% 18.3% 81.7%
Tejas Health Care Center 18 75 93 118 211 8.5% 35.5% 44.1% 55.9%
Charles County WIC Program 145 249 394 1,306 1,700 8.5% 14.6% 23.2% 76.8%
Rappahannock Area District 129 200 329 1,184 1,513 8.5% 13.2% 21.7% 78.3%
Alexandria District 64 254 318 433 751 8.5% 33.8% 42.3% 57.7%
Franklin County Health
Department 31 33 64 300 364 8.5% 9.1% 17.6% 82.4%
Warren County WIC Program 44 6 50 467 517 8.5% 1.2% 9.7% 90.3%
Health and Nutrition Service 77 90 167 739 906 8.5% 9.9% 18.4% 81.6%
Crawford County Health 39 26 65 395 460 8.5% 5.7% 14.1% 85.9%
Oklahoma City - County Health
Dept. 172 110 282 1,751 2,033 8.5% 5.4% 13.9% 86.1%
Lincoln County Health
Department 17 23 40 161 201 8.5% 11.4% 19.9% 80.1%
Johnson Nichols Health Clinic,
Inc. 24 21 45 239 284 8.5% 7.4% 15.8% 84.2%
Wheeling-Ohio County WIC 80 41 121 826 947 8.4% 4.3% 12.8% 87.2%
Jackson County WIC Program 20 3 23 215 238 8.4% 1.3% 9.7% 90.3%
Fayette Co. Community Action
Agency 63 5 68 683 751 8.4% 0.7% 9.1% 90.9%
Roanoke District 80 87 167 789 956 8.4% 9.1% 17.5% 82.5%
Madison County Health Dept. 70 51 121 716 837 8.4% 6.1% 14.5% 85.5%
OK Osage Nation 85 45 130 888 1,018 8.3% 4.4% 12.8% 87.2%
Greene County Health
Department 15 24 39 141 180 8.3% 13.3% 21.7% 78.3%
Dist./Unit 02-0 North Health
District 326 813 1,139 2,776 3,915 8.3% 20.8% 29.1% 70.9%
OK Choctaw Nation WIC
Program 89 43 132 943 1,075 8.3% 4.0% 12.3% 87.7%
Lake Cumberland District 160 183 343 1,598 1,941 8.2% 9.4% 17.7% 82.3%
Vernon Parish Health
Unit/LEESVILLE 38 14 52 409 461 8.2% 3.0% 11.3% 88.7%
Morgan Hospital & Medical
Center 29 14 43 309 352 8.2% 4.0% 12.2% 87.8%
Lawrence WIC 123 439 562 934 1,496 8.2% 29.3% 37.6% 62.4%
New Hope Service, Inc. 96 79 175 994 1,169 8.2% 6.8% 15.0% 85.0%
Sangamon County Health Dept 91 114 205 904 1,109 8.2% 10.3% 18.5% 81.5%
Schenectady County Public
Health Services 69 108 177 664 841 8.2% 12.8% 21.0% 79.0%
Los Barrios Unidos Community
Clinic 93 506 599 537 1,136 8.2% 44.5% 52.7% 47.3%
Todd County Health Department 9 4 13 97 110 8.2% 3.6% 11.8% 88.2%
North Central Community Action
Agencies, Inc. 62 55 117 642 759 8.2% 7.2% 15.4% 84.6%
Comm Action Program of West
IN 42 19 61 454 515 8.2% 3.7% 11.8% 88.2%
Catholic Charities of Buffalo 449 618 1,067 4,454 5,521 8.1% 11.2% 19.3% 80.7%
Upper Cumberland Region 203 196 399 2,098 2,497 8.1% 7.8% 16.0% 84.0%
Visiting Nurse Association 127 355 482 1,081 1,563 8.1% 22.7% 30.8% 69.2%
Belmont County WIC Program 32 5 37 357 394 8.1% 1.3% 9.4% 90.6%
Gadsden County Health
Department 35 68 103 328 431 8.1% 15.8% 23.9% 76.1%
Chautauqua County Health Dept 3 1 4 33 37 8.1% 2.7% 10.8% 89.2%
Children's National Medical
Center 97 217 314 885 1,199 8.1% 18.1% 26.2% 73.8%
Cass County Health Dept 8 15 23 76 99 8.1% 15.2% 23.2% 76.8%
East Hartford WIC Program 87 172 259 820 1,079 8.1% 15.9% 24.0% 76.0%
Lake Co. Hlth Dept. & Comm.
Hlth. Ctr. 265 783 1,048 2,239 3,287 8.1% 23.8% 31.9% 68.1%
South Central Region 213 214 427 2,217 2,644 8.1% 8.1% 16.1% 83.9%
Louisville-Jefferson Metro H. D. 366 1,869 2,235 2,310 4,545 8.1% 41.1% 49.2% 50.8%
Muhlenberg County Health
Department 19 7 26 210 236 8.1% 3.0% 11.0% 89.0%
Corpus Christi-Nueces County
Public Health District 99 291 390 847 1,237 8.0% 23.5% 31.5% 68.5%
Lowell WIC 101 192 293 969 1,262 8.0% 15.2% 23.2% 76.8%
Logan County WIC Program 20 8 28 222 250 8.0% 3.2% 11.2% 88.8%
NV Health Centers 598 1,727 2,325 5,154 7,479 8.0% 23.1% 31.1% 68.9%
Whitley County Health
Department 45 49 94 469 563 8.0% 8.7% 16.7% 83.3%
Dist/Unit 10-0 Northeast Health
District 217 314 531 2,184 2,715 8.0% 11.6% 19.6% 80.4%
*To maintain the privacy of participants, Local Agencies with less than 30 Infant Participants are not published. 71

Fully Formula-Fed
Local Agency
Infant Data
Participation Data Statistical Data
Fully Breastfed Partially Breastfed Total Breastfed Fully Formula-Fed Total Infants Fully Breastfed Partially Breastfed Total Breastfed
Lorain County WIC Program 119 27 146 1,344 1,490 8.0% 1.8% 9.8% 90.2%
Lake County WIC Program 77 40 117 850 967 8.0% 4.1% 12.1% 87.9%
Grace Hill Neighborhood Health
Centers, Inc. 162 249 411 1,625 2,036 8.0% 12.2% 20.2% 79.8%
Mount Rogers District 97 54 151 1,070 1,221 7.9% 4.4% 12.4% 87.6%
Henderson County Health
Department 13 12 25 139 164 7.9% 7.3% 15.2% 84.8%
Maimonides Medical Center 168 857 1,025 1,099 2,124 7.9% 40.3% 48.3% 51.7%
Middletown Community Health
Center 12 12 24 128 152 7.9% 7.9% 15.8% 84.2%
Franklin County WIC Program 718 378 1,096 8,004 9,100 7.9% 4.2% 12.0% 88.0%
Chambers County Health
Department 13 28 41 124 165 7.9% 17.0% 24.8% 75.2%
St Landry Parish Police Jury 14 9 23 155 178 7.9% 5.1% 12.9% 87.1%
Ford County Health Dept 44 106 150 410 560 7.9% 18.9% 26.8% 73.2%
Ottawa County WIC Program 12 10 22 131 153 7.8% 6.5% 14.4% 85.6%
Waco Mclennan Co Public
Health District 165 366 531 1,575 2,106 7.8% 17.4% 25.2% 74.8%
Public Health Area 5 273 470 743 2,746 3,489 7.8% 13.5% 21.3% 78.7%
Family Rosource Centers of NE
Nevada 14 11 25 154 179 7.8% 6.1% 14.0% 86.0%
White Earth Health Reservation
WIC 14 11 25 154 179 7.8% 6.1% 14.0% 86.0%
Warren County Health
Department 10 16 26 102 128 7.8% 12.5% 20.3% 79.7%
Portsmouth District 77 45 122 864 986 7.8% 4.6% 12.4% 87.6%
Trumbull County WIC Program 99 30 129 1,140 1,269 7.8% 2.4% 10.2% 89.8%
Prince Georges County WIC
Program 337 1,338 1,675 2,652 4,327 7.8% 30.9% 38.7% 61.3%
Brunswick County Health
Department 44 64 108 457 565 7.8% 11.3% 19.1% 80.9%
Area V Agency on Aging &
Comm. Serv. 31 17 48 351 399 7.8% 4.3% 12.0% 88.0%
Victoria City-County Health
Department 97 144 241 1,008 1,249 7.8% 11.5% 19.3% 80.7%
Stoddard County Health Dept 17 10 27 192 219 7.8% 4.6% 12.3% 87.7%
Butler County WIC Program 163 92 255 1,849 2,104 7.7% 4.4% 12.1% 87.9%
Springfield North WIC 99 154 253 1,026 1,279 7.7% 12.0% 19.8% 80.2%
Lincoln Community Health
Center 148 314 462 1,452 1,914 7.7% 16.4% 24.1% 75.9%
Ft. Bend Family Health Center
Inc. 133 796 929 797 1,726 7.7% 46.1% 53.8% 46.2%
Blue Valley Community Action 15 38 53 142 195 7.7% 19.5% 27.2% 72.8%
Springfield South WIC 71 126 197 726 923 7.7% 13.7% 21.3% 78.7%
People's Health Center 156 181 337 1,700 2,037 7.7% 8.9% 16.5% 83.5%
Albemarle Regional Health
Services 51 49 100 567 667 7.6% 7.3% 15.0% 85.0%
West Piedmont District 68 53 121 770 891 7.6% 5.9% 13.6% 86.4%
AR Department of Health/WIC 1,869 919 2,788 21,713 24,501 7.6% 3.8% 11.4% 88.6%
Harris County Public Health &
Environmental Service 1,189 5,873 7,062 8,534 15,596 7.6% 37.7% 45.3% 54.7%
Dubois County Health Dept 17 27 44 179 223 7.6% 12.1% 19.7% 80.3%
Westchester County
Department of Health 167 896 1,063 1,129 2,192 7.6% 40.9% 48.5% 51.5%
Trinitas Hospital WIC Program 149 669 818 1,138 1,956 7.6% 34.2% 41.8% 58.2%
Gaston County Health
Department 113 231 344 1,140 1,484 7.6% 15.6% 23.2% 76.8%
Aunt Martha's Youth Service
Center 13 46 59 112 171 7.6% 26.9% 34.5% 65.5%
Vanderburgh County Health
Dept 78 44 122 905 1,027 7.6% 4.3% 11.9% 88.1%
Indiana Health Centers, Inc. 188 185 373 2,103 2,476 7.6% 7.5% 15.1% 84.9%
Three Rivers District 47 37 84 535 619 7.6% 6.0% 13.6% 86.4%
Franklin Williamson Bi-County 56 27 83 656 739 7.6% 3.7% 11.2% 88.8%
Adams/Brown County WIC
Program 41 7 48 494 542 7.6% 1.3% 8.9% 91.1%
Marshall County Health Dept 4 3 7 46 53 7.5% 5.7% 13.2% 86.8%
Coles County Health
Department 22 21 43 249 292 7.5% 7.2% 14.7% 85.3%
Passaic WIC Program 102 359 461 895 1,356 7.5% 26.5% 34.0% 66.0%
Division of Public Health/Milford
Clinic 183 127 310 2,125 2,435 7.5% 5.2% 12.7% 87.3%
Jackson County Health
Department 62 71 133 692 825 7.5% 8.6% 16.1% 83.9%
San Patricio County Health
Department 53 112 165 541 706 7.5% 15.9% 23.4% 76.6%
Health Service Regions 6/5
South 181 941 1,122 1,290 2,412 7.5% 39.0% 46.5% 53.5%
Fairfax District 313 1,550 1,863 2,324 4,187 7.5% 37.0% 44.5% 55.5%
Harrison County WIC Program 7 1 8 86 94 7.4% 1.1% 8.5% 91.5%
Macoupin County Health Dept 16 19 35 180 215 7.4% 8.8% 16.3% 83.7%
Region 8 106 186 292 1,142 1,434 7.4% 13.0% 20.4% 79.6%
Western Indiana Community
Action Agency, Inc. 62 40 102 737 839 7.4% 4.8% 12.2% 87.8%
Family Health Services of
Cranston 26 21 47 305 352 7.4% 6.0% 13.4% 86.6%
Community Care Foundation,
Inc. 54 123 177 558 735 7.3% 16.7% 24.1% 75.9%
John's Hopkins WIC Program 175 472 647 1,736 2,383 7.3% 19.8% 27.2% 72.8%
Shelby County Health
Department 8 7 15 94 109 7.3% 6.4% 13.8% 86.2%
Boone County Health Dept 20 50 70 203 273 7.3% 18.3% 25.6% 74.4%
Health Service Region 11 89 224 313 902 1,215 7.3% 18.4% 25.8% 74.2%
Long Island Jewish Medical
Center 46 266 312 317 629 7.3% 42.3% 49.6% 50.4%
Region 2 500 519 1,019 5,818 6,837 7.3% 7.6% 14.9% 85.1%
Gateway District 40 72 112 435 547 7.3% 13.2% 20.5% 79.5%
St. Charles Community Health
Center/Slidell WIC Clinic 56 42 98 668 766 7.3% 5.5% 12.8% 87.2%
Ross/Pickaway County WIC
Program 62 16 78 771 849 7.3% 1.9% 9.2% 90.8%
Jamaica Plain WIC 37 150 187 320 507 7.3% 29.6% 36.9% 63.1%
Arlington District 48 351 399 259 658 7.3% 53.3% 60.6% 39.4%
Turtle Mountain Band of
Chiippewa 14 16 30 162 192 7.3% 8.3% 15.6% 84.4%
Cowley County Health Dept 22 20 42 260 302 7.3% 6.6% 13.9% 86.1%
*To maintain the privacy of participants, Local Agencies with less than 30 Infant Participants are not published. 72

Fully Formula-Fed
Local Agency
Infant Data
Participation Data Statistical Data
Fully Breastfed Partially Breastfed Total Breastfed Fully Formula-Fed Total Infants Fully Breastfed Partially Breastfed Total Breastfed
Clark County WIC Program 78 21 99 975 1,074 7.3% 2.0% 9.2% 90.8%
Walsh County WIC Program 5 8 13 56 69 7.2% 11.6% 18.8% 81.2%
TSN/WIC Program 160 62 222 1,995 2,217 7.2% 2.8% 10.0% 90.0%
Johnston County Health
Department 75 149 224 816 1,040 7.2% 14.3% 21.5% 78.5%
Genesee County Health Dept 221 161 382 2,683 3,065 7.2% 5.3% 12.5% 87.5%
Chesterfield District 105 121 226 1,232 1,458 7.2% 8.3% 15.5% 84.5%
Brooklyn Hospital Center 288 3,307 3,595 411 4,006 7.2% 82.6% 89.7% 10.3%
Pike County WIC Program 17 3 20 217 237 7.2% 1.3% 8.4% 91.6%
OK Cherokee Nation WIC
Program 139 59 198 1,743 1,941 7.2% 3.0% 10.2% 89.8%
Mecklenburg County Health
Department 407 1,057 1,464 4,233 5,697 7.1% 18.6% 25.7% 74.3%
Ray County Health Dept 10 8 18 122 140 7.1% 5.7% 12.9% 87.1%
Jefferson County Health Dept 19 19 38 229 267 7.1% 7.1% 14.2% 85.8%
Shannon County WIC
Program/IHS Hospital Building,
PO Box 1988 21 34 55 241 296 7.1% 11.5% 18.6% 81.4%
CenterStone of Indiana, Inc. 61 51 112 748 860 7.1% 5.9% 13.0% 87.0%
Family Health Services/WIC 24 18 42 297 339 7.1% 5.3% 12.4% 87.6%
Northern Arapahoe 8 19 27 86 113 7.1% 16.8% 23.9% 76.1%
Morgan County Health Dept 14 12 26 172 198 7.1% 6.1% 13.1% 86.9%
Muskingum County WIC
Program 46 13 59 594 653 7.0% 2.0% 9.0% 91.0%
Western Tidewater District 53 19 72 687 759 7.0% 2.5% 9.5% 90.5%
Gibson County Area Rehab
Centers, Inc. 18 9 27 231 258 7.0% 3.5% 10.5% 89.5%
Whitney M. Young, Jr. Health
Center, Inc 44 118 162 470 632 7.0% 18.7% 25.6% 74.4%
Commission on Economic
Opportunity 56 82 138 668 806 6.9% 10.2% 17.1% 82.9%
Mile Square Health Center 15 22 37 179 216 6.9% 10.2% 17.1% 82.9%
St. Vincent Jennings Hospital,
Inc. 15 12 27 189 216 6.9% 5.6% 12.5% 87.5%
Iron County Health Dept 7 3 10 91 101 6.9% 3.0% 9.9% 90.1%
Wayne County Health
Department 82 139 221 966 1,187 6.9% 11.7% 18.6% 81.4%
Beaufort County Health
Department 25 48 73 289 362 6.9% 13.3% 20.2% 79.8%
Hospital of St. Raphael 141 481 622 1,422 2,044 6.9% 23.5% 30.4% 69.6%
Estill County Health Department 9 12 21 110 131 6.9% 9.2% 16.0% 84.0%
Surry County Health
Department 34 82 116 379 495 6.9% 16.6% 23.4% 76.6%
Pender County Health
Department 21 32 53 253 306 6.9% 10.5% 17.3% 82.7%
Morton Health Center 19 27 46 231 277 6.9% 9.7% 16.6% 83.4%
Region 3 481 552 1,033 6,002 7,035 6.8% 7.8% 14.7% 85.3%
E. Orange WIC Program 91 398 489 842 1,331 6.8% 29.9% 36.7% 63.3%
Atlantic City WIC Program 106 296 402 1,150 1,552 6.8% 19.1% 25.9% 74.1%
Fayette County WIC Program 17 3 20 229 249 6.8% 1.2% 8.0% 92.0%
Region 6 186 247 433 2,292 2,725 6.8% 9.1% 15.9% 84.1%
Powell County Health
Department 9 32 41 92 133 6.8% 24.1% 30.8% 69.2%
Breckinridge County Health
Department 10 52 62 86 148 6.8% 35.1% 41.9% 58.1%
Lawrence County Health Dept 7 8 15 89 104 6.7% 7.7% 14.4% 85.6%
St Martin Parish Government 16 7 23 215 238 6.7% 2.9% 9.7% 90.3%
Person County Health
Department 17 17 34 219 253 6.7% 6.7% 13.4% 86.6%
Lewis County Health
Department 9 22 31 103 134 6.7% 16.4% 23.1% 76.9%
Northwest Family Services, Inc. 265 314 579 3,372 3,951 6.7% 7.9% 14.7% 85.3%
Winnebago County Health
Department 135 167 302 1,712 2,014 6.7% 8.3% 15.0% 85.0%
William F. Ryan Community
Health Center 50 201 251 496 747 6.7% 26.9% 33.6% 66.4%
Caldwell County Health Center 3 1 4 41 45 6.7% 2.2% 8.9% 91.1%
Dept. of Health-VI WIC Program 37 293 330 228 558 6.6% 52.5% 59.1% 40.9%
Dunklin County Health Dept 24 12 36 328 364 6.6% 3.3% 9.9% 90.1%
Crater District 76 72 148 1,006 1,154 6.6% 6.2% 12.8% 87.2%
Marion County WIC Program 34 10 44 473 517 6.6% 1.9% 8.5% 91.5%
Greater Baden WIC Program 83 311 394 869 1,263 6.6% 24.6% 31.2% 68.8%
Ashland-Boyd County Health
Dept. 27 55 82 329 411 6.6% 13.4% 20.0% 80.0%
Hoke County Health Department 30 60 90 367 457 6.6% 13.1% 19.7% 80.3%
East-Central District Health Dept 24 31 55 311 366 6.6% 8.5% 15.0% 85.0%
Macomb County Health Dept 184 216 400 2,409 2,809 6.6% 7.7% 14.2% 85.8%
Dist/Unit 04-0 LaGrange Hlth
Services 344 714 1,058 4,199 5,257 6.5% 13.6% 20.1% 79.9%
Dist/Unit 06-0 East Central Hlth
Dist. 232 461 693 2,858 3,551 6.5% 13.0% 19.5% 80.5%
Bennett County WIC Program 3 8 11 35 46 6.5% 17.4% 23.9% 76.1%
Scioto County WIC Program 41 12 53 577 630 6.5% 1.9% 8.4% 91.6%
Morrisania Diagnostic and
Treatment Center (NYCHHC) 96 562 658 819 1,477 6.5% 38.1% 44.5% 55.5%
Walworth County WIC
Program/Mobridge Regional
Hospital 2 3 5 26 31 6.5% 9.7% 16.1% 83.9%
Crescent City WIC
Services/Gretna 59 94 153 762 915 6.4% 10.3% 16.7% 83.3%
Comm. Hlth. Interven. & Ed.
Found., Inc. 5 3 8 70 78 6.4% 3.8% 10.3% 89.7%
Buffalo Trace District 11 33 44 128 172 6.4% 19.2% 25.6% 74.4%
Hamilton County WIC Program 356 216 572 5,018 5,590 6.4% 3.9% 10.2% 89.8%
Piedmont District 41 32 73 571 644 6.4% 5.0% 11.3% 88.7%
Rowan County Health
Department 55 117 172 693 865 6.4% 13.5% 19.9% 80.1%
Roberts County WIC Program 8 11 19 107 126 6.3% 8.7% 15.1% 84.9%
Cross Timbers Health Clinic 9 44 53 89 142 6.3% 31.0% 37.3% 62.7%
Sunrise Foundation 181 577 758 2,115 2,873 6.3% 20.1% 26.4% 73.6%
*To maintain the privacy of participants, Local Agencies with less than 30 Infant Participants are not published. 73

Fully Formula-Fed
Local Agency
Infant Data
Participation Data Statistical Data
Fully Breastfed Partially Breastfed Total Breastfed Fully Formula-Fed Total Infants Fully Breastfed Partially Breastfed Total Breastfed
Tri-County Community Health
Center 16 73 89 165 254 6.3% 28.7% 35.0% 65.0%
Public Health Area 2 350 592 942 4,643 5,585 6.3% 10.6% 16.9% 83.1%
Community & Econ Dev Assoc
CEDA 775 3,021 3,796 8,596 12,392 6.3% 24.4% 30.6% 69.4%
Matagorda County Hospital
District 24 40 64 320 384 6.3% 10.4% 16.7% 83.3%
Region 1 224 213 437 3,155 3,592 6.2% 5.9% 12.2% 87.8%
Oneida County Health
Department 89 197 286 1,142 1,428 6.2% 13.8% 20.0% 80.0%
Cheyenne River WIC Program 9 10 19 126 145 6.2% 6.9% 13.1% 86.9%
Dist/Unit 03-4 East Metro Hlth
Dist. 425 1,965 2,390 4,477 6,867 6.2% 28.6% 34.8% 65.2%
Fulmont Community Action
Agency, Inc 35 55 90 476 566 6.2% 9.7% 15.9% 84.1%
Dept. of Human & Social
Services 69 639 708 408 1,116 6.2% 57.3% 63.4% 36.6%
Little Sandy District 23 42 65 307 372 6.2% 11.3% 17.5% 82.5%
Bristol Hospital WIC Program 71 194 265 884 1,149 6.2% 16.9% 23.1% 76.9%
Moore County Health
Department 30 43 73 415 488 6.1% 8.8% 15.0% 85.0%
Wyckoff Heights Medical Center 104 577 681 1,013 1,694 6.1% 34.1% 40.2% 59.8%
Greene County Health
Department 6 4 10 88 98 6.1% 4.1% 10.2% 89.8%
PCHC, INC 83 219 302 1,055 1,357 6.1% 16.1% 22.3% 77.7%
Marion County Health Dept 519 1,107 1,626 6,883 8,509 6.1% 13.0% 19.1% 80.9%
Barrio Comprehensive Family
Health Care Center 47 187 234 538 772 6.1% 24.2% 30.3% 69.7%
Public Health Area 9 158 220 378 2,218 2,596 6.1% 8.5% 14.6% 85.4%
Wayne County Health Dept 314 770 1,084 4,080 5,164 6.1% 14.9% 21.0% 79.0%
UT Health Science Center at
Houston 465 2,722 3,187 4,469 7,656 6.1% 35.6% 41.6% 58.4%
Dearborn County Hospital 30 21 51 444 495 6.1% 4.2% 10.3% 89.7%
Jasper-Newton County Public
Health District 34 82 116 445 561 6.1% 14.6% 20.7% 79.3%
San Carlos Apache Tribe 16 1 17 247 264 6.1% 0.4% 6.4% 93.6%
Grant Parish Health
Unit/COLFAX 9 6 15 134 149 6.0% 4.0% 10.1% 89.9%
Harnett County Health
Department 45 90 135 612 747 6.0% 12.0% 18.1% 81.9%
Houston (City of) Dept. of
Health & Human Services 1,030 8,057 9,087 8,015 17,102 6.0% 47.1% 53.1% 46.9%
Lenoir Community Health
Center 30 50 80 421 501 6.0% 10.0% 16.0% 84.0%
Madison County Health Dept 49 75 124 696 820 6.0% 9.1% 15.1% 84.9%
Mahoning County WIC Program 83 55 138 1,256 1,394 6.0% 3.9% 9.9% 90.1%
St. Mary's Warrick Hospital, Inc. 28 20 48 424 472 5.9% 4.2% 10.2% 89.8%
Fort Peck Tribal Health Dept 9 8 17 135 152 5.9% 5.3% 11.2% 88.8%
Lincoln Trail District 126 870 996 1,140 2,136 5.9% 40.7% 46.6% 53.4%
City of Milwaukee 112 150 262 1,639 1,901 5.9% 7.9% 13.8% 86.2%
Cocopah Tribe WIC Program 3 3 6 45 51 5.9% 5.9% 11.8% 88.2%
Lyman County WIC Program 3 3 6 45 51 5.9% 5.9% 11.8% 88.2%
Northampton County Health
Department 9 11 20 133 153 5.9% 7.2% 13.1% 86.9%
St. Luke's-Roosevelt Hospital
Center 28 147 175 301 476 5.9% 30.9% 36.8% 63.2%
Urban League 72 146 218 1,009 1,227 5.9% 11.9% 17.8% 82.2%
Texarkana Bowie County Family
Health Center 45 37 82 686 768 5.9% 4.8% 10.7% 89.3%
Jersey City Dept Hum Res WIC
Program 132 733 865 1,394 2,259 5.8% 32.4% 38.3% 61.7%
Beaumont Public Health
Department 78 416 494 844 1,338 5.8% 31.1% 36.9% 63.1%
MLK Heritage Health Center 44 41 85 673 758 5.8% 5.4% 11.2% 88.8%
Macon Health Department 44 35 79 680 759 5.8% 4.6% 10.4% 89.6%
United Medical Centers 54 517 571 366 937 5.8% 55.2% 60.9% 39.1%
Fleming County Health
Department 7 14 21 101 122 5.7% 11.5% 17.2% 82.8%
Richmond University Medical
Center 48 244 292 547 839 5.7% 29.1% 34.8% 65.2%
Jefferson County WIC Program 22 16 38 347 385 5.7% 4.2% 9.9% 90.1%
Harlem Hospital (NYCHHC) 76 478 554 777 1,331 5.7% 35.9% 41.6% 58.4%
Scott County Health Dept 20 18 38 313 351 5.7% 5.1% 10.8% 89.2%
Baltimore City WIC Program 256 551 807 3,698 4,505 5.7% 12.2% 17.9% 82.1%
Cleveland County Health
Department 41 35 76 647 723 5.7% 4.8% 10.5% 89.5%
Rocky Boy WIC 4 5 9 62 71 5.6% 7.0% 12.7% 87.3%
East Feliciana Parish Health
Unit/CLINTON 12 9 21 193 214 5.6% 4.2% 9.8% 90.2%
Ford Iroquois Public Health 12 17 29 185 214 5.6% 7.9% 13.6% 86.4%
East Chicago Health Dept 27 45 72 411 483 5.6% 9.3% 14.9% 85.1%
Guernsey County WIC Program 16 2 18 269 287 5.6% 0.7% 6.3% 93.7%
Lincoln Parish Health
Unit/RUSTON 18 17 35 288 323 5.6% 5.3% 10.8% 89.2%
Union County WIC Program 2 3 5 31 36 5.6% 8.3% 13.9% 86.1%
Johnson County Health
Department 14 28 42 211 253 5.5% 11.1% 16.6% 83.4%
Public Health Area 6 148 264 412 2,280 2,692 5.5% 9.8% 15.3% 84.7%
Washington-Morgan WIC
Program 24 5 29 408 437 5.5% 1.1% 6.6% 93.4%
Clark County Health Department 17 73 90 221 311 5.5% 23.5% 28.9% 71.1%
Prince William District 103 484 587 1,300 1,887 5.5% 25.6% 31.1% 68.9%
Dist./Unit 01-1 Northwest GA
Hlth Dist. 233 724 957 3,339 4,296 5.4% 16.9% 22.3% 77.7%
Dist/Unit 07-0 West Central Hlth
Dist 197 556 753 2,882 3,635 5.4% 15.3% 20.7% 79.3%
Pittsylvania-Danville District 35 29 64 584 648 5.4% 4.5% 9.9% 90.1%
Three Rivers District 24 92 116 330 446 5.4% 20.6% 26.0% 74.0%
Health Delivery, Inc. 28 44 72 450 522 5.4% 8.4% 13.8% 86.2%
Division of Public
Health/Hudson Clinic 168 251 419 2,716 3,135 5.4% 8.0% 13.4% 86.6%
*To maintain the privacy of participants, Local Agencies with less than 30 Infant Participants are not published. 74

Fully Formula-Fed
Local Agency
Infant Data
Participation Data Statistical Data
Fully Breastfed Partially Breastfed Total Breastfed Fully Formula-Fed Total Infants Fully Breastfed Partially Breastfed Total Breastfed
Catholic Charities of Rockville
Center 29 239 268 275 543 5.3% 44.0% 49.4% 50.6%
Cumberland Valley District 67 140 207 1,048 1,255 5.3% 11.2% 16.5% 83.5%
Hildalgo County Health &
human Services Dept. 803 9,852 10,655 4,416 15,071 5.3% 65.4% 70.7% 29.3%
Hertford County Health
Department 11 11 22 185 207 5.3% 5.3% 10.6% 89.4%
Staten Island University Hospital 57 344 401 673 1,074 5.3% 32.0% 37.3% 62.7%
Near North Health Service 120 746 866 1,404 2,270 5.3% 32.9% 38.1% 61.9%
Norfolk District 108 100 208 1,841 2,049 5.3% 4.9% 10.2% 89.8%
Sullivan County Health Dept 3 5 8 49 57 5.3% 8.8% 14.0% 86.0%
Kentucky River District 54 104 158 870 1,028 5.3% 10.1% 15.4% 84.6%
Cameron County Dept of Health
and Human Services 325 3,009 3,334 2,861 6,195 5.2% 48.6% 53.8% 46.2%
Howard University Hospital 32 72 104 506 610 5.2% 11.8% 17.0% 83.0%
Christian County Health Dept 11 10 21 189 210 5.2% 4.8% 10.0% 90.0%
Su Clinica Familiar 15 54 69 219 288 5.2% 18.8% 24.0% 76.0%
Rock Island County Health Dept 58 206 264 850 1,114 5.2% 18.5% 23.7% 76.3%
Corsicana Navarro County Pub
Health District 26 85 111 389 500 5.2% 17.0% 22.2% 77.8%
Research Foundation of SUNY
Stony Brook 57 246 303 797 1,100 5.2% 22.4% 27.5% 72.5%
North Central District 30 185 215 364 579 5.2% 32.0% 37.1% 62.9%
Peoria City Health Department 67 136 203 1,091 1,294 5.2% 10.5% 15.7% 84.3%
Vermilion County Health
Department 37 33 70 645 715 5.2% 4.6% 9.8% 90.2%
St Vincent Dunn Hospital 14 17 31 241 272 5.1% 6.3% 11.4% 88.6%
Edgar County Health Dept 5 2 7 91 98 5.1% 2.0% 7.1% 92.9%
Southern Seven Health
Department 25 27 52 440 492 5.1% 5.5% 10.6% 89.4%
Granville-Vance District Health
Department 38 72 110 639 749 5.1% 9.6% 14.7% 85.3%
Dist/Unit 03-5 Metro East Hlth
District 298 1,943 2,241 3,634 5,875 5.1% 33.1% 38.1% 61.9%
Public Health Area 10 129 186 315 2,243 2,558 5.0% 7.3% 12.3% 87.7%
Livingston Parrish Health
Unit/Livingston 37 20 57 683 740 5.0% 2.7% 7.7% 92.3%
Ute Mountain Tribe WIC
Program 2 7 9 31 40 5.0% 17.5% 22.5% 77.5%
Anthony L. Jordan Health
Center 55 158 213 890 1,103 5.0% 14.3% 19.3% 80.7%
Cook County Dept of Public
Health 252 1,220 1,472 3,622 5,094 4.9% 23.9% 28.9% 71.1%
Dist/Unit 08-1 South Central
Health Dist 114 101 215 2,097 2,312 4.9% 4.4% 9.3% 90.7%
Public Health Area 8 238 463 701 4,183 4,884 4.9% 9.5% 14.4% 85.6%
Stamford WIC Program 56 265 321 830 1,151 4.9% 23.0% 27.9% 72.1%
Claiborne Parish Health
Unit/HOMER 7 10 17 128 145 4.8% 6.9% 11.7% 88.3%
Rockingham County Health
Department 27 43 70 491 561 4.8% 7.7% 12.5% 87.5%
Vida Y Salud Health Systems,
Inc 34 240 274 434 708 4.8% 33.9% 38.7% 61.3%
St. Joseph Health Services 15 32 47 267 314 4.8% 10.2% 15.0% 85.0%
Lafayette Parish Health
Unit/LAFAYETTE 58 77 135 1,081 1,216 4.8% 6.3% 11.1% 88.9%
Lenowisco District 29 15 44 565 609 4.8% 2.5% 7.2% 92.8%
Montgomery County Health
Department 13 50 63 210 273 4.8% 18.3% 23.1% 76.9%
Public Health Area 1 108 357 465 1,813 2,278 4.7% 15.7% 20.4% 79.6%
Beauregard Parish Health
Unit/DERIDDER 15 13 28 289 317 4.7% 4.1% 8.8% 91.2%
Women and Infants Hospital 25 46 71 458 529 4.7% 8.7% 13.4% 86.6%
Queens Hospital Center
(NYCHHC) 88 781 869 999 1,868 4.7% 41.8% 46.5% 53.5%
Mississippi County Health Dept 7 1 8 141 149 4.7% 0.7% 5.4% 94.6%
PACE Community Action
Agency 21 25 46 401 447 4.7% 5.6% 10.3% 89.7%
Jefferson Davis Parish Health
Unit/JENNINGS 15 15 30 290 320 4.7% 4.7% 9.4% 90.6%
Mary's Center for Maternal &
Child Care 31 278 309 354 663 4.7% 41.9% 46.6% 53.4%
St Charles Community Health
Center 38 62 100 714 814 4.7% 7.6% 12.3% 87.7%
Parish of Ascension 86 137 223 1,621 1,844 4.7% 7.4% 12.1% 87.9%
UMDNJ WIC Program 63 509 572 780 1,352 4.7% 37.6% 42.3% 57.7%
Daughters of Charity Services of
New Orleans 78 141 219 1,466 1,685 4.6% 8.4% 13.0% 87.0%
Children's Friend & Service 38 122 160 663 823 4.6% 14.8% 19.4% 80.6%
Dist/Unit 09-3 Coastal Health
District 158 467 625 2,838 3,463 4.6% 13.5% 18.0% 82.0%
Clay County Health Dept 10 13 23 197 220 4.5% 5.9% 10.5% 89.5%
Dept. of Health-VI WIC Program 27 365 392 211 603 4.5% 60.5% 65.0% 35.0%
Jackson Parish Health
Unit/JONESBORO 7 4 11 146 157 4.5% 2.5% 7.0% 93.0%
Unity Health Care 103 371 474 1,837 2,311 4.5% 16.1% 20.5% 79.5%
Acadia Parish Health
Unit/CROWLEY 11 7 18 229 247 4.5% 2.8% 7.3% 92.7%
Schuyler County Health
Department 2 1 3 42 45 4.4% 2.2% 6.7% 93.3%
Greenup County Health
Department 11 39 50 198 248 4.4% 15.7% 20.2% 79.8%
Plainfield WIC Program 39 205 244 636 880 4.4% 23.3% 27.7% 72.3%
Bladen County Health
Department 12 38 50 221 271 4.4% 14.0% 18.5% 81.5%
Cumberland Plateau 27 16 43 568 611 4.4% 2.6% 7.0% 93.0%
Waterbury Hlth Dept. WIC
Program 64 266 330 1,122 1,452 4.4% 18.3% 22.7% 77.3%
St Bernard Parish Health
Unit/CHALMETTE 19 25 44 388 432 4.4% 5.8% 10.2% 89.8%
Newark WIC Program 132 1,094 1,226 1,777 3,003 4.4% 36.4% 40.8% 59.2%
Eastern Shore District 18 43 61 351 412 4.4% 10.4% 14.8% 85.2%
Aurora Health Care 31 49 80 630 710 4.4% 6.9% 11.3% 88.7%
*To maintain the privacy of participants, Local Agencies with less than 30 Infant Participants are not published. 75

Fully Formula-Fed
Local Agency
Infant Data
Participation Data Statistical Data
Fully Breastfed Partially Breastfed Total Breastfed Fully Formula-Fed Total Infants Fully Breastfed Partially Breastfed Total Breastfed
Jefferson Parish Health
Unit/METAIRIE 34 70 104 681 785 4.3% 8.9% 13.2% 86.8%
Region 4 233 348 581 4,821 5,402 4.3% 6.4% 10.8% 89.2%
Southside District 21 23 44 443 487 4.3% 4.7% 9.0% 91.0%
Calcasieu Parish Health
Unit/LAKE CHARLES 58 87 145 1,217 1,362 4.3% 6.4% 10.6% 89.4%
Teche Action Clinic 12 10 22 261 283 4.2% 3.5% 7.8% 92.2%
Bayou Comprehensive Health
Foundation 11 10 21 239 260 4.2% 3.8% 8.1% 91.9%
Wee Care Day Care WIC 75 142 217 1,559 1,776 4.2% 8.0% 12.2% 87.8%
West TN Region Union City 82 95 177 1,767 1,944 4.2% 4.9% 9.1% 90.9%
Optimus Health Care WIC
Program 79 483 562 1,324 1,886 4.2% 25.6% 29.8% 70.2%
St John Parish Health
Unit/RESERVE 16 14 30 353 383 4.2% 3.7% 7.8% 92.2%
Duplin County Health
Department 25 118 143 456 599 4.2% 19.7% 23.9% 76.1%
Buffalo County WIC Program 2 3 5 43 48 4.2% 6.3% 10.4% 89.6%
Children Health Care Clinic of
Acadiana 19 25 44 412 456 4.2% 5.5% 9.6% 90.4%
Bronx Lebanon Hospital Center 30 477 507 219 726 4.1% 65.7% 69.8% 30.2%
The Greather Hudson Valley
Family Health Center, Inc 32 173 205 573 778 4.1% 22.2% 26.3% 73.7%
West TN Region Jackson 81 118 199 1,780 1,979 4.1% 6.0% 10.1% 89.9%
Suffolk County Department of
Health Services 194 1,708 1,902 2,855 4,757 4.1% 35.9% 40.0% 60.0%
Galveston Co. Health District 67 445 512 1,143 1,655 4.0% 26.9% 30.9% 69.1%
Richmond City District 69 145 214 1,510 1,724 4.0% 8.4% 12.4% 87.6%
Outpatient Medical Center 9 15 24 201 225 4.0% 6.7% 10.7% 89.3%
Union Parish Health
Unit/FARMERVILLE 8 9 17 183 200 4.0% 4.5% 8.5% 91.5%
New York Presbyterian Medical
Center 102 1,162 1,264 1,306 2,570 4.0% 45.2% 49.2% 50.8%
Egyptian Health Department 13 13 26 302 328 4.0% 4.0% 7.9% 92.1%
Leech Lake Band of Ojibwe 6 13 19 133 152 3.9% 8.6% 12.5% 87.5%
Richmond County Health
Department 17 40 57 375 432 3.9% 9.3% 13.2% 86.8%
Public Health Area 11 140 249 389 3,169 3,558 3.9% 7.0% 10.9% 89.1%
Public Health Area 4 179 514 693 3,862 4,555 3.9% 11.3% 15.2% 84.8%
Park Duvalle Health Center 16 134 150 258 408 3.9% 32.8% 36.8% 63.2%
Lawrence County WIC Program 20 10 30 483 513 3.9% 1.9% 5.8% 94.2%
Lafourche Parish Health
Unit/THIBODAUX 27 28 55 640 695 3.9% 4.0% 7.9% 92.1%
Children and Youth Project 15 127 142 252 394 3.8% 32.2% 36.0% 64.0%
Columbus County Health
Department 20 51 71 459 530 3.8% 9.6% 13.4% 86.6%
Hartford Health Department 71 404 475 1,423 1,898 3.7% 21.3% 25.0% 75.0%
Sound Shore Medical Center 69 824 893 954 1,847 3.7% 44.6% 48.3% 51.7%
Bedford Stuyvesant Family
Health Center 26 287 313 386 699 3.7% 41.1% 44.8% 55.2%
Dist/Unit 08-2 Southwest Hlth
District 126 403 529 2,861 3,390 3.7% 11.9% 15.6% 84.4%
Lee County Health Department 19 65 84 429 513 3.7% 12.7% 16.4% 83.6%
West Baton Rouge Parish
Health Unit/PORT ALLEN 11 15 26 271 297 3.7% 5.1% 8.8% 91.2%
Tangipahoa Parish Health
Unit/HAMMOND 43 56 99 1,064 1,163 3.7% 4.8% 8.5% 91.5%
Detroit Dept. of Health and
Welliness 291 856 1,147 6,730 7,877 3.7% 10.9% 14.6% 85.4%
Lincoln Hospital 71 976 1,047 880 1,927 3.7% 50.6% 54.3% 45.7%
Washington Parish Health
Unit/BOGALUSA 17 17 34 432 466 3.6% 3.6% 7.3% 92.7%
Pike County Health Department 22 60 82 523 605 3.6% 9.9% 13.6% 86.4%
Scotland County Health
Department 15 44 59 355 414 3.6% 10.6% 14.3% 85.7%
Dist/Unit 05-1 South Central
Hlth Dist. 43 36 79 1,109 1,188 3.6% 3.0% 6.6% 93.4%
New Madrid County Health Dept 5 2 7 132 139 3.6% 1.4% 5.0% 95.0%
Arunavanthi T. Sangisetty, APM 22 33 55 557 612 3.6% 5.4% 9.0% 91.0%
Region 5 98 166 264 2,475 2,739 3.6% 6.1% 9.6% 90.4%
Martin-Tyrell-Washington 11 20 31 277 308 3.6% 6.5% 10.1% 89.9%
Urban Health Plan, Inc. 48 567 615 735 1,350 3.6% 42.0% 45.6% 54.4%
Spirit Lake Sioux Nation 4 3 7 106 113 3.5% 2.7% 6.2% 93.8%
Rural Health Group Inc. 17 25 42 440 482 3.5% 5.2% 8.7% 91.3%
Grady Health System 48 238 286 1,079 1,365 3.5% 17.4% 21.0% 79.0%
Catholic Charities Brooklyn
Neighborhood 33 404 437 512 949 3.5% 42.6% 46.0% 54.0%
Allen Parish Health
Unit/OAKDALE 7 5 12 190 202 3.5% 2.5% 5.9% 94.1%
Martin County Health
Department 5 19 24 121 145 3.4% 13.1% 16.6% 83.4%
District IX WIC 126 176 302 3,369 3,671 3.4% 4.8% 8.2% 91.8%
City of Port Arthur 31 235 266 640 906 3.4% 25.9% 29.4% 70.6%
District VIII WIC 92 251 343 2,372 2,715 3.4% 9.2% 12.6% 87.4%
Vermillion Parish Health
Unit/ABBEVILLE 16 17 33 441 474 3.4% 3.6% 7.0% 93.0%
Webster Parish Health
Unit/MINDEN 14 6 20 407 427 3.3% 1.4% 4.7% 95.3%
North Caddo Medical Center 5 6 11 142 153 3.3% 3.9% 7.2% 92.8%
Dist./Unit 03-3 Clayton Co. Hlth
District 78 608 686 1,706 2,392 3.3% 25.4% 28.7% 71.3%
Public Health Area 7 45 94 139 1,246 1,385 3.2% 6.8% 10.0% 90.0%
Mt. Vernon Neighborhood
Health Center, Inc. 21 278 299 349 648 3.2% 42.9% 46.1% 53.9%
Detroit Urban League 112 259 371 3,089 3,460 3.2% 7.5% 10.7% 89.3%
Lasalle Parish Health Unit/JENA 3 4 7 86 93 3.2% 4.3% 7.5% 92.5%
Dist/Unit 05-1 North Central Hlth
Dist. 138 310 448 3,863 4,311 3.2% 7.2% 10.4% 89.6%
Nassau County Department of
Health 98 1,202 1,300 1,807 3,107 3.2% 38.7% 41.8% 58.2%
*To maintain the privacy of participants, Local Agencies with less than 30 Infant Participants are not published. 76

Fully Formula-Fed
Local Agency
Infant Data
Participation Data Statistical Data
Fully Breastfed Partially Breastfed Total Breastfed Fully Formula-Fed Total Infants Fully Breastfed Partially Breastfed Total Breastfed
Nash County Health Department 26 77 103 727 830 3.1% 9.3% 12.4% 87.6%
Public Health Area 3 61 126 187 1,767 1,954 3.1% 6.4% 9.6% 90.4%
District II WIC 104 274 378 2,954 3,332 3.1% 8.2% 11.3% 88.7%
West Feliciana Parish Health
Unit/ST FRANCISVILLE 4 5 9 120 129 3.1% 3.9% 7.0% 93.0%
Eastside Health District 31 81 112 889 1,001 3.1% 8.1% 11.2% 88.8%
Mille Lacs Band of Ojibwe WIC
Program 2 5 7 58 65 3.1% 7.7% 10.8% 89.2%
St Martin Parish Health Unit/ST
MARTINVILLE 8 8 16 244 260 3.1% 3.1% 6.2% 93.8%
Natchitoches Parish Health
Unit/NATCHITOCHES 7 10 17 212 229 3.1% 4.4% 7.4% 92.6%
Acadia Parish Police Jury 8 12 20 243 263 3.0% 4.6% 7.6% 92.4%
Rapides Parish Health
Unit/ALEXANDRIA 38 71 109 1,141 1,250 3.0% 5.7% 8.7% 91.3%
Terrebonne Parish Health
Unit/HOUMA 14 18 32 429 461 3.0% 3.9% 6.9% 93.1%
Breathitt County Health
Department 4 10 14 118 132 3.0% 7.6% 10.6% 89.4%
West Jefferson Medical Center 51 91 142 1,552 1,694 3.0% 5.4% 8.4% 91.6%
Laredo (City of) Health
Department 152 1,859 2,011 3,055 5,066 3.0% 36.7% 39.7% 60.3%
Standing Rock Sioux Tribe WIC 5 17 22 147 169 3.0% 10.1% 13.0% 87.0%
East New York Diagnostic and
Treatment Center (NYCHHC) 25 303 328 519 847 3.0% 35.8% 38.7% 61.3%
Bossier Parish Hlth
Unit/BOSSIER 14 34 48 434 482 2.9% 7.1% 10.0% 90.0%
Frio County WIC 6 40 46 161 207 2.9% 19.3% 22.2% 77.8%
Magoffin County Health
Department 4 21 25 113 138 2.9% 15.2% 18.1% 81.9%
North Brooklyn Health Network
(NYCHHC) 46 529 575 1,012 1,587 2.9% 33.3% 36.2% 63.8%
New Orleans Health Department 54 133 187 1,687 1,874 2.9% 7.1% 10.0% 90.0%
Montefiore Medical Center 81 905 986 1,829 2,815 2.9% 32.1% 35.0% 65.0%
Wilson County Health
Department 21 72 93 641 734 2.9% 9.8% 12.7% 87.3%
Sabine Parish Health
Unit/MANY 6 5 11 199 210 2.9% 2.4% 5.2% 94.8%
Caddo Parish Helalth
Unit/SHREVEPORT 22 51 73 698 771 2.9% 6.6% 9.5% 90.5%
Floyd County Health
Department 13 48 61 399 460 2.8% 10.4% 13.3% 86.7%
New York Downtown Hospital 10 81 91 263 354 2.8% 22.9% 25.7% 74.3%
Public Health Solutions 256 4,222 4,478 4,626 9,104 2.8% 46.4% 49.2% 50.8%
St. Francis Medical Center 12 25 37 391 428 2.8% 5.8% 8.6% 91.4%
Dist./Unit 03-2 Fulton Co. Hlth
Dist. 108 768 876 2,981 3,857 2.8% 19.9% 22.7% 77.3%
Ouachita Parish Health
Unit/MONROE 30 30 60 1,012 1,072 2.8% 2.8% 5.6% 94.4%
St Helena Parish Health
Unit/GREENSBURG 4 5 9 136 145 2.8% 3.4% 6.2% 93.8%
Red Lake Comprehensive
Health Services 5 10 15 167 182 2.7% 5.5% 8.2% 91.8%
East Baton Rouge Parish Health
Unit/BATON ROUGE 34 105 139 1,106 1,245 2.7% 8.4% 11.2% 88.8%
Joseph P. Addabbo Family
Health Center 33 385 418 798 1,216 2.7% 31.7% 34.4% 65.6%
St Landry Parish Health
Unit/OPELOUSAS 23 30 53 797 850 2.7% 3.5% 6.2% 93.8%
District I WIC 69 102 171 2,410 2,581 2.7% 4.0% 6.6% 93.4%
Pemiscot County Health Center 6 6 12 221 233 2.6% 2.6% 5.2% 94.8%
Bethel New Life, Inc. 21 81 102 727 829 2.5% 9.8% 12.3% 87.7%
Iberia Parish Health Unit/NEW
IBERIA 18 23 41 674 715 2.5% 3.2% 5.7% 94.3%
Kings County Hospital Center
(NYCHHC) 75 1,336 1,411 1,569 2,980 2.5% 44.8% 47.3% 52.7%
Robeson County Health
Department 34 145 179 1,176 1,355 2.5% 10.7% 13.2% 86.8%
District VI WIC 50 105 155 1,871 2,026 2.5% 5.2% 7.7% 92.3%
South Cove WIC 8 87 95 230 325 2.5% 26.8% 29.2% 70.8%
Caldwell Parish Health
Unit/COLUMBIA 3 2 5 119 124 2.4% 1.6% 4.0% 96.0%
Memphis Shelby County Health
Dept 207 917 1,124 7,501 8,625 2.4% 10.6% 13.0% 87.0%
Brownsville Community
Development Corp. 23 274 297 668 965 2.4% 28.4% 30.8% 69.2%
Seneca Nation Health
Department 1 6 7 36 43 2.3% 14.0% 16.3% 83.7%
District IV WIC 46 124 170 1,814 1,984 2.3% 6.3% 8.6% 91.4%
Institute for Family Health 20 314 334 531 865 2.3% 36.3% 38.6% 61.4%
Capitol City Family Health
Center 24 53 77 1,009 1,086 2.2% 4.9% 7.1% 92.9%
Edgecombe County Health
Department 11 28 39 471 510 2.2% 5.5% 7.6% 92.4%
Bienville Parish Health
Unit/ARCADIA 3 4 7 133 140 2.1% 2.9% 5.0% 95.0%
Evangeline Parish Health
Unit/VILLE PLATTE 5 7 12 222 234 2.1% 3.0% 5.1% 94.9%
Jamaica Hospital 48 845 893 1,364 2,257 2.1% 37.4% 39.6% 60.4%
Concordia Parish Health
Unit/FERRIDAY 5 6 11 226 237 2.1% 2.5% 4.6% 95.4%
Madison Parish Health
Unit/TALLULAH 4 4 8 183 191 2.1% 2.1% 4.2% 95.8%
Tensas Parish Health Unit/ST
JOSEPH 1 1 2 46 48 2.1% 2.1% 4.2% 95.8%
St Mary Parish Health
Unit/MORGAN CITY 5 17 22 220 242 2.1% 7.0% 9.1% 90.9%
Catahoula Parish Health
Unit/JONESVILLE 2 2 4 93 97 2.1% 2.1% 4.1% 95.9%
TCA Health Altgeld Health
Center 25 71 96 1,151 1,247 2.0% 5.7% 7.7% 92.3%
District V WIC 103 334 437 4,717 5,154 2.0% 6.5% 8.5% 91.5%
*To maintain the privacy of participants, Local Agencies with less than 30 Infant Participants are not published. 77

Fully Formula-Fed
Local Agency
Infant Data
Participation Data Statistical Data
Fully Breastfed Partially Breastfed Total Breastfed Fully Formula-Fed Total Infants Fully Breastfed Partially Breastfed Total Breastfed
Desoto Parish Health
Unit/MANSFIELD 5 6 11 240 251 2.0% 2.4% 4.4% 95.6%
Gouverneur Hospital (NYCHHC) 20 265 285 744 1,029 1.9% 25.8% 27.7% 72.3%
Sampson County Health
Department 10 55 65 471 536 1.9% 10.3% 12.1% 87.9%
Chicago Department of Health 182 1,320 1,502 8,389 9,891 1.8% 13.3% 15.2% 84.8%
West Carroll Parish Health
Unit/OAK GROVE 2 3 5 106 111 1.8% 2.7% 4.5% 95.5%
St James Parish Health
Unit/VACHERIE 3 2 5 167 172 1.7% 1.2% 2.9% 97.1%
Morehouse Parish Health
Unit/BASTROP 5 7 12 275 287 1.7% 2.4% 4.2% 95.8%
St. Barnabas Hospital 29 829 858 809 1,667 1.7% 49.7% 51.5% 48.5%
Franklin Parish Health
Unit/WINNSBORO 4 6 10 225 235 1.7% 2.6% 4.3% 95.7%
Pointe Coupee Parish Health
Unit/NEW ROADS 4 10 14 221 235 1.7% 4.3% 6.0% 94.0%
Sinai Community Institute 55 523 578 2,723 3,301 1.7% 15.8% 17.5% 82.5%
LSUHSC Hlth Care Services
Division 8 35 43 443 486 1.6% 7.2% 8.8% 91.2%
North Central Bronx Hospital
(NYCHHC) 31 830 861 1,040 1,901 1.6% 43.7% 45.3% 54.7%
Assumption Parish Heatlh
Unit/NAPOLEONVILLE 2 4 6 121 127 1.6% 3.1% 4.7% 95.3%
East Harlem Council For Human
Services, Inc 4 125 129 125 254 1.6% 49.2% 50.8% 49.2%
District VII WIC 26 95 121 1,541 1,662 1.6% 5.7% 7.3% 92.7%
Evangeline Parish Police Jury 2 4 6 123 129 1.6% 3.1% 4.7% 95.3%
Morris Heights Health Center 24 789 813 753 1,566 1.5% 50.4% 51.9% 48.1%
Avoyelles Parish Health
Unit/MARKSVILLE 7 14 21 442 463 1.5% 3.0% 4.5% 95.5%
LSUHSC Shreveport Pediatrics 25 77 102 1,657 1,759 1.4% 4.4% 5.8% 94.2%
Southern University School of
Nursing Health Care Center 5 11 16 339 355 1.4% 3.1% 4.5% 95.5%
Anson County Health Dept 3 19 22 192 214 1.4% 8.9% 10.3% 89.7%
Roseland Community Hospital 14 286 300 710 1,010 1.4% 28.3% 29.7% 70.3%
Brookdale Hospital and Medical
Center 15 540 555 551 1,106 1.4% 48.8% 50.2% 49.8%
Ascension Parish Health
Unit/DONALDSONVILLE 2 4 6 149 155 1.3% 2.6% 3.9% 96.1%
Winn Parish Health
Unit/WINNFIELD 2 4 6 157 163 1.2% 2.5% 3.7% 96.3%
District III WIC 31 112 143 2,509 2,652 1.2% 4.2% 5.4% 94.6%
Cook Co Bureau of Health
Services 5 84 89 355 444 1.1% 18.9% 20.0% 80.0%
LSUHCSD EA Conway Medical
Center 1 3 4 88 92 1.1% 3.3% 4.3% 95.7%
Three Affiliated Tribes 1 4 5 92 97 1.0% 4.1% 5.2% 94.8%
Iberville Parish Health
Unit/PLAQUEMINE 3 6 9 283 292 1.0% 2.1% 3.1% 96.9%
Richland Parish Health
Unit/RAYVILLE 2 5 7 219 226 0.9% 2.2% 3.1% 96.9%
David Raines Community Health
Center 9 25 34 994 1,028 0.9% 2.4% 3.3% 96.7%
East Carroll Parish Health
Unit/LAKE PROVIDENCE 1 1 2 114 116 0.9% 0.9% 1.7% 98.3%
Lutheran Family Health Center 27 1,136 1,163 2,003 3,166 0.9% 35.9% 36.7% 63.3%
Bertie County Health
Department 1 9 10 131 141 0.7% 6.4% 7.1% 92.9%
Dist/Unit 11-0 Southside
Hlthcare, Inc. - 4 4 55 59 0.0% 6.8% 6.8% 93.2%
MS Choctaw Reservation Health
Center - 11 11 192 203 0.0% 5.4% 5.4% 94.6%
Omaha Nation WIC - 3 3 63 66 0.0% 4.5% 4.5% 95.5%
Red River Parish Health
Unit/COUSHATTA - 1 1 133 134 0.0% 0.7% 0.7% 99.3%
Winnebago - 3 3 43 46 0.0% 6.5% 6.5% 93.5%
*To maintain the privacy of participants, Local Agencies with less than 30 Infant Participants are not published. 78