Embed Size (px)
Citation preview
Composition of Foods Raw, Processed, Prepared
USDA National Nutrient Database for Standard Reference, Release 21
September 2008
U.S. Department of Agriculture Agricultural Research Service Beltsville Human Nutrition Research Center Nutrient Data Laboratory 10300 Baltimore Avenue Building 005, Room 107, BARC-West Beltsville, Maryland 20705
i
U.S. Department of Agriculture, Agricultural Research Service, USDA Nutrient Data Laboratory. 2008. USDA National Nutrient Database for Standard Reference, Release 21. USDA Nutrient Data Laboratory website: http://www.ars.usda.gov/nutrientdata Mention of trade names, commercial products, or companies in this publication is solely for the purpose of providing specific information and does not imply recommendation or endorsement by the U.S. Department of Agriculture over others not mentioned. The U.S. Department of Agriculture (USDA) prohibits discrimination in all its programs and activities on the basis of race, color, national origin, age, disability, and where applicable, sex, marital status, familial status, parental status, religion, sexual orientation, genetic information, political beliefs, reprisal, or because all or part of an individual's income is derived from any public assistance program. (Not all prohibited bases apply to all programs.) Persons with disabilities who require alternative means for communication of program information (Braille, large print, audiotape, etc.) should contact USDA's TARGET Center at (202) 720-2600 (voice and TDD). To file a complaint of discrimination, write to USDA, Director, Office of Civil Rights, 1400 Independence Avenue, S.W., Washington, D.C. 20250-9410, or call (800) 795-3272 (voice) or (202) 720-6382 (TDD). USDA is an equal opportunity provider and employer. Issued September 2008
ii
Contents Introduction..................................................................................................................................... 1 Specific Changes for SR21 ............................................................................................................. 1 Data Files ........................................................................................................................................ 3 Database Reports ............................................................................................................................ 3 Database Content ............................................................................................................................ 3
Food Descriptions....................................................................................................................... 3 Nutrients ..................................................................................................................................... 4
Nutrient Retention and Food Yield........................................................................................ 8 Proximates.............................................................................................................................. 8 Minerals ............................................................................................................................... 10 Vitamins............................................................................................................................... 11 Lipid Components................................................................................................................ 15 Amino Acids ........................................................................................................................ 18
Weights and Measures.............................................................................................................. 19 Footnotes .................................................................................................................................. 20 Sources of Data ........................................................................................................................ 20
Explanation of File Formats ......................................................................................................... 20 Relational Files......................................................................................................................... 20
Food Description File .......................................................................................................... 22 Food Group Description File ............................................................................................... 24 Nutrient Data File ................................................................................................................ 24 Nutrient Definition File ....................................................................................................... 25 Source Code File.................................................................................................................. 26 Data Derivation Code Description File ............................................................................... 26 Weight File........................................................................................................................... 27 Footnote File ........................................................................................................................ 28 Sources of Data Link File .................................................................................................... 29 Sources of Data File............................................................................................................. 29
Abbreviated File ....................................................................................................................... 30 Update Files.............................................................................................................................. 32
Summary ....................................................................................................................................... 34 References..................................................................................................................................... 34 Appendix A. Abbreviations Used in Short Descriptions............................................................ A-1 Appendix B. Other Abbreviations .............................................................................................. B-1
1
Introduction The USDA National Nutrient Database for Standard Reference (SR) is the major source of food composition data in the United States. It provides the foundation for most food composition databases in the public and private sectors. As information is updated, new versions of the database are released. This version, Release 21 (SR21), contains data on 7,412 food items and up to 140 food components. It replaces SR20 issued in September 2007. Updated data have been published electronically on the USDA Nutrient Data Laboratory (NDL) website since 1992. SR21 includes composition data for all the food groups and nutrients published in the 21 volumes of AAgriculture Handbook 8@ (U.S. Department of Agriculture 1976B92), and its four supplements (U.S. Department of Agriculture 1990B93), which superseded the 1963 edition (Watt and Merrill, 1963). SR21 supersedes all previous releases, including the printed versions, in the event of any differences. In July 2001, when NDL converted to a new version of its Nutrient Databank System (NDBS), formats were changed and fields added to improve the descriptive information for food items and the statistical information about the nutrient values. While data in previous releases have been moved to the new NDBS, they may not have been updated through the complete system. Therefore, many of these new fields contain data only for those items that have been processed through the new NDBS and it will take a number of years before they are populated for most food items in the database. Data have been compiled from published and unpublished sources. Published sources include the scientific literature. Unpublished data include those obtained from the food industry, other government agencies, and research conducted under contracts initiated by USDA’s Agricultural Research Service (ARS). These analyses are currently conducted under the National Food and Nutrient Analysis Program (NFNAP), in cooperation with the National Cancer Institute and 16 other offices and institutes of the National Institutes of Health (Pehrsson et al., 2000). Data from the food industry represents the nutrient content of a specific food or food product at the time the data is sent to NDL. The values may change due to reformulations or other processing changes by individual companies between the time that SR is released and the next update of this database. Values in the database may be based on the results of laboratory analyses or calculated by using appropriate algorithms, factors, or recipes, as indicated by the source code in the Nutrient Data file. Not every food item contains a complete nutrient profile.
Specific Changes for SR21
The major changes to the database since the last release are listed below.
• Two hundred and sixteen new foods were added to the database using data generated by USDA through NFNAP or submitted by the food industry: 28 brand name soy milk items, 66 soy-based vegetarian items, 12 new breakfast cereals, 4 types of dark chocolate representing different cacao levels, spray (spritzer) salad dressing, reduced calorie honey
2
mustard dressing, several types of pie crusts, Dutch apple pie, frozen turkey dinner, rice bowl with chicken, pomegranate juice, fruit juice blend, refried beans, grass-fed bison, several rotisserie chicken items (wing, back, breast, drumstick, and thigh), and USDA commodity egg mix and meats. These can be found in the ADD_Food file (p. 32).
• As part of the American Indian/Alaska Native database, data for 6 Stellar sea lion items
(meat and organs) were added. • New pork “value cuts” were added. These are special cuts of individual lean muscles
from the shoulder and leg. They are marketed as value-added cuts, expanding the number of pork cuts available in the market.
• The demand for grass-fed beef has increased in recent years partially due to consumer
interest in the fat content of foods. This release of SR provides new data on strip steaks and ground beef derived from grass-fed beef.
• NDL has released Uniform Retail Meat Identity Standards (URMIS) identification
numbers for 190 beef items and 44 pork items in SR-21. The URMIS number is located in the Common Name Field of the Food Description File, and appears along with the common names in applicable SR reports. The URMIS program is a consumer-oriented identification system which simplifies and standardizes the perplexing array of fresh meat cuts and their names. Over the years, URMIS has advanced as a tool for sales information and inventory control. Within the URMIS system identification for meat cuts, Universal Product Code (UPC) numbers have been assigned to every cut. The UPC bar code is used by retailers to electronically scan meat packages and provides the retailer with information to assist in merchandising meat more effectively. The UPC bar code includes the URMIS identification number within its 12 digit code; digits 3 through 6 represent the URMIS number for meat products (More information on the URMIS numbering system can be viewed at www.meattrack.com).
• Nutrient data were updated for cottage cheese, sour cream, infant formulas, canned
blueberries, tart cherries, canned crab, farmed Atlantic salmon, pecan pie, pumpkin pie, crème-filled snack cakes, snack crackers, saltines, chocolate sandwich cookies, chocolate chip cookies, pie crust, beef pot pies, chicken pot pies, brand name soups, trans fatty acid values on selected fast food items, and several snack items. These can be found in the CHG_NUTR file (p. 33).
• In response to changes in the availability of beef products in retail stores, 266 beef items have been removed from the database. Most of the removed products were beef cuts with a ¼ inch fat trim. Beef cuts currently available in the retail market contain 1/8” or 0” of external trim fat.
• A number of dry soup mixes, no longer on the market, were also removed from the
database. A complete list of all the deleted food items can be found in the DEL_FOOD file (p. 33).
3
Data Files The data files for SR21 are available in ASCII format and as a Microsoft Access 2000 database. A description of each field in these files and the relationships between each begins on p. 20. The Access database contains all the SR21 files and relationships, with a few sample queries and reports. An abbreviated file (p. 30), with fewer nutrients (44) but all the food items is also included. A Microsoft Excel 2000 spreadsheet of this file is also provided. These database and spreadsheet files are generally compatible with later releases of the same software package or with other software packages released at the same time.
Database Reports The data in SR21 are available as reports in two different presentations. The first presents items in SR21 as page images containing all the data for each food. These data are separated into files by food groups. The second presentation contains selected foods and nutrients in SR21. Those reports are sorted either alphabetically by food description or in descending order by nutrient content in terms of common household measures. The food items and weights in these reports are adapted from those in the “U.S. Department of Agriculture Home and Garden Bulletin 72, Nutritive Value of Foods” (Gebhardt and Thomas, 2002). The Adobe Reader is needed to see these files. There is a link from the NDL website to Adobe=s website where it can be downloaded at no charge.
Database Content The database consists of several sets of data: food descriptions, nutrients, weights and measures, footnotes, and sources of data. The sections below provide details about the information in each. More extensive details on many specific foods are available in the printed “Agriculture Handbook 8” sections (U.S. Department of Agriculture, 1976-92). Food Descriptions This file includes descriptive information about the food items. For more details on the Food Description file, see “Food Description File Formats” (p. 22). A full description (containing the name of the food with relevant characteristics, e.g., raw or cooked, enriched, color) and a short description (containing abbreviations) are provided. Abbreviations used in creating short descriptions are given in Appendix A. In creating the short description, the first word in the long description is not abbreviated. In addition, if the long description is 25 characters or less, the short description contains no abbreviations. Abbreviations used elsewhere are given in Appendix B. Brand names used in food descriptions are in upper case. Scientific names, common names, manufacturers’ names, amounts of refuse, and refuse descriptions are provided where appropriate. The common name field includes alternative names for a product, e.g., soda or pop, for a carbonated beverage. In addition this field also includes URMIS identification numbers and USDA commodity codes as appropriate. The food group to which the food item belongs is also indicated. A code is also provided indicating if an item is used in the Food and Nutrient Database
4
for Dietary Surveys (FNDDS; USDA, ARS, 2008). The factors used to calculate protein from nitrogen are included, as well as those used to calculate calories. There are no factors for items prepared using the recipe program of the NDBS or for items where the manufacturer calculates protein and calories. The refuse and refuse description fields contain amounts and descriptions of inedible material (for example, seeds, bone, and skin) for applicable foods. These amounts are expressed as a percentage of the total weight of the item as purchased, and they are used to compute the weight of the edible portion. Refuse data were obtained from USDA-sponsored contracts and U.S. Department of Agriculture Handbooks 102 (Matthews and Garrison, 1975) and 456 (Adams, 1975). To calculate Aamount of nutrient in edible portion of 1 pound as purchased,@ use the following formula:
Y = V*4.536*[(100-R)/100] where
Y = nutrient value per 1 pound as purchased, V = nutrient value per 100 g (Nutr_Val in the Nutrient Data file), and R = percent refuse (Refuse in the Food Description file).
For meat cuts containing bone and connective tissue, the amount of connective tissue is included in the value given for bone. Separable fat is not shown as refuse if the meat is described as separable lean and fat. Separable fat generally refers to seam fat and external trim fat. Separable lean refers to muscle tissue that can be readily separated from fat, bone, and connective tissue in the intact cut; it includes any fat striations (marbling) within the muscle. For boneless cuts, the refuse values apply to connective tissue or connective tissue plus separable fat. The percentage yield of cooked, edible meat from 1 pound of raw meat with refuse can be determined by using the following formula:
Y = (Wc/453.6)*100 where
Y = nutrient value per 1 pound as purchased, and Wc = weight of cooked, edible meat.
Nutrients The Nutrient Data file contains mean nutrient values per 100 g of the edible portion of food, along with fields to further describe the mean value. The following statistical attributes are provided to better describe the data:
$ Nutrient value – the mean of the data values for a specific parameter. Nutrient values have been rounded to the number of decimal places for each nutrient as specified in the Nutrient Definition file (p. 25).
$ Number of data points – the number of data points used to estimate the mean.
5
$ Standard error – the standard error of the mean: a measure of variability of the mean value as a function of the number of data points.
$ Number of studies—the number of analytical studies used to generate the mean. A study is a discrete research project conducted or reported for a specific food. A study can be the analysis of one nutrient in one food, one nutrient in many foods, or many nutrients in many foods.
$ Minimum value—the smallest observed value in the range of values. $ Maximum value—the largest observed value in the range of values. $ Degrees of freedom—the number of data values that are free to vary after certain
restrictions are placed on the estimates; used in probability calculations. $ Lower- and upper-error bounds—represent a range of values within which the population
mean is expected to fall, given a pre-specified confidence level. For SR21 and related releases, the confidence level is 95 percent.
$ Statistical comments—gives additional details about certain assumptions made during statistical calculations. The definition of each comment is given after the description of the Nutrient Data file under “File Formats” (p. 24).
Other fields provide information on how the values are generated, as follows:
• Derivation code—gives more information about how a value was calculated or imputed. Procedures used to impute a nutrient value are described by Schakel et al. (1997).
• Reference NDB number—indicates the NDB number of the food item that was used to impute a nutrient value for another food. This field is only populated for items added or updated since SR14 for which an imputed value is provided.
• Added nutrient marker—a “Y” indicates that a mineral or vitamin was added for enrichment or fortification. This field is populated for ready-to-eat breakfast cereals and many brand-name hot cereals in food group 8. In future releases, this field will be populated for other food groups.
• Confidence code—indicates the relative quality of the data. This code is derived using the data quality criteria first described by Mangels et al. (1993). These criteria have been expanded and enhanced for the NDBS (Holden et al., 2002). This field is included as a placeholder for future releases.
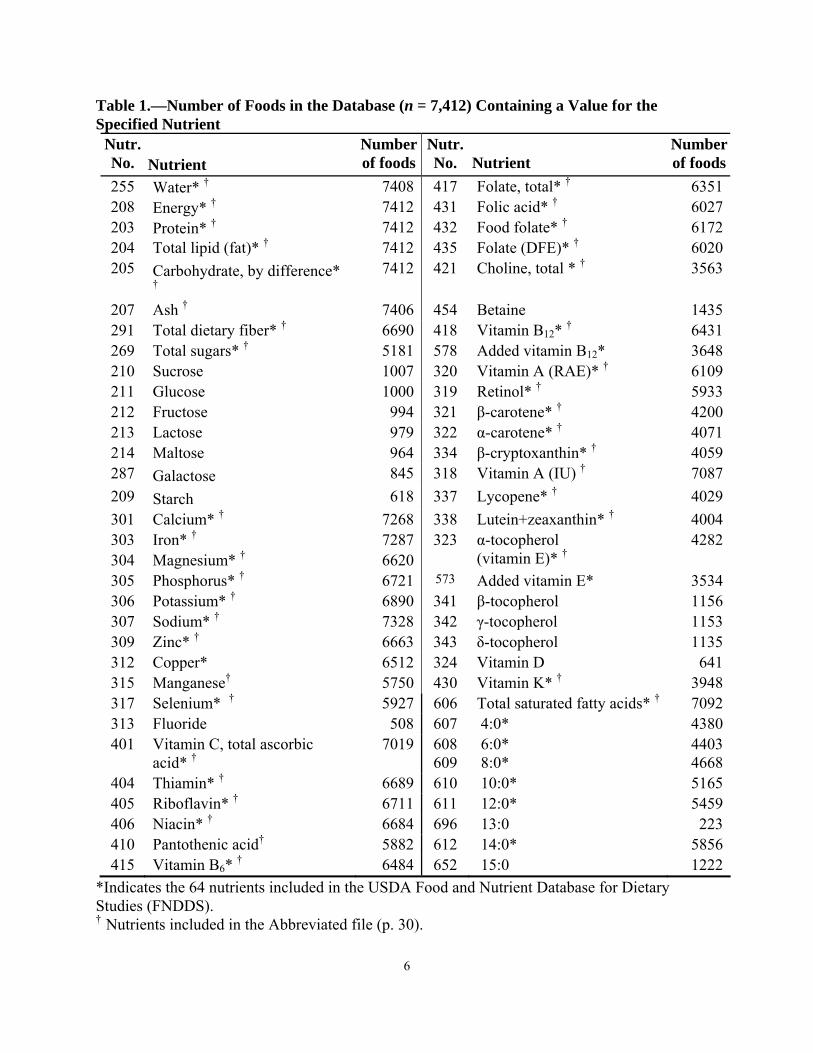
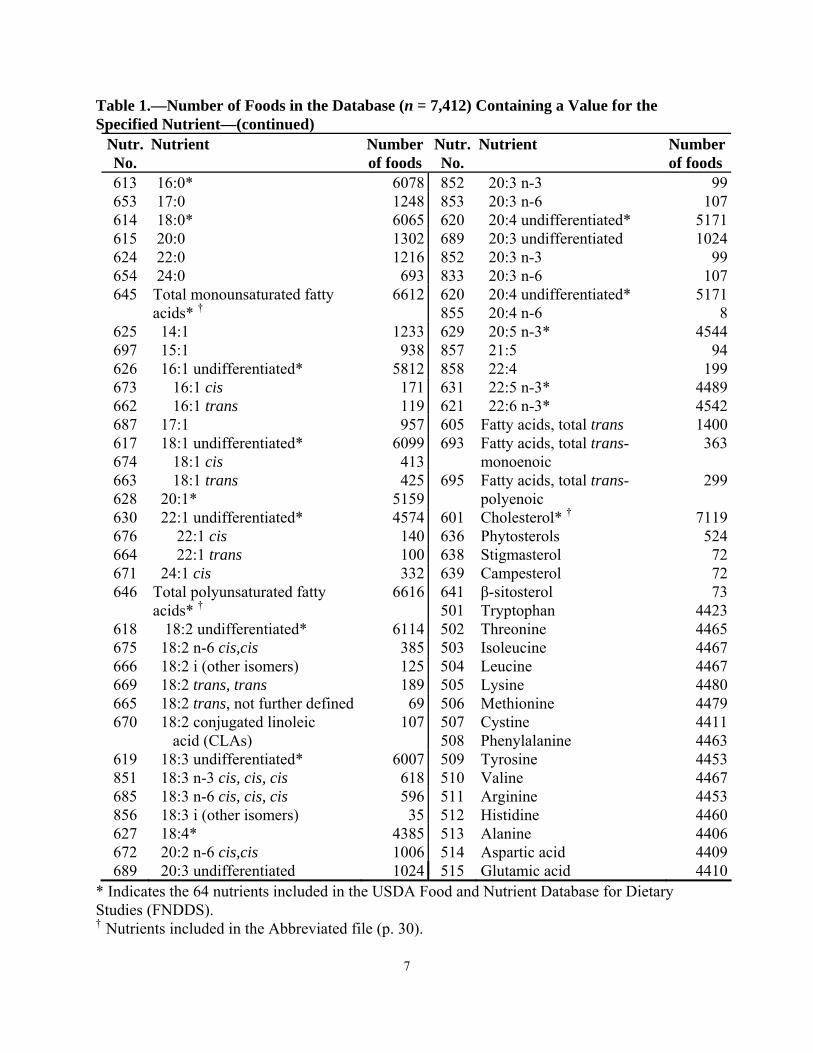
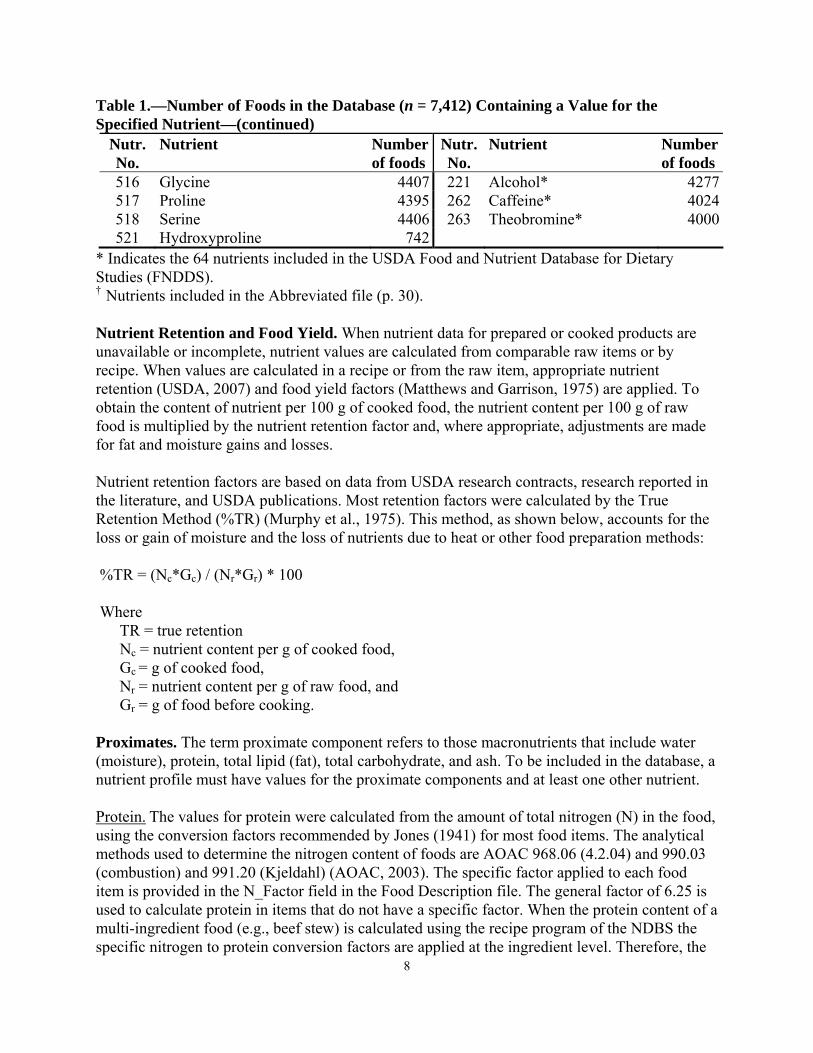
For more details on the Nutrient Data file, see “Nutrient Data File Formats” (p. 24). Nutrient values indicate the total amount of the nutrient present in the edible portion of the food, including any nutrients added in processing. Table 1 gives an idea of the comprehensiveness of the database by listing for each nutrient the number of food items that contain data. In general, levels of fortified nutrients are the values calculated by the manufacturer or by NDL, based on the Nutrition Labeling and Education Act (NLEA) label declaration of % Daily Value (DV) (CFR, Title 21, Pt. 101) (U.S. Food and Drug Administration–Department of Health and Human Services, 2004). Such values represent the minimum nutrient level expected in the product. If analytical values were used to estimate levels of added nutrients, a number is present in the sample count field for these nutrients.
6
Table 1.—Number of Foods in the Database (n = 7,412) Containing a Value for the Specified Nutrient
Nutr. No.
Nutrient
Number of foods
Nutr.No.
Nutrient
Number of foods
255 Water* † 7408 417 Folate, total* † 6351208 Energy* † 7412 431 Folic acid* † 6027203 Protein* † 7412 432 Food folate* † 6172204 Total lipid (fat)* † 7412 435 Folate (DFE)* † 6020205
Carbohydrate, by difference* †
7412 421 Choline, total * † 3563
207 Ash † 7406 454 Betaine 1435291 Total dietary fiber* † 6690 418 Vitamin B12* † 6431269 Total sugars* † 5181 578 Added vitamin B12* 3648210 Sucrose 1007 320 Vitamin A (RAE)* † 6109211 Glucose 1000 319 Retinol* † 5933212 Fructose 994 321 β-carotene* † 4200213 Lactose 979 322 α-carotene* † 4071214 Maltose 964 334 β-cryptoxanthin* † 4059287
Galactose 845 318 Vitamin A (IU) † 7087
209 Starch 618 337 Lycopene* † 4029
301 Calcium* † 7268 338 Lutein+zeaxanthin* † 4004303 304
Iron* †
Magnesium* † 7287 6620
323 α-tocopherol (vitamin E)* †
4282
305 Phosphorus* † 6721 573 Added vitamin E* 3534306 Potassium* † 6890 341 β-tocopherol 1156307 Sodium* † 7328 342 γ-tocopherol 1153309 Zinc* † 6663 343 δ-tocopherol 1135312 Copper* 6512 324 Vitamin D 641315 Manganese† 5750 430 Vitamin K* † 3948317 Selenium* † 5927 606 Total saturated fatty acids* † 7092313 Fluoride 508 607 4:0* 4380401 Vitamin C, total ascorbic
acid* † 7019 608
609 6:0* 8:0*
4403 4668
404 Thiamin* † 6689 610 10:0* 5165405 Riboflavin* † 6711 611 12:0* 5459406 Niacin* † 6684 696 13:0 223410 Pantothenic acid† 5882 612 14:0* 5856415 Vitamin B6* † 6484 652 15:0 1222
*Indicates the 64 nutrients included in the USDA Food and Nutrient Database for Dietary Studies (FNDDS). † Nutrients included in the Abbreviated file (p. 30).
7
Table 1.—Number of Foods in the Database (n = 7,412) Containing a Value for the Specified Nutrient—(continued)
Nutr. No.
Nutrient Number of foods
Nutr.No.
Nutrient Number of foods
613 16:0* 6078 852 20:3 n-3 99653 17:0 1248 853 20:3 n-6 107614 18:0* 6065 620 20:4 undifferentiated* 5171615 20:0 1302 689 20:3 undifferentiated 1024624 22:0 1216 852 20:3 n-3 99654 24:0 693 833 20:3 n-6 107645 Total monounsaturated fatty
acids* † 6612 620
855 20:4 undifferentiated* 20:4 n-6
51718
625 14:1 1233 629 20:5 n-3* 4544697 15:1 938 857 21:5 94626 16:1 undifferentiated* 5812 858 22:4 199673 16:1 cis 171 631 22:5 n-3* 4489662 16:1 trans 119 621 22:6 n-3* 4542687 17:1 957 605 Fatty acids, total trans 1400617 674
18:1 undifferentiated* 18:1 cis
6099413
693 Fatty acids, total trans-monoenoic
363
663 628
18:1 trans 20:1*
4255159
695 Fatty acids, total trans-polyenoic
299
630 22:1 undifferentiated* 4574 601 Cholesterol* † 7119676 22:1 cis 140 636 Phytosterols 524664 22:1 trans 100 638 Stigmasterol 72671 24:1 cis 332 639 Campesterol 72646 Total polyunsaturated fatty
acids* † 6616 641
501 β-sitosterol Tryptophan
734423
618 18:2 undifferentiated* 6114 502 Threonine 4465675 18:2 n-6 cis,cis 385 503 Isoleucine 4467666 18:2 i (other isomers) 125 504 Leucine 4467669 18:2 trans, trans 189 505 Lysine 4480665 18:2 trans, not further defined 69 506 Methionine 4479670 18:2 conjugated linoleic
acid (CLAs) 107 507
508 Cystine Phenylalanine
44114463
619 18:3 undifferentiated* 6007 509 Tyrosine 4453851 18:3 n-3 cis, cis, cis 618 510 Valine 4467685 18:3 n-6 cis, cis, cis 596 511 Arginine 4453856 18:3 i (other isomers) 35 512 Histidine 4460627 18:4* 4385 513 Alanine 4406672 20:2 n-6 cis,cis 1006 514 Aspartic acid 4409689 20:3 undifferentiated 1024 515 Glutamic acid 4410
* Indicates the 64 nutrients included in the USDA Food and Nutrient Database for Dietary Studies (FNDDS). † Nutrients included in the Abbreviated file (p. 30).
8
Table 1.—Number of Foods in the Database (n = 7,412) Containing a Value for the Specified Nutrient—(continued)
Nutr. No.
Nutrient Number of foods
Nutr.No.
Nutrient Number of foods
516 Glycine 4407 221 Alcohol* 4277517 Proline 4395 262 Caffeine* 4024518 Serine 4406 263 Theobromine* 4000521 Hydroxyproline 742
* Indicates the 64 nutrients included in the USDA Food and Nutrient Database for Dietary Studies (FNDDS). † Nutrients included in the Abbreviated file (p. 30). Nutrient Retention and Food Yield. When nutrient data for prepared or cooked products are unavailable or incomplete, nutrient values are calculated from comparable raw items or by recipe. When values are calculated in a recipe or from the raw item, appropriate nutrient retention (USDA, 2007) and food yield factors (Matthews and Garrison, 1975) are applied. To obtain the content of nutrient per 100 g of cooked food, the nutrient content per 100 g of raw food is multiplied by the nutrient retention factor and, where appropriate, adjustments are made for fat and moisture gains and losses. Nutrient retention factors are based on data from USDA research contracts, research reported in the literature, and USDA publications. Most retention factors were calculated by the True Retention Method (%TR) (Murphy et al., 1975). This method, as shown below, accounts for the loss or gain of moisture and the loss of nutrients due to heat or other food preparation methods: %TR = (Nc*Gc) / (Nr*Gr) * 100 Where TR = true retention
Nc = nutrient content per g of cooked food, Gc = g of cooked food, Nr = nutrient content per g of raw food, and Gr = g of food before cooking.
Proximates. The term proximate component refers to those macronutrients that include water (moisture), protein, total lipid (fat), total carbohydrate, and ash. To be included in the database, a nutrient profile must have values for the proximate components and at least one other nutrient. Protein. The values for protein were calculated from the amount of total nitrogen (N) in the food, using the conversion factors recommended by Jones (1941) for most food items. The analytical methods used to determine the nitrogen content of foods are AOAC 968.06 (4.2.04) and 990.03 (combustion) and 991.20 (Kjeldahl) (AOAC, 2003). The specific factor applied to each food item is provided in the N_Factor field in the Food Description file. The general factor of 6.25 is used to calculate protein in items that do not have a specific factor. When the protein content of a multi-ingredient food (e.g., beef stew) is calculated using the recipe program of the NDBS the specific nitrogen to protein conversion factors are applied at the ingredient level. Therefore, the
9
N-factor field will remain empty. When the manufacturer calculates protein the N-factor field will also be empty. Protein values for chocolate, cocoa, coffee, mushrooms, and yeast were adjusted for nonprotein nitrogenous material (Merrill and Watt, 1973). The adjusted protein conversion factors used to calculate protein for these items are as follows:
chocolate and cocoa 4.74 coffee 5.3 mushrooms 4.38 yeast 5.7
When these items are used as ingredients, such as chocolate in chocolate milk or yeast in bread, only their protein nitrogen content was used to determine their contribution to the calculated protein and amino acid content of the food. Protein calculated from total nitrogen, which may contain nonprotein nitrogen, was used in determining carbohydrate by difference. This unadjusted protein value is not given in the Nutrient Data file for SR21; rather, it is given as a footnote in printed sections of “Agriculture Handbook 8.” For soybeans, nitrogen values were multiplied by a factor of 5.71 (Jones, 1941) to calculate protein. The soybean industry, however, uses 6.25 to calculate protein. The protein content of soy flours, soy meals, soy protein concentrates, and soy protein isolates is expressed both ways in the database. The item calculated using the 6.25 factor is identified as “crude protein basis.” Total Lipid. The total lipid (fat) content of most foods is determined by gravimetric methods, including extraction methods such as those that use ether or a mixed solvent system of chloroform and methanol, or by acid hydrolysis. Total lipid determined by extraction is reported as Nutrient No. 204. It is sometimes referred to as “crude fat” and includes the weight of all lipid components, including glycerol, soluble in the solvent system. Nutrient No. 204 may not be identical to the fat level declared on food labels under the NLEA, where fat is expressed as the amount of triglyceride that would produce the analytically determined amount of lipid fatty acids and does not include other lipid components not soluble in the solvent system. The term “NLEA fat” is commonly referred to as “total fatty acids expressed as triglycerides.” Carbohydrate. Carbohydrate, when present, is determined as the difference between 100 and the sum of the percentages of water, protein, total lipid (fat), ash, and, when present, alcohol. Total carbohydrate values include total dietary fiber. Carbohydrate in beer and wine is determined by methods 979.06 (27.1.21) and 985.10 (28.1.18) of AOAC International (AOAC 2003), respectively. Total dietary fiber content is determined by enzymatic-gravimetric methods 985.29 and 991.43 of the AOAC (2003). Total sugars is the term used for the sum of the individual monosaccharides (galactose, glucose, and fructose) and disaccharides (sucrose, lactose, and maltose). Analytical data for individual sugars are determined using AOAC methods (2003), either high-performance liquid chromatography (HPLC) or gas-liquid chromatography (GLC). When analytical data for total sugars are unavailable for items in the FNDDS, values are imputed or obtained from manufacturers and trade associations. Starch is analyzed using the AOAC method 966.11 (2003). Because the analyses of total dietary fiber, total sugars, and starch are
10
performed separately and reflect the analytical variability inherent to the measurement process, the sum of these carbohydrate fractions may not equal the carbohydrate-by-difference value. Food Energy. Food energy is expressed in kilocalories (kcal) and kilojoules (kJ). One kcal equals 4.184 kJ. The data represent physiological energy, which is the energy value remaining after losses from digestion and metabolism are deducted from gross energy. Calorie values, with the exception of multi-ingredient processed foods, are based on the Atwater system for determining energy values. Derivation of the Atwater calorie factors is discussed in “Agriculture Handbook 74” (Merrill and Watt, 1973). For multi-ingredient processed foods, calorie values (source codes 8 or 9; for more information on source codes, see p. 26) generally reflect industry practices (as permitted by NLEA) of calculating calories as 4, 4, or 9 calories per gram of protein, carbohydrate, and fat, respectively, or as 4, 4, or 9 calories per gram of protein, carbohydrate minus insoluble fiber, and fat. The latter method is often used for high-fiber foods. Calorie factors for protein, fat, and carbohydrates are included in the Food Description file. For foods containing alcohol, a factor of 6.93 is used to calculate calories per gram of alcohol (Merrill and Watt, 1973). No calorie factors are given for items prepared using the recipe program of the NDBS. Instead, total calories for these items equal the sums of the calories contributed by each ingredient after adjustment for changes in yield, as appropriate. For multi-ingredient processed foods, if the calories calculated by the manufacturer are reported, no calorie factors are given. Calorie factors for fructose and sorbitol, not available in the Atwater system, are derived from the work of Livesay and Marinos (1988). Calorie factors for coffee and tea are estimated from those for seeds and vegetables, respectively. Minerals. Minerals included in the database are calcium, iron, magnesium, phosphorus, potassium, sodium, zinc, copper, manganese, selenium, and fluoride. Levels of minerals for most foods are determined by methods of the AOAC (2003). Calcium, iron, magnesium, phosphorus, sodium, potassium, zinc, copper, and manganese are usually determined by atomic absorption (AOAC 985.35) and inductively coupled plasma emission spectrophotometry (AOAC 984.27). Analytical data for selenium were published earlier by USDA (1992) and were determined by the modified selenium hydride and fluorometric methods. Selenium values for foods analyzed between 1998 and 2008 for NFNAP are determined by either the modified selenium hydride (AOAC 986.15) or stable isotope dilution gas chromatography-mass spectrometry (Reamer and Veillon, 1981) methods. The selenium content of plants, in particular cereal grains, is strongly influenced by the quantity of biologically available selenium in the soil in which the plants grow, that is, by their geographical origin (Kubota and Allaway, 1972). The values given are national averages and should be used with caution when levels of selenium in locally grown foods are of interest or concern.
Values for fluoride, previously released in the USDA National Fluoride Database of Selected Beverages and Foods, Release 2 (USDA, 2005), have been incorporated into SR21, but other analyzed values, including regional values, are not included in SR. Samples are analyzed using a fluoride ion-specific electrode, direct read method (VanWinkle, 1995) for clear liquids and a
11
micro-diffusion method (VanWinkle, 1995) for other food samples. As with selenium, the values for fluoride are national averages and should be used with caution when levels of fluoride in locally produced foods and beverages are of interest or concern.
Vitamins. Vitamins included in the database are ascorbic acid (vitamin C), thiamin, riboflavin, niacin, pantothenic acid, vitamin B6, vitamin B12, folate, total choline and betaine, vitamin A, vitamin E (α-tocopherol), vitamin K (phylloquinone), and vitamin D. Ascorbic acid. In the current database system, all data for ascorbic acid are listed under Nutrient No. 401, total ascorbic acid, determined by the fluorometric method (AOAC 967.22). Older values which have not been updated are primarily for reduced ascorbic acid and were determined by the dichloroindophenol method (AOAC 967.21) Thiamin, Riboflavin, and Niacin. Thiamin is determined chemically by the fluorometric method (AOAC 942.23). Fluorometric (AOAC 970.65) or microbiological (AOAC 940.33) methods are used to measure riboflavin. Niacin is determined by microbiological methods (AOAC 944.13). The values for niacin are for preformed niacin only and do not include the niacin contributed by tryptophan, a niacin precursor. The term Aniacin equivalent@ applies to the potential niacin value; that is, to the sum of the preformed niacin and the amount that could be derived from tryptophan (the mean value of 60 mg tryptophan is considered equivalent to 1 mg niacin (IOM, 1998)). Although not included in SR, niacin equivalents can be estimated for those foods where amino acids are given: mg Niacin equivalents = mg niacin + (mg tryptophan / 60) Pantothenic acid, Vitamins B6, and B12. Pantothenic acid (AOAC 945.74 or 992.07), vitamin B6 (AOAC 961.15), and vitamin B12 (AOAC 952.20) are determined by microbiological methods. Vitamin B12 is found in foods of animal origin or those containing some ingredient of animal origin, e.g., cake that contains eggs or milk. For foods that contain only plant products, the value for vitamin B12 is assumed to be zero. Some reports contain values for vitamin B12 in certain fermented foods (soy sauce and miso). While it is believed that this B12 is synthesized not by the microorganisms responsible for the fermentation of the food, but rather by other contaminating microorganisms. Therefore, one should not consider these foods to be a consistent source of vitamin B12 (Liem et al., 1977) and these values are not included in the database. The Dietary Reference Intakes (DRI) report on vitamin B12 recommended that people older than 50 years meet their Recommended Dietary Allowances (RDA) mainly by consuming foods fortified with vitamin B12 or a vitamin B12-containing supplement (IOM, 1998). Since vitamin B12 added as a fortificant may provide a significant source of the vitamin in the diet, a nutrient number (#578) for “added vitamin B12” has been added to the database. In this release, there are about 260 foods fortified with vitamin B12. The vast majority are breakfast cereals, infant formulas, and plant-based meat substitutes. For these foods, the value for total vitamin B12 is used for “added vitamin B12.” Only a few cereals containing a milk ingredient would contain any intrinsic vitamin B12. Milk-based infant formulas should contain intrinsic vitamin B12. However, infants are not the population of concern for intake of fortified vitamin B12. Plant-based meat substitutes should not contain intrinsic vitamin B12.
12
Folate. Values are reported for folic acid (Nutrient No. 431), food folate (Nutrient No. 432), and total folate reported in μg (Nutrient No. 417) and as dietary folate equivalents (DFEs) (Nutrient No. 435). These varied folate forms are included and defined as described in the DRI report on folate (IOM, 1998). RDAs for folate are expressed in DFEs, which take into account the greater bioavailability of synthetic folic acid compared with naturally occurring food folate. To calculate DFEs for any single food, it is necessary to have separate values for naturally occurring food folate and added synthetic folic acid in that item.
μg DFE = μg food folate + (1.7 * μg folic acid)
Folate values for foods analyzed through NFNAP are generated using the trienzyme microbiological procedure (Martin et al., 1990). Microbiological methods measure μg total folate; for enriched foods, folic acid and food folate are not distinguished from each other. Therefore, to be able to calculate DFE, multi-ingredient enriched foods are analyzed by an additional microbiological procedure without enzymes to estimate the amount of added folic acid (Chun et al., 2006). Food folate is then calculated by difference.
The addition of folic acid to enriched cereal-grain products subject to standards of identity began in the United States on January 1, 1998 (CFR, Title 21, Pts. 136B137). These products include flour, cornmeal and grits, farina, rice, macaroni, noodles, bread, rolls, and buns. Folic acid may continue to be added (with some restrictions on amounts) to breakfast cereals, infant formulas, medical foods, food for special dietary use, and meal replacement products.
For unenriched foods, food folate would be equivalent to total folate since folic acid (pteroylmonoglutamic acid) occurs rarely in foods. Therefore, the same value with its number of data points and standard error, if present, is used for total folate and food folate. The folic acid value is assumed to be zero. For enriched cereal-grain products with standards of identity (flour, cornmeal and grits, farina, rice, macaroni, noodles, bread, rolls, and buns), the folic acid value is calculated by subtracting the analytical folate value before fortification from the analytical value for the fortified product. Enriched ready-to-eat (RTE) cereals have generally included folic acid fortification for over 25 years. Therefore, food folate values (before fortification) were not readily available for these products. Food folate was estimated by means of the NDBS formulation program for a variety of high-consumption cereals. Mean folate values were calculated for categories of RTE cereals based on grain content. Added folic acid was then calculated by subtracting estimated food folate from the total folate content. Generally, food folate values represent a small proportion of the total folate in the fortified products. Choline. Beginning with SR19, total choline and betaine values from the USDA Database for the Choline Content of Common Foods (USDA, 2004) have been incorporated into SR. Values for the individual metabolites have not been added to SR, but are available in the USDA Database for the Choline Content of Common Foods.
13
For analysis, choline compounds are extracted, partitioned into organic and aqueous phases using methanol and chloroform, and analyzed directly by liquid chromatography-electrospray ionization-isotope dilution mass spectrometry (LC-ESI-IDMS) (Koc et al., 2002). Samples are analyzed for betaine and these choline-contributing compounds: free choline (Cho), glycerophosphocholine (GPC), phosphocholine (Pcho), phosphatidylcholine (Ptdcho), and sphingomyelin (SM). Because there are metabolic pathways for the interconversion of Cho, GPC, Pcho, PtdCho, and SM (Zeisel et al., 1994), total choline content is calculated as the sum of these choline-contributing metabolites. Betaine values are not included in the calculation of total choline since the conversion of choline to betaine is irreversible (Zeisel et al., 2003). Vitamin A. Beginning with SR15 (2002) values for vitamin A in μg of retinol activity equivalents (RAEs) and μg of retinol are reported. At the same time, values in μg of retinol equivalents (REs) were dropped from the database. This change responds to new reference values for vitamin A in the DRI report issued by the Institute of Medicine of the National Academies (IOM, 2001). The report recommended changing the factors used for calculating vitamin A activity from the individual provitamin A carotenoids and introduced RAE as a new unit for expressing vitamin A activity. One μg RAE is equivalent to 1 μg of all-trans-retinol, 12 μg of all-trans-β-carotene, or 24 μg of other provitamin A carotenoids. The RAE conversion factors are based on recent studies that show that the conversion of provitamin A carotenoids to retinol is only half as great as previously thought. Vitamin A is also reported in international units (IU), and will continue to be reported because it is still the unit used for nutrition labeling in the U.S. One IU is equivalent to 0.3 μg retinol, 0.6 μg β-carotene, or 1.2 μg other provitamin-A carotenoids (NAS/NRC, 1989) and thus over-estimates bioavailabilty. Individual carotenoids (β-carotene, α-carotene, β-cryptoxanthin, lycopene, and lutein+zeaxanthin) are reported. The analytical data are from NFNAP, generated using HPLC methodology (AOAC 941.15) and from the scientific literature. Most analytical systems do not separate lutein and zeaxanthin, so these carotenoids are shown combined. These values supersede those in Holden et al., 1999. Vitamin A activity values in RAE and IU were calculated from the content of individual carotenoids (β-carotene, α-carotene, and β-cryptoxanthin) using the appropriate factors. For food items used in the FNDDS, carotenoid values are imputed if analytical data are not available. For many of these items data are only available for vitamin A in IU. The variability in carotenoid levels due to cultivar, season, growing area, etc., as well as rounding within the NDBS, increases the difficulty in matching the calculated vitamin A activity values from imputed individual carotenoids to the existing IU values. As a result, the vitamin A IU value agrees within ±15 IU of the value calculated from individual carotenoids. When individual carotenoids are not reported for plant foods (such as fruits, vegetables, legumes, nuts, cereal grains, and spices and herbs), μg RAE are calculated by dividing the IU value by 20. In foods of animal origin, such as eggs, beef, pork, poultry, lamb, veal, game, and fish (except
14
for some organ meats and dairy), all of the vitamin A activity is contributed by retinol. For these foods, where analytical data are not available, μg RAE and μg of retinol are calculated by dividing the IU value by 3.33. In foods that contain both retinol and provitamin A carotenoids, the amount of each of these components must be known to calculate RAE. Previously, most of the vitamin A data in the database were received as IU. Therefore, the amounts of the provitamin A carotenoids and retinol were then estimated from the ingredients. Once the components had been estimated, μg RAE were calculated as (IU from carotenoids/20) + (IU from retinol/3.33). Micrograms of retinol were calculated as IU from retinol/3.33. Vitamin E. Vitamin E activity for the RDA as defined by the DRI report (IOM, 2000) is now limited to the naturally occurring form and three synthetic forms of α-tocopherol. For this reason, α-tocopherol equivalents, which included vitamin E activity from α-, β-, γ-, and δ-tocopherols and α-, β-, and γ-tocotrienols, were dropped from the database in SR16. Tocopherols are determined by gas-liquid chromatography (GLC) or high-performance liquid chromatography (HPLC) (Lee et al., 1999). For those items in FNDDS, values are presented for α-tocopherol. If analytical data are unavailable, values for α-tocopherol are imputed. When available, values are also presented for the other tocopherols. In the DRI report for Vitamin E, different factors are recommended to be used to calculate the milligram amount of α-tocopherol from IUs of vitamin E (IOM, 2000). The factors vary depending upon the chemical form of α-tocopherol used to fortify the food where
mg of α-tocopherol in food, fortified food, or multivitamin = IU of the RRR-α-tocopherol compound × 0.67 and = IU of the all rac-α-tocopherol compound × 0.45. Before SR16-1, the conversion factor for RRR-α-tocopherol was used for all vitamin E fortified foods. New α-tocopherol values have been calculated for breakfast cereals, most infant formulas and a few other foods that are fortified with vitamin E, where NDL confirmed that all rac-α-tocopherol is the form added. For more information about vitamin E in breakfast cereals, see the article in the January 2004 issue of the American Journal of Clinical Nutrition by Leonard et al. (2004). The basis of the vitamin E tolerable upper intake level (UL), another reference value in the DRI report, was established using all forms of supplemental α-tocopherol (IOM, 2000). Although the 2S-stereoisomers do not contribute to vitamin E activity for the RDA (IOM, 2000), they do contribute to the UL. A new nutrient number (#573) has been added to identify quantities of “added vitamin E.” In this release, there are about 125 food items that have values for added vitamin E greater than 0. For the majority of these food items the form added is synthetic vitamin E (all rac-α-tocopherol). To relate intakes of supplemental α-tocopherol to the UL, values for “added vitamin E” should be multiplied by 2 when the added form is synthetic vitamin E. Items that are fortified with RRR-α-tocopherol (natural vitamin E) are identified by a footnote and the
15
added vitamin E can be used directly to estimate its contribution to the UL. The majority of foods that are fortified with vitamin E are infant formulas and breakfast cereals. For these foods, the value for total vitamin E is also used for “added vitamin E”; the small amount of intrinsic vitamin E is not considered. In fortified peanut butter, the intrinsic vitamin E is calculated since it is a substantial amount. Vitamin K. Much of the data for vitamin K has been generated under NFNAP and supersedes the values in the USDA Provisional Table (PT-104) (Weihrauch and Chatra, 1994). Vitamin K is extracted with hexane, purified with solid phase extraction using silica columns, and quantitated using HPLC with chemical reduction and fluorescence detection. Losses are corrected using vitamin K1(25) as the internal standard (Booth et al. 1994). Vitamin D. Much of the data for vitamin D was published earlier in USDA’s Provisional Table (PT-108) (Weihrauch and Tamaki, 1991). Values for breakfast cereals have been updated based on data received from the food industry; values for other food items are updated using data generated under NFNAP using liquid chromatography (AOAC 995.05 or 982.29). These new values supersede those in PT-108. Lipid Components. Fatty acids are expressed as the actual quantity of fatty acid in g per 100 g of food and do not represent fatty acids as triglycerides. Historically, most fatty acid data were obtained as the percentage of fatty acid methyl esters and determined by GLC analyses (AOAC 996.06). These data were converted to g fatty acid per 100 g total lipid using lipid conversion factors and then to g fatty acid per 100 g edible portion of food using the total lipid content. Details of the derivation of lipid conversion factors were published by Weihrauch et al., 1977. In the redesigned NDBS, fatty acid data may be imported in a variety of units and converted within the system. No conversions are required if data are received as g fatty acid per 100 g edible portion of food. Data received as fatty acid esters and as triglycerides are converted to fatty acids using Sheppard conversion factors. Sheppard conversion factors are based on the molecular weights of the specific fatty acid and its corresponding esters (butyl or methyl) and triglyceride (Sheppard, 1992). When fatty acid data are received as percentages of fatty acid methyl esters, methyl esters are converted to fatty acids using Sheppard conversion factors and then multiplied by total lipid (Nutrient No. 204) to give g fatty acid per 100 g edible portion of food. Occasionally, total lipid values are available from a variety of data sources, but individual fatty acids are available from fewer sources. In those cases, it may be necessary to normalize the individual fatty acids to the mean fat value of the food item. In the case of normalized fatty acids, the sum of the individual fatty acids will equal the mean fat value multiplied by the Weihrauch (1977) lipid conversion factor for that food item. No statistics of variability are reported for normalized fatty acids.
Individual Fatty Acids. The basic format for describing individual fatty acids is that the number before the colon indicates the number of carbon atoms in the fatty acid chain, and the number after the colon indicates the number of double bonds. For unsaturated fatty acids, additional nutrient numbers have been added to accommodate the reporting of many specific positional and
16
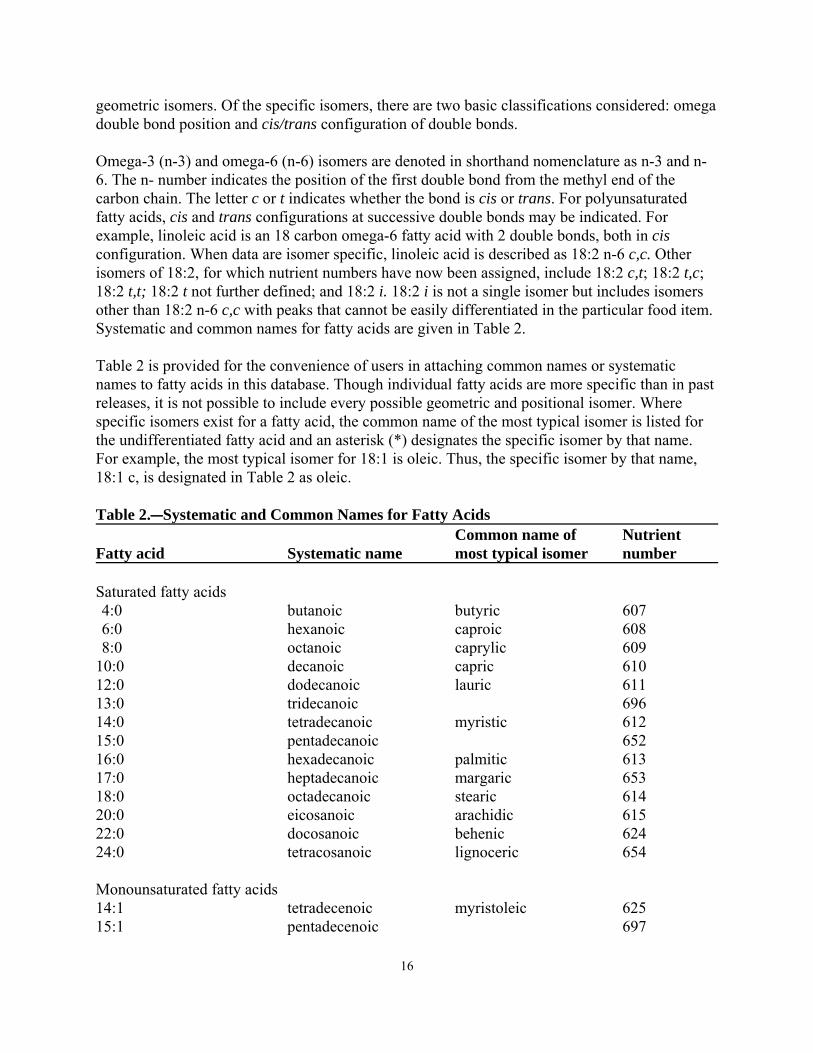
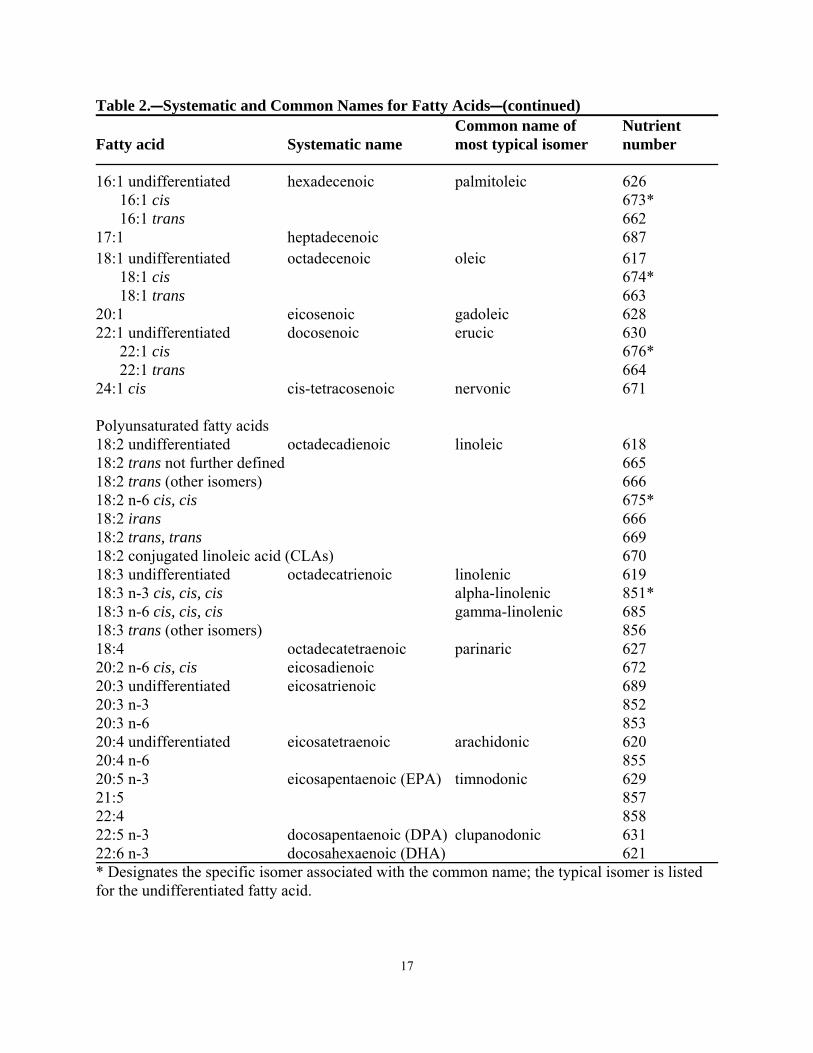
geometric isomers. Of the specific isomers, there are two basic classifications considered: omega double bond position and cis/trans configuration of double bonds. Omega-3 (n-3) and omega-6 (n-6) isomers are denoted in shorthand nomenclature as n-3 and n-6. The n- number indicates the position of the first double bond from the methyl end of the carbon chain. The letter c or t indicates whether the bond is cis or trans. For polyunsaturated fatty acids, cis and trans configurations at successive double bonds may be indicated. For example, linoleic acid is an 18 carbon omega-6 fatty acid with 2 double bonds, both in cis configuration. When data are isomer specific, linoleic acid is described as 18:2 n-6 c,c. Other isomers of 18:2, for which nutrient numbers have now been assigned, include 18:2 c,t; 18:2 t,c; 18:2 t,t; 18:2 t not further defined; and 18:2 i. 18:2 i is not a single isomer but includes isomers other than 18:2 n-6 c,c with peaks that cannot be easily differentiated in the particular food item. Systematic and common names for fatty acids are given in Table 2. Table 2 is provided for the convenience of users in attaching common names or systematic names to fatty acids in this database. Though individual fatty acids are more specific than in past releases, it is not possible to include every possible geometric and positional isomer. Where specific isomers exist for a fatty acid, the common name of the most typical isomer is listed for the undifferentiated fatty acid and an asterisk (*) designates the specific isomer by that name. For example, the most typical isomer for 18:1 is oleic. Thus, the specific isomer by that name, 18:1 c, is designated in Table 2 as oleic. Table 2.CSystematic and Common Names for Fatty Acids
Common name of Nutrient Fatty acid Systematic name most typical isomer number Saturated fatty acids 4:0 butanoic butyric 607 6:0 hexanoic caproic 608 8:0 octanoic caprylic 609
10:0 decanoic capric 610 12:0 dodecanoic lauric 611 13:0 tridecanoic 696 14:0 tetradecanoic myristic 612 15:0 pentadecanoic 652 16:0 hexadecanoic palmitic 613 17:0 heptadecanoic margaric 653 18:0 octadecanoic stearic 614 20:0 eicosanoic arachidic 615 22:0 docosanoic behenic 624 24:0 tetracosanoic lignoceric 654 Monounsaturated fatty acids 14:1 tetradecenoic myristoleic 625 15:1 pentadecenoic 697
17
Table 2.CSystematic and Common Names for Fatty AcidsC(continued) Common name of Nutrient
Fatty acid Systematic name most typical isomer number 16:1 undifferentiated hexadecenoic palmitoleic 626
16:1 cis 673* 16:1 trans 662
17:1 heptadecenoic 687 18:1 undifferentiated octadecenoic oleic 617
18:1 cis 674* 18:1 trans 663
20:1 eicosenoic gadoleic 628 22:1 undifferentiated docosenoic erucic 630
22:1 cis 676* 22:1 trans 664
24:1 cis cis-tetracosenoic nervonic 671 Polyunsaturated fatty acids 18:2 undifferentiated octadecadienoic linoleic 618 18:2 trans not further defined 665 18:2 trans (other isomers) 666 18:2 n-6 cis, cis 675* 18:2 irans 666 18:2 trans, trans 669 18:2 conjugated linoleic acid (CLAs) 670 18:3 undifferentiated octadecatrienoic linolenic 619 18:3 n-3 cis, cis, cis alpha-linolenic 851* 18:3 n-6 cis, cis, cis gamma-linolenic 685 18:3 trans (other isomers) 856 18:4 octadecatetraenoic parinaric 627 20:2 n-6 cis, cis eicosadienoic 672 20:3 undifferentiated eicosatrienoic 689 20:3 n-3 852 20:3 n-6 853 20:4 undifferentiated eicosatetraenoic arachidonic 620 20:4 n-6 855 20:5 n-3 eicosapentaenoic (EPA) timnodonic 629 21:5 857 22:4 858 22:5 n-3 docosapentaenoic (DPA) clupanodonic 631 22:6 n-3 docosahexaenoic (DHA) 621 * Designates the specific isomer associated with the common name; the typical isomer is listed for the undifferentiated fatty acid.
18
Fatty acid totals. Only a small portion of the fatty acid data received for release in SR21 contains specific positional and geometric isomers. Therefore, it has been necessary to maintain the usual nutrient numbers corresponding to fatty acids with no further differentiation other than carbon length and number of double bonds. To aid users of our data, specific isomers are always summed to provide a total value for the undifferentiated fatty acid. Thus, mean values for the specific isomers of 18:2 would be summed to provide a mean for 18:2 undifferentiated (Nutrient No. 618). Other fatty acid totals provided are (1) the sum of saturated, monounsaturated, and polyunsaturated fatty acids and (2) the sum of trans-monoenoic, the sum of trans-polyenoic, and the sum of all trans fatty acids. Values for total saturated, monounsaturated, and polyunsaturated fatty acids may include individual fatty acids not reported; therefore, the sum of their values may exceed the sum of the individual fatty acids. In rare cases, the sum of the individual fatty acids may exceed the sum of the values given for the total saturated fatty acids (SFA), monounsaturated fatty acids (MUFA), and polyunsaturated fatty acids (PUFA). These differences are generally caused by rounding and should be relatively small. For multi-ingredient processed brand-name foods, industry data are often available for fatty acid classes (SFA, MUFA, and PUFA) but are lacking for individual fatty acids. In these cases, individual fatty acids are calculated from the fatty acids of the individually listed ingredients and normalized to the total fat level. A best-fit approximation has been made to fatty acid classes, but unavoidably, calculated sums of individual fatty acid totals do not always match industry data for fatty acid classes. Zero values for individual fatty acids should be understood to mean that trace amounts may be present. When g fatty acids per 100 g of total lipid are converted to g fatty acids per 100 g of food, values of less than 0.0005 are rounded to 0. Cholesterol. Cholesterol values are generated primarily by gas liquid chromatographic procedures (AOAC 994.10). It is assumed that cholesterol is present only in foods of animal origin and foods containing at least one ingredient of animal origin (for example, cake that contains eggs). For mixtures containing ingredients derived from animal products, the cholesterol value may be calculated from the value for those ingredients. For foods that contain only plant products, the value for cholesterol is assumed to be zero. Plant sterols. Data on plant sterols (campesterol, stigmasterol, and β-sitosterol) are obtained by gas-chromatographic procedures (AOAC 967.18) and summed to calculate total phytosterols. Amino Acids. Amino acid data for a class or species of food are aggregated to yield a set of values that serve as the pattern for calculating the amino acid profile of other similar foods. The amino acid values for the pattern are expressed on a per-gram-of-nitrogen basis. Amino acids are extracted in three groups—tryptophan, sulfur-containing amino acids (methionine and cystine), and all others. Tryptophan is determined by alkaline hydrolysis/HPLC (AOAC 988.15), methionine and cystine by performic oxidation/HPLC (AOAC 994.12) and all others by acid hydrolysis/HPLC (AOAC 982.30). The amino acid patterns and the total nitrogen content are used to calculate the levels of individual amino acids per 100 g of food, using the following formula:
19
AAf = (AAn*Vp )/Nf
where AAf = amino acid content per 100 g of food, AAn = amino acid content per g of nitrogen, Vp = protein content of food, and Nf = nitrogen factor.
For foods processed in the NDBS since SR14 (2001), the number of observations used in developing an amino acid pattern will be released only with the pattern. The amino acid profiles calculated from these patterns will show the number of data points to be zero. In the past, the number of data points appeared only for the food item for which the amino acid pattern was developed, not on other foods that used the same pattern. It referred to the number of observations used in developing the amino acid pattern for that food. If amino acid values are presented for an item with more than one protein-containing ingredient, the values may be calculated on a per-gram-of-nitrogen basis from the amino acid patterns of the various protein-containing ingredients. Then the amino acid contents for an item on the 100-g basis are calculated as the sum of the amino acids in each protein-containing ingredient multiplied by total nitrogen in the item. The number of data points for these values are given as zero. Weights and Measures Information is provided on household measures for food items (for example, 1 cup, 1 tablespoon, 1 fruit, 1 leg). Weights are given for edible material without refuse, that is, the weight of an apple without the core or stem, or a chicken leg without the bone, and so forth. The Weight file contains the gram weights and measure descriptions for each food item. This file can be used to calculate nutrient values for food portions from the values provided per 100 g of food. The following formula is used to calculate the nutrient content per household measure:
N = (V*W)/100 Where:
N = nutrient value per household measure, V = nutrient value per 100 g (Nutr_Val in the Nutrient Data file), and W = g weight of portion (Gm_Wgt in the Weight file).
The Weight file can be used to produce reports showing the household measure and nutrient values calculated for that portion. The weights are derived from published sources, industry files, studies conducted by USDA (Adams, 1975; Fulton et al., 1977), and the weights and measures used in the FNDDS (2006). Though special efforts have been made to provide representative values, weights and measures obtained from different sources vary considerably for some foods. The format of this file is described on p. 27.
20
Footnotes Footnotes are provided for a few items where information about food description, weights and measures, or nutrient values could not be accommodated in existing fields. For example, if citric acid is added to a juice drink, this is indicated in the footnote. The format of this file is described on p. 28. Sources of Data The Sources of Data file (previously called References) was first added with SR14 (2001). The name of the file and fields reflect the fact that not all sources are journals or published literature, but also include the results of unpublished data from USDA-sponsored research and from research sponsored by others either separately or in collaboration with USDA. It contains data sources for the nutrient values and links to an identification number on each nutrient record. Since many of the data in this release were carried forward from SR13 (1999), nutrient-specific source documentation is not electronically available. As new data for these foods are generated and as additional documentation is entered into the new NDBS, data source information will increase in future releases. The format of this file is described on p. 29. A file, the Sources of Data Link file, is provided to allow users to establish a relationship between the Sources of Data file and the Nutrient Data file. This lets the user identify specific sources of data for each nutrient value. For example, the user can use these files to identify where NFNAP data is used in the database. The format of this file is described on p.29.
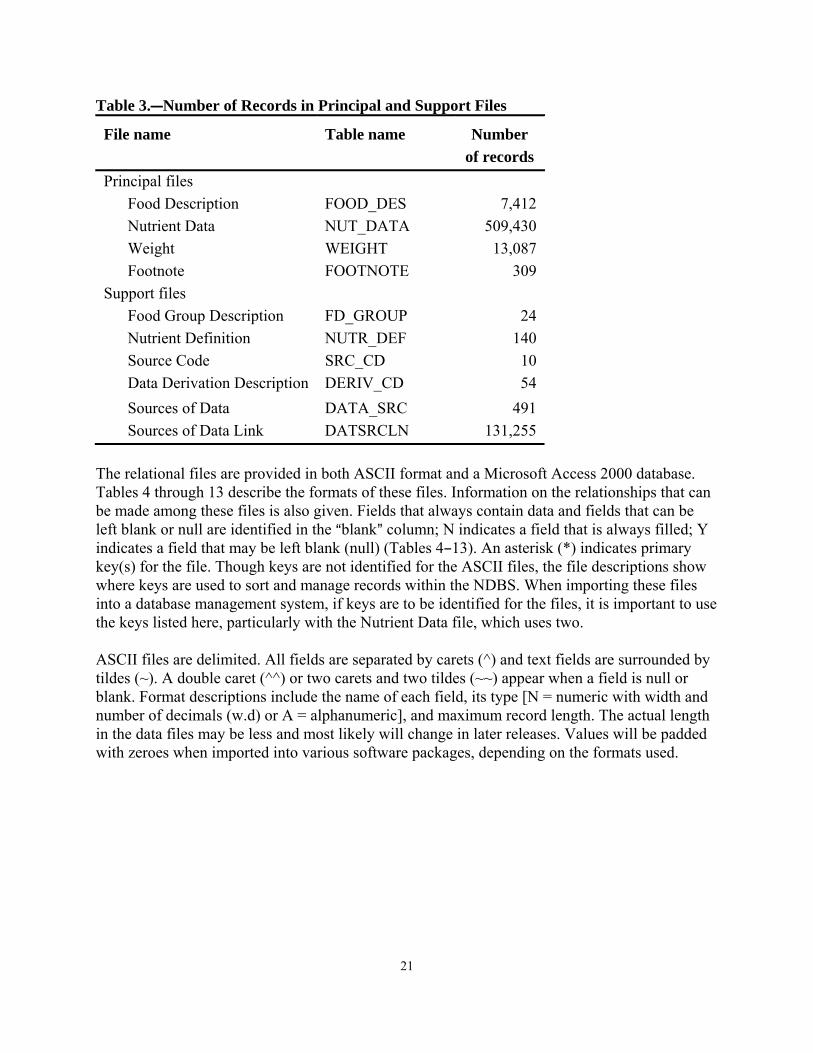
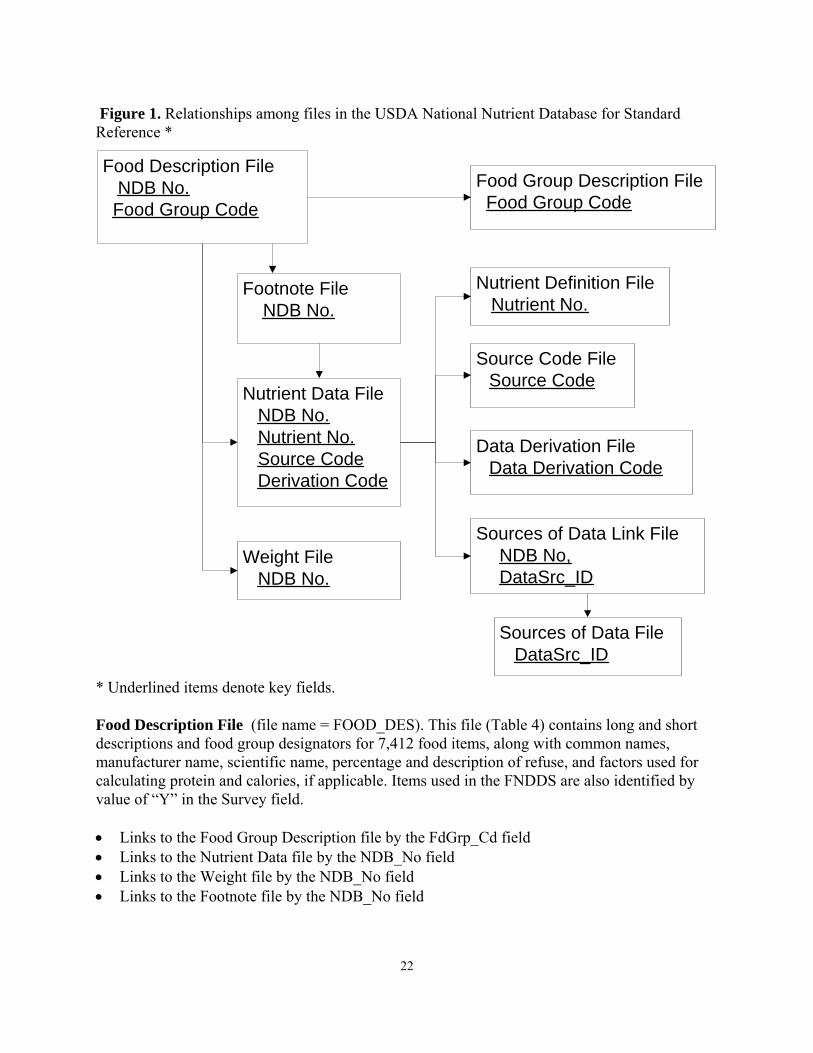
Explanation of File Formats The data appear in two different organizational formats. One is a relational format of four principal and six support files making up the database. The relational format is complete and contains all food, nutrient, and related data. The other is a flat abbreviated file with all the food items, but fewer nutrients, and not all of the other related information. The abbreviated file does not include values for starch, fluoride, betaine, added vitamin E, added vitamin B12, alcohol, caffeine, theobromine, vitamin D, phytosterols, individual amino acids, fatty acids, or sugars. See p. 30 for more information on this file. Relational Files The four principal database files are the Food Description file, Nutrient Data file, Gram Weight file, and Footnote file. The six support files are the Nutrient Definition file, Food Group Description file, Source Code file, Data Derivation Code Description file, Sources of Data file, and Sources of Data Link file. Table 3 shows the number of records in each file. In a relational database, these files can be linked together in a variety of combinations to produce queries and generate reports. Figure 1 provides a diagram of the relationships between files and their key fields.
21
Table 3.CNumber of Records in Principal and Support Files File name
Table name
Number
of records Principal files Food Description FOOD_DES 7,412 Nutrient Data NUT_DATA 509,430 Weight WEIGHT 13,087 Footnote FOOTNOTE 309 Support files Food Group Description FD_GROUP 24 Nutrient Definition NUTR_DEF 140 Source Code SRC_CD 10 Data Derivation Description DERIV_CD 54 Sources of Data DATA_SRC 491 Sources of Data Link DATSRCLN 131,255
The relational files are provided in both ASCII format and a Microsoft Access 2000 database. Tables 4 through 13 describe the formats of these files. Information on the relationships that can be made among these files is also given. Fields that always contain data and fields that can be left blank or null are identified in the Ablank@ column; N indicates a field that is always filled; Y indicates a field that may be left blank (null) (Tables 4B13). An asterisk (*) indicates primary key(s) for the file. Though keys are not identified for the ASCII files, the file descriptions show where keys are used to sort and manage records within the NDBS. When importing these files into a database management system, if keys are to be identified for the files, it is important to use the keys listed here, particularly with the Nutrient Data file, which uses two. ASCII files are delimited. All fields are separated by carets (^) and text fields are surrounded by tildes (~). A double caret (^^) or two carets and two tildes (~~) appear when a field is null or blank. Format descriptions include the name of each field, its type [N = numeric with width and number of decimals (w.d) or A = alphanumeric], and maximum record length. The actual length in the data files may be less and most likely will change in later releases. Values will be padded with zeroes when imported into various software packages, depending on the formats used.
22
Figure 1. Relationships among files in the USDA National Nutrient Database for Standard Reference *
Food Description File NDB No. Food Group Code
Nutrient Data File NDB No. Nutrient No. Source Code Derivation Code
Weight File NDB No.
Food Group Description File Food Group Code
Nutrient Definition File Nutrient No.
Source Code File Source Code
Footnote File NDB No.
Data Derivation File Data Derivation Code
Sources of Data Link FileNDB No,DataSrc_ID
Sources of Data File DataSrc_ID
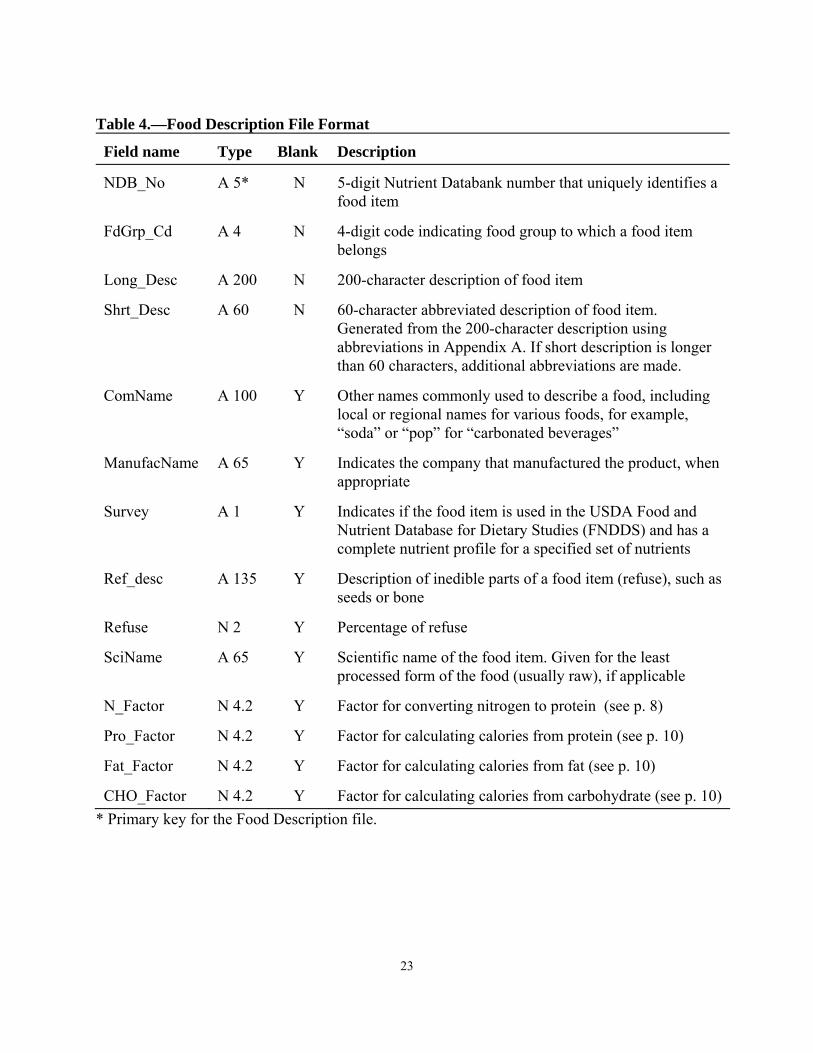
* Underlined items denote key fields. Food Description File (file name = FOOD_DES). This file (Table 4) contains long and short descriptions and food group designators for 7,412 food items, along with common names, manufacturer name, scientific name, percentage and description of refuse, and factors used for calculating protein and calories, if applicable. Items used in the FNDDS are also identified by value of “Y” in the Survey field. • Links to the Food Group Description file by the FdGrp_Cd field • Links to the Nutrient Data file by the NDB_No field • Links to the Weight file by the NDB_No field • Links to the Footnote file by the NDB_No field
23
Table 4.—Food Description File Format
Field name Type Blank Description
NDB_No A 5* N 5-digit Nutrient Databank number that uniquely identifies a food item
FdGrp_Cd A 4 N 4-digit code indicating food group to which a food item belongs
Long_Desc A 200 N 200-character description of food item
Shrt_Desc A 60 N 60-character abbreviated description of food item. Generated from the 200-character description using abbreviations in Appendix A. If short description is longer than 60 characters, additional abbreviations are made.
ComName A 100 Y Other names commonly used to describe a food, including local or regional names for various foods, for example, “soda” or “pop” for “carbonated beverages”
ManufacName A 65 Y Indicates the company that manufactured the product, when appropriate
Survey A 1 Y Indicates if the food item is used in the USDA Food and Nutrient Database for Dietary Studies (FNDDS) and has a complete nutrient profile for a specified set of nutrients
Ref_desc A 135 Y Description of inedible parts of a food item (refuse), such as seeds or bone
Refuse N 2 Y Percentage of refuse
SciName A 65 Y Scientific name of the food item. Given for the least processed form of the food (usually raw), if applicable
N_Factor N 4.2 Y Factor for converting nitrogen to protein (see p. 8)
Pro_Factor N 4.2 Y Factor for calculating calories from protein (see p. 10)
Fat_Factor N 4.2 Y Factor for calculating calories from fat (see p. 10)
CHO_Factor N 4.2 Y Factor for calculating calories from carbohydrate (see p. 10) * Primary key for the Food Description file.
24
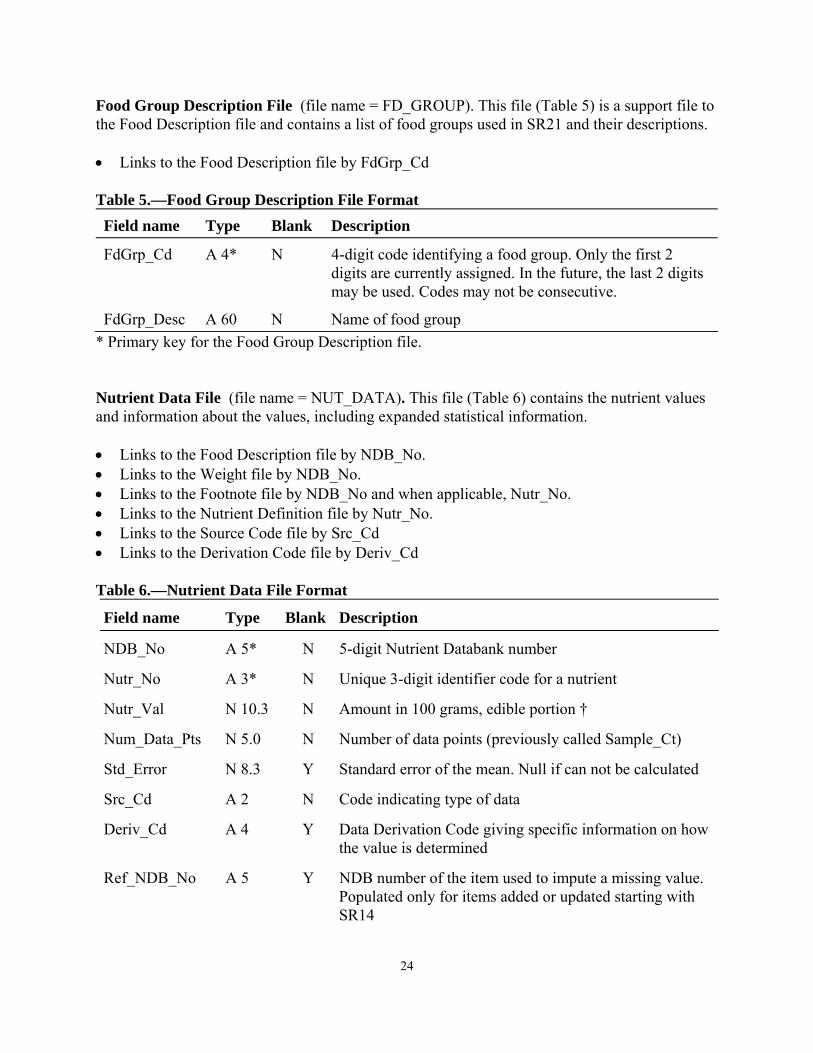
Food Group Description File (file name = FD_GROUP). This file (Table 5) is a support file to the Food Description file and contains a list of food groups used in SR21 and their descriptions. • Links to the Food Description file by FdGrp_Cd Table 5.—Food Group Description File Format Field name Type Blank Description
FdGrp_Cd A 4* N 4-digit code identifying a food group. Only the first 2 digits are currently assigned. In the future, the last 2 digits may be used. Codes may not be consecutive.
FdGrp_Desc A 60 N Name of food group * Primary key for the Food Group Description file. Nutrient Data File (file name = NUT_DATA). This file (Table 6) contains the nutrient values and information about the values, including expanded statistical information. • Links to the Food Description file by NDB_No. • Links to the Weight file by NDB_No. • Links to the Footnote file by NDB_No and when applicable, Nutr_No. • Links to the Nutrient Definition file by Nutr_No. • Links to the Source Code file by Src_Cd • Links to the Derivation Code file by Deriv_Cd Table 6.—Nutrient Data File Format
Field name Type Blank Description
NDB_No A 5* N 5-digit Nutrient Databank number
Nutr_No A 3* N Unique 3-digit identifier code for a nutrient
Nutr_Val N 10.3 N Amount in 100 grams, edible portion †
Num_Data_Pts N 5.0 N Number of data points (previously called Sample_Ct)
Std_Error N 8.3 Y Standard error of the mean. Null if can not be calculated
Src_Cd A 2 N Code indicating type of data
Deriv_Cd A 4 Y Data Derivation Code giving specific information on how the value is determined
Ref_NDB_No A 5 Y NDB number of the item used to impute a missing value. Populated only for items added or updated starting with SR14
25
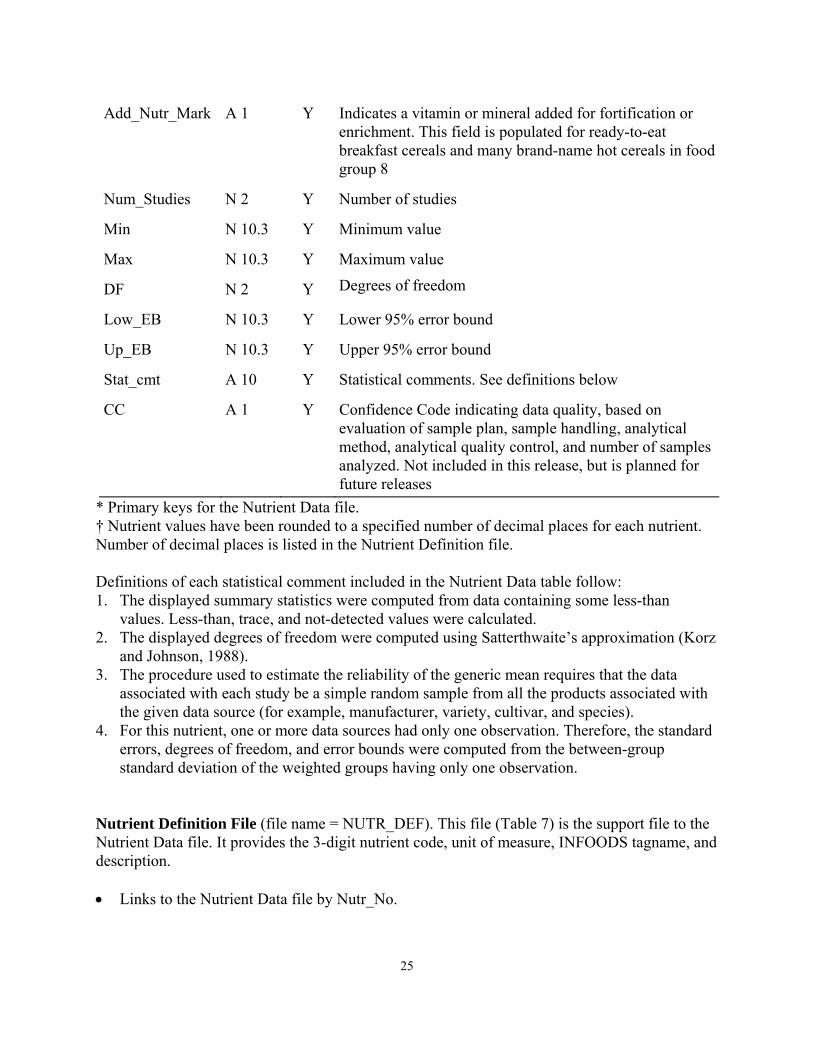
Add_Nutr_Mark A 1 Y Indicates a vitamin or mineral added for fortification or enrichment. This field is populated for ready-to-eat breakfast cereals and many brand-name hot cereals in food group 8
Num_Studies N 2 Y Number of studies
Min N 10.3 Y Minimum value
Max N 10.3 Y Maximum value
DF N 2 Y Degrees of freedom
Low_EB N 10.3 Y Lower 95% error bound
Up_EB N 10.3 Y Upper 95% error bound
Stat_cmt A 10 Y Statistical comments. See definitions below
CC A 1 Y Confidence Code indicating data quality, based on evaluation of sample plan, sample handling, analytical method, analytical quality control, and number of samples analyzed. Not included in this release, but is planned for future releases
* Primary keys for the Nutrient Data file. † Nutrient values have been rounded to a specified number of decimal places for each nutrient. Number of decimal places is listed in the Nutrient Definition file. Definitions of each statistical comment included in the Nutrient Data table follow: 1. The displayed summary statistics were computed from data containing some less-than
values. Less-than, trace, and not-detected values were calculated. 2. The displayed degrees of freedom were computed using Satterthwaite’s approximation (Korz
and Johnson, 1988). 3. The procedure used to estimate the reliability of the generic mean requires that the data
associated with each study be a simple random sample from all the products associated with the given data source (for example, manufacturer, variety, cultivar, and species).
4. For this nutrient, one or more data sources had only one observation. Therefore, the standard errors, degrees of freedom, and error bounds were computed from the between-group standard deviation of the weighted groups having only one observation.
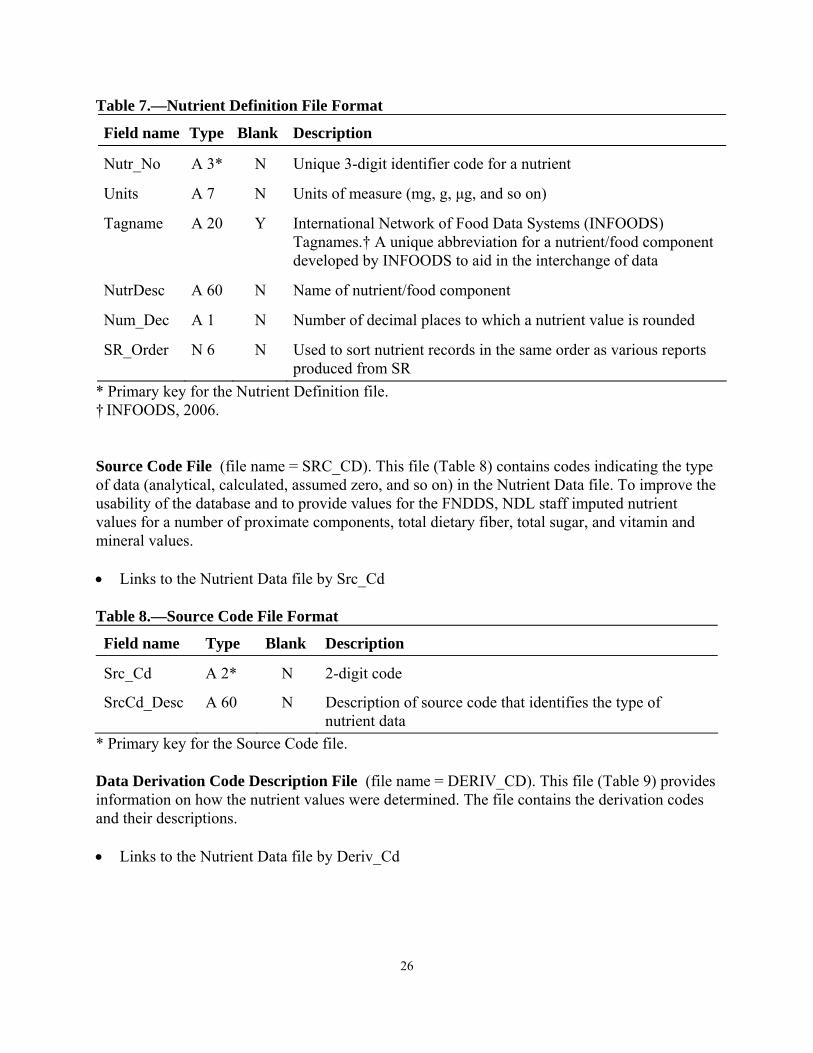
Nutrient Definition File (file name = NUTR_DEF). This file (Table 7) is the support file to the Nutrient Data file. It provides the 3-digit nutrient code, unit of measure, INFOODS tagname, and description. • Links to the Nutrient Data file by Nutr_No.
26
Table 7.—Nutrient Definition File Format
Field name Type Blank Description
Nutr_No A 3* N Unique 3-digit identifier code for a nutrient
Units A 7 N Units of measure (mg, g, μg, and so on)
Tagname A 20 Y International Network of Food Data Systems (INFOODS) Tagnames.† A unique abbreviation for a nutrient/food component developed by INFOODS to aid in the interchange of data
NutrDesc A 60 N Name of nutrient/food component
Num_Dec A 1 N Number of decimal places to which a nutrient value is rounded
SR_Order N 6 N Used to sort nutrient records in the same order as various reports produced from SR
* Primary key for the Nutrient Definition file. † INFOODS, 2006. Source Code File (file name = SRC_CD). This file (Table 8) contains codes indicating the type of data (analytical, calculated, assumed zero, and so on) in the Nutrient Data file. To improve the usability of the database and to provide values for the FNDDS, NDL staff imputed nutrient values for a number of proximate components, total dietary fiber, total sugar, and vitamin and mineral values. • Links to the Nutrient Data file by Src_Cd Table 8.—Source Code File Format
Field name Type Blank Description
Src_Cd A 2* N 2-digit code
SrcCd_Desc A 60 N Description of source code that identifies the type of nutrient data
* Primary key for the Source Code file. Data Derivation Code Description File (file name = DERIV_CD). This file (Table 9) provides information on how the nutrient values were determined. The file contains the derivation codes and their descriptions. • Links to the Nutrient Data file by Deriv_Cd
27
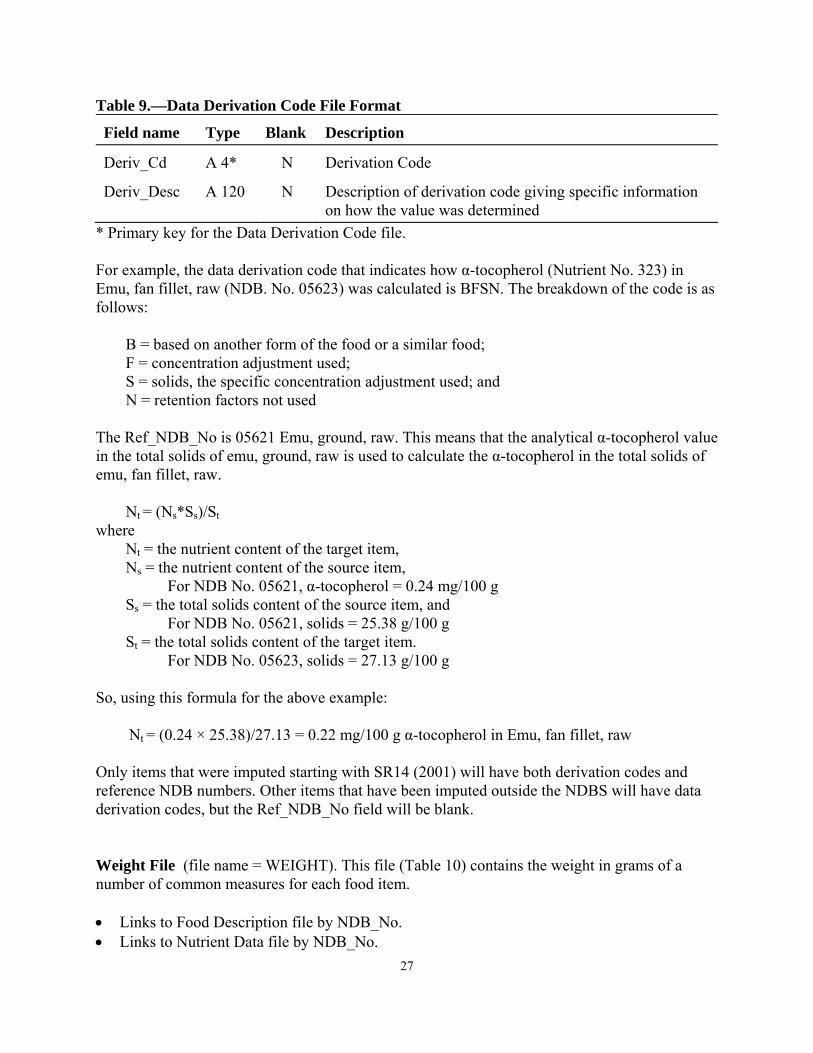
Table 9.—Data Derivation Code File Format
Field name Type Blank Description
Deriv_Cd A 4* N Derivation Code
Deriv_Desc A 120 N Description of derivation code giving specific information on how the value was determined
* Primary key for the Data Derivation Code file. For example, the data derivation code that indicates how α-tocopherol (Nutrient No. 323) in Emu, fan fillet, raw (NDB. No. 05623) was calculated is BFSN. The breakdown of the code is as follows:
B = based on another form of the food or a similar food; F = concentration adjustment used; S = solids, the specific concentration adjustment used; and N = retention factors not used
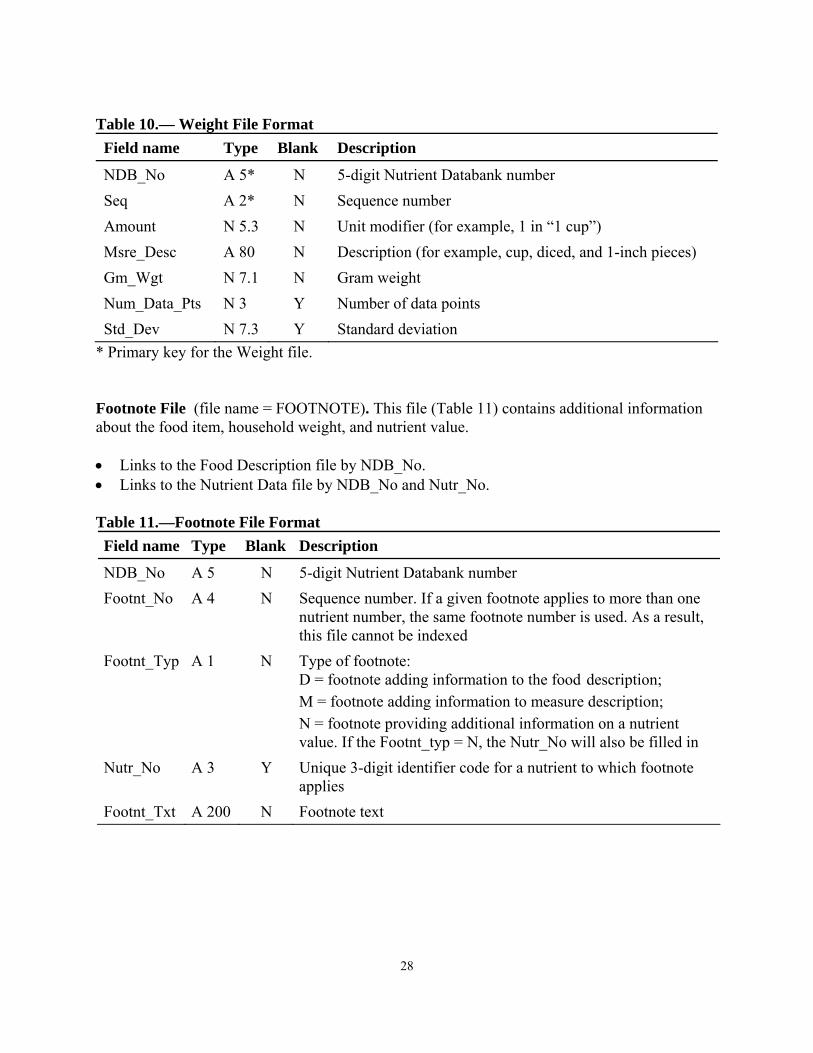
The Ref_NDB_No is 05621 Emu, ground, raw. This means that the analytical α-tocopherol value in the total solids of emu, ground, raw is used to calculate the α-tocopherol in the total solids of emu, fan fillet, raw. Nt = (Ns*Ss)/St where Nt = the nutrient content of the target item, Ns = the nutrient content of the source item, For NDB No. 05621, α-tocopherol = 0.24 mg/100 g Ss = the total solids content of the source item, and For NDB No. 05621, solids = 25.38 g/100 g St = the total solids content of the target item. For NDB No. 05623, solids = 27.13 g/100 g So, using this formula for the above example: Nt = (0.24 × 25.38)/27.13 = 0.22 mg/100 g α-tocopherol in Emu, fan fillet, raw Only items that were imputed starting with SR14 (2001) will have both derivation codes and reference NDB numbers. Other items that have been imputed outside the NDBS will have data derivation codes, but the Ref_NDB_No field will be blank. Weight File (file name = WEIGHT). This file (Table 10) contains the weight in grams of a number of common measures for each food item. • Links to Food Description file by NDB_No. • Links to Nutrient Data file by NDB_No.
28
Table 10.— Weight File Format Field name Type Blank Description
NDB_No A 5* N 5-digit Nutrient Databank number Seq A 2* N Sequence number Amount N 5.3 N Unit modifier (for example, 1 in “1 cup”) Msre_Desc A 80 N Description (for example, cup, diced, and 1-inch pieces) Gm_Wgt N 7.1 N Gram weight Num_Data_Pts N 3 Y Number of data points Std_Dev N 7.3 Y Standard deviation
* Primary key for the Weight file. Footnote File (file name = FOOTNOTE). This file (Table 11) contains additional information about the food item, household weight, and nutrient value. • Links to the Food Description file by NDB_No. • Links to the Nutrient Data file by NDB_No and Nutr_No. Table 11.—Footnote File Format Field name Type Blank Description
NDB_No A 5 N 5-digit Nutrient Databank number Footnt_No A 4 N Sequence number. If a given footnote applies to more than one
nutrient number, the same footnote number is used. As a result, this file cannot be indexed
Footnt_Typ A 1 N Type of footnote: D = footnote adding information to the food description; M = footnote adding information to measure description; N = footnote providing additional information on a nutrient value. If the Footnt_typ = N, the Nutr_No will also be filled in
Nutr_No A 3 Y Unique 3-digit identifier code for a nutrient to which footnote applies
Footnt_Txt A 200 N Footnote text
29
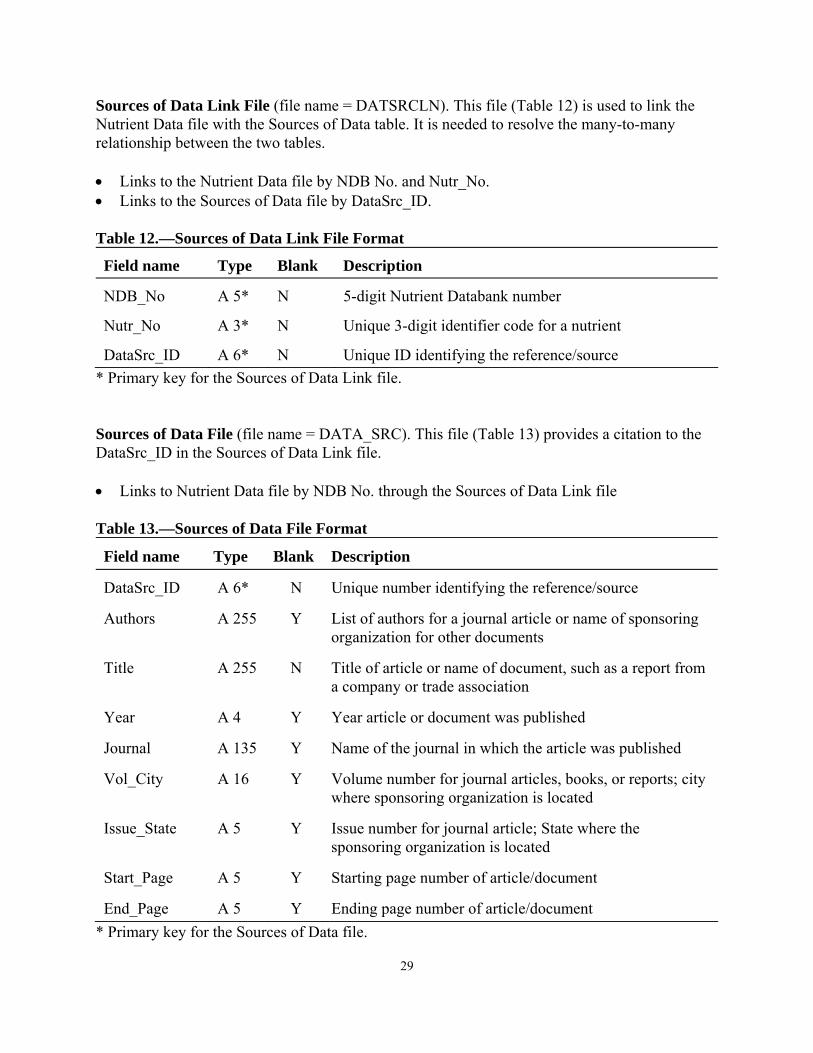
Sources of Data Link File (file name = DATSRCLN). This file (Table 12) is used to link the Nutrient Data file with the Sources of Data table. It is needed to resolve the many-to-many relationship between the two tables. • Links to the Nutrient Data file by NDB No. and Nutr_No. • Links to the Sources of Data file by DataSrc_ID. Table 12.—Sources of Data Link File Format
Field name Type Blank Description
NDB_No A 5* N 5-digit Nutrient Databank number
Nutr_No A 3* N Unique 3-digit identifier code for a nutrient
DataSrc_ID A 6* N Unique ID identifying the reference/source * Primary key for the Sources of Data Link file. Sources of Data File (file name = DATA_SRC). This file (Table 13) provides a citation to the DataSrc_ID in the Sources of Data Link file. • Links to Nutrient Data file by NDB No. through the Sources of Data Link file Table 13.—Sources of Data File Format
Field name Type Blank Description
DataSrc_ID A 6* N Unique number identifying the reference/source
Authors A 255 Y List of authors for a journal article or name of sponsoring organization for other documents
Title A 255 N Title of article or name of document, such as a report from a company or trade association
Year A 4 Y Year article or document was published
Journal A 135 Y Name of the journal in which the article was published
Vol_City A 16 Y Volume number for journal articles, books, or reports; city where sponsoring organization is located
Issue_State A 5 Y Issue number for journal article; State where the sponsoring organization is located
Start_Page A 5 Y Starting page number of article/document
End_Page A 5 Y Ending page number of article/document * Primary key for the Sources of Data file.
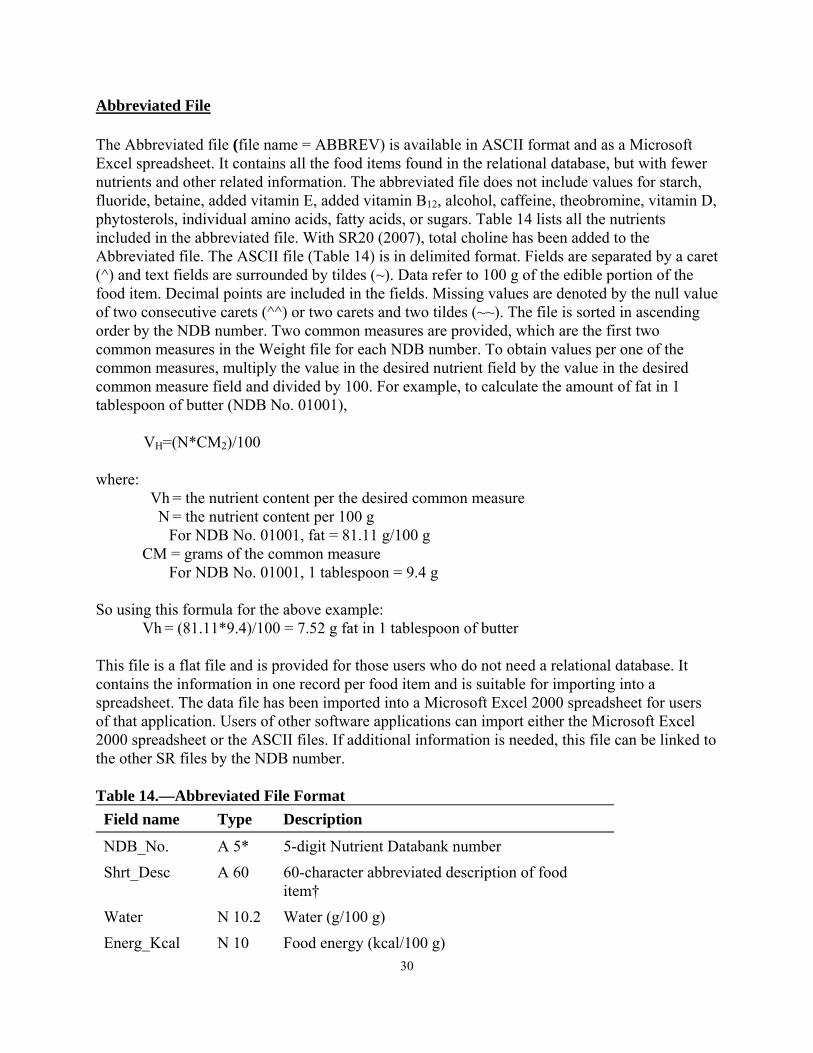
30
Abbreviated File The Abbreviated file (file name = ABBREV) is available in ASCII format and as a Microsoft Excel spreadsheet. It contains all the food items found in the relational database, but with fewer nutrients and other related information. The abbreviated file does not include values for starch, fluoride, betaine, added vitamin E, added vitamin B12, alcohol, caffeine, theobromine, vitamin D, phytosterols, individual amino acids, fatty acids, or sugars. Table 14 lists all the nutrients included in the abbreviated file. With SR20 (2007), total choline has been added to the Abbreviated file. The ASCII file (Table 14) is in delimited format. Fields are separated by a caret (^) and text fields are surrounded by tildes (~). Data refer to 100 g of the edible portion of the food item. Decimal points are included in the fields. Missing values are denoted by the null value of two consecutive carets (^^) or two carets and two tildes (~~). The file is sorted in ascending order by the NDB number. Two common measures are provided, which are the first two common measures in the Weight file for each NDB number. To obtain values per one of the common measures, multiply the value in the desired nutrient field by the value in the desired common measure field and divided by 100. For example, to calculate the amount of fat in 1 tablespoon of butter (NDB No. 01001), VH=(N*CM2)/100 where: Vh = the nutrient content per the desired common measure N = the nutrient content per 100 g For NDB No. 01001, fat = 81.11 g/100 g CM = grams of the common measure For NDB No. 01001, 1 tablespoon = 9.4 g So using this formula for the above example: Vh = (81.11*9.4)/100 = 7.52 g fat in 1 tablespoon of butter
This file is a flat file and is provided for those users who do not need a relational database. It contains the information in one record per food item and is suitable for importing into a spreadsheet. The data file has been imported into a Microsoft Excel 2000 spreadsheet for users of that application. Users of other software applications can import either the Microsoft Excel 2000 spreadsheet or the ASCII files. If additional information is needed, this file can be linked to the other SR files by the NDB number. Table 14.—Abbreviated File Format Field name Type Description
NDB_No. A 5* 5-digit Nutrient Databank number Shrt_Desc A 60 60-character abbreviated description of food
item† Water N 10.2 Water (g/100 g) Energ_Kcal N 10 Food energy (kcal/100 g)
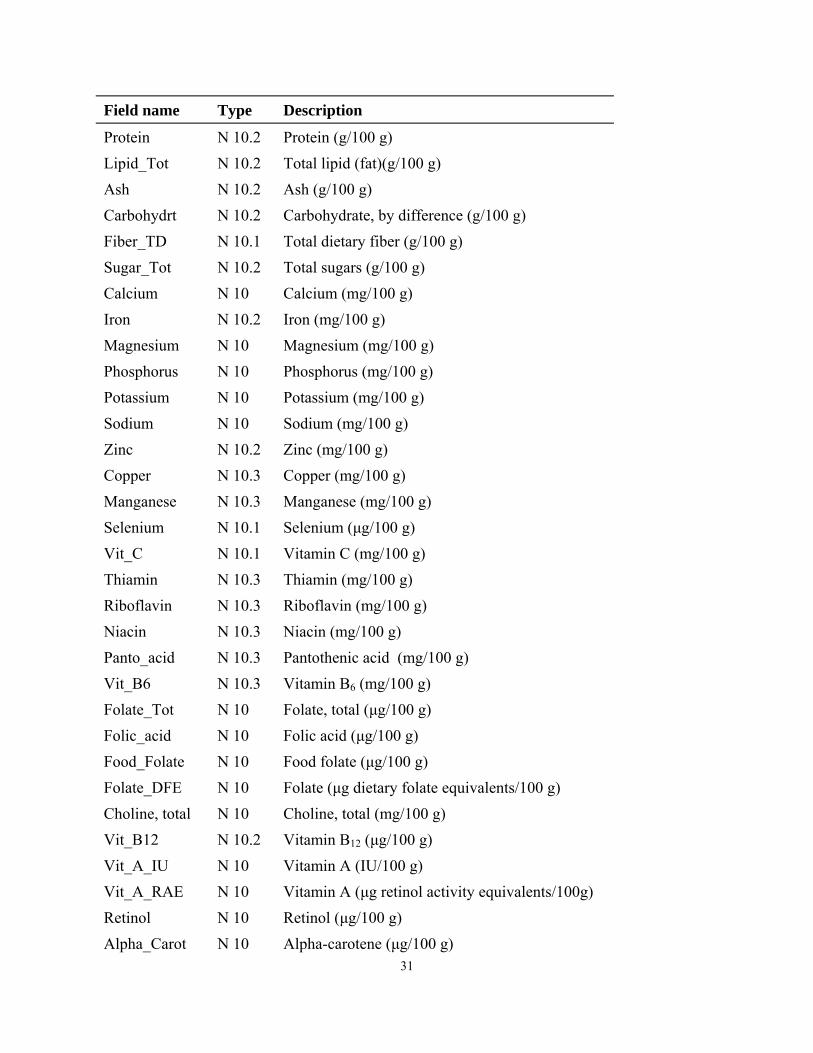
31
Field name Type Description
Protein N 10.2 Protein (g/100 g) Lipid_Tot N 10.2 Total lipid (fat)(g/100 g) Ash N 10.2 Ash (g/100 g) Carbohydrt N 10.2 Carbohydrate, by difference (g/100 g) Fiber_TD N 10.1 Total dietary fiber (g/100 g) Sugar_Tot N 10.2 Total sugars (g/100 g) Calcium N 10 Calcium (mg/100 g) Iron N 10.2 Iron (mg/100 g) Magnesium N 10 Magnesium (mg/100 g) Phosphorus N 10 Phosphorus (mg/100 g) Potassium N 10 Potassium (mg/100 g) Sodium N 10 Sodium (mg/100 g) Zinc N 10.2 Zinc (mg/100 g) Copper N 10.3 Copper (mg/100 g) Manganese N 10.3 Manganese (mg/100 g) Selenium N 10.1 Selenium (μg/100 g) Vit_C N 10.1 Vitamin C (mg/100 g) Thiamin N 10.3 Thiamin (mg/100 g) Riboflavin N 10.3 Riboflavin (mg/100 g) Niacin N 10.3 Niacin (mg/100 g) Panto_acid N 10.3 Pantothenic acid (mg/100 g) Vit_B6 N 10.3 Vitamin B6 (mg/100 g) Folate_Tot N 10 Folate, total (μg/100 g) Folic_acid N 10 Folic acid (μg/100 g) Food_Folate N 10 Food folate (μg/100 g) Folate_DFE N 10 Folate (μg dietary folate equivalents/100 g) Choline, total N 10 Choline, total (mg/100 g) Vit_B12 N 10.2 Vitamin B12 (μg/100 g) Vit_A_IU N 10 Vitamin A (IU/100 g) Vit_A_RAE N 10 Vitamin A (μg retinol activity equivalents/100g) Retinol N 10 Retinol (μg/100 g) Alpha_Carot N 10 Alpha-carotene (μg/100 g)
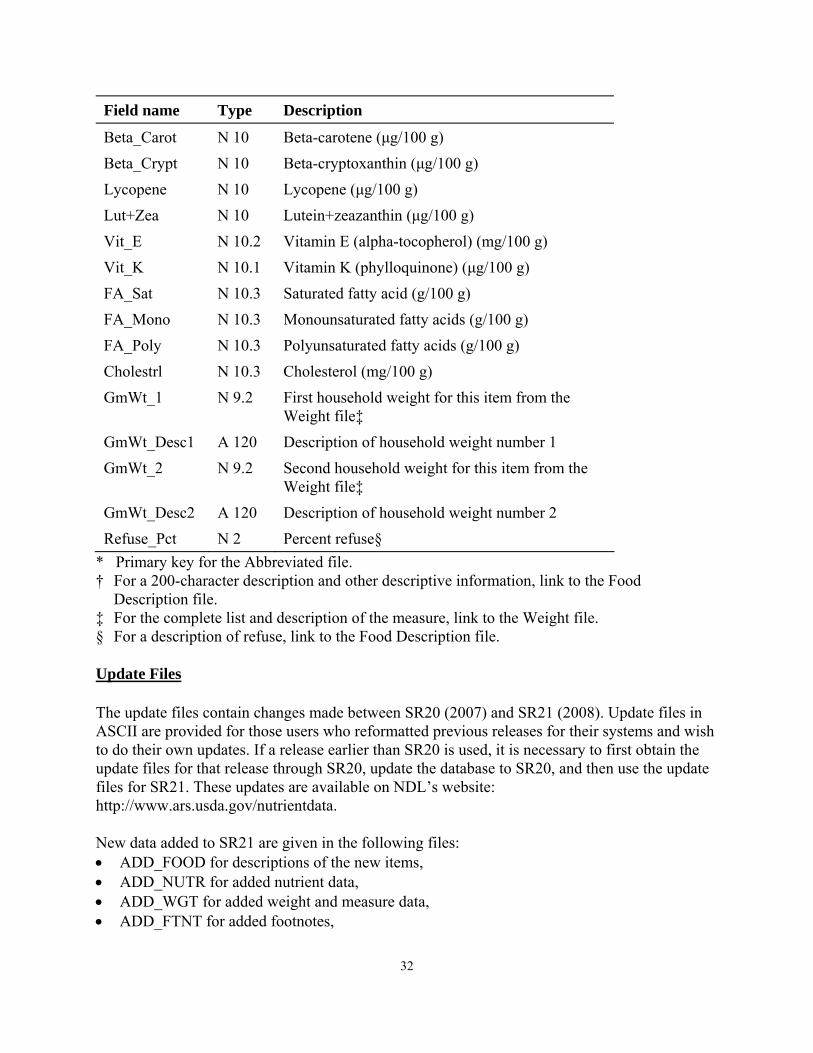
32
Field name Type Description
Beta_Carot N 10 Beta-carotene (μg/100 g) Beta_Crypt N 10 Beta-cryptoxanthin (μg/100 g) Lycopene N 10 Lycopene (μg/100 g) Lut+Zea N 10 Lutein+zeazanthin (μg/100 g) Vit_E N 10.2 Vitamin E (alpha-tocopherol) (mg/100 g) Vit_K N 10.1 Vitamin K (phylloquinone) (μg/100 g) FA_Sat N 10.3 Saturated fatty acid (g/100 g) FA_Mono N 10.3 Monounsaturated fatty acids (g/100 g) FA_Poly N 10.3 Polyunsaturated fatty acids (g/100 g) Cholestrl N 10.3 Cholesterol (mg/100 g) GmWt_1 N 9.2 First household weight for this item from the
Weight file‡ GmWt_Desc1 A 120 Description of household weight number 1 GmWt_2 N 9.2 Second household weight for this item from the
Weight file‡ GmWt_Desc2 A 120 Description of household weight number 2 Refuse_Pct N 2 Percent refuse§
* Primary key for the Abbreviated file. † For a 200-character description and other descriptive information, link to the Food
Description file. ‡ For the complete list and description of the measure, link to the Weight file. § For a description of refuse, link to the Food Description file. Update Files The update files contain changes made between SR20 (2007) and SR21 (2008). Update files in ASCII are provided for those users who reformatted previous releases for their systems and wish to do their own updates. If a release earlier than SR20 is used, it is necessary to first obtain the update files for that release through SR20, update the database to SR20, and then use the update files for SR21. These updates are available on NDL’s website: http://www.ars.usda.gov/nutrientdata. New data added to SR21 are given in the following files: • ADD_FOOD for descriptions of the new items, • ADD_NUTR for added nutrient data, • ADD_WGT for added weight and measure data, • ADD_FTNT for added footnotes,
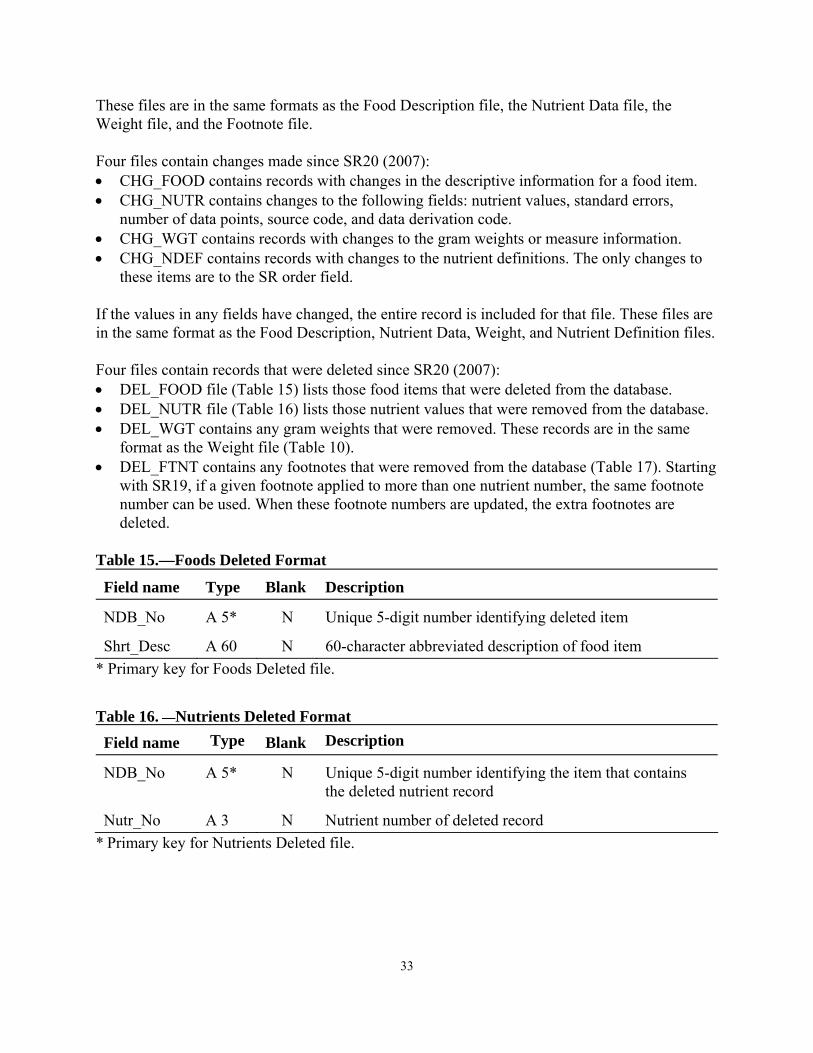
33
These files are in the same formats as the Food Description file, the Nutrient Data file, the Weight file, and the Footnote file. Four files contain changes made since SR20 (2007): • CHG_FOOD contains records with changes in the descriptive information for a food item. • CHG_NUTR contains changes to the following fields: nutrient values, standard errors,
number of data points, source code, and data derivation code. • CHG_WGT contains records with changes to the gram weights or measure information. • CHG_NDEF contains records with changes to the nutrient definitions. The only changes to
these items are to the SR order field. If the values in any fields have changed, the entire record is included for that file. These files are in the same format as the Food Description, Nutrient Data, Weight, and Nutrient Definition files. Four files contain records that were deleted since SR20 (2007): • DEL_FOOD file (Table 15) lists those food items that were deleted from the database. • DEL_NUTR file (Table 16) lists those nutrient values that were removed from the database. • DEL_WGT contains any gram weights that were removed. These records are in the same
format as the Weight file (Table 10). • DEL_FTNT contains any footnotes that were removed from the database (Table 17). Starting
with SR19, if a given footnote applied to more than one nutrient number, the same footnote number can be used. When these footnote numbers are updated, the extra footnotes are deleted.
Table 15.—Foods Deleted Format
Field name Type Blank Description
NDB_No A 5* N Unique 5-digit number identifying deleted item
Shrt_Desc A 60 N 60-character abbreviated description of food item * Primary key for Foods Deleted file. Table 16. —Nutrients Deleted Format
Field name Type Blank Description
NDB_No A 5* N Unique 5-digit number identifying the item that contains the deleted nutrient record
Nutr_No A 3 N Nutrient number of deleted record * Primary key for Nutrients Deleted file.
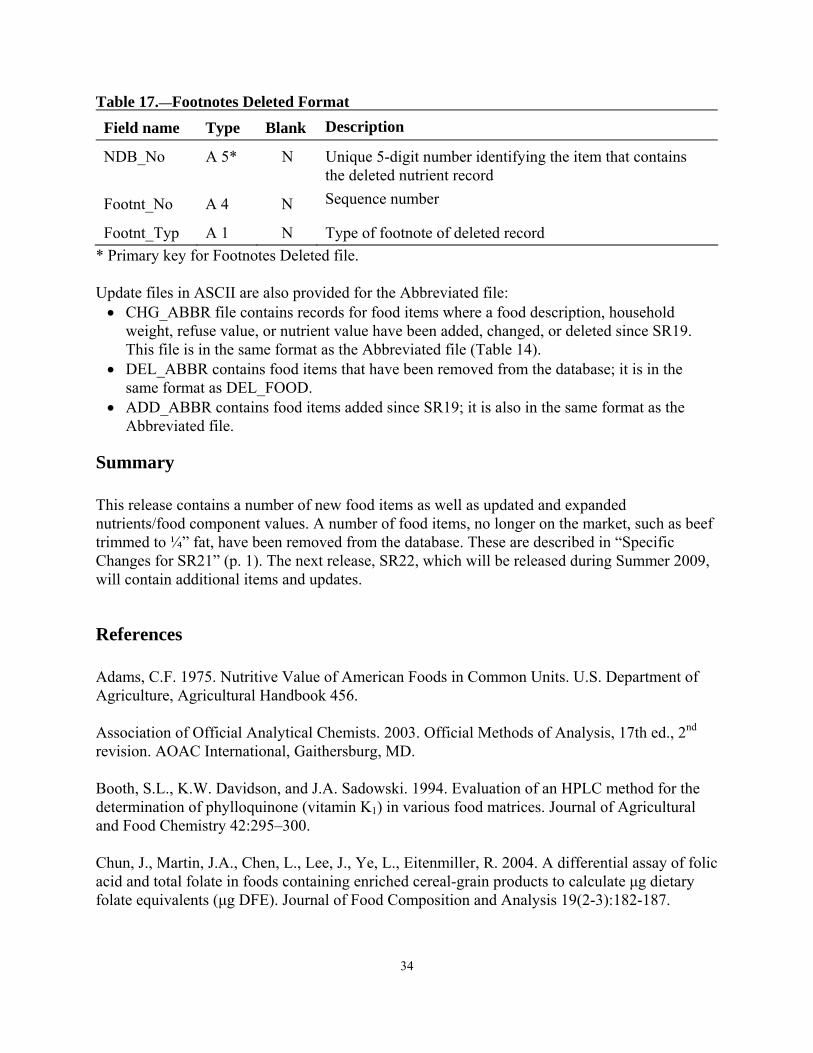
34
Table 17.—Footnotes Deleted Format Field name Type Blank Description
NDB_No A 5* N Unique 5-digit number identifying the item that contains the deleted nutrient record
Footnt_No A 4 N Sequence number
Footnt_Typ A 1 N Type of footnote of deleted record * Primary key for Footnotes Deleted file. Update files in ASCII are also provided for the Abbreviated file: • CHG_ABBR file contains records for food items where a food description, household
weight, refuse value, or nutrient value have been added, changed, or deleted since SR19. This file is in the same format as the Abbreviated file (Table 14).
• DEL_ABBR contains food items that have been removed from the database; it is in the same format as DEL_FOOD.
• ADD_ABBR contains food items added since SR19; it is also in the same format as the Abbreviated file.
Summary This release contains a number of new food items as well as updated and expanded nutrients/food component values. A number of food items, no longer on the market, such as beef trimmed to ¼” fat, have been removed from the database. These are described in “Specific Changes for SR21” (p. 1). The next release, SR22, which will be released during Summer 2009, will contain additional items and updates.
References Adams, C.F. 1975. Nutritive Value of American Foods in Common Units. U.S. Department of Agriculture, Agricultural Handbook 456. Association of Official Analytical Chemists. 2003. Official Methods of Analysis, 17th ed., 2nd revision. AOAC International, Gaithersburg, MD. Booth, S.L., K.W. Davidson, and J.A. Sadowski. 1994. Evaluation of an HPLC method for the determination of phylloquinone (vitamin K1) in various food matrices. Journal of Agricultural and Food Chemistry 42:295–300. Chun, J., Martin, J.A., Chen, L., Lee, J., Ye, L., Eitenmiller, R. 2004. A differential assay of folic acid and total folate in foods containing enriched cereal-grain products to calculate μg dietary folate equivalents (μg DFE). Journal of Food Composition and Analysis 19(2-3):182-187.
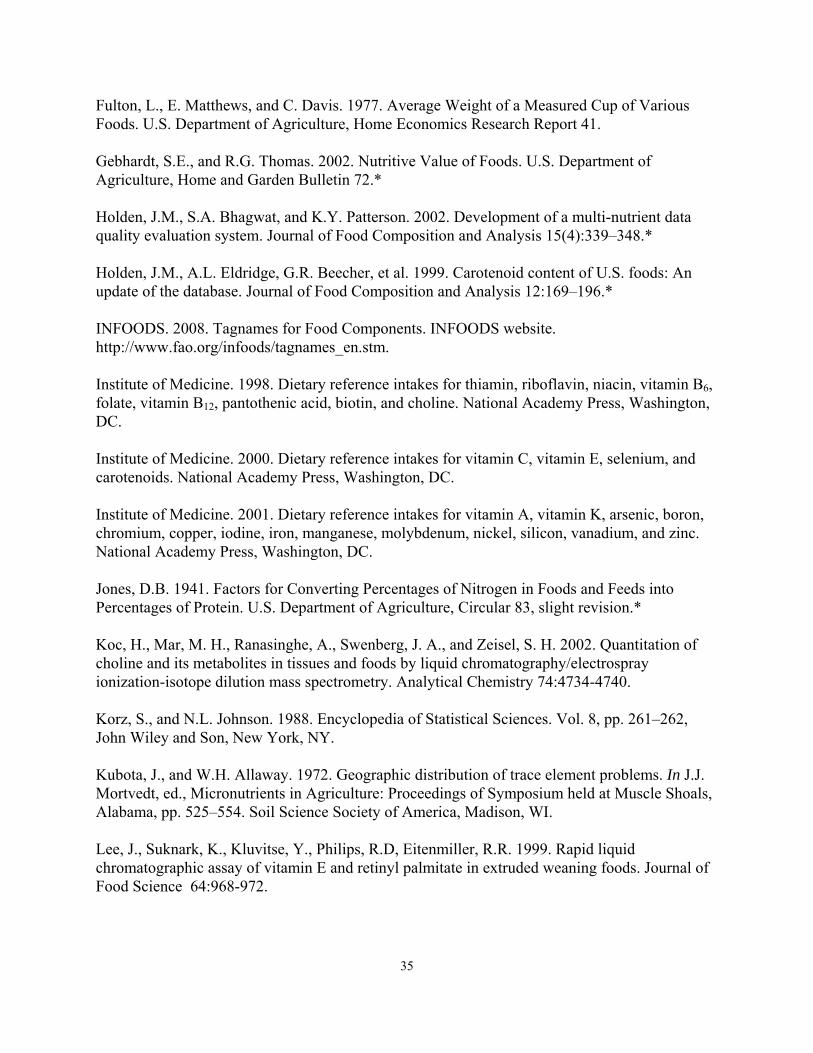
35
Fulton, L., E. Matthews, and C. Davis. 1977. Average Weight of a Measured Cup of Various Foods. U.S. Department of Agriculture, Home Economics Research Report 41. Gebhardt, S.E., and R.G. Thomas. 2002. Nutritive Value of Foods. U.S. Department of Agriculture, Home and Garden Bulletin 72.* Holden, J.M., S.A. Bhagwat, and K.Y. Patterson. 2002. Development of a multi-nutrient data quality evaluation system. Journal of Food Composition and Analysis 15(4):339–348.* Holden, J.M., A.L. Eldridge, G.R. Beecher, et al. 1999. Carotenoid content of U.S. foods: An update of the database. Journal of Food Composition and Analysis 12:169–196.* INFOODS. 2008. Tagnames for Food Components. INFOODS website. http://www.fao.org/infoods/tagnames_en.stm. Institute of Medicine. 1998. Dietary reference intakes for thiamin, riboflavin, niacin, vitamin B6, folate, vitamin B12, pantothenic acid, biotin, and choline. National Academy Press, Washington, DC. Institute of Medicine. 2000. Dietary reference intakes for vitamin C, vitamin E, selenium, and carotenoids. National Academy Press, Washington, DC. Institute of Medicine. 2001. Dietary reference intakes for vitamin A, vitamin K, arsenic, boron, chromium, copper, iodine, iron, manganese, molybdenum, nickel, silicon, vanadium, and zinc. National Academy Press, Washington, DC. Jones, D.B. 1941. Factors for Converting Percentages of Nitrogen in Foods and Feeds into Percentages of Protein. U.S. Department of Agriculture, Circular 83, slight revision.* Koc, H., Mar, M. H., Ranasinghe, A., Swenberg, J. A., and Zeisel, S. H. 2002. Quantitation of choline and its metabolites in tissues and foods by liquid chromatography/electrospray ionization-isotope dilution mass spectrometry. Analytical Chemistry 74:4734-4740. Korz, S., and N.L. Johnson. 1988. Encyclopedia of Statistical Sciences. Vol. 8, pp. 261–262, John Wiley and Son, New York, NY. Kubota, J., and W.H. Allaway. 1972. Geographic distribution of trace element problems. In J.J. Mortvedt, ed., Micronutrients in Agriculture: Proceedings of Symposium held at Muscle Shoals, Alabama, pp. 525–554. Soil Science Society of America, Madison, WI. Lee, J., Suknark, K., Kluvitse, Y., Philips, R.D, Eitenmiller, R.R. 1999. Rapid liquid chromatographic assay of vitamin E and retinyl palmitate in extruded weaning foods. Journal of Food Science 64:968-972.
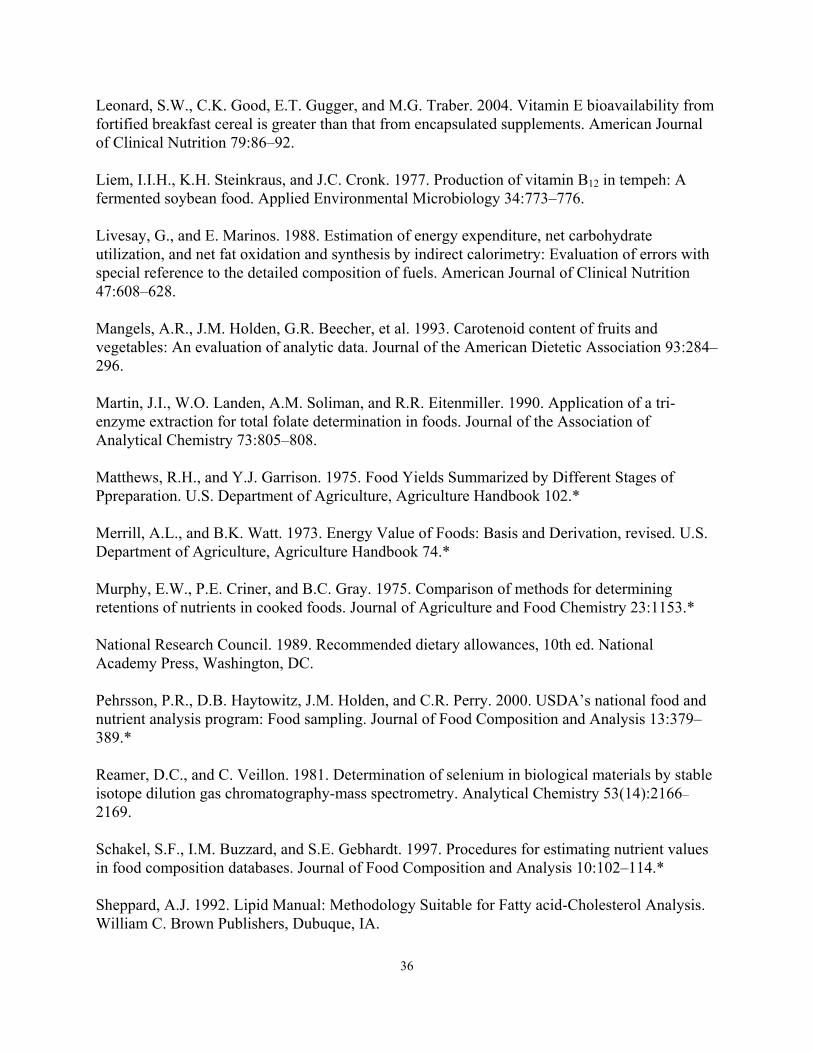
36
Leonard, S.W., C.K. Good, E.T. Gugger, and M.G. Traber. 2004. Vitamin E bioavailability from fortified breakfast cereal is greater than that from encapsulated supplements. American Journal of Clinical Nutrition 79:86–92. Liem, I.I.H., K.H. Steinkraus, and J.C. Cronk. 1977. Production of vitamin B12 in tempeh: A fermented soybean food. Applied Environmental Microbiology 34:773–776. Livesay, G., and E. Marinos. 1988. Estimation of energy expenditure, net carbohydrate utilization, and net fat oxidation and synthesis by indirect calorimetry: Evaluation of errors with special reference to the detailed composition of fuels. American Journal of Clinical Nutrition 47:608–628. Mangels, A.R., J.M. Holden, G.R. Beecher, et al. 1993. Carotenoid content of fruits and vegetables: An evaluation of analytic data. Journal of the American Dietetic Association 93:284–296. Martin, J.I., W.O. Landen, A.M. Soliman, and R.R. Eitenmiller. 1990. Application of a tri-enzyme extraction for total folate determination in foods. Journal of the Association of Analytical Chemistry 73:805–808. Matthews, R.H., and Y.J. Garrison. 1975. Food Yields Summarized by Different Stages of Ppreparation. U.S. Department of Agriculture, Agriculture Handbook 102.* Merrill, A.L., and B.K. Watt. 1973. Energy Value of Foods: Basis and Derivation, revised. U.S. Department of Agriculture, Agriculture Handbook 74.* Murphy, E.W., P.E. Criner, and B.C. Gray. 1975. Comparison of methods for determining retentions of nutrients in cooked foods. Journal of Agriculture and Food Chemistry 23:1153.* National Research Council. 1989. Recommended dietary allowances, 10th ed. National Academy Press, Washington, DC. Pehrsson, P.R., D.B. Haytowitz, J.M. Holden, and C.R. Perry. 2000. USDA’s national food and nutrient analysis program: Food sampling. Journal of Food Composition and Analysis 13:379–389.* Reamer, D.C., and C. Veillon. 1981. Determination of selenium in biological materials by stable isotope dilution gas chromatography-mass spectrometry. Analytical Chemistry 53(14):2166–2169. Schakel, S.F., I.M. Buzzard, and S.E. Gebhardt. 1997. Procedures for estimating nutrient values in food composition databases. Journal of Food Composition and Analysis 10:102–114.* Sheppard, A.J. 1992. Lipid Manual: Methodology Suitable for Fatty acid-Cholesterol Analysis. William C. Brown Publishers, Dubuque, IA.
37
U.S. Department of Agriculture, Agricultural Research Service. 1976. Composition of Foods: Dairy and Eegg products; raw, processed, prepared. Agriculture Handbook 8–1. U.S. Department of Agriculture, Agricultural Research Service. 1977. Composition of Foods: Spices and herbs; raw, processed, prepared. Agriculture Handbook 8–2. U.S. Department of Agriculture, Agricultural Research Service. 1978. Composition of Foods: Baby foods; raw, processed, prepared. Agriculture Handbook 8–3. U.S. Department of Agriculture, Agricultural Research Service. 1979. Composition of Foods: Fats and oils; raw, processed, prepared. Agriculture Handbook 8–4. U.S. Department of Agriculture, Agricultural Research Service. 1979. Composition of Foods: Poultry products; raw, processed, prepared. Agriculture Handbook 8–5. U.S Department of Agriculture, Agricultural Research Service. 1980. Composition of Foods Soups, sauces, and gravies; raw, processed, prepared. Agriculture Handbook 8–6. U.S. Department of Agriculture, Agricultural Research Service. 1980. Composition of Foods Sausages and luncheon meats; raw, processed, prepared. Agriculture Handbook 8–7. U.S. Department of Agriculture, Agricultural Research Service. 1982. Composition of Foods Breakfast cereals; raw, processed, prepared. Agriculture Handbook 8–8. U.S. Department of Agriculture, Agricultural Research Service. 1982. Composition of Foods Fruits and fruit juices; raw, processed, prepared. Agriculture Handbook 8–9. U.S. Department of Agriculture, Agricultural Research Service. 1992. Composition of Foods Pork products; raw, processed, prepared. Agriculture Handbook 8–10. U.S. Department of Agriculture, Agricultural Research Service. 1984. Composition of Foods Vegetables and vegetable products; raw, processed, prepared. Agriculture Handbook 8–11. U.S. Department of Agriculture, Agricultural Research Service. 1984. Composition of Foods Nut and seed products; raw, processed, prepared. Agriculture Handbook 8–12. U.S. Department of Agriculture, Agricultural Research Service. 1990. Composition of Foods Beef products; raw, processed, prepared. Agriculture Handbook 8–13. U.S. Department of Agriculture, Agricultural Research Service. 1986. Composition of Foods Beverages; raw, processed, prepared. Agriculture Handbook 8–14. U.S. Department of Agriculture, Agricultural Research Service. 1987. Composition of Foods Finfish and shellfish products; raw, processed, prepared. Agriculture Handbook 8–15.
38
U.S. Department of Agriculture, Agricultural Research Service. 1986. Composition of Foods Legumes and legume products; raw, processed, prepared. Agriculture Handbook 8–16. U.S. Department of Agriculture, Agricultural Research Service. 1989. Composition of Foods Lamb, veal, and game products; raw, processed, prepared. Agriculture Handbook 8–17. U.S. Department of Agriculture, Agricultural Research Service. 1992. Composition of Foods Baked products; raw, processed, prepared. Agriculture Handbook 8–18. U.S. Department of Agriculture, Agricultural Research Service. 1991. Composition of Foods Snacks and sweets; raw, processed, prepared. Agriculture Handbook 8–19. U.S. Department of Agriculture, Agricultural Research Service. 1989. Composition of Foods Cereal grains and pasta; raw, processed, prepared. Agriculture Handbook 8–20. U.S. Department of Agriculture, Agricultural Research Service. 1988. Composition of Foods Fast foods; raw, processed, prepared. Agriculture Handbook 8–21. U.S. Department of Agriculture, Agricultural Research Service. 1990. Composition of Foods Raw, processed, prepared. Agriculture Handbook 8, 1989 Supplement. U.S. Department of Agriculture, Agricultural Research Service. 1991. Composition of Foods Raw, processed, prepared. Agriculture Handbook 8, 1990 Supplement. U.S. Department of Agriculture, Agricultural Research Service. 1992. Composition of Foods Raw, processed, prepared. Agriculture Handbook 8, 1991 Supplement. U.S. Department of Agriculture, Agricultural Research Service. 1993. Composition of Foods Raw, processed, prepared. Agriculture Handbook 8, 1992 Supplement. U.S. Department of Agriculture, Agricultural Research Service. 1992. Provisional Table on the Selenium Content of Foods. USDA, HNIS, PT–109. U.S. Department of Agriculture. 2007. USDA Table of Nutrient Retention Factors, Release 6. Nutrient Data Laboratory Home Page at http://www.ars.usda.gov/nutrientdata.* U.S. Department of Agriculture, Agricultural Research Service. 2004. USDA Database for the Choline Content of Common Foods. Nutrient Data Laboratory website: http://www.ars.usda.gov/nutrientdata/choline. * U.S. Department of Agriculture, Agricultural Research Service. 2008. USDA Food and Nutrient Database for Dietary Studies (release 3.0) [database]. Food Surveys Research Group website: http://www.ars.usda.gov/ba/bhnrc/fsrg.
39
U.S. Department of Agriculture, Agricultural Research Service. 2005. USDA National Fluoride Database of Selected Beverages and Foods - Release 2. Nutrient Data Laboratory website: http://www.ars.usda.gov/nutrientdata/fluoride. * U.S. Food and Drug Administration, Department of Health and Human Services. 2008. Food Labeling. Code of Federal Regulations, Title 21, Pt. 101. U.S. Government Printing Office website: http://www.gpoaccess.gov/cfr/index.html. Van Winkle S, Levy S.M., Kiritsy M.C., Heilman J.R., Wefel J.S., Marshall T. 1995. Water and formula fluoride concentrations: Significance for infants fed formula. Pediatric Dentistry. 17(4):305-310. Watt, B.K., and A.L. Merrill. 1963. Composition of Foods Raw, processed, prepared. U.S. Department of Agriculture, Agriculture Handbook 8.
Weihrauch, J.L., and A.S. Chatra. 1994. Provisional Table on the Vitamin K Content of Foods, Revised. USDA, HNIS, PT–104.* Weihrauch, J.L., L.P. Posati, B.A. Anderson, and J. Exler. 1977. Lipid conversion factors for calculating fatty acid content of foods. Journal of the American Oil Chemists Society 54:36–40. Weihrauch, J.L., and J. Tamaki. 1991. Provisional Table on the Vitamin D Content of Foods. USDA, HNIS, PT–108.* Zeisel, S. H., and Blusztajn, J. K. 1994. Choline and human nutrition. Annual Reviews of Nutrition. 14:269-296 Zeisel, S.H., Mar, M.H., Howe, J. C., Holden, J. M. 2003. Concentrations of choline – containing compounds and betaine in common foods. Journal of Nutrition 133:1302-1307; Erratum. 2003. Journal of Nutrition. 133:2918-2919 _______________ * Available on NDL’s website: http://www.ars.usda.gov/nutrientdata
A-1
Appendix A. Abbreviations Used in Short Descriptions All purpose ALLPURP Aluminum AL And & Apple APPL Apples APPLS Applesauce APPLSAUC Approximate APPROX Approximately APPROX Arm and blade ARM&BLD Artificial ART Ascorbic acid VIT C Aspartame ASPRT Aspartame-sweetened ASPRT-SWTND Baby food BABYFD Baked BKD Barbequed BBQ Based BSD Beans BNS Beef BF Beverage BEV Boiled BLD Boneless BNLESS Bottled BTLD Bottom BTTM Braised BRSD Breakfast BRKFST Broiled BRLD Buttermilk BTTRMLK Calcium CA Calorie, calories CAL Canned CND Carbonated CARB Center CNTR Cereal CRL Cheese CHS Chicken CHICK Chocolate CHOC Choice CHOIC Cholesterol CHOL Cholesterol-free CHOL-FREE Chopped CHOPD Cinnamon CINN
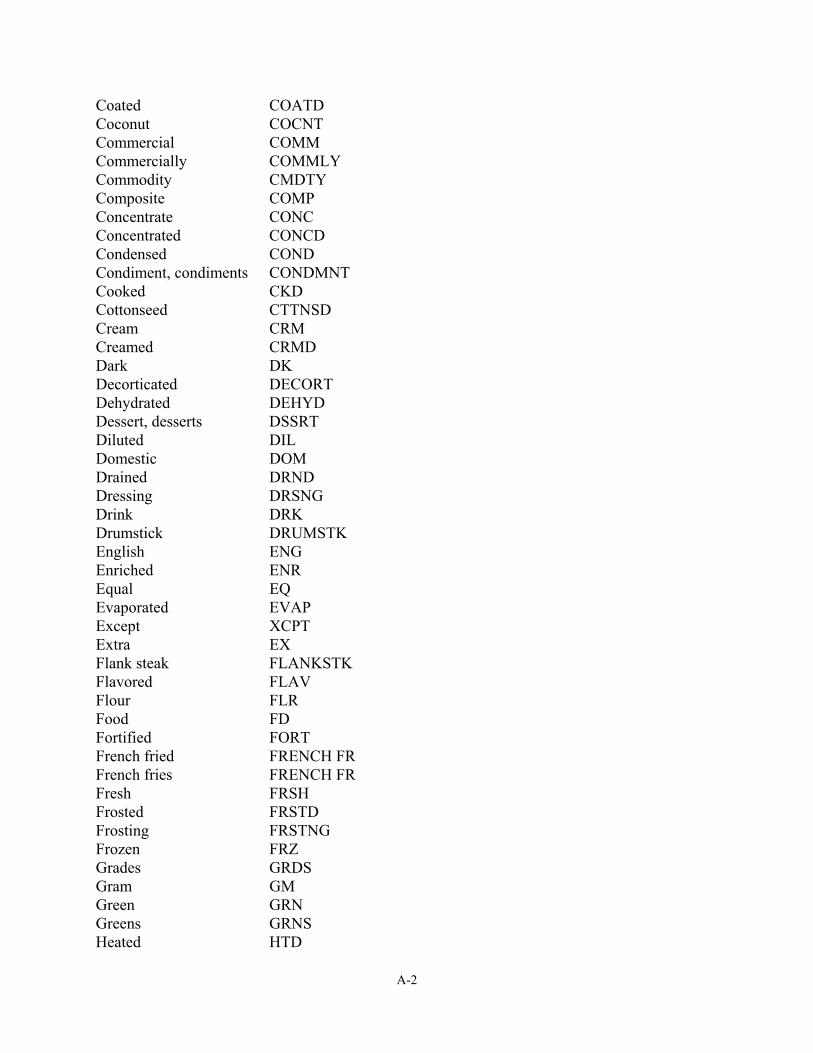
A-2
Coated COATD Coconut COCNT Commercial COMM Commercially COMMLY Commodity CMDTY Composite COMP Concentrate CONC Concentrated CONCD Condensed COND Condiment, condiments CONDMNT Cooked CKD Cottonseed CTTNSD Cream CRM Creamed CRMD Dark DK Decorticated DECORT Dehydrated DEHYD Dessert, desserts DSSRT Diluted DIL Domestic DOM Drained DRND Dressing DRSNG Drink DRK Drumstick DRUMSTK English ENG Enriched ENR Equal EQ Evaporated EVAP Except XCPT Extra EX Flank steak FLANKSTK Flavored FLAV Flour FLR Food FD Fortified FORT French fried FRENCH FR French fries FRENCH FR Fresh FRSH Frosted FRSTD Frosting FRSTNG Frozen FRZ Grades GRDS Gram GM Green GRN Greens GRNS Heated HTD
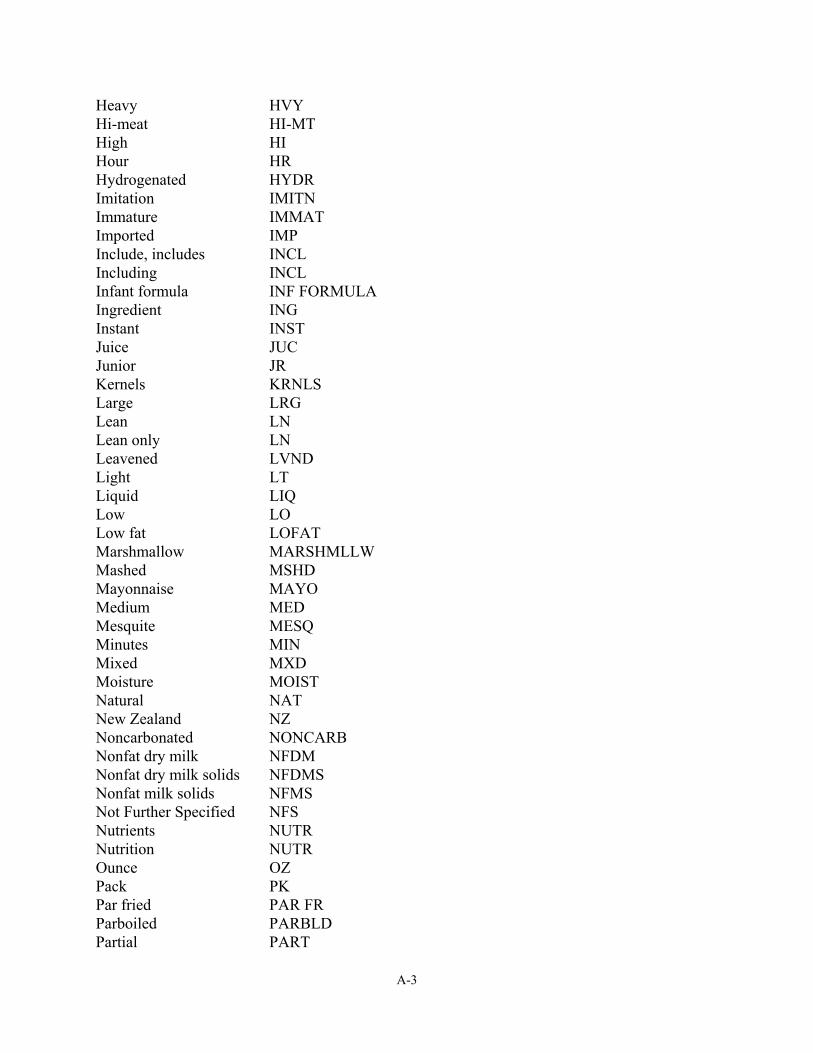
A-3
Heavy HVY Hi-meat HI-MT High HI Hour HR Hydrogenated HYDR Imitation IMITN Immature IMMAT Imported IMP Include, includes INCL Including INCL Infant formula INF FORMULA Ingredient ING Instant INST Juice JUC Junior JR Kernels KRNLS Large LRG Lean LN Lean only LN Leavened LVND Light LT Liquid LIQ Low LO Low fat LOFAT Marshmallow MARSHMLLW Mashed MSHD Mayonnaise MAYO Medium MED Mesquite MESQ Minutes MIN Mixed MXD Moisture MOIST Natural NAT New Zealand NZ Noncarbonated NONCARB Nonfat dry milk NFDM Nonfat dry milk solids NFDMS Nonfat milk solids NFMS Not Further Specified NFS Nutrients NUTR Nutrition NUTR Ounce OZ Pack PK Par fried PAR FR Parboiled PARBLD Partial PART
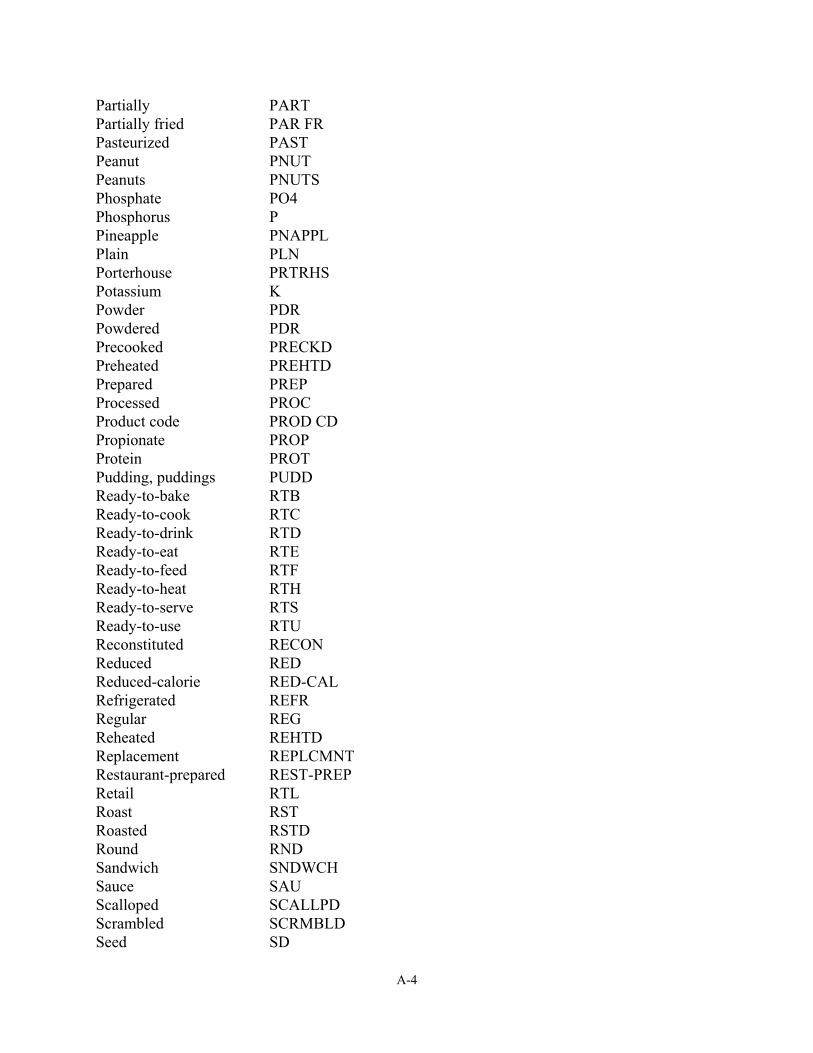
A-4
Partially PART Partially fried PAR FR Pasteurized PAST Peanut PNUT Peanuts PNUTS Phosphate PO4 Phosphorus P Pineapple PNAPPL Plain PLN Porterhouse PRTRHS Potassium K Powder PDR Powdered PDR Precooked PRECKD Preheated PREHTD Prepared PREP Processed PROC Product code PROD CD Propionate PROP Protein PROT Pudding, puddings PUDD Ready-to-bake RTB Ready-to-cook RTC Ready-to-drink RTD Ready-to-eat RTE Ready-to-feed RTF Ready-to-heat RTH Ready-to-serve RTS Ready-to-use RTU Reconstituted RECON Reduced RED Reduced-calorie RED-CAL Refrigerated REFR Regular REG Reheated REHTD Replacement REPLCMNT Restaurant-prepared REST-PREP Retail RTL Roast RST Roasted RSTD Round RND Sandwich SNDWCH Sauce SAU Scalloped SCALLPD Scrambled SCRMBLD Seed SD
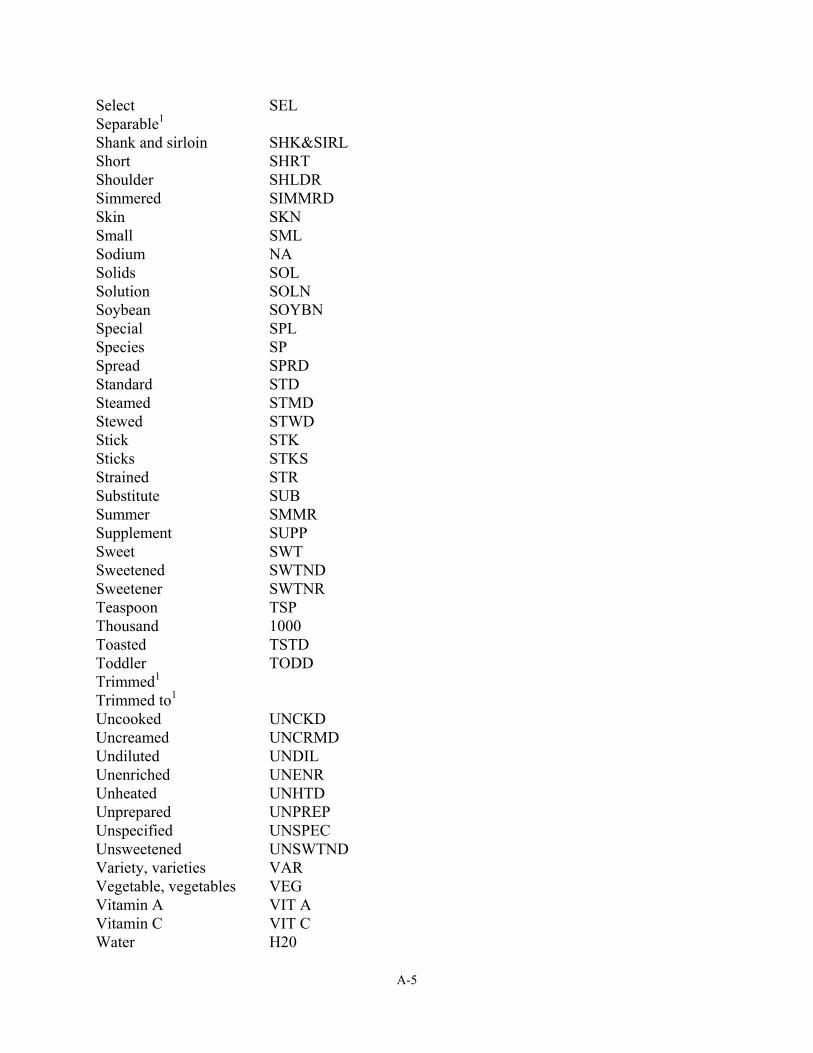
A-5
Select SEL Separable1 Shank and sirloin SHK&SIRL Short SHRT Shoulder SHLDR Simmered SIMMRD Skin SKN Small SML Sodium NA Solids SOL Solution SOLN Soybean SOYBN Special SPL Species SP Spread SPRD Standard STD Steamed STMD Stewed STWD Stick STK Sticks STKS Strained STR Substitute SUB Summer SMMR Supplement SUPP Sweet SWT Sweetened SWTND Sweetener SWTNR Teaspoon TSP Thousand 1000 Toasted TSTD Toddler TODD Trimmed1 Trimmed to1 Uncooked UNCKD Uncreamed UNCRMD Undiluted UNDIL Unenriched UNENR Unheated UNHTD Unprepared UNPREP Unspecified UNSPEC Unsweetened UNSWTND Variety, varieties VAR Vegetable, vegetables VEG Vitamin A VIT A Vitamin C VIT C Water H20
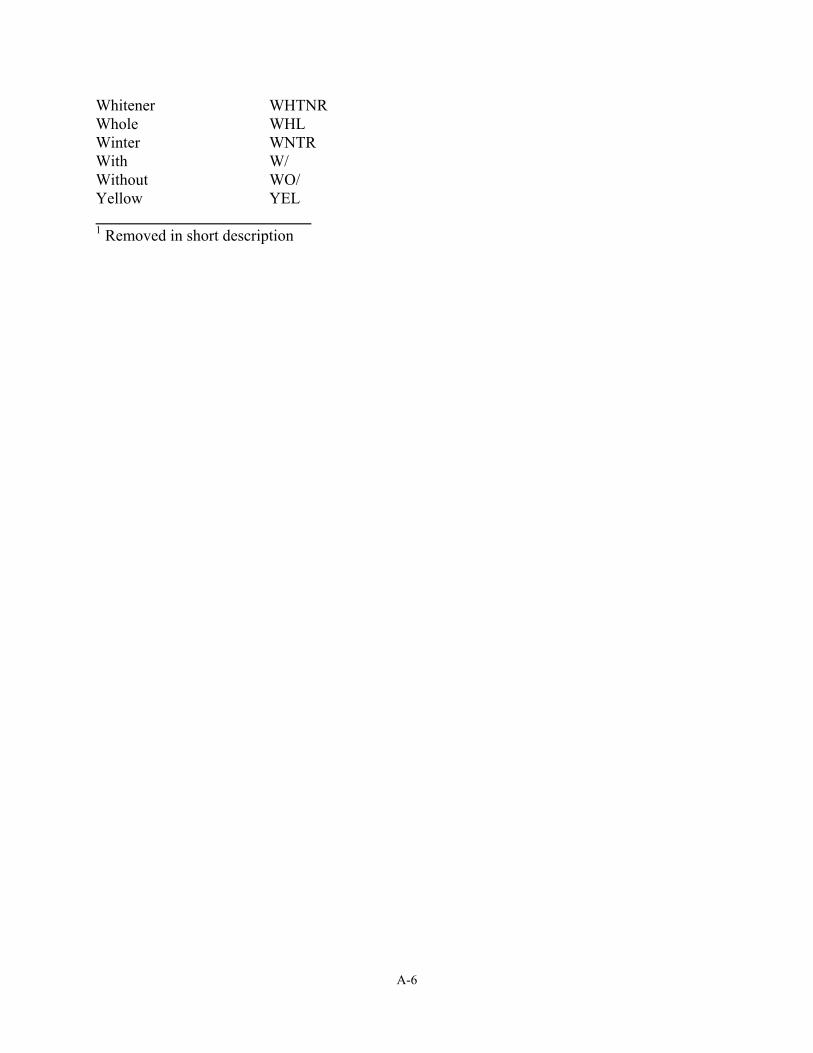
A-6
Whitener WHTNR Whole WHL Winter WNTR With W/ Without WO/ Yellow YEL ___________________________ 1 Removed in short description
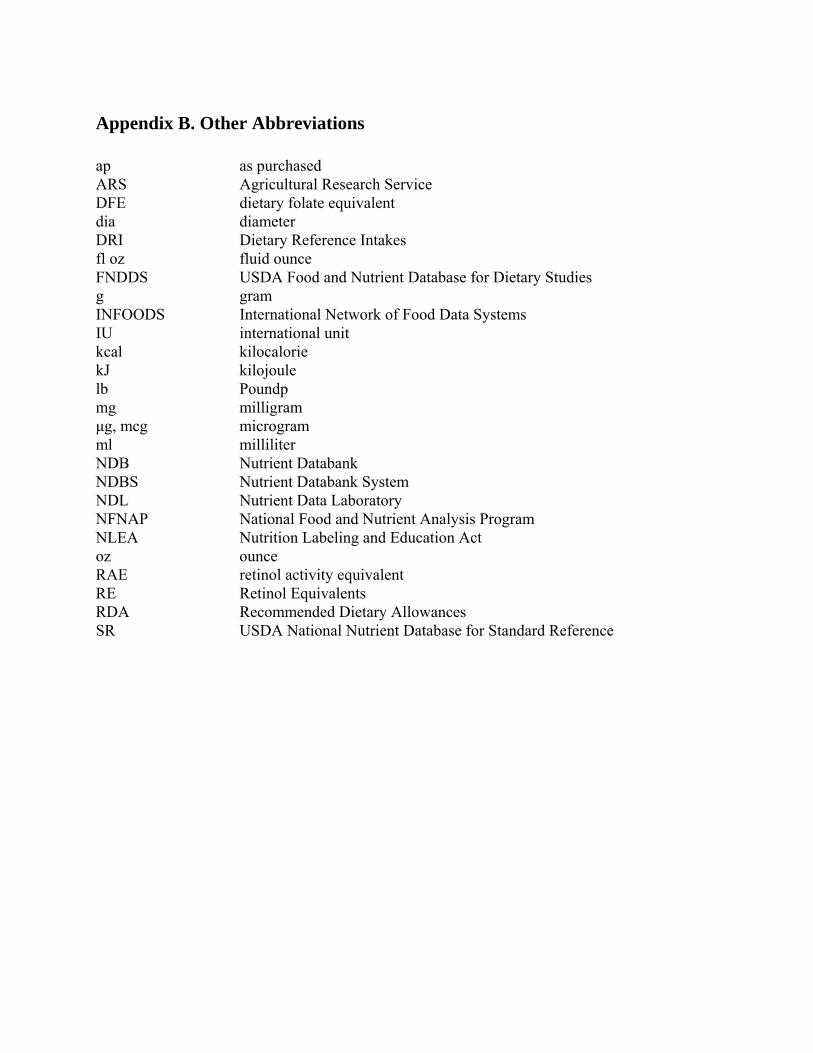
Appendix B. Other Abbreviations ap as purchased ARS Agricultural Research Service DFE dietary folate equivalent dia diameter DRI Dietary Reference Intakes fl oz fluid ounce FNDDS USDA Food and Nutrient Database for Dietary Studies g gram INFOODS International Network of Food Data Systems IU international unit kcal kilocalorie kJ kilojoule lb Poundp mg milligram μg, mcg microgram ml milliliter NDB Nutrient Databank NDBS Nutrient Databank System NDL Nutrient Data Laboratory NFNAP National Food and Nutrient Analysis Program NLEA Nutrition Labeling and Education Act oz ounce RAE retinol activity equivalent RE Retinol Equivalents RDA Recommended Dietary Allowances SR USDA National Nutrient Database for Standard Reference