Embed Size (px)
Citation preview
FY 2004
BUDGET SUMMARY
U. S. DEPARTMENT OF AGRICULTURE
TABLE OF CONTENTS ITEM PAGE
i
INTRODUCTION........................................................................................................... iii FUNDING OVERVIEW ..................................................................................................1 MISSION AREA HIGHLIGHTS....................................................................................4 MISSION AREA/AGENCY DETAILS: FARM AND FOREIGN AGRICULTURAL SERVICES: Farm Service Agency................................................................................................13 Risk Management Agency ........................................................................................23 Foreign Agricultural Service.....................................................................................25 RURAL DEVELOPMENT: Rural Development ...................................................................................................35 Rural Utilities Service...........................................................................................39 Rural Housing Service ..........................................................................................42 Rural Business-Cooperative Service.....................................................................45 FOOD, NUTRITION, AND CONSUMER SERVICES: Food and Nutrition Service .......................................................................................48 FOOD SAFETY: Food Safety and Inspection Service..........................................................................54 NATURAL RESOURCES AND ENVIRONMENT: Natural Resources Conservation Service ..................................................................58 Forest Service............................................................................................................62 MARKETING AND REGULATORY PROGRAMS:
Animal and Plant Health Inspection Service ............................................................68 Agricultural Marketing Service.................................................................................72 Grain Inspection, Packers and Stockyards Administration.......................................74 RESEARCH, EDUCATION, AND ECONOMICS: Agricultural Research Service...................................................................................78 Cooperative State Research, Education, and Extension Service...............................80 Economic Research Service ......................................................................................84 National Agricultural Statistics Service ....................................................................85 DEPARTMENTAL ACTIVITIES ................................................................................87 OFFICE OF THE INSPECTOR GENERAL ................................................................92
TABLE OF CONTENTS ITEM PAGE
ii
HOMELAND SECURITY: Funds Transferred to the Department of Homeland Security ...................................93 APPENDIX: Budget Authority by Agency, 2002-2004.................................................................95 Discretionary Budget Authority by Agency, 2002-2004 ..........................................96 Outlays by Agency, 2002-2004.................................................................................97 Discretionary Budget Outlays by Agency, 2002-2004 .............................................98 Staff Years by Agency, 2002-2004...........................................................................99
2004 User Fee Proposals .........................................................................................100 2004 Proposed Budget-Related Legislation............................................................101
INTRODUCTION
iii
The Budget Summary describes the fiscal year (FY) 2004 budget for the U.S. Department of Agriculture (USDA). All references to years refer to fiscal year, except where specifically noted. The funding estimates presented for FY 2003 are based on the President’s FY 2003 Budget request. Throughout the booklet, “2002 Farm Bill” and “The Act” are used to refer to the Farm Security and Rural Investment Act of 2002. The Summary is organized into six sections: Funding Overview, Mission Area Highlights, Mission Area/Agency Details, Homeland Security and Appendix Tables. Basic budget terminology: ! Program Level represents the gross value of all financial assistance USDA provides to
the public. This assistance may be in the form of grants, guaranteed or direct loans, cost-sharing, professional services such as research or technical assistance activities, or in-kind benefits such as commodities.
! Budget Authority is the authority to commit funds of the Federal Treasury. Congress
provides this authority through annual appropriations acts and substantive legislation which authorizes direct spending. The President's budget requests the Congress to appropriate or otherwise provide an amount of budget authority sufficient to carry out recommended government programs.
! Obligations are commitments of government funds. In order for USDA to make a valid obligation, it must have a sufficient amount of budget authority to cover the obligation. ! Outlays are cash disbursements from the Federal Treasury to satisfy a valid obligation. Program level measures are used in most instances. However, there are some cases when other measures are used and the reader should take care to note which measure is being used. Estimates for 2002 have been adjusted to reflect: a) the impact of supplemental funding provided under Public Law 107-117, the Department of Defense Appropriations Act for Fiscal Year 2002; and b) supplemental funding, offsets and rescissions provided under Public Law 107-206, the 2002 Supplemental Appropriations Act. Finally, the reader should understand that many 2003 estimates are very tentative, especially where programs are sensitive to weather or economic conditions. Questions may be directed to the Office of Budget and Program Analysis via e-mail at [email protected] or telephone at (202) 720-6176.
FUNDING OVERVIEW
1
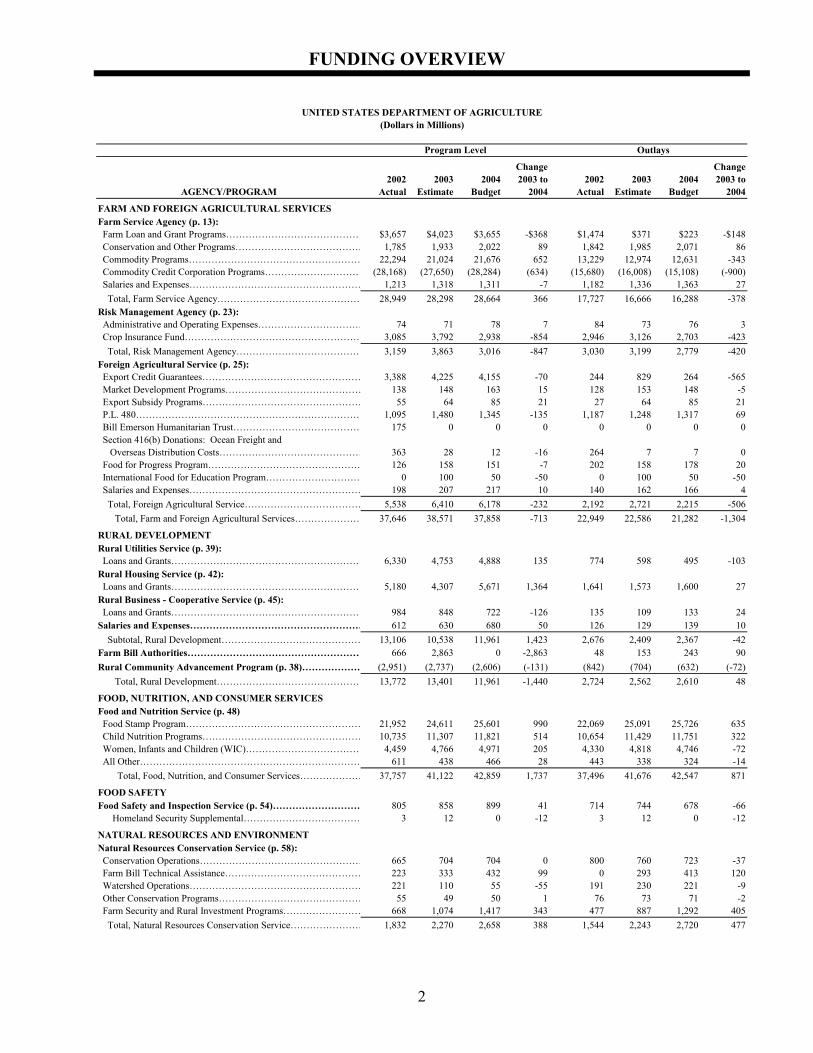
2004 Funding Overview USDA’s 2004 discretionary program outlays are about $20.2 billion, a decrease of $311 million from the 2003 level. The discretionary program outlays are about 27 percent of total USDA outlays and include the Special Supplemental Nutrition Program for Women, Infants and Children (WIC); programs to address agricultural pest and disease threats; rural development; research and education; soil and water conservation technical assistance; management of the National Forests and Grasslands and other Forest Service activities; and domestic and international marketing assistance. Mandatory programs account for the remaining 73 percent of USDA outlays, about $53.9 billion in 2004 which is an increase of $1.7 billion above the 2003 level. These programs provide services as required by law and include the majority of the nutrition assistance programs, commodity programs, export promotion programs and a number of conservation programs. Emergency funds to address natural disasters and respond to terrorist attacks are reflected in USDA outlay trends in 2002 and 2003. In 2002, USDA received $328 million in supplemental funds to respond to the September 11, 2001 terrorist attacks. Funds were primarily targeted to upgrade physical security at various USDA facilities. Carryover from supplemental funding in 2002 affects projected outlays in 2003. The Administration published Food and Agricultural Policy: Taking Stock for the New Century, a set of principles to provide the foundation for meeting current and future challenges in the food and agriculture sector. The document provides a long term view of the agriculture and food system and sets forth the Administration’s principles for efforts and investments to meet the needs of this critical system. In addition, the Department recently completed its Strategic Plan for 2002-2007. The Strategic Plan identifies key policy and management objectives that are integrated with USDA’s budget priorities. References to these documents are made throughout this Budget Summary.
FUNDING OVERVIEW
2
UNITED STATES DEPARTMENT OF AGRICULTURE(Dollars in Millions)
Program Level Outlays
Change Change2002 2003 2004 2003 to 2002 2003 2004 2003 to
AGENCY/PROGRAM Actual Estimate Budget 2004 Actual Estimate Budget 2004
FARM AND FOREIGN AGRICULTURAL SERVICESFarm Service Agency (p. 13): Farm Loan and Grant Programs…………………………………… $3,657 $4,023 $3,655 -$368 $1,474 $371 $223 -$148 Conservation and Other Programs………………………………… 1,785 1,933 2,022 89 1,842 1,985 2,071 86 Commodity Programs……………………………………………… 22,294 21,024 21,676 652 13,229 12,974 12,631 -343 Commodity Credit Corporation Programs………………………… (28,168) (27,650) (28,284) (634) (15,680) (16,008) (15,108) (-900) Salaries and Expenses……………………………………………… 1,213 1,318 1,311 -7 1,182 1,336 1,363 27 Total, Farm Service Agency……………………………………… 28,949 28,298 28,664 366 17,727 16,666 16,288 -378Risk Management Agency (p. 23): Administrative and Operating Expenses…………………………… 74 71 78 7 84 73 76 3 Crop Insurance Fund……………………………………………… 3,085 3,792 2,938 -854 2,946 3,126 2,703 -423 Total, Risk Management Agency………………………………… 3,159 3,863 3,016 -847 3,030 3,199 2,779 -420Foreign Agricultural Service (p. 25): Export Credit Guarantees…………………………………………… 3,388 4,225 4,155 -70 244 829 264 -565 Market Development Programs…………………………………… 138 148 163 15 128 153 148 -5 Export Subsidy Programs…………………………………………… 55 64 85 21 27 64 85 21 P.L. 480…………………………………………………………… 1,095 1,480 1,345 -135 1,187 1,248 1,317 69 Bill Emerson Humanitarian Trust………………………………… 175 0 0 0 0 0 0 0 Section 416(b) Donations: Ocean Freight and Overseas Distribution Costs……………………………………… 363 28 12 -16 264 7 7 0 Food for Progress Program………………………………………… 126 158 151 -7 202 158 178 20 International Food for Education Program………………………… 0 100 50 -50 0 100 50 -50 Salaries and Expenses……………………………………………… 198 207 217 10 140 162 166 4 Total, Foreign Agricultural Service……………………………… 5,538 6,410 6,178 -232 2,192 2,721 2,215 -506 Total, Farm and Foreign Agricultural Services………………… 37,646 38,571 37,858 -713 22,949 22,586 21,282 -1,304
RURAL DEVELOPMENTRural Utilities Service (p. 39): Loans and Grants…………………………………………………… 6,330 4,753 4,888 135 774 598 495 -103Rural Housing Service (p. 42): Loans and Grants…………………………………………………… 5,180 4,307 5,671 1,364 1,641 1,573 1,600 27Rural Business - Cooperative Service (p. 45): Loans and Grants…………………………………………………… 984 848 722 -126 135 109 133 24Salaries and Expenses……………………………………………… 612 630 680 50 126 129 139 10 Subtotal, Rural Development……………………………………… 13,106 10,538 11,961 1,423 2,676 2,409 2,367 -42Farm Bill Authorities……………………………………………… 666 2,863 0 -2,863 48 153 243 90Rural Community Advancement Program (p. 38)……………… (2,951) (2,737) (2,606) (-131) (842) (704) (632) (-72) Total, Rural Development……………………………………… 13,772 13,401 11,961 -1,440 2,724 2,562 2,610 48
FOOD, NUTRITION, AND CONSUMER SERVICESFood and Nutrition Service (p. 48) Food Stamp Program……………………………………………… 21,952 24,611 25,601 990 22,069 25,091 25,726 635 Child Nutrition Programs…………………………………………… 10,735 11,307 11,821 514 10,654 11,429 11,751 322 Women, Infants and Children (WIC)……………………………… 4,459 4,766 4,971 205 4,330 4,818 4,746 -72 All Other…………………………………………………………… 611 438 466 28 443 338 324 -14 Total, Food, Nutrition, and Consumer Services………………… 37,757 41,122 42,859 1,737 37,496 41,676 42,547 871
FOOD SAFETYFood Safety and Inspection Service (p. 54)……………………… 805 858 899 41 714 744 678 -66 Homeland Security Supplemental……………………………… 3 12 0 -12 3 12 0 -12
NATURAL RESOURCES AND ENVIRONMENTNatural Resources Conservation Service (p. 58): Conservation Operations…………………………………………… 665 704 704 0 800 760 723 -37 Farm Bill Technical Assistance…………………………………… 223 333 432 99 0 293 413 120 Watershed Operations……………………………………………… 221 110 55 -55 191 230 221 -9 Other Conservation Programs……………………………………… 55 49 50 1 76 73 71 -2 Farm Security and Rural Investment Programs…………………… 668 1,074 1,417 343 477 887 1,292 405 Total, Natural Resources Conservation Service…………………… 1,832 2,270 2,658 388 1,544 2,243 2,720 477
FUNDING OVERVIEW
3
UNITED STATES DEPARTMENT OF AGRICULTURE(Dollars in Millions)
Program Level Outlays
Change Change2002 2003 2004 2003 to 2002 2003 2004 2003 to
AGENCY/PROGRAM Actual Estimate Budget 2004 Actual Estimate Budget 2004
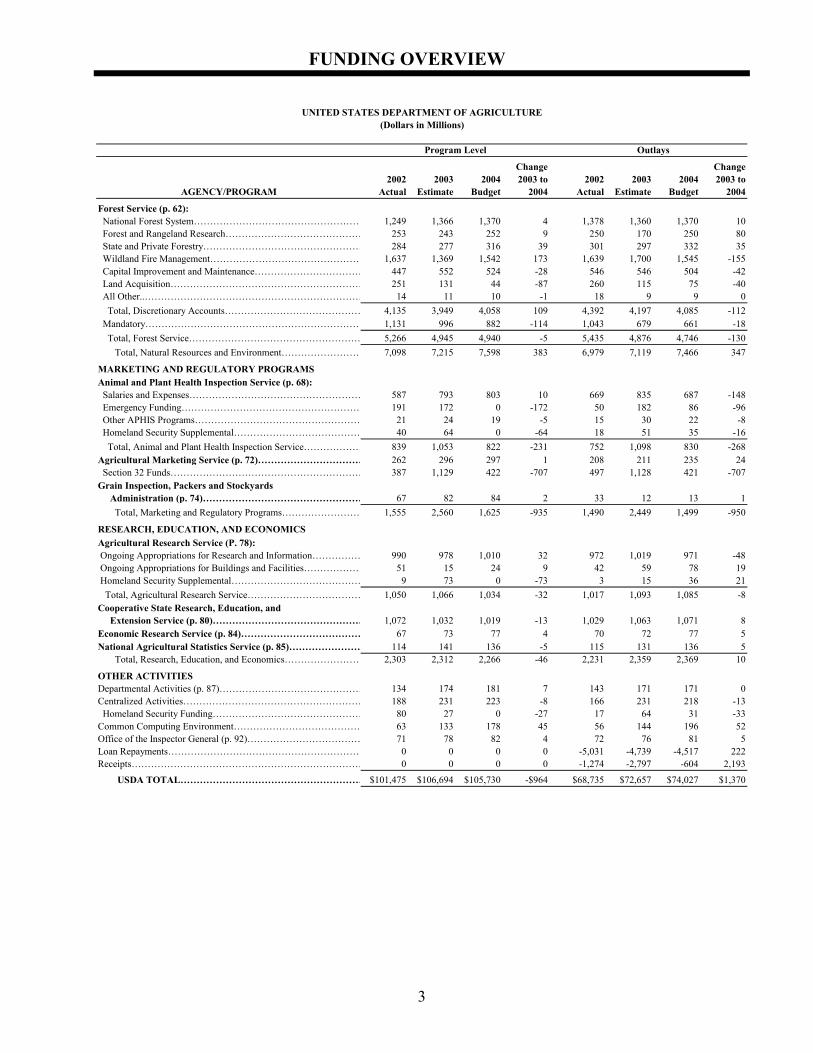
Forest Service (p. 62): National Forest System……………………………………………… 1,249 1,366 1,370 4 1,378 1,360 1,370 10 Forest and Rangeland Research…………………………………… 253 243 252 9 250 170 250 80 State and Private Forestry…………………………………………… 284 277 316 39 301 297 332 35 Wildland Fire Management………………………………………… 1,637 1,369 1,542 173 1,639 1,700 1,545 -155 Capital Improvement and Maintenance…………………………… 447 552 524 -28 546 546 504 -42 Land Acquisition…………………………………………………… 251 131 44 -87 260 115 75 -40 All Other..…………………………………………………………… 14 11 10 -1 18 9 9 0 Total, Discretionary Accounts…………………………………… 4,135 3,949 4,058 109 4,392 4,197 4,085 -112 Mandatory…………………………………………………………… 1,131 996 882 -114 1,043 679 661 -18 Total, Forest Service……………………………………………… 5,266 4,945 4,940 -5 5,435 4,876 4,746 -130 Total, Natural Resources and Environment……………………… 7,098 7,215 7,598 383 6,979 7,119 7,466 347
MARKETING AND REGULATORY PROGRAMSAnimal and Plant Health Inspection Service (p. 68): Salaries and Expenses……………………………………………… 587 793 803 10 669 835 687 -148 Emergency Funding………………………………………………… 191 172 0 -172 50 182 86 -96 Other APHIS Programs…………………………………………… 21 24 19 -5 15 30 22 -8 Homeland Security Supplemental………………………………… 40 64 0 -64 18 51 35 -16 Total, Animal and Plant Health Inspection Service……………… 839 1,053 822 -231 752 1,098 830 -268Agricultural Marketing Service (p. 72)…………………………… 262 296 297 1 208 211 235 24 Section 32 Funds…………………………………………………… 387 1,129 422 -707 497 1,128 421 -707Grain Inspection, Packers and Stockyards Administration (p. 74)…………………………………………… 67 82 84 2 33 12 13 1 Total, Marketing and Regulatory Programs…………………… 1,555 2,560 1,625 -935 1,490 2,449 1,499 -950
RESEARCH, EDUCATION, AND ECONOMICSAgricultural Research Service (P. 78): Ongoing Appropriations for Research and Information…………… 990 978 1,010 32 972 1,019 971 -48 Ongoing Appropriations for Buildings and Facilities……………… 51 15 24 9 42 59 78 19 Homeland Security Supplemental…………………………………… 9 73 0 -73 3 15 36 21 Total, Agricultural Research Service……………………………… 1,050 1,066 1,034 -32 1,017 1,093 1,085 -8Cooperative State Research, Education, and Extension Service (p. 80)………………………………………… 1,072 1,032 1,019 -13 1,029 1,063 1,071 8Economic Research Service (p. 84)………………………………… 67 73 77 4 70 72 77 5National Agricultural Statistics Service (p. 85)…………………… 114 141 136 -5 115 131 136 5 Total, Research, Education, and Economics…………………… 2,303 2,312 2,266 -46 2,231 2,359 2,369 10
OTHER ACTIVITIESDepartmental Activities (p. 87)……………………………………… 134 174 181 7 143 171 171 0Centralized Activities………………………………………………… 188 231 223 -8 166 231 218 -13 Homeland Security Funding………………………………………… 80 27 0 -27 17 64 31 -33Common Computing Environment………………………………… 63 133 178 45 56 144 196 52Office of the Inspector General (p. 92)……………………………… 71 78 82 4 72 76 81 5Loan Repayments…………………………………………………… 0 0 0 0 -5,031 -4,739 -4,517 222Receipts……………………………………………………………… 0 0 0 0 -1,274 -2,797 -604 2,193
USDA TOTAL………………………………………………… $101,475 $106,694 $105,730 -$964 $68,735 $72,657 $74,027 $1,370
MISSION AREA HIGHLIGHTS
4
The Department’s 2004 budget supports achievement of its Strategic Goals as follows: • Enhance economic opportunities for agricultural producers. • Support increased economic opportunities and improved quality of life in rural America. • Enhance protection and safety of the Nation’s agriculture and food supply. • Improve the Nation’s nutrition and health. • Protect and enhance the Nation’s natural resource base and environment. Following are mission area highlights of the Department’s budget proposals in support of these goals: FARM AND FOREIGN AGRICULTURAL SERVICES This mission area supports expanded economic and trade opportunities for agricultural producers through commodity and income support, export promotion, farm credit, risk management, and related programs. These programs provide a safety net to enhance the long-term economic vitality of American farmers and ranchers. The Department’s 2004 budget supports the requirements of the Farm Security and Rural Investment Act of 2002 (Farm Bill) which, combined with a strong crop insurance program, provides a strong market-oriented economic safety net for farmers. The budget also supports the Administration’s international trade initiatives to strengthen the economic viability and global leadership of our diverse food and agriculture system. In addition, the Department’s budget supports the strengthened complementary conservation programs to promote environmentally sound land management which were provided by the Farm Bill. The 2004 budget includes resources to:
• Administer the Farm Bill’s farm programs. The Farm Bill, enacted in 2002, expands the
farm income and commodity support programs of the Commodity Credit Corporation (CCC) to include new counter-cyclical programs and reformed programs for peanuts and other commodities. It also expands the Department’s conservation programs. The budget provides $1.3 billion within FSA for continued administration of the Farm Bill programs.
• Enhance the opportunities for family farmers to obtain adequate credit to maintain
their farming operations. The budget proposes a total loan level of $3.7 billion for direct and guaranteed farm loans. Funding has been reallocated to provide additional direct loans to accommodate the recent demand for such loans. This level of funding is expected to provide operating loans to about 25,000 farmers and ownership loans to about 4,700 people. (See page 14.)
• Strengthen crop insurance delivery to ensure that farmers have access to sound risk
management tools. USDA’s crop insurance program provides roughly $38 billion of risk
MISSION AREA HIGHLIGHTS
5
management protection for the Nation’s farmers against price and production losses. Crop insurance is delivered by private insurance companies which are reimbursed for their delivery expense. In addition, the insurance providers are able to earn underwriting gains on those policies for which they retain the risk of losses. While participation in the crop insurance program is voluntary, participation is encouraged by subsidizing the premium paid by farmers for coverage. As a result of this subsidy, participation in the program is about 78 percent of the Nation’s planted acres. In addition, producers have begun purchasing higher levels of protection than in past years. As a result of increased levels of protection, the average premium per policy has risen from about $1,500 in 1998 to about $2,300 in 2004. Consequently, the amount that companies are reimbursed for their delivery expenses has increased dramatically, while their workload, as measured by the number of policies sold, has changed very little. The budget proposes to cap the amount that companies may be reimbursed for their delivery expenses at 20 percent of the total premium. This proposal is expected to save about $68 million. In addition, drought conditions throughout much of the country resulted in higher than expected indemnities for the 2002 crop year. Due to the timing of the crop cycle, the majority of those indemnities will be paid out during the 2003 fiscal year. The 2004 indemnities reflect the statutory loss ratio of 1.075, resulting in total Government costs of about $3 billion compared to $3.9 billion in 2003. (See page 23.)
• Support the Department’s strategic goal of expanding international marketing
opportunities by providing a total program level of nearly $6.2 billion for the Department’s international programs and activities. The budget includes a program level of $4.2 billion for CCC export credit guarantee programs, relatively unchanged from the current estimate for 2003. Funding for market development programs, including the Market Access Program and Cooperator Program, is increased to $163 million, consistent with provisions of the 2002 Farm Bill. The budget also provides a program level of $28 million for the Export Enhancement Program and $57 million for the Dairy Export Incentive Program. The budget supports a nearly $1.6 billion program level for U.S. foreign food assistance activities. This includes just over $1.3 billion for P.L. 480 programs and $50 million for the new McGovern-Dole International Food for Education and Child Nutrition Program. Funding for the Foreign Agricultural Service (FAS) is increased by nearly $10 million in order to support a number of trade-related initiatives, including a trade capacity building initiative and a USDA contribution to the Montreal Protocol Multilateral Fund. The FAS budget also includes funding of $5 million for the Cochran Fellowship Program. Funding of $6.6 million is also provided for a cross-cutting trade negotiation and biotechnology fund in the Office of the Secretary to support agencies’ work in addressing overseas trade barriers. (See page 25.)
RURAL DEVELOPMENT Rural Development helps local and regional economies create economic growth and improve the quality of life. The financial and technical assistance Rural Development provides is the catalyst, or venture capital, needed to stimulate the economy of rural communities. The mission of Rural Development is to stimulate new opportunities that result in decent, safe, affordable housing, the establishment of rural businesses and community facilities, the development of
MISSION AREA HIGHLIGHTS
6
modern and affordable water and waste water services, and the improvement of electric and telecommunications services, all of which lead to an improved rural quality of life. The 2004 budget requests $2.3 billion in budget authority to support $11.3 billion in direct loans, loan guarantees, grants, and technical assistance, and to pay administrative expenses. Highlights of the request include: • Support for about 49,000 home ownership opportunities in rural America. The budget
request supports $1.4 billion in direct loans and $2.7 billion in guaranteed loans for decent, safe, affordable single family housing. This funding will improve the availability and quality of housing for some of the poorest families in the country. The direct loan level is over $400 million above the 2003 level. This increase supports the President’s Initiative on Increasing Homeownership, particularly among minorities. (See page 42.)
• A program level of nearly $1.5 billion for water and waste water loans and grants. This
program provides financing for rural communities to establish, expand or modernize water treatment and waste disposal facilities. Greater emphasis is placed on loans rather than grants for financing water and waste disposal projects. Recent declines in interest rates have reduced the cost of loan financing, so that projects can be supported at a higher loan to grant ratio without increasing user costs. Further, the mandatory funding provided by the 2002 Farm Bill was used primarily to serve poverty level communities that required mostly grants. Applications received since then are more heavily weighted toward communities with more income.
FOOD, NUTRITION, AND CONSUMER SERVICES Programs in this mission area are designed to promote the good nutrition and health of Americans by providing resources to low-income families for food and by promoting proper nutrition and physical activity. The 2004 budget reflects our commitment to the nutrition safety net by including a record $42.9 billion for domestic nutrition assistance programs. This amount funds the projected needs of the Food Stamp, Child Nutrition, WIC, and other related programs. Recent studies indicate that overweight and obesity in the United States are at an all time high. In response to this growing epidemic, in 1999 FNS funded Fit WIC, a multi-state project to determine how WIC can be more responsive to the problem of childhood obesity. The Fit WIC Projects were three-year projects to look at ways that WIC policies, practices and operations might be changed to make the program more responsive to the problem of childhood obesity. An increase of $5 million is proposed to expand this effort by establishing WIC Childhood Obesity Prevention Demonstration Projects. During 2003, reauthorization of the Child Nutrition Programs and the WIC Program will be addressed, including a new system to improve the accuracy of eligibility determinations for free and reduced price school meals. (See page 48.) Highlights of the 2004 domestic nutrition assistance budget include: • Support for an estimated 21.6 million food stamp participants. The budget supports an
increase in participation of 0.9 million over 2003 and 2.5 million over 2002, increases of about 4.3 percent and almost 13.1 percent, respectively. The 2004 budget for the Food Stamp Program is $24.2 billion, an increase of $1 billion above 2003 and $3.6 billion above
MISSION AREA HIGHLIGHTS
7
2002. In addition, the budget proposes a $2 billion contingency fund to cover unanticipated increases in participation. Funding is also included for food stamp nutrition education and activities to inform eligible non-participants of the availability of food stamp benefits. The Food Distribution Program on Indian Reservations, Nutrition Assistance for Puerto Rico and American Samoa are also funded.
• Support for a monthly average of 7.8 million low-income, nutritionally at risk WIC
participants. The President’s budget requests a $43 million increase in budget authority. This brings total funds available for WIC in the 2004 budget to a level of nearly $5 billion; a program-level increase of $205 million above 2003 and $512 million over 2002. WIC has grown to be a vital part of the nutrition safety net, providing better nutrition and a gateway to healthcare for needy participants during the stage in life when such assistance can make the most difference. The request provides for projected increases in program demand due to the softening economy and a modest increase in food costs. In addition, the budget proposes a $150 million contingency fund to cover unanticipated increases in participation. Included in the request is $30 million for State management information system improvements, $20 million to support breastfeeding promotion through peer counselors, and $5 million for the WIC Childhood Obesity Prevention Demonstration Projects.
• Support balanced meals for school children via the School Lunch Program serving an
average of 29.1 million children each day, and the School Breakfast Program which serves 9.1 million children each day. The 2004 budget funds the Child Nutrition Programs at a program level of $11.8 billion, an increase of $514 million above 2003. This level provides an increase to meet projected participation growth and for food cost inflation. The School Lunch Program projects 4.9 billion reimbursable meals in 2004, an increase of 1.6 percent over the 2003 level. The Child Nutrition Programs are due to be reauthorized in 2004. As part of the reauthorization, the Administration supports establishing a new system to improve the accuracy of eligibility determinations for free and reduced price school meals.
FOOD SAFETY This mission area ensures that the Nation’s meat, poultry and processed egg product supply is safe, wholesome and properly labeled, and oversees the work of the U.S. Manager for Codex Alimentarius (a commission that develops international food safety standards). Implementation of the Pathogen Reduction/Hazard Analysis and Critical Control Point (HACCP) final rule has contributed to a reduction in the incidence of pathogens in meat and poultry and related foodborne illnesses. Continued implementation of science-based inspection systems and improved inspector training, tools, and information will enable inspectors to better evaluate the food safety hazards that threaten the food supply. For 2004, the budget includes: • A program level of $899 million for ensuring the safety of the meat, poultry, and egg
products supply. Additional funding of $29 million is requested for increased inspector staffing, expanded oversight of foreign meat and poultry inspection systems, microbiological testing, enhanced inspector training, and consumer education. The budget includes the resources necessary to fund approximately 7,680 meat, poultry, and egg products inspectors, an increase of 80 inspectors over 2003 for industry growth. FSIS will continue to evaluate
MISSION AREA HIGHLIGHTS
8
the costs and benefits associated with expanding the use of more efficient inspection processes. Funding will also be used to increase the number of audits of foreign programs to ensure that they apply the same standards as in the United States. Microbiological testing will be increased to ensure that establishments are effectively controlling or eliminating the presence of pathogens in products and to measure FSIS performance in achieving its goal of reducing foodborne illnesses. Inspector training opportunities will be expanded to enhance consistency and effectiveness of inspection. Funding is also requested to design a mass media campaign aimed at improving the safe food handling practices of consumers.
• User fees. Under the 2004 budget, legislation will be proposed to recover $122 million
annually by collecting user fees for the cost of providing inspection services beyond an approved eight-hour primary shift. (See page 54.)
NATURAL RESOURCES AND ENVIRONMENT The Natural Resources and Environment mission area promotes conservation and sustainable use of natural resources on the Nation’s private lands through education, technical and financial assistance. The mission area is also responsible for meeting public demands for recreation, timber and other goods and services through management of approximately 192 million acres of National Forests and grasslands. The Administration is committed to preserving natural resources for future generations through assistance to farmers, ranchers and other private landowners and through sound management of public lands. The budgets for NRCS (see page 58) and Forest Service (see page 62) programs include resources to: • Provide technical and financial assistance to enhance the conservation of natural
resources. The USDA budget includes $704 million for NRCS conservation operations and $432 million in a new account to fund technical assistance needed to implement the Farm Bill conservation programs. These funding levels will support the technical assistance needs of the expanding farm bill programs; they will also enable continued support for the agency’s locally led, voluntary conservation effort including ongoing high priority activities such as grazing lands assistance and the development of waste management plans for animal feeding operations. Further, they will enable selected increases in certain other areas that need attention including addressing air quality needs, establishing a more thorough monitoring and evaluation regimen for the farm bill conservation programs, and enhancing the Customer Service Toolkit which provides NRCS field staff with the geographic data and technical tools that they need to adequately deliver farm bill conservation and other field programs. For the watershed programs, the budget does not request funding for the Emergency Watershed Protection program in view of the difficulty in accurately predicting emergency spending from one year to the next. Instead, the budget includes $45 million to support ongoing watershed planning and implementation activities and $10 million to address the rehabilitation needs of aging dams built with USDA assistance
• Reduce the risk of wildland fires to communities and the environment by implementing
the President’s Healthy Forest Initiative. The Department is committed to a ten-year interagency, intergovernmental strategy to reduce risk and damaging effects to resources and communities from wildland fire. As part of improving the health of the land, the Department
MISSION AREA HIGHLIGHTS
9
is dedicated to implementing the President’s Healthy Forests Initiative. The 2004 budget includes approximately $1.57 billion in funding for the National Fire Plan, an increase of about $173 million above the 2003 level. The 2004 budget for the National Fire Plan includes $231 million for hazardous fuels reduction on 1.3 million acres, $610 million for fire preparedness, and $605 million for suppression activities. The Department will take the necessary steps to address concerns about the rising costs of fighting fire and the reporting of fire obligations. The Forest Service and the Department of Interior plan on: developing cost containment strategies; revising procedures to improve the reporting of fire suppression spending; reviewing the cost-effectiveness of large fire aviation resources; and assessing the consistency of state cost-share agreements.
• Enhance the ability of the National Forest System to meet multiple demands. A total of
$1.37 billion is proposed for management of the National Forests. The budget includes an additional $7 million to enhance the management of grazing on National Forest System lands. Funding for management of the National Forests includes $268 million to support a timber sales offer level of approximately 2.0 billion board feet (bbf) depending on salvage sales volume. In 2003, 2.0 bbf are programmed to be offered for sale. In addition, the budget proposes legislation to create a permanent recreation fee program.
MARKETING AND REGULATORY PROGRAMS The mission of Marketing and Regulatory Programs is to facilitate and expand the domestic and international marketing of U.S. agricultural products, to help protect the agricultural sector from plant and animal health threats, and to ensure humane care and treatment of certain animals. These programs provide the basic infrastructure to improve agricultural market competitiveness for the benefit of both consumers and producers of American agriculture. The budget proposes funding to: • Protect American agriculture from threats to plant and animal industries. The 2004
budget proposes a program level for operations of the Animal and Plant Health Inspection Service (APHIS) of $803 million, $10 million above the comparable 2003 estimate. Notable increases would fund a doubling of efforts against chronic wasting disease, increase the availability of foot-and-mouth disease vaccines to protect against a potential outbreak, fund a low-pathogenic avian influenza program, enhance the ability to track animals and animal products entering and leaving the country, protect against introduction of tropical bont tick (a vector for heartwater disease in livestock), and expand regulatory enforcement. Further, biosecurity and physical and operational security efforts would be bolstered, as would veterinary biologic and diagnostic support for the livestock sector. About $32 million would be reduced from specific pest and disease management programs assuming additional cost-sharing between USDA and cooperators for emergency pest and disease outbreaks. Funding and staff associated with border inspections from outside the United States and territories and some funding for the Foreign Animal Disease Diagnostic Laboratory at Plum Island, New York, are part of the Department of Homeland Security and are not included in these numbers in any years. (See page 68.)
MISSION AREA HIGHLIGHTS
10
• Encourage competitive, efficient markets. The Grain Inspection, Packers and Stockyards Administration (GIPSA) program level request totals $84 million. It includes funding to implement a new pilot program to audit the top four steer and heifer meatpackers. These new audits are anticipated to result in substantially better financial protection to the regulated industries through heightened scrutiny of the Top Four. The request would also provide funds to review the Packers and Stockyards Act and enhance compliance. The budget proposes to charge fees to packers, live poultry dealers, swine contractors, poultry processors, stockyard owners, market agencies and dealers regulated under the Packers and Stockyards Act to fund the Packers and Stockyards program. The budget also proposes user fees to recover costs associated with developing, reviewing, and maintaining official U.S. grain standards used by the grain industry. (See page 74.)
RESEARCH, EDUCATION, AND ECONOMICS (REE) The Research, Education, and Economics (REE) mission area and its four agencies have Federal leadership responsibility for the creation and dissemination of knowledge spanning the biological, physical, and social sciences related to agricultural and food research, economic analysis, statistics, extension, and higher education. Through its programs, REE enhances the U.S. position as a global leader in a highly competitive food and fiber system; promotes sustainable agricultural practices in harmony with the environment; and contributes to thriving rural communities and well-informed consumers. Total program level for the REE agencies in 2004 is estimated at $2.3 billion. The 2004 budget follows the general pattern of the 2003 budget with reductions in earmarked programs and selected lower priority work to finance higher levels for competitively awarded grants and other high priority program increases. Highlights in the REE budget include: • Supporting competitive research for fundamental and applied sciences in agriculture.
The National Research Initiative (NRI), the Nation’s premier competitive peer reviewed research program for fundamental and applied sciences in agriculture, is funded at $200 million which, while less than the 2003 budget proposal, is nonetheless a significant increase from recent actual appropriations. Major NRI initiatives include plant and animal diseases, biosecurity, genomics, and food and nutrition. Additionally, the NRI will support the training and education of the next generation of agricultural scientists and will enable USDA to forge increased partnerships with other Federal agencies on research topics of mutual interest.
• Advancing agricultural genomic research. Harnessing the inherent potential of genetic
resources holds the promise for effectively meeting many of the challenges facing agriculture. More rapid and efficient methods are required to characterize, identify and manipulate useful properties of genes and genomes to address these challenges. Mapping and sequencing projects financed by ARS and CSREES will be coordinated with ongoing genomics initiatives funded by other Federal agencies—NIH, NSF, and DOE—and facilitated by interagency workgroups. The interagency workgroup on animal genomics is chaired by the USDA Under Secretary for Research, Education, and Economics. These Federal agencies have assigned high priority to sequencing genomes of agriculturally-important species and USDA funds will be highly leveraged as these mapping and
MISSION AREA HIGHLIGHTS
11
sequencing projects move forward. To complement the biological and bioinformatics research, ERS will undertake a program of data collection and economic analysis to inform policy decisions as to the implications of genomic advances for consumer behavior, farm and food industry structure, and agricultural trade.
• Protecting agriculture and U.S. trade from terrorism and emerging and exotic diseases.
Because of its size, complexity, and integration, U.S. agriculture is uniquely vulnerable to highly infectious disease and pests, particularly foreign diseases. Increases of $8 million in the ARS budget will support research to develop more sensitive and rapid on-site diagnostic tests, vaccines, and work on emerging diseases of poultry and swine. The CSREES budget includes $16 million to support the non-Federal laboratories in the new unified Federal-State diagnostic network established in 2002 to reinforce and supplement the Federal diagnostic facilities maintained by APHIS. An ERS increase of $1 million will support continuing development, delivery, and maintenance of the Security Analysis System for U.S. Agriculture, a decision support system designed to improve USDA’s ability to mitigate security threats and attacks to the Nation’s agriculture and food supply.
• Providing continued support for core university-based research. The Cooperative State
Research, Education, and Extension Service (CSREES) programs provide funding for research and extension activities at the 1862, 1890 historically Black and 1994 Tribal Land-Grant schools and foster interstate cooperation and Federal collaboration in planning and conducting agricultural research and extension. CSREES is the lead Federal agency for linking teaching, research and extension in the food and agricultural sciences. The 2004 budget maintains current levels for the important formula programs at the 1862 institutions and proposes increases for the 1890 formula programs in recognition of the higher authorization levels for these programs enacted in the 2002 Farm Bill. Increases are also proposed for CSREES graduate fellowships and for grants to Native American serving institutions.
• Census of Agriculture. The National Agricultural Statistics Service’s (NASS) Census of
Agriculture provides comprehensive data on the agricultural economy with National, State, and county level details. The budget includes a decrease of $16.5 million and 27 staff years, reflecting the normal change in activity levels due to the cyclical nature of the 5-year census program. The available funding includes monies to analyze, summarize, and disseminate the 2002 Census. The request also includes funding for follow-on activities which were not previously included in the base projections, the Farm and Ranch Irrigation Survey and the Census of Horticultural Specialties, as well as for enhanced list maintenance activities between census data collection years to ensure a high level of coverage.
• Improved Agricultural Estimates. The requested increase of $4.8 million and 29 staff
years will help restore and modernize NASS’s core survey and estimation program which covers most agricultural commodities produced in the U.S., as well as economic, environmental and rural data. In addition, an increase of $1.6 million for the NASS Locality-based Agricultural County Estimation Program is requested to continue improvements begun in 2003. These statistical programs are critical in meeting the needs of USDA for a multitude of programs, including the calculation of 2002 Farm Bill national countercyclical payment
MISSION AREA HIGHLIGHTS
12
rates as well as the calculation of county loan rates and national loan deficiency payments. Other users that rely on the data from these statistical programs include the Environmental Protection Agency, the Department of Labor, bankers, brokers, university research institutions and trade associations.
MANAGEMENT AND DEPARTMENTAL ACTIVITIES
The Department is committed to implementing the President’s Management Agenda and making other reforms needed to make the Department an efficient, effective and discrimination-free organization that provides improved customer service and more effective stewardship of taxpayer funds. The Department recently has made significant progress in improving management: • The Department’s new Strategic Plan includes 5 strategic goals which will be used to
communicate and drive programmatic, budget and management priorities. This plan was used to help develop the 2004 budget request.
• The Department received its first-ever unqualified or “clean” opinion on the 2002 financial
statements, and all of the Department’s agencies now use a single financial information system that meets Federal standards.
• USDA’s customers can increasingly conduct business with the Department online, saving
them and the Department time and money over the long-term. • The Department is establishing an Office of the Assistant Secretary for Civil Rights. This
office is fully funded in the budget request. The 2004 budget builds upon that progress by continuing funding levels for the Departmental Offices and Executive Operations and providing key funding increases needed to: strengthen homeland security coordination and planning; modernize the common information systems used by the Service Center Agencies (FSA, NRCS and RD) and RMA; increase the Department’s ability to reach all customers with program information; and renovate the Department’s South Building.
FARM AND FOREIGN AGRICULTURAL SERVICES
13
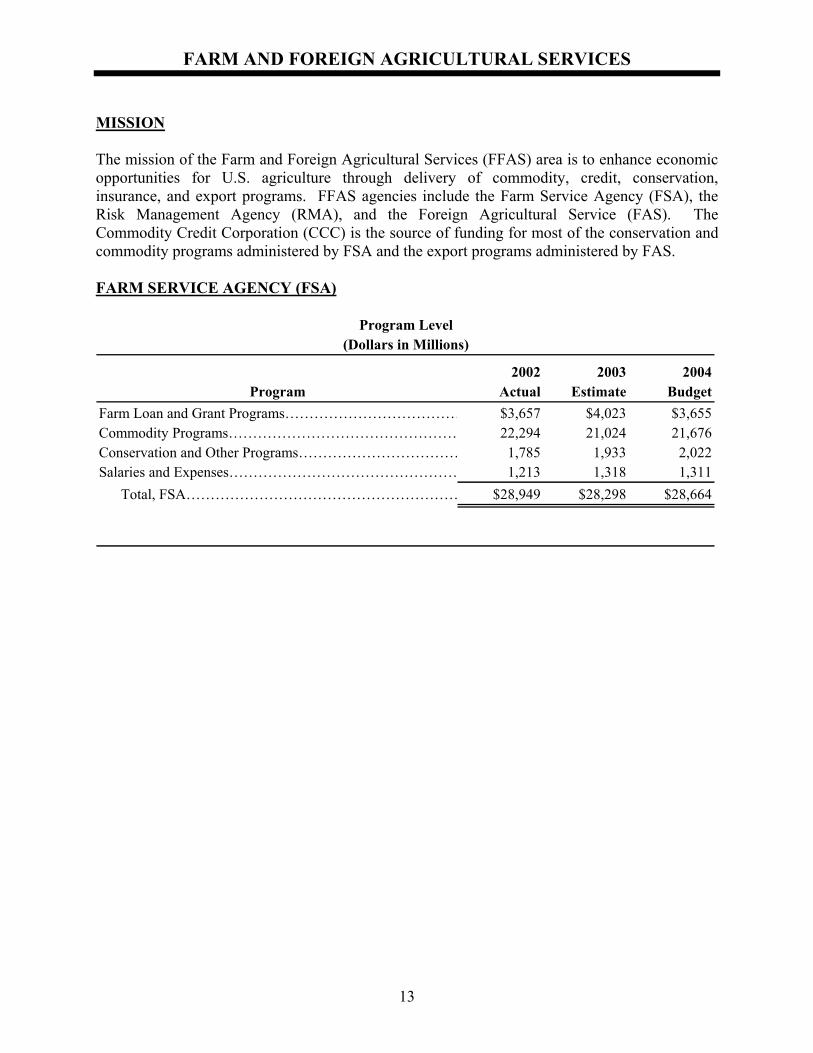
MISSION The mission of the Farm and Foreign Agricultural Services (FFAS) area is to enhance economic opportunities for U.S. agriculture through delivery of commodity, credit, conservation, insurance, and export programs. FFAS agencies include the Farm Service Agency (FSA), the Risk Management Agency (RMA), and the Foreign Agricultural Service (FAS). The Commodity Credit Corporation (CCC) is the source of funding for most of the conservation and commodity programs administered by FSA and the export programs administered by FAS. FARM SERVICE AGENCY (FSA)
Program Level(Dollars in Millions)
2002 2003 2004Program Actual Estimate Budget
Farm Loan and Grant Programs……………………………… $3,657 $4,023 $3,655Commodity Programs………………………………………… 22,294 21,024 21,676Conservation and Other Programs…………………………… 1,785 1,933 2,022Salaries and Expenses………………………………………… 1,213 1,318 1,311 Total, FSA………………………………………………… $28,949 $28,298 $28,664
FARM AND FOREIGN AGRICULTURAL SERVICES
14
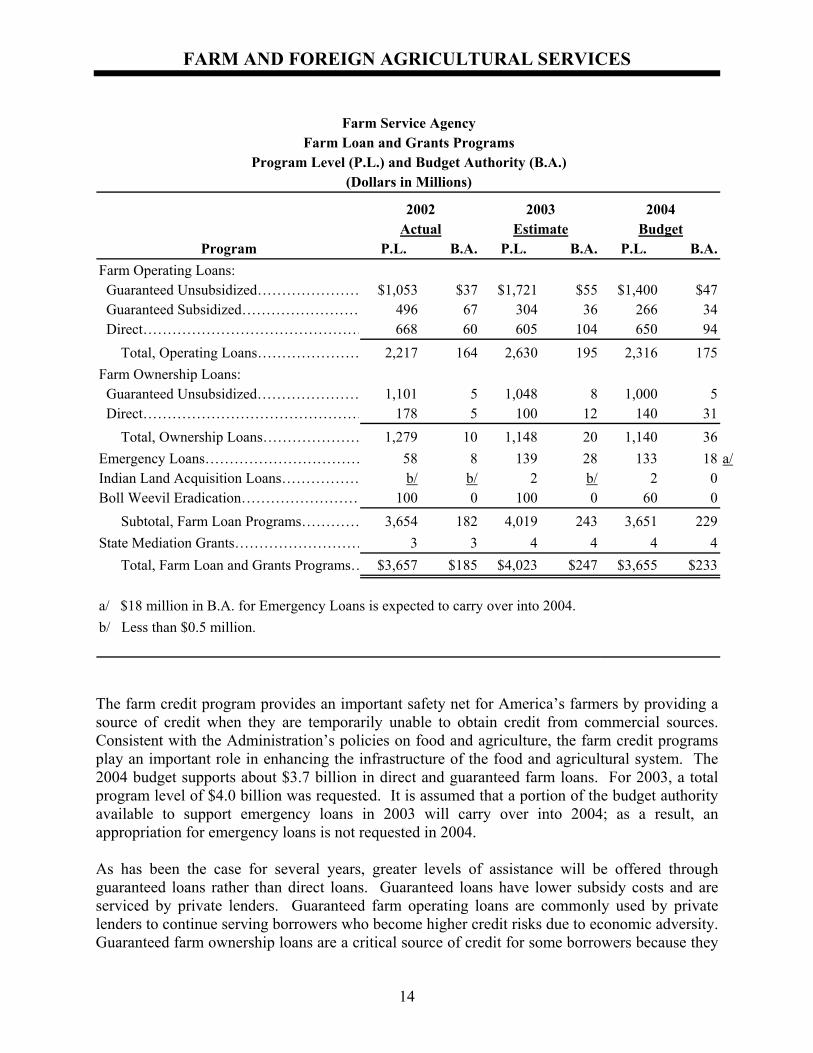
Farm Service AgencyFarm Loan and Grants Programs
Program Level (P.L.) and Budget Authority (B.A.)(Dollars in Millions)
2002 2003 2004Actual Estimate Budget
Program P.L. B.A. P.L. B.A. P.L. B.A.Farm Operating Loans: Guaranteed Unsubsidized………………… $1,053 $37 $1,721 $55 $1,400 $47 Guaranteed Subsidized…………………… 496 67 304 36 266 34 Direct……………………………………… 668 60 605 104 650 94 Total, Operating Loans………………… 2,217 164 2,630 195 2,316 175Farm Ownership Loans: Guaranteed Unsubsidized………………… 1,101 5 1,048 8 1,000 5 Direct……………………………………… 178 5 100 12 140 31 Total, Ownership Loans………………… 1,279 10 1,148 20 1,140 36Emergency Loans…………………………… 58 8 139 28 133 18 a/Indian Land Acquisition Loans……………… b/ b/ 2 b/ 2 0Boll Weevil Eradication…………………… 100 0 100 0 60 0 Subtotal, Farm Loan Programs………… 3,654 182 4,019 243 3,651 229State Mediation Grants……………………… 3 3 4 4 4 4 Total, Farm Loan and Grants Programs… $3,657 $185 $4,023 $247 $3,655 $233
a/ $18 million in B.A. for Emergency Loans is expected to carry over into 2004.b/ Less than $0.5 million.
The farm credit program provides an important safety net for America’s farmers by providing a source of credit when they are temporarily unable to obtain credit from commercial sources. Consistent with the Administration’s policies on food and agriculture, the farm credit programs play an important role in enhancing the infrastructure of the food and agricultural system. The 2004 budget supports about $3.7 billion in direct and guaranteed farm loans. For 2003, a total program level of $4.0 billion was requested. It is assumed that a portion of the budget authority available to support emergency loans in 2003 will carry over into 2004; as a result, an appropriation for emergency loans is not requested in 2004. As has been the case for several years, greater levels of assistance will be offered through guaranteed loans rather than direct loans. Guaranteed loans have lower subsidy costs and are serviced by private lenders. Guaranteed farm operating loans are commonly used by private lenders to continue serving borrowers who become higher credit risks due to economic adversity. Guaranteed farm ownership loans are a critical source of credit for some borrowers because they
FARM AND FOREIGN AGRICULTURAL SERVICES
15
allow real estate equity to be used to restructure short-term debt. Emphasis will continue to be placed on providing assistance to socially disadvantaged farmers. As required by statute, a portion of both direct and guaranteed farm operating and ownership loan funds are targeted to socially disadvantaged borrowers based on county level demographic data. Although targets vary by loan program and county, on average about 14 percent of loan funds are targeted to socially disadvantaged borrowers. The 2004 budget proposes loan levels that generally reflect actual usage in recent years. For farm operating loans, the 2004 budget provides $650 million for direct loans and about $1.7 billion for guaranteed loans. These loan levels will serve an estimated 25,000 farmers, about 15,000 of whom will receive direct loans. The availability of farm operating loans provides farmers with short term credit to finance the costs of continuing or improving their farming operations, such as purchasing seed, fertilizer, livestock, feed, equipment and other supplies. For farm ownership loans, the 2004 budget provides $140 million in direct loans and $1 billion for guaranteed loans. The 2004 levels will provide almost 4,700 people with the opportunity to either acquire their own farm or save an existing one. About 1,200 borrowers would receive direct loans and 3,500 would receive guaranteed loans. The 2004 budget also provides funding for Indian land acquisition loans and the Boll Weevil Eradication Loan Program. Due to the successful completion of some eradication programs the 2004 budget requests $60 million for this program compared to $100 million in 2003. FSA will conduct an evaluation of the potential for achieving budget savings through the sale of loan assets to private investors. The 2004 budget reflects a $5 million budget savings for a pilot sale. FSA will first evaluate whether private investors would be willing to pay a premium over the value of the loans to the Government, and whether there would be any administrative savings to selling rather than holding the loans. No loans will be sold for less than the value of the loans to the Government less any administrative costs that could be avoided by selling them. Funding for State Mediation Grants would be maintained at $4 million. Mediation benefits family farmers, including many low-income and socially disadvantaged farmers, who, because of mediation, are often able to resolve credit and other issues and remain on the farm.
FARM AND FOREIGN AGRICULTURAL SERVICES
16
Farm Service AgencyCommodity Credit Corporation
(Dollars in Millions)
Program Levels Net OutlaysProgram 2002 2003 2004 2002 2003 2004
Commodity Programs: Price Support and Marketing Assistance Loans……………………… $10,131 $8,652 $8,934 $4,456 $3,116 $2,305 Production Flexibility Contracts………… 3,968 0 0 3,968 0 0 Loan Deficiency Payments……………… 5,345 858 829 5,345 858 829 Direct Payments…………………………… 0 3,820 5,228 0 3,820 5,228 Countercyclical Payments………………… 0 1,709 3,087 0 1,709 3,087 Milk Income Loss Contract Payments…… 0 2,400 1,100 0 2,400 1,100 Noninsured Assistance Payments………… 181 244 257 181 244 257 Farm Storage Facility Loans……………… 65 147 117 2 2 1 Cotton User Marketing Payments………… 182 191 482 182 191 482 Peanut Quota Payments…………………… 0 1,100 125 0 1,100 125 Other Direct Payments…………………… -1 186 0 -1 186 0 Purchases and Sales……………………… 1,418 1,114 750 -1,169 -1,365 -1,621 Disaster Assistance……………………… 254 20 0 254 20 0 Interest Expenditures……………………… 300 226 352 218 122 213 Other……………………………………… 451 357 415 -207 571 625 Total, Commodity Programs…………… 22,294 21,024 21,676 13,229 12,974 12,631Conservation Programs: CRP Program Payments………………… 1,785 1,883 2,022 1,785 1,883 2,022 Other Conservation Programs…………… 0 0 0 286 293 201 Total, Conservation Programs………… 1,785 1,883 2,022 2,071 2,176 2,223Export Programs: Export Credit……………………………… 3,388 4,225 4,155 245 829 264 Market Access Program…………………… 100 110 125 97 114 109 Foreign Market Development (Cooperator) Program………………… 34 34 34 31 35 35 Technical Assistance for Specialty Crops Program………………………… 2 2 2 0 2 2 Quality Samples Program………………… 2 2 2 0 2 2 Export Enhancement Program…………… 0 28 28 2 28 28 Dairy Export Incentive Program………… 55 36 57 25 36 57
FARM AND FOREIGN AGRICULTURAL SERVICES
17
Farm Service AgencyCommodity Credit Corporation
(Dollars in Millions)
Program Levels Net OutlaysProgram 2002 2003 2004 2002 2003 2004
Food for Progress Program……………… 126 158 151 202 158 178 International Food for Education Program………………………………… a/ 100 b/ 0 100 0 Section 416(b) Donations c/……………… 363 28 12 d/ 264 7 7 Other……………………………………… 19 20 20 15 25 21 Total, Export Programs………………… 4,089 4,743 4,586 881 1,336 703 Subtotal, CCC………………………… 28,168 27,650 28,284 16,181 16,486 15,557Pre-credit Reform Loan Repayments……… 0 0 0 -501 -478 -449 Total, CCC………………………………$28,168 $27,650 $28,284 $15,680 $16,008 $15,108
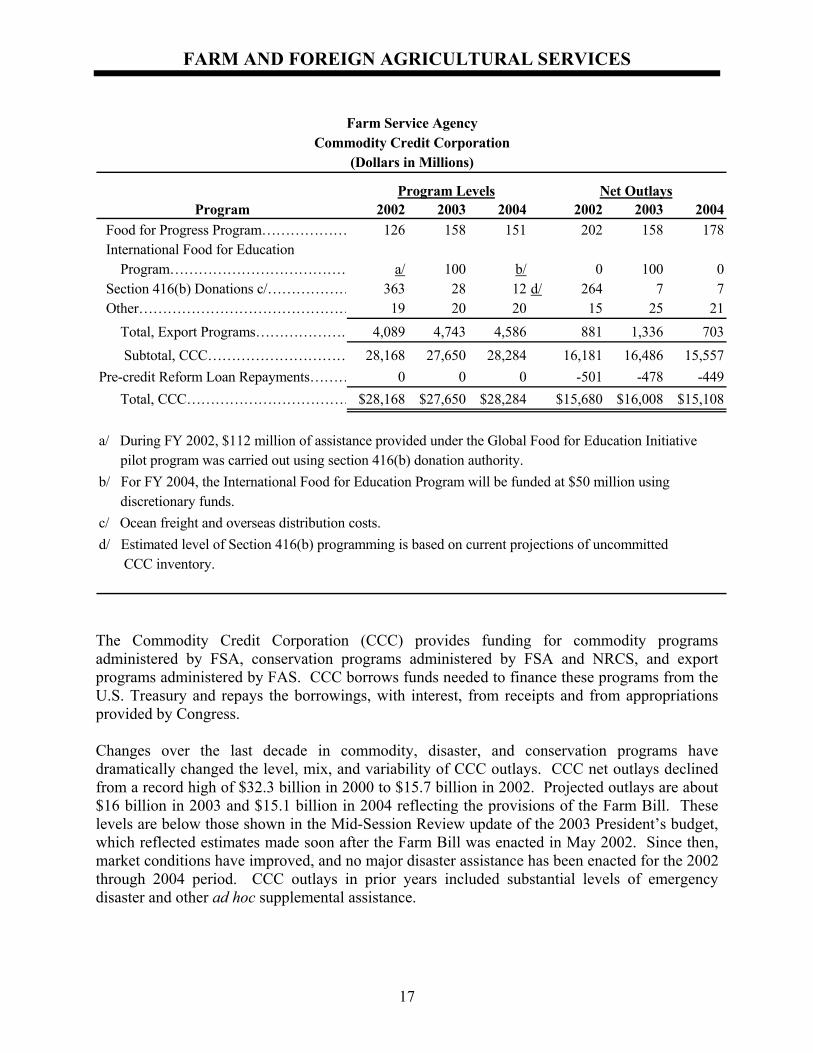
a/ During FY 2002, $112 million of assistance provided under the Global Food for Education Initiative pilot program was carried out using section 416(b) donation authority.b/ For FY 2004, the International Food for Education Program will be funded at $50 million using discretionary funds.c/ Ocean freight and overseas distribution costs.d/ Estimated level of Section 416(b) programming is based on current projections of uncommitted CCC inventory.
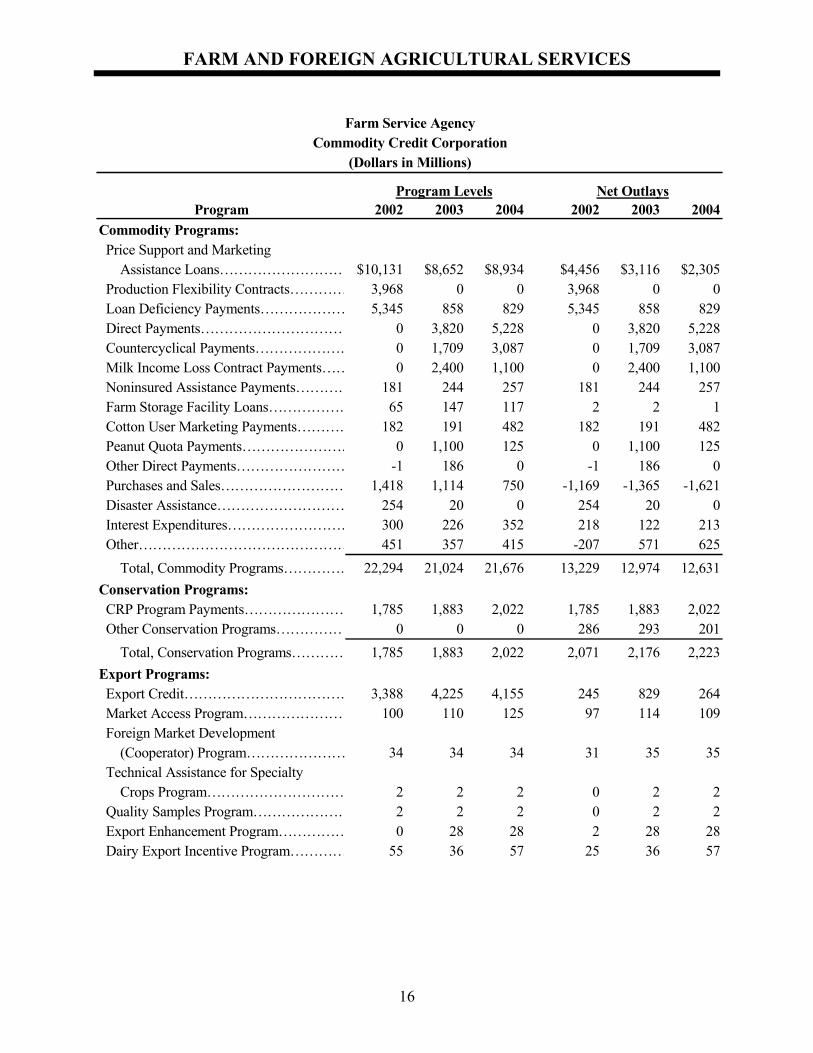
The Commodity Credit Corporation (CCC) provides funding for commodity programs administered by FSA, conservation programs administered by FSA and NRCS, and export programs administered by FAS. CCC borrows funds needed to finance these programs from the U.S. Treasury and repays the borrowings, with interest, from receipts and from appropriations provided by Congress. Changes over the last decade in commodity, disaster, and conservation programs have dramatically changed the level, mix, and variability of CCC outlays. CCC net outlays declined from a record high of $32.3 billion in 2000 to $15.7 billion in 2002. Projected outlays are about $16 billion in 2003 and $15.1 billion in 2004 reflecting the provisions of the Farm Bill. These levels are below those shown in the Mid-Session Review update of the 2003 President’s budget, which reflected estimates made soon after the Farm Bill was enacted in May 2002. Since then, market conditions have improved, and no major disaster assistance has been enacted for the 2002 through 2004 period. CCC outlays in prior years included substantial levels of emergency disaster and other ad hoc supplemental assistance.
FARM AND FOREIGN AGRICULTURAL SERVICES
18
Farm Service AgencyCommodity Program Outlays
(Dollars in Millions)
2002 2003 2004Program Actual Estimate Budget
Commodity: Feed Grains…………………………………………………… $3,295 $1,320 $3,144 Wheat………………………………………………………… 1,190 846 1,577 Rice…………………………………………………………… 1,085 1,336 1,347 Upland Cotton……………………………………………… 3,307 3,171 2,897 Tobacco……………………………………………………… -137 -132 -101 Dairy………………………………………………………… 614 2,902 1,407 Soybeans and Products……………………………………… 3,467 1,114 1,084 Minor Oilseeds……………………………………………… 89 55 40 Peanuts……………………………………………………… 129 1,478 499 Sugar………………………………………………………… -131 -111 0 Honey………………………………………………………… -3 11 11 Wool and Mohair…………………………………………… -1 28 15 Other Crops………………………………………………… 260 279 28 Subtotal…………………………………………………… 13,164 12,297 11,948 Disaster Assistance…………………………………………… 254 20 0 Other a/……………………………………………………… -189 657 683 Total, Commodity Programs……………………………… $13,229 $12,974 $12,631
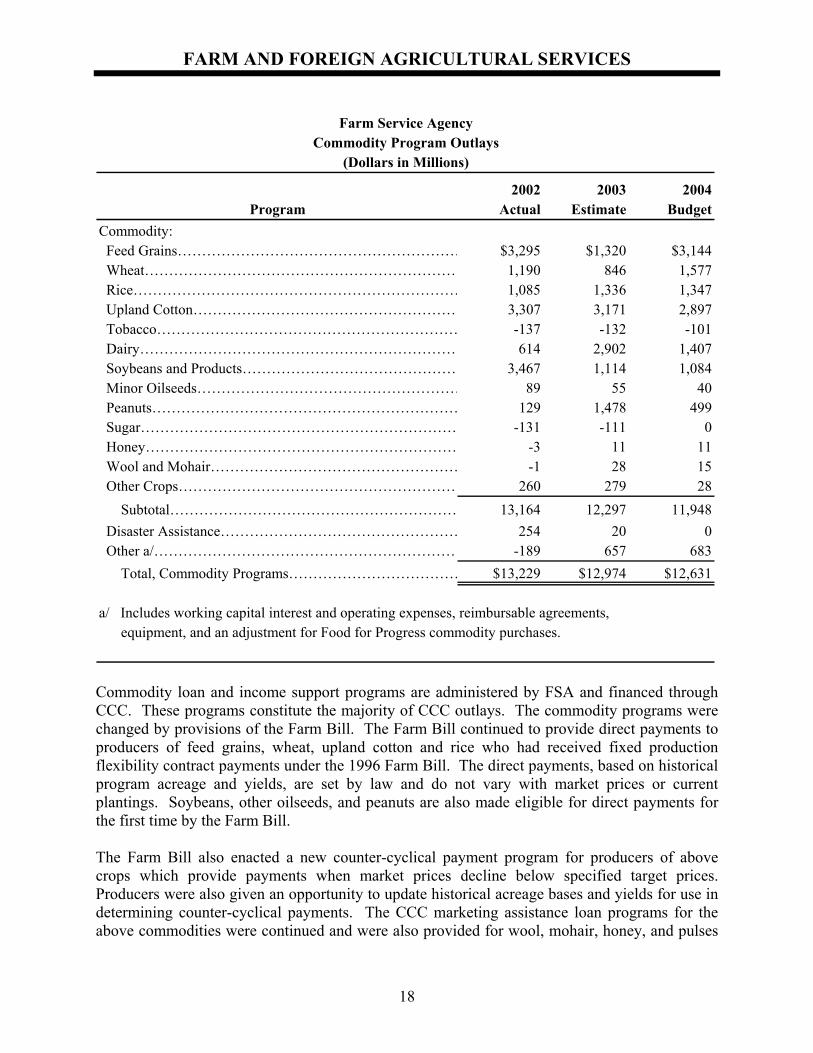
a/ Includes working capital interest and operating expenses, reimbursable agreements, equipment, and an adjustment for Food for Progress commodity purchases.
Commodity loan and income support programs are administered by FSA and financed through CCC. These programs constitute the majority of CCC outlays. The commodity programs were changed by provisions of the Farm Bill. The Farm Bill continued to provide direct payments to producers of feed grains, wheat, upland cotton and rice who had received fixed production flexibility contract payments under the 1996 Farm Bill. The direct payments, based on historical program acreage and yields, are set by law and do not vary with market prices or current plantings. Soybeans, other oilseeds, and peanuts are also made eligible for direct payments for the first time by the Farm Bill. The Farm Bill also enacted a new counter-cyclical payment program for producers of above crops which provide payments when market prices decline below specified target prices. Producers were also given an opportunity to update historical acreage bases and yields for use in determining counter-cyclical payments. The CCC marketing assistance loan programs for the above commodities were continued and were also provided for wool, mohair, honey, and pulses
FARM AND FOREIGN AGRICULTURAL SERVICES
19
to provide protection against sharp declines in market prices. Marketing assistance loan program levels doubled between 1997 and 2000 and remained at relatively high levels through 2002. Loan deficiency payments, market loan gains, and related gains totaled $8 billion in 2002. Projected levels total nearly $1.9 billion in 2003 and over $1.6 billion for 2004 reflecting improved market conditions. The Farm Bill dramatically increased dairy program outlays by establishing a Milk Income Loss Compensation program which provides payments equal to 45 percent of the difference between $16.94 per hundredweight and the Class I milk price per hundredweight in Boston under the applicable Federal milk marketing order. Low prices have also increased outlays for the dairy price support program. The historic peanut program which provided high price support and quotas was abolished by the Farm Bill and peanut producers now receive payments and marketing assistance loans similar to other crops. The budget proposes to limit the CCC bioenergy incentive program to $100 million in 2004, down from $150 million provided by the Farm Bill. A program evaluation of direct crop payments was conducted as part of the 2004 budget formulation process. As a result of that evaluation, the Administration will: devise better performance measures to address program goals and delivery; and reduce trade barriers through trade negotiations to reduce future dependence on government payments.
FARM AND FOREIGN AGRICULTURAL SERVICES
20
Farm Bill Conservation ProgramsProgram Level
(Dollars in Millions)
2002 2003 2004Program Actual Estimate Budget
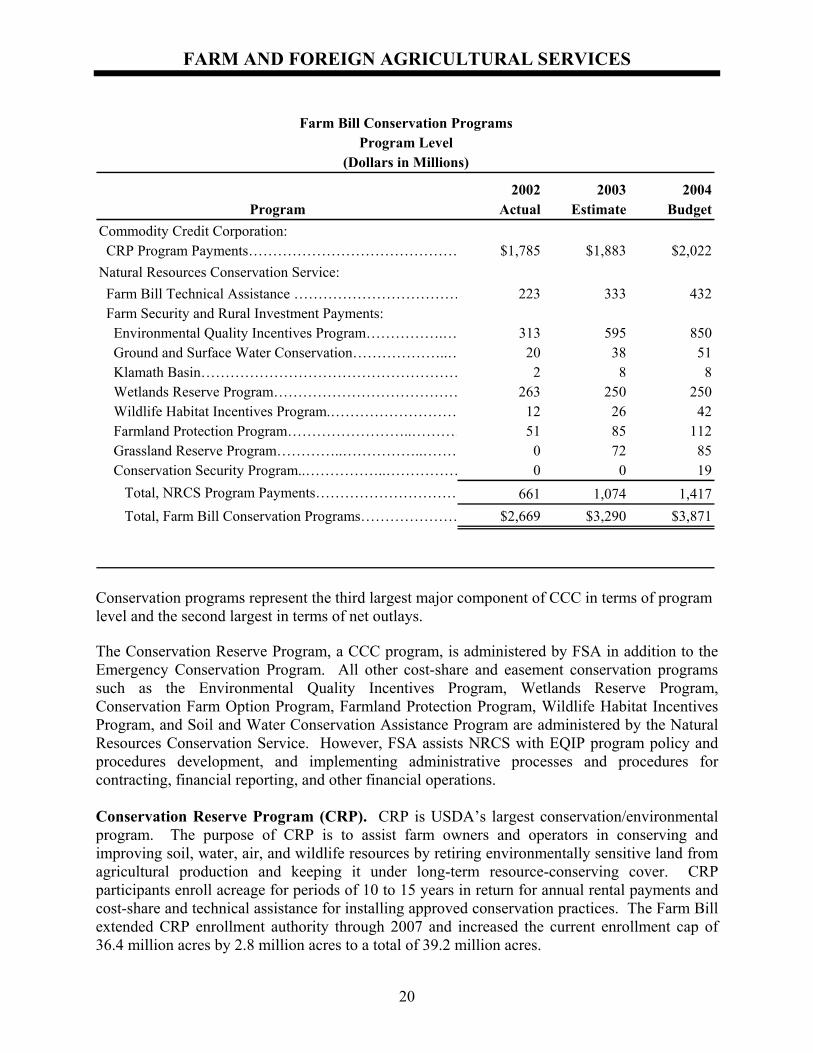
Commodity Credit Corporation: CRP Program Payments……………………………………… $1,785 $1,883 $2,022Natural Resources Conservation Service: Farm Bill Technical Assistance ……………………………… 223 333 432 Farm Security and Rural Investment Payments: Environmental Quality Incentives Program…………….… 313 595 850 Ground and Surface Water Conservation………………..… 20 38 51 Klamath Basin……………………………………………… 2 8 8 Wetlands Reserve Program………………………………… 263 250 250 Wildlife Habitat Incentives Program.……………………… 12 26 42 Farmland Protection Program……………………..………… 51 85 112 Grassland Reserve Program…………..……………..……… 0 72 85 Conservation Security Program..……………..…………… 0 0 19 Total, NRCS Program Payments………………………… 661 1,074 1,417 Total, Farm Bill Conservation Programs………………… $2,669 $3,290 $3,871
Conservation programs represent the third largest major component of CCC in terms of program level and the second largest in terms of net outlays. The Conservation Reserve Program, a CCC program, is administered by FSA in addition to the Emergency Conservation Program. All other cost-share and easement conservation programs such as the Environmental Quality Incentives Program, Wetlands Reserve Program, Conservation Farm Option Program, Farmland Protection Program, Wildlife Habitat Incentives Program, and Soil and Water Conservation Assistance Program are administered by the Natural Resources Conservation Service. However, FSA assists NRCS with EQIP program policy and procedures development, and implementing administrative processes and procedures for contracting, financial reporting, and other financial operations. Conservation Reserve Program (CRP). CRP is USDA’s largest conservation/environmental program. The purpose of CRP is to assist farm owners and operators in conserving and improving soil, water, air, and wildlife resources by retiring environmentally sensitive land from agricultural production and keeping it under long-term resource-conserving cover. CRP participants enroll acreage for periods of 10 to 15 years in return for annual rental payments and cost-share and technical assistance for installing approved conservation practices. The Farm Bill extended CRP enrollment authority through 2007 and increased the current enrollment cap of 36.4 million acres by 2.8 million acres to a total of 39.2 million acres.
FARM AND FOREIGN AGRICULTURAL SERVICES
21
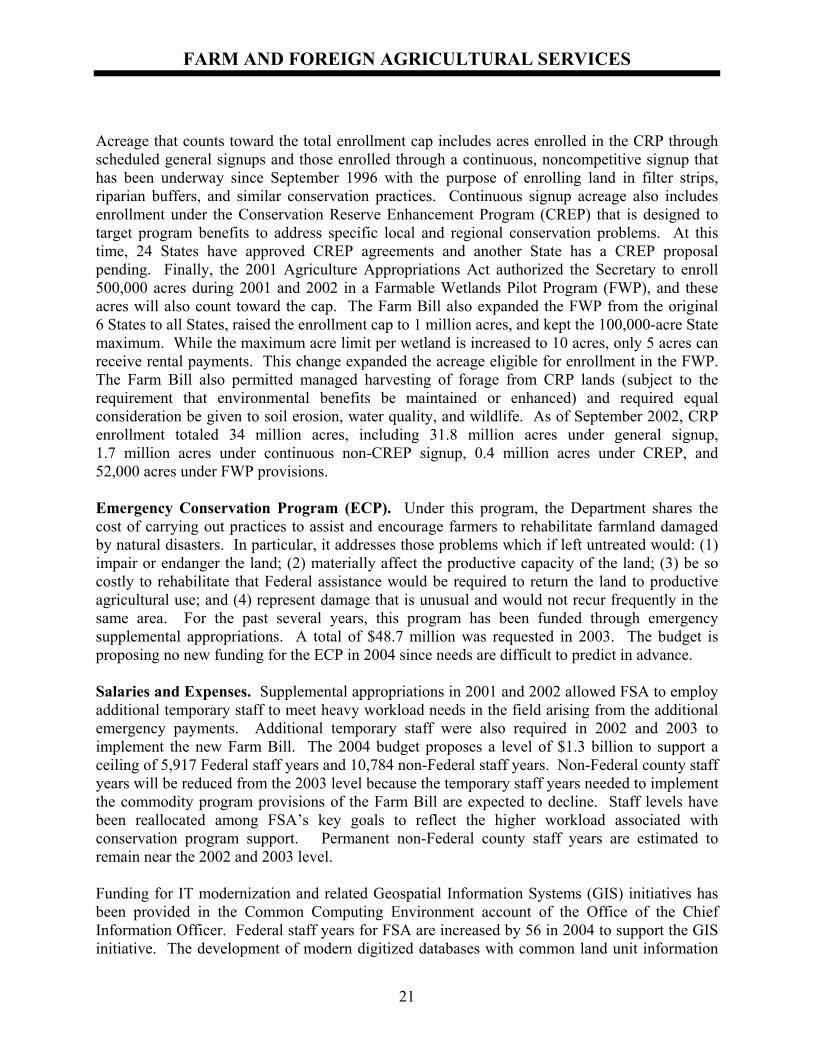
Acreage that counts toward the total enrollment cap includes acres enrolled in the CRP through scheduled general signups and those enrolled through a continuous, noncompetitive signup that has been underway since September 1996 with the purpose of enrolling land in filter strips, riparian buffers, and similar conservation practices. Continuous signup acreage also includes enrollment under the Conservation Reserve Enhancement Program (CREP) that is designed to target program benefits to address specific local and regional conservation problems. At this time, 24 States have approved CREP agreements and another State has a CREP proposal pending. Finally, the 2001 Agriculture Appropriations Act authorized the Secretary to enroll 500,000 acres during 2001 and 2002 in a Farmable Wetlands Pilot Program (FWP), and these acres will also count toward the cap. The Farm Bill also expanded the FWP from the original 6 States to all States, raised the enrollment cap to 1 million acres, and kept the 100,000-acre State maximum. While the maximum acre limit per wetland is increased to 10 acres, only 5 acres can receive rental payments. This change expanded the acreage eligible for enrollment in the FWP. The Farm Bill also permitted managed harvesting of forage from CRP lands (subject to the requirement that environmental benefits be maintained or enhanced) and required equal consideration be given to soil erosion, water quality, and wildlife. As of September 2002, CRP enrollment totaled 34 million acres, including 31.8 million acres under general signup, 1.7 million acres under continuous non-CREP signup, 0.4 million acres under CREP, and 52,000 acres under FWP provisions. Emergency Conservation Program (ECP). Under this program, the Department shares the cost of carrying out practices to assist and encourage farmers to rehabilitate farmland damaged by natural disasters. In particular, it addresses those problems which if left untreated would: (1) impair or endanger the land; (2) materially affect the productive capacity of the land; (3) be so costly to rehabilitate that Federal assistance would be required to return the land to productive agricultural use; and (4) represent damage that is unusual and would not recur frequently in the same area. For the past several years, this program has been funded through emergency supplemental appropriations. A total of $48.7 million was requested in 2003. The budget is proposing no new funding for the ECP in 2004 since needs are difficult to predict in advance. Salaries and Expenses. Supplemental appropriations in 2001 and 2002 allowed FSA to employ additional temporary staff to meet heavy workload needs in the field arising from the additional emergency payments. Additional temporary staff were also required in 2002 and 2003 to implement the new Farm Bill. The 2004 budget proposes a level of $1.3 billion to support a ceiling of 5,917 Federal staff years and 10,784 non-Federal staff years. Non-Federal county staff years will be reduced from the 2003 level because the temporary staff years needed to implement the commodity program provisions of the Farm Bill are expected to decline. Staff levels have been reallocated among FSA’s key goals to reflect the higher workload associated with conservation program support. Permanent non-Federal county staff years are estimated to remain near the 2002 and 2003 level. Funding for IT modernization and related Geospatial Information Systems (GIS) initiatives has been provided in the Common Computing Environment account of the Office of the Chief Information Officer. Federal staff years for FSA are increased by 56 in 2004 to support the GIS initiative. The development of modern digitized databases with common land unit information
FARM AND FOREIGN AGRICULTURAL SERVICES
22
integrated with soils and crop data and other farm records and related initiatives is critical to the development of more efficient and effective customer services at our Service Centers and will greatly facilitate realization of the potential benefits from electronic (e) Government. The Administration expects significant long-term savings and improved services to clientele to result from improvements made in the information technology services and GIS systems, as well as in the IT administrative support services of the three county-based agencies (the Farm Service Agency, the Natural Resources Conservation Service, and the Rural Development mission area). FSA will also make administrative improvements in its servicing of farm credit loans.
Farm Service AgencyStaff Years
2002 2003 2004Program Actual Estimate Budget
Federal………………………………………………………… 5,861 5,861 5,917Non-Federal: Permanent Full-Time………………………………………… 9,284 9,284 9,284 Temporary…………………………………………………… 2,017 4,192 1,500
Total, Non-Federal………………………………………… 11,301 13,476 10,784
Total, FSA Staff Years…………………………………… 17,162 19,337 16,701
FARM AND FOREIGN AGRICULTURAL SERVICES
23
RISK MANAGEMENT AGENCY (RMA)
Crop Insurance ProgramProgram Level
(Dollars in Millions)
2002 2003 2004Program Actual Estimate Budget
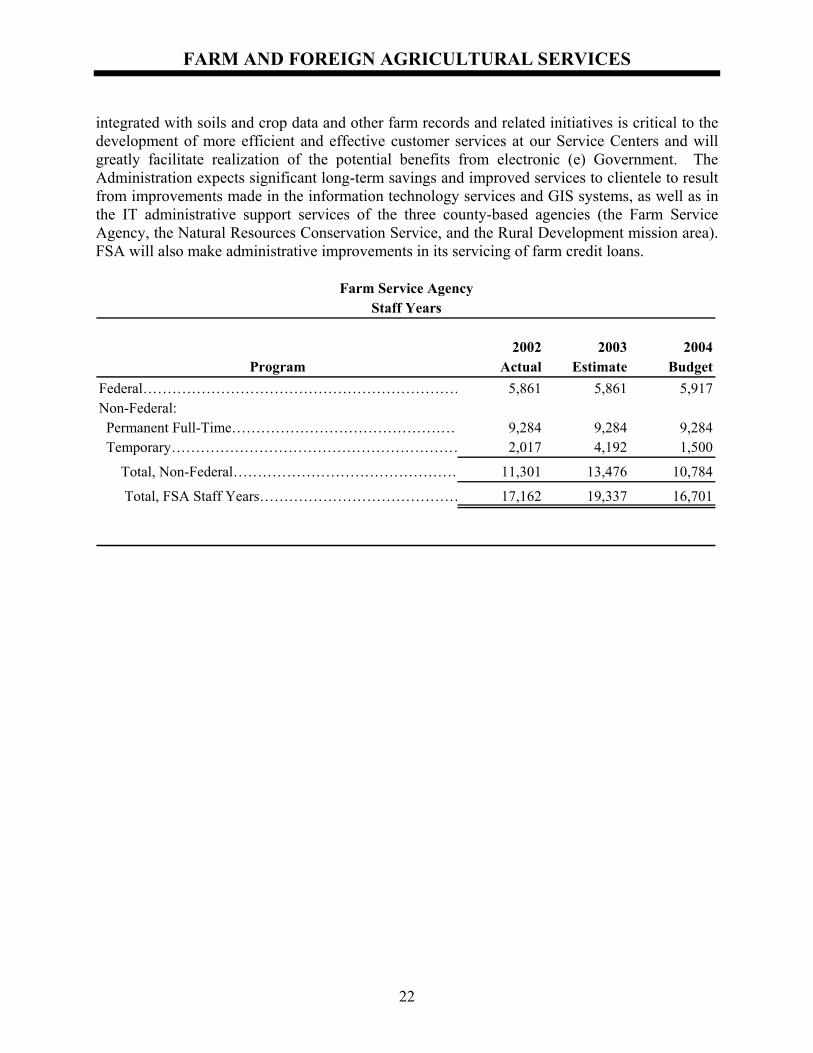
Net Indemnities to Producers: Gross Indemnities…………………………………………… $3,161 $4,251 $3,090 Producer-Paid Premium……………………………………… -1,102 -1,139 -1,175 Total, Net Indemnities…………………………………… 2,059 3,112 1,915Administrative/Delivery and Other Expenses………………… 1,100 751 1,169Proposal to reduce the reimbursement rate from 24.5 percent to 20 percent…………………………… 0 0 -68 Total, Government Costs………………………………… 3,159 3,863 3,016FUNDING SOURCE DETAIL: Delivery and Other Administrative Expenses a/…………… 684 680 721 Gross Indemnities…………………………………………… 3,161 4,251 3,090 Underwriting Gains b/……………………………………… 342 0 370 Proposal to reduce the reimbursement rate from 24.5 percent to 20 percent…………………………… 0 0 -68 Subtotal, Crop Insurance Program Level………………… 4,187 4,931 4,113 Administrative and Operating Expenses…………………… 74 71 78 Total, Program Level……………………………………… 4,261 5,002 4,191Less: Producer Premium……………………………………… -1,102 -1,139 -1,175 Total, Government Costs………………………………… $3,159 $3,863 $3,016Loss Ratio c/…………………………………………………… 1.420 1.075 1.075
a/ Includes reimbursements to private companies and certain costs for research, development and other activities authorized by ARPA.b/ The 2003 Budget included a proposal to cap underwriting gains at 12.5 percent of retained premium. The proposal was estimated to save $115 million.c/ Estimated.
The primary responsibility of the RMA is to administer the Crop Insurance Program. The program provides an important safety net by protecting producers against a wide range of environmental risks as well as the risk of price fluctuations. The program is expected to provide about $38 billion in risk protection on about 208 million acres in 2004. This represents about 78 percent of the Nation’s acres planted to principal crops. Participation in the Crop Insurance
FARM AND FOREIGN AGRICULTURAL SERVICES
24
Program by producers is voluntary, however, participation is encouraged through premium subsidies. Crop insurance is delivered to producers through private insurance companies that share in the risk of loss. The companies are reimbursed for their delivery expenses and receive underwriting gains in years of favorable loss experience. The 2004 budget requests “such sums as necessary” for the mandatory costs associated with the Crop Insurance Program, including premium subsidies, indemnity payments (in excess of premiums), underwriting gains paid to private companies, reimbursements to private companies for delivery expenses and other authorized expenditures. Mandatory costs to the government for 2004 are estimated to be about $3 billion, compared to about $3.9 billion in 2003. Drought conditions throughout much of the country resulted in higher than expected indemnities for the 2002 crop year. Due to the timing of the crop cycle, the majority of those indemnities will be paid out during the 2003 fiscal year. The 2004 indemnities reflect the statutory loss ratio of 1.075. In addition, producers are expected to pay about $1.2 billion in premiums. In 2000, Congress substantially reformed the crop insurance program, in part, by providing for substantial increases in the premium subsidy available to producers, especially at higher levels of coverage. And, producers have responded by purchasing higher levels of coverage. As a result, the premium earned per policy has increased from about $1,500 to over $2,300. However, the number of policies sold has remained virtually steady at about 1.3 million policies. Most of the current crop insurance business is renewal business which requires less sales effort than does the solicitation of new customers. In addition, technological advances mandated, in part, by the 2000 reforms have provided producers the opportunity to access information and to apply for crop insurance electronically. The Administration recently announced that the 2004 book of business would be delivered under the Standard Reinsurance Agreement that has been in place for a number of years. However, the budget includes a proposal to cap the amount of delivery expense reimbursement the companies may receive at 20 percent of the premium. The existing cap of 24.5 percent has been in place since 1998. This proposal is expected to save about $68 million in 2004. These savings are achievable because of improvements in the cost-effectiveness of the delivery system through the establishment of e-commerce procedures, higher premium dollar policies for insuring the same number of acres, and more business being done on a renewal basis. A program evaluation of the Crop Insurance Program was conducted as part of the 2004 budget formulation process. As a result of that evaluation, the Administration will: establish adequate long-term and short-term measures and goals; and identify improvements in the program that will get it closer to becoming a complete risk management tool. Discretionary costs for the Crop Insurance Program cover Federal salaries and related expenses. The 2004 budget includes about $78 million for these costs, compared to about $71 million requested for 2003. The increase includes about $5.6 million for information technology initiatives to maintain and update the RMA computing system, $1 million to initiate a system of annual expense and performance audits of the private insurance companies, and $1.3 million for pay increases.
FARM AND FOREIGN AGRICULTURAL SERVICES
25
FOREIGN AGRICULTURAL SERVICE (FAS)
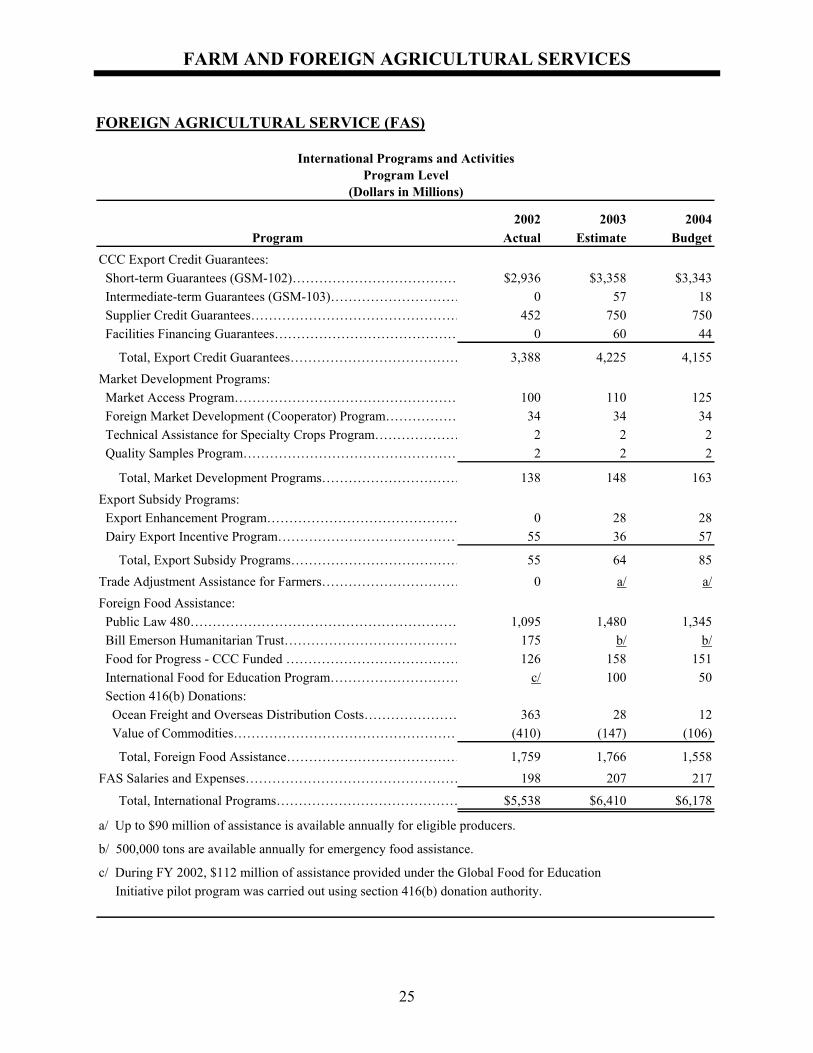
International Programs and ActivitiesProgram Level
(Dollars in Millions)
2002 2003 2004Program Actual Estimate Budget
CCC Export Credit Guarantees: Short-term Guarantees (GSM-102)………………………………… $2,936 $3,358 $3,343 Intermediate-term Guarantees (GSM-103)………………………… 0 57 18 Supplier Credit Guarantees………………………………………… 452 750 750 Facilities Financing Guarantees…………………………………… 0 60 44
Total, Export Credit Guarantees………………………………… 3,388 4,225 4,155Market Development Programs: Market Access Program…………………………………………… 100 110 125 Foreign Market Development (Cooperator) Program……………… 34 34 34 Technical Assistance for Specialty Crops Program………………… 2 2 2 Quality Samples Program………………………………………… 2 2 2
Total, Market Development Programs…………………………… 138 148 163Export Subsidy Programs: Export Enhancement Program……………………………………… 0 28 28 Dairy Export Incentive Program…………………………………… 55 36 57
Total, Export Subsidy Programs………………………………… 55 64 85Trade Adjustment Assistance for Farmers…………………………… 0 a/ a/Foreign Food Assistance: Public Law 480…………………………………………………… 1,095 1,480 1,345 Bill Emerson Humanitarian Trust………………………………… 175 b/ b/ Food for Progress - CCC Funded ………………………………… 126 158 151 International Food for Education Program………………………… c/ 100 50 Section 416(b) Donations: Ocean Freight and Overseas Distribution Costs………………… 363 28 12 Value of Commodities…………………………………………… (410) (147) (106)
Total, Foreign Food Assistance………………………………… 1,759 1,766 1,558FAS Salaries and Expenses………………………………………… 198 207 217
Total, International Programs…………………………………… $5,538 $6,410 $6,178
a/ Up to $90 million of assistance is available annually for eligible producers.
b/ 500,000 tons are available annually for emergency food assistance.
c/ During FY 2002, $112 million of assistance provided under the Global Food for Education Initiative pilot program was carried out using section 416(b) donation authority.
FARM AND FOREIGN AGRICULTURAL SERVICES
26
FAS administers a variety of programs designed to promote U.S. agricultural exports, develop long-term markets overseas, and foster economic growth and trade capacity building in developing countries. These activities help to enhance economic opportunities for U.S. agricultural producers, one of the goals established in the USDA Strategic Plan. Expanding markets for agricultural products is critical to the long-term health and prosperity of the U.S. agricultural sector and, with 96 percent of the world’s population living outside the United States, future growth in demand for food and agricultural products will occur primarily in overseas markets. FAS’ international activities play a critical role in helping to open new markets and in facilitating U.S. competitiveness and, by doing so, help to secure a more prosperous future for American agriculture. CCC Export Credit Guarantee Programs. Under these programs, CCC provides payment guarantees for the commercial financing of U.S. agricultural exports. These programs facilitate exports to buyers in countries where credit is necessary to maintain or increase U.S. sales, but where financing may not be available without CCC guarantees. The budget includes an overall program level of just under $4.2 billion for CCC export credit guarantees in 2004, which is relatively unchanged from the current estimate for 2003. These estimates reflect the levels of sales expected to be registered under the export credit guarantee programs. However, the actual levels of programming are likely to vary from these estimates, depending upon program demand, market conditions, and other relevant factors during the course of the year. Of the total program level for export credit guarantees expected to be issued by CCC in 2004, $3.3 billion will be made available under the GSM-102 program, which provides guarantees on commercial export credit extended with short-term repayment terms (up to 3 years), and $18 million will be made available under the GSM-103 program, which provides intermediate-term credit guarantees (3 to 10 year repayment terms). For supplier credit guarantees, the budget includes an estimated program level of $750 million for 2004. Under this credit activity, CCC guarantees payments due from importers under short-term financing that exporters extend directly to the importers for the purchase of U.S. agricultural products. Sales registrations under the supplier credit guarantee program have been growing rapidly in recent years, and that growth is expected to continue. Although the 2002 Farm Bill extended the financing terms for supplier credit guarantees up to 360 days, the budget assumes the program will continue to operate with the current maximum of 180 days. The budget also includes an estimated program level of $44 million for facility financing guarantees in 2004. Under this activity, CCC provides guarantees to facilitate the financing of goods and services exported from the United States to improve or establish agriculture-related facilities in emerging markets. By supporting such facilities, these guarantees enhance sales of U.S. agricultural products to countries where demand is constricted due to inadequate storage, processing, or handling capabilities. Market Development Programs. FAS administers a number of programs which support the development, maintenance, and expansion of commercial export markets for U.S. agricultural
FARM AND FOREIGN AGRICULTURAL SERVICES
27
commodities and products. Under the Market Access Program (MAP), CCC funds are used to reimburse participating organizations for a portion of the costs of carrying out overseas marketing and promotional activities, such as direct consumer promotions. Historically, more than 80 percent of MAP funding has been devoted to building export markets for high value products, the fastest growing component of U.S. agricultural exports. MAP participants include nonprofit agricultural trade organizations, State-regional trade groups, cooperatives, and private companies which qualify as small business concerns. Consistent with provisions of the 2002 Farm Bill, the budget includes funding for MAP of $110 million in 2003 and $125 million in 2004. Under the Foreign Market Development (Cooperator) Program, cost-share assistance is provided to nonprofit commodity and agricultural trade associations to support overseas market development activities that are designed to remove long-term impediments to increased U.S. trade. These activities include technical assistance, trade servicing, and market research. Unlike MAP, Cooperator Program activities are carried out on a generic commodity basis and do not include brand-name or consumer promotions. As authorized by the 2002 Farm Bill, the budget provides funding of $34.5 million for the Cooperator Program, unchanged from 2003. The 2002 Farm Bill authorizes a new Technical Assistance for Specialty Crops Program to address unique barriers that prohibit or threaten the export of U.S. specialty crops. Under the program, grants are provided to assist U.S. organizations in activities designed to overcome phytosanitary and related technical barriers. The program was implemented during 2002 at an annual program level of $2 million with funding provided by CCC. The budget assumes continued CCC funding for the program in 2003 and 2004 at the same level. The budget also includes $2.5 million of CCC funding for the Quality Samples Program (QSP). Under the program, CCC provides funding to assist private entities to furnish samples of U.S. agricultural products to foreign importers in order to overcome trade and marketing obstacles. The program provides foreign importers with a better understanding and appreciation of the characteristics of U.S. agricultural products. Export Subsidy Programs. The Department currently has two export subsidy programs: the Export Enhancement Program (EEP) and Dairy Export Incentive Program (DEIP). Under these programs, bonus payments are made available to exporters of U.S. agricultural commodities to enable them to be price competitive and thereby make sales in targeted overseas markets where competitor countries are making subsidized sales. EEP programming has been limited for the past several years due to world supply and demand conditions, and no bonuses were awarded under the program during 2002. In view of this recent performance, the budget assumes an EEP programming level of $28 million for both 2003 and 2004. However, the 2002 Farm Bill establishes a maximum annual program level for EEP of $478 million, the maximum allowable level under the Uruguay Round export subsidy reduction commitments. Should market conditions warrant, the program can be reactivated and the awarding of bonuses resumed up to the authorized level.
FARM AND FOREIGN AGRICULTURAL SERVICES
28
For DEIP, the budget assumes a program level of $57 million for 2004, an increase above the current estimate for 2003 of $36 million. The program level established for DEIP is an estimate of the level of subsidy funding needed to facilitate export sales consistent with projected U.S. and world market conditions. The program level may increase or decrease from the projected level depending upon the relationship between U.S. and world market prices during the course of the programming year. Trade Adjustment Assistance for Farmers. The Trade Act of 2002 establishes a new Trade Adjustment Assistance Program for Farmers. Under the program, USDA is authorized to make payments to eligible producer groups when the current year’s price of an agricultural commodity is less than 80 percent of the national average price for the 5 marketing years proceeding the most recent marketing year, and the Secretary determines that imports have contributed importantly to the decline in price. Procedures for determining rates and amounts of payments to eligible producers are set forth in the statute. The statute also authorizes USDA to use not more than $90 million annually to carry out the program, beginning in 2003. FAS is currently coordinating efforts with other USDA agencies to establish the new program, which is expected to be implemented through rulemaking later this year. International Food Assistance. The United States is the world’s leader in international food aid. The United States is pivotal in the international food aid system, not only for the level of assistance provided, but also for the influence of U.S. efforts on other donors and the system itself. A program evaluation of food aid programs was conducted as part of the 2004 budget formulation process. As a result of that evaluation, the Administration will administer the program in a manner that will limit duplication and inconsistent program implementation between the Department and the Agency for International Development (AID) and make more efficient use of the U.S. food aid resources through implementation of the President’s Management Agenda.
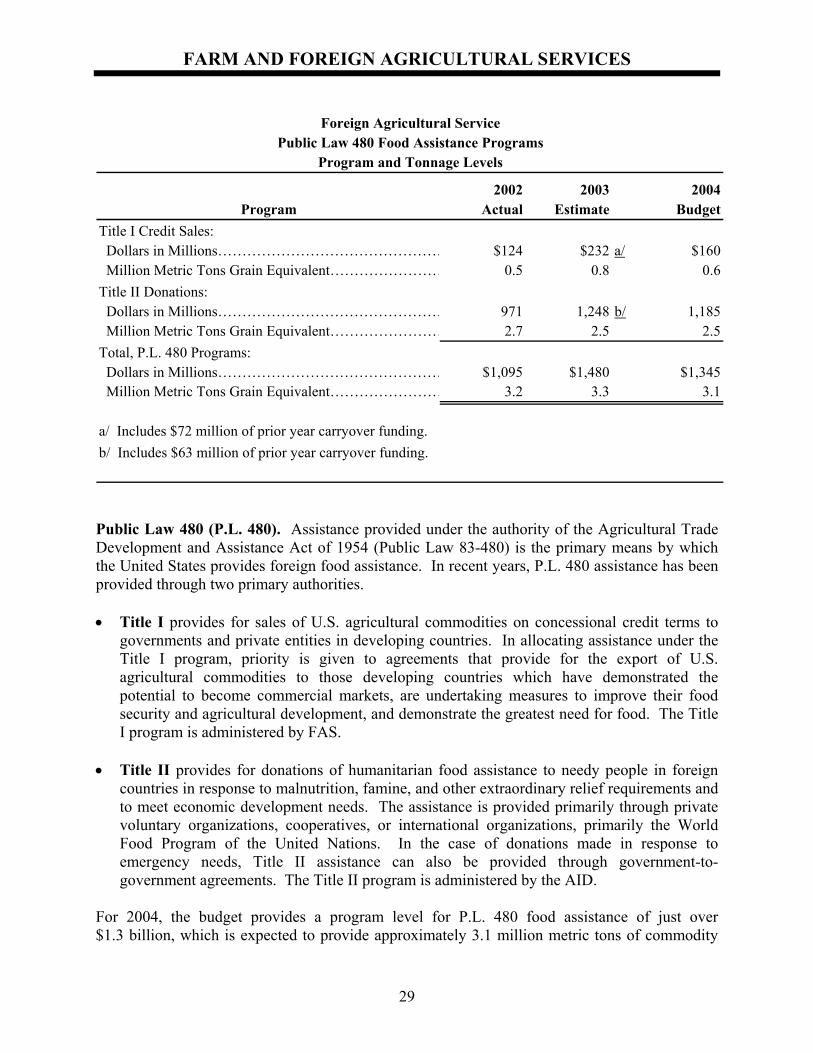
FARM AND FOREIGN AGRICULTURAL SERVICES
29
Foreign Agricultural ServicePublic Law 480 Food Assistance Programs
Program and Tonnage Levels
2002 2003 2004Program Actual Estimate Budget
Title I Credit Sales: Dollars in Millions………………………………………… $124 $232 a/ $160 Million Metric Tons Grain Equivalent…………………… 0.5 0.8 0.6Title II Donations: Dollars in Millions………………………………………… 971 1,248 b/ 1,185 Million Metric Tons Grain Equivalent…………………… 2.7 2.5 2.5Total, P.L. 480 Programs: Dollars in Millions………………………………………… $1,095 $1,480 $1,345 Million Metric Tons Grain Equivalent…………………… 3.2 3.3 3.1
a/ Includes $72 million of prior year carryover funding.b/ Includes $63 million of prior year carryover funding.
Public Law 480 (P.L. 480). Assistance provided under the authority of the Agricultural Trade Development and Assistance Act of 1954 (Public Law 83-480) is the primary means by which the United States provides foreign food assistance. In recent years, P.L. 480 assistance has been provided through two primary authorities. • Title I provides for sales of U.S. agricultural commodities on concessional credit terms to
governments and private entities in developing countries. In allocating assistance under the Title I program, priority is given to agreements that provide for the export of U.S. agricultural commodities to those developing countries which have demonstrated the potential to become commercial markets, are undertaking measures to improve their food security and agricultural development, and demonstrate the greatest need for food. The Title I program is administered by FAS.
• Title II provides for donations of humanitarian food assistance to needy people in foreign
countries in response to malnutrition, famine, and other extraordinary relief requirements and to meet economic development needs. The assistance is provided primarily through private voluntary organizations, cooperatives, or international organizations, primarily the World Food Program of the United Nations. In the case of donations made in response to emergency needs, Title II assistance can also be provided through government-to-government agreements. The Title II program is administered by the AID.
For 2004, the budget provides a program level for P.L. 480 food assistance of just over $1.3 billion, which is expected to provide approximately 3.1 million metric tons of commodity
FARM AND FOREIGN AGRICULTURAL SERVICES
30
assistance. For Title I credit sales, the budget includes a program level of $160 million, which is expected to support 600,000 metric tons of commodity exports. The proposed program level is unchanged from last year’s budget request; however, Title I appropriated funding has been increased slightly due to higher estimated subsidy costs for the program. For Title II donations, a program level of nearly $1.2 billion is requested, unchanged from last year’s request level. The 2002 Farm Bill increased the annual minimum tonnage level for Title II donations to 2.5 million metric tons (grain equivalent). The program level requested for 2004 is expected to meet that level, based on current USDA price estimates. Bill Emerson Humanitarian Trust. The Bill Emerson Humanitarian Trust is a commodity reserve designed to ensure that the United States can meet its international food assistance commitments. Up to 4 million metric tons of wheat, corn, sorghum, and rice can be held in the Trust, which is administered by the Secretary of Agriculture. The Secretary is authorized to release commodities from the Trust for programming under P.L. 480 under two conditions: (a) when U.S. domestic supplies are insufficient to meet the annual P.L. 480 commodity availability criteria and (b) to provide commodities for Title II donations in response to unanticipated needs for emergency assistance. During 2002, 523,000 metric tons of wheat were released from the Trust in response to emergency needs in 6 countries in southern Africa. The wheat was sold and the proceeds used to purchase nearly 320,000 metric tons of corn, sorghum, bulgur, vegetable oil, and beans for shipment to the region under Title II. The total value of the assistance provided, including freight and overseas distribution costs, is estimated to be $175 million. Following last year’s release, the Trust currently holds approximately 2 million metric tons of wheat. Food for Progress. The Food for Progress Act of 1985 authorizes U.S. agricultural commodities to be provided to developing countries and emerging democracies that have made commitments to introduce and expand free enterprise in their agricultural economies. Food for Progress agreements can be entered into with foreign governments, private voluntary agencies, nonprofit agricultural organizations, cooperatives, or intergovernmental organizations. Agreements may provide for the commodities to be supplied on either long-term credit or grant terms. P.L. 480 Title I funds may be used for the procurement and transportation costs of the commodities. Alternatively, either CCC-owned commodities may be made available or CCC may purchase commodities if not in its inventory, with transportation and other non-commodity expenses paid with CCC funds subject to a limitation of $55 million. Provisions of the 2002 Farm Bill established an annual minimum tonnage level of 400,000 metric tons for that portion of the program carried out with CCC funding, subject to the limitation on transportation and other non-commodity costs. The 2004 budget assumes a program level for the CCC-funded portion of Food for Progress programming of $151 million, which is expected to meet the minimum tonnage level based on current commodity price projections. McGovern-Dole International Food for Education and Child Nutrition Program. The 2002 Farm Bill authorizes the new McGovern-Dole International Food for Education and Child
FARM AND FOREIGN AGRICULTURAL SERVICES
31
Nutrition Program (IFEP), which provides for the donation of U.S. agricultural commodities and associated financial and technical assistance to carry out preschool and school feeding programs in foreign countries. Maternal, infant, and child nutrition programs also are authorized under the program. Its purpose is to improve food security, reduce the incidence of hunger and malnutrition, and improve literacy and primary education. The program will be administered by FAS, with implementation set to begin once program regulations have been promulgated. The Farm Bill provides a program level of $100 million for the IFEP during 2003, with funding to be provided by CCC. This is expected to support the programming of just over 200,000 metric tons of commodities. Beginning in 2004, the program is to be funded through annual appropriations, and the budget requests $50 million for that purpose. Based on current price projections, the requested program level will provide approximately 100,000 metric tons of assistance. The IFEP replaces the Global Food for Education (GFE) initiative pilot program that USDA implemented during 2001 and 2002. Under the pilot program, commodities were provided to support school feeding programs in developing countries with the objectives of reducing hunger, improving health, and promoting school enrollment, attendance, and performance. Total costs of the pilot project are now estimated at just under $300 million. During the 2-year period, 48 school feeding projects were carried out in 38 countries, and the program reached an estimated 7 million children. The GFE was implemented in cooperation with 14 private voluntary organizations, the World Food Program, and the Government of the Dominican Republic. Section 416(b) Donations. Section 416(b) of the Agricultural Act of 1949 authorizes the donation of surplus CCC-owned commodities in order to carry out programs of assistance in developing countries and friendly countries. Commodities eligible for donation include those in inventory that have been acquired by CCC through price support operations, or otherwise acquired by CCC in the normal course of its operations and which are excess to domestic program requirements. The commodities are made available for donation through agreements with foreign governments, private voluntary organizations and cooperatives, and the World Food Program. The budget assumes that commodities acquired by CCC in the normal course of its domestic support operations will be available for donation under section 416(b) authority. Current CCC baseline estimates project that surplus nonfat dry milk that will be made available for programming under section 416(b) authority during 2004. The budget assumes the value of the assistance and associated costs to be provided will total $118 million.
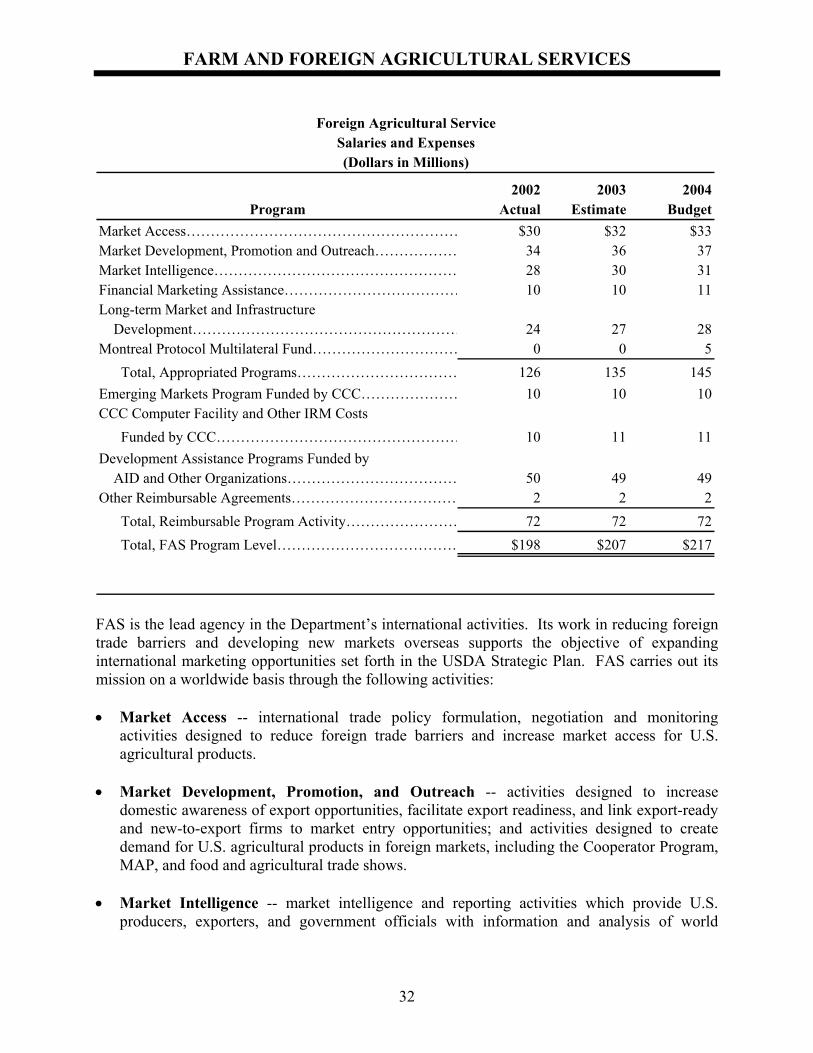
FARM AND FOREIGN AGRICULTURAL SERVICES
32
Foreign Agricultural ServiceSalaries and Expenses(Dollars in Millions)
2002 2003 2004Program Actual Estimate Budget
Market Access………………………………………………… $30 $32 $33Market Development, Promotion and Outreach……………… 34 36 37Market Intelligence…………………………………………… 28 30 31Financial Marketing Assistance……………………………… 10 10 11Long-term Market and Infrastructure Development………………………………………………… 24 27 28Montreal Protocol Multilateral Fund………………………… 0 0 5 Total, Appropriated Programs…………………………… 126 135 145Emerging Markets Program Funded by CCC………………… 10 10 10CCC Computer Facility and Other IRM Costs Funded by CCC…………………………………………… 10 11 11Development Assistance Programs Funded by AID and Other Organizations……………………………… 50 49 49Other Reimbursable Agreements……………………………… 2 2 2 Total, Reimbursable Program Activity…………………… 72 72 72 Total, FAS Program Level………………………………… $198 $207 $217
FAS is the lead agency in the Department’s international activities. Its work in reducing foreign trade barriers and developing new markets overseas supports the objective of expanding international marketing opportunities set forth in the USDA Strategic Plan. FAS carries out its mission on a worldwide basis through the following activities: • Market Access -- international trade policy formulation, negotiation and monitoring
activities designed to reduce foreign trade barriers and increase market access for U.S. agricultural products.
• Market Development, Promotion, and Outreach -- activities designed to increase
domestic awareness of export opportunities, facilitate export readiness, and link export-ready and new-to-export firms to market entry opportunities; and activities designed to create demand for U.S. agricultural products in foreign markets, including the Cooperator Program, MAP, and food and agricultural trade shows.
• Market Intelligence -- market intelligence and reporting activities which provide U.S.
producers, exporters, and government officials with information and analysis of world
FARM AND FOREIGN AGRICULTURAL SERVICES
33
agricultural production and trade, as well as reporting on and addressing foreign government policies and issues that affect the competitiveness of U.S. agricultural exports.
• Financial Marketing Assistance -- administration of the Department's major commercial
export programs, including the CCC export credit guarantee and export subsidy programs, which enhance U.S. competitiveness in the global marketplace.
• Long-Term Market and Infrastructure Development -- administration of foreign food
assistance, international development, and trade capacity building activities, including scientific and technical exchanges, cooperative research, liaison with international food and agricultural organizations, and agricultural technical assistance and training, including the Cochran Fellowship Program.
The budget provides appropriated funding of $145 million for FAS activities in 2004. This is an increase of nearly $10 million above the 2003 level and supports a number of trade-related initiatives. First, the budget provides $500,000 for a trade capacity building initiative to work with countries in their implementation of the Cartagena Protocol on Biosafety. Provisions of the Biosafety Protocol, which is expected to become a legally binding international instrument during 2003, are intended to provide uniform international standards for ensuring the safe transport and use of products derived from biotechnology. However, misinterpretation of the Protocol could seriously impede trade, product development, and scientific research. In order to ensure that the Protocol’s provisions are properly interpreted and applied, FAS will work with developing countries so that science-based, transparent, and non-discriminatory standards are adopted. Through a series of regional seminars, training sessions, scientific exchanges, and related activities, FAS will work to secure a full understanding of the agreement’s purpose and potential benefits, while avoiding any potential disruptions in agricultural trade. The FAS budget also includes $5 million for a USDA contribution to the Montreal Protocol Multilateral Fund. The Fund was established in 1991 to help developing countries switch from ozone depleting substances to safer alternatives. Developing countries’ commitment to comply with the Protocol’s strict requirements is contingent on developed countries providing help through the Fund. Agricultural issues are expected to become increasingly important in the Montreal Protocol process, particularly as the scheduled phase-out date for the use of methyl bromide approaches. The USDA contribution will supplement contributions by the Department of State and Environmental Protection Agency to the Fund and will help to further U.S. agricultural interests in implementation of the Protocol. Additional funding in support of FAS trade agreement negotiation, enforcement, and standards-setting activities will be made available from funds requested for the Office of the Secretary to conduct USDA cross-cutting trade negotiation and biotechnology activities. Among other things, these resources will facilitate FAS’ active participation in the World Trade Organization’s multilateral negotiations to reform global agricultural trade practices, as well as numerous regional and bilateral free trade negotiations. These funds also will be available to
FARM AND FOREIGN AGRICULTURAL SERVICES
34
bolster FAS efforts to address market access constraints related to biotechnology, which have increased dramatically in recent years. The budget also provides $4 million to meet projected pay cost increases, inflation, and higher overseas rental expenses and payments to the State Department for administrative services provided at overseas posts. Funding for the Cochran Fellowship Program is maintained at the current level of $5 million. In addition, the budget includes an estimated $72 million in funding to be made available to FAS through reimbursable agreements. The largest component of this is funding for technical assistance, training, and research activities that FAS carries out overseas on behalf of AID, foreign governments, and international organizations. It also includes funding made available by CCC for the Emerging Markets Program. This program supports technical assistance and related activities in order to further U.S. market development objectives in promising overseas growth markets.
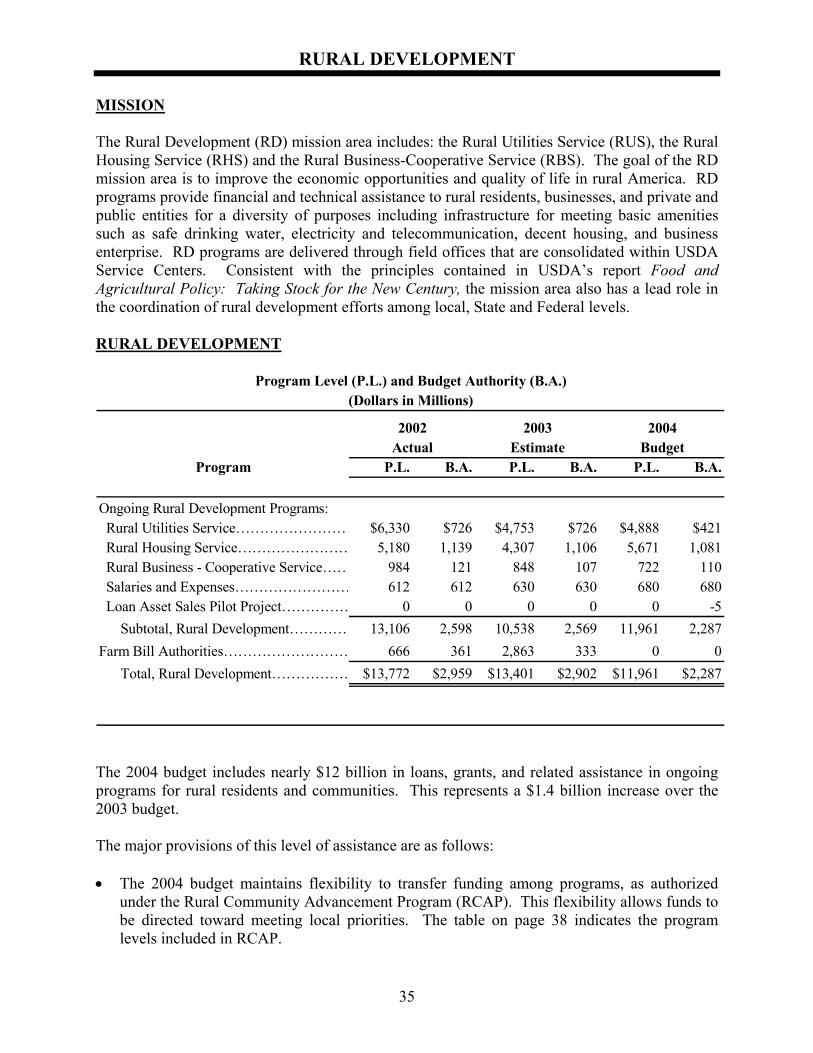
RURAL DEVELOPMENT
35
MISSION The Rural Development (RD) mission area includes: the Rural Utilities Service (RUS), the Rural Housing Service (RHS) and the Rural Business-Cooperative Service (RBS). The goal of the RD mission area is to improve the economic opportunities and quality of life in rural America. RD programs provide financial and technical assistance to rural residents, businesses, and private and public entities for a diversity of purposes including infrastructure for meeting basic amenities such as safe drinking water, electricity and telecommunication, decent housing, and business enterprise. RD programs are delivered through field offices that are consolidated within USDA Service Centers. Consistent with the principles contained in USDA’s report Food and Agricultural Policy: Taking Stock for the New Century, the mission area also has a lead role in the coordination of rural development efforts among local, State and Federal levels. RURAL DEVELOPMENT
Program Level (P.L.) and Budget Authority (B.A.)(Dollars in Millions)
2002 2003 2004Actual Estimate Budget
Program P.L. B.A. P.L. B.A. P.L. B.A.
Ongoing Rural Development Programs: Rural Utilities Service…………………… $6,330 $726 $4,753 $726 $4,888 $421 Rural Housing Service…………………… 5,180 1,139 4,307 1,106 5,671 1,081 Rural Business - Cooperative Service…… 984 121 848 107 722 110 Salaries and Expenses…………………… 612 612 630 630 680 680 Loan Asset Sales Pilot Project…………… 0 0 0 0 0 -5 Subtotal, Rural Development………… 13,106 2,598 10,538 2,569 11,961 2,287Farm Bill Authorities……………………… 666 361 2,863 333 0 0 Total, Rural Development……………… $13,772 $2,959 $13,401 $2,902 $11,961 $2,287
The 2004 budget includes nearly $12 billion in loans, grants, and related assistance in ongoing programs for rural residents and communities. This represents a $1.4 billion increase over the 2003 budget. The major provisions of this level of assistance are as follows: • The 2004 budget maintains flexibility to transfer funding among programs, as authorized
under the Rural Community Advancement Program (RCAP). This flexibility allows funds to be directed toward meeting local priorities. The table on page 38 indicates the program levels included in RCAP.
RURAL DEVELOPMENT
36
• Loans and grants for water and waste disposal projects are funded at nearly $1.5 billion, the same as the 2003 budget. Within the total, grants are reduced to $346 million, down $241 million from the 2003 budget. However, loans for such projects are increased by a comparable amount. Because of the relatively low interest rate on loans, more projects should be feasible with less grant funding required and, therefore the overall program should be able to operate at a much higher loan to grant ratio than it has over the past few years.
• Most direct loan and loan guarantee programs are maintained at their 2003 budget level.
This includes $2.6 billion in electric loans and $495 million in telecommunications loans. • Electric loan funds will be targeted to borrowers that serve areas of high poverty. Borrowers
will also be asked to recertify that they are serving areas that are rural, rather than urban or suburban.
• The Administration continues to support the accelerated privatization of the Rural Telephone
Bank (RTB), which is fully capable of becoming a private entity. Therefore, the 2004 budget does not include support for RTB loans. As a private entity, the RTB will be able to obtain financing to make loans from the commercial markets.
• The distance learning and medical link program is maintained at the same level as supported
by the 2003 budget - $50 million in direct loans and $25 million in grants. In addition, the 2004 budget includes support through discretionary funding for $196 million in loans and $2 million in grants for broadband facilities and internet access.
• For Section 502 single family housing, the 2004 budget supports nearly $1.4 billion in direct
loans – an increase of $400 million over the 2003 budget estimates - and almost $2.8 billion in guaranteed loans, including $225 million for refinancing. The increase in direct loans represents RD’s contribution to the President’s initiative to increase homeownership, especially among minorities. The 2004 program levels will allow the agency to provide loans and guarantees to provide about 49,000 homeownership opportunities. In recent years, there have been shortfalls in the demand for guaranteed loans. However, RD recently reduced the guarantee fee to bring it more in line with the fee charged by other Federal agencies. In response, the demand for its guaranteed loans has risen significantly.
• For Section 515 multi family housing, the 2004 budget includes $71 million in direct loans
for the repair, rehabilitation, and preservation of existing projects. No funding is provided for new construction. This proposal is consistent with the Administration’s 2003 budget decision to focus efforts on maintaining the existing portfolio of about 17,800 projects. Many of the projects are over 20 years old and in need of repair or rehabilitation. The demand for loans to repair and rehabilitate existing projects has been increasing in recent years, as has the cost of providing rental assistance payments to keep the projects viable and available to low-income tenants.
• The 2004 budget includes $740 million to fully fund all expiring rural rental assistance
contracts for existing projects and to provide contracts for new construction of farm labor housing projects.
RURAL DEVELOPMENT
37
• The 2004 budget includes $680 million for RD’s salaries and expenses. This level of funding
includes funding to cover higher pay costs and to invest in information technology to improve the overall management of the programs.
• RD will conduct a pilot loan asset sale in 2004 in cooperation with FSA. Data generated will
help USDA evaluate the potential for achieving budget savings through the sale of loan assets to private investors on a regular basis. The 2004 budget reflects an estimated $5 million in budget savings for a pilot within the RD mission area total.
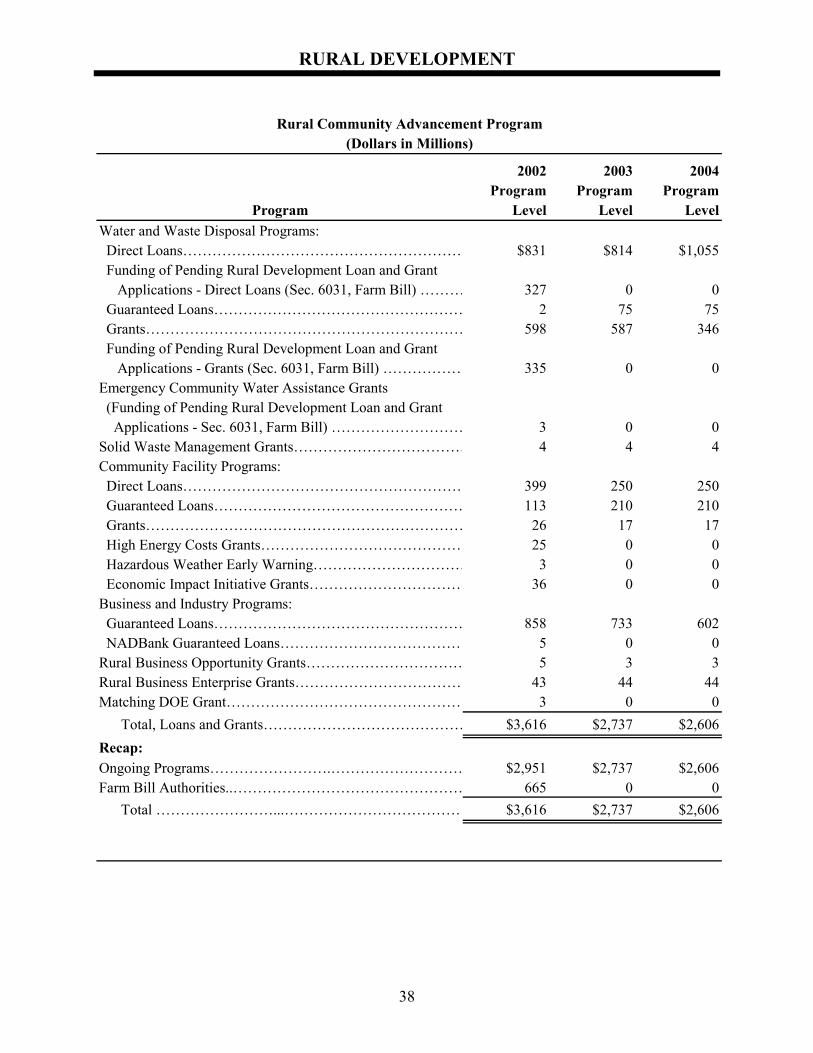
RURAL DEVELOPMENT
38
Rural Community Advancement Program
(Dollars in Millions)
2002 2003 2004Program Program Program
Program Level Level LevelWater and Waste Disposal Programs: Direct Loans………………………………………………… $831 $814 $1,055 Funding of Pending Rural Development Loan and Grant Applications - Direct Loans (Sec. 6031, Farm Bill) ……… 327 0 0 Guaranteed Loans…………………………………………… 2 75 75 Grants………………………………………………………… 598 587 346 Funding of Pending Rural Development Loan and Grant Applications - Grants (Sec. 6031, Farm Bill) ……………… 335 0 0Emergency Community Water Assistance Grants (Funding of Pending Rural Development Loan and Grant Applications - Sec. 6031, Farm Bill) ……………………… 3 0 0Solid Waste Management Grants……………………………… 4 4 4Community Facility Programs: Direct Loans………………………………………………… 399 250 250 Guaranteed Loans…………………………………………… 113 210 210 Grants………………………………………………………… 26 17 17 High Energy Costs Grants…………………………………… 25 0 0 Hazardous Weather Early Warning…………………………… 3 0 0 Economic Impact Initiative Grants…………………………… 36 0 0Business and Industry Programs: Guaranteed Loans…………………………………………… 858 733 602 NADBank Guaranteed Loans………………………………… 5 0 0Rural Business Opportunity Grants…………………………… 5 3 3Rural Business Enterprise Grants……………………………… 43 44 44Matching DOE Grant………………………………………… 3 0 0 Total, Loans and Grants…………………………………… $3,616 $2,737 $2,606Recap:Ongoing Programs…………………….……………………… $2,951 $2,737 $2,606Farm Bill Authorities..………………………………………… 665 0 0 Total ……………………...……………………………… $3,616 $2,737 $2,606
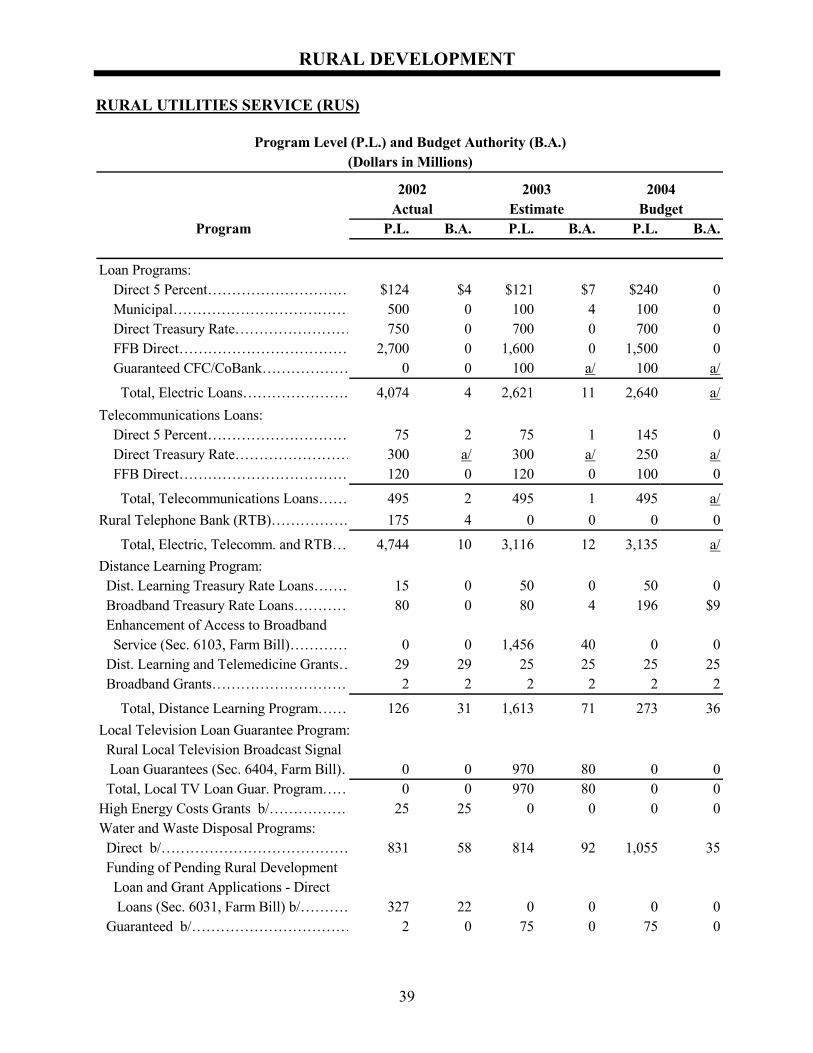
RURAL DEVELOPMENT
39
RURAL UTILITIES SERVICE (RUS)
Program Level (P.L.) and Budget Authority (B.A.)(Dollars in Millions)
2002 2003 2004Actual Estimate Budget
Program P.L. B.A. P.L. B.A. P.L. B.A.
Loan Programs: Direct 5 Percent………………………… $124 $4 $121 $7 $240 0 Municipal………………………………… 500 0 100 4 100 0 Direct Treasury Rate…………………… 750 0 700 0 700 0 FFB Direct……………………………… 2,700 0 1,600 0 1,500 0 Guaranteed CFC/CoBank……………… 0 0 100 a/ 100 a/
Total, Electric Loans…………………… 4,074 4 2,621 11 2,640 a/Telecommunications Loans: Direct 5 Percent………………………… 75 2 75 1 145 0 Direct Treasury Rate…………………… 300 a/ 300 a/ 250 a/ FFB Direct……………………………… 120 0 120 0 100 0
Total, Telecommunications Loans…… 495 2 495 1 495 a/Rural Telephone Bank (RTB)……………… 175 4 0 0 0 0
Total, Electric, Telecomm. and RTB…… 4,744 10 3,116 12 3,135 a/Distance Learning Program: Dist. Learning Treasury Rate Loans……… 15 0 50 0 50 0 Broadband Treasury Rate Loans………… 80 0 80 4 196 $9 Enhancement of Access to Broadband Service (Sec. 6103, Farm Bill)………… 0 0 1,456 40 0 0 Dist. Learning and Telemedicine Grants… 29 29 25 25 25 25 Broadband Grants………………………… 2 2 2 2 2 2
Total, Distance Learning Program……… 126 31 1,613 71 273 36Local Television Loan Guarantee Program: Rural Local Television Broadcast Signal Loan Guarantees (Sec. 6404, Farm Bill)… 0 0 970 80 0 0 Total, Local TV Loan Guar. Program…… 0 0 970 80 0 0High Energy Costs Grants b/……………… 25 25 0 0 0 0Water and Waste Disposal Programs: Direct b/………………………………… 831 58 814 92 1,055 35 Funding of Pending Rural Development Loan and Grant Applications - Direct Loans (Sec. 6031, Farm Bill) b/………… 327 22 0 0 0 0 Guaranteed b/…………………………… 2 0 75 0 75 0
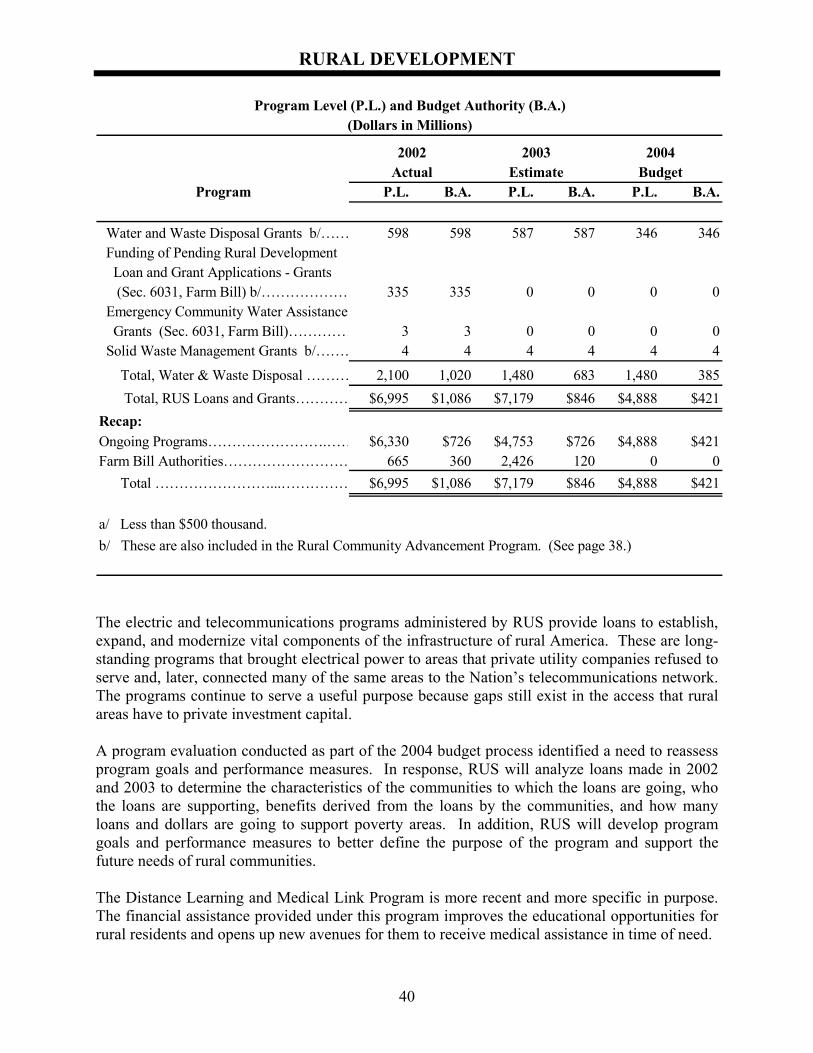
RURAL DEVELOPMENT
40
Program Level (P.L.) and Budget Authority (B.A.)(Dollars in Millions)
2002 2003 2004Actual Estimate Budget
Program P.L. B.A. P.L. B.A. P.L. B.A.
Water and Waste Disposal Grants b/…… 598 598 587 587 346 346 Funding of Pending Rural Development Loan and Grant Applications - Grants (Sec. 6031, Farm Bill) b/……………… 335 335 0 0 0 0 Emergency Community Water Assistance Grants (Sec. 6031, Farm Bill)…………… 3 3 0 0 0 0 Solid Waste Management Grants b/……… 4 4 4 4 4 4
Total, Water & Waste Disposal ……… 2,100 1,020 1,480 683 1,480 385 Total, RUS Loans and Grants………… $6,995 $1,086 $7,179 $846 $4,888 $421Recap:Ongoing Programs…………………….…… $6,330 $726 $4,753 $726 $4,888 $421Farm Bill Authorities……………………… 665 360 2,426 120 0 0 Total ……………………...…………… $6,995 $1,086 $7,179 $846 $4,888 $421
a/ Less than $500 thousand.b/ These are also included in the Rural Community Advancement Program. (See page 38.)
The electric and telecommunications programs administered by RUS provide loans to establish, expand, and modernize vital components of the infrastructure of rural America. These are long-standing programs that brought electrical power to areas that private utility companies refused to serve and, later, connected many of the same areas to the Nation’s telecommunications network. The programs continue to serve a useful purpose because gaps still exist in the access that rural areas have to private investment capital. A program evaluation conducted as part of the 2004 budget process identified a need to reassess program goals and performance measures. In response, RUS will analyze loans made in 2002 and 2003 to determine the characteristics of the communities to which the loans are going, who the loans are supporting, benefits derived from the loans by the communities, and how many loans and dollars are going to support poverty areas. In addition, RUS will develop program goals and performance measures to better define the purpose of the program and support the future needs of rural communities. The Distance Learning and Medical Link Program is more recent and more specific in purpose. The financial assistance provided under this program improves the educational opportunities for rural residents and opens up new avenues for them to receive medical assistance in time of need.
RURAL DEVELOPMENT
41
The Broadband and Internet Services Program was established as a pilot program in 2001 and was continued in 2002. It is used to finance the installation of various modes of broadband transmission capacity, including fiber optic cable for high speed internet access, and to provide local dial-up internet service to under served areas. Funds are targeted to communities that currently lack internet access via a local call. Recipients include existing RUS telecommunication borrowers or their subsidiaries as well as other entities. The 2002 Farm Bill authorized a permanent program and provided mandatory funding for the program. The program is expected to be operational in 2003. For 2004, the Administration is proposing that the program be continued using discretionary funding authority. The mandatory funding provided by the 2002 Farm Bill would be blocked. The proposal to stop making new Rural Telephone Bank (RTB) loans with Federal funds is to continue the progression of the RTB toward becoming a private bank. The RTB has the potential to obtain funding from the major capital markets, and remain a vital source of credit for telephone borrowers. Privatization will allow the bank more flexibility in how it supports telephone borrowers. The RTB was established in 1971 as a supplemental source of funding for telephone loans. The first step toward privatization was taken in 1996 with the retirement of $18 million in government-owned, Class A stock. Since 1996, an additional $97.4 million in such stock has been retired, leaving an outstanding balance of $476.7 million. The Water and Waste Disposal Program provides financing for rural communities to establish, expand or modernize water treatment and waste disposal facilities. For the most part, eligibility is limited to communities of 10,000 or less in population that are unable to obtain credit elsewhere. Grants are limited to a maximum of 75 percent of project costs and, typically average about 35 to 45 percent of program costs. They are available only to those communities with low median household income levels. Program regulations stipulate that the grant amount should only be as much as necessary to bring the user rates down to a reasonable level for the area. Interest rates on loans range from 4.5 percent for poverty communities to a ceiling of 7 percent, although the highest rate currently being charged is 4.875 percent for communities that can afford to pay a market rate of interest. Grant and loan funds are usually combined based on the income levels of users and user costs. The 2002 Farm Bill provided mandatory funding that was used in August of 2002 to make $665 million in loans and grants for 377 projects. This action reduced the backlog of projects waiting for funding. Further, the 2002 Farm Bill funding was used primarily to fund projects for poverty level communities, which required a very heavy emphasis on grants rather then loans. A greater share of the applications received since then is from higher income communities that either do not qualify for grants or do not require as much emphasis on grants for their projects to be viable. A program evaluation of the Rural Water and Waste Disposal Loan and Grants Program was conducted as part of the 2004 budget formulation process. As a result of that evaluation, the Administration will develop improved annual and long-term goals and outcome measures for the program.
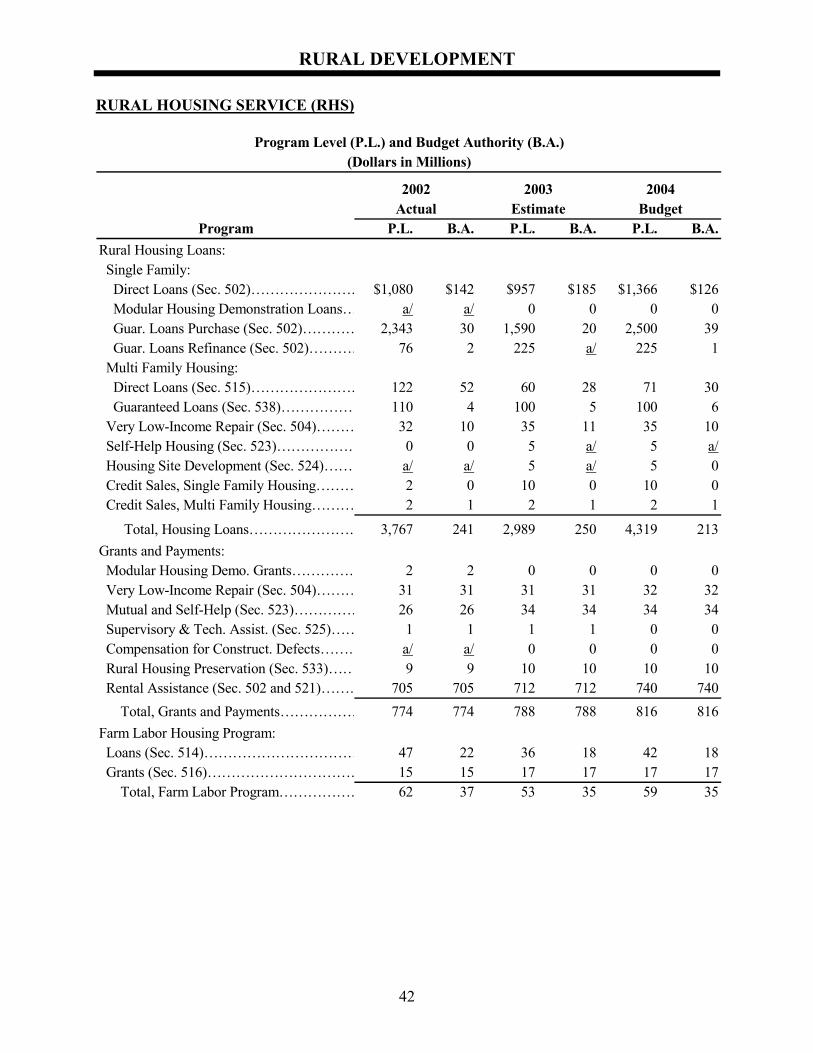
RURAL DEVELOPMENT
42
RURAL HOUSING SERVICE (RHS)
Program Level (P.L.) and Budget Authority (B.A.)(Dollars in Millions)
2002 2003 2004Actual Estimate Budget
Program P.L. B.A. P.L. B.A. P.L. B.A.Rural Housing Loans: Single Family: Direct Loans (Sec. 502)…………………… $1,080 $142 $957 $185 $1,366 $126 Modular Housing Demonstration Loans… a/ a/ 0 0 0 0 Guar. Loans Purchase (Sec. 502)………… 2,343 30 1,590 20 2,500 39 Guar. Loans Refinance (Sec. 502)………… 76 2 225 a/ 225 1 Multi Family Housing: Direct Loans (Sec. 515)…………………… 122 52 60 28 71 30 Guaranteed Loans (Sec. 538)…………… 110 4 100 5 100 6 Very Low-Income Repair (Sec. 504)……… 32 10 35 11 35 10 Self-Help Housing (Sec. 523)……………… 0 0 5 a/ 5 a/ Housing Site Development (Sec. 524)…… a/ a/ 5 a/ 5 0 Credit Sales, Single Family Housing……… 2 0 10 0 10 0 Credit Sales, Multi Family Housing……… 2 1 2 1 2 1
Total, Housing Loans…………………… 3,767 241 2,989 250 4,319 213Grants and Payments: Modular Housing Demo. Grants…………… 2 2 0 0 0 0 Very Low-Income Repair (Sec. 504)……… 31 31 31 31 32 32 Mutual and Self-Help (Sec. 523)…………… 26 26 34 34 34 34 Supervisory & Tech. Assist. (Sec. 525)…… 1 1 1 1 0 0 Compensation for Construct. Defects……… a/ a/ 0 0 0 0 Rural Housing Preservation (Sec. 533)…… 9 9 10 10 10 10 Rental Assistance (Sec. 502 and 521)……… 705 705 712 712 740 740 Total, Grants and Payments……………… 774 774 788 788 816 816Farm Labor Housing Program: Loans (Sec. 514)…………………………… 47 22 36 18 42 18 Grants (Sec. 516)…………………………… 15 15 17 17 17 17 Total, Farm Labor Program……………… 62 37 53 35 59 35
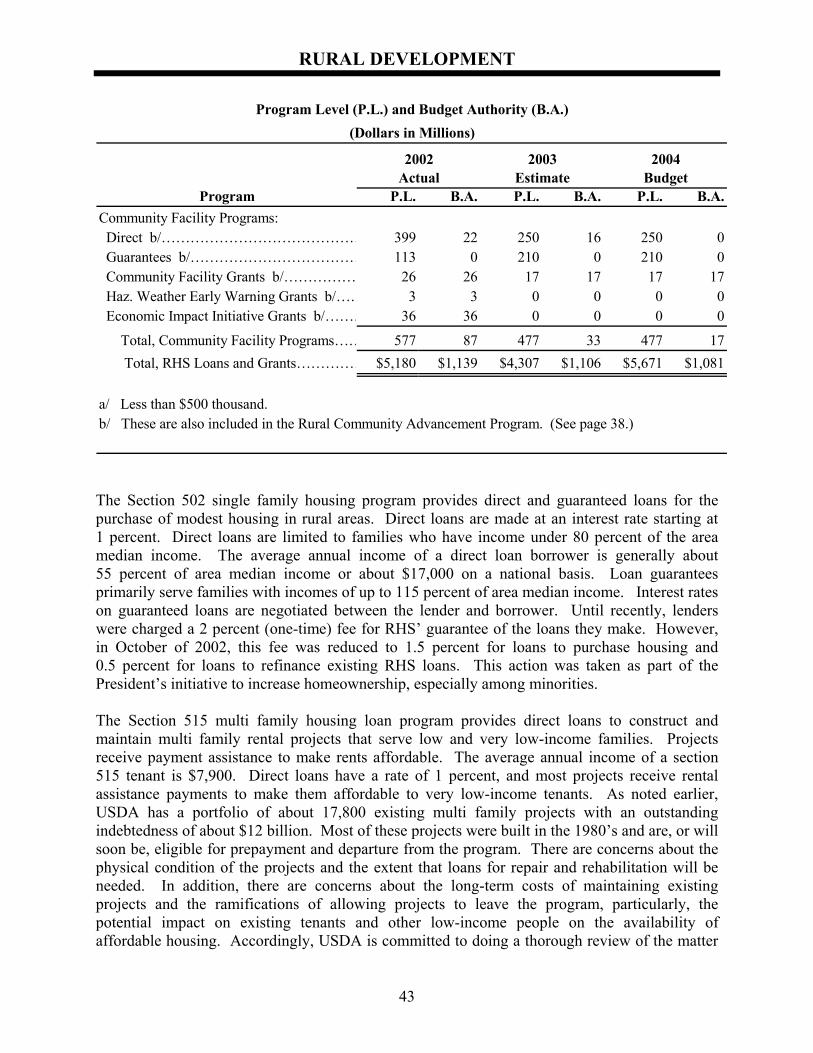
RURAL DEVELOPMENT
43
Program Level (P.L.) and Budget Authority (B.A.)(Dollars in Millions)
2002 2003 2004Actual Estimate Budget
Program P.L. B.A. P.L. B.A. P.L. B.A.Community Facility Programs: Direct b/…………………………………… 399 22 250 16 250 0 Guarantees b/……………………………… 113 0 210 0 210 0 Community Facility Grants b/…………… 26 26 17 17 17 17 Haz. Weather Early Warning Grants b/…… 3 3 0 0 0 0 Economic Impact Initiative Grants b/……… 36 36 0 0 0 0
Total, Community Facility Programs…… 577 87 477 33 477 17 Total, RHS Loans and Grants…………… $5,180 $1,139 $4,307 $1,106 $5,671 $1,081
a/ Less than $500 thousand.b/ These are also included in the Rural Community Advancement Program. (See page 38.)
The Section 502 single family housing program provides direct and guaranteed loans for the purchase of modest housing in rural areas. Direct loans are made at an interest rate starting at 1 percent. Direct loans are limited to families who have income under 80 percent of the area median income. The average annual income of a direct loan borrower is generally about 55 percent of area median income or about $17,000 on a national basis. Loan guarantees primarily serve families with incomes of up to 115 percent of area median income. Interest rates on guaranteed loans are negotiated between the lender and borrower. Until recently, lenders were charged a 2 percent (one-time) fee for RHS’ guarantee of the loans they make. However, in October of 2002, this fee was reduced to 1.5 percent for loans to purchase housing and 0.5 percent for loans to refinance existing RHS loans. This action was taken as part of the President’s initiative to increase homeownership, especially among minorities. The Section 515 multi family housing loan program provides direct loans to construct and maintain multi family rental projects that serve low and very low-income families. Projects receive payment assistance to make rents affordable. The average annual income of a section 515 tenant is $7,900. Direct loans have a rate of 1 percent, and most projects receive rental assistance payments to make them affordable to very low-income tenants. As noted earlier, USDA has a portfolio of about 17,800 existing multi family projects with an outstanding indebtedness of about $12 billion. Most of these projects were built in the 1980’s and are, or will soon be, eligible for prepayment and departure from the program. There are concerns about the physical condition of the projects and the extent that loans for repair and rehabilitation will be needed. In addition, there are concerns about the long-term costs of maintaining existing projects and the ramifications of allowing projects to leave the program, particularly, the potential impact on existing tenants and other low-income people on the availability of affordable housing. Accordingly, USDA is committed to doing a thorough review of the matter
RURAL DEVELOPMENT
44
and developing better strategies for managing the existing portfolio of projects before adding to future costs by funding new projects. Part of this review will include the data generated from the program evaluation included in the 2004 budget on multi family programs. The Section 538 multi family housing loan guarantee program provides guarantees of loans that are made by private lenders. The program is designed to leverage other sources of financing. It serves rural families with incomes up to 115 percent of the area median income, who can afford to pay unsubsidized rents. The program has operated for only a few years and is still evolving. Regulations for administering the program are being revised to make it a more attractive component of the complete funding package, including access to secondary market funds and use of tax credits and other subsidies. The rural rental assistance program provides funding for five year contracts with project owners for reducing rent payments to make up the difference between the 30 percent of income the low-income tenant pays and the rent required for the project owner to meet debt servicing requirements. Most of the funding for this program is used to renew expiring contracts on projects that are financed for up to 50 years although dependent on rental assistance that is funded in five-year increments. The community facilities program provides direct loans, guarantees and grants to finance essential community facilities, with priority given to health and safety facilities. There are three interest rates available on direct loans, with the lowest, 4.5 percent, offered to communities where the median income is below the poverty level and for projects to meet health and safety standards. For community facility programs, the 2004 budget provides $250 million in direct loans, $210 million in guarantees, and $17 million in grants. This level of funding will support over 560 new or improved health care facilities, child care, fire and emergency services and other facilities lacking in rural America.
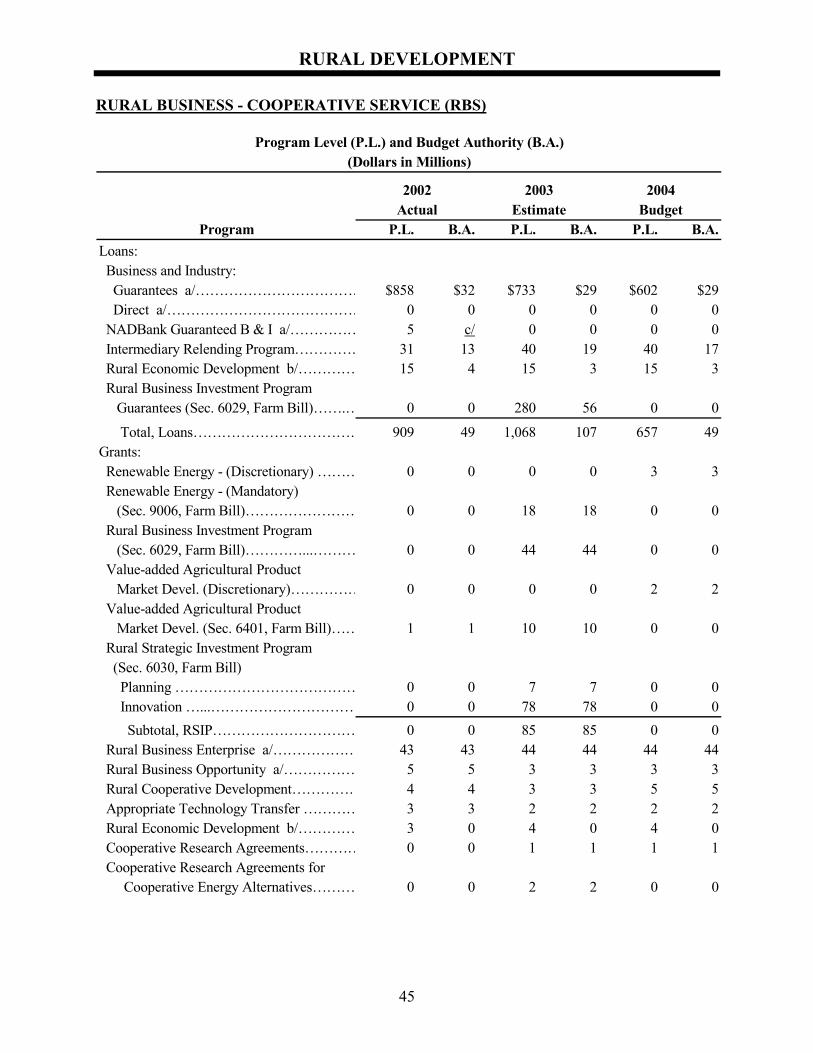
RURAL DEVELOPMENT
45
RURAL BUSINESS - COOPERATIVE SERVICE (RBS)
Program Level (P.L.) and Budget Authority (B.A.)(Dollars in Millions)
2002 2003 2004Actual Estimate Budget
Program P.L. B.A. P.L. B.A. P.L. B.A.Loans: Business and Industry: Guarantees a/……………………………… $858 $32 $733 $29 $602 $29 Direct a/…………………………………… 0 0 0 0 0 0 NADBank Guaranteed B & I a/…………… 5 c/ 0 0 0 0 Intermediary Relending Program…………… 31 13 40 19 40 17 Rural Economic Development b/………… 15 4 15 3 15 3 Rural Business Investment Program Guarantees (Sec. 6029, Farm Bill)…….… 0 0 280 56 0 0
Total, Loans……………………………… 909 49 1,068 107 657 49Grants: Renewable Energy - (Discretionary) ……… 0 0 0 0 3 3 Renewable Energy - (Mandatory) (Sec. 9006, Farm Bill)…………………… 0 0 18 18 0 0 Rural Business Investment Program (Sec. 6029, Farm Bill)…………...……… 0 0 44 44 0 0 Value-added Agricultural Product Market Devel. (Discretionary)…………… 0 0 0 0 2 2 Value-added Agricultural Product Market Devel. (Sec. 6401, Farm Bill)…… 1 1 10 10 0 0 Rural Strategic Investment Program (Sec. 6030, Farm Bill) Planning ………………………………… 0 0 7 7 0 0 Innovation …...………………………… 0 0 78 78 0 0 Subtotal, RSIP………………………… 0 0 85 85 0 0 Rural Business Enterprise a/……………… 43 43 44 44 44 44 Rural Business Opportunity a/…………… 5 5 3 3 3 3 Rural Cooperative Development…………… 4 4 3 3 5 5 Appropriate Technology Transfer ………… 3 3 2 2 2 2 Rural Economic Development b/………… 3 0 4 0 4 0 Cooperative Research Agreements………… 0 0 1 1 1 1 Cooperative Research Agreements for Cooperative Energy Alternatives……… 0 0 2 2 0 0
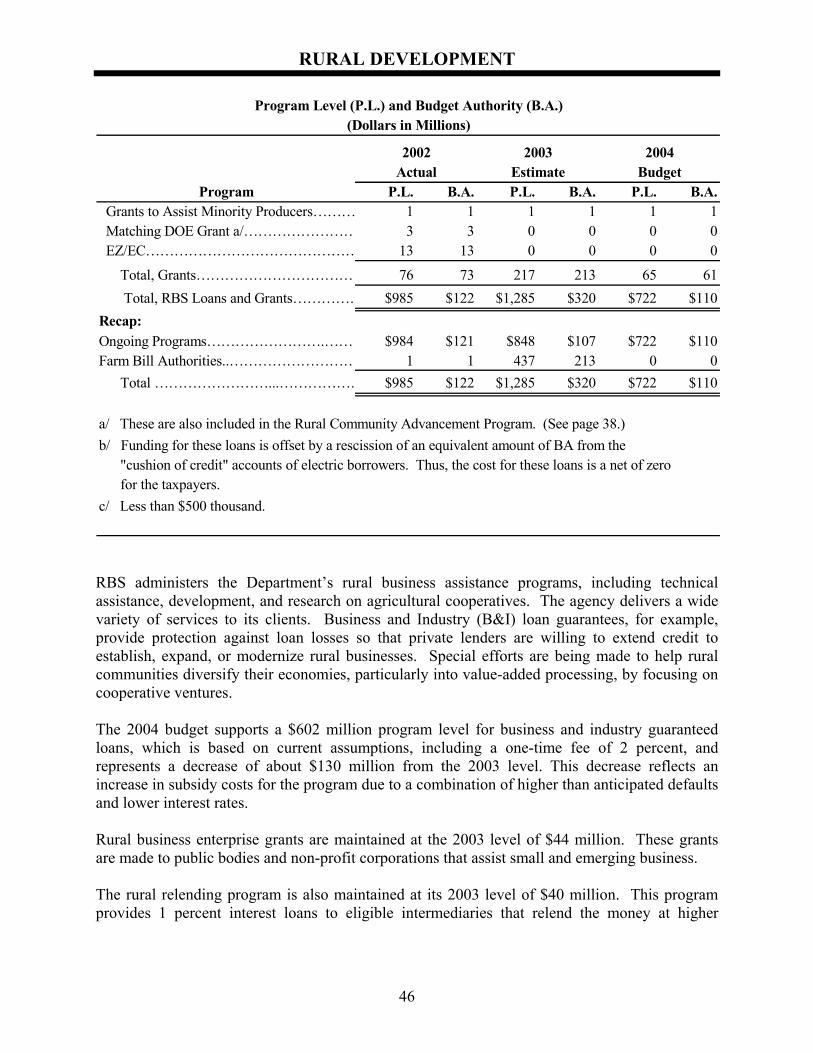
RURAL DEVELOPMENT
46
Program Level (P.L.) and Budget Authority (B.A.)(Dollars in Millions)
2002 2003 2004Actual Estimate Budget
Program P.L. B.A. P.L. B.A. P.L. B.A. Grants to Assist Minority Producers……… 1 1 1 1 1 1 Matching DOE Grant a/…………………… 3 3 0 0 0 0 EZ/EC……………………………………… 13 13 0 0 0 0
Total, Grants…………………………… 76 73 217 213 65 61 Total, RBS Loans and Grants…………… $985 $122 $1,285 $320 $722 $110Recap:Ongoing Programs…………………….……… $984 $121 $848 $107 $722 $110Farm Bill Authorities..……………………… 1 1 437 213 0 0 Total ……………………...……………… $985 $122 $1,285 $320 $722 $110
a/ These are also included in the Rural Community Advancement Program. (See page 38.)b/ Funding for these loans is offset by a rescission of an equivalent amount of BA from the "cushion of credit" accounts of electric borrowers. Thus, the cost for these loans is a net of zero for the taxpayers.c/ Less than $500 thousand.
RBS administers the Department’s rural business assistance programs, including technical assistance, development, and research on agricultural cooperatives. The agency delivers a wide variety of services to its clients. Business and Industry (B&I) loan guarantees, for example, provide protection against loan losses so that private lenders are willing to extend credit to establish, expand, or modernize rural businesses. Special efforts are being made to help rural communities diversify their economies, particularly into value-added processing, by focusing on cooperative ventures. The 2004 budget supports a $602 million program level for business and industry guaranteed loans, which is based on current assumptions, including a one-time fee of 2 percent, and represents a decrease of about $130 million from the 2003 level. This decrease reflects an increase in subsidy costs for the program due to a combination of higher than anticipated defaults and lower interest rates. Rural business enterprise grants are maintained at the 2003 level of $44 million. These grants are made to public bodies and non-profit corporations that assist small and emerging business. The rural relending program is also maintained at its 2003 level of $40 million. This program provides 1 percent interest loans to eligible intermediaries that relend the money at higher
RURAL DEVELOPMENT
47
The 2004 budget also maintains RBS programs that provide research and technical assistance for cooperatives. These programs are relatively modest in size, yet provide opportunities to encourage farmers and rural residents to organize cooperatives as a way to expand their income base. The 2002 Farm Bill authorized a number of new programs that are in the process of being implemented by RBS, including a value-added grants program, a loan and grant program for renewable energy and energy efficiency, and two additional business lending programs – a rural business investment program and a rural strategic investment program. The 2004 budget proposes blocking some of the mandatory funding the 2002 Farm Bill provided for these programs. It also includes discretionary funding instead of mandatory funding for the value-added and renewable energy programs.
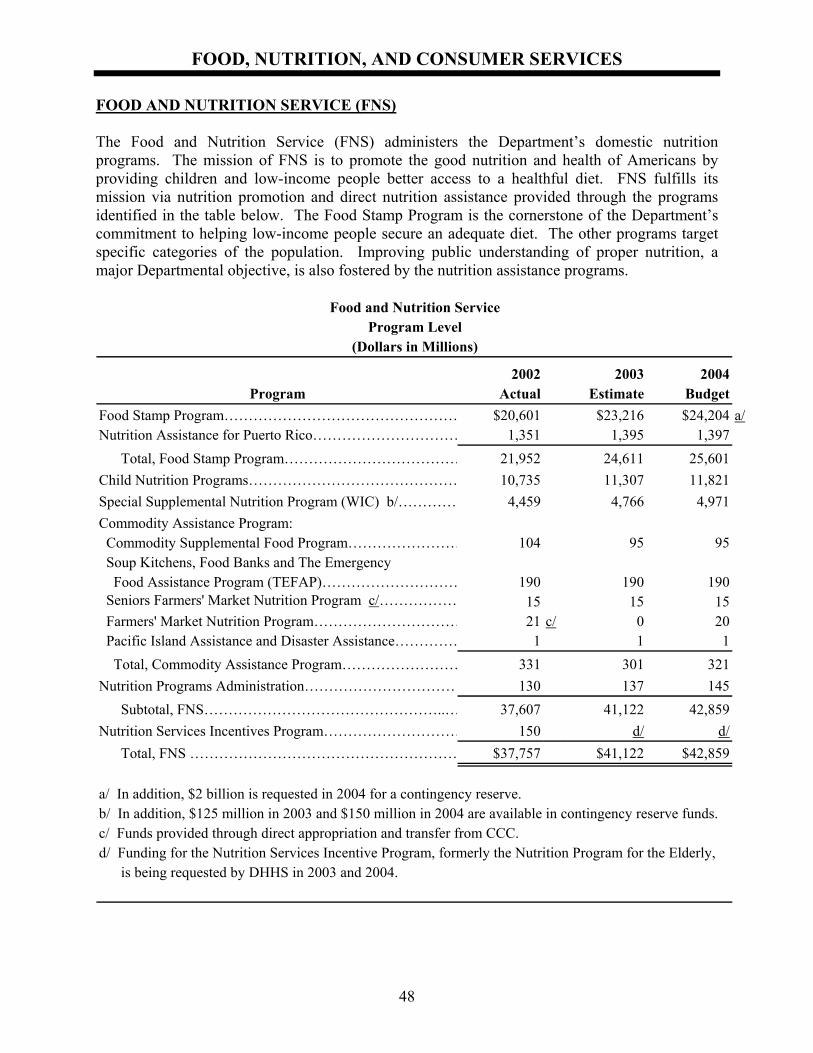
FOOD, NUTRITION, AND CONSUMER SERVICES
48
FOOD AND NUTRITION SERVICE (FNS) The Food and Nutrition Service (FNS) administers the Department’s domestic nutrition programs. The mission of FNS is to promote the good nutrition and health of Americans by providing children and low-income people better access to a healthful diet. FNS fulfills its mission via nutrition promotion and direct nutrition assistance provided through the programs identified in the table below. The Food Stamp Program is the cornerstone of the Department’s commitment to helping low-income people secure an adequate diet. The other programs target specific categories of the population. Improving public understanding of proper nutrition, a major Departmental objective, is also fostered by the nutrition assistance programs.
Food and Nutrition ServiceProgram Level
(Dollars in Millions)
2002 2003 2004Program Actual Estimate Budget
Food Stamp Program………………………………………… $20,601 $23,216 $24,204 a/Nutrition Assistance for Puerto Rico………………………… 1,351 1,395 1,397 Total, Food Stamp Program……………………………… 21,952 24,611 25,601Child Nutrition Programs……………………………………… 10,735 11,307 11,821Special Supplemental Nutrition Program (WIC) b/………… 4,459 4,766 4,971Commodity Assistance Program: Commodity Supplemental Food Program…………………… 104 95 95 Soup Kitchens, Food Banks and The Emergency Food Assistance Program (TEFAP)………………………… 190 190 190 Seniors Farmers' Market Nutrition Program c/……………… 15 15 15 Farmers' Market Nutrition Program………………………… 21 c/ 0 20 Pacific Island Assistance and Disaster Assistance…………… 1 1 1 Total, Commodity Assistance Program…………………… 331 301 321Nutrition Programs Administration…………………………… 130 137 145 Subtotal, FNS…………………………………………..… 37,607 41,122 42,859Nutrition Services Incentives Program………………………… 150 d/ d/ Total, FNS ………………………………………………… $37,757 $41,122 $42,859
a/ In addition, $2 billion is requested in 2004 for a contingency reserve.b/ In addition, $125 million in 2003 and $150 million in 2004 are available in contingency reserve funds.c/ Funds provided through direct appropriation and transfer from CCC.d/ Funding for the Nutrition Services Incentive Program, formerly the Nutrition Program for the Elderly, is being requested by DHHS in 2003 and 2004.
FOOD, NUTRITION, AND CONSUMER SERVICES
49
The 2004 budget funds the anticipated needs for each of these programs. Increases are proposed for the Food Stamp Program, Child Nutrition Programs, and The Special Supplemental Nutrition Program for Women, Infants and Children (WIC) sufficient to provide for anticipated changes in participation and food cost inflation. During 2003, Child Nutrition and WIC Program reauthorization will be requested to extend program authorities from fiscal year 2004 through 2008. Greater emphasis will be directed towards improving program operations and outcomes in terms of the nutritional status of recipients, particularly to help address America’s problems with overweight and obesity. Some details of the nutrition programs follow. Food Stamp Program. The 2004 budget anticipates growth in participation of about 0.9 million, a 3 percent increase over the 2003 estimates (for a total of 21.6 million), projects modest food price inflation, and provides $2 billion for a contingency reserve. The Farm Bill restored eligibility for legal immigrants affecting about 400,000 new recipients when fully implemented. Funding for State administrative expenses has also been increased, and efforts will continue to focus on encouraging all eligible persons to take advantage of food stamps, while providing critical assistance to ease the transition from welfare to work. Greater emphasis is to be placed on improving household nutritional status. The 2004 budget also continues nutrition education and program information activities. The program will also substantially complete implementation of electronic benefit transfer for the delivery of food stamp benefits nationwide. Continued focus will be placed on increasing the proportion of recipients correctly paid. Funding for the Nutrition Assistance Program for Puerto Rico is requested at $1.4 billion, the same as the authorized level. Overall, the budget reflects continued commitment to the nutrition safety net. Child Nutrition Programs. Ensuring access to food for children and improving their eating habits continues to be a priority. The National School Lunch, School Breakfast, Summer Food Service, Special Milk, and Child and Adult Care Food Programs (CACFP) play a significant role in achieving this goal by assisting State and local governments in serving healthful, nutritious meals to children in various settings, with greatest emphasis on helping low-income children. These programs assist pre-school and school-aged children by subsidizing nutritious meals for children in participating schools as well as in child care settings. While children from all income levels are eligible to receive some assistance from these programs, the preponderance of funding is provided in the form of support for meals served to low-income children for free or at a greatly reduced price. Under the current Child Nutrition Programs, especially CACFP, the meal subsidies provide important support for child care. This helps the Nation's working people, as well as work-able welfare recipients, to be able to train for, gain and maintain employment. For 2004, the Child Nutrition Programs are funded at a level that will support anticipated participation and food costs. The Department continues to work with the States to improve the appeal and nutritional quality of school meals and to help schools serve meals that are consistent with The Dietary Guidelines for Americans. The Child Nutrition Programs are due to be reauthorized in 2004. As part of the reauthorization the Administration supports establishing a new system to improve the accuracy of eligibility determinations for free and reduced price meals. Free and reduced price meal data not only are used to allocate about $7 billion a year in meal reimbursements for school meals programs, but
FOOD, NUTRITION, AND CONSUMER SERVICES
50
are also used to target about triple that amount in education grants and resources to low-income children and schools. It is important to all Americans to get the free and reduced price certification data right. The new system will improve access for low-income children already participating in means-tested programs by using program records from Food Stamps or Temporary Assistance for Needy Families (TANF) to directly certify children’s eligibility for free meals. For other households, States will use a combination of third-party wage data, expanded requirements for up-front documentation or other means to verify information reported by households. The reauthorization proposals will support the Secretary’s commitment to the following principles: • Ensure that all eligible children have access to meals; • Provide financial incentives to schools that serve meals that meet The Dietary Guidelines; • Create an equitable mechanism for allocating Federal and State education dollars targeted at
low-income children; • Ensure that meal reimbursement rates provide adequate support for program meals; • Streamline program administration and minimize administrative burden; and • Provide adequate resources for program oversight and evaluate the impact of program
changes on children and participating schools. A program evaluation of the School Lunch Program was conducted as part of the 2004 budget formulation process. As a result of that evaluation, the Administration will: create a system to address the high rate of erroneous payments; create a performance-based reimbursement system; and develop performance measures that meet the long-term goals. WIC. The President’s budget requests a $43 million increase in budget authority. This brings total funds available for WIC in the 2004 budget to a level of nearly $5 billion; a program level increase of $205 million above 2003 and $512 million over 2002. Also, the budget proposes a $150 million contingency fund to cover any unanticipated increases in participation. The funding for the WIC Program will support a monthly average of 7.8 million participants. Ensuring funding for WIC is one of the Secretary’s major priorities, as stated in Food and Agricultural Policy: Taking Stock for the New Century. The WIC Program helps improve the health and nutritional intake of low-income pregnant, breast-feeding and postpartum women, infants and children up to their fifth birthday. WIC works by providing participants with vouchers redeemable for foods dense in nutrients known to be lacking in their diets -- foods such as milk, eggs, cheese, fruit juices, cereal and infant formula. In addition to the supplemental foods provided at no cost to recipients, WIC provides nutrition education so that participants eat a nutritious diet for better health outcomes. Finally, WIC provides referrals to other important health and social services. Over 47 percent of infants born in the United States are WIC beneficiaries each year.
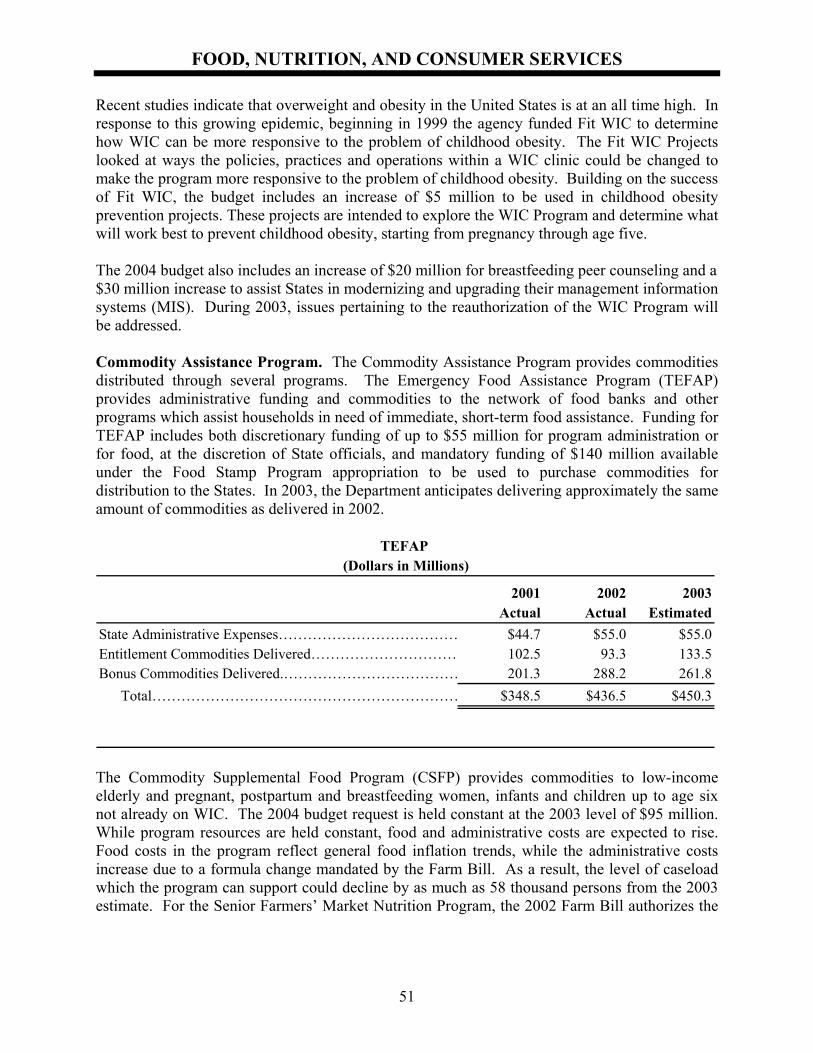
FOOD, NUTRITION, AND CONSUMER SERVICES
51
Recent studies indicate that overweight and obesity in the United States is at an all time high. In response to this growing epidemic, beginning in 1999 the agency funded Fit WIC to determine how WIC can be more responsive to the problem of childhood obesity. The Fit WIC Projects looked at ways the policies, practices and operations within a WIC clinic could be changed to make the program more responsive to the problem of childhood obesity. Building on the success of Fit WIC, the budget includes an increase of $5 million to be used in childhood obesity prevention projects. These projects are intended to explore the WIC Program and determine what will work best to prevent childhood obesity, starting from pregnancy through age five. The 2004 budget also includes an increase of $20 million for breastfeeding peer counseling and a $30 million increase to assist States in modernizing and upgrading their management information systems (MIS). During 2003, issues pertaining to the reauthorization of the WIC Program will be addressed. Commodity Assistance Program. The Commodity Assistance Program provides commodities distributed through several programs. The Emergency Food Assistance Program (TEFAP) provides administrative funding and commodities to the network of food banks and other programs which assist households in need of immediate, short-term food assistance. Funding for TEFAP includes both discretionary funding of up to $55 million for program administration or for food, at the discretion of State officials, and mandatory funding of $140 million available under the Food Stamp Program appropriation to be used to purchase commodities for distribution to the States. In 2003, the Department anticipates delivering approximately the same amount of commodities as delivered in 2002.
TEFAP (Dollars in Millions)
2001 2002 2003Actual Actual Estimated
State Administrative Expenses………………………………… $44.7 $55.0 $55.0Entitlement Commodities Delivered………………………… 102.5 93.3 133.5Bonus Commodities Delivered.……………………………… 201.3 288.2 261.8 Total……………………………………………………… $348.5 $436.5 $450.3
The Commodity Supplemental Food Program (CSFP) provides commodities to low-income elderly and pregnant, postpartum and breastfeeding women, infants and children up to age six not already on WIC. The 2004 budget request is held constant at the 2003 level of $95 million. While program resources are held constant, food and administrative costs are expected to rise. Food costs in the program reflect general food inflation trends, while the administrative costs increase due to a formula change mandated by the Farm Bill. As a result, the level of caseload which the program can support could decline by as much as 58 thousand persons from the 2003 estimate. For the Senior Farmers’ Market Nutrition Program, the 2002 Farm Bill authorizes the
FOOD, NUTRITION, AND CONSUMER SERVICES
52
transfer of $15 million each year from CCC in fiscal years 2003 through 2007. In 2004, $20 million is requested for the Farmers’ Market Nutrition Program for women, infants and children. Nutrition Programs Administration. Funding of $144.8 million is requested to maintain program operations, enhance program integrity initiatives, and increase the emphasis on improved nutrition among participants in the domestic nutrition assistance programs. The budget includes an increase of $7 million for new Child Nutrition Programs integrity efforts and systems improvements. Of this amount $1 million will fund additional Federal staffing in the Nutrition Programs Administration account, and $6 million will be used to enhance program integrity in the Child Nutrition Programs by expanding assessment of certification accuracy in the school meals programs and exploring policy responses. The request also includes an additional $4.3 million to expand and improve nutrition education and obesity prevention efforts. USDA’s ability to simplify and improve the programs, to increase program efforts to improve nutritional outcomes, encouraging healthy and nutritious diets, and expand an obesity prevention campaign, is fostered by the Federal administrative efforts supported by these funds.
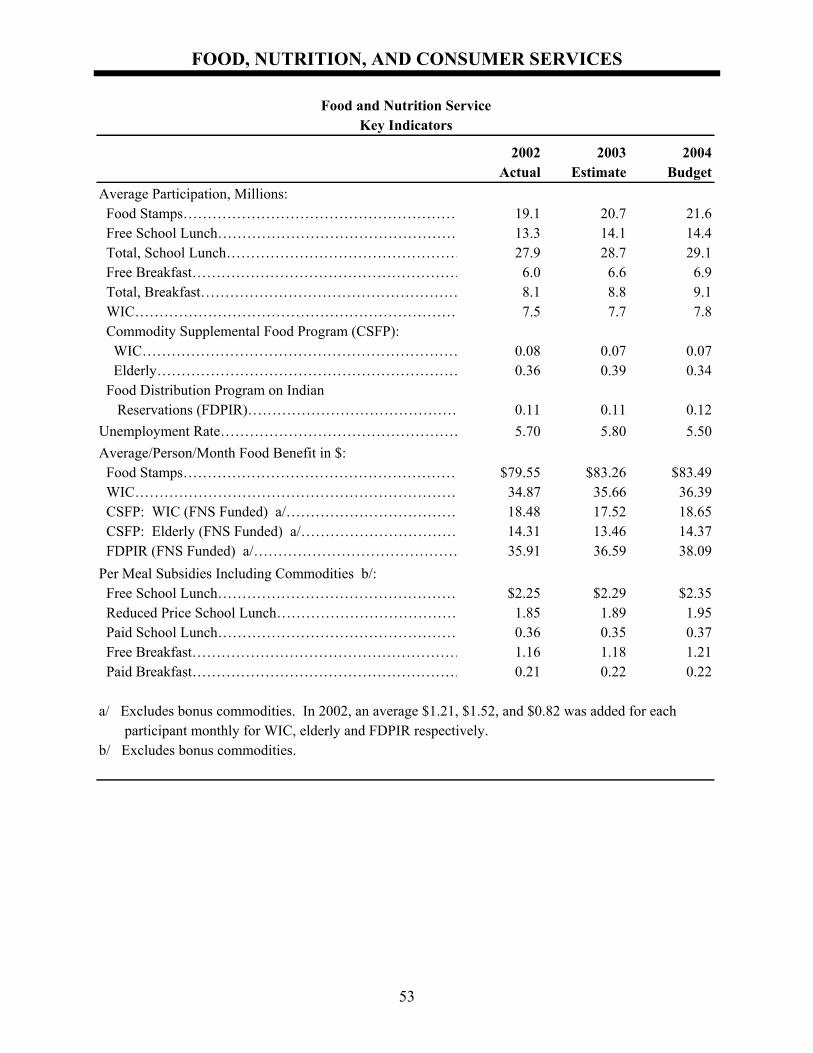
FOOD, NUTRITION, AND CONSUMER SERVICES
53
Food and Nutrition ServiceKey Indicators
2002 2003 2004Actual Estimate Budget
Average Participation, Millions: Food Stamps………………………………………………… 19.1 20.7 21.6 Free School Lunch…………………………………………… 13.3 14.1 14.4 Total, School Lunch………………………………………… 27.9 28.7 29.1 Free Breakfast………………………………………………… 6.0 6.6 6.9 Total, Breakfast……………………………………………… 8.1 8.8 9.1 WIC………………………………………………………… 7.5 7.7 7.8 Commodity Supplemental Food Program (CSFP): WIC………………………………………………………… 0.08 0.07 0.07 Elderly……………………………………………………… 0.36 0.39 0.34 Food Distribution Program on Indian Reservations (FDPIR)……………………………………… 0.11 0.11 0.12Unemployment Rate…………………………………………… 5.70 5.80 5.50Average/Person/Month Food Benefit in $: Food Stamps………………………………………………… $79.55 $83.26 $83.49 WIC………………………………………………………… 34.87 35.66 36.39 CSFP: WIC (FNS Funded) a/……………………………… 18.48 17.52 18.65 CSFP: Elderly (FNS Funded) a/…………………………… 14.31 13.46 14.37 FDPIR (FNS Funded) a/…………………………………… 35.91 36.59 38.09Per Meal Subsidies Including Commodities b/: Free School Lunch…………………………………………… $2.25 $2.29 $2.35 Reduced Price School Lunch………………………………… 1.85 1.89 1.95 Paid School Lunch…………………………………………… 0.36 0.35 0.37 Free Breakfast………………………………………………… 1.16 1.18 1.21 Paid Breakfast………………………………………………… 0.21 0.22 0.22
a/ Excludes bonus commodities. In 2002, an average $1.21, $1.52, and $0.82 was added for each participant monthly for WIC, elderly and FDPIR respectively.b/ Excludes bonus commodities.
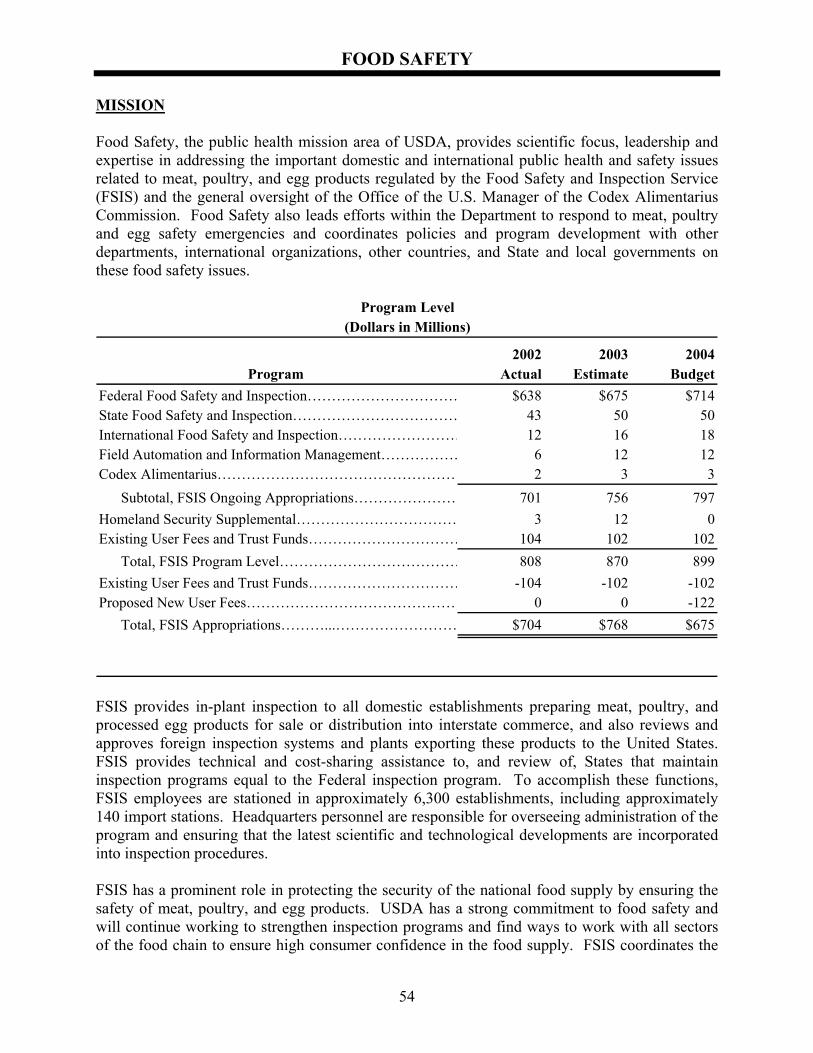
FOOD SAFETY
54
MISSION Food Safety, the public health mission area of USDA, provides scientific focus, leadership and expertise in addressing the important domestic and international public health and safety issues related to meat, poultry, and egg products regulated by the Food Safety and Inspection Service (FSIS) and the general oversight of the Office of the U.S. Manager of the Codex Alimentarius Commission. Food Safety also leads efforts within the Department to respond to meat, poultry and egg safety emergencies and coordinates policies and program development with other departments, international organizations, other countries, and State and local governments on these food safety issues.
Program Level(Dollars in Millions)
2002 2003 2004Program Actual Estimate Budget
Federal Food Safety and Inspection…………………………… $638 $675 $714State Food Safety and Inspection……………………………… 43 50 50International Food Safety and Inspection……………………… 12 16 18Field Automation and Information Management……………… 6 12 12Codex Alimentarius…………………………………………… 2 3 3 Subtotal, FSIS Ongoing Appropriations………………… 701 756 797Homeland Security Supplemental…………………………… 3 12 0Existing User Fees and Trust Funds…………………………… 104 102 102 Total, FSIS Program Level………………………………… 808 870 899Existing User Fees and Trust Funds…………………………… -104 -102 -102Proposed New User Fees……………………………………… 0 0 -122 Total, FSIS Appropriations………...……………………… $704 $768 $675
FSIS provides in-plant inspection to all domestic establishments preparing meat, poultry, and processed egg products for sale or distribution into interstate commerce, and also reviews and approves foreign inspection systems and plants exporting these products to the United States. FSIS provides technical and cost-sharing assistance to, and review of, States that maintain inspection programs equal to the Federal inspection program. To accomplish these functions, FSIS employees are stationed in approximately 6,300 establishments, including approximately 140 import stations. Headquarters personnel are responsible for overseeing administration of the program and ensuring that the latest scientific and technological developments are incorporated into inspection procedures. FSIS has a prominent role in protecting the security of the national food supply by ensuring the safety of meat, poultry, and egg products. USDA has a strong commitment to food safety and will continue working to strengthen inspection programs and find ways to work with all sectors of the food chain to ensure high consumer confidence in the food supply. FSIS coordinates the
FOOD SAFETY
55
development of its policies with other USDA agencies, the Food and Drug Administration (FDA), the Environmental Protection Agency (EPA), the Centers for Disease Control and Prevention (CDC), as well as international organizations, to ensure an integrated farm-to-table approach to food safety. To ensure that FSIS continues to achieve the goals for improving food safety that are identified in the USDA Strategic Plan, the 2004 budget proposes a program level of $899 million, a net increase of about $29 million over the 2003 current estimate. Of this amount, $675 million would be funded through appropriated funds and $224 million would be funded through user fees. Funds are requested to cover the costs of Federal inspection and for maintaining Federal support of State inspection programs. The budget requests resources necessary to support FSIS food safety activities and fund approximately 7,680 meat and poultry inspectors, an increase of 80 inspectors from 2003 for industry growth. The 2004 budget also includes funding that is aimed at achieving FSIS’ strategic goal of improving public health by further reducing the prevalence of foodborne hazards from farm to table, striving to become a model for all other public health institutions. Specifically, funding is provided to strengthen domestic and international enforcement of regulatory requirements. Microbiological testing will be increased to ensure that establishments are effectively controlling or eliminating the presence of pathogens in products and to measure FSIS performance in achieving its goal of reducing foodborne illness. The budget also provides for training for in-plant inspectors to enhance consistency and effectiveness of inspection. Inspectors highly trained in HACCP must be the backbone of our food safety infrastructure. This educational effort for USDA inspectors will provide them the skill necessary to more easily and effectively implement science-based policies and programs. Funding is also included to evaluate and design a mass media campaign aimed at improving the safe food handling practices of consumers. A well educated public is better prepared to understand and address the food safety hazards they face and therefore be more confident in the food they buy and eat. FSIS has been moving in recent years to a science-based food safety regulatory system based on performance standards and risk-based allocation of resources. Analyses have identified that the slaughter inspection system can be modified to improve the efficiency by which USDA conducts inspection. In order to realize these efficiencies, FSIS will evaluate the costs and benefits associated with expanding the use of more efficient inspection processes. A program evaluation of the Food Safety and Inspection Service was conducted as part of the 2004 budget formulation process. As a result of that evaluation, the Administration will evaluate the impact of implementing a risk-based inspection system beyond the current pilot program. FSIS collects $102 million in user fees annually to recover the cost of overtime, holiday, and voluntary inspection. Under the 2004 budget, legislation will be proposed to collect an additional $122 million in user fees annually by recovering the cost of providing inspection services beyond an approved eight-hour primary shift. The Federal government would continue to fund 100 percent of the costs of meat, poultry, and egg products inspection services for one complete primary work shift in all establishments. Current overtime and holiday policies will
FOOD SAFETY
56
not change. Recovering a greater portion of these funds through user fees would result in savings to the taxpayer. These fees will have a minimal impact on prices. FSIS’ program responsibilities include: Federal Food Safety and Inspection. FSIS inspects all carcasses in slaughter plants for disease and other abnormalities, and samples for the presence of chemical residues and microbiological contaminants. Meat and poultry processing operations are inspected by FSIS at a minimum on a daily basis. Typical processing operations include cutting, boning, curing, freezing and canning. Inspector activities include inspections of plant operations for sanitation and cleanliness, labeling, and packing functions. FSIS provides mandatory, continuous in-plant inspection to egg product processing plants. FSIS inspectors check the sanitation of plant and equipment, and determine if the egg products have been properly processed. FSIS operates three laboratories to perform scientific testing in support of inspection operations. Samples sent to the laboratories are analyzed for food chemistry and to identify the presence of pathogens, residues, additives, disease, and foreign matter. Other responsibilities ensure that establishments develop and implement acceptable HACCP plans, sanitation standard operating procedures, and humane methods of slaughter. State Food Safety and Inspection. FSIS has authority to approve State meat and poultry inspection programs for products traveling in intrastate commerce. FSIS reviews State inspection programs to assure that standards, at least equal to Federal standards, are applied to meat and poultry plants under State jurisdiction. For State inspection programs, USDA contributes, through the Grants to States Program, up to 50 percent of each State's costs. Currently, 28 States participate in the program. FSIS also provides special assistance in the form of training and technical assistance to a variety of State and local agencies that play important roles in reducing risks associated with meat and poultry products. International Food Safety and Inspection. FSIS reviews and approves inspection systems in countries exporting meat, poultry and egg products to the U.S. and inspects imported products at ports-of-entry. Field Automation and Information Management (FAIM). FAIM provides automated technology, scheduling information, regulatory information and improved telecommunications capability among the widely dispersed field inspection workforce and State inspection programs. Codex Alimentarius Commission. FSIS coordinates U.S. participation in and informs the public of the sanitary and phytosanitary standard setting activities of the Codex Alimentarius Commission. FSIS enhances U.S. leadership in international food safety issues by training U.S. delegates in Codex procedures and gathering international support for the science-based factors needed to design international food safety standards. Existing User Fees and Trust Funds. Currently, user fees are collected to recover the cost of inspection provided beyond regularly scheduled operations and on holidays. Establishments requesting voluntary inspection services, which are not mandated by law, are also charged a user fee to recover the full costs of the inspection.

NATURAL RESOURCES AND ENVIRONMENT
57
MISSION The mission of the Natural Resources and Environment area is to promote the conservation and sustainable use of natural resources on the Nation's private lands and to sustain production of all the goods and services that the public demands of the National Forests. This mission also supports one of the key strategic goals from the USDA Strategic Plan which is to protect and enhance the Nation’s natural resource base and environment. Two agencies, the Natural Resources Conservation Service (NRCS) and the Forest Service (FS), are primarily responsible for achieving this mission.
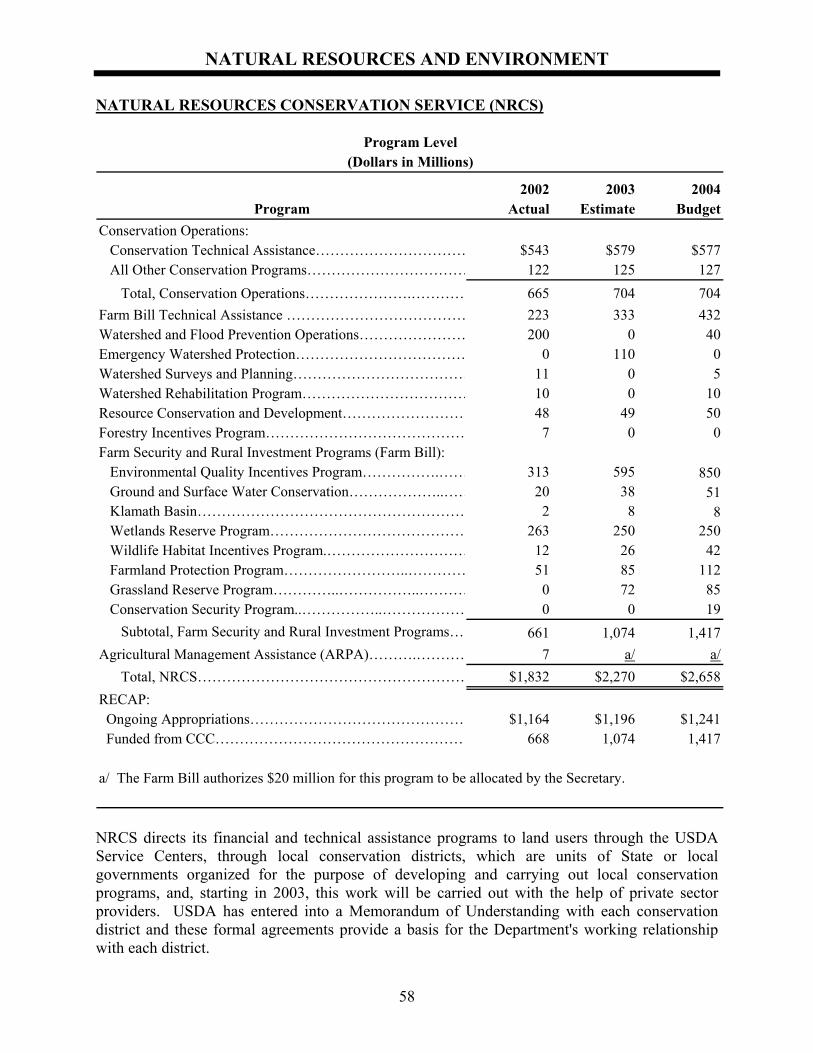
NATURAL RESOURCES AND ENVIRONMENT
58
NATURAL RESOURCES CONSERVATION SERVICE (NRCS)
Program Level(Dollars in Millions)
2002 2003 2004Program Actual Estimate Budget
Conservation Operations: Conservation Technical Assistance…………………………… $543 $579 $577 All Other Conservation Programs…………………………… 122 125 127 Total, Conservation Operations………………….………… 665 704 704Farm Bill Technical Assistance ………………………………… 223 333 432Watershed and Flood Prevention Operations…………………… 200 0 40Emergency Watershed Protection……………………………… 0 110 0Watershed Surveys and Planning……………………………… 11 0 5Watershed Rehabilitation Program……………………………… 10 0 10Resource Conservation and Development……………………… 48 49 50Forestry Incentives Program…………………………………… 7 0 0Farm Security and Rural Investment Programs (Farm Bill): Environmental Quality Incentives Program…………….…… 313 595 850 Ground and Surface Water Conservation………………..…… 20 38 51 Klamath Basin………………………………………………… 2 8 8 Wetlands Reserve Program…………………………………… 263 250 250 Wildlife Habitat Incentives Program.………………………… 12 26 42 Farmland Protection Program……………………..………… 51 85 112 Grassland Reserve Program…………..……………..………… 0 72 85 Conservation Security Program..……………..……………… 0 0 19 Subtotal, Farm Security and Rural Investment Programs…… 661 1,074 1,417Agricultural Management Assistance (ARPA)……….………… 7 a/ a/ Total, NRCS………………………………………………… $1,832 $2,270 $2,658RECAP: Ongoing Appropriations……………………………………… $1,164 $1,196 $1,241 Funded from CCC……………………………………………… 668 1,074 1,417
a/ The Farm Bill authorizes $20 million for this program to be allocated by the Secretary.
NRCS directs its financial and technical assistance programs to land users through the USDA Service Centers, through local conservation districts, which are units of State or local governments organized for the purpose of developing and carrying out local conservation programs, and, starting in 2003, this work will be carried out with the help of private sector providers. USDA has entered into a Memorandum of Understanding with each conservation district and these formal agreements provide a basis for the Department's working relationship with each district.
NATURAL RESOURCES AND ENVIRONMENT
59
The President’s 2004 budget for NRCS will focus on ensuring that the important ongoing and new conservation programs authorized in the 2002 Farm Bill are implemented efficiently. One new element that will support this goal is the creation through a 2003 budget amendment of a new Farm Bill Technical Assistance Account within NRCS to fund all technical assistance costs needed to implement all the 2002 Farm Bill conservation programs. Farm Bill Technical Assistance Account. In a 2003 budget amendment, the Administration proposed establishing a new account to fund the technical assistance needed to implement the conservation programs authorized in the 2002 Farm Bill. Prior to this, funding from these programs was used for both technical and financial assistance. However, the Department of Justice has determined that Commodity Credit Corporation funding for federally provided technical assistance is limited by a statutory cap. The maximum allowable funding under this cap is insufficient to support the needed technical assistance to the recipients of these programs. The 2004 budget proposes the Farm Bill Technical Assistance account at a level of $432 million and will provide funding of all technical assistance costs needed to operate the 2002 Farm Bill conservation programs which include the Conservation Reserve Program, the Wetlands Reserve Program, the Environmental Quality Incentives Program, the Wildlife Habitat Incentives Program, the Farmland Protection Program, the Conservation Security Program and the Grasslands Reserve Program. Conservation Operations (CO). The 2004 budget proposes $704 million for CO, the same level as requested in 2003, which includes $577 million for conservation technical assistance (CTA). This will continue the agency's activities that support locally led, voluntary conservation through the unique partnership that has been developed over the years with each conservation district. This partnership provides the foundation on which the Department addresses many of the Nation’s critical natural resource issues such as maintaining agricultural productivity and water quality and leverages additional investment from non-Federal sources. The CTA total will also enable NRCS to increase support for certain activities as well as maintain funding for ongoing high priority work. For example, increases are provided in the budget for additional specialized staff and training to help address air quality problems in areas that are not in compliance with national air quality standards; to enhance the Customer Service Toolkit which provides NRCS field staff with the geographic data and technical tools that they need to adequately deliver Farm Bill conservation and other field programs; and to establish a monitoring and evaluation regimen that will provide more meaningful performance goals and measures for Farm Bill conservation programs. High priority ongoing work that will be maintained includes addressing water pollution caused by Animal Feeding Operations (AFOs) as well as providing specialized technical assistance to land users on grazing lands. In addition to regular technical assistance support provided to grazing land customers, the budget proposes to maintain funding for the Grazing Land Conservation Initiative (GLCI) at $22 million in 2004. The GLCI is a private coalition of producer groups and environmental organizations that supports voluntary technical assistance to private grazing landowners and managers.
NATURAL RESOURCES AND ENVIRONMENT
60
Watershed and Flood Prevention Operations (WFPO). The 2004 budget includes $40 million for the PL 566 watershed program while requesting no funding for the Emergency Watershed Protection Program. The budget directs PL 566 resources to those projects that are under way and for which Federal support is critical for their successful implementation. NRCS will focus the program on developing and funding non-structural flood prevention measures. Watershed Surveys and Planning. NRCS works with local sponsoring organizations to develop plans on watersheds dealing with water quality, flooding, water and land management, and sedimentation problems. These plans then form the basis for installing needed improvements. The agency also works cooperatively with State and local governments to develop river basin surveys and floodplain management studies to help identify water and related land resource problems and evaluate alternative solutions. In 2004, this activity will be funded at a level of $5 million to ensure that this important work is continued. Watershed Rehabilitation Program. One of the agency’s strategic goals is to reduce risks from drought and flooding to protect community health and safety. A key tool in meeting this goal is providing financial and technical assistance to communities to implement high priority watershed rehabilitation projects to address the more than 11,000 dams installed with USDA assistance that will be or are now at the end of their 50-year life span. Some dams already pose a significant threat to public safety and these will naturally be the first to be addressed. The budget proposes $10 million to continue the work begun in 2002. Resource Conservation and Development (RC&D). The purpose of the RC&D program is to encourage and improve the capability of State and local units of government and local nonprofit organizations in rural areas to plan, develop, and carry out programs for RC&D. NRCS also helps coordinate available Federal, State, and local programs. The 2004 budget proposes a level of $50 million which will support the 368 RC&D areas now authorized. Environmental Quality Incentives Program (EQIP). The purpose of EQIP is to provide flexible assistance to landowners that face serious natural resource challenges that impact soil, water and related natural resources, including grazing lands, wetlands, and wildlife habitat management. EQIP was reauthorized by the 2002 Farm Bill through 2007 at a total funding level of $5.8 billion, including $1 billion for 2004. The budget proposes a level of $850 million for financial assistance with the $150 million balance being used to partially fund the Farm Bill Technical Assistance account. Wetlands Reserve Program (WRP). WRP is a voluntary program in which landowners are paid to retire cropland from agricultural production if those lands are restored to wetlands and protected, in most cases, with a long-term or permanent easement. Landowners receive fair market value for the land and are provided with cost-share assistance to cover the restoration expenses. The 2002 Farm Bill increased the program cap to 2,275,000 acres and the budget estimates that about 178,000 acres will be enrolled in 2004. Grassland Reserve Program (GSP). The 2002 Farm Bill authorized the GSP to assist landowners in restoring and protecting grassland by enrolling up to 2 million acres under easement or long-term rental agreements. The program participant would also enroll in a
NATURAL RESOURCES AND ENVIRONMENT
61
restoration agreement to restore the functions and values of the grassland. The 2002 Farm Bill authorized $254 million for implementation of this program during the period 2003-2007. Conservation Security Program (CSP). CSP, as authorized by the 2002 Farm Bill, is a voluntary program that provides financial and technical assistance for the conservation, protection and improvement of natural resources on Tribal and private working lands. The program provides payments for producers to install conservation systems with high levels of performance. The budget proposes to cap CSP at $2 billion over ten years, 2003 through 2012, for financial assistance. Wildlife Habitat Incentives Program (WHIP). WHIP is a voluntary program that provides cost-sharing for landowners to apply an array of wildlife practices to develop habitat that will support upland wildlife, wetland wildlife, threatened and endangered species, fisheries, and other types of wildlife. The 2002 Farm Bill authorized $360 million for implementation of the program during the period 2002 through 2007 including $60 million in 2004. The budget funds a level of $42 million in financial assistance with the balance being used to fund the Farm Bill Technical Assistance account. A program evaluation of the Wildlife Habitat Incentives Program was conducted as part of the 2004 budget formulation process. As a result of that evaluation, the Administration will: develop outcome measures and targets; conduct an internal review of the program; and request an increase in the discretionary appropriation to design and implement an evaluation system to provide outcome performance indicators. Farmland Protection Program (FPP). Through FPP, the Federal Government establishes partnerships with State, local or tribal government entities or nonprofit organizations to share the costs of acquiring conservation easements or other interests to limit conversion of agricultural lands to non-agricultural uses. FPP acquires perpetual conservation easements on a voluntary basis on lands with prime, unique, or other productive soil that presents the most social, economic, and environmental benefits. FPP provides matching funds of no more than 50 percent of the purchase price for the acquired easements. The 2002 Farm Bill authorized a total of $597 million for the program through 2007 including $125 million in 2004. The budget funds a level of $112 million in financial assistance with the balance being used to fund the Farm Bill Technical Assistance account. A program evaluation of the Farmland Protection Program was conducted as part of the 2004 budget formulation process. As a result of that evaluation, the Administration recommends: development of improved performance measures; and increasing discretionary appropriations to design and implement an evaluation system to provide outcome performance indicators. Conservation Reserve Program (CRP). CRP is administered by the Farm Service Agency (FSA) and is described on page 20.
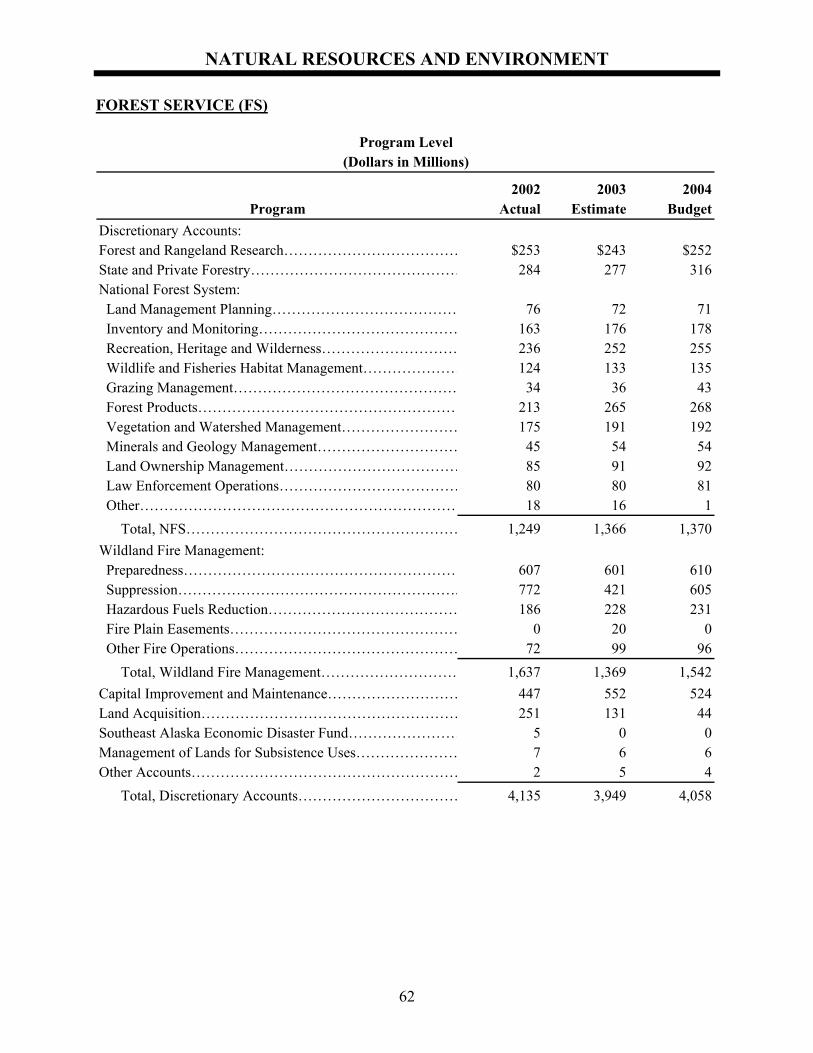
NATURAL RESOURCES AND ENVIRONMENT
62
FOREST SERVICE (FS)
Program Level(Dollars in Millions)
2002 2003 2004Program Actual Estimate Budget
Discretionary Accounts:Forest and Rangeland Research……………………………… $253 $243 $252State and Private Forestry……………………………………… 284 277 316National Forest System: Land Management Planning………………………………… 76 72 71 Inventory and Monitoring…………………………………… 163 176 178 Recreation, Heritage and Wilderness………………………… 236 252 255 Wildlife and Fisheries Habitat Management………………… 124 133 135 Grazing Management………………………………………… 34 36 43 Forest Products……………………………………………… 213 265 268 Vegetation and Watershed Management…………………… 175 191 192 Minerals and Geology Management………………………… 45 54 54 Land Ownership Management……………………………… 85 91 92 Law Enforcement Operations………………………………… 80 80 81 Other………………………………………………………… 18 16 1 Total, NFS………………………………………………… 1,249 1,366 1,370Wildland Fire Management: Preparedness………………………………………………… 607 601 610 Suppression…………………………………………………. 772 421 605 Hazardous Fuels Reduction………………………………… 186 228 231 Fire Plain Easements………………………………………… 0 20 0 Other Fire Operations………………………………………… 72 99 96 Total, Wildland Fire Management………………………… 1,637 1,369 1,542Capital Improvement and Maintenance……………………… 447 552 524Land Acquisition……………………………………………… 251 131 44Southeast Alaska Economic Disaster Fund…………………… 5 0 0Management of Lands for Subsistence Uses………………… 7 6 6Other Accounts………………………………………………… 2 5 4 Total, Discretionary Accounts…………………………… 4,135 3,949 4,058
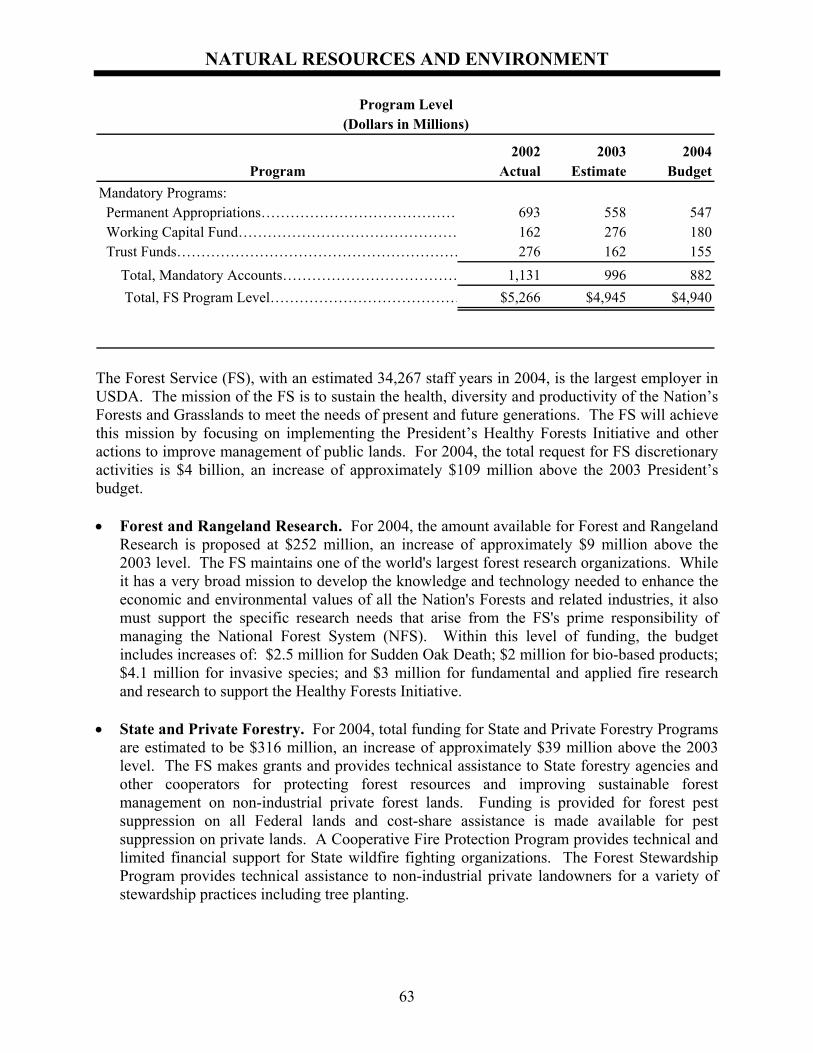
NATURAL RESOURCES AND ENVIRONMENT
63
Program Level(Dollars in Millions)
2002 2003 2004Program Actual Estimate Budget
Mandatory Programs: Permanent Appropriations…………………………………… 693 558 547 Working Capital Fund……………………………………… 162 276 180 Trust Funds…………………………………………………… 276 162 155 Total, Mandatory Accounts……………………………… 1,131 996 882 Total, FS Program Level………………………………… $5,266 $4,945 $4,940
The Forest Service (FS), with an estimated 34,267 staff years in 2004, is the largest employer in USDA. The mission of the FS is to sustain the health, diversity and productivity of the Nation’s Forests and Grasslands to meet the needs of present and future generations. The FS will achieve this mission by focusing on implementing the President’s Healthy Forests Initiative and other actions to improve management of public lands. For 2004, the total request for FS discretionary activities is $4 billion, an increase of approximately $109 million above the 2003 President’s budget. • Forest and Rangeland Research. For 2004, the amount available for Forest and Rangeland
Research is proposed at $252 million, an increase of approximately $9 million above the 2003 level. The FS maintains one of the world's largest forest research organizations. While it has a very broad mission to develop the knowledge and technology needed to enhance the economic and environmental values of all the Nation's Forests and related industries, it also must support the specific research needs that arise from the FS's prime responsibility of managing the National Forest System (NFS). Within this level of funding, the budget includes increases of: $2.5 million for Sudden Oak Death; $2 million for bio-based products; $4.1 million for invasive species; and $3 million for fundamental and applied fire research and research to support the Healthy Forests Initiative.
• State and Private Forestry. For 2004, total funding for State and Private Forestry Programs
are estimated to be $316 million, an increase of approximately $39 million above the 2003 level. The FS makes grants and provides technical assistance to State forestry agencies and other cooperators for protecting forest resources and improving sustainable forest management on non-industrial private forest lands. Funding is provided for forest pest suppression on all Federal lands and cost-share assistance is made available for pest suppression on private lands. A Cooperative Fire Protection Program provides technical and limited financial support for State wildfire fighting organizations. The Forest Stewardship Program provides technical assistance to non-industrial private landowners for a variety of stewardship practices including tree planting.
NATURAL RESOURCES AND ENVIRONMENT
64
The budget proposes a $12 million emerging pest and pathogen fund. The fund would be used to respond to new introductions of non-native or invasive pests or pathogens, and in limited instances to respond to a significant population increase over the previous year. As part of full funding for the Land and Water Conservation Fund, the Forest Legacy Program is funded at $91 million, an increase of $21 million over the 2003 level, and the Forest Stewardship Program is funded at $66 million, an increase of approximately $16 million over the 2003 level. The Forest Legacy Program helps conserve environmentally important forests threatened by conversion to non-forest uses, through the acquisition of land or interests in land through States. In cooperation with States, the Forest Stewardship Program assists forest landowners with planning and implementation of sustainable forest management. The additional funding for the Forest Stewardship Program is to be allocated on a competitive basis to support stewardship projects related to hazardous fuels reduction, invasive species management and the sustainable management of timber and non-timber resources.
• National Forest System (NFS). For 2004, total funding for NFS is proposed at
$1.37 billion. The FS manages approximately 192 million acres of public land -- an area about 110 percent the size of the State of Texas -- located in 44 States, Puerto Rico, and the Virgin Islands. These lands, known collectively as the NFS, are managed for multiple uses on a sustained-yield basis to meet the needs of people today while maintaining or improving the productivity, health, resilience and vigor of forest resources for future generations. The National Forests produce diverse benefits for the American people ranging from outdoor recreation, wildlife, fish and watershed protection, to timber, forage and minerals. The budget includes an additional $7 million for Grazing Management. Funding for management of the National Forests includes $268 million to support a timber sales offer level of approximately 2.0 billion board feet, depending on salvage sales volume. In addition, the budget proposes legislation to create a permanent recreation fee program.
A program evaluation of Capital Improvement and Maintenance was conducted as part of the 2004 budget formulation process. As a result of that evaluation, the Administration will: fund deferred maintenance projects out of roads, facilities and trails accounts; improve annual performance measures; improve the project prioritization process; and increase incentives aimed at decommissioning obsolete and underutilized infrastructure.
• Land Acquisition. For 2004, funding is proposed at $44 million for Land Acquisition. The
agency is shifting its focus from acquiring new land to protecting life, property, and natural resources on NFS land, including fire preparedness and restoration of ecosystems to fire-tolerant conditions, reducing forest management costs, and increasing forest production. FS will concentrate on the acquisition of lands in backlog from previously appropriated funding, with a focused number of new acquisitions projects. Program emphasis on new projects will be placed on securing only the highest priority land to protect wetlands, riparian areas, threatened and endangered species habitat, and other high value conservation areas.
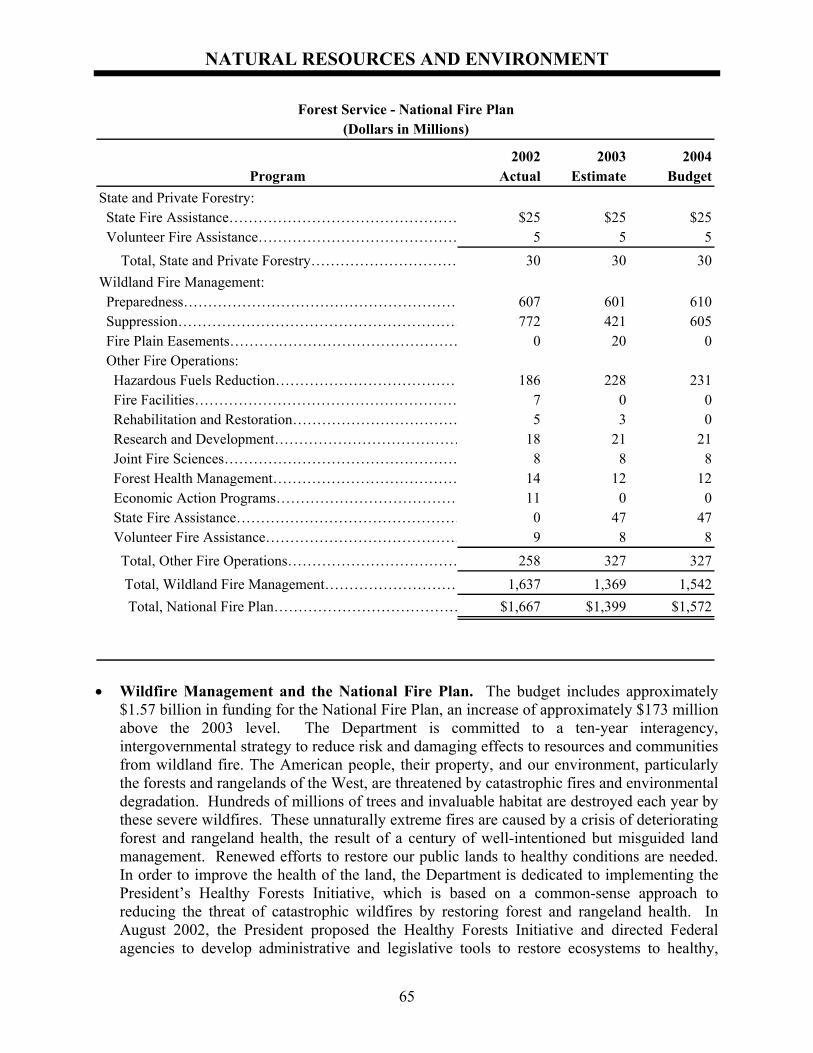
NATURAL RESOURCES AND ENVIRONMENT
65
Forest Service - National Fire Plan(Dollars in Millions)
2002 2003 2004Program Actual Estimate Budget
State and Private Forestry: State Fire Assistance………………………………………… $25 $25 $25 Volunteer Fire Assistance…………………………………… 5 5 5 Total, State and Private Forestry………………………… 30 30 30Wildland Fire Management: Preparedness………………………………………………… 607 601 610 Suppression…………………………………………………… 772 421 605 Fire Plain Easements………………………………………… 0 20 0 Other Fire Operations: Hazardous Fuels Reduction………………………………… 186 228 231 Fire Facilities……………………………………………… 7 0 0 Rehabilitation and Restoration……………………………… 5 3 0 Research and Development………………………………… 18 21 21 Joint Fire Sciences………………………………………… 8 8 8 Forest Health Management………………………………… 14 12 12 Economic Action Programs………………………………… 11 0 0 State Fire Assistance………………………………………… 0 47 47 Volunteer Fire Assistance…………………………………… 9 8 8 Total, Other Fire Operations……………………………… 258 327 327 Total, Wildland Fire Management……………………… 1,637 1,369 1,542 Total, National Fire Plan………………………………… $1,667 $1,399 $1,572
• Wildfire Management and the National Fire Plan. The budget includes approximately
$1.57 billion in funding for the National Fire Plan, an increase of approximately $173 million above the 2003 level. The Department is committed to a ten-year interagency, intergovernmental strategy to reduce risk and damaging effects to resources and communities from wildland fire. The American people, their property, and our environment, particularly the forests and rangelands of the West, are threatened by catastrophic fires and environmental degradation. Hundreds of millions of trees and invaluable habitat are destroyed each year by these severe wildfires. These unnaturally extreme fires are caused by a crisis of deteriorating forest and rangeland health, the result of a century of well-intentioned but misguided land management. Renewed efforts to restore our public lands to healthy conditions are needed. In order to improve the health of the land, the Department is dedicated to implementing the President’s Healthy Forests Initiative, which is based on a common-sense approach to reducing the threat of catastrophic wildfires by restoring forest and rangeland health. In August 2002, the President proposed the Healthy Forests Initiative and directed Federal agencies to develop administrative and legislative tools to restore ecosystems to healthy,
NATURAL RESOURCES AND ENVIRONMENT
66
natural conditions, and assist in executing the core components of the National Fire Plan. Since the President’s direction, FS has taken several administrative steps to implement components of the Healthy Forests Initiative including the promulgation of two new “categorical exclusions” for hazardous fuels reduction and rehabilitation and stabilization projects. Congressional authorization will also be needed to implement other components of the Initiative.
The Wildland Fire Management programs that are involved in the National Fire Plan fund preparedness costs such as the pay and training of permanent fire crews and aircraft availability, the cost of operations to suppress fires, and hazardous fuels reduction activities. The State and Private Forestry Programs in the National Fire Plan provide funds for cooperative fire assistance and increased volunteer fire department readiness. Forest and Rangeland Research activities include: research related to enhancing firefighting capacity and preparedness; restoring landscapes and rebuilding communities; and reducing hazardous fuels and fire risks. The 2004 budget maintains funding for priority activities and is faithful to commitments made to increase efforts to fight wildfires, reduce the risk of fire, and assist communities including: $231 million for hazardous fuels reduction (allows for the treatment of 1.3 million total acres); $610 million for preparedness; and $605 million for suppression activities which provides funding at the 10-year average adjusted for inflation. The Department will take steps to address concerns raised about the rising costs of fighting fire and the reporting of fire obligations. The Forest Service and the Department of Interior plan on: developing cost containment strategies; revising procedures to improve the reporting of fire suppression spending; reviewing the cost-effectiveness of large fire aviation resources; and assessing the consistency of State cost-share agreements. A program evaluation of Wildland Fire Management was conducted as part of the 2004 budget formulation process. As a result of that evaluation, the Administration will: develop a real-time obligation system; assess state cost-share agreements; develop a new fire preparedness model; and establish hazardous fuels project criteria consistent with the 10-year Implementation Strategy.
MARKETING AND REGULATORY PROGRAMS
67
MISSION The mission of Marketing and Regulatory Programs is to facilitate and expand the domestic and international marketing of U.S. agricultural products, to help protect the agricultural sector from plant and animal health threats, and to ensure humane care and treatment of certain animals. These programs provide the basic infrastructure to improve agricultural market competitiveness for the overall benefit of both consumers and producers of American agriculture. The Marketing and Regulatory Programs are administered by three agencies: the Animal and Plant Health Inspection Service (APHIS); the Agricultural Marketing Service (AMS); and the Grain Inspection, Packers and Stockyards Administration (GIPSA).
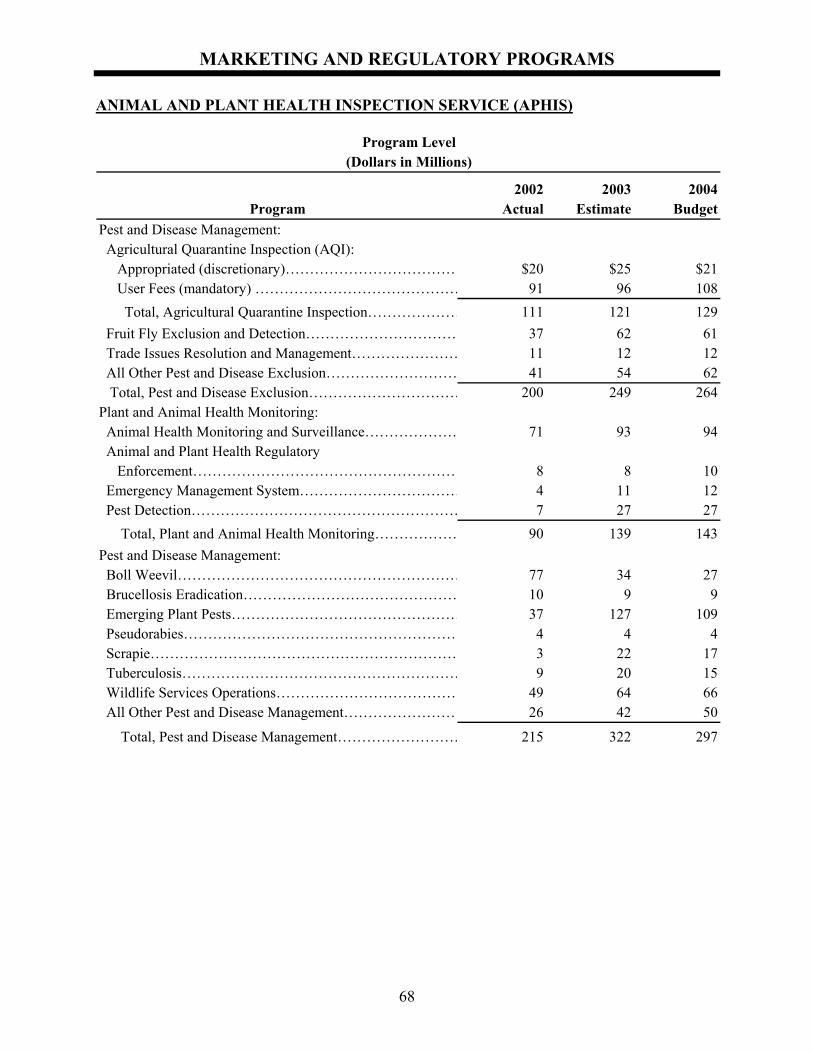
MARKETING AND REGULATORY PROGRAMS
68
ANIMAL AND PLANT HEALTH INSPECTION SERVICE (APHIS)
Program Level(Dollars in Millions)
2002 2003 2004Program Actual Estimate Budget
Pest and Disease Management: Agricultural Quarantine Inspection (AQI): Appropriated (discretionary)……………………………… $20 $25 $21 User Fees (mandatory) …………………………………… 91 96 108 Total, Agricultural Quarantine Inspection………………… 111 121 129 Fruit Fly Exclusion and Detection…………………………… 37 62 61 Trade Issues Resolution and Management…………………… 11 12 12 All Other Pest and Disease Exclusion……………………… 41 54 62 Total, Pest and Disease Exclusion…………………………… 200 249 264Plant and Animal Health Monitoring: Animal Health Monitoring and Surveillance………………… 71 93 94 Animal and Plant Health Regulatory Enforcement……………………………………………… 8 8 10 Emergency Management System…………………………… 4 11 12 Pest Detection………………………………………………… 7 27 27 Total, Plant and Animal Health Monitoring……………… 90 139 143Pest and Disease Management: Boll Weevil…………………………………………………… 77 34 27 Brucellosis Eradication……………………………………… 10 9 9 Emerging Plant Pests………………………………………… 37 127 109 Pseudorabies………………………………………………… 4 4 4 Scrapie……………………………………………………… 3 22 17 Tuberculosis………………………………………………… 9 20 15 Wildlife Services Operations………………………………… 49 64 66 All Other Pest and Disease Management…………………… 26 42 50
Total, Pest and Disease Management……………………… 215 322 297
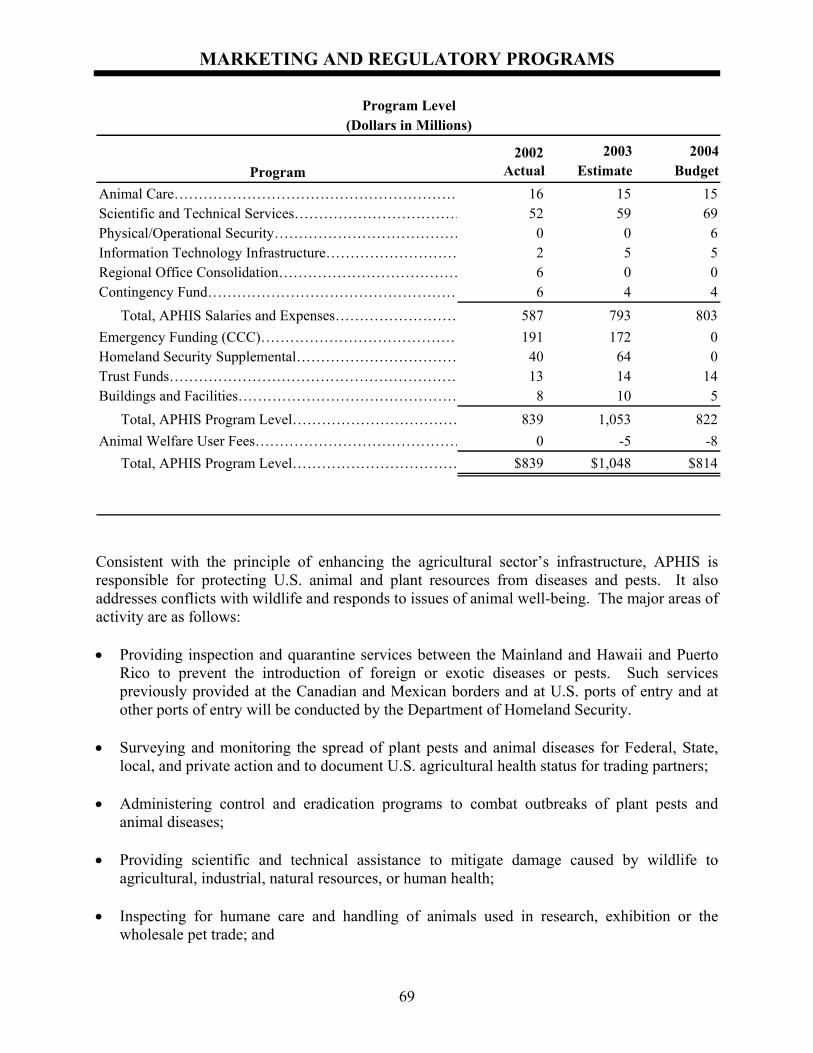
MARKETING AND REGULATORY PROGRAMS
69
Program Level(Dollars in Millions)
2002 2003 2004Program Actual Estimate Budget
Animal Care…………………………………………………… 16 15 15Scientific and Technical Services……………………………… 52 59 69Physical/Operational Security………………………………… 0 0 6Information Technology Infrastructure……………………… 2 5 5Regional Office Consolidation………………………………… 6 0 0Contingency Fund…………………………………………… 6 4 4 Total, APHIS Salaries and Expenses……………………… 587 793 803Emergency Funding (CCC)…………………………………… 191 172 0Homeland Security Supplemental…………………………… 40 64 0Trust Funds…………………………………………………… 13 14 14Buildings and Facilities……………………………………… 8 10 5 Total, APHIS Program Level……………………………… 839 1,053 822Animal Welfare User Fees…………………………………… 0 -5 -8 Total, APHIS Program Level……………………………… $839 $1,048 $814
Consistent with the principle of enhancing the agricultural sector’s infrastructure, APHIS is responsible for protecting U.S. animal and plant resources from diseases and pests. It also addresses conflicts with wildlife and responds to issues of animal well-being. The major areas of activity are as follows: • Providing inspection and quarantine services between the Mainland and Hawaii and Puerto
Rico to prevent the introduction of foreign or exotic diseases or pests. Such services previously provided at the Canadian and Mexican borders and at U.S. ports of entry and at other ports of entry will be conducted by the Department of Homeland Security.
• Surveying and monitoring the spread of plant pests and animal diseases for Federal, State,
local, and private action and to document U.S. agricultural health status for trading partners; • Administering control and eradication programs to combat outbreaks of plant pests and
animal diseases; • Providing scientific and technical assistance to mitigate damage caused by wildlife to
agricultural, industrial, natural resources, or human health; • Inspecting for humane care and handling of animals used in research, exhibition or the
wholesale pet trade; and
MARKETING AND REGULATORY PROGRAMS
70
• Providing scientific and technical assistance or leadership on issues of biotechnology, disease diagnostics, and pest control methods development.
Much of the agency's work is conducted in cooperation with State and local agencies, private groups, and foreign governments. The 2004 budget proposes a program level of $803 million for salaries and expenses, an increase of about $10 million from the current comparable 2003 estimate. Notable increases would fund a doubling of efforts against chronic wasting disease, increase the availability of foot-and-mouth disease (FMD) vaccines to protect against a potential outbreak, fund a low-pathogenic avian influenza program, enhance the ability to track animals and animal products entering and leaving the country, protect against introduction of tropical bont tick (a vector for heartwater disease in livestock), and expand regulatory enforcement. Further, biosecurity and physical and operational security efforts would be bolstered, as would veterinary biologic and diagnostic support for the livestock sector. A significant aspect of the 2004 budget is the implementation of consistent cost-share criteria between the Federal Government and its partners to combat pest and disease infestations. Agricultural Quarantine Inspection (AQI). While most AQI resources are reassigned to the Department of Homeland Security, USDA retains the role of ensuring that passengers and cargoes traveling from Hawaii and Puerto Rico comply with specified regulations to protect the health of the agricultural sector on the Mainland. Further, USDA retains the responsibility of promulgating regulations related to entry of passengers and commodities into the United States. The 2004 budget proposes $129 million for those efforts compared with $121 million in 2003. Plant and Animal Health Monitoring. Experience gained from abroad about FMD and bovine spongiform encephalopathy (BSE) highlights the need for rapid detection and response to agricultural health threats. Long-standing efforts have kept FMD and BSE out of the United States, and vigilant surveillance and monitoring are still needed. An additional $4 million would increase the availability of FMD vaccines and support efforts to address increased incidence of smuggling and other threats from regulatory violations. Pest and Disease Management Programs. Once detected, prompt eradication reduces overall control costs. In cases where eradication is not feasible (e.g., European gypsy moth), attempts are made to slow the advance, and damages, of the pest or disease. APHIS provides technical and financial support to help control or eradicate a variety of agricultural threats. The 2004 budget requests $297 million compared to $322 million in 2003 for these efforts. Successes in boll weevil eradication and plum pox efforts allow program reductions. The budget proposes increased funding for efforts against chronic wasting disease, golden nematode, and low-pathogenic avian influenza. The Secretary retains authority to use funds from CCC to combat any new emergency pest and disease outbreaks. The budget also proposes a slight increase for wildlife services operations to enhance control over hazardous materials. Animal Care. Similar to the 2003 request, the 2004 budget proposes almost $15 million for Animal Welfare Act activities and about $0.5 million for the Horse Protection Act. The budget
MARKETING AND REGULATORY PROGRAMS
71
proposes collection of about $8 million in new user fees for animal welfare inspections. A program evaluation of the Animal Welfare Program was conducted as part of the 2004 budget formulation process. As a result of that evaluation, the Administration recommends: APHIS seek additional input from sources outside of the government; and APHIS develop additional goals to measure the program’s impact. Scientific and Technical Services. APHIS develops methods and provides diagnostic support to prevent, detect, control, and eradicate agricultural health threats, and to reduce wildlife damages (e.g., coyote predation). It also works to prevent worthless or harmful animal biologics from reaching consumers. An increase of $10 million would enhance biosecurity activities, the national animal health laboratory network, and other efforts. Further, increased funds totaling $6.6 million are included in the budget for the Office of the Secretary for crosscutting trade-related and biotechnology activities of the Department. The Department anticipates a growing demand for trade negotiating efforts and biotechnology activities, including regulatory, market access and removal of trade barriers. Increased APHIS efforts related to biotechnology may be funded from these appropriations to be made available to the Office of the Secretary. Buildings and Facilities. General repairs and maintenance of APHIS buildings would be funded at about $5 million.
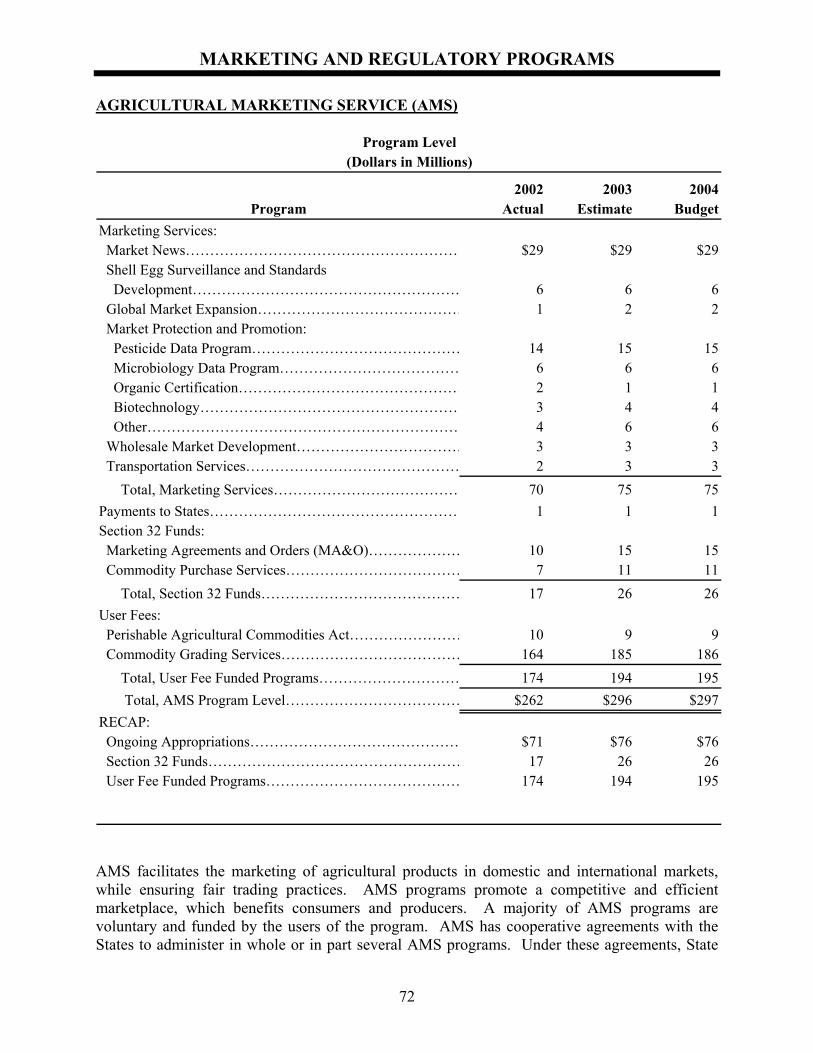
MARKETING AND REGULATORY PROGRAMS
72
AGRICULTURAL MARKETING SERVICE (AMS)
Program Level(Dollars in Millions)
2002 2003 2004Program Actual Estimate Budget
Marketing Services: Market News………………………………………………… $29 $29 $29 Shell Egg Surveillance and Standards Development………………………………………………… 6 6 6 Global Market Expansion…………………………………… 1 2 2 Market Protection and Promotion: Pesticide Data Program……………………………………… 14 15 15 Microbiology Data Program………………………………… 6 6 6 Organic Certification………………………………………… 2 1 1 Biotechnology……………………………………………… 3 4 4 Other………………………………………………………… 4 6 6 Wholesale Market Development……………………………… 3 3 3 Transportation Services……………………………………… 2 3 3 Total, Marketing Services………………………………… 70 75 75Payments to States…………………………………………… 1 1 1Section 32 Funds: Marketing Agreements and Orders (MA&O)………………… 10 15 15 Commodity Purchase Services……………………………… 7 11 11 Total, Section 32 Funds…………………………………… 17 26 26User Fees: Perishable Agricultural Commodities Act…………………… 10 9 9 Commodity Grading Services………………………………… 164 185 186 Total, User Fee Funded Programs………………………… 174 194 195 Total, AMS Program Level……………………………… $262 $296 $297RECAP: Ongoing Appropriations……………………………………… $71 $76 $76 Section 32 Funds……………………………………………… 17 26 26 User Fee Funded Programs…………………………………… 174 194 195
AMS facilitates the marketing of agricultural products in domestic and international markets, while ensuring fair trading practices. AMS programs promote a competitive and efficient marketplace, which benefits consumers and producers. A majority of AMS programs are voluntary and funded by the users of the program. AMS has cooperative agreements with the States to administer in whole or in part several AMS programs. Under these agreements, State
MARKETING AND REGULATORY PROGRAMS
73
employees carry out the program. AMS is organized along commodity lines that reflect major segments of the agricultural industry. Headquarters staff are responsible for the administration of programs. AMS field employees are located in processing plants, at shipping points, produce terminals, auction houses, and warehouses. Field offices, established for supervision and administrative purposes, are located in key production areas. For 2004, the AMS budget proposes a program level of $297 million of which $195 million (66 percent) will be funded by user fees and $102 million (34 percent) by appropriations and Section 32 funds. The 2004 budget includes an increase of about $1 million in appropriated funds for increased pay costs in order to maintain existing program operations. Marketing Services. AMS administers a variety of programs that enhance the marketing and distribution of agricultural products. Activities include the dissemination of market information; surveillance of shell egg handling operations; development of grade standards; protection of producers from unfair marketing practices; random testing of commodities for pesticide residues and microbiological contamination; development of organic standards; research and technical assistance aimed at improving efficiency of food marketing and distribution; and, pesticide recordkeeping. Payments to States. Under this program, AMS provides matching funds to State Departments of Agriculture for projects aimed at improving marketing efficiency, reducing marketing costs for producers, and lowering food costs for consumers. Section 32 Funds. Section 32 of the Act of August 24, 1935, authorizes the appropriation for each fiscal year of an amount equal to 30 percent of the gross receipts from duties collected under customs laws of the United States during the preceding calendar year. These funds are used to: encourage exports of agricultural commodities; encourage domestic consumption of such commodities; and to re-establish farmers’ purchasing power. Section 32 funds are also used to finance the administrative costs associated with the purchase of commodities that support domestic nutrition assistance programs, such as the National School Lunch Program. In addition, AMS is responsible for developing the specifications used for food procurement throughout the Federal Government. Marketing agreements and orders help stabilize market prices and the supply of milk, fruit, vegetables, and certain specialty crops. The orders are administered locally by marketing order committees and market administrators. Local activities are funded through assessments on regulated handlers. Section 32 funds are also used to finance the administration of marketing agreements and orders at the national level. Perishable Agricultural Commodities Act. This Act prohibits unfair and fraudulent practices in the marketing of perishable agricultural commodities by regulating shippers, distributors, and retailers. Full and prompt payment for fresh fruits and vegetables is a key objective of the program. The program is funded through annual licensing fees paid by those subject to the Act.
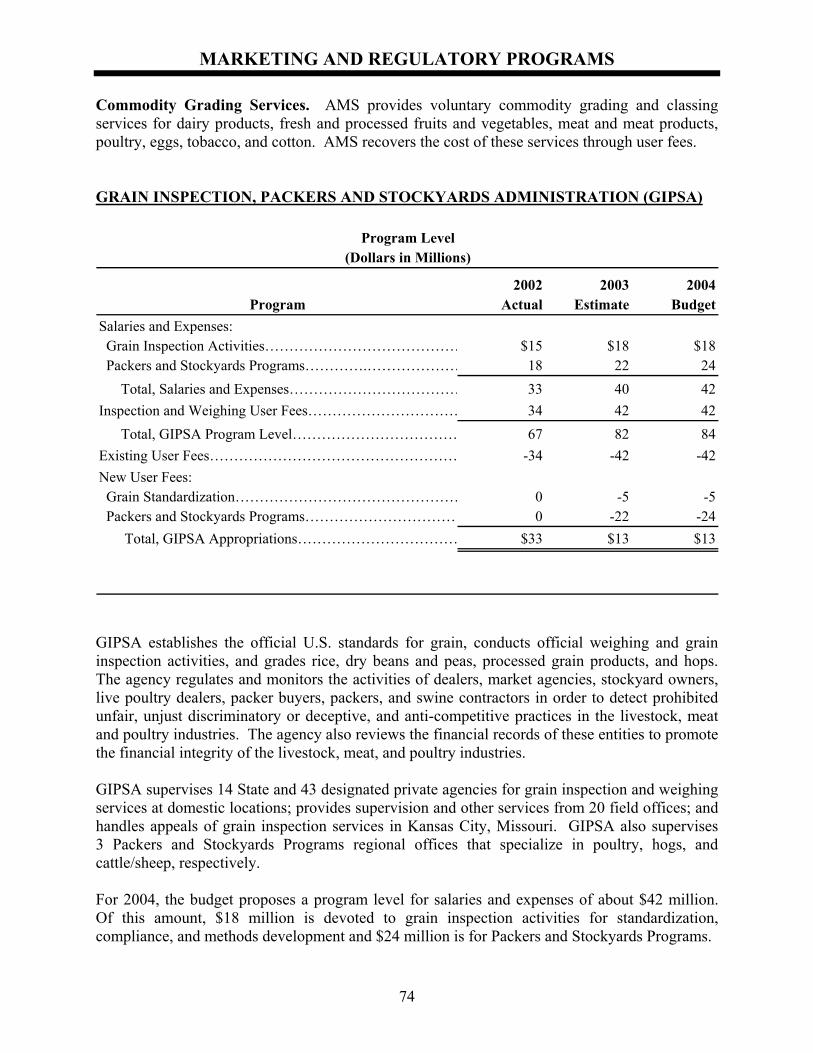
MARKETING AND REGULATORY PROGRAMS
74
Commodity Grading Services. AMS provides voluntary commodity grading and classing services for dairy products, fresh and processed fruits and vegetables, meat and meat products, poultry, eggs, tobacco, and cotton. AMS recovers the cost of these services through user fees. GRAIN INSPECTION, PACKERS AND STOCKYARDS ADMINISTRATION (GIPSA)
Program Level(Dollars in Millions)
2002 2003 2004Program Actual Estimate Budget
Salaries and Expenses: Grain Inspection Activities…………………………………… $15 $18 $18 Packers and Stockyards Programs………….………………… 18 22 24 Total, Salaries and Expenses……………………………… 33 40 42Inspection and Weighing User Fees…………………………… 34 42 42 Total, GIPSA Program Level……………………………… 67 82 84Existing User Fees…………………………………………… -34 -42 -42New User Fees: Grain Standardization………………………………………… 0 -5 -5 Packers and Stockyards Programs…………………………… 0 -22 -24 Total, GIPSA Appropriations…………………………… $33 $13 $13
GIPSA establishes the official U.S. standards for grain, conducts official weighing and grain inspection activities, and grades rice, dry beans and peas, processed grain products, and hops. The agency regulates and monitors the activities of dealers, market agencies, stockyard owners, live poultry dealers, packer buyers, packers, and swine contractors in order to detect prohibited unfair, unjust discriminatory or deceptive, and anti-competitive practices in the livestock, meat and poultry industries. The agency also reviews the financial records of these entities to promote the financial integrity of the livestock, meat, and poultry industries. GIPSA supervises 14 State and 43 designated private agencies for grain inspection and weighing services at domestic locations; provides supervision and other services from 20 field offices; and handles appeals of grain inspection services in Kansas City, Missouri. GIPSA also supervises 3 Packers and Stockyards Programs regional offices that specialize in poultry, hogs, and cattle/sheep, respectively. For 2004, the budget proposes a program level for salaries and expenses of about $42 million. Of this amount, $18 million is devoted to grain inspection activities for standardization, compliance, and methods development and $24 million is for Packers and Stockyards Programs.
MARKETING AND REGULATORY PROGRAMS
75
The 2004 budget includes two program increases: • $1 million to implement a new pilot program to audit the top four steer and heifer
meatpackers. The Packers and Stockyards Programs have never audited a large packer. These audits are anticipated to result in substantially better financial protection to the regulated industries through heightened financial scrutiny of the Top Four.
• $0.5 million to conduct a comprehensive, industry-wide review of the Packers and Stockyards Act. Given changes in the livestock sector, the Packers and Stockyards Programs are preparing to undertake a complete review of the Packers and Stockyards Act and its regulations. The Packers and Stockyards Act has not undergone a comprehensive review since its enactment in 1921 although the industries it regulates have undergone dramatic structural changes. Industry participants will have an opportunity to provide input on the statute’s scope and framework, and as suggested by the General Accounting Office, GIPSA will clarify its views on competition in the industries it regulates. These activities may result in future increases in the number and complexity of investigations conducted by GIPSA and the monies recovered or returned to the regulated industries.
An increase is proposed within the Office of the Secretary budget to support crosscutting trade and biotechnology activities of the Department, including regulatory, market access and trade barrier removal activities. Increased GIPSA efforts related to biotechnology may be funded from the proposed Office of the Secretary funds. The GIPSA budget includes two user fee proposals. New user fees would be charged to recover the costs of developing, reviewing, and maintaining official U.S. grain standards used by the grain industry. Those who receive, ship, store, or process grain would be charged fees estimated to total about $5 million to cover these costs. Also, the Packers and Stockyards Programs would be funded by new license fees of about $24 million that would be required of packers, live poultry dealers, poultry processors, stockyard owners, market agencies, dealers and swine contractors, as defined under the Packers and Stockyards Act.
RESEARCH, EDUCATION, AND ECONOMICS
76
MISSION The Research, Education, and Economics (REE) mission area is assigned Federal leadership responsibility for the discovery, application, and dissemination of information and technologies spanning the biological, physical, and social sciences through agricultural research, education, and extension activities and economic and statistical analysis. REE responsibilities are carried out by four agencies: • The Agricultural Research Service (ARS) is the principal in-house research agency in USDA
in the area of natural and biological sciences. • The Cooperative State Research, Education, and Extension Service (CSREES) is the Federal
partner with land-grant and non-land grant colleges and universities in carrying out extramural research, higher education, and extension activities.
• The Economic Research Service (ERS) is the principal intramural economic and social
science research agency in USDA. • The National Agricultural Statistics Service (NASS) conducts the Census of Agriculture and
provides the official current statistics on agricultural production and indicators of the economic and environmental welfare of the farm sector.
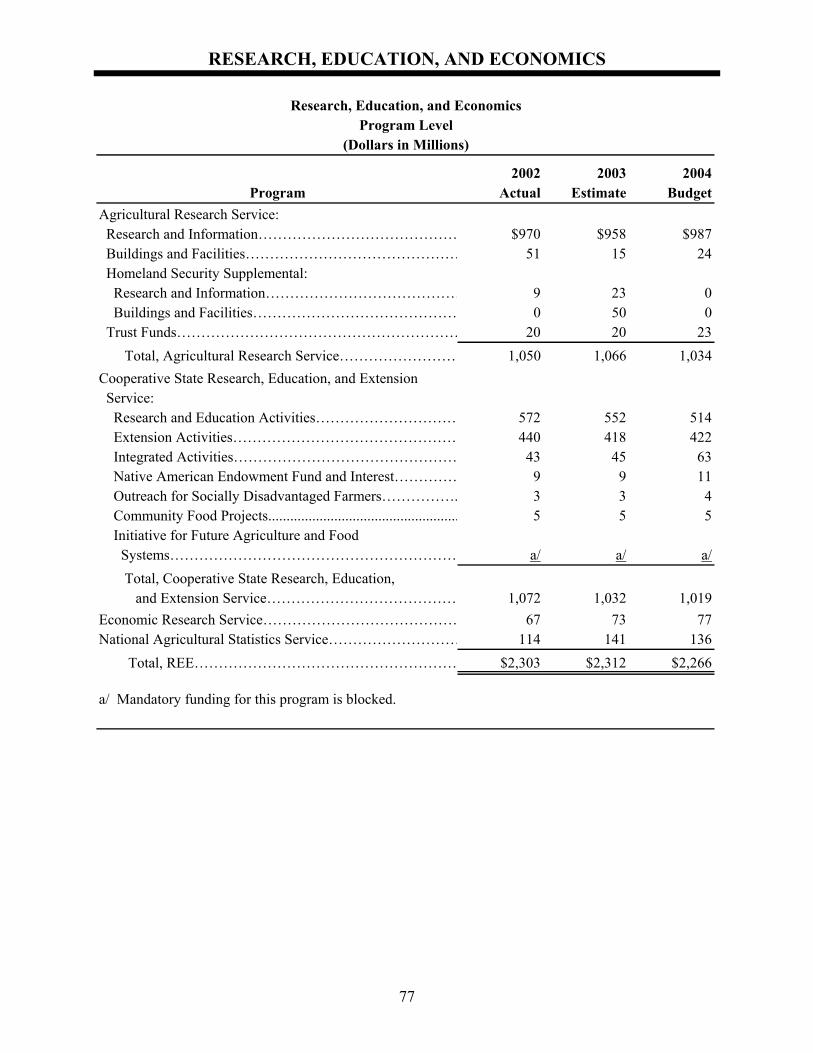
RESEARCH, EDUCATION, AND ECONOMICS
77
Research, Education, and EconomicsProgram Level
(Dollars in Millions)
2002 2003 2004Program Actual Estimate Budget
Agricultural Research Service: Research and Information…………………………………… $970 $958 $987 Buildings and Facilities……………………………………… 51 15 24 Homeland Security Supplemental: Research and Information…………………………………… 9 23 0 Buildings and Facilities…………………………………… 0 50 0 Trust Funds…………………………………………………… 20 20 23 Total, Agricultural Research Service…………………… 1,050 1,066 1,034Cooperative State Research, Education, and Extension Service: Research and Education Activities………………………… 572 552 514 Extension Activities………………………………………… 440 418 422 Integrated Activities………………………………………… 43 45 63 Native American Endowment Fund and Interest…………… 9 9 11 Outreach for Socially Disadvantaged Farmers……………. 3 3 4 Community Food Projects.................................................... 5 5 5 Initiative for Future Agriculture and Food Systems…………………………………………………… a/ a/ a/ Total, Cooperative State Research, Education, and Extension Service………………………………… 1,072 1,032 1,019Economic Research Service…………………………………… 67 73 77National Agricultural Statistics Service……………………… 114 141 136 Total, REE……………………………………………… $2,303 $2,312 $2,266
a/ Mandatory funding for this program is blocked.
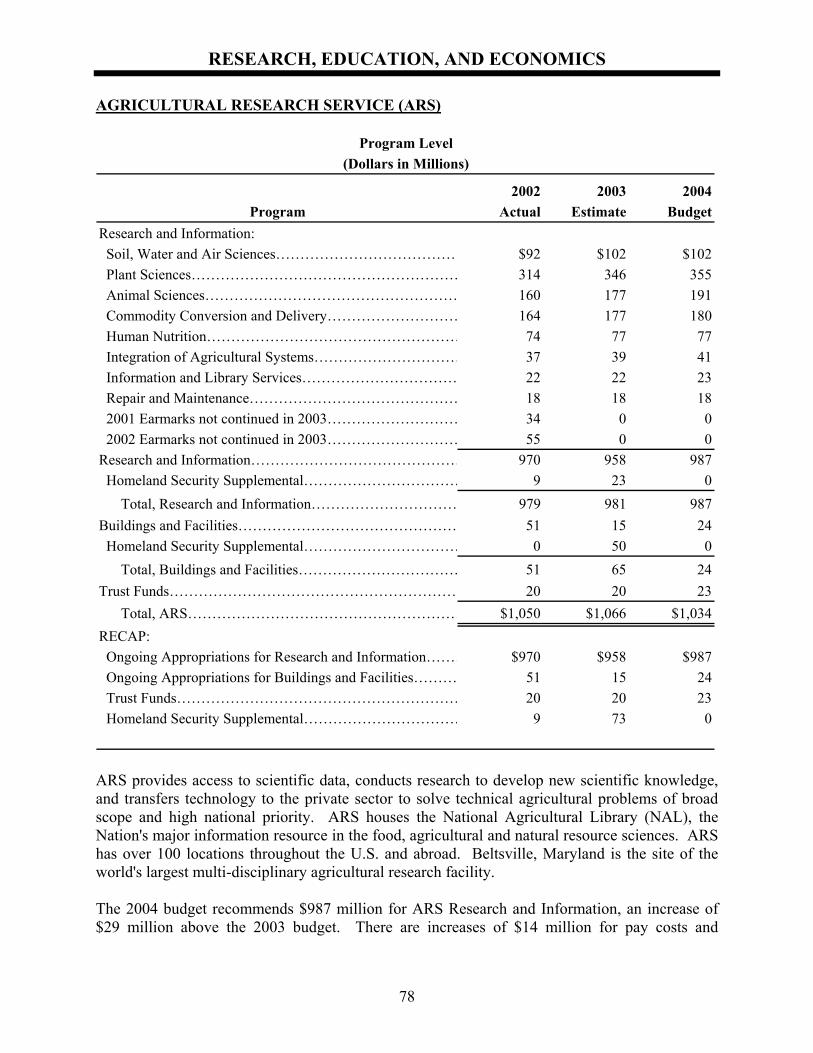
RESEARCH, EDUCATION, AND ECONOMICS
78
AGRICULTURAL RESEARCH SERVICE (ARS)
Program Level(Dollars in Millions)
2002 2003 2004Program Actual Estimate Budget
Research and Information: Soil, Water and Air Sciences………………………………… $92 $102 $102 Plant Sciences………………………………………………… 314 346 355 Animal Sciences……………………………………………… 160 177 191 Commodity Conversion and Delivery……………………… 164 177 180 Human Nutrition……………………………………………… 74 77 77 Integration of Agricultural Systems………………………… 37 39 41 Information and Library Services…………………………… 22 22 23 Repair and Maintenance……………………………………… 18 18 18 2001 Earmarks not continued in 2003……………………… 34 0 0 2002 Earmarks not continued in 2003……………………… 55 0 0Research and Information……………………………………… 970 958 987 Homeland Security Supplemental…………………………… 9 23 0 Total, Research and Information………………………… 979 981 987Buildings and Facilities……………………………………… 51 15 24 Homeland Security Supplemental…………………………… 0 50 0 Total, Buildings and Facilities…………………………… 51 65 24Trust Funds…………………………………………………… 20 20 23 Total, ARS………………………………………………… $1,050 $1,066 $1,034RECAP: Ongoing Appropriations for Research and Information……… $970 $958 $987 Ongoing Appropriations for Buildings and Facilities……… 51 15 24 Trust Funds…………………………………………………… 20 20 23 Homeland Security Supplemental…………………………… 9 73 0
ARS provides access to scientific data, conducts research to develop new scientific knowledge, and transfers technology to the private sector to solve technical agricultural problems of broad scope and high national priority. ARS houses the National Agricultural Library (NAL), the Nation's major information resource in the food, agricultural and natural resource sciences. ARS has over 100 locations throughout the U.S. and abroad. Beltsville, Maryland is the site of the world's largest multi-disciplinary agricultural research facility. The 2004 budget recommends $987 million for ARS Research and Information, an increase of $29 million above the 2003 budget. There are increases of $14 million for pay costs and
RESEARCH, EDUCATION, AND ECONOMICS
79
$16 million for selected, high priority programs. The 2003 budget proposed reductions in all projects earmarked by Congress in fiscal years 2001 and 2002. The 2003 budget also proposed reductions in base programs of $15 million. For the most part, the 2004 budget extends proposals made for 2003. Highlights of the proposals for the main program areas follow: • Soil, Water, and Air Sciences. This area of research emphasizes development of a sound
scientific basis to provide advanced technical assistance and education to producers to manage and conserve soil, water, and air resources to optimize agricultural productivity and environmental quality. The 2003 budget proposal for a $5 million increase in air and water quality is scaled back to $3.5 million for 2004. The increase will be used to deal with animal waste related problems.
• Plant Science. Ongoing ARS research addresses a wide range of crop production issues,
including pest and disease management through use of biologically-based technologies, plant genome mapping, and the maintenance and improvement of plant germplasm. The 2004 budget includes a proposed $3.5 million increase for plant/crop genomics.
• Animal Science. Research in this program is directed toward solving major issues faced by
producers and consumers of meat and poultry products. Areas of emphasis include disease prevention, genetics and genome mapping, animal reproduction, food quality, and safety. The 2004 budget includes a $3.5 million increase for animal genomics financed with additional appropriations and an increase of $8.3 million for emerging diseases and biosecurity.
• Commodity Conversion and Delivery. This research focuses on post-harvest food safety
and quality concerns, development of new food and industrial uses for agricultural commodities, and elimination of barriers to the export of commodities.
• Human Nutrition. Six ARS centers conduct research to enhance the understanding of
nutritional needs of diverse populations, including children, the elderly, pregnant and lactating women, and healthy adults. Results of this work identify the impact of nutrients in reducing chronic disease risks and predicting health outcomes.
• Integration of Agricultural Systems. Research in this category includes projects to
integrate the results of specific programs into production systems which are sustainable, environmentally-benign, and profitable for farmers and ranchers. Projects include the development of models and decision support systems to assist producers in making production decisions and managing natural resources. The 2004 budget includes an increase of $3.0 million for information technology cyber security.
• Information and Library Services. NAL provides access to scientific agricultural data
through its online database and CD-Roms. NAL provides agricultural information electronically and is expanding efforts to catalog, manage, and disseminate agriculture-related data through the Internet.
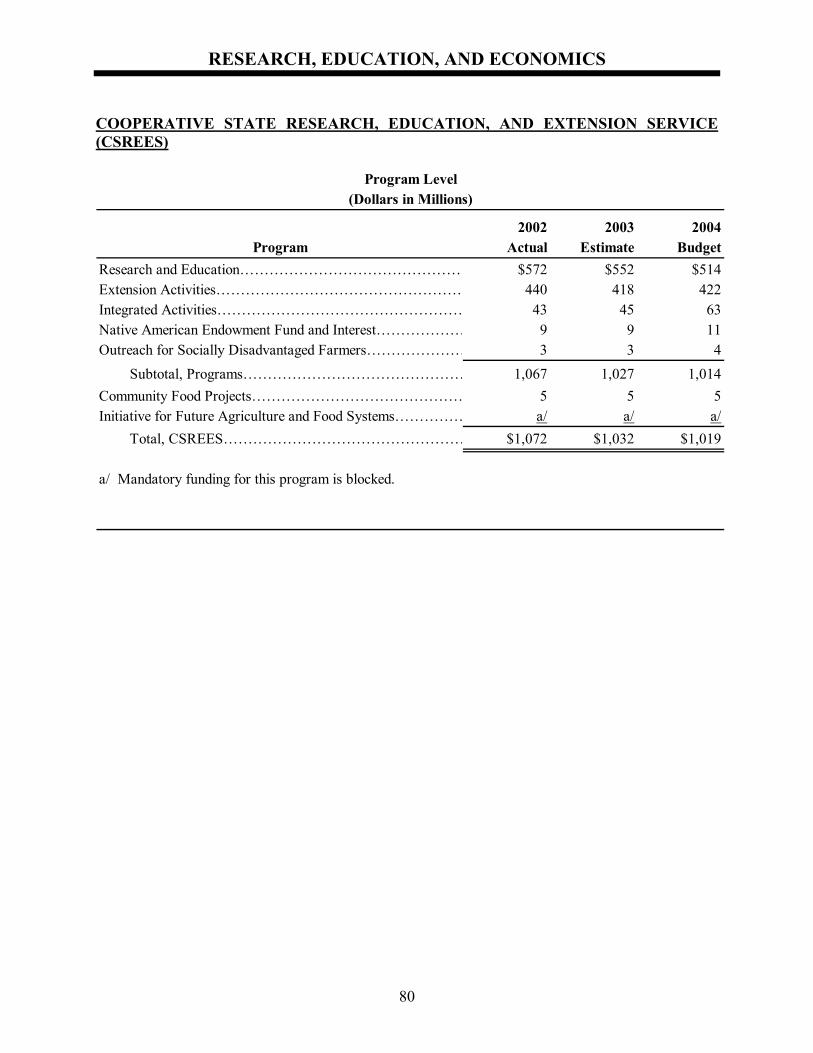
RESEARCH, EDUCATION, AND ECONOMICS
80
COOPERATIVE STATE RESEARCH, EDUCATION, AND EXTENSION SERVICE (CSREES)
Program Level(Dollars in Millions)
2002 2003 2004Program Actual Estimate Budget
Research and Education……………………………………… $572 $552 $514Extension Activities…………………………………………… 440 418 422Integrated Activities…………………………………………… 43 45 63Native American Endowment Fund and Interest……………… 9 9 11Outreach for Socially Disadvantaged Farmers………………… 3 3 4 Subtotal, Programs……………………………………… 1,067 1,027 1,014Community Food Projects……………………………………… 5 5 5Initiative for Future Agriculture and Food Systems…………… a/ a/ a/ Total, CSREES…………………………………………… $1,072 $1,032 $1,019
a/ Mandatory funding for this program is blocked.
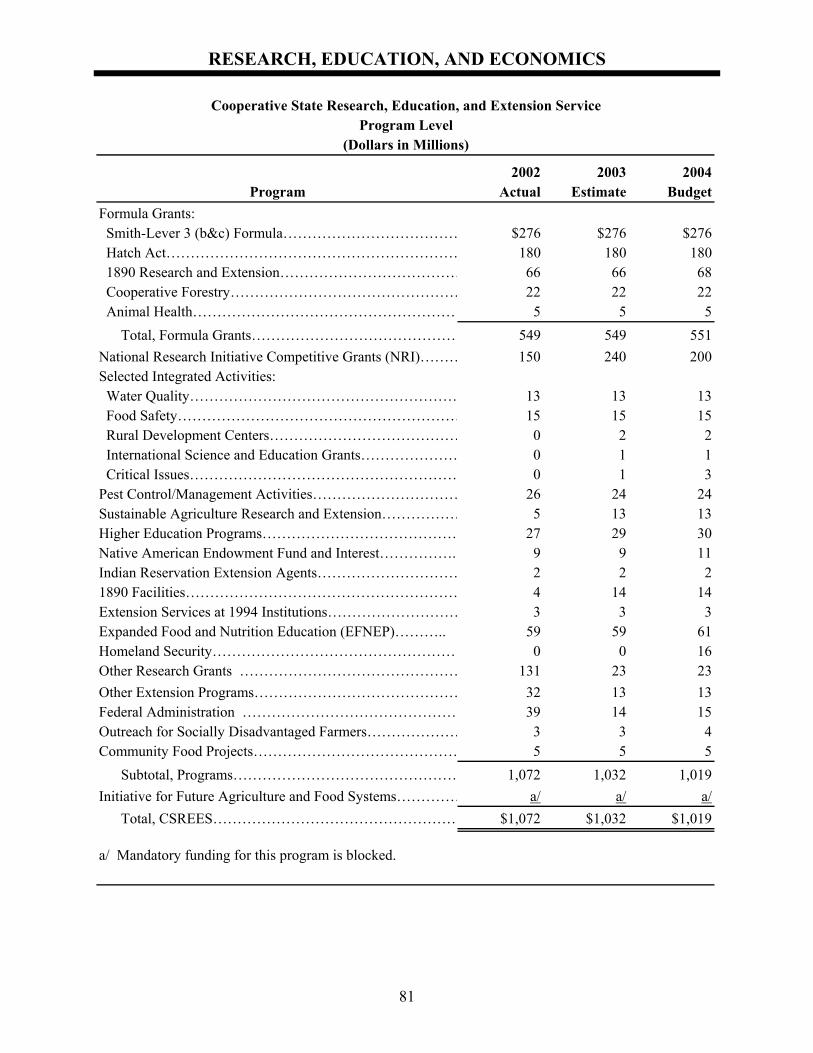
RESEARCH, EDUCATION, AND ECONOMICS
81
Cooperative State Research, Education, and Extension ServiceProgram Level
(Dollars in Millions)
2002 2003 2004Program Actual Estimate Budget
Formula Grants: Smith-Lever 3 (b&c) Formula……………………………… $276 $276 $276 Hatch Act…………………………………………………… 180 180 180 1890 Research and Extension………………………………… 66 66 68 Cooperative Forestry………………………………………… 22 22 22 Animal Health……………………………………………… 5 5 5 Total, Formula Grants…………………………………… 549 549 551National Research Initiative Competitive Grants (NRI)……… 150 240 200Selected Integrated Activities: Water Quality………………………………………………… 13 13 13 Food Safety…………………………………………………… 15 15 15 Rural Development Centers………………………………… 0 2 2 International Science and Education Grants………………… 0 1 1 Critical Issues………………………………………………… 0 1 3Pest Control/Management Activities………………………… 26 24 24Sustainable Agriculture Research and Extension……………… 5 13 13Higher Education Programs…………………………………… 27 29 30Native American Endowment Fund and Interest……………. 9 9 11Indian Reservation Extension Agents………………………… 2 2 21890 Facilities………………………………………………… 4 14 14Extension Services at 1994 Institutions……………………… 3 3 3Expanded Food and Nutrition Education (EFNEP)……….. 59 59 61Homeland Security…………………………………………… 0 0 16Other Research Grants ……………………………………… 131 23 23Other Extension Programs…………………………………… 32 13 13Federal Administration ……………………………………… 39 14 15Outreach for Socially Disadvantaged Farmers………………… 3 3 4Community Food Projects…………………………………… 5 5 5 Subtotal, Programs………………………………………… 1,072 1,032 1,019Initiative for Future Agriculture and Food Systems…………… a/ a/ a/ Total, CSREES…………………………………………… $1,072 $1,032 $1,019
a/ Mandatory funding for this program is blocked.
RESEARCH, EDUCATION, AND ECONOMICS
82
CSREES has primary responsibility for providing linkages between the Federal and State components of a broad-based, national agricultural research, extension, and higher education system. CSREES provides funding for projects conducted in partnership with the State Agricultural Experiment Stations, State Cooperative Extension Systems, land-grant universities, colleges and other research and education institutions. Federal funds are distributed to universities and institutions by statutory formula funding, competitive awards, and special grants. CSREES is responsible for administering USDA's primary competitive research grants program, the National Research Initiative (NRI), which supports investigator-initiated research with strong potential to contribute to major breakthroughs in agricultural science. The 2004 budget recommends $1 billion for CSREES, a net decrease of $13 million from the 2003 budget. The 2003 budget proposed $240 million for the National Research Initiative. While the 2004 budget scales this ambitious proposal back, the proposed appropriation of $200 million will represent a substantial increase above recent annual appropriations. For the most part, the 2004 budget extends proposals made for 2003, including proposals to discontinue Congressional earmarks. Highlights of the proposals for the main program areas follow: Formula Grants—CSREES provides Federal formula payments to eligible institutions under several authorities. There have been long-standing matching requirements for funds distributed to 1862 Institutions under the Hatch Act of 1887 for research, the Smith-Lever Act for extension, and the forestry and animal health research programs. Matching requirements for funds distributed to the 1890 institutions were enacted in 1998 and 2002. The formula funds programs provide important underlying support for planning and Federal-State collaboration. The 2004 budget proposes to continue the 2003 budget level for the two 1862 programs and the smaller formula programs for forestry and animal health research. There are proposals for increases in the 1890 formula programs as a step towards meeting the higher authorizations called for in the 2002 Farm Bill. National Research Initiative—The NRI is the Nation’s premier competitive, peer reviewed research program for fundamental and applied sciences in agriculture. In recent years the Federal government has made major investments in research to deal with issues related to national health and other areas needed to keep the U.S. technologically competitive. The 2003 budget for the NRI acknowledged the importance of Federal support for agricultural research with a proposal to fund the NRI at $240 million. The 2004 budget proposal of $200 million for the NRI is based on the same policy objective. The NRI is broad in scope with programs ranging from fundamental science to farm management and community issues. Funding at the proposed level will support research that will make an immediate impact on such issues as emerging diseases and pests, biosecurity, farm management, air quality, and food and nutritional improvements. The NRI enables USDA to develop new partnerships with other Federal agencies on topics of mutual interest. Moreover, the NRI will make a major contribution to developing the next generation of agricultural scientists. The NRI, along with funding in the ARS budget, is a major source of USDA support for multi-agency collaborative efforts in the field of genomics. There are opportunities to leverage investments with investments from the National Institutes of Health, the Department of Energy,
RESEARCH, EDUCATION, AND ECONOMICS
83
and the National Science Foundation in projects to map and sequence the genomes of agriculturally important species of plants, animals, and microbes. USDA plays an important role in coordinating and participating in interagency workgroups on domestic animal, microbial, and plant genomics. NIH solicits proposals from USDA and USDA cooperators for projects to be carried out at the major genome sequencing centers. The NRI will also support investments in functional genomics and data bases. Access to genomic information and the new tools to exploit it has implications for virtually all aspects of agriculture. Funding at the levels proposed for the NRI is important to take full advantage of the opportunities to collaborate with many other partners. Animal genomics is slated for a $10 million increase in the NRI and there is a corresponding increase in the ARS budget of $4 million. Integrated Activities/Unified Federal-State Diagnostic Network—USDA, through the cooperative efforts of CSREES and the Animal and Plant Health Inspection Service, has established a unified network of public agricultural institutions to identify and respond to high risk biological pathogens in the food and agriculture system. The core of the network is comprised of 12 animal diagnostic laboratories and 5 plant diagnostic laboratories. The laboratories will be responsible for conducting standardized diagnostic tests for identification of exotic and domestic pests and pathogens. The network will be supported with secure, two-way communications, and a comprehensive database on test procedures, experts, and past pest and disease problems. The network was established with $20 million in the 2002 Homeland Security Supplemental. Costs to support the network in 2004 are estimated at $16 million. Higher Education Programs—CSREES offers a variety of higher education programs designed to ensure that undergraduate and graduate institutions in the food and agriculture sciences meet the challenges of recruiting and training needed to address current and anticipated agricultural workforce issues. The 2004 budget includes a proposal to increase the Graduate Fellowship Grants program by $1 million with a focus on agricultural biosecurity and human nutrition at the Ph. D. and M.S. levels. Additional funding for fellowships at the M.S. level is especially important for recruiting minority graduate students. CSREES offers a program of grants to the 31 tribal colleges identified as 1994 Land Grant Institutions. The 2004 budget proposes to increase the grants to these institutions from the current level of $50,000 per institution to $73,000, moving towards the full authorization of $100,000 enacted in the 2002 Farm Bill. Outreach and Technical Assistance for Socially Disadvantaged Farmers and Ranchers—The Department seeks to encourage greater participation of Black farmers, tribal groups, Hispanic and other minority groups in the full range of commodity, loan, grant, and education programs offered to eligible individuals and community groups. CSREES assumed responsibility for the grant making aspects of the program authorized in Section 2501 of the Food, Agriculture, Conservation, and Trade Act of 1990 beginning in 2003. The 2004 budget includes a recommendation to increase funding for the Section 2501 program by $760,000 to a total of $4 million. Under CSREES administration, the Section 2501 program will move to multi-year awards and improved coordination with outreach efforts of other USDA agencies.
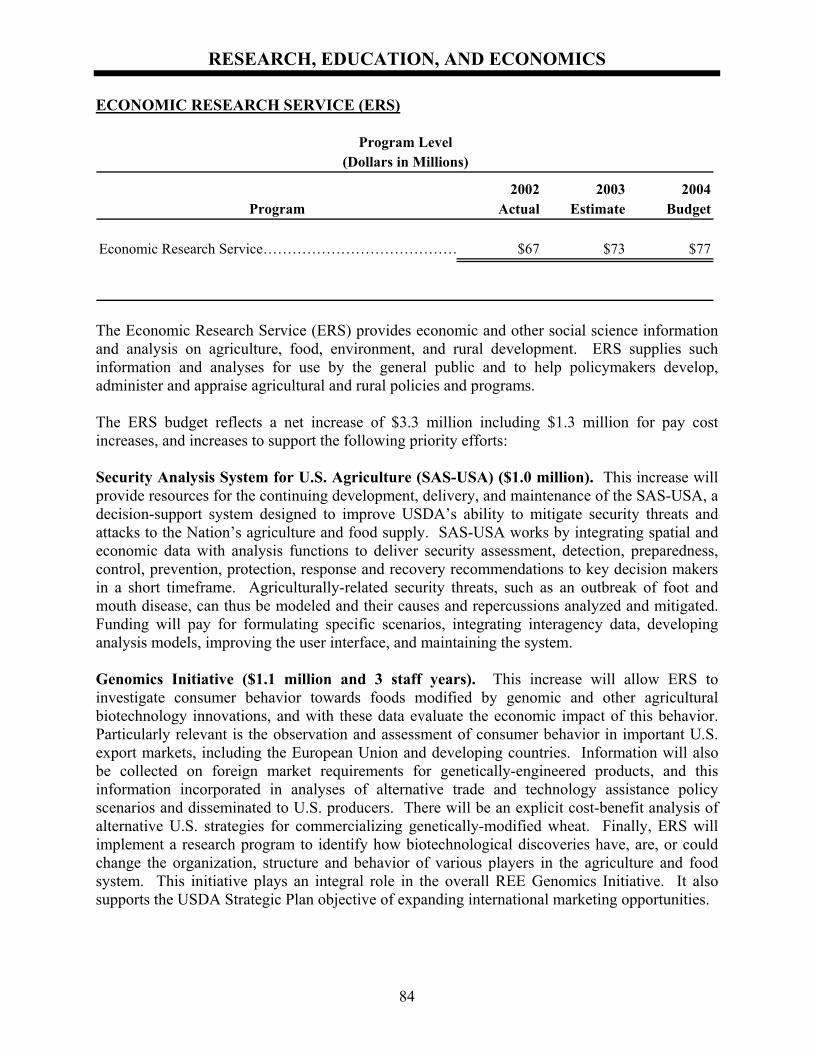
RESEARCH, EDUCATION, AND ECONOMICS
84
ECONOMIC RESEARCH SERVICE (ERS)
Program Level(Dollars in Millions)
2002 2003 2004Program Actual Estimate Budget
Economic Research Service…………………………………… $67 $73 $77
The Economic Research Service (ERS) provides economic and other social science information and analysis on agriculture, food, environment, and rural development. ERS supplies such information and analyses for use by the general public and to help policymakers develop, administer and appraise agricultural and rural policies and programs. The ERS budget reflects a net increase of $3.3 million including $1.3 million for pay cost increases, and increases to support the following priority efforts: Security Analysis System for U.S. Agriculture (SAS-USA) ($1.0 million). This increase will provide resources for the continuing development, delivery, and maintenance of the SAS-USA, a decision-support system designed to improve USDA’s ability to mitigate security threats and attacks to the Nation’s agriculture and food supply. SAS-USA works by integrating spatial and economic data with analysis functions to deliver security assessment, detection, preparedness, control, prevention, protection, response and recovery recommendations to key decision makers in a short timeframe. Agriculturally-related security threats, such as an outbreak of foot and mouth disease, can thus be modeled and their causes and repercussions analyzed and mitigated. Funding will pay for formulating specific scenarios, integrating interagency data, developing analysis models, improving the user interface, and maintaining the system. Genomics Initiative ($1.1 million and 3 staff years). This increase will allow ERS to investigate consumer behavior towards foods modified by genomic and other agricultural biotechnology innovations, and with these data evaluate the economic impact of this behavior. Particularly relevant is the observation and assessment of consumer behavior in important U.S. export markets, including the European Union and developing countries. Information will also be collected on foreign market requirements for genetically-engineered products, and this information incorporated in analyses of alternative trade and technology assistance policy scenarios and disseminated to U.S. producers. There will be an explicit cost-benefit analysis of alternative U.S. strategies for commercializing genetically-modified wheat. Finally, ERS will implement a research program to identify how biotechnological discoveries have, are, or could change the organization, structure and behavior of various players in the agriculture and food system. This initiative plays an integral role in the overall REE Genomics Initiative. It also supports the USDA Strategic Plan objective of expanding international marketing opportunities.
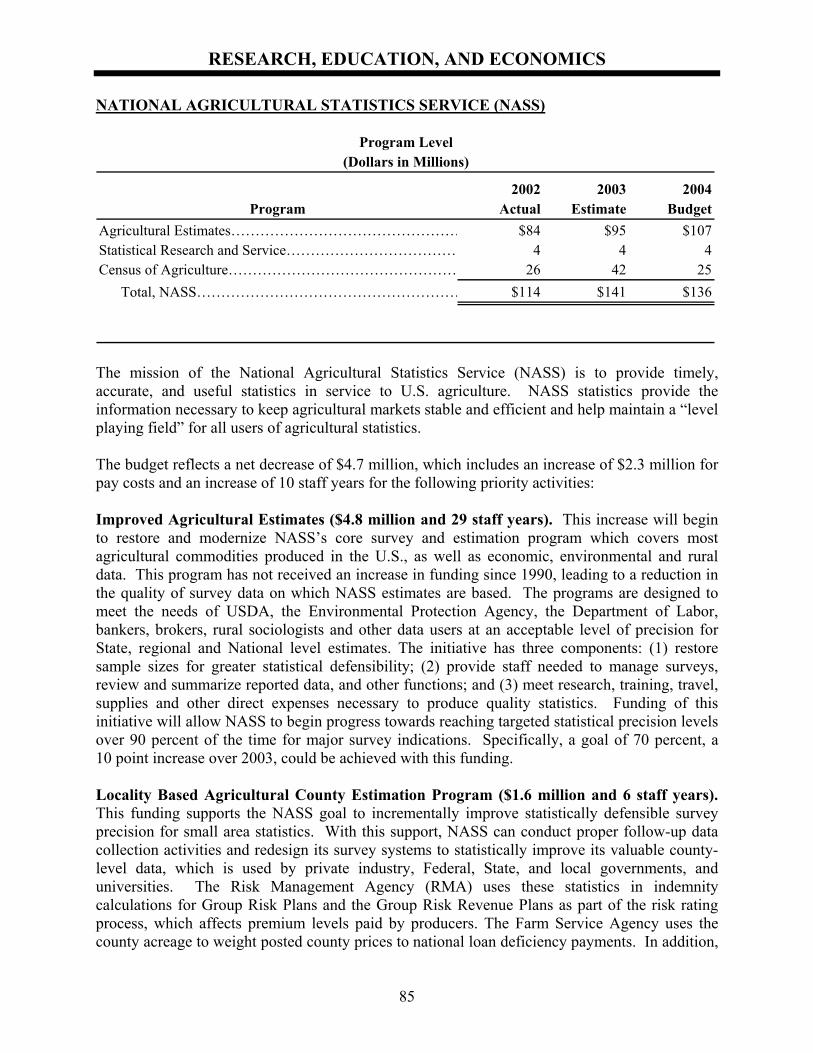
RESEARCH, EDUCATION, AND ECONOMICS
85
NATIONAL AGRICULTURAL STATISTICS SERVICE (NASS)
Program Level(Dollars in Millions)
2002 2003 2004Program Actual Estimate Budget
Agricultural Estimates………………………………………… $84 $95 $107Statistical Research and Service……………………………… 4 4 4Census of Agriculture………………………………………… 26 42 25 Total, NASS……………………………………………… $114 $141 $136
The mission of the National Agricultural Statistics Service (NASS) is to provide timely, accurate, and useful statistics in service to U.S. agriculture. NASS statistics provide the information necessary to keep agricultural markets stable and efficient and help maintain a “level playing field” for all users of agricultural statistics. The budget reflects a net decrease of $4.7 million, which includes an increase of $2.3 million for pay costs and an increase of 10 staff years for the following priority activities: Improved Agricultural Estimates ($4.8 million and 29 staff years). This increase will begin to restore and modernize NASS’s core survey and estimation program which covers most agricultural commodities produced in the U.S., as well as economic, environmental and rural data. This program has not received an increase in funding since 1990, leading to a reduction in the quality of survey data on which NASS estimates are based. The programs are designed to meet the needs of USDA, the Environmental Protection Agency, the Department of Labor, bankers, brokers, rural sociologists and other data users at an acceptable level of precision for State, regional and National level estimates. The initiative has three components: (1) restore sample sizes for greater statistical defensibility; (2) provide staff needed to manage surveys, review and summarize reported data, and other functions; and (3) meet research, training, travel, supplies and other direct expenses necessary to produce quality statistics. Funding of this initiative will allow NASS to begin progress towards reaching targeted statistical precision levels over 90 percent of the time for major survey indications. Specifically, a goal of 70 percent, a 10 point increase over 2003, could be achieved with this funding. Locality Based Agricultural County Estimation Program ($1.6 million and 6 staff years). This funding supports the NASS goal to incrementally improve statistically defensible survey precision for small area statistics. With this support, NASS can conduct proper follow-up data collection activities and redesign its survey systems to statistically improve its valuable county-level data, which is used by private industry, Federal, State, and local governments, and universities. The Risk Management Agency (RMA) uses these statistics in indemnity calculations for Group Risk Plans and the Group Risk Revenue Plans as part of the risk rating process, which affects premium levels paid by producers. The Farm Service Agency uses the county acreage to weight posted county prices to national loan deficiency payments. In addition,
RESEARCH, EDUCATION, AND ECONOMICS
86
agriculture input suppliers, agricultural marketing firms, and transportation companies who provide billions of dollars of goods and services to farmers and ranchers, track county level data on livestock inventories and crop acreage yields and production. Furthermore, under the 2002 Farm Bill, producers have begun to update their base acreage and yields by utilizing the county wide averages established by this program. Collaborative E-Government Initiatives ($3.25 million and 2 staff years). The increase supports NASS’s role as the lead agency for two of USDA’s enterprise-wide e-Government initiatives, Survey Capability and Data Management. It also supports NASS’s electronic data reporting initiative which will provide producers and agri-businesses the option for submitting reports electronically, as mandated by the Government Paperwork Elimination Act, thus reducing their reporting burden. Supported by the Data Management initiative, this information can be efficiently processed while maintaining its security and confidentiality. This funding will allow NASS to develop the infrastructure necessary for electronic data reporting for NASS’s surveys, while also providing system redundancy to continue in the event of a system failure. Census of Agriculture (decrease of $16.479 million and 27 staff years). The census provides comprehensive data on the agricultural economy with National, State, and county level details. This reduction reflects the decrease in staffing and activity levels to be realized in 2004, due to the cyclical nature of the 5-year census program. The available funding includes monies to analyze, summarize and disseminate the 2002 Census. The request also includes funding for follow-on activities for the Farm and Ranch Irrigation Survey and the Census of Horticultural Specialties, as well as for enhanced list maintenance activities between census data collection years to ensure a high level of coverage.
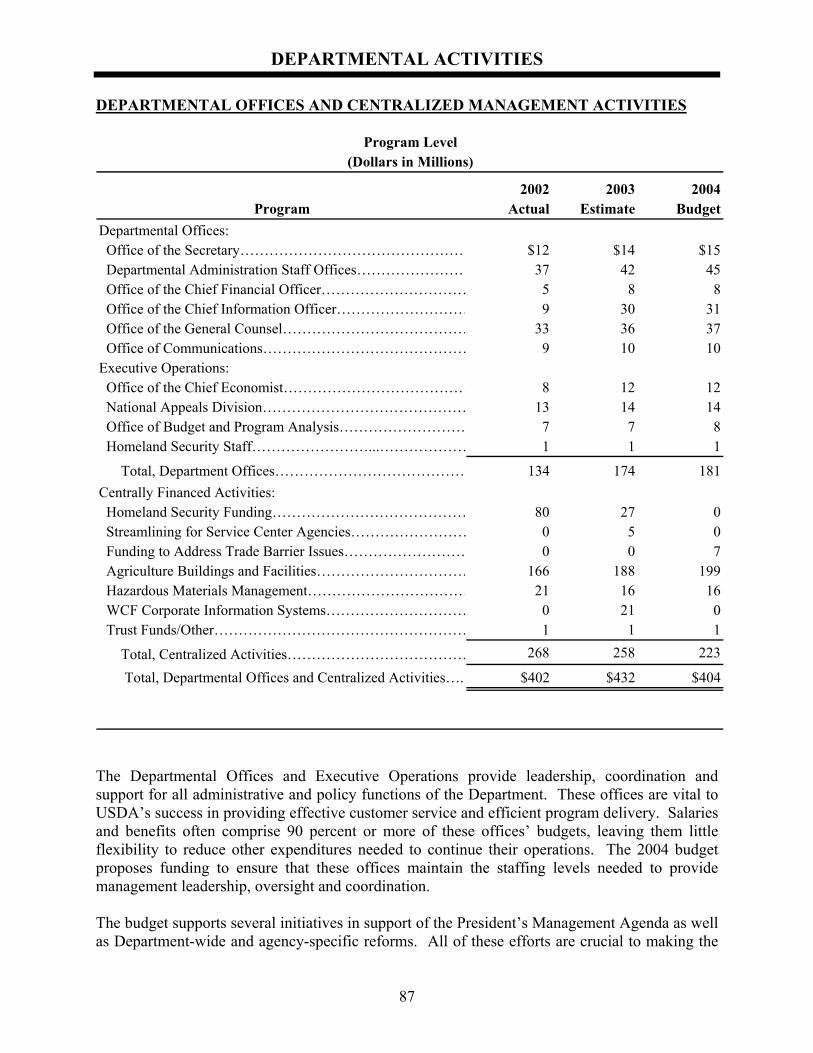
DEPARTMENTAL ACTIVITIES
87
DEPARTMENTAL OFFICES AND CENTRALIZED MANAGEMENT ACTIVITIES
Program Level(Dollars in Millions)
2002 2003 2004Program Actual Estimate Budget
Departmental Offices: Office of the Secretary………………………………………… $12 $14 $15 Departmental Administration Staff Offices…………………… 37 42 45 Office of the Chief Financial Officer………………………… 5 8 8 Office of the Chief Information Officer……………………… 9 30 31 Office of the General Counsel………………………………… 33 36 37 Office of Communications…………………………………… 9 10 10Executive Operations: Office of the Chief Economist………………………………… 8 12 12 National Appeals Division…………………………………… 13 14 14 Office of Budget and Program Analysis……………………… 7 7 8 Homeland Security Staff……………………...……………… 1 1 1
Total, Department Offices………………………………… 134 174 181Centrally Financed Activities: Homeland Security Funding…………………………………… 80 27 0 Streamlining for Service Center Agencies…………………… 0 5 0 Funding to Address Trade Barrier Issues……………………… 0 0 7 Agriculture Buildings and Facilities…………………………… 166 188 199 Hazardous Materials Management…………………………… 21 16 16 WCF Corporate Information Systems………………………… 0 21 0 Trust Funds/Other……………………………………………… 1 1 1
Total, Centralized Activities………………………………… 268 258 223
Total, Departmental Offices and Centralized Activities…. $402 $432 $404
The Departmental Offices and Executive Operations provide leadership, coordination and support for all administrative and policy functions of the Department. These offices are vital to USDA’s success in providing effective customer service and efficient program delivery. Salaries and benefits often comprise 90 percent or more of these offices’ budgets, leaving them little flexibility to reduce other expenditures needed to continue their operations. The 2004 budget proposes funding to ensure that these offices maintain the staffing levels needed to provide management leadership, oversight and coordination. The budget supports several initiatives in support of the President’s Management Agenda as well as Department-wide and agency-specific reforms. All of these efforts are crucial to making the
DEPARTMENTAL ACTIVITIES
88
Department an efficient, effective and discrimination-free organization that delivers the best return on taxpayers’ investments. Highlights of activities included in this request follow. The Office of the Secretary, assisted by the Deputy Secretary, Under Secretaries and Assistant Secretaries, and members of their immediate staffs, directs and coordinates the work of the Department. This involves providing policy direction for all areas of the Department and maintaining liaisons with the Executive Office of the President, members of Congress and the public on all matters pertaining to Departmental policy. Funding increases include $0.8 million for the new Office of the Assistant Secretary for Civil Rights. Also included is $6.6 million to address a number of trade-related challenges, including those involving biotechnology trade barriers. Over the next several years, USDA will be undertaking an unprecedented level of trade negotiating activity, and additional resources are needed to monitor foreign compliance and protect U.S. trade rights under existing trade agreements and to represent the interests of the United States in standards-setting bodies, such as the Codex Alimentarius and International Plant Protection Council. The Department also faces a growing array of challenges related to biotechnology, including a rapidly expanding number of regulatory, market access, and trade barrier issues. USDA resources are needed to anticipate and address these issues, to avoid disruptions to trade and the loss of marketing opportunities overseas. The Office of the Secretary will determine the allocation of these funds among those USDA agencies involved with trade and biotechnology related activities. Departmental Administration (DA) provides overall direction, leadership and coordination for the Department’s management of human resources, civil rights, ethics, outreach, property, procurement, emergency preparedness, and the regulatory hearing and administrative proceedings conducted by the Administrative Law Judges, the Judicial Officer, and the Board of Contract Appeals. Civil-rights related functions will be transferred to the new Office of the Assistant Secretary for Civil Rights. Key funding increases include $1.5 million to meet demands for emergency planning and strengthened physical security in light of the September 11, 2001, attacks and $0.5 million to improve DA’s computer security. With these increases, DA plans to complete deployment of continuity of operations planning across USDA in 2004 and address critical system vulnerabilities. The Office of the Chief Financial Officer (OCFO) provides overall direction and leadership in the development of financial management policies and systems and produces the Department’s consolidated financial statements and strategic and annual plans. It also oversees the provision of administrative accounting, payroll and related systems for USDA and other agencies through operation of the National Finance Center (NFC). The budget contains funding to continue these critical responsibilities and achieve key results, such as maintaining the clean audit opinion that USDA obtained on its 2002 financial statements. The Office of the Chief Information Officer (OCIO) provides policy guidance, leadership and coordination for the Department's information management, technology investment and cyber security activities in support of USDA program delivery. OCIO also operates the National Information Technology Center (NITC), which is a centralized computing facility providing applications and technical support to USDA agencies, and the Telecommunications Services and Operations (TSO) organization, which is responsible for developing USDA telecommunications
DEPARTMENTAL ACTIVITIES
89
policy and guidance and leading the design of and migration to the Department’s future corporate telecommunications network. TSO also manages the current network, and provides local telecommunications and computer support services throughout metropolitan Washington D.C. In addition, OCIO is responsible for the management of the Common Computing Environment (CCE) for the Service Center agencies, which is discussed separately. Legal oversight, counsel, and support for the Department’s programs are provided by the Office of the General Counsel. The budget provides an increase of $1.03 million to continue these services and address issues of increasing importance and workload, such as animal disease programs, food safety, natural resources, civil rights and trade practices. Included in this increase is $0.25 million for improved IT-based OGC-client communications and enhanced information sharing. The Department’s Office of Communications provides leadership and coordination for the development of communications strategies for the Department and plays a critical role in disseminating information about USDA’s programs to the general public. The proposed increase of $0.3 million for upgrades to USDA’s media facilities is designed to improve communication between USDA and the public. The Office of the Chief Economist (OCE) advises the Secretary and Department officials on the economic implications of Department policies, programs and proposed legislation and serves as the focal point for the Nation’s agricultural economic intelligence, analysis and review related to domestic and international food and agriculture markets and provides policy direction for biofuels and new uses of agricultural products. The National Appeals Division (NAD) conducts evidentiary administrative appeal hearings and reviews arising from program operations of the Rural Development mission area, Farm Service Agency, Risk Management Agency, and the Natural Resources Conservation Service. The Office of Budget and Program Analysis provides analyses and information to the Secretary and other senior level policy officials to support informed decision-making regarding the Department’s programs and policies, and budget, legislative, and regulatory actions. An increase of $0.1 million is requested for an information technology upgrade. The Homeland Security Staff was created with emergency supplemental funding in 2002 for the purpose of establishing a central oversight and assistance capability within USDA for its many homeland security activities. Funding of $1.48 million is requested for the continued operation of the staff. The Department’s request for its Agriculture Buildings and Facilities appropriation includes $41.4 million for the operation and maintenance of the headquarters complex, including the Beltsville office facility and $34 million for the continued renovation of the South Building in Washington, D.C. The South Building is nearly 70 years old and is in need of repair to address electrical malfunctions, poor air quality, lead paint, and numerous code violations. The 2004 budget continues funding for this modernization and provides $11 million in additional funding for physical security upgrades, increased GSA rent and contract costs.
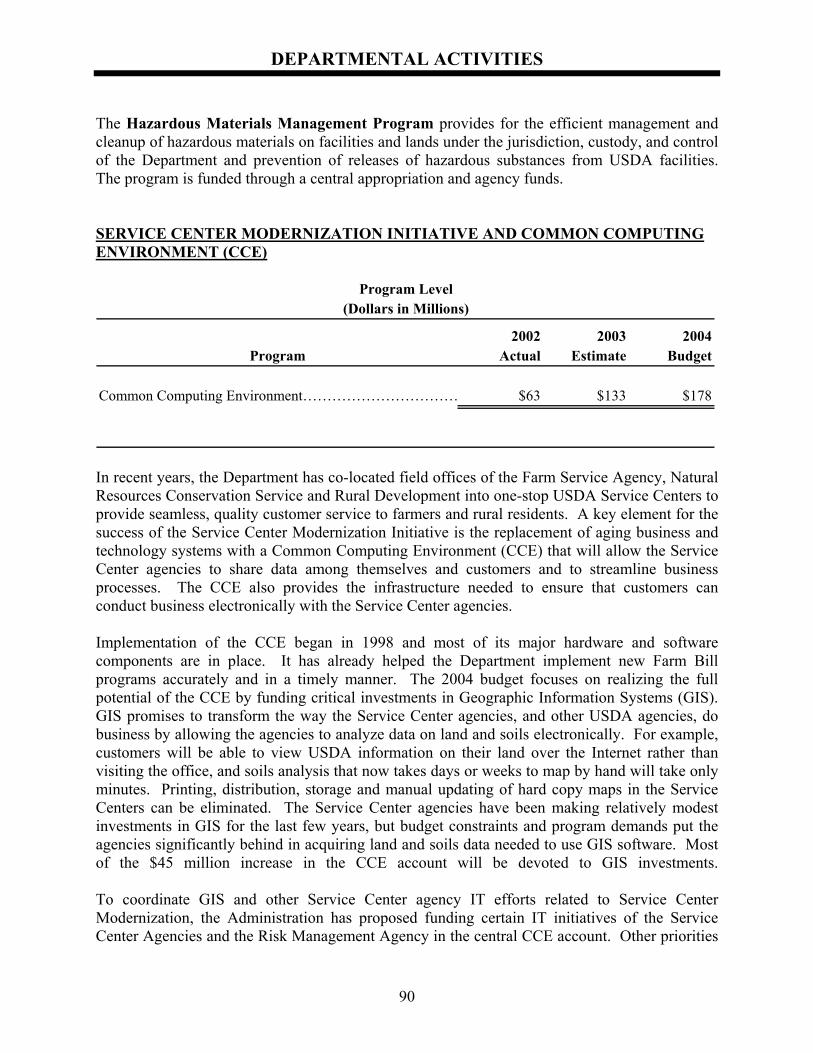
DEPARTMENTAL ACTIVITIES
90
The Hazardous Materials Management Program provides for the efficient management and cleanup of hazardous materials on facilities and lands under the jurisdiction, custody, and control of the Department and prevention of releases of hazardous substances from USDA facilities. The program is funded through a central appropriation and agency funds. SERVICE CENTER MODERNIZATION INITIATIVE AND COMMON COMPUTING ENVIRONMENT (CCE)
Program Level(Dollars in Millions)
2002 2003 2004Program Actual Estimate Budget
Common Computing Environment…………………………… $63 $133 $178
In recent years, the Department has co-located field offices of the Farm Service Agency, Natural Resources Conservation Service and Rural Development into one-stop USDA Service Centers to provide seamless, quality customer service to farmers and rural residents. A key element for the success of the Service Center Modernization Initiative is the replacement of aging business and technology systems with a Common Computing Environment (CCE) that will allow the Service Center agencies to share data among themselves and customers and to streamline business processes. The CCE also provides the infrastructure needed to ensure that customers can conduct business electronically with the Service Center agencies. Implementation of the CCE began in 1998 and most of its major hardware and software components are in place. It has already helped the Department implement new Farm Bill programs accurately and in a timely manner. The 2004 budget focuses on realizing the full potential of the CCE by funding critical investments in Geographic Information Systems (GIS). GIS promises to transform the way the Service Center agencies, and other USDA agencies, do business by allowing the agencies to analyze data on land and soils electronically. For example, customers will be able to view USDA information on their land over the Internet rather than visiting the office, and soils analysis that now takes days or weeks to map by hand will take only minutes. Printing, distribution, storage and manual updating of hard copy maps in the Service Centers can be eliminated. The Service Center agencies have been making relatively modest investments in GIS for the last few years, but budget constraints and program demands put the agencies significantly behind in acquiring land and soils data needed to use GIS software. Most of the $45 million increase in the CCE account will be devoted to GIS investments. To coordinate GIS and other Service Center agency IT efforts related to Service Center Modernization, the Administration has proposed funding certain IT initiatives of the Service Center Agencies and the Risk Management Agency in the central CCE account. Other priorities
DEPARTMENTAL ACTIVITIES
91
for CCE funding include replacing some of the oldest CCE equipment to prevent it from becoming obsolete and providing adequate telecommunications capability. Complementing efforts to modernize and standardize the Service Center agencies’ technology, the Department is also taking steps to integrate the information technology support functions of the Service Center agencies into a single organization and will examine whether further administrative efficiencies can be gained in these agencies.
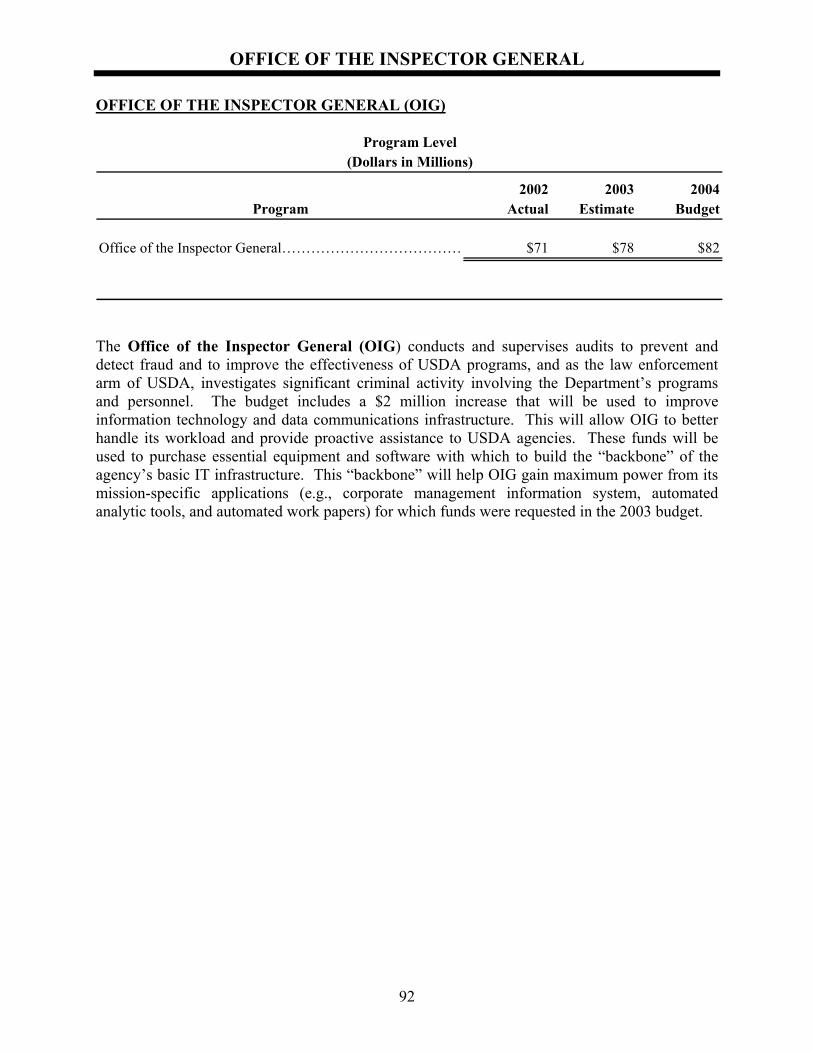
OFFICE OF THE INSPECTOR GENERAL
92
OFFICE OF THE INSPECTOR GENERAL (OIG)
Program Level(Dollars in Millions)
2002 2003 2004Program Actual Estimate Budget
Office of the Inspector General………………………………… $71 $78 $82
The Office of the Inspector General (OIG) conducts and supervises audits to prevent and detect fraud and to improve the effectiveness of USDA programs, and as the law enforcement arm of USDA, investigates significant criminal activity involving the Department’s programs and personnel. The budget includes a $2 million increase that will be used to improve information technology and data communications infrastructure. This will allow OIG to better handle its workload and provide proactive assistance to USDA agencies. These funds will be used to purchase essential equipment and software with which to build the “backbone” of the agency’s basic IT infrastructure. This “backbone” will help OIG gain maximum power from its mission-specific applications (e.g., corporate management information system, automated analytic tools, and automated work papers) for which funds were requested in the 2003 budget.
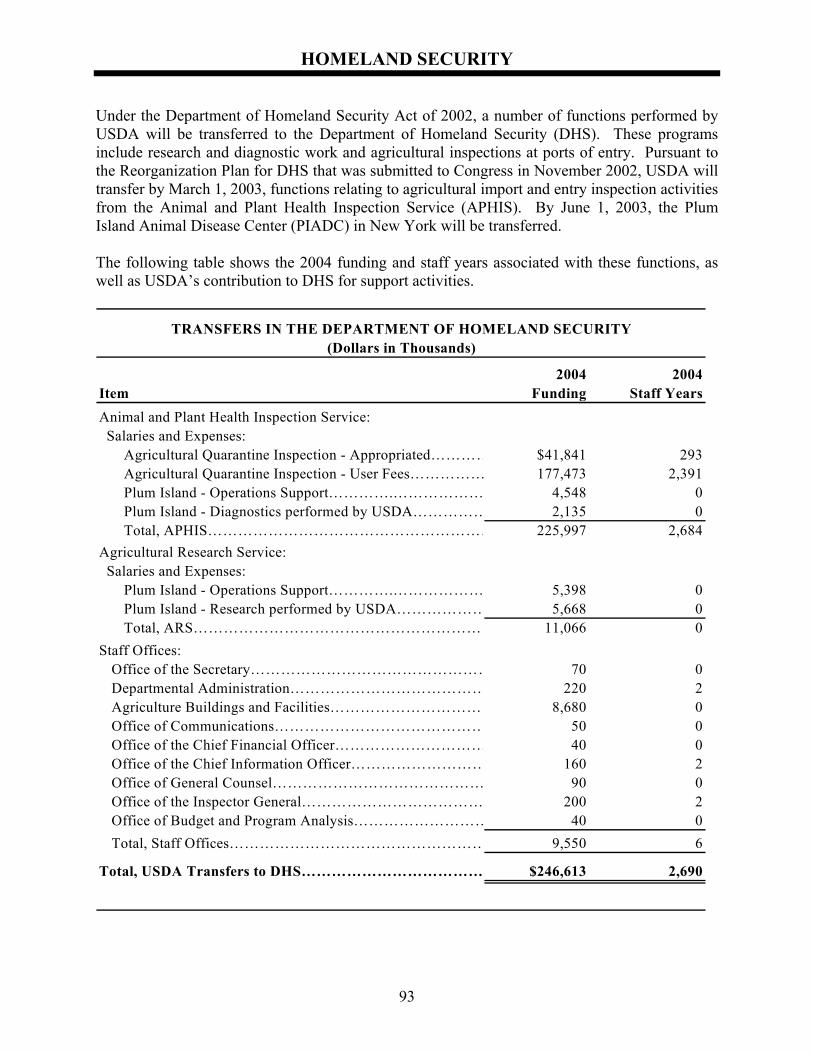
HOMELAND SECURITY
93
Under the Department of Homeland Security Act of 2002, a number of functions performed by USDA will be transferred to the Department of Homeland Security (DHS). These programs include research and diagnostic work and agricultural inspections at ports of entry. Pursuant to the Reorganization Plan for DHS that was submitted to Congress in November 2002, USDA will transfer by March 1, 2003, functions relating to agricultural import and entry inspection activities from the Animal and Plant Health Inspection Service (APHIS). By June 1, 2003, the Plum Island Animal Disease Center (PIADC) in New York will be transferred. The following table shows the 2004 funding and staff years associated with these functions, as well as USDA’s contribution to DHS for support activities.
2004 2004Item Funding Staff YearsAnimal and Plant Health Inspection Service: Salaries and Expenses:
Agricultural Quarantine Inspection - Appropriated………… $41,841 293Agricultural Quarantine Inspection - User Fees…………… 177,473 2,391Plum Island - Operations Support………….……………… 4,548 0Plum Island - Diagnostics performed by USDA…………… 2,135 0Total, APHIS………………………………………………… 225,997 2,684
Agricultural Research Service: Salaries and Expenses:
Plum Island - Operations Support………….……………… 5,398 0Plum Island - Research performed by USDA……………… 5,668 0Total, ARS…………………………………………………… 11,066 0
Staff Offices:Office of the Secretary………………………………………… 70 0Departmental Administration………………………………… 220 2Agriculture Buildings and Facilities…………………………… 8,680 0Office of Communications…………………………………… 50 0Office of the Chief Financial Officer………………………… 40 0Office of the Chief Information Officer……………………… 160 2Office of General Counsel…………………………………… 90 0Office of the Inspector General……………………………… 200 2Office of Budget and Program Analysis……………………… 40 0Total, Staff Offices…………………………………………… 9,550 6
Total, USDA Transfers to DHS……………………………… $246,613 2,690
TRANSFERS IN THE DEPARTMENT OF HOMELAND SECURITY(Dollars in Thousands)
HOMELAND SECURITY
94
Most of the APHIS Agricultural Quarantine Inspection (AQI) program is also being transferred to the DHS. An estimated 2,684 staff years will transfer to DHS to conduct inspections at ports of entry. Such services previously provided at U.S. ports of entry and the Canadian and Mexican borders will be conducted by DHS. USDA retains the role of ensuring that passengers and cargoes traveling from Hawaii and Puerto Rico comply with specified regulations to protect the health of the agricultural sector on the Mainland. PIADC houses Agricultural Research Service research related to Foot and Mouth Disease, African Swine Fever and other exotic animal diseases. PIADC also houses APHIS’ Foreign Animal Disease and Diagnostics Laboratory. The 2004 Budget proposes to finance laboratory support costs with an appropriation to DHS. In addition, the budget proposes to include funding for one-half of the research and diagnostic program activities in the DHS budget. The budget assumes this funding will be used for continuing support of USDA personnel through 2005. In addition to these program areas, funding is also being transferred from various Departmental staff offices to support DHS related activities.
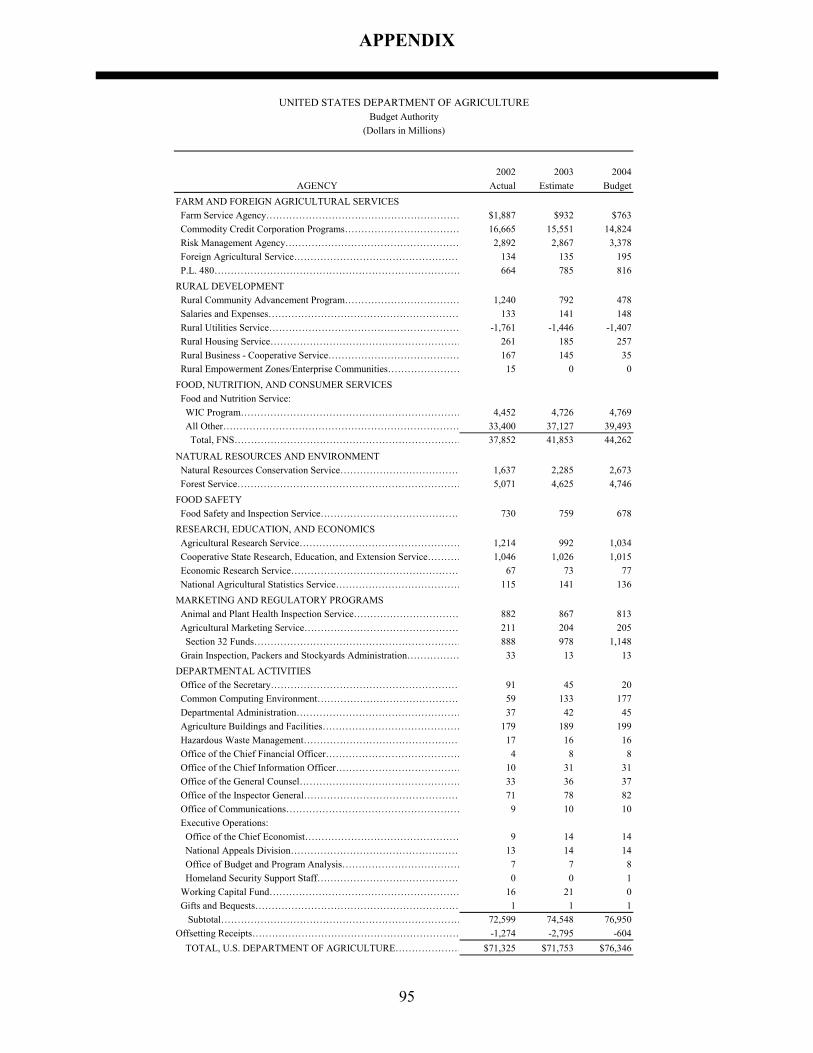
APPENDIX
95
UNITED STATES DEPARTMENT OF AGRICULTUREBudget Authority
(Dollars in Millions)
2002 2003 2004AGENCY Actual Estimate Budget
FARM AND FOREIGN AGRICULTURAL SERVICES Farm Service Agency…………………………………………………… $1,887 $932 $763 Commodity Credit Corporation Programs……………………………… 16,665 15,551 14,824 Risk Management Agency……………………………………………… 2,892 2,867 3,378 Foreign Agricultural Service…………………………………………… 134 135 195 P.L. 480………………………………………………………………… 664 785 816RURAL DEVELOPMENT Rural Community Advancement Program……………………………… 1,240 792 478 Salaries and Expenses…………………………………………………… 133 141 148 Rural Utilities Service…………………………………………………… -1,761 -1,446 -1,407 Rural Housing Service…………………………………………………… 261 185 257 Rural Business - Cooperative Service…………………………………… 167 145 35 Rural Empowerment Zones/Enterprise Communities…………………… 15 0 0FOOD, NUTRITION, AND CONSUMER SERVICES Food and Nutrition Service: WIC Program…………………………………………………………… 4,452 4,726 4,769 All Other……………………………………………………………… 33,400 37,127 39,493 Total, FNS…………………………………………………………… 37,852 41,853 44,262
NATURAL RESOURCES AND ENVIRONMENT Natural Resources Conservation Service……………………………… 1,637 2,285 2,673 Forest Service…………………………………………………………… 5,071 4,625 4,746FOOD SAFETY Food Safety and Inspection Service…………………………………… 730 759 678RESEARCH, EDUCATION, AND ECONOMICS Agricultural Research Service…………………………………………… 1,214 992 1,034 Cooperative State Research, Education, and Extension Service………… 1,046 1,026 1,015 Economic Research Service…………………………………………… 67 73 77 National Agricultural Statistics Service………………………………… 115 141 136MARKETING AND REGULATORY PROGRAMS Animal and Plant Health Inspection Service…………………………… 882 867 813 Agricultural Marketing Service………………………………………… 211 204 205 Section 32 Funds……………………………………………………… 888 978 1,148 Grain Inspection, Packers and Stockyards Administration……………… 33 13 13DEPARTMENTAL ACTIVITIES Office of the Secretary…………………………………………………… 91 45 20 Common Computing Environment……………………………………… 59 133 177 Departmental Administration…………………………………………… 37 42 45 Agriculture Buildings and Facilities…………………………………… 179 189 199 Hazardous Waste Management………………………………………… 17 16 16 Office of the Chief Financial Officer…………………………………… 4 8 8 Office of the Chief Information Officer………………………………… 10 31 31 Office of the General Counsel…………………………………………… 33 36 37 Office of the Inspector General………………………………………… 71 78 82 Office of Communications……………………………………………… 9 10 10 Executive Operations: Office of the Chief Economist………………………………………… 9 14 14 National Appeals Division……………………………………………… 13 14 14 Office of Budget and Program Analysis……………………………… 7 7 8 Homeland Security Support Staff……………………………………… 0 0 1 Working Capital Fund…………………………………………………… 16 21 0 Gifts and Bequests……………………………………………………… 1 1 1 Subtotal………………………………………………………………… 72,599 74,548 76,950Offsetting Receipts……………………………………………………… -1,274 -2,795 -604 TOTAL, U.S. DEPARTMENT OF AGRICULTURE………………… $71,325 $71,753 $76,346
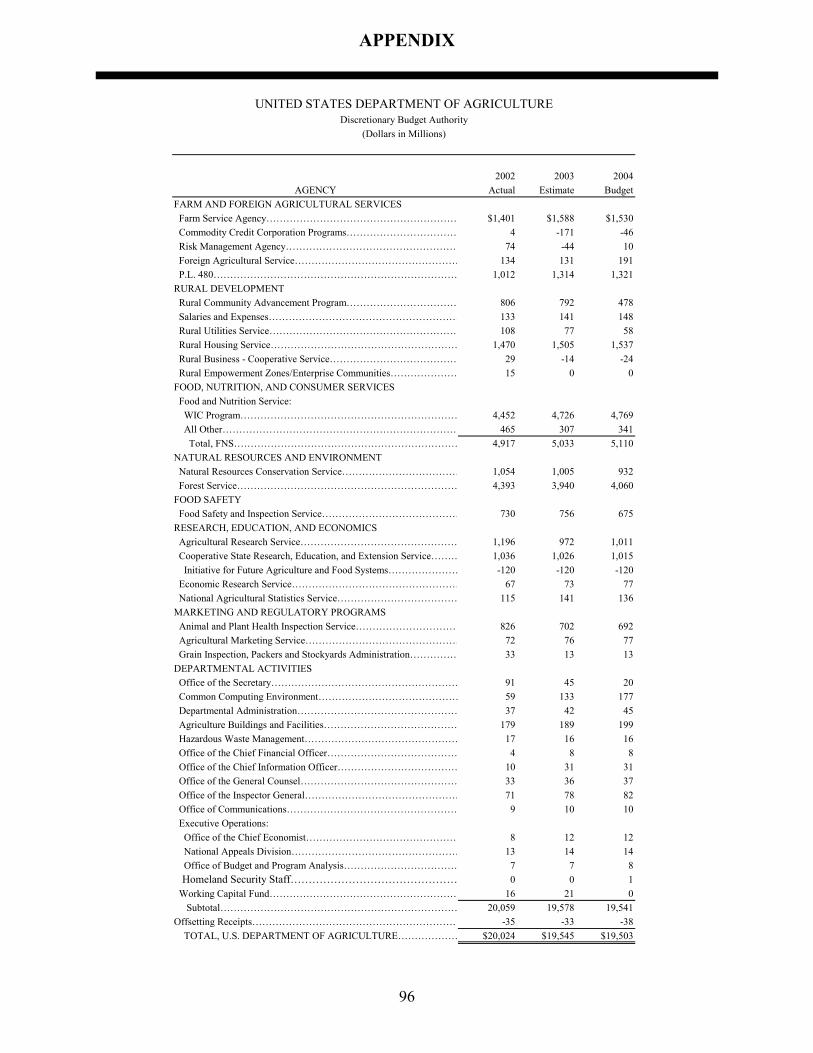
APPENDIX
96
UNITED STATES DEPARTMENT OF AGRICULTUREDiscretionary Budget Authority
(Dollars in Millions)
2002 2003 2004AGENCY Actual Estimate Budget
FARM AND FOREIGN AGRICULTURAL SERVICES Farm Service Agency………………………………………………… $1,401 $1,588 $1,530 Commodity Credit Corporation Programs…………………………… 4 -171 -46 Risk Management Agency……………………………………………… 74 -44 10 Foreign Agricultural Service…………………………………………… 134 131 191 P.L. 480………………………………………………………………… 1,012 1,314 1,321RURAL DEVELOPMENT Rural Community Advancement Program…………………………… 806 792 478 Salaries and Expenses………………………………………………… 133 141 148 Rural Utilities Service………………………………………………… 108 77 58 Rural Housing Service………………………………………………… 1,470 1,505 1,537 Rural Business - Cooperative Service………………………………… 29 -14 -24 Rural Empowerment Zones/Enterprise Communities………………… 15 0 0FOOD, NUTRITION, AND CONSUMER SERVICES Food and Nutrition Service: WIC Program………………………………………………………… 4,452 4,726 4,769 All Other……………………………………………………………… 465 307 341 Total, FNS…………………………………………………………… 4,917 5,033 5,110NATURAL RESOURCES AND ENVIRONMENT Natural Resources Conservation Service……………………………… 1,054 1,005 932 Forest Service………………………………………………………… 4,393 3,940 4,060FOOD SAFETY Food Safety and Inspection Service…………………………………… 730 756 675RESEARCH, EDUCATION, AND ECONOMICS Agricultural Research Service………………………………………… 1,196 972 1,011 Cooperative State Research, Education, and Extension Service……… 1,036 1,026 1,015 Initiative for Future Agriculture and Food Systems………………… -120 -120 -120 Economic Research Service…………………………………………… 67 73 77 National Agricultural Statistics Service……………………………… 115 141 136MARKETING AND REGULATORY PROGRAMS Animal and Plant Health Inspection Service…………………………… 826 702 692 Agricultural Marketing Service………………………………………… 72 76 77 Grain Inspection, Packers and Stockyards Administration…………… 33 13 13DEPARTMENTAL ACTIVITIES Office of the Secretary………………………………………………… 91 45 20 Common Computing Environment…………………………………… 59 133 177 Departmental Administration………………………………………… 37 42 45 Agriculture Buildings and Facilities…………………………………… 179 189 199 Hazardous Waste Management………………………………………… 17 16 16 Office of the Chief Financial Officer………………………………… 4 8 8 Office of the Chief Information Officer……………………………… 10 31 31 Office of the General Counsel………………………………………… 33 36 37 Office of the Inspector General………………………………………… 71 78 82 Office of Communications…………………………………………… 9 10 10 Executive Operations: Office of the Chief Economist………………………………………… 8 12 12 National Appeals Division…………………………………………… 13 14 14 Office of Budget and Program Analysis……………………………… 7 7 8 Homeland Security Staff………………………………………… 0 0 1 Working Capital Fund………………………………………………… 16 21 0 Subtotal……………………………………………………………… 20,059 19,578 19,541Offsetting Receipts……………………………………………………… -35 -33 -38 TOTAL, U.S. DEPARTMENT OF AGRICULTURE……………… $20,024 $19,545 $19,503
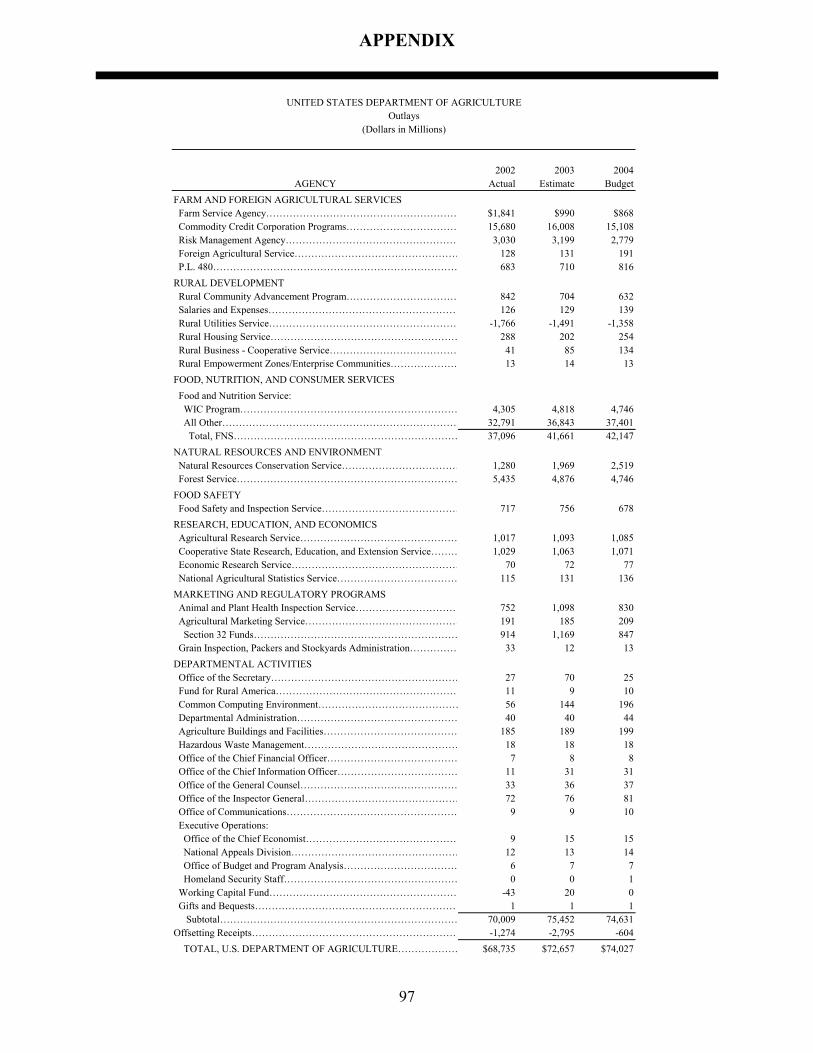
APPENDIX
97
UNITED STATES DEPARTMENT OF AGRICULTUREOutlays
(Dollars in Millions)
2002 2003 2004AGENCY Actual Estimate Budget
FARM AND FOREIGN AGRICULTURAL SERVICES Farm Service Agency………………………………………………… $1,841 $990 $868 Commodity Credit Corporation Programs…………………………… 15,680 16,008 15,108 Risk Management Agency……………………………………………… 3,030 3,199 2,779 Foreign Agricultural Service…………………………………………… 128 131 191 P.L. 480………………………………………………………………… 683 710 816RURAL DEVELOPMENT Rural Community Advancement Program…………………………… 842 704 632 Salaries and Expenses………………………………………………… 126 129 139 Rural Utilities Service………………………………………………… -1,766 -1,491 -1,358 Rural Housing Service………………………………………………… 288 202 254 Rural Business - Cooperative Service………………………………… 41 85 134 Rural Empowerment Zones/Enterprise Communities………………… 13 14 13FOOD, NUTRITION, AND CONSUMER SERVICES Food and Nutrition Service: WIC Program………………………………………………………… 4,305 4,818 4,746 All Other……………………………………………………………… 32,791 36,843 37,401 Total, FNS…………………………………………………………… 37,096 41,661 42,147NATURAL RESOURCES AND ENVIRONMENT Natural Resources Conservation Service……………………………… 1,280 1,969 2,519 Forest Service………………………………………………………… 5,435 4,876 4,746FOOD SAFETY Food Safety and Inspection Service…………………………………… 717 756 678RESEARCH, EDUCATION, AND ECONOMICS Agricultural Research Service………………………………………… 1,017 1,093 1,085 Cooperative State Research, Education, and Extension Service……… 1,029 1,063 1,071 Economic Research Service…………………………………………… 70 72 77 National Agricultural Statistics Service……………………………… 115 131 136MARKETING AND REGULATORY PROGRAMS Animal and Plant Health Inspection Service…………………………… 752 1,098 830 Agricultural Marketing Service………………………………………… 191 185 209 Section 32 Funds……………………………………………………… 914 1,169 847 Grain Inspection, Packers and Stockyards Administration…………… 33 12 13DEPARTMENTAL ACTIVITIES Office of the Secretary………………………………………………… 27 70 25 Fund for Rural America………………………………………………… 11 9 10 Common Computing Environment…………………………………… 56 144 196 Departmental Administration………………………………………… 40 40 44 Agriculture Buildings and Facilities…………………………………… 185 189 199 Hazardous Waste Management………………………………………… 18 18 18 Office of the Chief Financial Officer………………………………… 7 8 8 Office of the Chief Information Officer……………………………… 11 31 31 Office of the General Counsel………………………………………… 33 36 37 Office of the Inspector General………………………………………… 72 76 81 Office of Communications…………………………………………… 9 9 10 Executive Operations: Office of the Chief Economist………………………………………… 9 15 15 National Appeals Division…………………………………………… 12 13 14 Office of Budget and Program Analysis……………………………… 6 7 7 Homeland Security Staff……………………………………………… 0 0 1 Working Capital Fund………………………………………………… -43 20 0 Gifts and Bequests……………………………………………………… 1 1 1 Subtotal……………………………………………………………… 70,009 75,452 74,631Offsetting Receipts……………………………………………………… -1,274 -2,795 -604 TOTAL, U.S. DEPARTMENT OF AGRICULTURE……………… $68,735 $72,657 $74,027
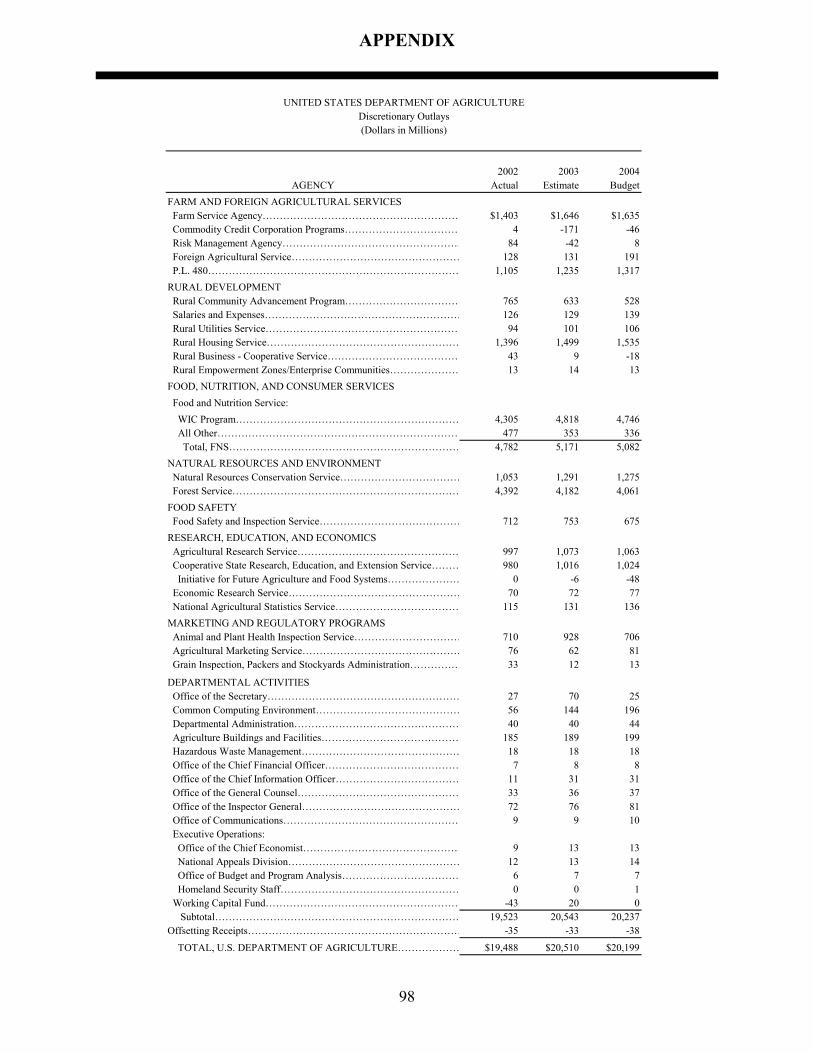
APPENDIX
98
UNITED STATES DEPARTMENT OF AGRICULTUREDiscretionary Outlays(Dollars in Millions)
2002 2003 2004AGENCY Actual Estimate Budget
FARM AND FOREIGN AGRICULTURAL SERVICES Farm Service Agency………………………………………………… $1,403 $1,646 $1,635 Commodity Credit Corporation Programs…………………………… 4 -171 -46 Risk Management Agency……………………………………………… 84 -42 8 Foreign Agricultural Service…………………………………………… 128 131 191 P.L. 480………………………………………………………………… 1,105 1,235 1,317RURAL DEVELOPMENT Rural Community Advancement Program…………………………… 765 633 528 Salaries and Expenses………………………………………………… 126 129 139 Rural Utilities Service………………………………………………… 94 101 106 Rural Housing Service………………………………………………… 1,396 1,499 1,535 Rural Business - Cooperative Service………………………………… 43 9 -18 Rural Empowerment Zones/Enterprise Communities………………… 13 14 13FOOD, NUTRITION, AND CONSUMER SERVICES Food and Nutrition Service: WIC Program………………………………………………………… 4,305 4,818 4,746 All Other……………………………………………………………… 477 353 336 Total, FNS…………………………………………………………… 4,782 5,171 5,082NATURAL RESOURCES AND ENVIRONMENT Natural Resources Conservation Service……………………………… 1,053 1,291 1,275 Forest Service………………………………………………………… 4,392 4,182 4,061FOOD SAFETY Food Safety and Inspection Service…………………………………… 712 753 675RESEARCH, EDUCATION, AND ECONOMICS Agricultural Research Service………………………………………… 997 1,073 1,063 Cooperative State Research, Education, and Extension Service……… 980 1,016 1,024 Initiative for Future Agriculture and Food Systems………………… 0 -6 -48 Economic Research Service…………………………………………… 70 72 77 National Agricultural Statistics Service……………………………… 115 131 136MARKETING AND REGULATORY PROGRAMS Animal and Plant Health Inspection Service…………………………… 710 928 706 Agricultural Marketing Service………………………………………… 76 62 81 Grain Inspection, Packers and Stockyards Administration…………… 33 12 13
DEPARTMENTAL ACTIVITIES Office of the Secretary………………………………………………… 27 70 25 Common Computing Environment…………………………………… 56 144 196 Departmental Administration………………………………………… 40 40 44 Agriculture Buildings and Facilities…………………………………… 185 189 199 Hazardous Waste Management………………………………………… 18 18 18 Office of the Chief Financial Officer………………………………… 7 8 8 Office of the Chief Information Officer……………………………… 11 31 31 Office of the General Counsel………………………………………… 33 36 37 Office of the Inspector General………………………………………… 72 76 81 Office of Communications…………………………………………… 9 9 10 Executive Operations: Office of the Chief Economist………………………………………… 9 13 13 National Appeals Division…………………………………………… 12 13 14 Office of Budget and Program Analysis……………………………… 6 7 7 Homeland Security Staff……………………………………………… 0 0 1 Working Capital Fund………………………………………………… -43 20 0 Subtotal……………………………………………………………… 19,523 20,543 20,237Offsetting Receipts……………………………………………………… -35 -33 -38
TOTAL, U.S. DEPARTMENT OF AGRICULTURE……………… $19,488 $20,510 $20,199
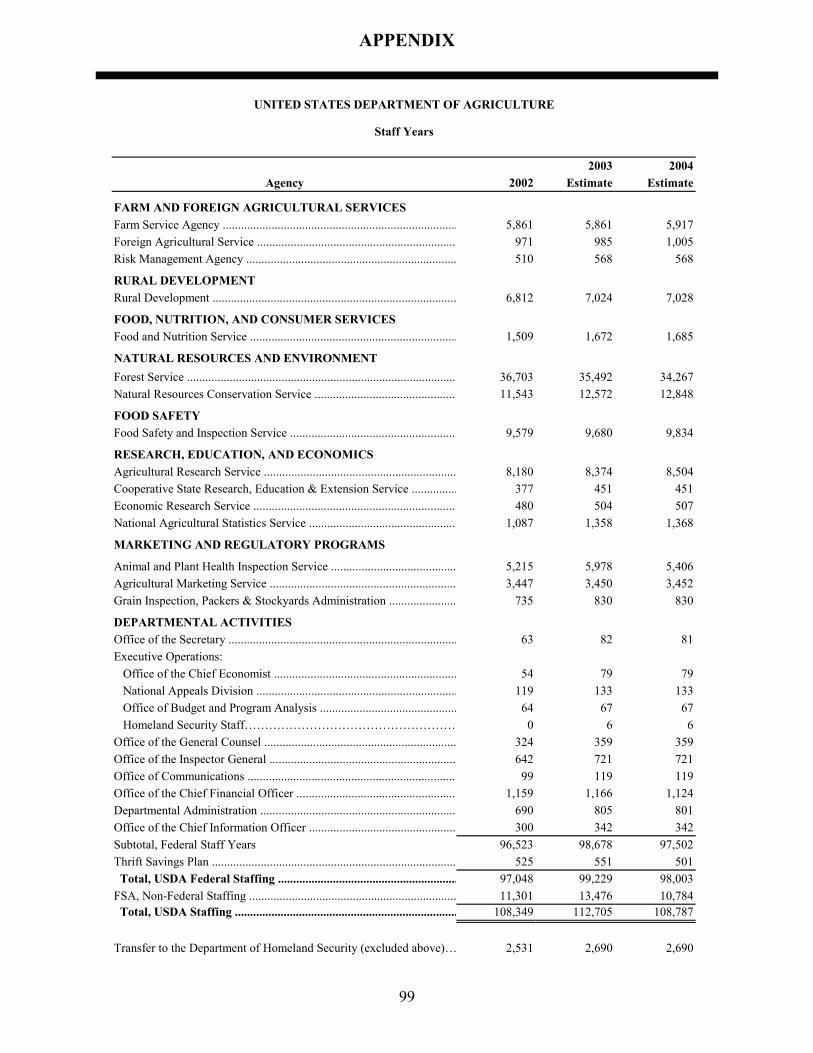
APPENDIX
99
UNITED STATES DEPARTMENT OF AGRICULTURE
Staff Years
2003 2004Agency 2002 Estimate Estimate
FARM AND FOREIGN AGRICULTURAL SERVICESFarm Service Agency ............................................................................. 5,861 5,861 5,917Foreign Agricultural Service ................................................................. 971 985 1,005Risk Management Agency ..................................................................... 510 568 568
RURAL DEVELOPMENTRural Development ................................................................................ 6,812 7,024 7,028
FOOD, NUTRITION, AND CONSUMER SERVICESFood and Nutrition Service .................................................................... 1,509 1,672 1,685
NATURAL RESOURCES AND ENVIRONMENTForest Service ........................................................................................ 36,703 35,492 34,267Natural Resources Conservation Service ............................................... 11,543 12,572 12,848
FOOD SAFETYFood Safety and Inspection Service ....................................................... 9,579 9,680 9,834
RESEARCH, EDUCATION, AND ECONOMICSAgricultural Research Service ............................................................... 8,180 8,374 8,504Cooperative State Research, Education & Extension Service ............... 377 451 451Economic Research Service ................................................................... 480 504 507National Agricultural Statistics Service ................................................ 1,087 1,358 1,368
MARKETING AND REGULATORY PROGRAMS
Animal and Plant Health Inspection Service ......................................... 5,215 5,978 5,406Agricultural Marketing Service ............................................................. 3,447 3,450 3,452Grain Inspection, Packers & Stockyards Administration ...................... 735 830 830
DEPARTMENTAL ACTIVITIESOffice of the Secretary ........................................................................... 63 82 81Executive Operations: Office of the Chief Economist ............................................................ 54 79 79 National Appeals Division .................................................................. 119 133 133 Office of Budget and Program Analysis ............................................. 64 67 67 Homeland Security Staff……………………………………………… 0 6 6Office of the General Counsel ............................................................... 324 359 359Office of the Inspector General ............................................................. 642 721 721Office of Communications ..................................................................... 99 119 119Office of the Chief Financial Officer .................................................... 1,159 1,166 1,124Departmental Administration ................................................................ 690 805 801Office of the Chief Information Officer ................................................ 300 342 342Subtotal, Federal Staff Years 96,523 98,678 97,502Thrift Savings Plan ................................................................................ 525 551 501 Total, USDA Federal Staffing ........................................................... 97,048 99,229 98,003FSA, Non-Federal Staffing .................................................................... 11,301 13,476 10,784 Total, USDA Staffing ......................................................................... 108,349 112,705 108,787
Transfer to the Department of Homeland Security (excluded above)… 2,531 2,690 2,690
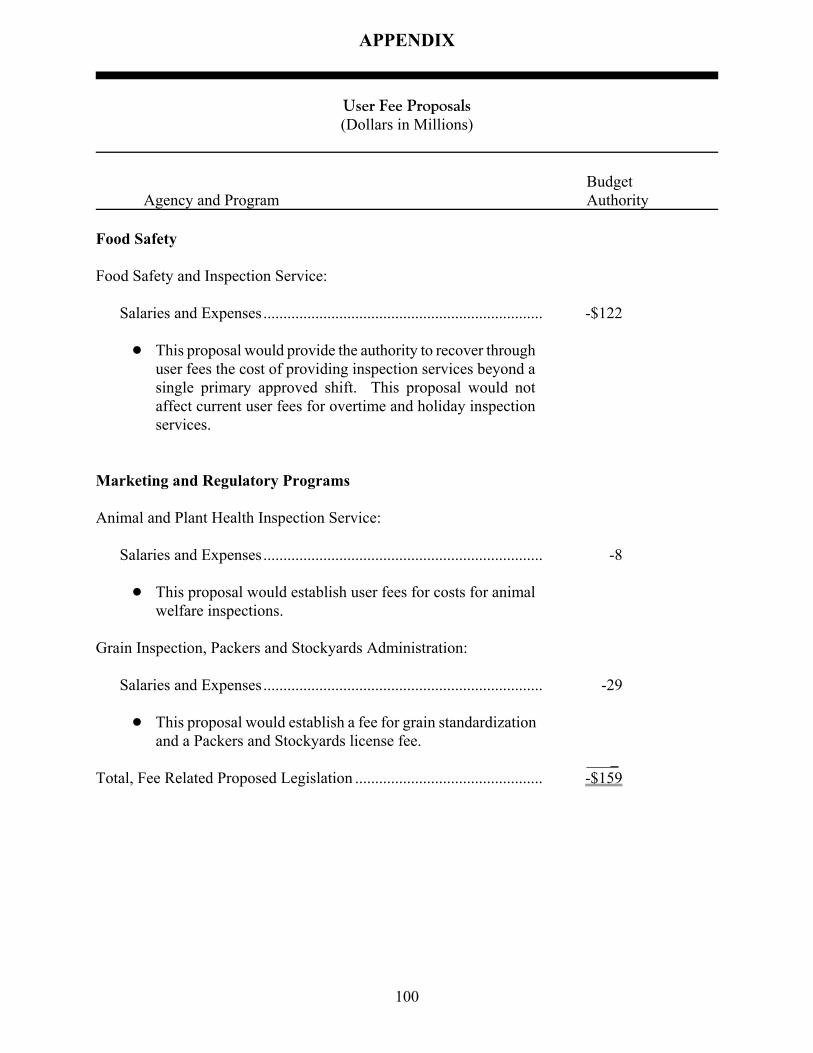
APPENDIX
100
User Fee Proposals (Dollars in Millions)
Budget Agency and Program Authority
Food Safety Food Safety and Inspection Service:
Salaries and Expenses ...................................................................... -$122
! This proposal would provide the authority to recover through user fees the cost of providing inspection services beyond a single primary approved shift. This proposal would not affect current user fees for overtime and holiday inspection services.
Marketing and Regulatory Programs Animal and Plant Health Inspection Service:
Salaries and Expenses ...................................................................... -8
! This proposal would establish user fees for costs for animal welfare inspections.
Grain Inspection, Packers and Stockyards Administration:
Salaries and Expenses ...................................................................... -29
! This proposal would establish a fee for grain standardization and a Packers and Stockyards license fee.
____ Total, Fee Related Proposed Legislation ............................................... -$159
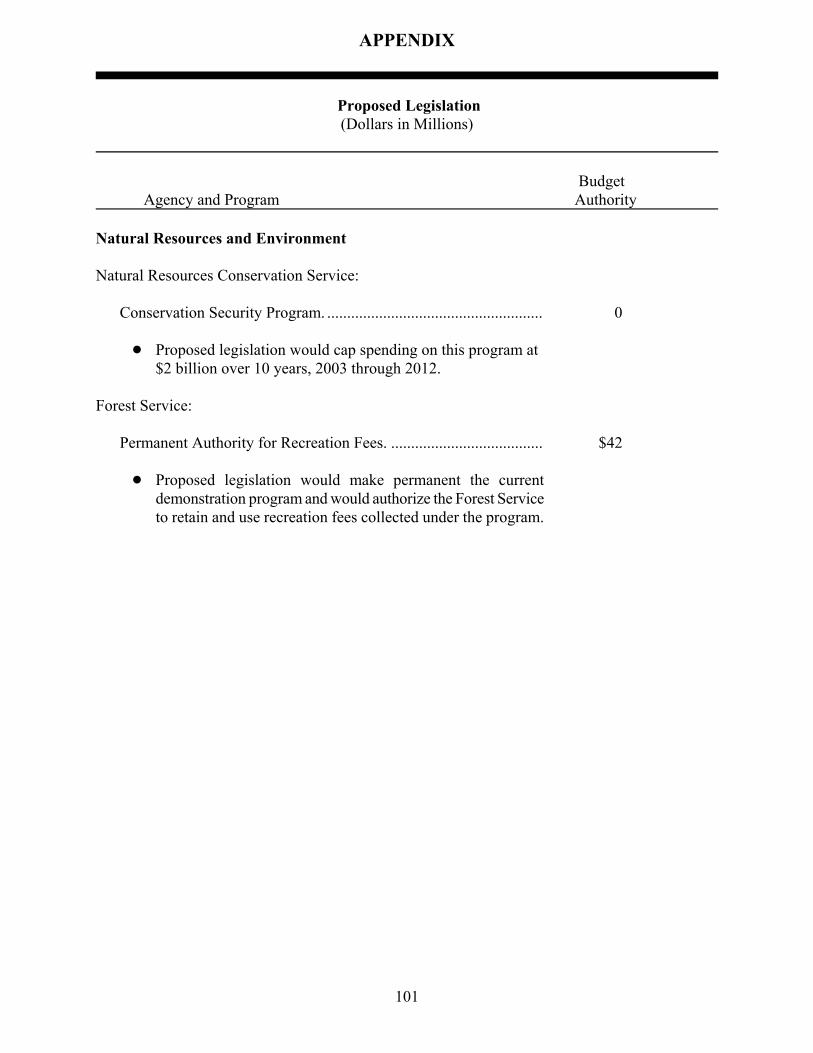
APPENDIX
101
Proposed Legislation (Dollars in Millions)
Budget Agency and Program Authority
Natural Resources and Environment Natural Resources Conservation Service:
Conservation Security Program. ...................................................... 0 ! Proposed legislation would cap spending on this program at $2 billion over 10 years, 2003 through 2012.
Forest Service:
Permanent Authority for Recreation Fees. ...................................... $42
! Proposed legislation would make permanent the current demonstration program and would authorize the Forest Service to retain and use recreation fees collected under the program.


![Textual & Visual Media 6, 2013 [177-196] Nativos digitales ... … · Textual & Visual Media 6, 2013 [177-196] [178] Textual ... afirma que un nativo digital es una persona nacida](https://img.pdfslide.us/doc/110x75/608fbd7f656ca874676b2240/textual-visual-media-6-2013-177-196-nativos-digitales-textual-.jpg)