Embed Size (px)
Citation preview
Required Report - public distribution
Date: 12/21/2006
GAIN Report Number: IN6111
IN6111
India
Report
Retail Food Sector
2006 Approved by: Holly Higgins U.S. Embassy, New Delhi
Prepared by: Santosh Kr. Singh Report Highlights: Food retailing in India is in transition. ‘Organized’ retailing is now in full swing in India with several large Indian corporate entering and expanding their operations. The optimism in the food retail sector stems from a vibrant and growing economy, increasing purchasing power, and an increasing number of urban consumers demanding a more international shopping experience. This provides an opportunity for the supply of U.S. food products to India. However, success in introducing a new product in this highly price sensitive market depends on an effective pricing strategy and familiarity with India’s myriad food laws. High import tariffs and competition from inexpensive domestic products are other challenges.
Includes PSD Changes: No Includes Trade Matrix: No
Annual Report New Delhi [IN1]
[IN]
USDA Foreign Agricultural Service
GAIN ReportGlobal Agriculture Information Network
Template Version 2.09
GAIN Report - IN6111 Page 2 of 17
UNCLASSIFIED USDA Foreign Agricultural Service
I. MARKET SUMMARY
General Economy and Policy Environment
q Indian economic growth ranged between 6 to 8.4 percent annually over the last decade.
q India’s economy is expected to double by 2010 (Merrill Lynch) and will be the third largest economy by 2050 (Goldman Sachs)
q India is the fourth largest economy in the world in terms of purchasing power parity (PPP), next only to USA, China and Japan
The Indian economy is expected to grow at over 8.0 percent in Indian fiscal year (IFY) 2006/07 (April/March) on top of strong growth in the manufacturing and services sectors, robust exports, and record foreign institutional investment. The government’s Planning Commission has set an average gross domestic product (GDP) growth rate target of 9 percent for the upcoming Eleventh five-year plan (2007 to 2012). India’s foreign exchange reserves are at an all time high of $ 175 billion as of end November 2006. The current Congress party-led United Progressive Alliance (UPA) government has adopted ‘economic reforms with a human face’ as a guiding principal. A lively debate is ongoing in India on the issue of allowing in foreign direct investment (FDI) in the retail sector, which is effectively prohibited now, ostensibly to protect the interest of millions of small retailers. However, the government supports allowing foreign direct investment in the retail sector in a gradual manner. In January 2006, the government allowed up to 51 percent FDI in retail outlets meant exclusively for ‘single brands’. Industry observers believe that FDI through joint ventures may be permitted as ‘unrestricted retailing’ in the next few years. Initially, foreign companies may be allowed a minority stake, which could be raised later. The government has initiated various domestic tax reforms including introduction of a value added tax (VAT) system in April 2005, which brought all retailers, whether big or small, into the tax loop. Earlier, small, unorganized traders and retailers were largely excluded from the tax regime. Status of Food Retail Sector
q The food and grocery retail sector in India is largely unorganized and is madeup of over 6.5 million ‘Pop & Son’ corner stores. The share of large, organized food retailing is less than one percent.
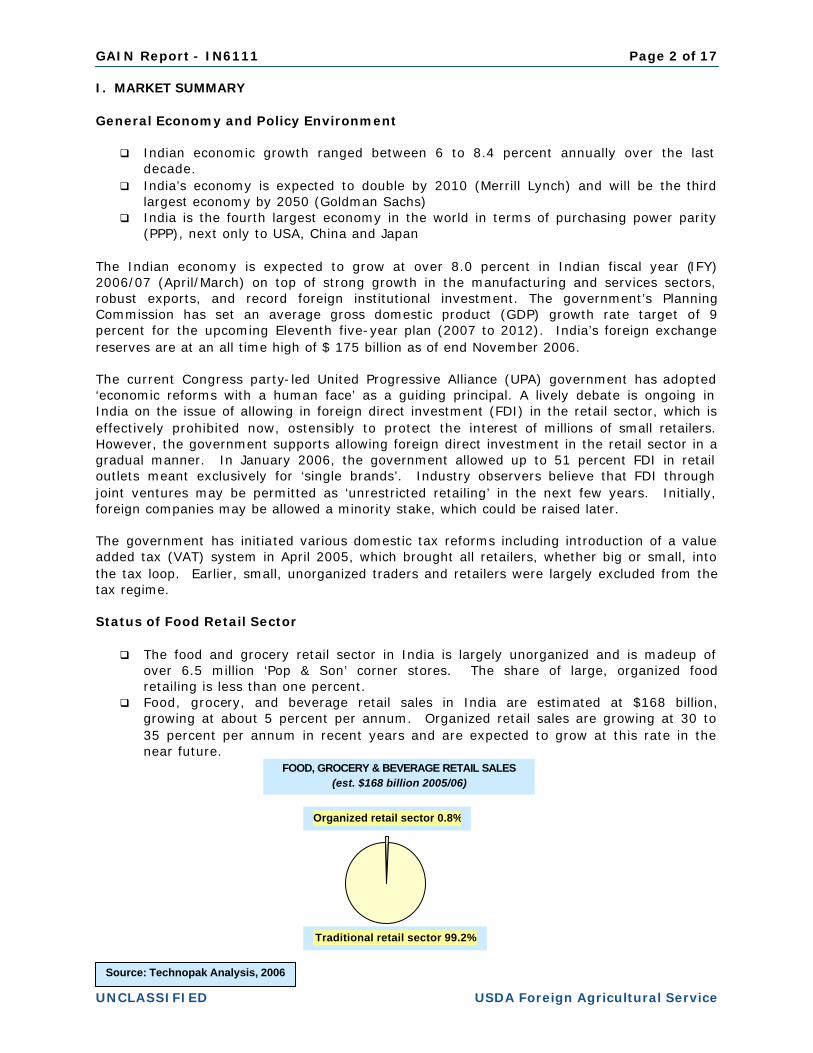
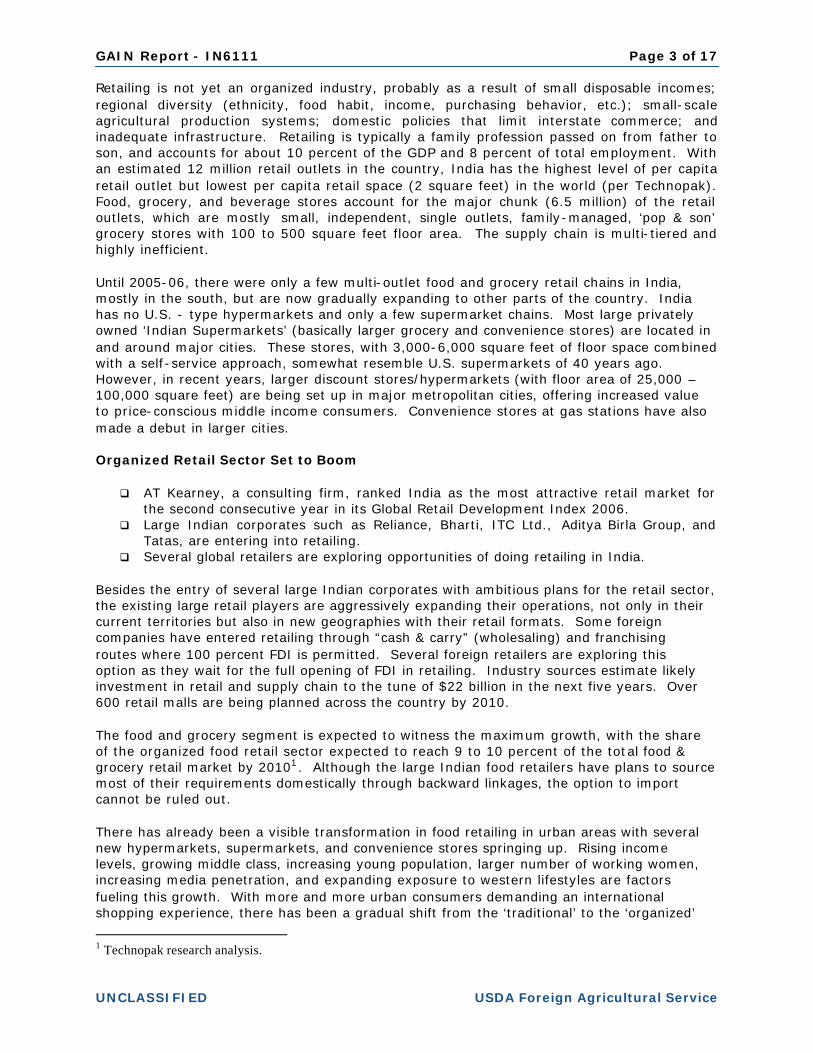
q Food, grocery, and beverage retail sales in India are estimated at $168 billion, growing at about 5 percent per annum. Organized retail sales are growing at 30 to 35 percent per annum in recent years and are expected to grow at this rate in the near future.
FOOD, GROCERY & BEVERAGE RETAIL SALES (est. $168 billion 2005/06)
Organized retail sector 0.8%
Traditional retail sector 99.2%
Source: Technopak Analysis, 2006y
GAIN Report - IN6111 Page 3 of 17
UNCLASSIFIED USDA Foreign Agricultural Service
Retailing is not yet an organized industry, probably as a result of small disposable incomes; regional diversity (ethnicity, food habit, income, purchasing behavior, etc.); small-scale agricultural production systems; domestic policies that limit interstate commerce; and inadequate infrastructure. Retailing is typically a family profession passed on from father to son, and accounts for about 10 percent of the GDP and 8 percent of total employment. With an estimated 12 million retail outlets in the country, India has the highest level of per capita retail outlet but lowest per capita retail space (2 square feet) in the world (per Technopak). Food, grocery, and beverage stores account for the major chunk (6.5 million) of the retail outlets, which are mostly small, independent, single outlets, family-managed, ‘pop & son’ grocery stores with 100 to 500 square feet floor area. The supply chain is multi-tiered and highly inefficient. Until 2005-06, there were only a few multi-outlet food and grocery retail chains in India, mostly in the south, but are now gradually expanding to other parts of the country. India has no U.S. - type hypermarkets and only a few supermarket chains. Most large privately owned ‘Indian Supermarkets’ (basically larger grocery and convenience stores) are located in and around major cities. These stores, with 3,000-6,000 square feet of floor space combined with a self-service approach, somewhat resemble U.S. supermarkets of 40 years ago. However, in recent years, larger discount stores/hypermarkets (with floor area of 25,000 – 100,000 square feet) are being set up in major metropolitan cities, offering increased value to price-conscious middle income consumers. Convenience stores at gas stations have also made a debut in larger cities. Organized Retail Sector Set to Boom
q AT Kearney, a consulting firm, ranked India as the most attractive retail market for the second consecutive year in its Global Retail Development Index 2006.
q Large Indian corporates such as Reliance, Bharti, ITC Ltd., Aditya Birla Group, and Tatas, are entering into retailing.
q Several global retailers are exploring opportunities of doing retailing in India. Besides the entry of several large Indian corporates with ambitious plans for the retail sector, the existing large retail players are aggressively expanding their operations, not only in their current territories but also in new geographies with their retail formats. Some foreign companies have entered retailing through “cash & carry” (wholesaling) and franchising routes where 100 percent FDI is permitted. Several foreign retailers are exploring this option as they wait for the full opening of FDI in retailing. Industry sources estimate likely investment in retail and supply chain to the tune of $22 billion in the next five years. Over 600 retail malls are being planned across the country by 2010. The food and grocery segment is expected to witness the maximum growth, with the share of the organized food retail sector expected to reach 9 to 10 percent of the total food & grocery retail market by 20101. Although the large Indian food retailers have plans to source most of their requirements domestically through backward linkages, the option to import cannot be ruled out. There has already been a visible transformation in food retailing in urban areas with several new hypermarkets, supermarkets, and convenience stores springing up. Rising income levels, growing middle class, increasing young population, larger number of working women, increasing media penetration, and expanding exposure to western lifestyles are factors fueling this growth. With more and more urban consumers demanding an international shopping experience, there has been a gradual shift from the ‘traditional’ to the ‘organized’
1 Technopak research analysis.
GAIN Report - IN6111 Page 4 of 17
UNCLASSIFIED USDA Foreign Agricultural Service
format of shopping. Meanwhile, traditional grocery shop owners are also gradually reformatting their operation by increasing floor space, and introducing self-service format, price discounts and other value-added services.
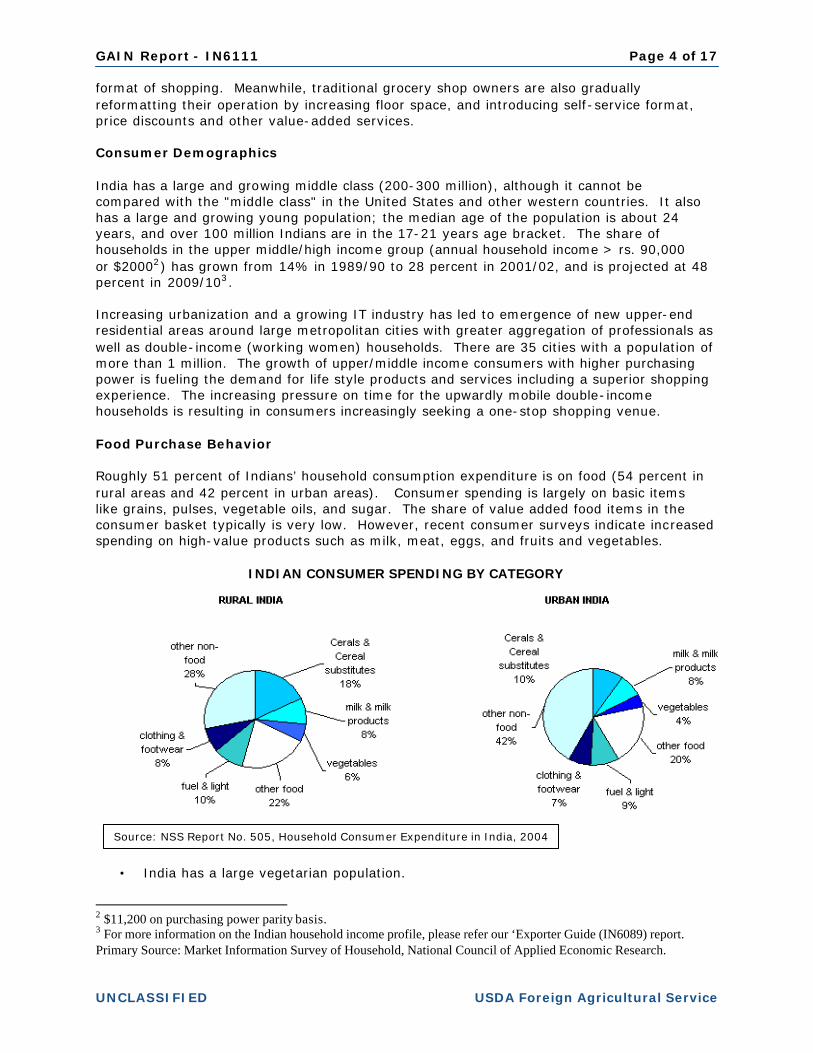
Consumer Demographics India has a large and growing middle class (200-300 million), although it cannot be compared with the "middle class" in the United States and other western countries. It also has a large and growing young population; the median age of the population is about 24 years, and over 100 million Indians are in the 17-21 years age bracket. The share of households in the upper middle/high income group (annual household income > rs. 90,000 or $20002) has grown from 14% in 1989/90 to 28 percent in 2001/02, and is projected at 48 percent in 2009/103. Increasing urbanization and a growing IT industry has led to emergence of new upper-end residential areas around large metropolitan cities with greater aggregation of professionals as well as double-income (working women) households. There are 35 cities with a population of more than 1 million. The growth of upper/middle income consumers with higher purchasing power is fueling the demand for life style products and services including a superior shopping experience. The increasing pressure on time for the upwardly mobile double-income households is resulting in consumers increasingly seeking a one-stop shopping venue. Food Purchase Behavior Roughly 51 percent of Indians’ household consumption expenditure is on food (54 percent in rural areas and 42 percent in urban areas). Consumer spending is largely on basic items like grains, pulses, vegetable oils, and sugar. The share of value added food items in the consumer basket typically is very low. However, recent consumer surveys indicate increased spending on high-value products such as milk, meat, eggs, and fruits and vegetables.
INDIAN CONSUMER SPENDING BY CATEGORY
• India has a large vegetarian population.
2 $11,200 on purchasing power parity basis. 3 For more information on the Indian household income profile, please refer our ‘Exporter Guide (IN6089) report. Primary Source: Market Information Survey of Household, National Council of Applied Economic Research.
Source: NSS Report No. 505, Household Consumer Expenditure in India, 2004
GAIN Report - IN6111 Page 5 of 17
UNCLASSIFIED USDA Foreign Agricultural Service
• Indians have a strong preference for fresh products and traditional spices and ingredients, which has generally slowed the penetration of western style food.
• Many Indians are willing to try new foods, but usually return to traditional fare. • Acceptance of packaged food is increasing due to
Ø rising incomes Ø increasing urbanization Ø more working women Ø increasing offering of western style products by multinational food companies Ø increasing exposure of the younger Indian professionals to western culture Ø proliferation of fast food outlets/coffee cafes
• Popular processed foods available in shops include-
Ø curry powders (spice mixes) Ø pickles Ø wheat flour Ø noodles Ø snack foods (mostly spicy Indian types) Ø biscuits, cakes, pastries, etc. Ø chocolates and confectionaries Ø ketchups and sauces; jams and jellies Ø table butter, ghee (melted butter), cheese Ø fruit juices, and soft drinks.
• Demand for specialty and high value foods, including imported, such as chocolates,
almonds and other nuts, cakes and pastries, exotic fruits, fruit juices, and Indian sweetmeats peaks during the fall festive season, especially at Diwali - the festival of lights. This is the best time to introduce new-to-market food products in India.
Shopping Habits Lacking purchasing power and sufficient home refrigeration, most Indians shop almost daily at small neighborhood specialty shops or roadside vendors (i.e., fruits and vegetables in one shop, dairy products in another, groceries in a third, and meats and fish in yet another). Quality is important, but there is a reluctance to pay a premium. Availability of many items, particularly fruits and vegetables, is seasonal, and people are accustomed to adjusting their food purchases to the season. Women do most of the shopping and make most food purchasing decisions. Households able to afford imported food products usually have servants who buy, clean, and prepare food. Most processed foods are sold in small containers due to customers’ limited purchasing power. Only over the past few years have Indians (mostly in cities) been exposed to supermarkets in the Western sense. Consumers from semi-urban, and rural localities, accounting for over 70 percent of the Indian population, have yet to experience modern retailing. Very recently, the ‘Shopping Mall’ culture is gaining ground in metropolitan and larger cities and urban suburbs in India.
Consumer Food Import Market Although quantitative restrictions on imports of most food and agricultural products were removed in April 2001, the government continues to discourage imports through relatively high tariffs and non-tariff barriers. Import tariffs on most consumer food products currently range from 30.6 to 58.4 percent (applied). Sensitive items such as alcoholic beverages continue to attract much higher duties (154-577 percent). Non-tariff barriers include non-transparent sanitary and phytosanitary regulations, onerous labeling requirements for
GAIN Report - IN6111 Page 6 of 17
UNCLASSIFIED USDA Foreign Agricultural Service
packaged goods, and ambiguous procedures for sampling and testing of food products at the time of imports. Factors that further dampen prospects for imported food include poor infrastructure (roads and cold chain), an unorganized retailing sector and multi-layered food distribution system. Refrigerated warehousing and transportation facilities are limited and costly, which results in high losses. These factors together raise the retail costs of imported food products almost 4 times the FOB cost (see Appendix 1). Nevertheless, the ‘untapped’ Indian market with a vibrant economy and a large middle class offers potential opportunities for U.S. suppliers of food and agricultural products. At present, there are 20-50 million upper/upper-middle Indian consumers (annual household income > Rs. 0.6 million or $ 13,500) who can afford to regularly purchase imported food products, and this number is growing. Market sources estimate that the spending of these consumers has been growing annually at about 10-12 percent versus the overall spending growth of 6-8 percent for all consumer classes. Imported food items are largely limited to the organized retail sector and grocery stores catering to high-end consumers in the urban areas. The share of imported products in the organized sector food and grocery inventory varies from 3 to 5 percent. Typically, imported food items that can be found in retail stores in cities include – Ø chocolates & confectionary items Ø biscuits & cookies Ø chocolate syrups Ø cake mixes Ø ketchup & sauces Ø specialty cheese Ø canned fruits/vegetables Ø fruit juices Ø soups & seasonings Ø breakfast cereals Ø dry fruits Ø fresh fruits like apples, pears, grapes, etc.
Typically, most imported consumer food products, including U.S. products, are transshipped through regional trading hubs such as Dubai and Singapore, due to their liberal trade policies, efficient handling and ability of the traders to meet Indian importers requirements. Major importers are located in Mumbai, Delhi, Chennai, and Kolkatta. A large share (30-35 percent) of imported food enters India through illegal channels (smuggling and leakages from duty-free outlets and ships at dock, etc.). Legitimate importers, who pay high import duties, face stiff competition from this illegal ‘gray market.’ However, increasing trade liberalization, including declining tariffs and adoption of value added taxation (VAT) system is likely to discourage smuggling over time.
GAIN Report - IN6111 Page 7 of 17
UNCLASSIFIED USDA Foreign Agricultural Service
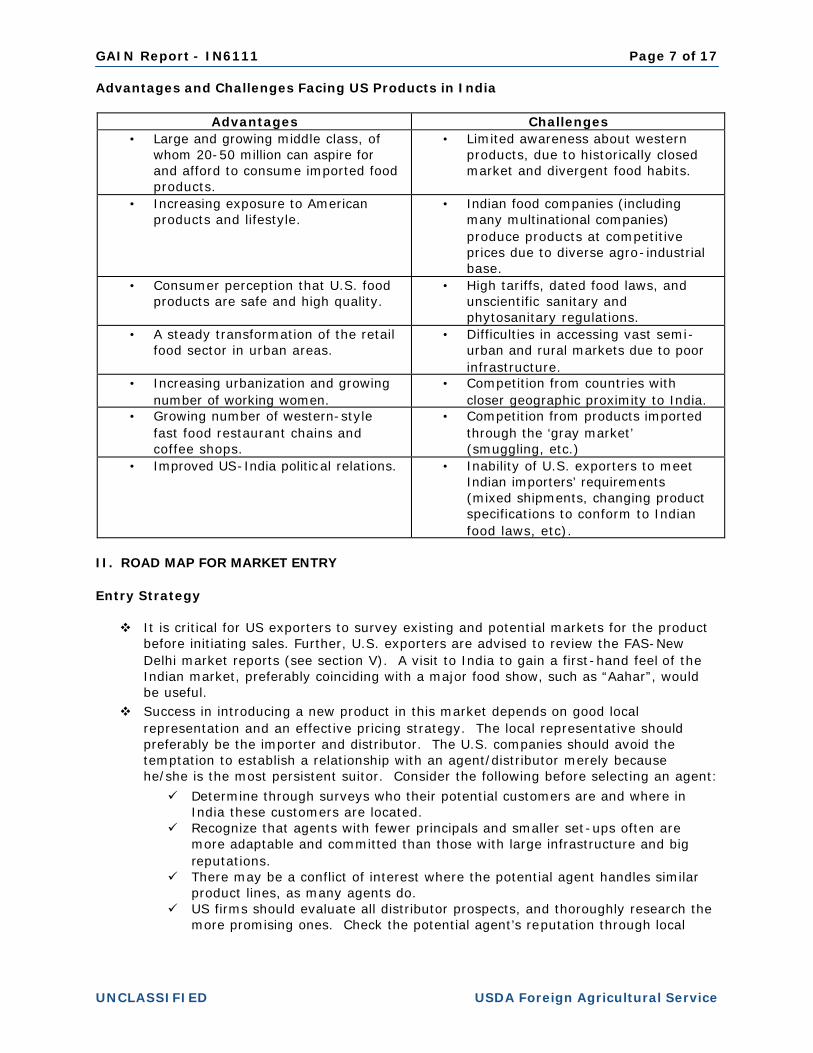
Advantages and Challenges Facing US Products in India
Advantages Challenges • Large and growing middle class, of
whom 20-50 million can aspire for and afford to consume imported food products.
• Limited awareness about western products, due to historically closed market and divergent food habits.
• Increasing exposure to American products and lifestyle.
• Indian food companies (including many multinational companies) produce products at competitive prices due to diverse agro-industrial base.
• Consumer perception that U.S. food products are safe and high quality.
• High tariffs, dated food laws, and unscientific sanitary and phytosanitary regulations.
• A steady transformation of the retail food sector in urban areas.
• Difficulties in accessing vast semi-urban and rural markets due to poor infrastructure.
• Increasing urbanization and growing number of working women.
• Competition from countries with closer geographic proximity to India.
• Growing number of western-style fast food restaurant chains and coffee shops.
• Competition from products imported through the ‘gray market’ (smuggling, etc.)
• Improved US-India political relations. • Inability of U.S. exporters to meet Indian importers’ requirements (mixed shipments, changing product specifications to conform to Indian food laws, etc).
II. ROAD MAP FOR MARKET ENTRY Entry Strategy v It is critical for US exporters to survey existing and potential markets for the product
before initiating sales. Further, U.S. exporters are advised to review the FAS-New Delhi market reports (see section V). A visit to India to gain a first-hand feel of the Indian market, preferably coinciding with a major food show, such as “Aahar”, would be useful.
v Success in introducing a new product in this market depends on good local representation and an effective pricing strategy. The local representative should preferably be the importer and distributor. The U.S. companies should avoid the temptation to establish a relationship with an agent/distributor merely because he/she is the most persistent suitor. Consider the following before selecting an agent:
ü Determine through surveys who their potential customers are and where in India these customers are located.
ü Recognize that agents with fewer principals and smaller set-ups often are more adaptable and committed than those with large infrastructure and big reputations.
ü There may be a conflict of interest where the potential agent handles similar product lines, as many agents do.
ü US firms should evaluate all distributor prospects, and thoroughly research the more promising ones. Check the potential agent’s reputation through local
GAIN Report - IN6111 Page 8 of 17
UNCLASSIFIED USDA Foreign Agricultural Service
industry/trade associations, potential clients, bankers, and other foreign companies.
v Due to the vast regional diversity in India, it is common to appoint more than one representative covering specified regional markets. FAS-New Delhi maintains listings of potential importers, and assists exporters in meeting members of the Indian trade.
v Most Indian importers prefer to: ü Purchase mixed containers of smaller quantities of individual products.
ü Seek exclusive agreements from exporters. ü Use services of freight consolidators to handle their orders from various
exporters.
v The key to success is to focus on ‘reasonable’ entry pricing for their products, which is specifically targeted at the desired consumer base.
v Potential exporters should be familiar with India’s varied food laws. Some products/ingredients, which are approved in the U.S. or in other countries, need not necessarily be approved in India.
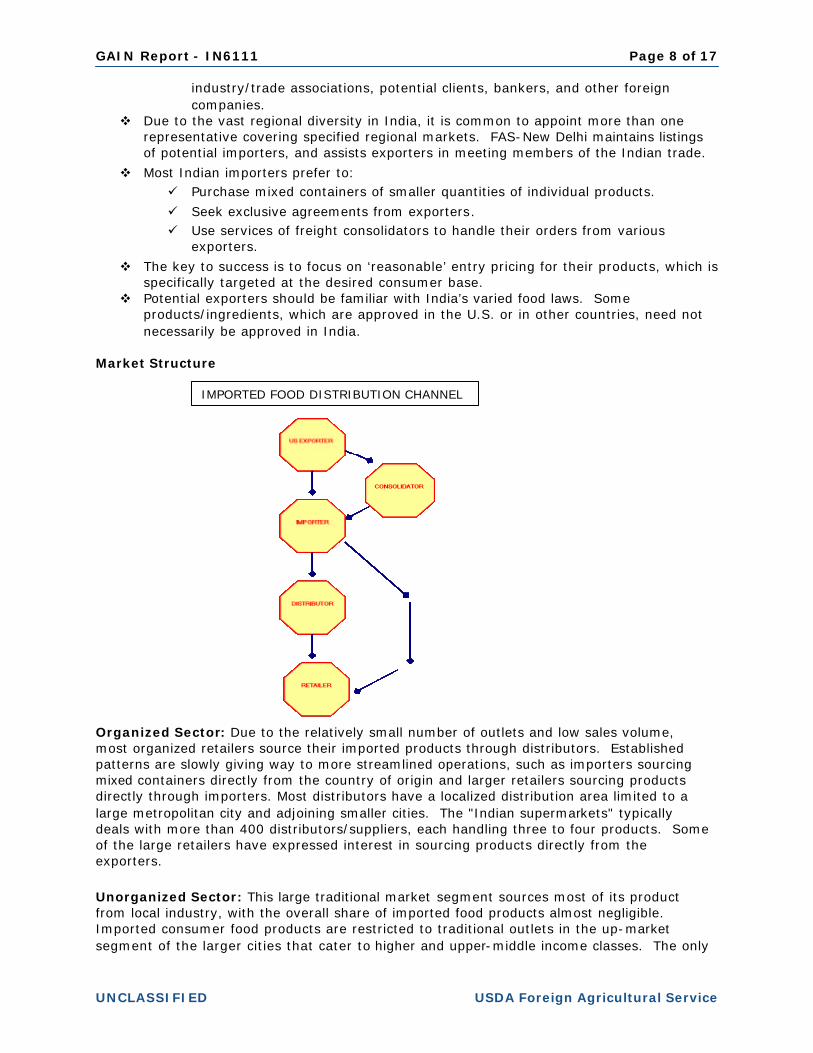
Market Structure
Organized Sector: Due to the relatively small number of outlets and low sales volume, most organized retailers source their imported products through distributors. Established patterns are slowly giving way to more streamlined operations, such as importers sourcing mixed containers directly from the country of origin and larger retailers sourcing products directly through importers. Most distributors have a localized distribution area limited to a large metropolitan city and adjoining smaller cities. The "Indian supermarkets" typically deals with more than 400 distributors/suppliers, each handling three to four products. Some of the large retailers have expressed interest in sourcing products directly from the exporters.
Unorganized Sector: This large traditional market segment sources most of its product from local industry, with the overall share of imported food products almost negligible. Imported consumer food products are restricted to traditional outlets in the up-market segment of the larger cities that cater to higher and upper-middle income classes. The only
IMPORTED FOOD DISTRIBUTION CHANNEL
GAIN Report - IN6111 Page 9 of 17
UNCLASSIFIED USDA Foreign Agricultural Service
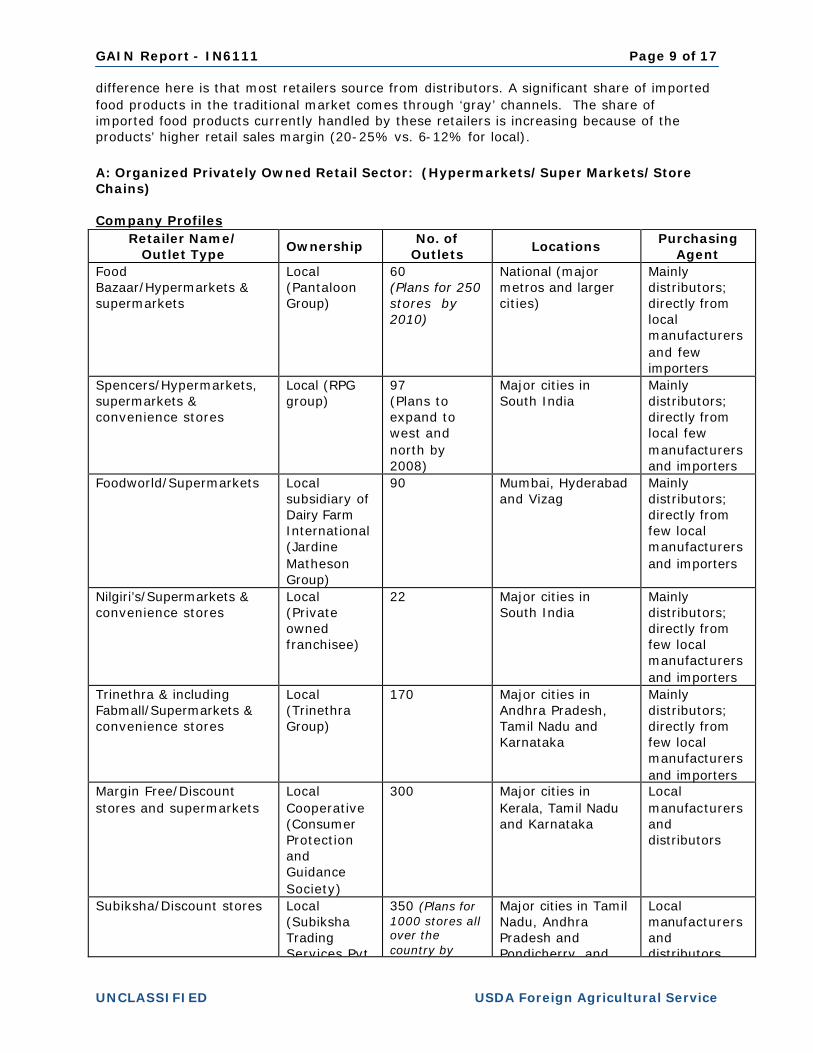
difference here is that most retailers source from distributors. A significant share of imported food products in the traditional market comes through ‘gray’ channels. The share of imported food products currently handled by these retailers is increasing because of the products’ higher retail sales margin (20-25% vs. 6-12% for local). A: Organized Privately Owned Retail Sector: (Hypermarkets/Super Markets/Store Chains) Company Profiles
Retailer Name/ Outlet Type
Ownership No. of
Outlets Locations
Purchasing Agent
Food Bazaar/Hypermarkets & supermarkets
Local (Pantaloon Group)
60 (Plans for 250 stores by 2010)
National (major metros and larger cities)
Mainly distributors; directly from local manufacturers and few importers
Spencers/Hypermarkets, supermarkets & convenience stores
Local (RPG group)
97 (Plans to expand to west and north by 2008)
Major cities in South India
Mainly distributors; directly from local few manufacturers and importers
Foodworld/Supermarkets Local subsidiary of Dairy Farm International (Jardine Matheson Group)
90
Mumbai, Hyderabad and Vizag
Mainly distributors; directly from few local manufacturers and importers
Nilgiri’s/Supermarkets & convenience stores
Local (Private owned franchisee)
22 Major cities in South India
Mainly distributors; directly from few local manufacturers and importers
Trinethra & including Fabmall/Supermarkets & convenience stores
Local (Trinethra Group)
170
Major cities in Andhra Pradesh, Tamil Nadu and Karnataka
Mainly distributors; directly from few local manufacturers and importers
Margin Free/Discount stores and supermarkets
Local Cooperative (Consumer Protection and Guidance Society)
300 Major cities in Kerala, Tamil Nadu and Karnataka
Local manufacturers and distributors
Subiksha/Discount stores Local (Subiksha Trading Services Pvt.
350 (Plans for 1000 stores all over the country by
Major cities in Tamil Nadu, Andhra Pradesh and Pondicherry, and
Local manufacturers and distributors
GAIN Report - IN6111 Page 10 of 17
UNCLASSIFIED USDA Foreign Agricultural Service
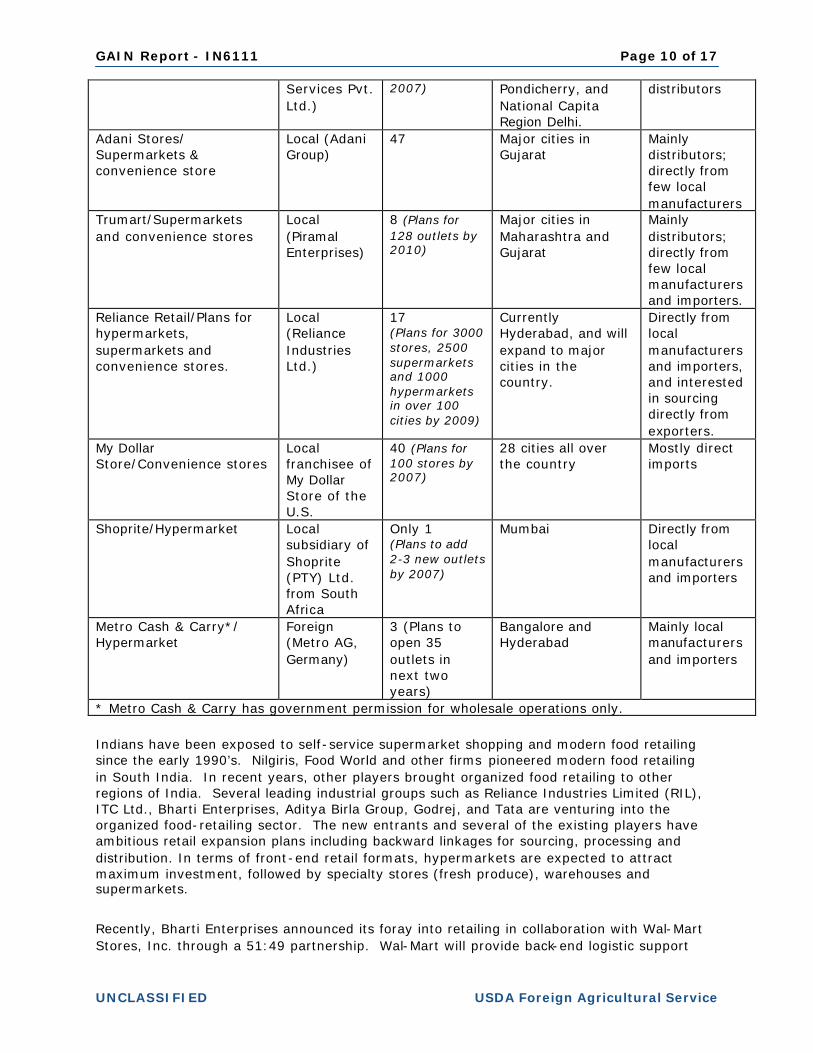
Services Pvt. Ltd.)
2007) Pondicherry, and National Capita Region Delhi.
distributors
Adani Stores/ Supermarkets & convenience store
Local (Adani Group)
47 Major cities in Gujarat
Mainly distributors; directly from few local manufacturers
Trumart/Supermarkets and convenience stores
Local (Piramal Enterprises)
8 (Plans for 128 outlets by 2010)
Major cities in Maharashtra and Gujarat
Mainly distributors; directly from few local manufacturers and importers.
Reliance Retail/Plans for hypermarkets, supermarkets and convenience stores.
Local (Reliance Industries Ltd.)
17 (Plans for 3000 stores, 2500 supermarkets and 1000 hypermarkets in over 100 cities by 2009)
Currently Hyderabad, and will expand to major cities in the country.
Directly from local manufacturers and importers, and interested in sourcing directly from exporters.
My Dollar Store/Convenience stores
Local franchisee of My Dollar Store of the U.S.
40 (Plans for 100 stores by 2007)
28 cities all over the country
Mostly direct imports
Shoprite/Hypermarket Local subsidiary of Shoprite (PTY) Ltd. from South Africa
Only 1 (Plans to add 2-3 new outlets by 2007)
Mumbai Directly from local manufacturers and importers
Metro Cash & Carry*/ Hypermarket
Foreign (Metro AG, Germany)
3 (Plans to open 35 outlets in next two years)
Bangalore and Hyderabad
Mainly local manufacturers and importers
* Metro Cash & Carry has government permission for wholesale operations only.
Indians have been exposed to self-service supermarket shopping and modern food retailing since the early 1990’s. Nilgiris, Food World and other firms pioneered modern food retailing in South India. In recent years, other players brought organized food retailing to other regions of India. Several leading industrial groups such as Reliance Industries Limited (RIL), ITC Ltd., Bharti Enterprises, Aditya Birla Group, Godrej, and Tata are venturing into the organized food-retailing sector. The new entrants and several of the existing players have ambitious retail expansion plans including backward linkages for sourcing, processing and distribution. In terms of front-end retail formats, hypermarkets are expected to attract maximum investment, followed by specialty stores (fresh produce), warehouses and supermarkets.
Recently, Bharti Enterprises announced its foray into retailing in collaboration with Wal-Mart Stores, Inc. through a 51:49 partnership. Wal-Mart will provide back-end logistic support
GAIN Report - IN6111 Page 11 of 17
UNCLASSIFIED USDA Foreign Agricultural Service
including sourcing, supply chain, technology support, as well as wholesale cash-and-carry format. Bharti will be Wal-Mart’s franchisee and wholly own and manage the front end retailing by setting up 'several hundred' stores across India. Bharti plans to roll out the stores by August next year in several formats including hypermarkets and supermarkets. Several foreign retailers (Metro, Shoprite, My Dollar Store) are already operating through ‘cash and carry’ or ‘franchisee’ models.
Emergence of privately owned organized retail formats has predominantly been an urban phenomenon so far with about 12-15 cities being targeted by most retailers. However, there are about 35 cities that have a high concentration (30 percent) of high and upper middle class consumers. In the next decade, organized retail will percolate to these cities and further to smaller, second-tier cities and towns throughout India. The concept of shopping malls is beginning to take shape in India’s major cities. During the last two years, retailers have set up larger discount outlets with floor areas of 25,000-50,000 square feet, which are being touted as ‘Indian Hyper Markets.’ The retail sales turnover of the current players is relatively low compared to global retail standards. Sales turnover for Indian fiscal year 2005/06 (April/March) of groups like Food World is estimated at $78.7 million, Food Bazaar at $76.2 million, Subiksha at $74.1 million, Spencers at $ 70.8 million, Trinethra at $67.4 million, and Adani Stores at $24.7 million4. Most customers coming to these outlets are from upper and middle-income households.
Most of these ‘Indian Supermarkets’ have a floor area ranging from 3,000 to 6,000 square feet, and convenience stores have a floor area of 1000-1,500 square feet. They stock most national brands, regional and specialty brands, their own brand of packaged dry products, and some international brands. Many have a small bakery/confectionary section, and some have fresh produce and dairy products. Only a few sell small quantities of frozen foods, as cold storage availability is limited and electric power supply is erratic. A typical supermarket carries about 6,000 stock-keeping units, but most have no item-based inventory control. Their margins typically range from 14 to 16 percent. These relatively high margins are due largely to the ability to get somewhat better prices from suppliers on bulk purchases.
Gas-station convenience stores are relatively new to India, as petroleum companies like Hindustan Petroleum Corporation Limited, Indian Oil, and Bharat Petroleum have introduced branded outlets like ‘Speedmart’ (around 100 in number), ‘ConveniO’s’ (around 70), and ‘In & Out’ stores (around 310). Most of the oil companies lease out these outlets to private individuals or companies who run them independently. These outlets sell impulse items like chocolates, confectionary, soft drinks, juices, cakes, cookies, potato chips and other snack food and local savories. However, they have made limited inroads in the retail market, as their prices are relatively high vis-à-vis traditional retailers.
B: Traditional/Unorganized Market: Provisions Shops/Grocery Shops/Wet Markets The traditional ‘Pop & Son’ and ‘wet market’ stores in India are similar to those in other developing and less-developed countries. Of the roughly 6.5 million outlets, grocery stores account for 32 percent, general stores 14 percent, and kiosks and wet markets the remaining share of the total. Most of these outlets offer only the basics: limited selection, lack of refrigeration, fixed prices, no technology, and little or no ambience. Floor/display space normally ranges from 100 to 300 square feet. However, with the introduction of the ‘Indian
4 Source – Technopak Ltd.
GAIN Report - IN6111 Page 12 of 17
UNCLASSIFIED USDA Foreign Agricultural Service
supermarkets,’ some of the stores have modernized by expanding floor size and adding ambience, such as more display space, walking aisles, refrigeration, etc. Most consumers prefer the traditional market to larger supermarkets because of proximity, personal attention, credit service, home delivery, and lower prices. Domestic servants who do most of the grocery shopping for upper and middle income households also prefer the traditional markets.
III: COMPETITION The biggest competitor for foreign foods in the Indian retail food market is the local food industry. Potential U.S. exporters should understand that India’s diverse agro-industrial base already offers many products at competitive prices. The leading multinationals from the U.S. and Europe have established food processing operations in India, and offer a range of western-style products at reasonable prices, though the quality may be inferior to imported products due to poor quality of the raw material supplies. Most local products are priced lower than imported products due to high import duties. While some consumers are aware of quality differences and insist on world standards or global brands, most must sacrifice quality for affordable prices. The presence of imported food products even in a typical western-style supermarket is just 3 to 5 percent of the total product offering.
There are no reliable data on imports of consumer food products for retail sale in India5. See Appendix 2 and 3 for trends in India’s imports of consumer ready food products and U.S. market share based on official Indian statistics.
Based on a qualitative assessment of the market and information from market sources, products from Australia, New Zealand, the European Union (EU), South Africa, the Middle East, and other South Asian countries directly compete with like items from the United States. In addition to the freight advantages, market sources report that suppliers from these countries are more responsive to importers’ demands for smaller shipment sizes, and are more willing to modify product specifications to meet Indian food laws, in contrast to some U.S. suppliers.
Australia and New Zealand aggressively promote their products in the Indian market. Countries like Thailand, South Africa, Chile, Brazil, and few EU countries also increasingly organize trade promotions in India. Market promotions by these countries are mainly through trade missions, trade servicing, and participation in food shows.
5 Most consumer food products are imported as mixed consignment from transshipments points like Dubai/Singapore and are not necessarily identified by their country of origin. Some transshipped, mixed consignments are under-invoiced or falsely declared. Over 30-40% of imported products are unaccounted as they come through illegal channels. Consequently, official import statistics do not reflect the market accurately. Official Indian statistics are not sufficiently detailed to provide a break-up of consumer food items by product category for retail sales. Thereby, processed food items under chapters 20-22 include consumer food items imported for retail sales, HRI, and for further processing.
GAIN Report - IN6111 Page 13 of 17
UNCLASSIFIED USDA Foreign Agricultural Service
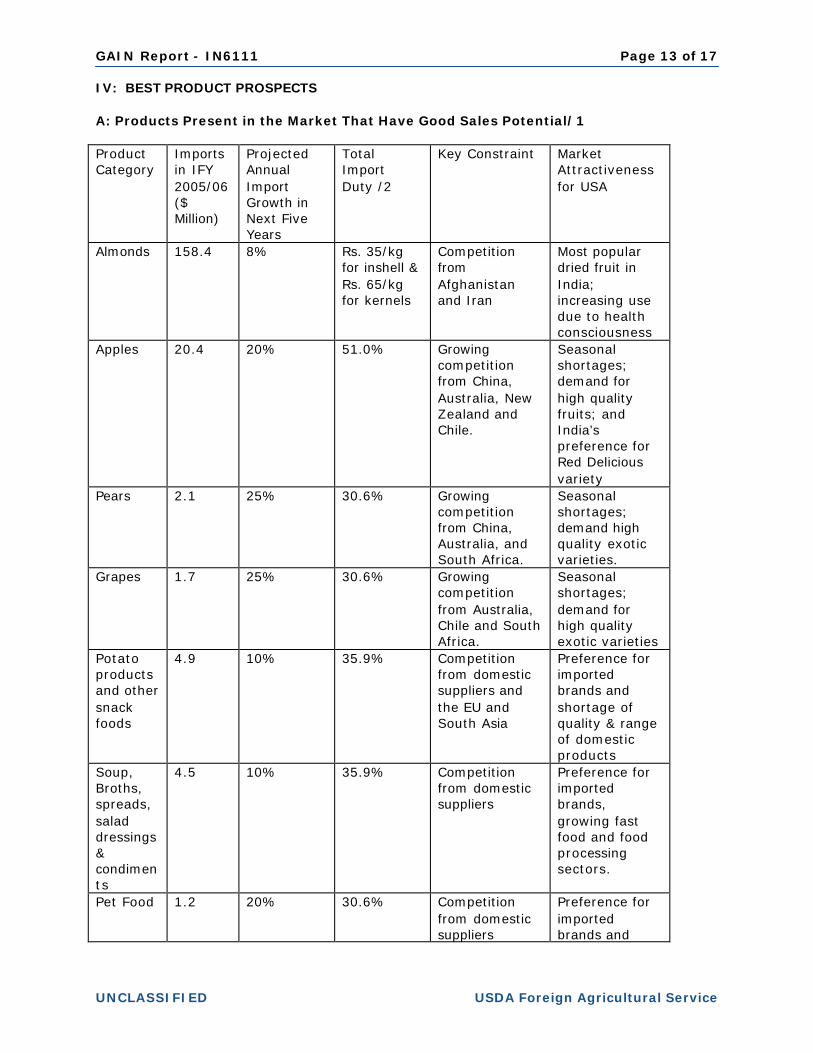
IV: BEST PRODUCT PROSPECTS A: Products Present in the Market That Have Good Sales Potential/1 Product Category
Imports in IFY 2005/06 ($ Million)
Projected Annual Import Growth in Next Five Years
Total Import Duty /2
Key Constraint Market Attractiveness for USA
Almonds 158.4 8% Rs. 35/kg for inshell & Rs. 65/kg for kernels
Competition from Afghanistan and Iran
Most popular dried fruit in India; increasing use due to health consciousness
Apples 20.4 20% 51.0% Growing competition from China, Australia, New Zealand and Chile.
Seasonal shortages; demand for high quality fruits; and India’s preference for Red Delicious variety
Pears 2.1 25% 30.6% Growing competition from China, Australia, and South Africa.
Seasonal shortages; demand high quality exotic varieties.
Grapes 1.7 25% 30.6% Growing competition from Australia, Chile and South Africa.
Seasonal shortages; demand for high quality exotic varieties
Potato products and other snack foods
4.9 10% 35.9% Competition from domestic suppliers and the EU and South Asia
Preference for imported brands and shortage of quality & range of domestic products
Soup, Broths, spreads, salad dressings & condiments
4.5
10% 35.9% Competition from domestic suppliers
Preference for imported brands, growing fast food and food processing sectors.
Pet Food 1.2 20% 30.6% Competition from domestic suppliers
Preference for imported brands and
GAIN Report - IN6111 Page 14 of 17
UNCLASSIFIED USDA Foreign Agricultural Service
shortage of quality & range of domestic products
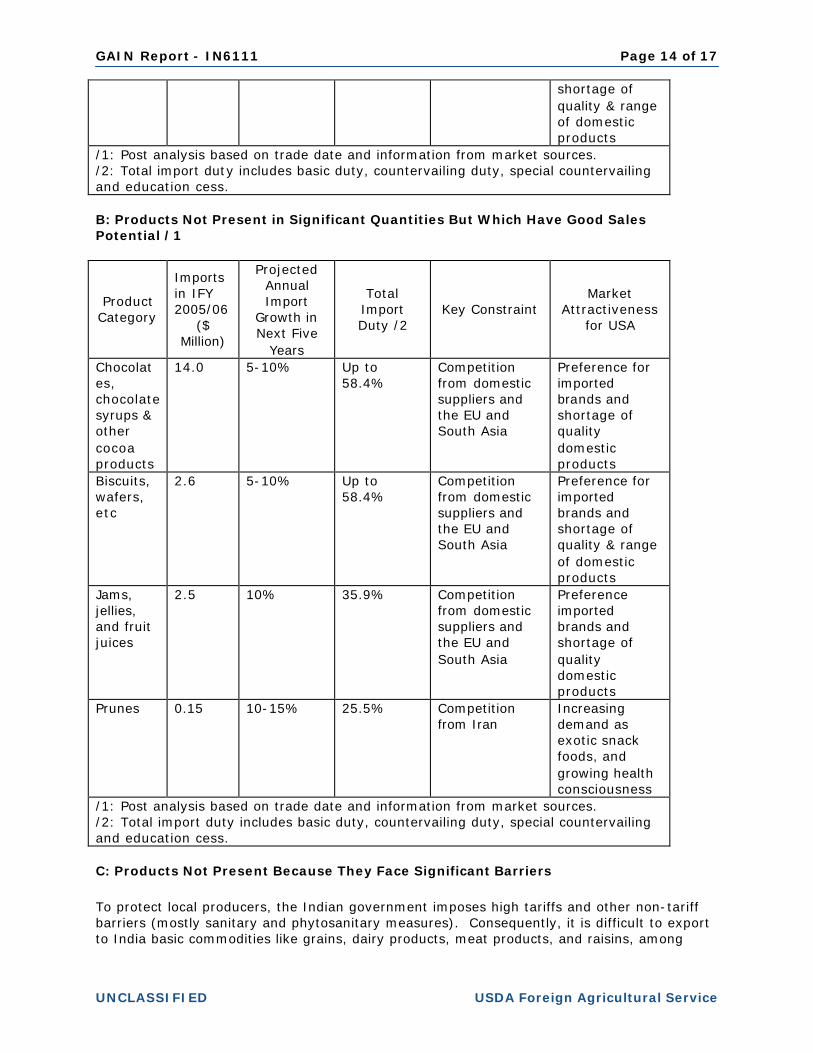
/1: Post analysis based on trade date and information from market sources. /2: Total import duty includes basic duty, countervailing duty, special countervailing and education cess. B: Products Not Present in Significant Quantities But Which Have Good Sales Potential /1
Product Category
Imports in IFY 2005/06
($ Million)
Projected Annual Import
Growth in Next Five
Years
Total Import Duty /2
Key Constraint Market
Attractiveness for USA
Chocolates, chocolate syrups & other cocoa products
14.0 5-10% Up to 58.4%
Competition from domestic suppliers and the EU and South Asia
Preference for imported brands and shortage of quality domestic products
Biscuits, wafers, etc
2.6 5-10% Up to 58.4%
Competition from domestic suppliers and the EU and South Asia
Preference for imported brands and shortage of quality & range of domestic products
Jams, jellies, and fruit juices
2.5 10% 35.9% Competition from domestic suppliers and the EU and South Asia
Preference imported brands and shortage of quality domestic products
Prunes 0.15 10-15% 25.5% Competition from Iran
Increasing demand as exotic snack foods, and growing health consciousness
/1: Post analysis based on trade date and information from market sources. /2: Total import duty includes basic duty, countervailing duty, special countervailing and education cess. C: Products Not Present Because They Face Significant Barriers
To protect local producers, the Indian government imposes high tariffs and other non-tariff barriers (mostly sanitary and phytosanitary measures). Consequently, it is difficult to export to India basic commodities like grains, dairy products, meat products, and raisins, among
GAIN Report - IN6111 Page 15 of 17
UNCLASSIFIED USDA Foreign Agricultural Service
others. Import of beef is banned due to religious reasons. Imports of alcoholic beverages are severely constrained by high import tariffs, local taxes, and by a complex licensing system for distribution and sales in the local markets. V. POST CONTACTS AND FURTHER INFORMATION If you have any additional queries regarding this report or need assistance exporting to India, please contact the Office of Agricultural Affairs, New Delhi, at following address:
Agricultural Counselor Foreign Agricultural Service
Embassy of the United States of America Chanakyapuri, New Delhi - 110 021
Ph: (91-11) 24198000, Fax: (91-11) 2419-8530 E-Mail: [email protected]
q The following reports may be of interest to U.S. exporters. These, and related reports
prepared by this office, can be accessed via the FAS Home Page, (http://www.fas.usda.gov) by clicking on "Attaché Reports," and typing the report number.
Report Number Report Title IN6089 Exporter Guide Report
IN6066 FAIRS Annual Report
IN6021 Trade Policy Monitoring Report
IN6087 FAIRS Export Certificate Report
IN5066 Hotel Restaurant & Institutional Service Report
IN5031 Food Processing Sector Report
q The Country Commercial Guide prepared by the Commercial Section of the US Embassy will also be of interest to exporters. This can be accessed through www.stat-usa.gov.
q To get information on India’s imports of select food and agricultural products for a
particular Indian fiscal year (April/March) by countries, please follow the following procedure- Ø Go to the website of Directorate General of Foreign Trade, Ministry of Commerce
and Industries, Government of India http://dgftcom.nic.in/. Ø In the ‘Trade Related Links’ section, select icon ‘Export Import Databank’. Ø In the ‘Imports’ section, select icon ‘Commodity wise all countries’. Ø In the pop-up menu, fill in the year and ITC/HS Code of the commodity.
GAIN Report - IN6111 Page 16 of 17
UNCLASSIFIED USDA Foreign Agricultural Service
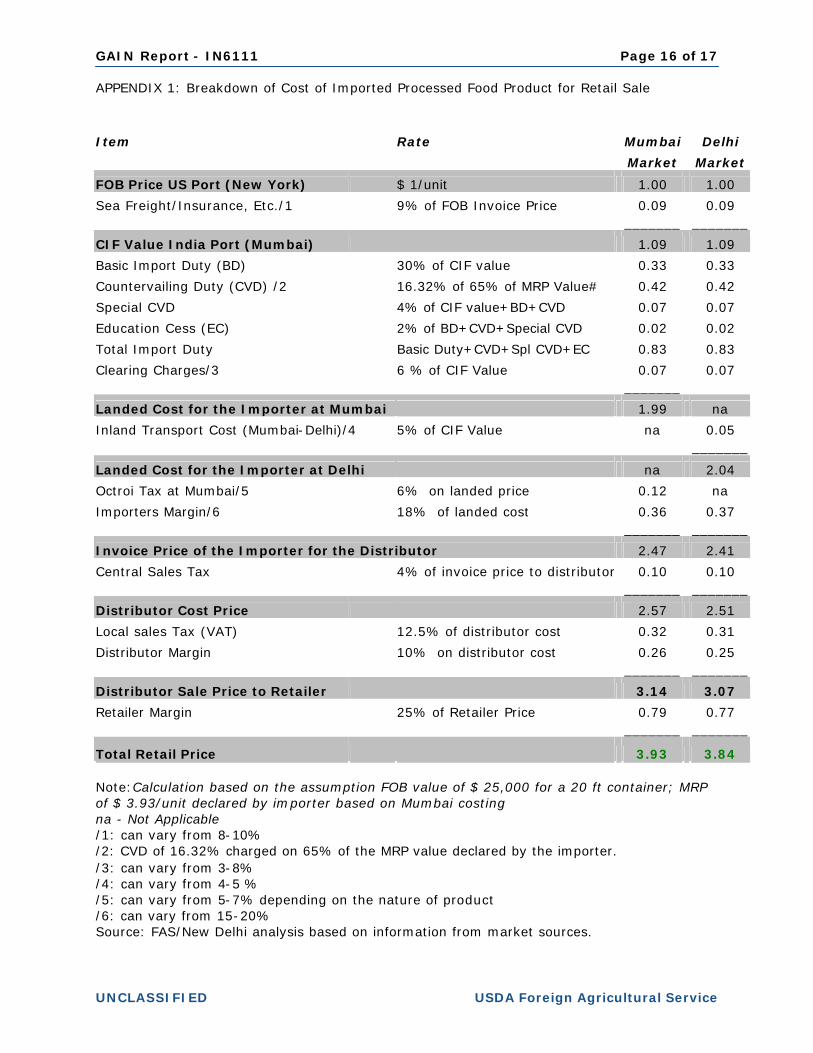
APPENDIX 1: Breakdown of Cost of Imported Processed Food Product for Retail Sale
Item Rate Mumbai Delhi
Market Market
FOB Price US Port (New York) $ 1/unit 1.00 1.00
Sea Freight/Insurance, Etc./1 9% of FOB Invoice Price 0.09 0.09 _______ _______
CIF Value India Port (Mumbai) 1.09 1.09
Basic Import Duty (BD) 30% of CIF value 0.33 0.33
Countervailing Duty (CVD) /2 16.32% of 65% of MRP Value# 0.42 0.42
Special CVD 4% of CIF value+BD+CVD 0.07 0.07
Education Cess (EC) 2% of BD+CVD+Special CVD 0.02 0.02
Total Import Duty Basic Duty+CVD+Spl CVD+EC 0.83 0.83
Clearing Charges/3 6 % of CIF Value 0.07 0.07 _______
Landed Cost for the Importer at Mumbai 1.99 na
Inland Transport Cost (Mumbai-Delhi)/4 5% of CIF Value na 0.05 _______
Landed Cost for the Importer at Delhi na 2.04
Octroi Tax at Mumbai/5 6% on landed price 0.12 na
Importers Margin/6 18% of landed cost 0.36 0.37 _______ _______
Invoice Price of the Importer for the Distributor 2.47 2.41
Central Sales Tax 4% of invoice price to distributor 0.10 0.10 _______ _______
Distributor Cost Price 2.57 2.51
Local sales Tax (VAT) 12.5% of distributor cost 0.32 0.31
Distributor Margin 10% on distributor cost 0.26 0.25 _______ _______
Distributor Sale Price to Retailer 3.14 3.07
Retailer Margin 25% of Retailer Price 0.79 0.77 _______ _______
Total Retail Price 3.93 3.84
Note:Calculation based on the assumption FOB value of $ 25,000 for a 20 ft container; MRP of $ 3.93/unit declared by importer based on Mumbai costing na - Not Applicable /1: can vary from 8-10% /2: CVD of 16.32% charged on 65% of the MRP value declared by the importer. /3: can vary from 3-8% /4: can vary from 4-5 % /5: can vary from 5-7% depending on the nature of product /6: can vary from 15-20% Source: FAS/New Delhi analysis based on information from market sources.
GAIN Report - IN6111 Page 17 of 17
UNCLASSIFIED USDA Foreign Agricultural Service
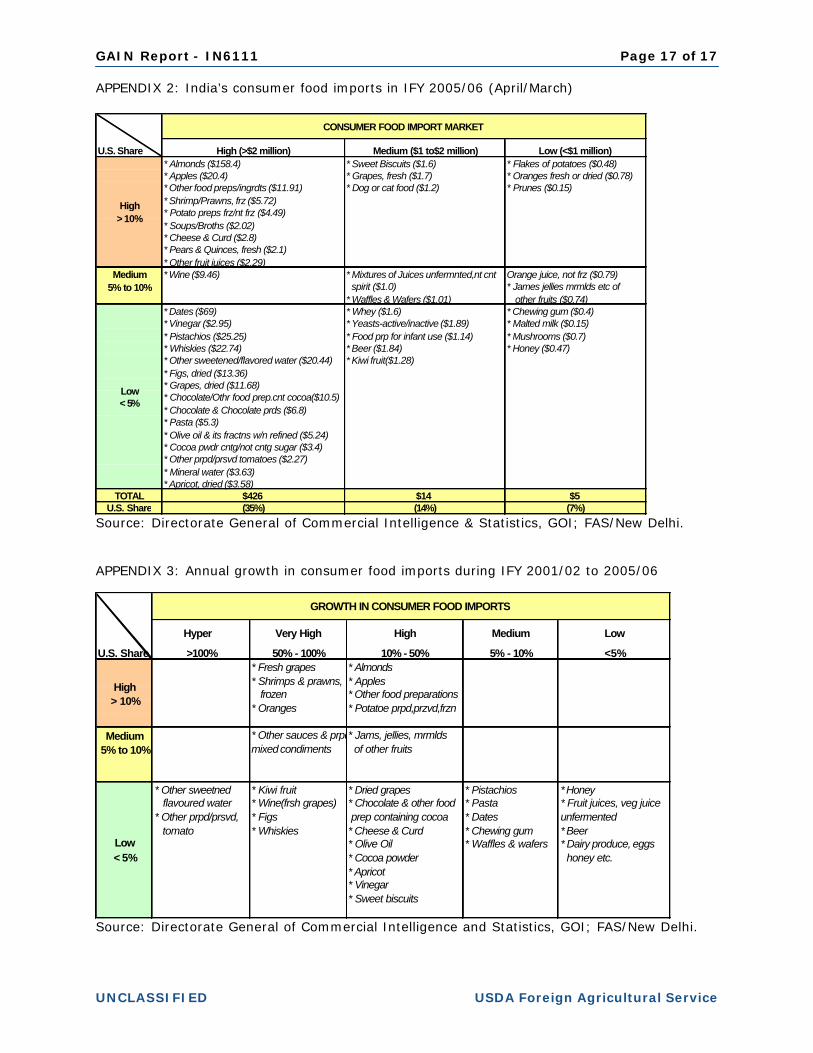
APPENDIX 2: India’s consumer food imports in IFY 2005/06 (April/March)
Source: Directorate General of Commercial Intelligence & Statistics, GOI; FAS/New Delhi.
APPENDIX 3: Annual growth in consumer food imports during IFY 2001/02 to 2005/06
Source: Directorate General of Commercial Intelligence and Statistics, GOI; FAS/New Delhi.
High (>$2 million) Medium ($1 to$2 million) Low (<$1 million)* Almonds ($158.4) * Sweet Biscuits ($1.6) * Flakes of potatoes ($0.48)* Apples ($20.4) * Grapes, fresh ($1.7) * Oranges fresh or dried ($0.78)* Other food preps/ingrdts ($11.91) * Dog or cat food ($1.2) * Prunes ($0.15)* Shrimp/Prawns, frz ($5.72) * Potato preps frz/nt frz ($4.49) * Soups/Broths ($2.02) * Cheese & Curd ($2.8) * Pears & Quinces, fresh ($2.1)* Other fruit juices ($2.29)* Wine ($9.46) * Mixtures of Juices unfermnted,nt cnt Orange juice, not frz ($0.79) spirit ($1.0) * James jellies mrmlds etc of
* Waffles & Wafers ($1.01) other fruits ($0.74)* Dates ($69) * Whey ($1.6) * Chewing gum ($0.4)* Vinegar ($2.95) * Yeasts-active/inactive ($1.89) * Malted milk ($0.15)* Pistachios ($25.25) * Food prp for infant use ($1.14) * Mushrooms ($0.7)* Whiskies ($22.74) * Beer ($1.84) * Honey ($0.47)* Other sweetened/flavored water ($20.44) * Kiwi fruit($1.28) * Figs, dried ($13.36) * Grapes, dried ($11.68) * Chocolate/Othr food prep.cnt cocoa($10.5) * Chocolate & Chocolate prds ($6.8) * Pasta ($5.3)* Olive oil & its fractns w/n refined ($5.24)* Cocoa pwdr cntg/not cntg sugar ($3.4) * Other prpd/prsvd tomatoes ($2.27) * Mineral water ($3.63)* Apricot, dried ($3.58)
TOTAL $426 $14 $5U.S. Share (35%) (14%) (7%)
High > 10%
Medium 5% to 10%
Low < 5%
CONSUMER FOOD IMPORT MARKET
U.S. Share
Hyper Very High High Medium Low
>100% 50% - 100% 10% - 50% 5% - 10% <5%* Fresh grapes * Almonds* Shrimps & prawns, * Apples frozen * Other food preparations* Oranges * Potatoe prpd,przvd,frzn
* Other sauces & prpd* Jams, jellies, mrmldsmixed condiments of other fruits
* Other sweetned * Kiwi fruit * Dried grapes * Pistachios * Honey flavoured water * Wine(frsh grapes) * Chocolate & other food * Pasta * Fruit juices, veg juice* Other prpd/prsvd, * Figs prep containing cocoa * Dates unfermented tomato * Whiskies * Cheese & Curd * Chewing gum * Beer
* Olive Oil * Waffles & wafers * Dairy produce, eggs* Cocoa powder honey etc.* Apricot * Vinegar* Sweet biscuits
High > 10%
Medium 5% to 10%
Low < 5%
GROWTH IN CONSUMER FOOD IMPORTS
U.S. Share