Embed Size (px)
Citation preview

USDA-ARS Highlights and Emerging Research on Agricultural Water Use
Irrigation Association Center Stage
5 November 2012, Orlando, Florida
Steve Evett, USDA-ARS

USDA, Agricultural Research Service
Charged with extending the nation's scientific knowledge and solving agricultural problems through its four national program areas:
• Nutrition, food safety and quality;
• Animal production and protection;
• Natural resources and sustainable agricultural systems; and
• Crop production and protection

Irrigation Water Management – NP211
• Managing and scheduling irrigation for efficient water use
• Innovative surface and subsurface irrigation tools and techniques
• Improved irrigation and cropping for reuse of degraded water
• Sensor technologies for site-specific irrigation water management
• Cropping and management strategies under limited water supplies

American Agriculture’s Accomplishments
• 16% of the $9 trillion gross domestic product
• 8% of U.S. exports
• 17% of employment
• <2% U.S. workforce on farms
• 100% of citizens are users
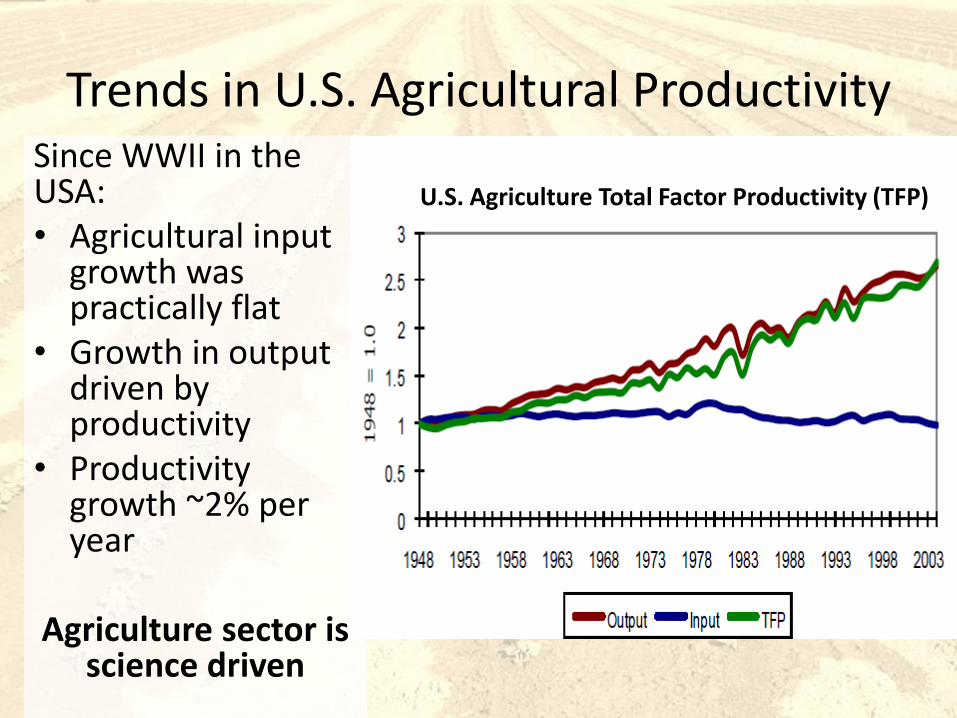
Since WWII in the USA: • Agricultural input
growth was practically flat
• Growth in output driven by productivity
• Productivity growth ~2% per year
Agriculture sector is science driven
Trends in U.S. Agricultural Productivity
U.S. Agriculture Total Factor Productivity (TFP)

U.S. Water Use by Sectors

74% increase in Energy Expense since 2003 – only 12% increase in pumps
Producers spent $2.1 billion on expenses related to irrigation equipment, facilities, land improvements and computer technology in 2008. Of those expenses, 50 percent was for replacement of existing equipment, 35 percent for new expansion and 15 percent for water conservation.
75,000 farms changed irrigation management or equipment to save energy/water

Trends – People, Resources & Challenges to Sustainability
• Greater limitations on water availability & quality
• Increasing demand by cities & industries
Freshwater consumption as a percentage of local average annual precipitation
NRCS & ERS

Change in irrigated acres – 2002 to 2007

Acres Irrigated – 2007

Economic Importance of Western Irrigated Agriculture - FFA
• 2010 total production (farm gate) value for the 17 Western U.S. states was about $162 billion; about $103 billion tied to irrigated agriculture on 42 million acres.
• In the Western U.S., the annual direct household income derived from the Irrigated Agriculture Industry (production, services and food processing) is about $52 billion/year; about $128 billion accounting for total direct, indirect, and induced impacts.
• Direct net benefits from irrigated agriculture represent the opportunity costs of economic tradeoffs made in water resources allocation decisions. Opportunity costs are what is given up to pursue some other alternative.
• There are also "silent opportunity costs" inherent to changes to irrigated agriculture that are reflected as changes to the consumer spending economy. – Direct and indirect linkages to the economy derived from a low-cost food supply, making
available large blocks of disposal income to the consumer spending economy.

ARS Irrigation Research
• 201 Related Projects
• 117 Include irrigation in objectives
• 53 Include Irrigation in title

Spotlight on Emerging Science
LOCATION CROP ET & WUE
Bushland, TX Alfalfa, Turfgrass, Cotton, Sorghum, Corn, Soybean, Sunflower, Winter wheat
Ft. Collins, CO Wheat, Sunflower, Corn, Dry Beans, Alfalfa
Lubbock, TX Cotton, Peanut, Grain Sorghum
Maricopa, AZ Cotton, Wheat, Camelina, Lesquerella
Parlier, CA Broccoli, Garlic, Lettuce, Pepper, Onion, Fruit trees
Stoneville, MS Cotton, corn, soy
ET RESEARCH LOCATIONS
Reference ET Methods
Bushland, Lubbock, Parlier, Maricopa
Evaporation & Transpiration Partitioning
Bushland, Lubbock, Maricopa
Tillage Effects Bushland, Lubbock, Ft. Collins, Stoneville
Deficit Irrigation & Application Method Effects
Bushland, Lubbock, Ft. Collins, Parlier, Sidney, MT (NP 207)
Spatial ET Beltsville, Bushland, Lubbock, Maricopa, Stoneville
Water Tables & Salinity
Parlier, Riverside

WPF Trials
Neutron probe
Wheat
Varieties
Bowen
Ratio ET
55% Corn
Bowen
Ratio ET
100% Corn
Bowen Ratio ET
100% Pinto Bean
Weather Station

Scheduling Deficit Irrigation
Canopy
Temperature
Ground
Cover
Aerial or Satellite Remote Sensing
Near-surface Sensing


Irrigation and nutrient scheduling strategies increase
crop water-use and nitrogen-use efficiencies.
Optimum water use and nitrogen requirements for wheat and
biodiesel-camelina determined using gradient water
application and randomized plot nitrogen application under a
linear move sprinkler irrigation system in Maricopa, AZ.
Seasonal irrigation, mm
0 100 200 300 400 500 600 700
Gra
in Y
ield
(ra
w w
eig
ht)
, kg
/ha
0
2000
4000
6000
8000
10000
12000
Wheat yield versus seasonal irrigation Linear Move Field Study 2012
Arid Land Agricultural Research
Center Maricopa, Arizona

Remote sensing and crop simulation methods determine
spatially and temporally variable crop water use (ET) in arid
irrigated agriculture.
Coordinated ground –
based and airborne remote
sensing surveys verify
vegetation (NDVI) and
surface temperatures.
Day of year, 2005
0 20 40 60 80 100 120 140 160
Ba
sal
Cro
p C
oef
fici
ent,
Kcb
0.0
0.2
0.4
0.6
0.8
1.0
1.2
1.4
1.6
1.8Standard FAO-56 Kcb model for wheat
NDVI-adjusted Kcb for densely-planted wheat
Measured Kcb for densely-planted wheat
FAO behind measured 9-16 days
FAO ahead of measured 10-17 days
Temperature NDVI
Ground-based radiometry
Airborne remote sensing surveys
Meter-scale Temperature & NDVI in
field plots in AZ (above); and km-
scale temperatures using satellites
over New Mexico (below).
Field Experiments Spatial Analysis ET Estimation
NDVI-based Kcb are used to
correct standard table Kc
coefficients (above) & RS and
crop growth models are used to
extend ET estimates for the entire
growing season.
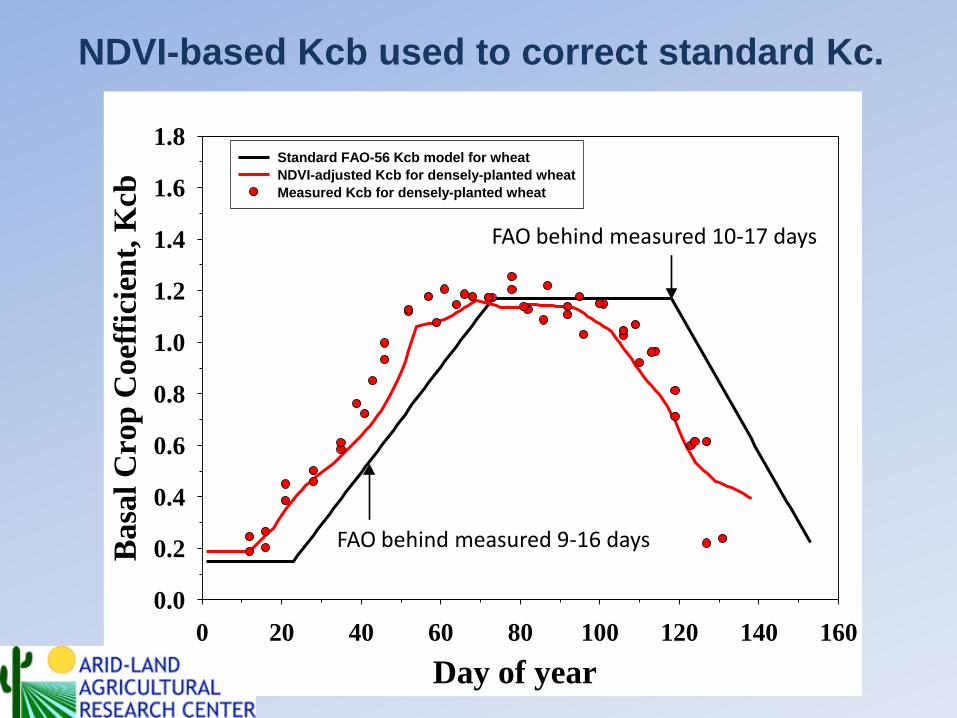
NDVI-based Kcb used to correct standard Kc.
Day of year, 2005
0 20 40 60 80 100 120 140 160
Basa
l C
rop
Co
effi
cien
t, K
cb
0.0
0.2
0.4
0.6
0.8
1.0
1.2
1.4
1.6
1.8Standard FAO-56 Kcb model for wheat
NDVI-adjusted Kcb for densely-planted wheat
Measured Kcb for densely-planted wheat
FAO behind measured 9-16 days
FAO ahead of measured 10-17 days
Day of year
FAO behind measured 10-17 days
FAO behind measured 9-16 days

• The Evaporative Stress Index (ESI) highlights areas with abnormally high or low ET. ET is estimated from remotely sensed land-surface temperature, providing proxy information on surface soil moisture and crop stress conditions.
• The ESI also demonstrates capability for capturing early signals of “flash drought”, brought on by extended periods of hot, dry and windy conditions leading to rapid soil moisture depletion.
http://hrsl.arsusda.gov/drought/

Mapping Evapotranspiration & Drought with Satellites
Surface temperature maps from thermal infrared satellite data contain help detect surface moisture and water use.
Soil surface and vegetation canopy temperatures rise as soil moisture is depleted
Thermal stress signals typically precede significant reduction in biomass.
Employed data from multiple satellites to map ET, soil moisture, and crop stress at field to continental scales.
A derived Evaporative Stress Index (ESI) represents drought impacts.
The use of remote sensing provides information at fine spatial scales, suitable for field‐scale management.
Related work at Bushland, TX; El Reno, OK; Fort Collins, CO, Parlier, CA, Maricopa, AZ
Multi‐scale ET maps using land‐surface
temperature from satellites.
A scalable water‐use information system

San Joaquin Valley Agricultural Sciences Center, Parlier, CA • Developing sustainable cropping systems to improve water
productivity and protect water and soil quality in irrigated agriculture (peppers, garlic, lettuce, broccoli, strawberry, grapes, pomegranate, biofuels feedstocks)
• Using Satellite Imagery with ET Weather Station Networks to Map Crop Water Use for Irrigation Scheduling: TOPS-SIMS.
Satellite Irrigation Management Support (SIMS) system uses NASA’s Terrestrial Observation and Prediction Systems (TOPS) to merge reflectance information from Landsat and MODIS satellite imagery with reference ET estimates from the California Irrigation Management Information System (CIMIS). Crop coefficients are estimated from the normalized difference vegetation index (NDVI) each 8 days. Maps crop fractional ground cover, basal crop coefficients, and basal ET of a non-stressed crop at 30-m resolution over 6 million ha (14.8 million acres).
http://ecocast.org/dgw/sims

San Joaquin Valley Agricultural Sciences Center, Parlier, CA • Developing sustainable cropping systems to improve water
productivity and protect water and soil quality in irrigated agriculture (peppers, garlic, lettuce, broccoli, strawberry, grapes, pomegranate, biofuels feedstocks) – Improved prediction of irrigation water use for California crops from remote
sensing
– Identified optimal, generic relationship between fraction of cover (fc) and basal crop coefficient (Kcb) to support broad-area satellite mapping, and quantified resulting errors in Kcb specification.
– An FAO-56 interpolation method was used to relate Fc to Kcb for several major annual crop classes using a “density coefficient” based on fc and crop height.
– NDVI was compared to Surface Energy Balance Algorithm for Land (SEBAL), which derived ET through a surface energy balance approach.
Broccoli water use

Sensor-Based Management – Importance • Only 10% of 1,300+ U.S. cotton farmers indicated they were using
any type of irrigation monitoring sensor (Cotton, Inc., 2008) • A large adoption barrier was the time required to visit fields and
read sensors or download data. • Now affordable wireless data delivery is removing that barrier and
grower implementation of sensor-based scheduling is increasing. • Multiple factors drive producer use of sensors:
– 1) Desire to optimize yield for the inputs invested; – 2) Need to partition limited water resources during the season; – 3) Ability to properly account for rainfall received; – 4) Increased pumping energy costs; – 5) Regulatory requirements (even in humid regions); and – 6) Public scrutiny over agricultural water use: "water footprint"
• All these factors have led producers to recognize sensors are an important part of an overall sustainable irrigation production management system.
Edward Barnes, Cotton Incorporated: The Importance of Sensor-Based Irrigation Management

Sensors and Site Specific Irrigation
• Sensors mounted on moving irrigation systems can scan entire field over multiple days.
• Maps of NDVI, canopy temperature & crop health enable site specific management.
• Wireless sensors make this affordable and remove the hassle factor & cost of wires.
• ARS Task Force for Site Specific Irrigation Management and Water Use Efficiency Tools (SSIMWUET) – Bushland, TX; Florence, SC; Maricopa, AZ; Portageville, MO; Sidney, MT; Stoneville, SC
• Work with industry on standardization
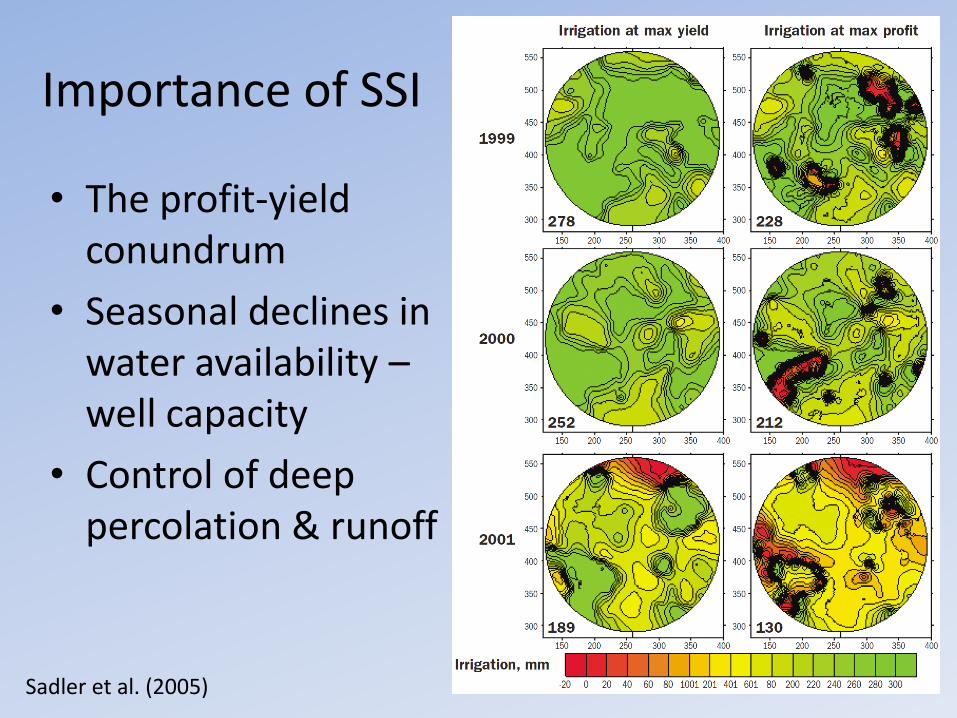
Importance of SSI
• The profit-yield conundrum
• Seasonal declines in water availability – well capacity
• Control of deep percolation & runoff
Sadler et al. (2005)

Weather station
900 MHz Embedded computer at pivot point for data acquisition and central processing
Infrared thermometers (IRTs) on pivot lateral Wireless network of IRTs
2.4 GHz- Zigbee protocol with mesh-networking
Integrated Sensor Network on Moving Irrigation System
CPRL Bushland, TX

Center pivot outfitted with variable rate irrigation (VRI) and wireless sensor network system for site-specific irrigation management and dynamic prescription map building. Plant feedback algorithm is basis for prescription map building and
controlling location and rate of irrigation for each management zone
Router
IRT
Ethernet connection for remote monitoring
2.4 GHz, Zigbee protocol
Hydraulic valves
Embedded computer for data
acquisition and
processing
Prescription map based on integrated CWSI
Bushland, Texas – Southern High Plains
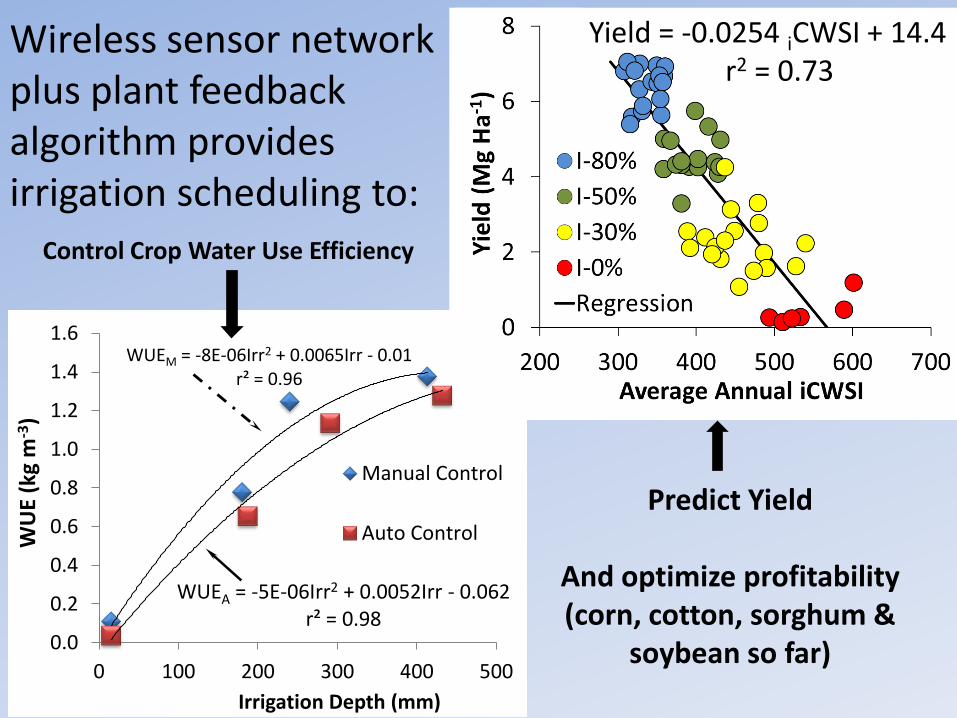
Control Crop Water Use Efficiency
Predict Yield
And optimize profitability (corn, cotton, sorghum &
soybean so far)
WUEM = -8E-06Irr2 + 0.0065Irr - 0.01r² = 0.96
WUEA = -5E-06Irr2 + 0.0052Irr - 0.062r² = 0.98
0.0
0.2
0.4
0.6
0.8
1.0
1.2
1.4
1.6
0 100 200 300 400 500
WU
E (k
g m
-3)
Irrigation Depth (mm)
Manual Control
Auto Control
Wireless sensor network plus plant feedback algorithm provides irrigation scheduling to:
Yield = -0.0254 iCWSI + 14.4 r2 = 0.73
WU
E (k
g m
-3)

Vegetative Remote Sensing for Spatial Irrigation Management
2012, uniform vegetative growth due to adequate rainfall.
1.2
1.2
1.2
1.2
Corn, June 1, 2012
Corn Crop
Coefficients,
(Kc)
1.20 - 1.25
1.15 - 1.19
1.10 - 1.14
1.00 - 1.09
•Irrigation Depths Calculated using remotely sensed crop coefficients (NDVI)
Irrigation= ET × Kc
Crop Canopy Sensor - mounted on tractor or center pivot
Coastal Plain Soil, Water and Plant Conservation Research Center, Florence, South Carolina

• Soil-water was monitored using WSN in 16 locations
• Based on ET & soil-water, 5 irrig. rates used in corn and soybean plots: 0, 50, 75, 100, 125%; 0 and 100% used in cotton plots
• Yield and quality data collected
• Data in analysis
VRI in Stoneville, MS

Quantification & partitioning of ET and Kc under all constraints
Partitioning of ET components
Regional variations
Tillage effects
Irrigation methods
Incomplete canopies
Deficit irrigation
Irrigation Water Management Irrigation Scheduling for Water Use Efficiency

END Contact:
http://www.ars.usda.gov/research/programs/programs.htm?NP_CODE=211