Embed Size (px)
Citation preview
USD Outlook
Cheng-Mount ChengAsia Pacific Economic and Market Analysis
+886-2-2777-7070
29, September, 2006

Recent Trends in Dollar Index
60
70
80
90
100
110
02-A
pr
02-J
ul
02-O
ct
03-J
an
03-A
pr
03-J
ul
03-O
ct
04-J
an
04-M
ay
04-A
ug
04-N
ov
05-F
eb
05-M
ay
05-A
ug
05-N
ov
06-M
ar
06-J
un
06-S
ep
Source: Reuters
•Dollar may look consolidated this year
Dollar Index, 2002 Jan=100
3
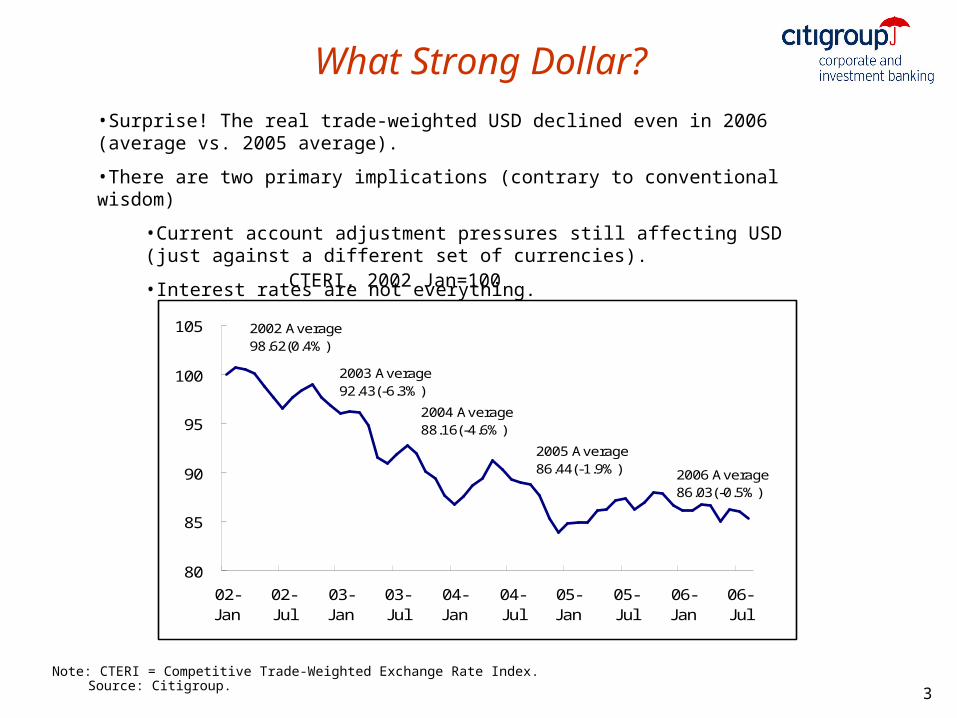
What Strong Dollar?
Note: CTERI = Competitive Trade-Weighted Exchange Rate Index.Source: Citigroup.
CTERI, 2002 Jan=100
•Surprise! The real trade-weighted USD declined even in 2006 (average vs. 2005 average).
•There are two primary implications (contrary to conventional wisdom)
•Current account adjustment pressures still affecting USD (just against a different set of currencies).
•Interest rates are not everything.
80
85
90
95
100
105
02-Jan
02-Jul
03-Jan
03-Jul
04-Jan
04-Jul
05-Jan
05-Jul
06-Jan
06-Jul
2002 Average98.62(0.4%)
2005 Average86.44(-1.9%)
2004 Average88.16(-4.6%)
2003 Average92.43(-6.3%)
2006 Average86.03(-0.5%)

4
USD Weakness Began to Shift
Fed Real Trade-Weighted USD Index, Majors vs. Other Important Trading Partners, Feb 2002 – Dec 2004 (Feb 2002 = 100)
Note: OITP Other Important Trading Partners.Source: Federal Reserve.
•In the three years after the USD peak in Feb 2002, all of the USD decline was against the majors.
•Last year, at least relative to the majors, some EM currencies finally began to perform well.
70.0
75.0
80.0
85.0
90.0
95.0
100.0
105.0
110.0
Mar-02
Jun-0
2
Sep-0
2
Dec-0
2
Mar-03
Jun-0
3
Sep-0
3
Dec-0
3
Mar-04
Jun-0
4
Sep-0
4
Dec-0
4
Feb
2002
= 1
00
Majors OITP
Fed Real Trade-Weighted USD Index, Majors vs. Other Important Trading Partners, Jan 2005 – Jun 2006 (Jan 2005 = 100)
90.0
95.0
100.0
105.0
110.0
1/1/2005 4/1/2005 7/1/2005 10/1/2005 1/1/2006 4/1/2006
Jan
20
05
= 1
00
Majors OITP
5
Yields May Have Helped, But Correlation With USD is Weak
CTERI = Competitive Trade Weighted Exchange Rate Index (calculated by Citigroup).Sources: Federal Reserve, Citigroup.
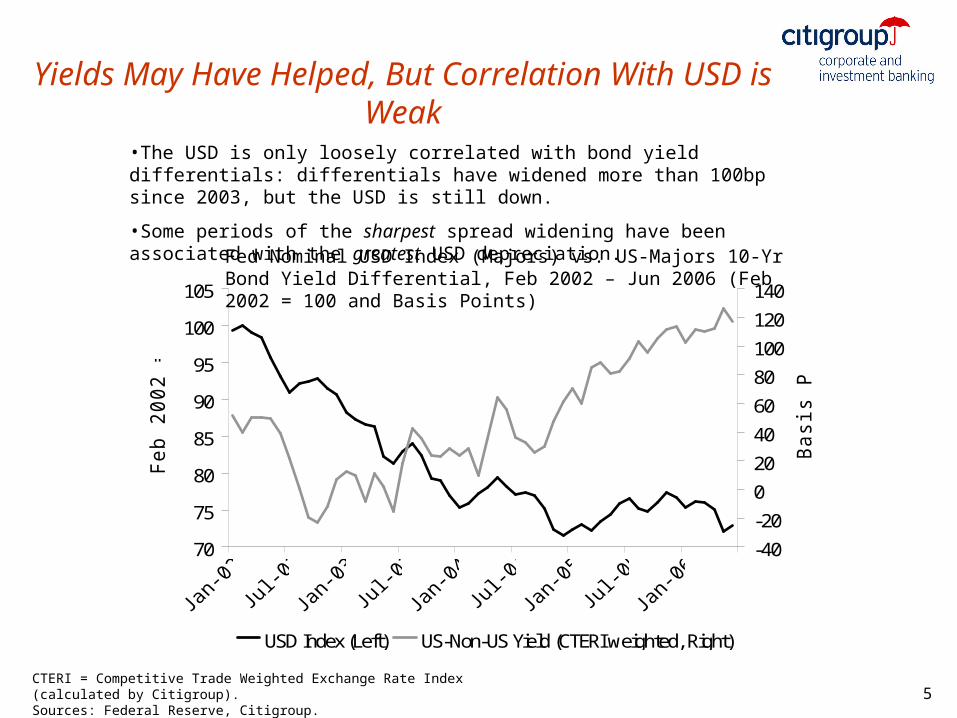
Fed Nominal USD Index (Majors) vs. US-Majors 10-Yr Bond Yield Differential, Feb 2002 – Jun 2006 (Feb 2002 = 100 and Basis Points)
•The USD is only loosely correlated with bond yield differentials: differentials have widened more than 100bp since 2003, but the USD is still down.
•Some periods of the sharpest spread widening have been associated with the greatest USD depreciation.
70
75
80
85
90
95
100
105
Feb
20
02
= 1
00
-40
-20
0
20
40
60
80
100
120
140
Basis
Poin
ts
USD Index (Left) US-Non-US Yield (CTERI weighted, Right)

6
-7
-5
-3
-1
1
3
5
7
Dec-8
0
Dec-8
2
Dec-8
4
Dec-8
6
Dec-8
8
Dec-9
0
Dec-9
2
Dec-9
4
Dec-9
6
Dec-9
8
Dec-0
0
Dec-0
2
Dec-0
4
Pct
of
GD
P
Fiscal balance CA balance
Until about 1989, fiscal and current account balances more or less moved in line with each other.
Since then, they have more often moved in opposite directions.
US Fiscal Deficit Reduction: Little Impact on CA Deficit
Note: Four-quarter moving sum for fiscal balance.Sources: US Treasury, Bureau of Economic Analysis.
US Fiscal Balance and Current Account Balance, 1980 – 2Q 2006 (Pct of GDP)
•The US fiscal deficit does not appear to be causing the current account deficit.
•Fiscal tightening might be a good idea, but it wouldn’t necessarily reduce the CA deficit or strengthen the USD.
7
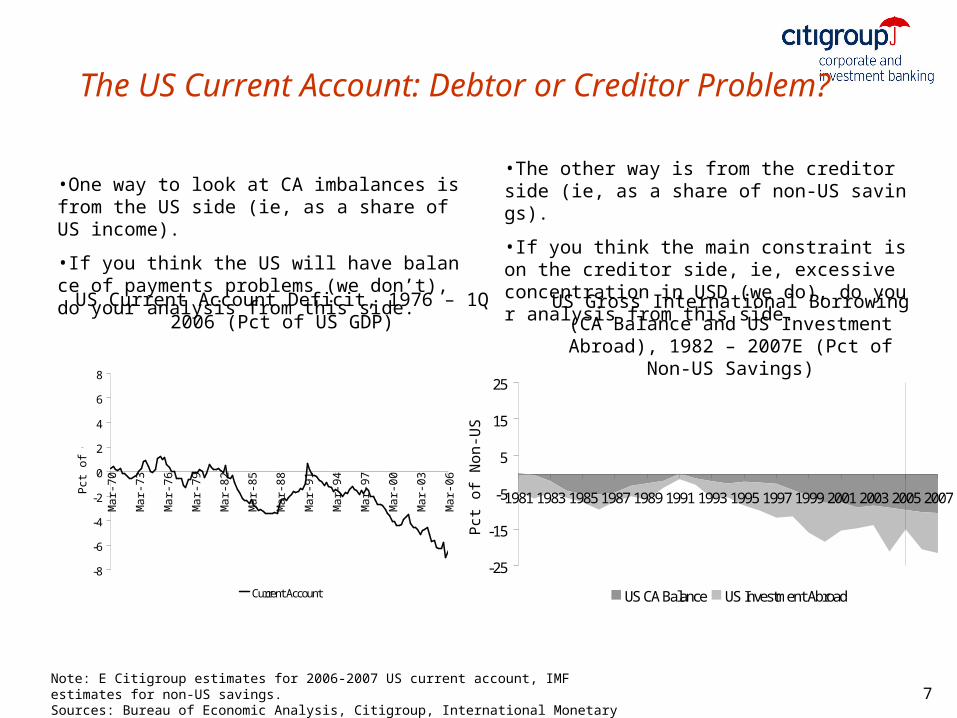
The US Current Account: Debtor or Creditor Problem?
•One way to look at CA imbalances is from the US side (ie, as a share of US income).
•If you think the US will have balance of payments problems (we don’t), do your analysis from this side.
•The other way is from the creditor side (ie, as a share of non-US savings).
•If you think the main constraint is on the creditor side, ie, excessive concentration in USD (we do), do your analysis from this side.
Note: E Citigroup estimates for 2006-2007 US current account, IMF estimates for non-US savings. Sources: Bureau of Economic Analysis, Citigroup, International Monetary Fund World Economic Outlook.
US Gross International Borrowing (CA Balance and US Investment Abroad), 1982 – 2007E (Pct
of Non-US Savings)
US Current Account Deficit, 1976 – 1Q 2006 (Pct of US GDP)
-8
-6
-4
-2
0
2
4
6
8
Mar-
70
Mar-
73
Mar-
76
Mar-
79
Mar-
82
Mar-
85
Mar-
88
Mar-
91
Mar-
94
Mar-
97
Mar-
00
Mar-
03
Mar-
06
Pct
of
GD
P
Current Account
-25
-15
-5
5
15
25
19811983198519871989199119931995199719992001200320052007
Pct
of
Non
-US
Savin
gs
US CA Balance US Investment Abroad
8
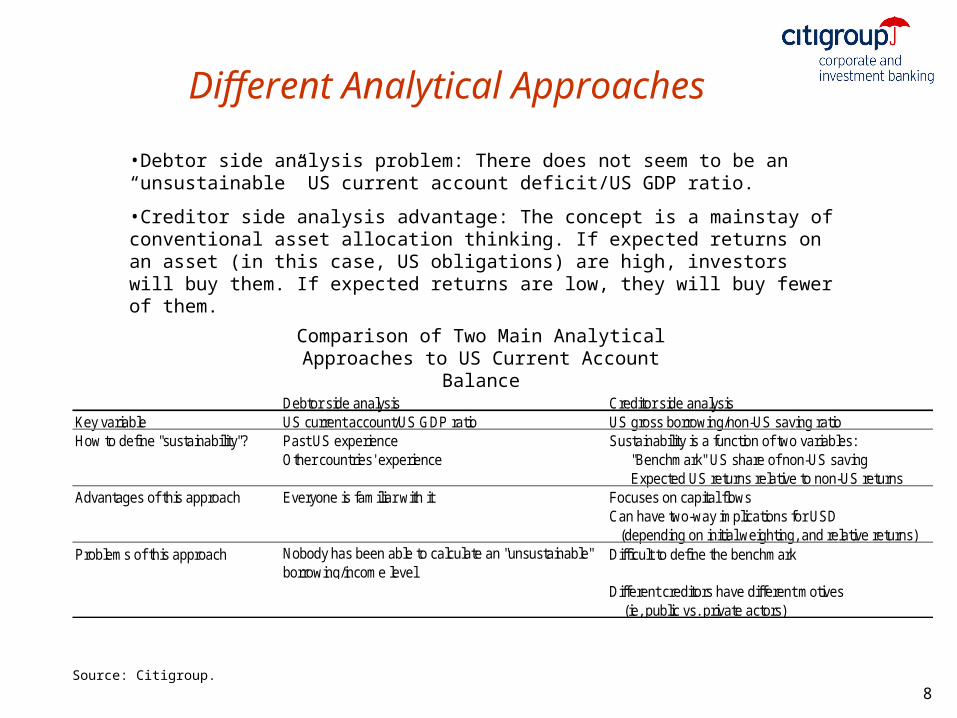
Different Analytical Approaches
Debtor side analysis Creditor side analysisKey variable US current account/US GDP ratio US gross borrowing/non-US saving ratioHow to define "sustainability"? Past US experience Sustainability is a function of two variables:
Other countries' experience "Benchmark" US share of non-US saving Expected US returns relative to non-US returns
Advantages of this approach Everyone is familiar with it Focuses on capital flowsCan have two-way implications for USD (depending on initial weighting, and relative returns)
Problems of this approach Nobody has been able to calculate an "unsustainable" borrowing/income level
Difficult to define the benchmark
Different creditors have different motives (ie, public vs. private actors)
Source: Citigroup.
Comparison of Two Main Analytical Approaches to US Current Account Balance
•Debtor side analysis problem: There does not seem to be an “unsustainable” US current account deficit/US GDP ratio.
•Creditor side analysis advantage: The concept is a mainstay of conventional asset allocation thinking. If expected returns on an asset (in this case, US obligations) are high, investors will buy them. If expected returns are low, they will buy fewer of them.
9
-25.0
-20.0
-15.0
-10.0
-5.0
0.0
5.0
10.0
Pct
of
Non
-US
Savin
g
Benchmark USD Share US Borrowing/Non-US Saving
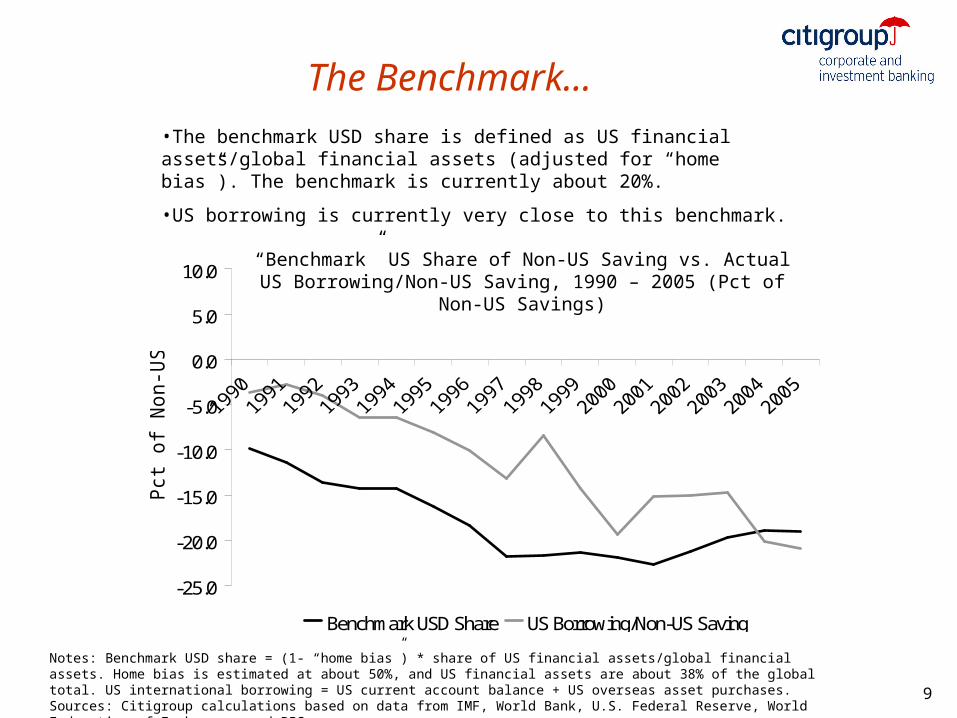
The Benchmark...
Notes: Benchmark USD share = (1- “home bias”) * share of US financial assets/global financial assets. Home bias is estimated at about 50%, and US financial assets are about 38% of the global total. US international borrowing = US current account balance + US overseas asset purchases. Sources: Citigroup calculations based on data from IMF, World Bank, U.S. Federal Reserve, World Federation of Exchanges, and BIS.
“Benchmark” US Share of Non-US Saving vs. Actual US Borrowing/Non-US Saving, 1990 – 2005 (Pct of Non-US Savings)
•The benchmark USD share is defined as US financial assets/global financial assets (adjusted for “home bias”). The benchmark is currently about 20%.
•US borrowing is currently very close to this benchmark.
10
-1.0
0.0
1.0
2.0
3.0
4.0
5.0
6.0
Retu
rn/S
D
US G9
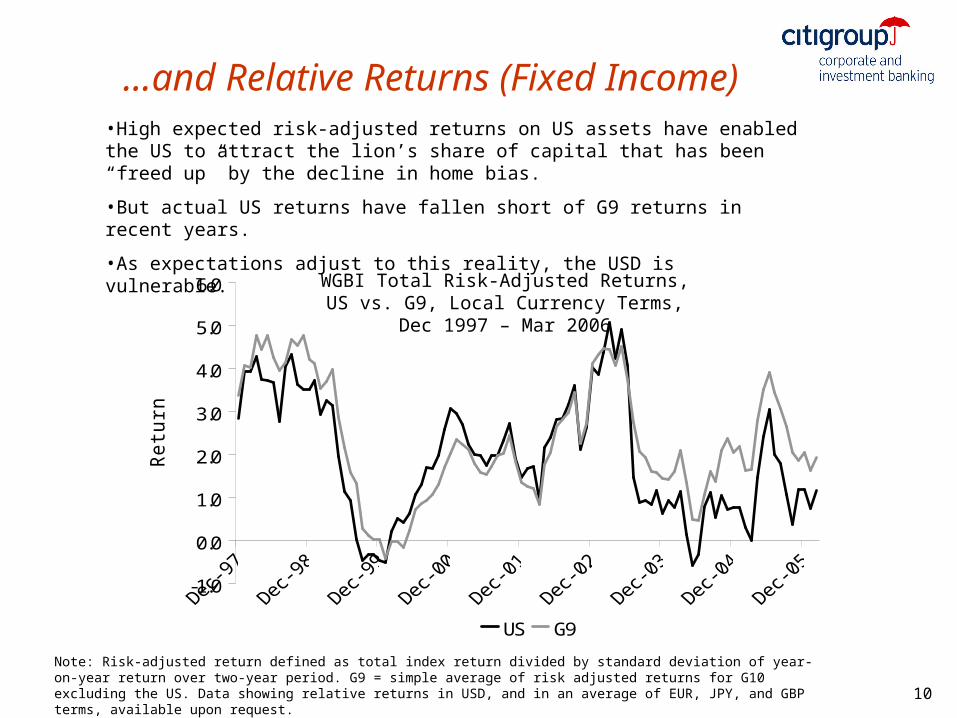
...and Relative Returns (Fixed Income)
WGBI Total Risk-Adjusted Returns, US vs. G9, Local Currency Terms, Dec 1997 – Mar 2006
Note: Risk-adjusted return defined as total index return divided by standard deviation of year-on-year return over two-year period. G9 = simple average of risk adjusted returns for G10 excluding the US. Data showing relative returns in USD, and in an average of EUR, JPY, and GBP terms, available upon request.Source: Citigroup.
•High expected risk-adjusted returns on US assets have enabled the US to attract the lion’s share of capital that has been “freed up” by the decline in home bias.
•But actual US returns have fallen short of G9 returns in recent years.
•As expectations adjust to this reality, the USD is vulnerable.
11
-6.0
-4.0
-2.0
0.0
2.0
4.0
6.0D
ec-
97
Jun
-98
Dec-
98
Jun
-99
Dec-
99
Jun
-00
Dec-
00
Jun
-01
Dec-
01
Jun
-02
Dec-
02
Jun
-03
Dec-
03
Jun
-04
Dec-
04
Jun
-05
Dec-
05
Retu
rn/S
D
US G9
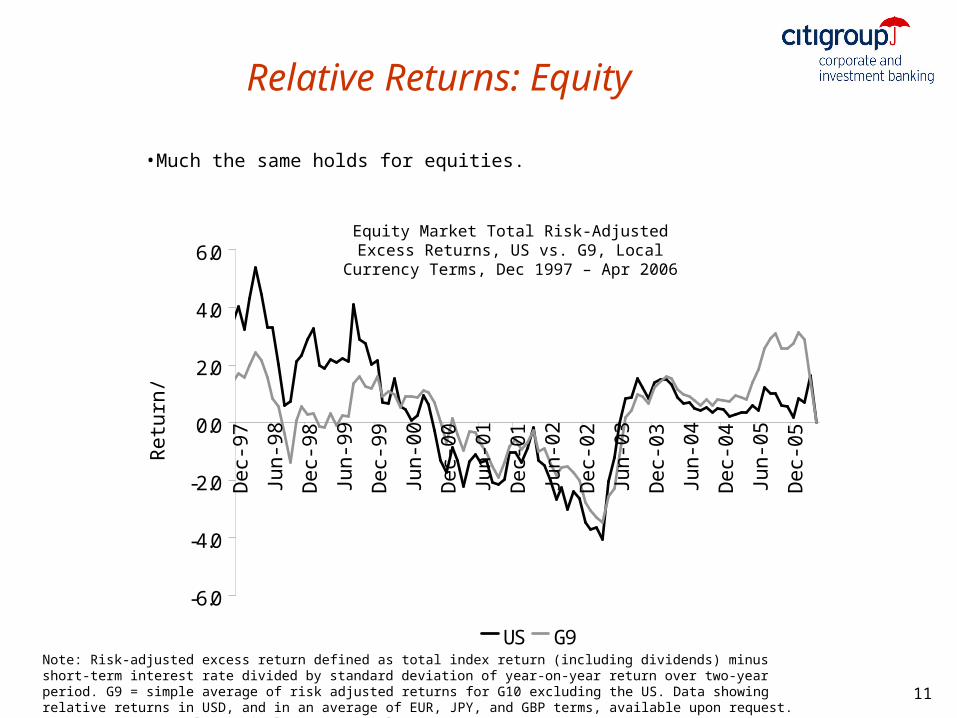
Relative Returns: Equity
Equity Market Total Risk-Adjusted Excess Returns, US vs. G9, Local Currency Terms, Dec 1997 – Apr 2006
Note: Risk-adjusted excess return defined as total index return (including dividends) minus short-term interest rate divided by standard deviation of year-on-year return over two-year period. G9 = simple average of risk adjusted returns for G10 excluding the US. Data showing relative returns in USD, and in an average of EUR, JPY, and GBP terms, available upon request. Source: Morgan Stanley Capital International.
•Much the same holds for equities.
12
-8
-6
-4
-2
0
2
4
6
Dec-
97
Apr-
98
Aug-9
8
Dec-
98
Apr-
99
Aug-9
9
Dec-
99
Apr-
00
Aug-0
0
Dec-
00
Apr-
01
Aug-0
1
Dec-
01
Apr-
02
Aug-0
2
Dec-
02
Apr-
03
Aug-0
3
Dec-
03
Apr-
04
Aug-0
4
Dec-
04
Apr-
05
Aug-0
5
Dec-
05
Retu
rn/S
D
US-G9 returns US Current account balance
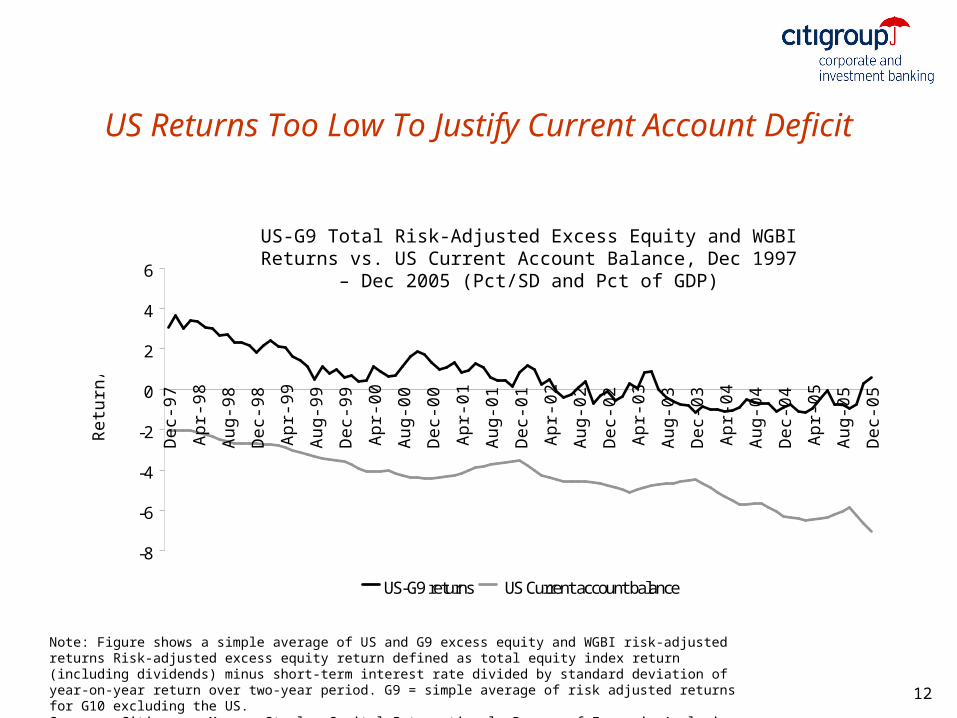
US Returns Too Low To Justify Current Account Deficit
US-G9 Total Risk-Adjusted Excess Equity and WGBI Returns vs. US Current Account Balance, Dec 1997 – Dec 2005 (Pct/SD and Pct of
GDP)
Note: Figure shows a simple average of US and G9 excess equity and WGBI risk-adjusted returns Risk-adjusted excess equity return defined as total equity index return (including dividends) minus short-term interest rate divided by standard deviation of year-on-year return over two-year period. G9 = simple average of risk adjusted returns for G10 excluding the US.Sources: Citigroup, Morgan Stanley Capital International, Bureau of Economic Analysis.
13
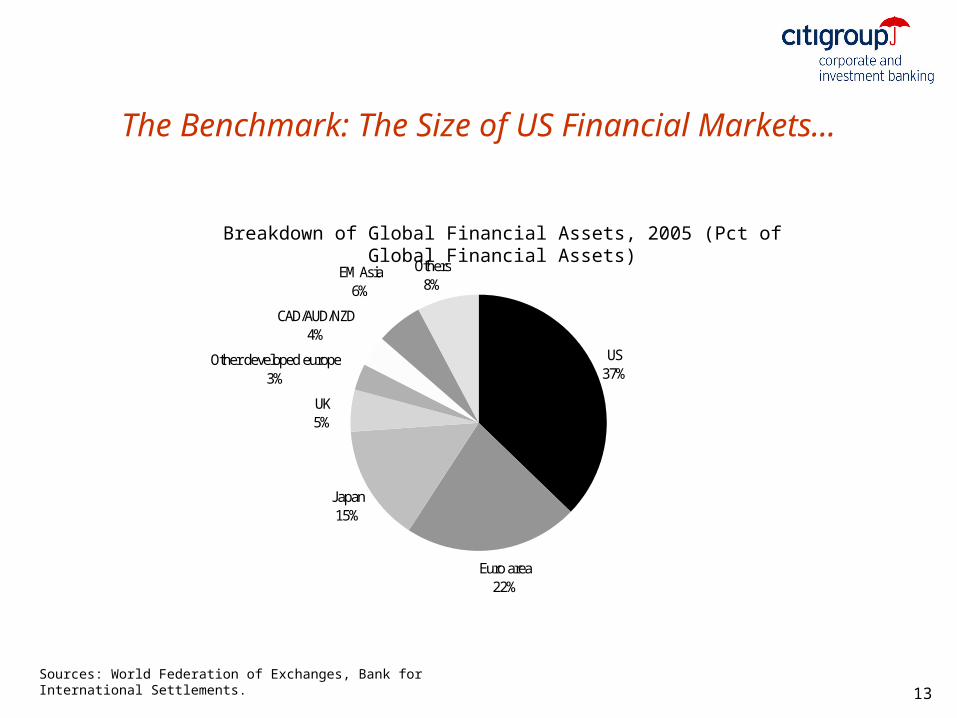
The Benchmark: The Size of US Financial Markets...
Sources: World Federation of Exchanges, Bank for International Settlements.
Breakdown of Global Financial Assets, 2005 (Pct of Global Financial Assets)
US37%
Euro area22%
Japan15%
Other developed europe3%
CAD/AUD/NZD4%
EM Asia6%
Others8%
UK5%
14
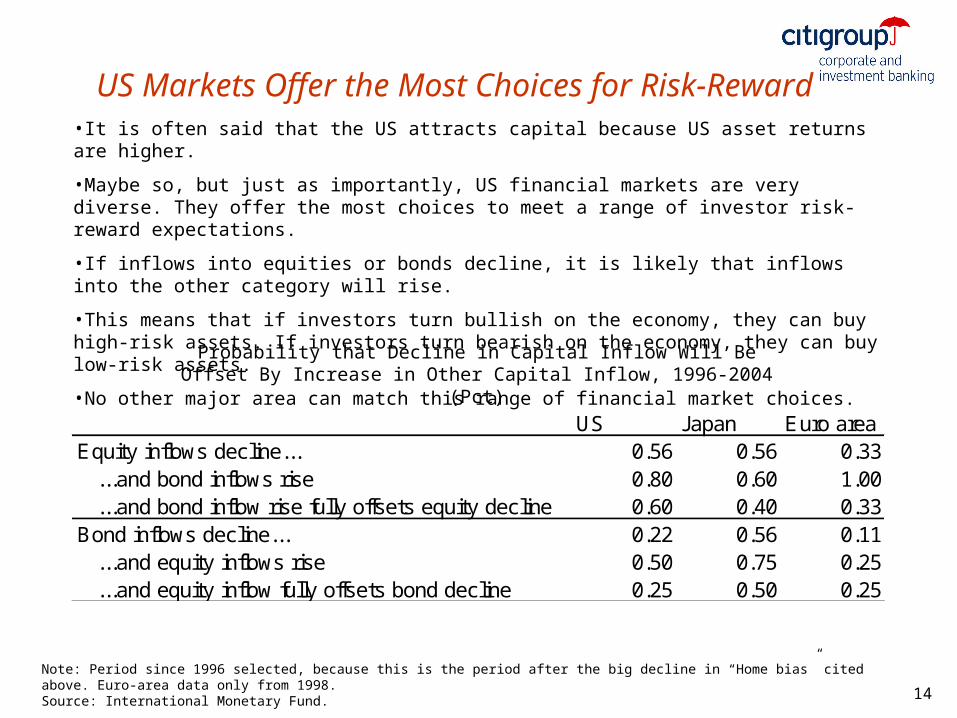
US Markets Offer the Most Choices for Risk-Reward
US Japan Euro areaEquity inflows decline... 0.56 0.56 0.33 ...and bond inflows rise 0.80 0.60 1.00 ...and bond inflow rise fully offsets equity decline 0.60 0.40 0.33Bond inflows decline... 0.22 0.56 0.11 ...and equity inflows rise 0.50 0.75 0.25 ...and equity inflow fully offsets bond decline 0.25 0.50 0.25
Note: Period since 1996 selected, because this is the period after the big decline in “Home bias” cited above. Euro-area data only from 1998.Source: International Monetary Fund.
Probability that Decline in Capital Inflow Will Be Offset By Increase in Other Capital Inflow, 1996-2004 (Pct)
•It is often said that the US attracts capital because US asset returns are higher.
•Maybe so, but just as importantly, US financial markets are very diverse. They offer the most choices to meet a range of investor risk-reward expectations.
•If inflows into equities or bonds decline, it is likely that inflows into the other category will rise.
•This means that if investors turn bullish on the economy, they can buy high-risk assets. If investors turn bearish on the economy, they can buy low-risk assets.
•No other major area can match this range of financial market choices.
15
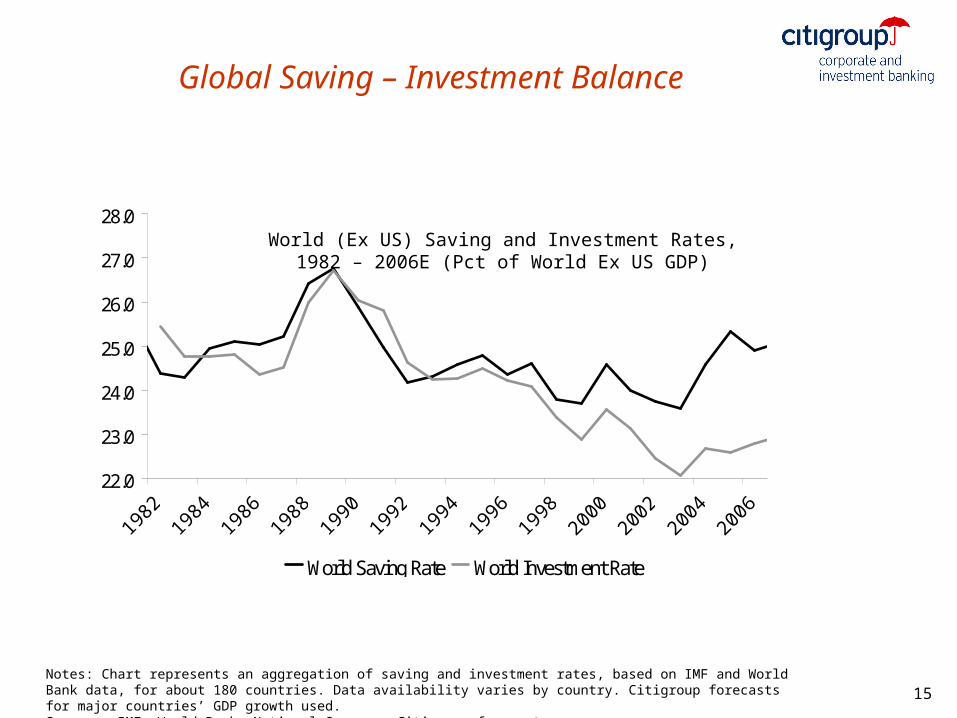
Global Saving – Investment Balance
World (Ex US) Saving and Investment Rates, 1982 – 2006E (Pct of World Ex US GDP)
Notes: Chart represents an aggregation of saving and investment rates, based on IMF and World Bank data, for about 180 countries. Data availability varies by country. Citigroup forecasts for major countries’ GDP growth used.Sources: IMF, World Bank, National Sources, Citigroup forecasts.
22.0
23.0
24.0
25.0
26.0
27.0
28.0
1982
1984
1986
1988
1990
1992
1994
1996
1998
2000
2002
2004
2006
World Saving Rate World Investment Rate
16
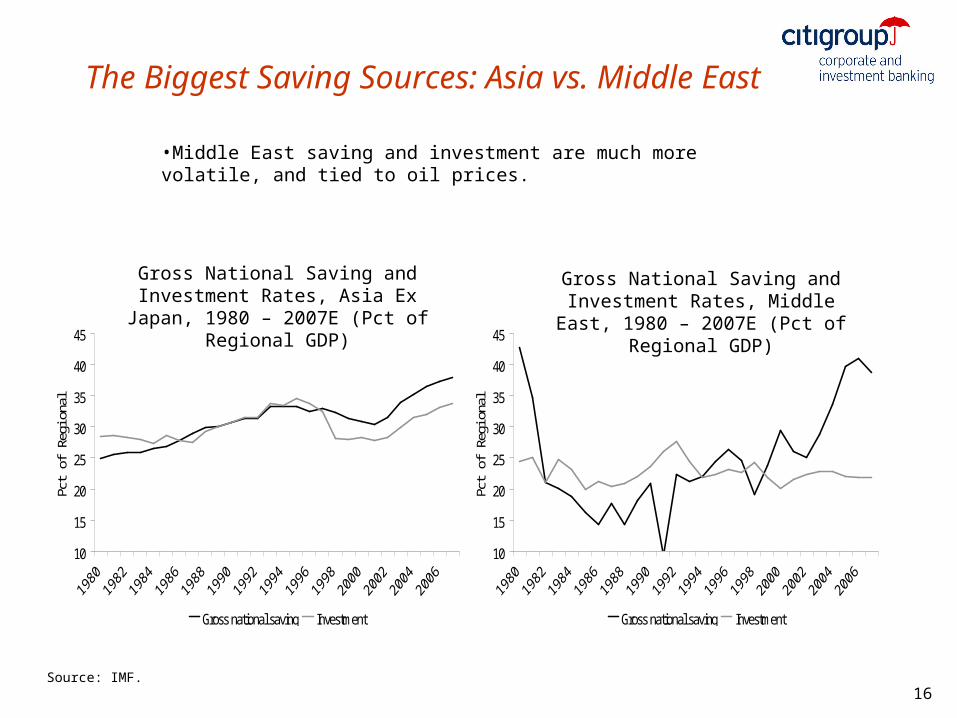
The Biggest Saving Sources: Asia vs. Middle East
10
15
20
25
30
35
40
45
Pct
of R
egio
nal G
DP
Gross national saving Investment
10
15
20
25
30
35
40
45
Pct
of R
egio
nal G
DP
Gross national saving Investment
Source: IMF.
Gross National Saving and Investment Rates, Asia Ex Japan, 1980 – 2007E (Pct
of Regional GDP)
Gross National Saving and Investment Rates, Middle East, 1980 – 2007E (Pct
of Regional GDP)
•Middle East saving and investment are much more volatile, and tied to oil prices.
17
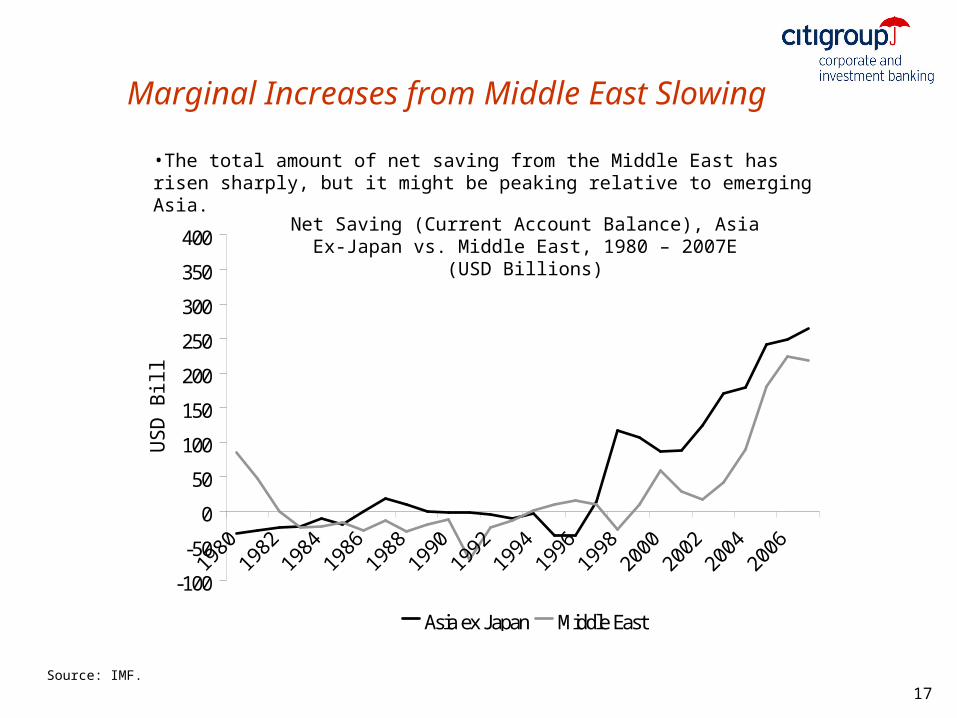
Marginal Increases from Middle East Slowing
-100
-50
0
50
100
150
200
250
300
350
400
1980
1982
1984
1986
1988
1990
1992
1994
1996
1998
2000
2002
2004
2006
US
D B
illio
ns
Asia ex Japan Middle East
Net Saving (Current Account Balance), Asia Ex-Japan vs. Middle East, 1980 – 2007E (USD Billions)
Source: IMF.
•The total amount of net saving from the Middle East has risen sharply, but it might be peaking relative to emerging Asia.

18
The Importance of China
24
29
34
39
44
49
54
Pct
of G
DP
Saving Investment
24
29
34
39
44
49
54
Pct
of G
DP
Saving Investment
Sources: IMF, World Bank, National Sources, Citigroup forecasts.
China’s Saving and Investment Rates, 1982 – 2005 (Pct of GDP)
Emerging Asia Ex China’s Saving and Investment Rates, 1982 – 2005 (Pct of GDP)
•China has a much higher saving rate than the rest of emerging Asia (plus China is bigger, and growing faster).
19
Current Account Deficit: Don’t Expect It To Decline
• Little relative price change (Asia sacrifices margin for market share).
• Little relative growth change • Little relative productivity change in critical
sectors (retail)• It is not unusual for current account decline to lag
USD decline

20
Weak USD, But Little Relative Price Shift
Sources: Federal Reserve Board, Bureau of Labor Statistics.
Real Trade-Weighted Dollar (Inverted) and Ratio of Import Prices (ex Oil) to Core PPI, Sep 1982 – Jun 2006 (2000 = 100)
80859095
100105110115120125130
Sep
-82
Sep
-84
Sep
-86
Sep
-88
Sep
-90
Sep
-92
Sep
-94
Sep
-96
Sep
-98
Sep
-00
Sep
-02
Sep
-04
20
00
= 1
00
90
95
100
105
110
115
120
20
00
= 1
00
USD (Left) Import prices ex-oil/Core PPI (Right)
21
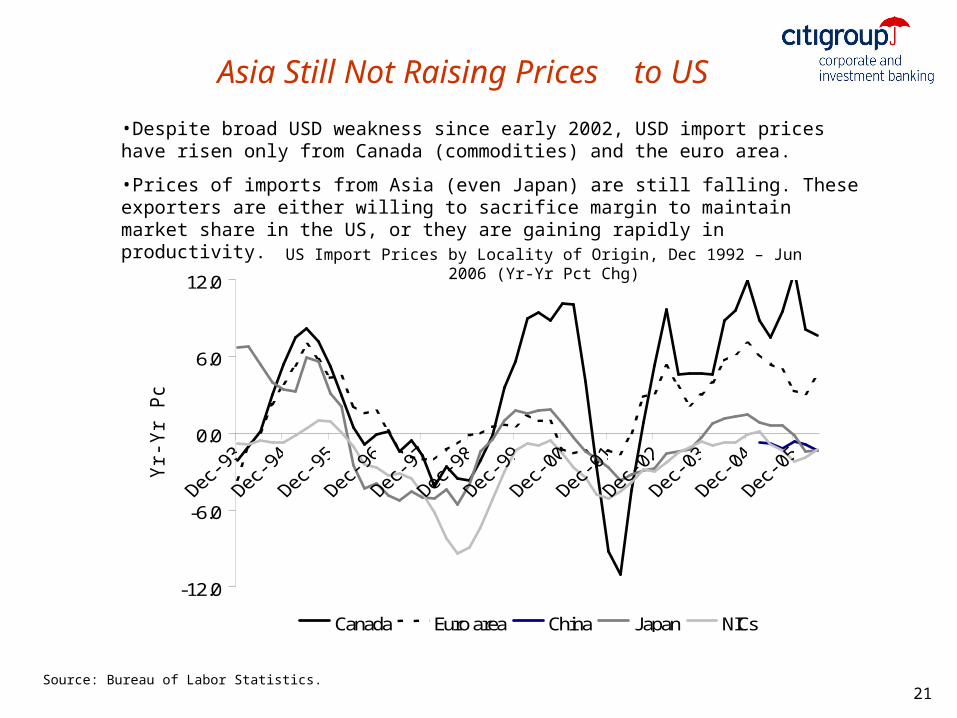
Asia Still Not Raising Prices to US
Source: Bureau of Labor Statistics.
US Import Prices by Locality of Origin, Dec 1992 – Jun 2006 (Yr-Yr Pct Chg)
•Despite broad USD weakness since early 2002, USD import prices have risen only from Canada (commodities) and the euro area.
•Prices of imports from Asia (even Japan) are still falling. These exporters are either willing to sacrifice margin to maintain market share in the US, or they are gaining rapidly in productivity.
-12.0
-6.0
0.0
6.0
12.0
Yr-Yr
Pct
Ch
g
Canada Euro area China Japan NICs

22
Weak Relative Non-US Growth
US, Real Exports and Imports, 1996 – 2Q 2006 (Yr-Yr Pct Chg)
Source: Bureau of Economic Analysis.
US export growth has finally exceeded US import growth, but it has a long way to go to
stabilize deficits.
-20
-15
-10
-5
0
5
10
15
20
Jun-
96
Jun-
97
Jun-
98
Jun-
99
Jun-
00
Jun-
01
Jun-
02
Jun-
03
Jun-
04
Jun-
05
Jun-
06Yr-Y
r Pct
Ch
g
Exports Imports
23
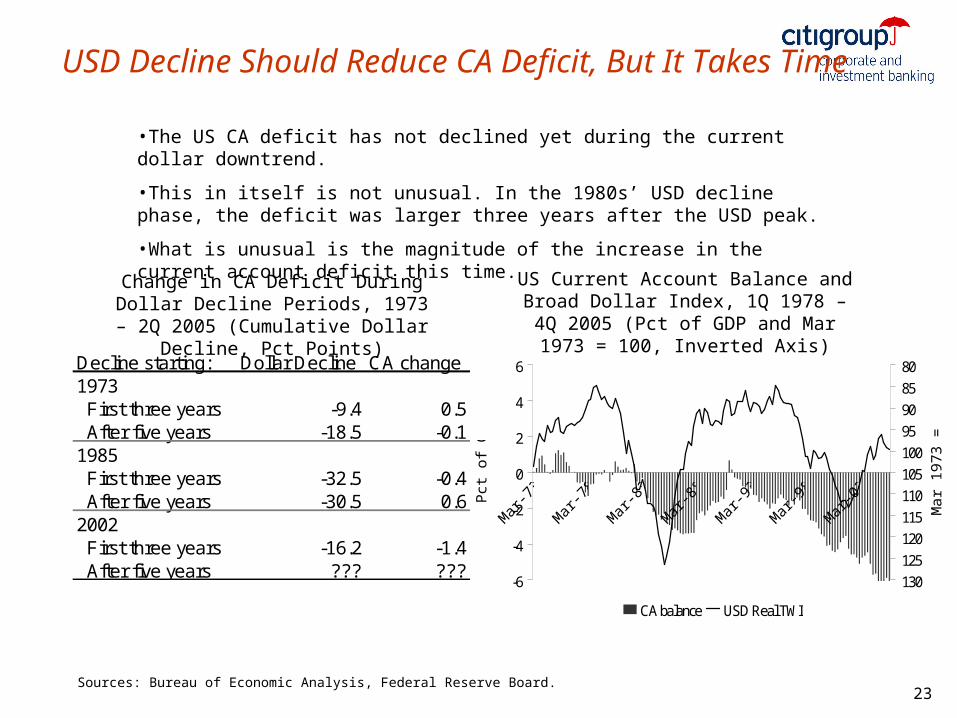
USD Decline Should Reduce CA Deficit, But It Takes Time
Sources: Bureau of Economic Analysis, Federal Reserve Board.
US Current Account Balance and Broad Dollar Index, 1Q 1978 – 4Q 2005 (Pct of GDP and Mar 1973 = 100, Inverted Axis)
Change in CA Deficit During Dollar Decline Periods, 1973 – 2Q 2005
(Cumulative Dollar Decline, Pct Points)
•The US CA deficit has not declined yet during the current dollar downtrend.
•This in itself is not unusual. In the 1980s’ USD decline phase, the deficit was larger three years after the USD peak.
•What is unusual is the magnitude of the increase in the current account deficit this time.
Decline starting: Dollar Decline CA change1973 First three years -9.4 0.5 After five years -18.5 -0.11985 First three years -32.5 -0.4 After five years -30.5 0.62002 First three years -16.2 -1.4 After five years ??? ???
-6
-4
-2
0
2
4
6
Pct
of
GD
P
80859095100105110115120125130
Mar
19
73
= 1
00
CA balance USD Real TWI
24
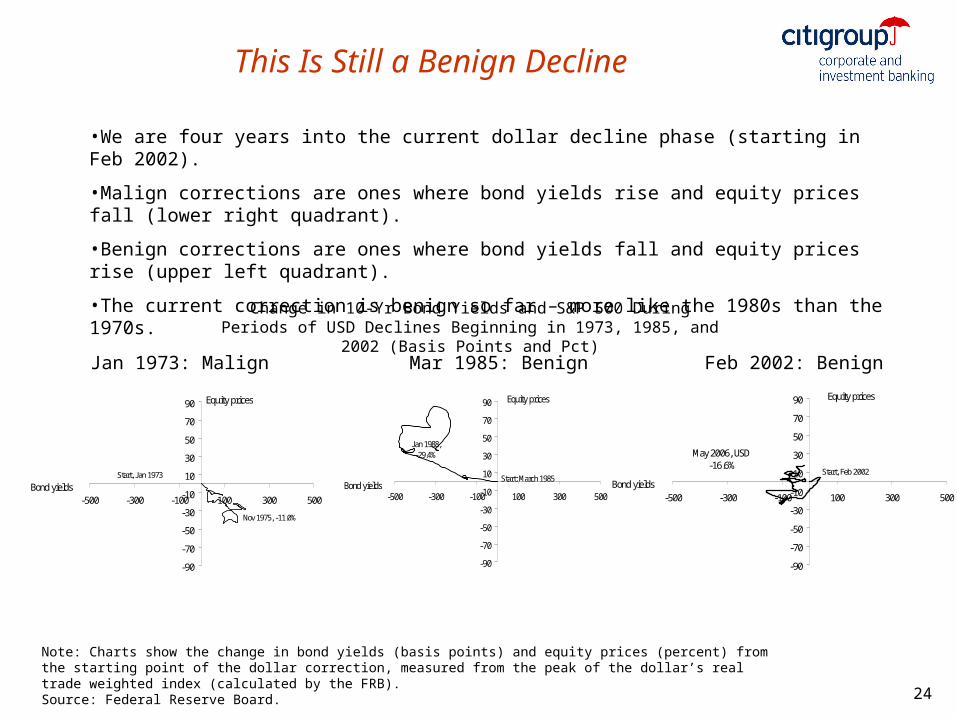
This Is Still a Benign Decline
-90
-70
-50
-30
-10
10
30
50
70
90
-500 -300 -100 100 300 500Bond yields
Equity prices
Nov 1975, -11.0%
Start, Jan 1973
-90
-70
-50
-30
-10
10
30
50
70
90
-500 -300 -100 100 300 500Bond yields
Equity prices
Jan 1988, -29.4%
Start: March 1985
Jan 1973: Malign Mar 1985: Benign Feb 2002: Benign
•We are four years into the current dollar decline phase (starting in Feb 2002).
•Malign corrections are ones where bond yields rise and equity prices fall (lower right quadrant).
•Benign corrections are ones where bond yields fall and equity prices rise (upper left quadrant).
•The current correction is benign so far – more like the 1980s than the 1970s.
Note: Charts show the change in bond yields (basis points) and equity prices (percent) from the starting point of the dollar correction, measured from the peak of the dollar’s real trade weighted index (calculated by the FRB).Source: Federal Reserve Board.
Change in 10-Yr Bond Yields and S&P 500 During Periods of USD Declines Beginning in 1973, 1985, and 2002 (Basis Points and Pct)
-90
-70
-50
-30
-10
10
30
50
70
90
-500 -300 -100 100 300 500Bond yields
Equity prices
May 2006, USD -16.6%
Start, Feb 2002

Shifts of Geographical Distribution of Economic Influence
E 2006 estimate based on data from 3Q 05-2Q 06. Source: IMF and Citigroup.
Emerging Markets — Share of World Exports (Percent), 1990-06E
United States and Emerging Economies — Current Accounts (Percent of Global Savings), 1980–2006F
0
10
20
30
40
50
1990 1994 1998 2002 2006
0
2
4
6
8
10Emerging Markets (Left)Emerging Asia (Left)China (Right)
50% 10%
-3
0
3
6
9
1980 1985 1990 1995 2000 2005
-9
-6
-3
0
3
Emerging Economies (Left) United States (Right, inverted)
9% -9%
26
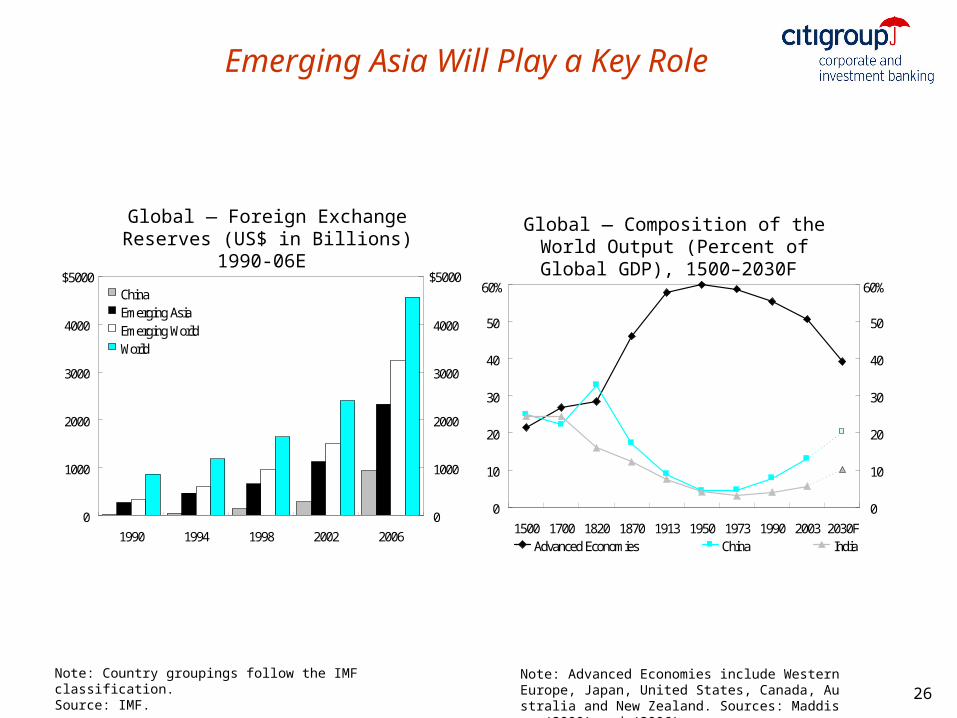
Emerging Asia Will Play a Key Role
Note: Country groupings follow the IMF classification. Source: IMF.
Global — Foreign Exchange Reserves (US$ in Billions) 1990-06E
0
1000
2000
3000
4000
5000
1990 1994 1998 2002 2006
0
1000
2000
3000
4000
5000ChinaEmerging AsiaEmerging WorldWorld
$5000B
$5000B
0
10
20
30
40
50
60
1500 1700 1820 1870 1913 1950 1973 1990 2003 2030F
0
10
20
30
40
50
60
Advanced Economies China India
60% 60%
Global — Composition of the World Output (Percent of Global GDP), 1500–2030F
Note: Advanced Economies include Western Europe, Japan, United States, Canada, Australia and New Zealand. Sources: Maddison (2000) and (2006).
27
Disclosure AppendixANALYST CERTIFICATIONI, Cheng-Mount Cheng, economist and author of the report, hereby certify that all of the views expressed in this research report accurately reflect my personal views about any and all of the
subject issuer(s) or securities. I also certify that no part of my compensation was, is, or will be directly or indirectly related to the specific recommendation(s) or view(s) in this report.Other DisclosuresADDITIONAL INFORMATION AVAILABLE UPON REQUEST
Citigroup Global Markets Inc, including its parent, subsidiaries and/or affiliates (“CGMI”), may make a market in the securities discussed in this report and may sell to or buy from customers, as principal, securities recommended in this report. CGMI may have a position in securities or options of any issuer recommended in this report. An employee of CGMI may be a director of an issuer recommended in this report. CGMI may perform or solicit investment banking or other services from any issuer recommended in this report.
Within the past three years, CGMI may have acted as manager or co-manager of a public offering of the securities of any issuer recommended in this report. Securities recommended, offered, or sold by CGMI : (i) are not insured by the Federal Deposit Insurance Corporation; (ii) are not deposits or other obligations of any insured depository institution (including Citibank); and (iii) are subject to investment risks, including the possible loss of the principal amount invested.
Investing in non-U.S. securities entails, including ADR’s, certain risks. The securities of non-U.S. issuers may not be registered with, nor be subject to the reporting requirements of, the U.S. Securities and Exchange Commission. There may be limited information available on foreign securities. Foreign companies are generally not subject to uniform audit and reporting standards, practices and requirements comparable to those in the U.S. Securities of some foreign companies may be less liquid and their prices more volatile than securities of comparable U.S. companies. In addition, exchange rate movements may have an adverse effect on the value of an investment in a foreign stock and its corresponding dividend payment for U.S. investors. Net dividends to ADR investors are estimated, using withholding tax rates conventions, deemed accurate, but investors are urged to consult their tax advisor for exact dividend computations.
Although information has been obtained from and is based upon sources CGMI believes to be reliable, we do not guarantee its accuracy and it may be incomplete or condensed. All opinions and estimates constitute CGMI 's judgement as of the date of the report and are subject to change without notice. This report is for informational purposes only and is not intended as an offer or solicitation for the purchase or sale of a security.
Investing in non-US securities by US persons may entail certain risks. Investors who have received this report from CGMI may be prohibited in certain US States from purchasing securities mentioned in this report from CGMI ; please ask your Financial Consultant for additional details.
This report is distributed in the United Kingdom by Citigroup Global Markets Limited , Citigroup Centre, Canada Square, Canary Wharf, London E14 5LB, UK. This material is directed exclusively at market professional and institutional investor customers and is not for distribution to private customers, as defined by the rules of the Financial Services Authority, who should not rely on this material. Moreover, any investment or service to which the material may relate will not be made available to such private customers. This material may relate to investments or services of a person outside of the United Kingdom or to other matters which are not regulated by the Financial Services Authority and further details as to where this may be the case are available upon request in respect of this material. If this publication is being made available in certain provinces of Canada by Citigroup Global Markets (Canada) Inc. ("CGMI Canada"), CGMI Canada has approved this publication. If this report was prepared by CGMI (excluding Nikko Citigroup Limited) and distributed in Japan by Nikko Citigroup Limited, it is being so distributed under license. This report is made available in Australia, to non retail clients through Citigroup Global Markets Australia Pty Limited (ABN 64 003 114 832), and to retail clients through Smith Barney Citigroup Australia Pty Ltd (ABN 10 009 145 555), Licensed Securities Dealers In New Zealand it is made available through Citigroup Global Markets New Zealand Limited, a member firm of the New Zealand Stock Exchange. This report does not take into account the investment objectives, financial situation or particular needs of any particular person. Investors should obtain advice based on their own individual circumstances before making an investment decision. Citigroup Global Markets (Pty) Limited is incorporated in the Republic of South Africa (company registration number 2000/025866/07) and its registered office is at Citibank Plaza, 145 West Street , Sandown, Sandton, 2196, Republic of South Africa. The investments and services contained herein are not available to private customers in South Africa. This publication is made available in Singapore through Citigroup Global Markets Singapore Pte. Ltd., a Capital Markets Services Licence holder. This report is being distributed in Hong Kong by or on behalf of, and is attributable to Citigroup Global Markets Asia Limited, 50th Floor, Citibank Plaza, 3 Garden Road, Central, Hong Kong.
Citigroup Global Markets Inc. is a member of the Securities Investor Protection Corporation (SIPC). © Citigroup Global Markets Inc., 2006. All rights reserved Smith Barney is a division and service mark of Citigroup Global Markets Inc. and its affiliates and is used and registered throughout the world. Citigroup and the Umbrella Device are trademarks and service marks of Citicorp and its affiliates and are used and registered throughout the world. CitiFx is a service mark of Citicorp . Any unauthorized use, duplication or disclosure is prohibited by law and may result in prosecution. Nikko is a service mark of Nikko Cordial Corporation.