Embed Size (px)
Citation preview

USD #292 Wheatland Schools PO Box 165 2920 K 23
Grainfield, KS 67737 www.usd292.org
i
• Budget General Information (characteristics of district)
• Supplemental Information for Tables in Summary of Expenditures
• KSDE Website Information Available
• Summary of Expenditures (Sumexpen.xls)

1
2008-2009 Budget General Information USD #: 292 Wheatland Schools
Introduction USD #292 Wheatland is entering the second year of a full academic and activities cooperation with USD #291 Grinnell Schools. Under the cooperative agreement, each district’s preschool – 4th grade students attend at their respective elementary schools in the towns of Grainfield and Grinnell. All 5th-8th graders in each district are encouraged to attend the Grinnell Middle School in Grinnell while all 9th-12th graders are encouraged to attend the Wheatland High School facility in Grainfield. A shuttle bus provides transportation between the attendance centers. USD #292 Wheatland is a rural western Kansas school district. The district is made up of the communities of Gove, Grainfield, and Park and many rural residences along the way. Four bus routes travel the 437 square miles to transport students in grades Preschool – 12th grade. Students in grades 5th – 8th are shuttled from Grainfield to Grinnell. Special Education services for USD #292 are provided by the Northwest Kansas Education Service Center (NKESC) in Oakley. The Wheatland Elementary School is located at 436 Elm in Grainfield. The Wheatland High School is located at 2920 K 23, between the intersection of I-70 and K-23.
Board Members Mitch Gillesipe, Board President Dale Goetz Leon Tuttle, Board Vice President Roy Williams Rodney Haffner Steve Watts Cindy Tustin
Faculty & Staff Superintendent: Darrin Herl Business Office Staff: Paula Chapin Rose Packard, Treasurer
Bus Transportation: Bus Drivers: Mary Zerr, Ellen Eberle, Carol Hartman, & Aaron Packard Bus Maintenance: Jim Hartman
Wheatland High School Tyler Flavin Civics/Leadership & Coach Donna Garrett HS Library Aide/ITV Mark Heier Industrial Arts & Technology Terry Ostmeyer Industrial Arts & Technology Brian Johnston HS Science & Coach Nealee Johnston Language Arts, Speech Allison Polifka Government, Current Events, Social Studies

2
Faculty & Staff
Virginia Kinderknecht Nurse Denise Wittman Special Services Rose LaBarge Language Arts, Journalism Rozan Schmalzried Vocal, Band Connie Lews Science Maria Castigliano Interrelated Teacher Amy Anderson Cook Connie Musgrove Para Educator Charles Packard Driver’s Ed, P.E., Math, Counselor & Coach Rose Packard Coach Susan Pfannenstiel Business Tammy Price Para Educator Christy Rathgeber Secretary & Coach Sheila Selensky Para Educator Ronna Schultz Art Reba White Family & Consumer Sciences Vernon “Butch” Weber Maintenance/Custodian Diane Wetter Math Allison Polikfa Social Sciences & Coach Jill Zerr Cook Mary Zerr Custodian Charlotte Manhart Para Educator Danyell Ziegler Para Educator James Bradley Technology Director
Wheatland Elementary Cherie Jo Medley Kindergarten Linda Gillespie Grade 1 Heather Flavin Grade 2 Deidre Zimmerman Grade 3 Susan Beesley Grade 4/Head Teacher Ronna Schultz Art Donna Tuttle Preschool Donna Garrett Library Rozan Schmalzried Music/Title I Tyler Flavin Physical Education/Title I Beverly Zimmerman Secretary Maria Castigliano Interrelated Teacher Virginia Kindeknecht Nurse Connie Musgrove Para educator Cammie Heier Para educator Donna Tuttle Para educator Melissa Hanna Para eduator Joan Dinkel Cook Pam Garrett Cook Aaron Packard Custodian

3
The District’s Accomplishments and Challenges Accomplishments: USD #292 has seen a graduation rate of 100% for the past several years. Nearly all graduates continue their education at a vocational school, community college or university. Graduates of Wheatland High School are building wonderful careers and foundations. The current elementary, middle school and high school students are striving as well with accomplishments on the Kansas State Assessment Tests as well as achieving Standard of Excellence. As many districts are facing faculty vacancies, USD #292 Wheatland is fortunate to recruit highly qualified teachers for all positions. The district hired a half time Business teacher last year, thus filling a position that has been open for several years and enabling the district to include those classes. An opening in the Government/History was easily filled by a local graduate. The FACS position was also filled locally with the ability to work with another district to enhance the program in each district. USD #292 employee one administrator for the combined the positions of Superintendent/Principal. A Head Teacher was appointed in each building to assist the Superintendent and an athletic director is shared with USD #291. Both district facilities are in exceptionally good condition. The gymnasium floor was refinished this summer. The REAP grant has annually provided funding for computer enhancements. Local businesses and patrons were very supportive in raising funds to replace the mats in the gymnasium. The district bus and vehicle fleet is also in excellent condition. Busses and vehicles have been upgraded annually as needed to insure a well maintained fleet. The implementation of the cooperative agreement with USD #291 has been an accomplishment for the district. Currently, there are 85 high school student attending Wheatland High School. The district is excited about the possibilities and class offerings for these students. With the cooperation of both districts, several teachers are being shared to provide a vast class offering to middle school and high school students. The students, staff and community have united under a new mascot, Thunderhawks, and new colors of blue, black and silver.

4
Challenges: As are all rural and small school district, USD #292 Wheatland is facing the effects of declining enrollment. The larger number classes are at the high school level and as those student graduate, the incoming Kindergarten classes are not nearly as large. The district has anticipated these enrollment changes and has been able to conserve as much as possible. Fund balances (when allowable) have been maintained. While USD #292 feels that the cooperative agreement has been beneficial to both districts, there is a question as to the future of the agreement. The agreement is for one additional year with this spring being the deadline for either board notification for not renewing the agreement. Joint board meetings are scheduled for this fall and spring to decide the fate of the cooperative agreement. USD #292 would like to see the agreement continue. An additional challenge for the cooperative agreement is the “ten-mile rule”. With the attendance center for grades 5-8 in Grinnell, the city of Park has now open (less than 10 miles) for the neighboring district to enter and transport students back to their district. Busses from both districts often meet on main-street in Park. USD #292 does not offer a group health plan at this time. The Board acknowledges that benefit could be a strong factor in recruiting teachers. The Board does offer a board paid fringe for faculty members that can be used for health premium reimbursement, cancer, disability, accident, medical reimbursement, and dependent child care reimbursement.

5
Supplemental Information for the Following Tables 1. Summary of Total Expenditures by Function (All Funds) 2. Summary of General Fund Expenditures by Function 3. Summary of Supplemental General Fund Expenditures by Function 4. Summary of General and Supplemental General Fund Expenditures by Function 5. Summary of Special Education Fund by Function 6. Instruction Expenditures (1000) 7. Student and Instructional Support Expenditures (2100 & 2200) 8. General Administration Expenditures (2300) 9. School Administration Expenditures (2400) 10. Operations and Maintenance Expenditures (2600) 11. Other Costs (2500 & 2900: Other Supplemental Services) (3000: Non-Instruction Services) 12. Capital Improvements (4000) 13. Debt Services (5000) 14. Miscellaneous Information Unencumbered Cash Balance by Fund 15. Reserve Funds Unencumbered Cash Balance 16. Other Information - FTE 17. Miscellaneous Information Mill Rates by Fund 18. Other Information – Assessed Valuation and Bonded Indebtedness Note: The FTE (full time equivalency) used in this report to calculate the “Amount Per Pupil” is defined as following: Enrollment (FTE) includes the enrollment of the district used for state aid and budget authority, and all other preschool enrollment and kindergarten students attending full time.
6
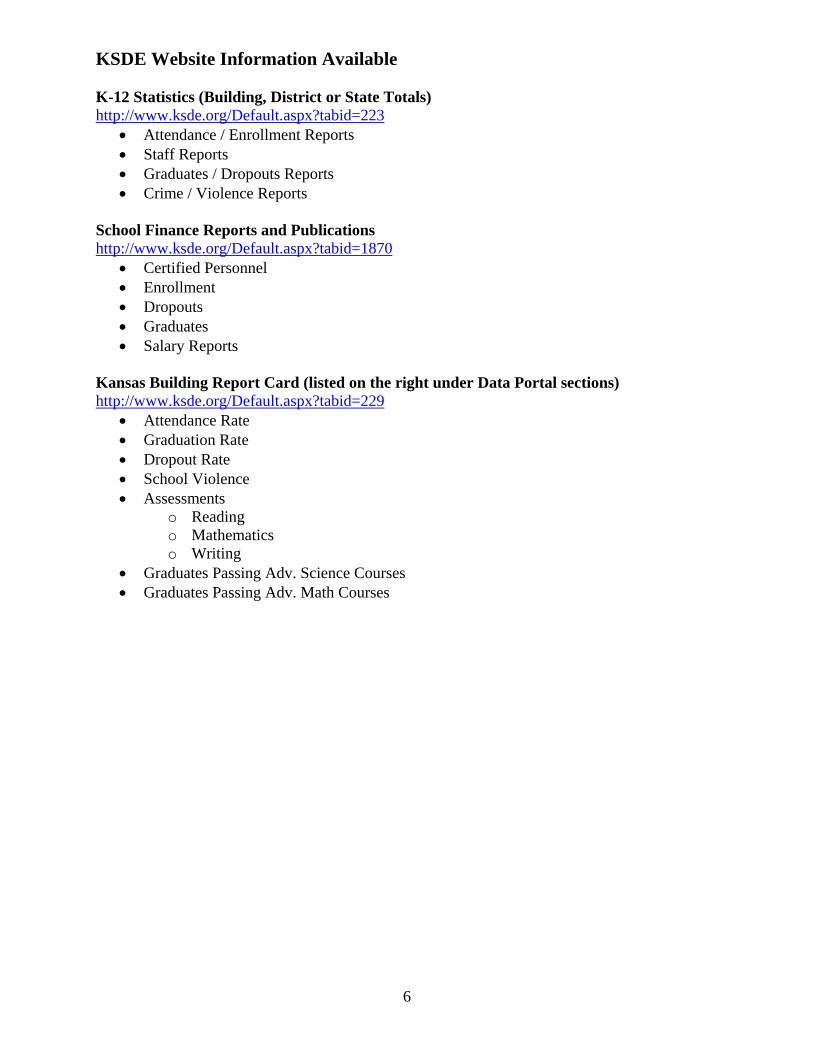
KSDE Website Information Available K-12 Statistics (Building, District or State Totals) http://www.ksde.org/Default.aspx?tabid=223
• Attendance / Enrollment Reports • Staff Reports • Graduates / Dropouts Reports • Crime / Violence Reports
School Finance Reports and Publications http://www.ksde.org/Default.aspx?tabid=1870
• Certified Personnel • Enrollment • Dropouts • Graduates • Salary Reports
Kansas Building Report Card (listed on the right under Data Portal sections) http://www.ksde.org/Default.aspx?tabid=229
• Attendance Rate • Graduation Rate • Dropout Rate • School Violence • Assessments
o Reading o Mathematics o Writing
• Graduates Passing Adv. Science Courses • Graduates Passing Adv. Math Courses

USD# 292
Summary of Total Expenditures By Function(All Funds)
% % % % %2006-2007 of 2007-2008 of inc/ 2008-2009 of inc/
Actual Tot Actual Tot dec Budget Tot dec
Instruction 1,322,042 62% 1,383,732 66% 5% 1,547,940 60% 12%
Student & Instructional Support 38,447 2% 37,386 2% -3% 101,119 4% 170%
General Administration 120,938 6% 109,380 5% -10% 119,725 5% 9%
School Administration (Building) 149,936 7% 91,424 4% -39% 97,500 4% 7%
Operations & Maintenance 284,386 13% 211,405 10% -26% 265,126 10% 25%
Capital Improvements 2,714 0% 20,989 1% 673% 85,000 3% 305%
Debt Services 0 0% 0 0% 0% 0 0% 0%
Other Costs 224,157 10% 234,598 11% 5% 345,762 13% 47%
Total Expenditures 2,142,620 100% 2,088,914 100% -3% 2,562,172 100% 23%
Amount per Pupil $14,284 $14,406 1% $22,280 55%
Note: Percentages on charts are within +-1% due to rounding used. Pie graph percentages may differ from charts for this reason also.
Further definition of what goes into each category:Instruction - 1000 Operations & Maintenance - 2600Student & Instructional Support - 2100 & 2200 Other Costs - 2500, 2900 and 3000 and all others not included elsewhereGeneral Administration - 2300 Capital Improvements - 4000School Administration (Building) 2400 Debt Services 5100 Transfers 5200
The funds that are included in the categories above are: General, Supplemental General, Bilingual Education, At Risk(4yr Old), At Risk(K-12), Virtual Education, Capital Outlay, Driver Education, Extraordinary School Program, Summer School, Special Education, Vocational Education, Professional Development, Bond & Interest #1, Bond & Interest #2, No-Fund Warrant, Special Assessment, Parent Education, School Retirement, Student Materials Revolving & Textbook Rental, Tuition Reimbursement, Gifts/Grants, KPERS Special Retirement Contribution, Contingency, Special Liability Expense, Federal Funds, Adult Education, Adult Supplemental Education, Area Vocational Education, and Special Education Coop.
School Administration (Building) - 2400 Debt Services - 5100 Transfers - 5200
0
200,000
400,000
600,000
800,000
1,000,000
1,200,000
1,400,000
1,600,000
1,800,000
Instruction Student & Instructional Support
General Administration
School Administration
(Building)
Operations & Maintenance
Capital Improvements
Debt Services Other Costs
Summary of Total Expenditures By Function (All Funds)
2006-2007
2007-2008
2008-2009
Instruction60%
Student & Instructional Support4%
General Administration5%
School Administration (Building)
4%
Operations & Maintenance10%
Capital Improvements3%
Other Costs14%
2008-2009 Summary of Total Expenditures By Function(All Funds)
Instruction
Student & Instructional Support
General Administration
School Administration (Building)
Operations & Maintenance
Capital Improvements
Debt Services
Other Costs
10/8/2008 2:02 PM Sumexpen.xls Page 1 of 19

USD# 292
Summary of General Expendituresby Function
% % % % %2006-2007 of 2007-2008 of inc/ 2008-2009 of inc/
Actual Tot Actual Tot dec Budget Tot dec
Instruction 830,395 61% 865,162 64% 4% 725,437 59% -16%
Student & Instructional Support 27,419 2% 31,656 2% 15% 30,600 3% -3%
General Administration 115,363 8% 97,101 7% -16% 105,525 9% 9%
School Administration (Building) 140,905 10% 82,907 6% -41% 82,000 7% -1%
Operations & Maintenance 140,625 10% 142,758 11% 2% 154,361 13% 8%
Capital Improvements 0 0% 0 0% 0% 0 0% 0%
Other Costs 112,857 8% 130,043 10% 15% 125,268 10% -4%
Total Expenditures 1,367,564 100% 1,349,627 100% -1% 1,223,191 100% -9%
Amount per Pupil $9,117 $9,308 2% $10,636 14%
The Summary of General Fund Expenditures chart information comes from pages 6-13 and only uses the 'General Fund' line items.
600,000
700,000
800,000
900,000
1,000,000
Summary of General Fund Expendituresby Function
2006-2007
2007 2008
0
100,000
200,000
300,000
400,000
500,000
Instruction Student & Instructional
Support
General Administration
School Administration
(Building)
Operations & Maintenance
Capital Improvements
Other Costs
2007-2008
2008-2009
Instruction59%
Student & Instructional Support
2%
General Administration9%
School Administration (Building)
7%
Operations & Maintenance13%
Other Costs10%
2008-2009 Summary of General Fund Expendituresby Function
Instruction
Student & Instructional Support
General Administration
School Administration (Building)
Operations & Maintenance
Capital Improvements
Other Costs
10/8/2008 2:02 PM Sumexpen.xls Page 2 of 19

USD# 292
Summary of Supplemental General Fund Expendituresby Function
% % % % %2006-2007 of 2007-2008 of inc/ 2008-2009 of inc/
Actual Tot Actual Tot dec Budget Tot dec
Instruction 41,593 45% 39,733 46% -4% 63,900 46% 61%
Student & Instructional Support 268 0% 45 0% -83% 0 0% -100%
General Administration 0 0% 2,801 3% 0% 8,200 6% 193%
School Administration (Building) 3,554 4% 0 0% -100% 0 0% 0%
Operations & Maintenance 47,953 51% 41,458 48% -14% 63,500 46% 53%
Capital Improvements 0 0% 0 0% 0% 0 0% 0%
Other Costs 0 0% 2,007 2% 0% 2,500 2% 25%
Total Expenditures 93,368 100% 86,044 100% -8% 138,100 100% 60%
Amount per Pupil $622 $593 -5% $1,201 102%
The Summary of Supplemental General Fund Expenditures chart information comes from pages 6-13 and only uses the 'Supplemental General Fund' line items.
50,000
60,000
70,000
Summary of Supplemental General Fund Expendituresby Function
2006-2007
2007-2008
Instruction46%
General Administration6%
Operations & Maintenance
46%
Other Costs2%
2008-2009 Summary of Supplemental General Fund Expendituresby Function
InstructionStudent & Instructional SupportGeneral AdministrationSchool Administration (Building)Operations & MaintenanceCapital ImprovementsOther Costs
0
10,000
20,000
30,000
40,000
Instruction Student & Instructional
Support
General Administration
School Administration
(Building)
Operations & Maintenance
Capital Improvements
Other Costs
2008-2009
10/8/2008 2:02 PM Sumexpen.xls Page 3 of 19

USD# 292Summary of General and Supplemental General Fund
Expenditures by Function
% % % % %2006-2007 of 2007-2008 of inc/ 2008-2009 of inc/
Actual Tot Actual Tot dec Budget Tot dec
Instruction 871,988 60% 904,895 63% 4% 789,337 58% -13%
Student & Instructional Support 27,687 2% 31,701 2% 14% 30,600 2% -3%
General Administration 115,363 8% 99,902 7% -13% 113,725 8% 14%
School Administration (Building) 144,459 10% 82,907 6% -43% 82,000 6% -1%
Operations & Maintenance 188,578 13% 184,216 13% -2% 217,861 16% 18%
Capital Improvements 0 0% 0 0% 0% 0 0% 0%
Other Costs 112,857 8% 132,050 9% 17% 127,768 9% -3%
Total Expenditures 1,460,932 100% 1,435,671 100% -2% 1,361,291 100% -5%
Amount per Pupil $9,740 $9,901 2% $11,837 20%
The Summary of General and Supplemental General Fund Expenditures chart information comes from pages 6-13 and adds togetherthe 'General Fund' and 'Supplemental General Fund' line items.
400 000
500,000
600,000
700,000
800,000
900,000
1,000,000
Summary of General and Supplemental General FundExpenditures by Function
2006-2007
2007-2008
2008-2009
0
100,000
200,000
300,000
400,000
Instruction Student & Instructional
Support
General Administration
School Administration
(Building)
Operations & Maintenance
Capital Improvements
Other Costs
Instruction58%
Student & Instructional Support
2%
General Administration8%
School Administration (Building)
6%
Operations & Maintenance16%
Other Costs10%
2008-2009 Summary of General and Supplemental General Fund Expenditures by Function
Instruction
Student & Instructional Support
General Administration
School Administration (Building)
Operations & Maintenance
Capital Improvements
Other Costs
10/8/2008 2:02 PM Sumexpen.xls Page 4 of 19

USD# 292
Summary of Special Education Fundby Function
% % % % %2006-2007 of 2007-2008 of inc/ 2008-2009 of inc/
Actual Tot Actual Tot dec Budget Tot dec
Instruction 284,510 100% 295,009 100% 4% 455,598 100% 54%
Student & Instructional Support 0 0% 0 0% 0% 0 0% 0%
General Administration 0 0% 0 0% 0% 0 0% 0%
School Administration (Building) 0 0% 0 0% 0% 0 0% 0%
Operations & Maintenance 0 0% 0 0% 0% 0 0% 0%
Capital Improvements 0 0% 0 0% 0% 0 0% 0%
Other Costs 0 0% 0 0% 0% 0 0% 0%
Total Expenditures 284,510 100% 295,009 100% 4% 455,598 100% 54%
Amount per Pupil $1,897 $2,035 7% $3,962 95%
The Summary of Special Education Fund Expenditures chart information comes from pages 6-13 and only uses the 'Special Education Fund'line items. (Total expenditures excludes Special Ed Coop Fund because it would include expenditures for all schools participating in the Coop.)
250 000300,000350,000400,000450,000500,000
Summary of Special Education Fund Expendituresby Function
2006-2007
2007 2008
050,000
100,000150,000200,000250,000
Instruction Student & Instructional
Support
General Administration
School Administration
(Building)
Operations & Maintenance
Capital Improvements
Other Costs
2007-2008
2008-2009
Instruction100%
2008-2009 Summary of Special Education Fundby Function
Instruction
Student & Instructional Support
General Administration
School Administration (Building)
Operations & Maintenance
Capital Improvements
Other Costs
10/8/2008 2:02 PM Sumexpen.xls Page 5 of 19

USD# 292Instruction Expenditures (1000)
% %2006-2007 2007-2008 inc/ 2008-2009 inc/
Actual Actual dec Budget dec
General 830,395 865,162 4% 725,437 -16%Federal Funds 58,835 60,767 3% 77,044 27%Supplemental General 41,593 39,733 -4% 63,900 61%At Risk (4yr Old) 0 0 0% 9,833 0%At Risk (K-12) 30,619 44,689 46% 50,545 13%Bilingual Education 0 0 0% 0 0%Virtual Education 0Capital Outlay 7,906 22,798 188% 25,000 10%Driver Education 2,584 2,845 10% 5,725 101%Declining Enrollment 0 0 0% 0 0%Extraordinary School Program 0 0 0% 0 0%Food Service 0 0 0% 0 0%Professional Development 0 0 0% 0 0%Parent Education Program 0 0 0% 0 0%Summer School 0 0 0% 0 0%Special Education 284,510 295,009 4% 455,598 54%Cost of Living 0 0 0% 0 0%Vocational Education 10,144 6,760 -33% 73,291 984%Gifts/Grants 0 0 0% 0 0%Special Liability 0 0 0% 0 0%School Retirement 0 0 0% 0 0%Extraordinary Growth Facilities 0 0 0% 0 0%Special Reserve 0 0 0%KPERS Spec. Ret. Contribution 50,855 40,186 -21% 61,567 53%Contingency Reserve 0 0 0%Text Book & Student Material 4,601 5,783 26%Bond & Interest #1 0 0 0% 0 0%Bond & Interest #2 0 0 0% 0 0%No-Fund Warrant 0 0 0% 0 0%Special Assessment 0 0 0% 0 0%Temporary Note 0 0 0% 0 0%
SUBTOTAL 1,322,042 1,383,732 5% 1,547,940 12%Enrollment (FTE)* 150.0 145.0 -3% 115.0 -21%Amount per Pupil 8,814 9,543 8% 13,460 41%p p , , ,
Adult Education 0 0 0% 0 0%Adult Supplemental Education 0 0 0% 0 0%Area Vocational School 0 0 0% 0 0%Tuition Reimbursement 0 0 0% 0 0%Special Education Coop 0 0 0% 0 0%TOTAL 1,322,042 1,383,732 5% 1,547,940 12%
NOTE: Gifts/Grants includes private grants and grants from nonfederal sources.
Amount per pupil excludes the following funds: Area Vocational School, Adult Education, Adult Supplemental Education,Special Education Coop and Tuition Reimbursement.
*E ll t (FTE) i l d th ll t f th di t i t d f t t id d b d t th it d ll th h l ll t
0
200,000
400,000
600,000
800,000
1,000,000
1,200,000
1,400,000
1,600,000
1,800,000
2006-2007 2007-2008 2008-2009
Instruction Expenditures
0100,000200,000300,000400,000500,000600,000700,000800,000900,000
1,000,000
2006-2007 2007-2008 2008-2009
Instruction Expenditures
General
Supplemental General
Special Education
*Enrollment (FTE) includes the enrollment of the district used for state aid and budget authority, and all other preschool enrollmentand kindergarten students attending full time.10/8/2008 2:02 PM Sumexpen.xls Page 6 of 19

USD# 292
Student and Instructional Support Expenditures (2100 & 2200)
% %2006-2007 2007-2008 inc/ 2008-2009 inc/
Actual Actual dec Budget dec
General 27,419 31,656 15% 30,600 -3%Federal Funds 1,942 0 -100% 0 0%Supplemental General 268 45 -83% 0 -100%At Risk (4yr Old) 0 0 0% 0 0%At Risk (K-12) 0 0 0% 0 0%Bilingual Education 0 0 0% 0 0%Virtual Education 0Capital Outlay 0 0 0% 50,000 0%Driver Training 0 0 0% 0 0%Declining Enrollment 0 0 0% 0 0%Extraordinary School Program 0 0 0% 0 0%Food Service 0 0 0% 0 0%Professional Development 6,235 3,513 -44% 17,519 399%Parent Education Program 0 0 0% 0 0%Summer School 0 0 0% 0 0%Special Education 0 0 0% 0 0%Cost of Living 0 0 0% 0 0%Vocational Education 0 0 0% 0 0%Gifts/Grants 0 0 0% 0 0%Special Liability 0 0 0% 0 0%School Retirement 0 0 0% 0 0%Extraordinary Growth Facilities 0 0 0% 0 0%Special Reserve 0 0 0%KPERS Spec. Ret. Contribution 2,583 2,172 -16% 3,000 38%Contingency Reserve 0 0 0%Text Book & Student Material 0 0 0%Bond & Interest #1 0 0 0% 0 0%Bond & Interest #2 0 0 0% 0 0%No-Fund Warrant 0 0 0% 0 0%Special Assessment 0 0 0% 0 0%Temporary Note 0 0 0% 0 0%
SUBTOTAL 38,447 37,386 -3% 101,119 170%Enrollment (FTE)* 150.0 145.0 -3% 115.0 -21%Amount per Pupil 256 258 1% 879 241%p p
Adult Education 0 0 0% 0 0%Adult Supplemental Education 0 0 0% 0 0%Area Vocational School 0 0 0% 0 0%Tuition Reimbursement 0 0 0% 0 0%Special Education Coop 0 0 0% 0 0%TOTAL 38,447 37,386 -3% 101,119 170%Amount per Pupil $282 $282 0% $895 217%
NOTE: Gifts/Grants includes private grants and grants from nonfederal sources.
Amount per pupil excludes the following funds: Area Vocational School, Adult Education, Adult Supplemental Education,Special Education Coop and Tuition Reimbursement.
*Enrollment (FTE) includes the enrollment of the district used for state aid and budget authority, and all other preschool enrollmentand kindergarten students attending full time.
0
20,000
40,000
60,000
80,000
100,000
120,000
2006-2007 2007-2008 2008-2009
Student and Instructional Support Expenditures
10/8/2008 2:02 PM Sumexpen.xls Page 7 of 19
USD# 292
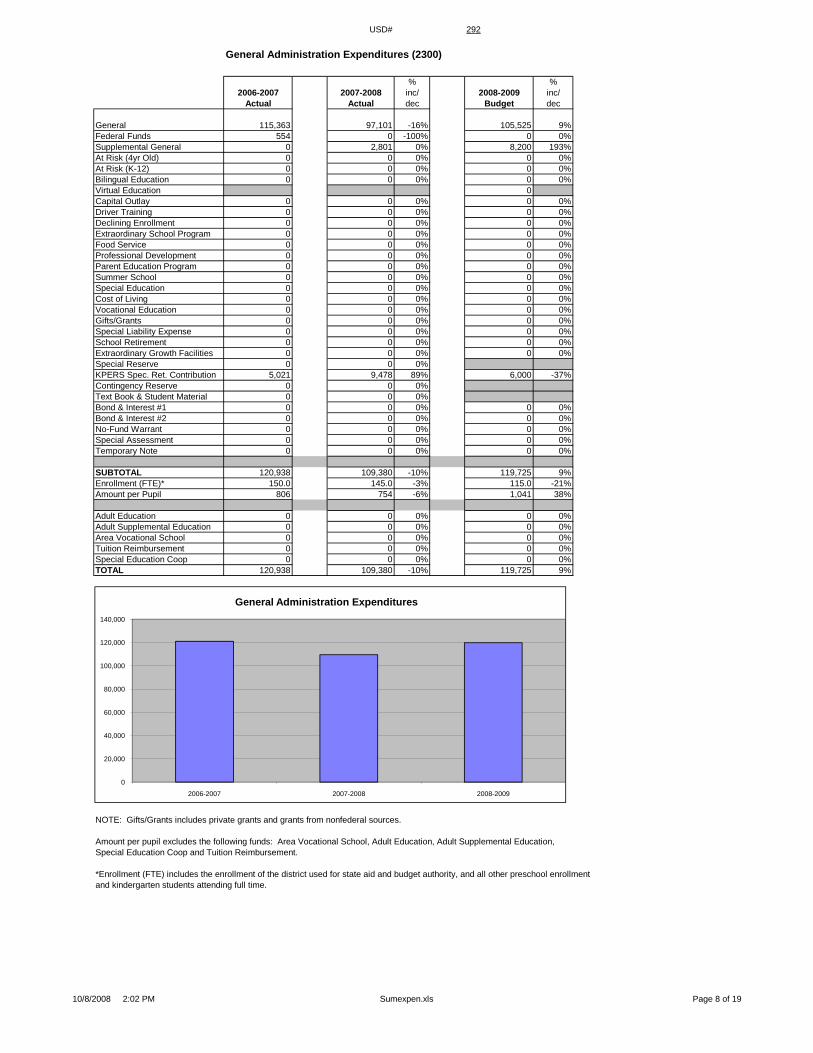
General Administration Expenditures (2300)
% %2006-2007 2007-2008 inc/ 2008-2009 inc/
Actual Actual dec Budget dec
General 115,363 97,101 -16% 105,525 9%Federal Funds 554 0 -100% 0 0%Supplemental General 0 2,801 0% 8,200 193%At Risk (4yr Old) 0 0 0% 0 0%At Risk (K-12) 0 0 0% 0 0%Bilingual Education 0 0 0% 0 0%Virtual Education 0Capital Outlay 0 0 0% 0 0%Driver Training 0 0 0% 0 0%Declining Enrollment 0 0 0% 0 0%Extraordinary School Program 0 0 0% 0 0%Food Service 0 0 0% 0 0%Professional Development 0 0 0% 0 0%Parent Education Program 0 0 0% 0 0%Summer School 0 0 0% 0 0%Special Education 0 0 0% 0 0%Cost of Living 0 0 0% 0 0%Vocational Education 0 0 0% 0 0%Gifts/Grants 0 0 0% 0 0%Special Liability Expense 0 0 0% 0 0%School Retirement 0 0 0% 0 0%Extraordinary Growth Facilities 0 0 0% 0 0%Special Reserve 0 0 0%KPERS Spec. Ret. Contribution 5,021 9,478 89% 6,000 -37%Contingency Reserve 0 0 0%Text Book & Student Material 0 0 0%Bond & Interest #1 0 0 0% 0 0%Bond & Interest #2 0 0 0% 0 0%No-Fund Warrant 0 0 0% 0 0%Special Assessment 0 0 0% 0 0%Temporary Note 0 0 0% 0 0%
SUBTOTAL 120,938 109,380 -10% 119,725 9%Enrollment (FTE)* 150.0 145.0 -3% 115.0 -21%A t P il 806 754 6% 1 041 38%Amount per Pupil 806 754 -6% 1,041 38%
Adult Education 0 0 0% 0 0%Adult Supplemental Education 0 0 0% 0 0%Area Vocational School 0 0 0% 0 0%Tuition Reimbursement 0 0 0% 0 0%Special Education Coop 0 0 0% 0 0%TOTAL 120,938 109,380 -10% 119,725 9%
NOTE: Gifts/Grants includes private grants and grants from nonfederal sources.
Amount per pupil excludes the following funds: Area Vocational School, Adult Education, Adult Supplemental Education,Special Education Coop and Tuition Reimbursement.
*Enrollment (FTE) includes the enrollment of the district used for state aid and budget authority, and all other preschool enrollmentand kindergarten students attending full time.
0
20,000
40,000
60,000
80,000
100,000
120,000
140,000
2006-2007 2007-2008 2008-2009
General Administration Expenditures
10/8/2008 2:02 PM Sumexpen.xls Page 8 of 19
USD# 292
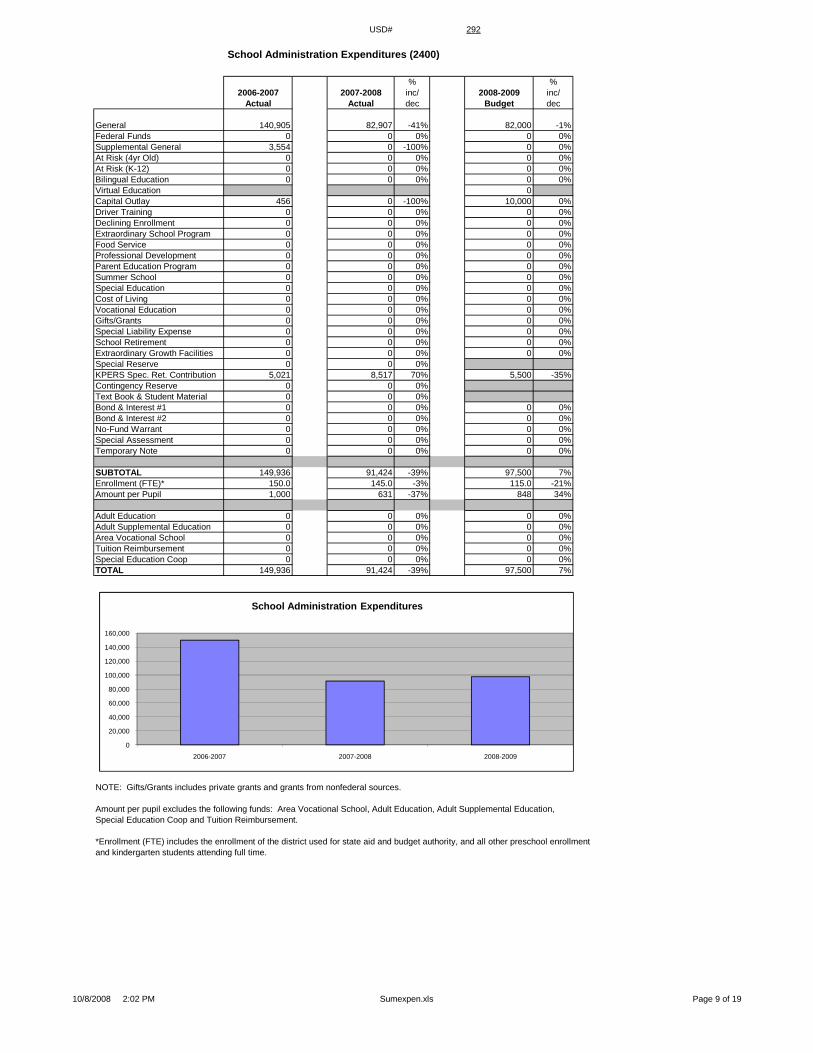
School Administration Expenditures (2400)
% %2006-2007 2007-2008 inc/ 2008-2009 inc/
Actual Actual dec Budget dec
General 140,905 82,907 -41% 82,000 -1%Federal Funds 0 0 0% 0 0%Supplemental General 3,554 0 -100% 0 0%At Risk (4yr Old) 0 0 0% 0 0%At Risk (K-12) 0 0 0% 0 0%Bilingual Education 0 0 0% 0 0%Virtual Education 0Capital Outlay 456 0 -100% 10,000 0%Driver Training 0 0 0% 0 0%Declining Enrollment 0 0 0% 0 0%Extraordinary School Program 0 0 0% 0 0%Food Service 0 0 0% 0 0%Professional Development 0 0 0% 0 0%Parent Education Program 0 0 0% 0 0%Summer School 0 0 0% 0 0%Special Education 0 0 0% 0 0%Cost of Living 0 0 0% 0 0%Vocational Education 0 0 0% 0 0%Gifts/Grants 0 0 0% 0 0%Special Liability Expense 0 0 0% 0 0%School Retirement 0 0 0% 0 0%Extraordinary Growth Facilities 0 0 0% 0 0%Special Reserve 0 0 0%KPERS Spec. Ret. Contribution 5,021 8,517 70% 5,500 -35%Contingency Reserve 0 0 0%Text Book & Student Material 0 0 0%Bond & Interest #1 0 0 0% 0 0%Bond & Interest #2 0 0 0% 0 0%No-Fund Warrant 0 0 0% 0 0%Special Assessment 0 0 0% 0 0%Temporary Note 0 0 0% 0 0%
SUBTOTAL 149,936 91,424 -39% 97,500 7%Enrollment (FTE)* 150.0 145.0 -3% 115.0 -21%A t P il 1 000 631 37% 848 34%Amount per Pupil 1,000 631 -37% 848 34%
Adult Education 0 0 0% 0 0%Adult Supplemental Education 0 0 0% 0 0%Area Vocational School 0 0 0% 0 0%Tuition Reimbursement 0 0 0% 0 0%Special Education Coop 0 0 0% 0 0%TOTAL 149,936 91,424 -39% 97,500 7%
NOTE: Gifts/Grants includes private grants and grants from nonfederal sources.
Amount per pupil excludes the following funds: Area Vocational School, Adult Education, Adult Supplemental Education,Special Education Coop and Tuition Reimbursement.
*Enrollment (FTE) includes the enrollment of the district used for state aid and budget authority, and all other preschool enrollmentand kindergarten students attending full time.
0
20,000
40,000
60,000
80,000
100,000
120,000
140,000
160,000
2006-2007 2007-2008 2008-2009
School Administration Expenditures
10/8/2008 2:02 PM Sumexpen.xls Page 9 of 19

USD# 292
Operations and Maintenance Expenditures (2600)
% %2006-2007 2007-2008 inc/ 2008-2009 inc/
Actual Actual dec Budget dec
General 140,625 142,758 2% 154,361 8%Federal Funds 0 0 0% 0 0%Supplemental General 47,953 41,458 -14% 63,500 53%At Risk (4yr Old) 0 0 0% 0 0%At Risk (K-12) 0 0 0% 250 0%Bilingual Education 0 0 0% 0 0%Virtual Education 0Capital Outlay 93,318 16,076 -83% 20,000 24%Driver Training 1,915 1,167 -39% 23,807 1940%Declining Enrollment 0 0 0% 0 0%Extraordinary School Program 0 0 0% 0 0%Food Service 0 0 0% 0 0%Professional Development 0 0 0% 0 0%Parent Education Program 0 0 0% 0 0%Summer School 0 0 0% 0 0%Special Education 0 0 0% 0 0%Cost of Living 0 0 0% 0 0%Vocational Education 0 0 0% 0 0%Gifts/Grants 0 0 0% 0 0%Special Liability 0 0 0% 0 0%School Retirement 0 0 0% 0 0%Extraordinary Growth Facilities 0 0 0% 0 0%Special Reserve 0 0 0%KPERS Spec. Ret. Contribution 575 9,946 1630% 3,208 -68%Contingency Reserve 0 0 0%Text Book & Student Material 0 0 0%Bond & Interest #1 0 0 0% 0 0%Bond & Interest #2 0 0 0% 0 0%No-Fund Warrant 0 0 0% 0 0%Special Assessment 0 0 0% 0 0%Temporary Note 0 0 0% 0 0%
SUBTOTAL 284,386 211,405 -26% 265,126 25%Enrollment (FTE)* 150.0 145.0 -3% 115.0 -21%A t P il 1 896 1 458 23% 2 305 58%Amount per Pupil 1,896 1,458 -23% 2,305 58%
Adult Education 0 0 0% 0 0%Adult Supplemental Education 0 0 0% 0 0%Area Vocational School 0 0 0% 0 0%Tuition Reimbursement 0 0 0% 0 0%Special Education Coop 0 0 0% 0 0%TOTAL 284,386 211,405 -26% 265,126 25%
NOTE: Gifts/Grants includes private grants and grants from nonfederal sources.
Amount per pupil excludes the following funds: Area Vocational School, Adult Education, Adult Supplemental Education,Special Education Coop and Tuition Reimbursement.
*Enrollment (FTE) includes the enrollment of the district used for state aid and budget authority, and all other preschool enrollmentand kindergarten students attending full time.
0
50,000
100,000
150,000
200,000
250,000
300,000
2006-2007 2007-2008 2008-2009
Operations and Maintenance Expenditures
10/8/2008 2:02 PM Sumexpen.xls Page 10 of 19

USD# 292
Other Costs(2500 & 2900: Other Supplemental Services)
(2700: Transportation)(3000: Non-Instruction Services)
% %2006-2007 2007-2008 inc/ 2008-2009 inc/
Actual Actual dec Budget dec
General 112,857 130,043 15% 125,268 -4%Federal Funds 0 0 0% 0 0%Supplemental General 0 2,007 0% 2,500 25%At Risk (4yr Old) 0 0 0% 0 0%At Risk (K-12) 85 246 189% 270 10%Bilingual Education 0 0 0% 0 0%Virtual Education 0Capital Outlay 0 0 0% 60,000 0%Driver Training 0 0 0% 0 0%Declining Enrollment 0 0 0% 0 0%Extraordinary School Program 0 0 0% 0 0%Food Service 110,509 101,782 -8% 152,724 50%Professional Development 0 0 0% 0 0%Parent Education Program 0 0 0% 0 0%Summer School 0 0 0% 0 0%Special Education 0 0 0% 0 0%Cost of Living 0 0 0% 0 0%Vocational Education 0 0 0% 0 0%Gifts/Grants 0 0 0% 0 0%Special Liability 0 0 0% 0 0%School Retirement 0 0 0% 0 0%Extraordinary Growth Facilities 0 0 0% 0 0%Special Reserve 0 0 0%KPERS Spec. Ret. Contribution 706 520 -26% 5,000 862%Contingency Reserve 0 0 0%Text Book & Student Material 0 0 0%Bond & Interest #1 0 0 0% 0 0%Bond & Interest #2 0 0 0% 0 0%No-Fund Warrant 0 0 0% 0 0%Special Assessment 0 0 0% 0 0%Temporary Note 0 0 0% 0 0%
SUBTOTAL 224,157 234,598 5% 345,762 47%Enrollment (FTE)* 150.0 145.0 -3% 115.0 -21%Amount per Pupil 1,494 1,618 8% 3,007 86%
Adult Education 0 0 0% 0 0%Adult Supplemental Education 0 0 0% 0 0%Area Vocational School 0 0 0% 0 0%Tuition Reimbursement 0 0 0% 0 0%Special Education Coop 0 0 0% 0 0%TOTAL 224,157 234,598 5% 345,762 47%
NOTE: Gifts/Grants includes private grants and grants from nonfederal sources.
Amount per pupil excludes the following funds: Area Vocational School, Adult Education, Adult Supplemental Education,Special Education Coop and Tuition Reimbursement.
*Enrollment (FTE) includes the enrollment of the district used for state aid and budget authority, and all other preschool enrollmentand kindergarten students attending full time.
0
50,000
100,000
150,000
200,000
250,000
300,000
350,000
400,000
2006-2007 2007-2008 2008-2009
Other Costs
10/8/2008 2:02 PM Sumexpen.xls Page 11 of 19

USD# 292
Capital Improvements Expenditures (4000)
% %2006-2007 2007-2008 inc/ 2008-2009 inc/
Actual Actual dec Budget dec
General 0 0 0% 0 0%Federal Funds 0 0 0% 0 0%Supplemental General 0 0 0% 0 0%At Risk (4yr Old) 0 0 0% 0 0%At Risk (K-12) 0 0 0% 0 0%Bilingual Education 0 0 0% 0 0%Virtual Education 0Capital Outlay 2,714 20,989 673% 85,000 305%Driver Training 0 0 0% 0 0%Declining Enrollment 0 0 0% 0 0%Extraordinary School Program 0 0 0% 0 0%Food Service 0 0 0% 0 0%Professional Development 0 0 0% 0 0%Parent Education Program 0 0 0% 0 0%Summer School 0 0 0% 0 0%Special Education 0 0 0% 0 0%Cost of Living 0 0 0% 0 0%Vocational Education 0 0 0% 0 0%Gifts/Grants 0 0 0% 0 0%Special Liability 0 0 0% 0 0%School Retirement 0 0 0% 0 0%Extraordinary Growth Facilities 0 0 0% 0 0%Special Reserve 0 0 0%KPERS Spec. Ret. Contribution 0 0 0% 0 0%Contingency Reserve 0 0 0%Text Book & Student Material 0 0 0%Bond & Interest #1 0 0 0% 0 0%Bond & Interest #2 0 0 0% 0 0%No-Fund Warrant 0 0 0% 0 0%Special Assessment 0 0 0% 0 0%Temporary Note 0 0 0% 0 0%
SUBTOTAL 2,714 20,989 673% 85,000 305%Enrollment (FTE)* 150.0 145.0 -3% 115.0 -21%Amount per Pupil 18 145 700% 739 411%
Adult Education 0 0 0% 0 0%Adult Supplemental Education 0 0 0% 0 0%Area Vocational School 0 0 0% 0 0%Tuition Reimbursement 0 0 0% 0 0%Special Education Coop 0 0 0% 0 0%TOTAL 2,714 20,989 673% 85,000 305%
NOTE: Gifts/Grants includes private grants and grants from nonfederal sources.
Amount per pupil excludes the following funds: Area Vocational School, Adult Education, Adult Supplemental Education,Special Education Coop and Tuition Reimbursement.
*Enrollment (FTE) includes the enrollment of the district used for state aid and budget authority, and all other preschool enrollmentand kindergarten students attending full time.
0
10,000
20,000
30,000
40,000
50,000
60,000
70,000
80,000
90,000
2006-2007 2007-2008 2008-2009
Capital Improvements (4000)
10/8/2008 2:02 PM Sumexpen.xls Page 12 of 19

USD# 292
Debt Services Expenditures (5100)
% %2006-2007 2007-2008 inc/ 2008-2009 inc/
Actual Actual dec Budget dec
General 0 0 0% 0 0%Federal Funds 0 0 0% 0 0%Supplemental General 0 0 0% 0 0%At Risk (4yr Old) 0 0 0% 0 0%At Risk (K-12) 0 0 0% 0 0%Bilingual Education 0 0 0% 0 0%Virtual Education 0Capital Outlay 0 0 0% 0 0%Driver Training 0 0 0% 0 0%Declining Enrollment 0 0 0% 0 0%Extraordinary School Program 0 0 0% 0 0%Food Service 0 0 0% 0 0%Professional Development 0 0 0% 0 0%Parent Education Program 0 0 0% 0 0%Summer School 0 0 0% 0 0%Special Education 0 0 0% 0 0%Cost of Living 0 0 0% 0 0%Vocational Education 0 0 0% 0 0%Gifts/Grants 0 0 0% 0 0%Special Liability 0 0 0% 0 0%School Retirement 0 0 0% 0 0%Extraordinary Growth Facilities 0 0 0% 0 0%Special Reserve 0 0 0%KPERS Spec. Ret. Contribution 0 0 0% 0 0%Contingency Reserve 0 0 0%Text Book & Student Material 0 0 0%Bond & Interest #1 0 0 0% 0 0%Bond & Interest #2 0 0 0% 0 0%No-Fund Warrant 0 0 0% 0 0%Special Assessment 0 0 0% 0 0%Temporary Note 0 0 0% 0 0%
SUBTOTAL 0 0 0% 0 0%Enrollment (FTE)* 150.0 145.0 -3% 115.0 -21%A t P il 0 0 0% 0 0%Amount per Pupil 0 0 0% 0 0%
Adult Education 0 0 0% 0 0%Adult Supplemental Education 0 0 0% 0 0%Area Vocational School 0 0 0% 0 0%Tuition Reimbursement 0 0 0% 0 0%Special Education Coop 0 0 0% 0 0%TOTAL 0 0 0% 0 0%
NOTE: Gifts/Grants includes private grants and grants from nonfederal sources.
Amount per pupil excludes the following funds: Area Vocational School, Adult Education, Adult Supplemental Education,Special Education Coop and Tuition Reimbursement.
*Enrollment (FTE) includes the enrollment of the district used for state aid and budget authority, and all other preschool enrollmentand kindergarten students attending full time.
00000111111
2006-2007 2007-2008 2008-2009
Debt Services (5100)
10/8/2008 2:02 PM Sumexpen.xls Page 13 of 19

USD# 292
Transfers (5200)
% %2006-2007 2007-2008 inc/ 2008-2009 inc/
Actual Actual dec Budget dec
General 276,290 240,117 -13% 317,720 32%Federal Funds 0 0 0% 0 0%Supplemental General 41,632 75,000 80% 101,900 36%At Risk (4yr Old) 0 0 0% 0 0%At Risk (K-12) 0 0 0% 0 0%Bilingual Education 0 0 0% 0 0%Virtual Education 0Capital OutlayDriver Training 0 0 0% 0 0%Declining Enrollment 0 0 0% 0 0%Extraordinary School Program 0 0 0% 0 0%Food Service 0 0 0% 0 0%Professional Development 0 0 0% 0 0%Parent Education Program 0 0 0% 0 0%Summer School 0 0 0% 0 0%Special Education 0 0 0% 0 0%Cost of Living 0 0 0% 0 0%Vocational Education 0 0 0% 0 0%Gifts/Grants 0 0 0% 0 0%Special Liability 0 0 0% 0 0%School Retirement 0 0 0% 0 0%Extraordinary Growth Facilities 0 0 0% 0 0%Special Reserve 0 0 0%KPERS Spec. Ret. Contribution 0 0 0% 0 0%Contingency Reserve 0 0 0%Text Book & Student Material 0 0 0%Bond & Interest #1 0 0 0% 0 0%Bond & Interest #2 0 0 0% 0 0%No-Fund Warrant 0 0 0% 0 0%Special Assessment 0 0 0% 0 0%Temporary Note 0 0 0% 0 0%
SUBTOTAL 317,922 315,117 -1% 419,620 33%Enrollment (FTE)* 150.0 145.0 -3% 115.0 -21%A t P il 2 119 2 173 3% 3 649 68%Amount per Pupil 2,119 2,173 3% 3,649 68%
Adult Education 0 0 0% 0 0%Adult Supplemental Education 0 0 0% 0 0%Area Vocational School 0 0 0% 0 0%Tuition Reimbursement 0 0 0% 0 0%Special Education Coop 0 0 0% 0 0%TOTAL 317,922 315,117 -1% 419,620 33%
NOTE: Gifts/Grants includes private grants and grants from nonfederal sources.
Amount per pupil excludes the following funds: Area Vocational School, Adult Education, Adult Supplemental Education,Special Education Coop and Tuition Reimbursement.
*Enrollment (FTE) includes the enrollment of the district used for state aid and budget authority, and all other preschool enrollmentand kindergarten students attending full time.
0
50,000
100,000
150,000
200,000
250,000
300,000
350,000
400,000
450,000
2006-2007 2007-2008 2008-2009
Transfers (5200)
10/8/2008 2:02 PM Sumexpen.xls Page 14 of 19

USD# 292Miscellaneous Information
Unencumbered Cash Balance by Fund
July 1, 2006 July 1, 2007 July 1, 2008General 0 423 219Federal Funds -21,560 853 3,717Supplemental General 5,507 9,552 5,156At Risk (4yr Old) 0 0 0At Risk (K-12) 0 0 65Bilingual Education 0 0 0Virtual Education 0Capital Outlay 411,911 360,553 372,629Driver Training 26,604 26,916 26,604Declining Enrollment 0 0 0Extraordinary School Program 0 0 0Food Service 34,938 36,341 35,090Professional Development 22,995 18,026 17,019Parent Education Program 0 0 0Summer School 0 0 0Special Education 263,773 258,114 219,711Cost of Living 0 0Vocational Education 15,295 10,151 10,391Gifts/Grants 0 0 0Special Liability 0 0 0School Retirement 0 0 0Extraordinary Growth Facilities 0 0 0Special Reserve 0 0KPERS Spec. Ret. Contribution 0 0 0Contingency Reserve 103,369 103,369Text Book & Student Material 13,818 12,668Bond & Interest 1 0 0 0Bond & Interest 2 0 0 0No Fund Warrant 0 0 0Special Assessment 0 0 0Temporary Note 0 0 0
SUBTOTAL 876,650 836,966 690,601Enrollment (FTE)* 150.0 145.0 115.0Amount per Pupil 5,844 5,772 6,005
Adult Education 0 0 0Adult Supplemental Education 0 0 0Area Vocational School 0 0 0Tuition Reimbursement 0 0 0Special Education Coop 0 0 0TOTAL 876,650 836,966 690,601
NOTE: Gifts/Grants includes private grants and grants from nonfederal sources.
Amount per pupil excludes the following funds: Area Vocational School, Adult Education, Adult Supplemental Education,Special Education Coop and Tuition Reimbursement.
*Enrollment (FTE) includes the enrollment of the district used for state aid and budget authority, and all other preschool enrollmentand kindergarten students attending full time.
0
100,000
200,000
300,000
400,000
500,000
600,000
700,000
800,000
900,000
1,000,000
July 1, 2006 July 1, 2007 July 1, 2008
Unencumbered Cash Balances by Fund
10/8/2008 2:02 PM Sumexpen.xls Page 15 of 19

USD# 292
Reserve FundsUnencumbered Cash Balance
July 1, 2006 July 1, 2007Special Reserve 0 0TOTAL OTHER 0 0Amount per Pupil $0 $0
*School districts are authorized by law to self insure rather than purchase insurance for the following categories: Worker's Comp,Health Insurance, Life Insurance, Property and Casualty (Risk Management) and Disability Income Insurance. Monies are placedin the Self Insured Fund to pay for claims which may arise from the categories listed above.
0
0
0
0
0
1
1
1
1
1
1
July 1, 2006 July 1, 2007
Unencumbered Cash Balances by Fund (Reserve Funds Only)
10/8/2008 2:02 PM Sumexpen.xls Page 16 of 19

USD# 292Other Information
2004-2005 2005-2006 % 2006-2007 % 2007-2008 % 2008-2009 %Actual Actual inc/ Actual inc/ Actual inc/ Budget inc/
dec dec dec dec
Enrollment (FTE)* 183.5 165.0 -10% 136.5 -17% 132.5 -3% 113.0 -15%
Enrollment (FTE)** 186.2 168.0 -10% 150.0 -11% 145.0 -3% 115.0 -21%Number of Students - Free Meals 59 46 -22% 23 -50% 27 17% 26 -4%Number of Students - Reduced Meals 26 33 27% 25 -24% 13 -48% 24 85%
0.0
20.0
40.0
60.0
80.0
100.0
120.0
140.0
160.0
180.0
200.0
2004-2005 2005-2006 2006-2007 2007-2008 2008-2009
Enrollment (FTE)* for Budget Authority
140.0160.0180.0200.0
Enrollment (FTE)** Used for Calculating "Amount Per Pupil"
*FTE for state aid and budget authority purposes for general fund (excludes 4 yr old at-risk).
** FTE includes 9/20 enrollment used for state aid purposes and adding the additional FTE for preschool programs, headstart, and all-daykindergarten. For example, preschool students attending half days on September 20th would be counted as .5 FTE. Kindergartenstudents attending full time every day would be counted as 1.0 FTE.
0
10
20
30
40
50
60
70
2004-2005 2005-2006 2006-2007 2007-2008 2008-2009
Low Income Students
Free Meals
Reduced Meals
0.020.040.060.080.0
100.0120.0
2004-2005 2005-2006 2006-2007 2007-2008 2008-2009
10/8/2008 2:02 PM Sumexpen.xls Page 17 of 19

USD# 292
Miscellaneous InformationMill Rates by Fund
2006-2007 2007-2008 2008-2009Actual Actual Budget
General 20.000 20.000 20.000Supplemental General 8.645 12.222 17.828Adult Education 0.000 0.000 0.000Capital Outlay 1.993 1.992 2.000Declining Enrollment 0.000 0.000 0.000Cost of Living 0.000 0.000 0.000Special Liability 0.000 0.000 0.000School Retirement 0.000 0.000 0.000Extraordinary Growth Facilities 0.000 0.000 0.000Bond & Interest 1 0.000 0.000 0.000Bond & Interest 2 0.000 0.000 0.000No Fund Warrant 0.000 0.000 0.000Special Assessment 0.000 0.000 0.000Temporary Note 0.000 0.000 0.000TOTAL USD 30.638 34.214 39.828Historical Museum 0.000 0.000 0.000Public Library Board 0.000 0.000 0.000Public Library Brd & Emp Benf 0.000 0.000 0.000Recreation Commission 0.000 0.000 0.000Recreation Commission Employee Benefit 0.000 0.000 0.000TOTAL OTHER 0.000 0.000 0.000
15.000
20.000
25.000
30.000
35.000
40.000
45.000
Total USD Mill Rates
General50%
Supplemental General45%
Capital Outlay5%
2008-2009 Miscellaneous InformationMill Rates by Fund (Total USD)
General
Supplemental General
Adult Education
Capital Outlay
Special Liability
School Retirement
Declining Enrollment
Cost of Living
Bond & Interest 1
Bond & Interest 2
Extraordinary Growth Facilities
No Fund Warrant
Special Assessment
Temporary Note
0.000
5.000
10.000
5 000
2006-2007 2007-2008 2008-2009
10/8/2008 2:02 PM Sumexpen.xls Page 18 of 19

USD# 292Other Information
2006-2007 2007-2008 2008-2009Actual Actual Budget
Assessed Valuation $12,613,876 $12,346,436 $13,015,403
Bonded Indebtedness $0 $0 $0
$0
$2,000,000
$4,000,000
$6,000,000
$8,000,000
$10,000,000
$12,000,000
$14,000,000
2006-2007 2007-2008 2008-2009
Assessed Valuation
$0
$0
$0
$0
$1
$1
$1
$1
$1
$1
Bonded Indebtedness
$0
$0
2006-2007 2007-2008 2008-2009
10/8/2008 2:02 PM Sumexpen.xls Page 19 of 19