Embed Size (px)
Citation preview

USCGC Healy Data FileFormats for HLY1002
Dale Chayes, Lamont-Doherty Earth Observatory ofColumbia University <[email protected]>
Steve Roberts, National Center forAtmospheric Research <[email protected]>
Tom Bolmer , Woods Hole Oceanographic Institution <[email protected]>

USCGC Healy Data File Formats for HLY1002by Dale Chayes, Steve Roberts, and Tom Bolmer
Publication date September, 06 2010

iii
Table of ContentsPreface ...................................................................................................................... vii1. Introduction .............................................................................................................. 12. End of Cruise Archive Directory Structure ..................................................................... 2
One (1) Minute Averaged Data ............................................................................... 2Ice Observations ................................................................................................... 2LDS_Data ............................................................................................................ 2master.index ......................................................................................................... 2master.md5 .......................................................................................................... 3Metadata ............................................................................................................. 3Plots ................................................................................................................... 3Raw .................................................................................................................... 3Satellite Images .................................................................................................... 3SCS_Data ............................................................................................................ 3sea_ice_movie ...................................................................................................... 3
3. SCS Primary Data ..................................................................................................... 4Overview of SCS records ....................................................................................... 4Meteorological data ............................................................................................... 4
Air Temperature Sensors ................................................................................ 4Wind Sensors ............................................................................................... 6Solar Sensors ............................................................................................... 9
Oceanograpahic Data .......................................................................................... 10Flow Through Sensors ................................................................................. 10Sonar Data ................................................................................................. 18Winches ..................................................................................................... 20
Navigational Data ................................................................................................ 21POS/MV .................................................................................................... 21Ashtech ADU5 (SCS) .................................................................................. 26P-Code (SCS) ............................................................................................. 29Glonass (SCS) ............................................................................................ 34Sperry MX512 ........................................................................................... 36Sperry Gyroscopes ...................................................................................... 39IBS way points (SCS) .................................................................................. 40Sperry SRD500 Doppler Speed Log (SCS) ...................................................... 41SV2000 (SCS) ............................................................................................ 41
4. RAW Data files ...................................................................................................... 43ADCP DATA ..................................................................................................... 43
UHDAS ADCP Data ................................................................................... 43RDI VMDAS ADCP Data ............................................................................ 44
Bathymetry Data ................................................................................................. 45Kongsberg EM122 multibeam ....................................................................... 45KNUDSEN 320B/R ..................................................................................... 46
CTD ................................................................................................................. 46Environmental_sensors ......................................................................................... 47Expendable Bathythermograph (XBT) Data ............................................................. 47
Sippican MK21 files (XBT, XCTD, etc.) Files .................................................. 47Sippican MK21 files XCTD Files .................................................................. 48Turo Devil XBT files ................................................................................... 50
Expendable CTD (XCTD) .................................................................................... 505. Lamont Data System (LDS) Primary Data .................................................................... 51
Navigational Data ................................................................................................ 51Thales (Ashtech) ADU5 GPS ....................................................................... 51Trimble AG132 Differential Global Positioning System (GPS) ........................... 54Applanix POS/MV-320 Global Positioning System (GPS) ................................... 59Bridge IBS Navigation System Way Points ...................................................... 64Automatic Identification System (AIS) (LDS) ................................................. 66

USCGC Healy Data FileFormats for HLY1002
iv
Multibeam Data .................................................................................................. 67Real-time position for the SeaBeam .............................................................. 67Raw Multibeam data ................................................................................. 67Multibeam Center Beam (LDS) .................................................................... 67Sound Speed at the keel .............................................................................. 68
BGM-3 Gravity Meter data ................................................................................... 69LDS Events ........................................................................................................ 69Images ............................................................................................................... 69
Aloft Con Images ........................................................................................ 69Fantail Images ............................................................................................ 69
SIO TSG and MET Data ...................................................................................... 70All SIO TSG and MET Data ......................................................................... 70SIO TSG data from BioChem Lab ................................................................. 70
Winches ............................................................................................................ 71Starboard Winch ......................................................................................... 71Aft Winch .................................................................................................. 71
C-Nav Globally Corrected Differential GNSS ........................................................... 72C-Nav Globally Corrected Differential GNSS - Starboard ................................... 72C-Nav Globally Corrected Differential GNSS - Port .......................................... 72
6. SCS Derived Data ................................................................................................... 74Air temperature (Derived) ..................................................................................... 74HCO Met3A Air Temperatures (Derived) ................................................................ 74True Wind, Ship's Port Yardarm (Derived) ............................................................. 75True Wind, Ship's Starboard Yardarm (Derived) ...................................................... 76Shipboard Automated Meteorological and Oceanographic Systems (SAMOS) deriveddata ................................................................................................................... 77
Example SAMOS format (scalar) ................................................................... 77Example SAMOS format (data in degrees) ....................................................... 78SAMOS Data Designator Keys ...................................................................... 78
A. Revision History .................................................................................................... 81

v
List of Tables2.1. Archive Directory Structure ...................................................................................... 23.1. SCS Time Stamp Format ......................................................................................... 43.2. Meteorological data from the Bridge .......................................................................... 53.3. Jack Staff Air Temperature ....................................................................................... 53.4. HCO Met3A Air Temperature, Relative Humidity, Barometric Pressure, and Precipitation................................................................................................................................... 63.5. Ship Wind Sensor, Port Yardarm .............................................................................. 63.6. Ship Wind Sensor, Starboard Yardarm ........................................................................ 73.7. Ultrasonic Wind Sensor, Starboard Yardarm ................................................................ 73.8. Ultrasonic Wind Sensor, Jack staff ............................................................................ 83.9. Ultrasonic Wind Sensor, HCO Shack ........................................................................ 93.10. Surface PAR ....................................................................................................... 93.11. Surface Solar Radiometers ................................................................................... 103.12. TSG, SBE-45, BioChem ...................................................................................... 113.13. Sea Surface Temperature ...................................................................................... 123.14. Flow Meter ........................................................................................................ 123.15. Flow Meter ........................................................................................................ 133.16. Bow Incubator Water Temperature Temperature ........................................................ 133.17. Dissolved Oxygen ............................................................................................... 143.18. Dissolved Oxygen ............................................................................................... 143.19. Sea Surface Temperature ...................................................................................... 153.20. Fluorometer B ..................................................................................................... 163.21. ISUS Nitrate sensor small file ................................................................................ 163.22. ISUS Nitrate Sensor 3V large file ........................................................................... 173.23. SSW Pressure ..................................................................................................... 173.24. SB2112 Center Beam ........................................................................................... 183.25. EM122 Center Beam ............................................................................................ 193.26. Knudsen PKEL recor ........................................................................................... 193.27. Starboard Winch Wire .......................................................................................... 203.28. Aft Winch Wire .................................................................................................. 213.29. POS/MV GGA Record (SCS) ................................................................................ 223.30. POS/MV Pseudo range noise statistics (SCS) ............................................................ 233.31. POS/MV Heading (SCS) ...................................................................................... 233.32. POS/MV PASHR (SCS) ....................................................................................... 243.33. POS/MV VTG (SCS) ........................................................................................... 253.34. POS/MV ZDA (SCS) ........................................................................................... 253.35. ADU5 Attitude (SCS) .......................................................................................... 263.36. ADU5 GGA Record (SCS) ................................................................................... 273.37. ADU5 GLL Record (SCS) .................................................................................... 283.38. ADU5 GLL Record (SCS) .................................................................................... 283.39. Centurion (Aft P-Code) GGA Record (SCS) ............................................................. 293.40. Centurion P-Code GLL Record (SCS) ..................................................................... 303.41. Centurion VTG (SCS) .......................................................................................... 313.42. Centurion ZDA (SCS) .......................................................................................... 313.43. Rockwell-Collins P-Code GGA Record (SCS) .......................................................... 323.44. Rockwell-Collins P-Code GLL Record (SCS) ........................................................... 333.45. Centurion VTG (SCS) .......................................................................................... 343.46. Centurion (Aft P-Code) GGA Record (SCS) ............................................................. 343.47. Glonass/GPS GLL Record (SCS) ........................................................................... 353.48. MX512 GGA Record (SCS) .................................................................................. 363.49. MX512 GLL Record (SCS) ................................................................................... 373.50. MX512 GLL Record (SCS) ................................................................................... 383.51. MX512 VTG (SCS) ............................................................................................. 383.52. MK27 Gyro Record (SCS) .................................................................................... 393.53. MK39 Gyro Record (SCS) .................................................................................... 40

USCGC Healy Data FileFormats for HLY1002
vi
3.54. IBS way points Record (SCS) ................................................................................ 403.55. SRD500 Record (SCS) ......................................................................................... 413.56. SV2000 Record (SCS) .......................................................................................... 424.1. Top Level UHDAS Directory Structure: Data for Scientists ........................................... 444.2. ADCP 75 File Types ............................................................................................. 444.3. ADCP 150 File Types ............................................................................................ 454.4. Kongsberg EM122 Raw data file types ..................................................................... 464.5. Knudsen File Types ............................................................................................... 464.6. CTD File Types .................................................................................................... 464.7. Environmental Chamber Status Files ......................................................................... 474.8. Sipppican XBT File Types ...................................................................................... 484.9. Sipppican XBT File Types ...................................................................................... 494.10. Devil XBT File Types .......................................................................................... 504.11. XBT File Types .................................................................................................. 505.1. ADU5 GLL Message ............................................................................................. 515.2. ADU5 $VTG Message ........................................................................................... 525.3. ADU5 $GPGGA Message ...................................................................................... 535.4. ADU5 HTD Record (SCS) ..................................................................................... 535.5. ADU5 GPPAT Record Format (LDS) ....................................................................... 535.6. AG132 $GPGGA Message ..................................................................................... 555.7. AG132 $GPGGA Message ..................................................................................... 565.8. AG132 GLL Message ............................................................................................ 565.9. AG132 $GPGSVMessage ....................................................................................... 575.10. Trimble AG132 ZDA (LDS) ................................................................................. 585.11. AG132 $GPRMC Message .................................................................................... 585.12. Trimble AG132 PTNLDG (LDS) ........................................................................... 595.13. Applanix POS/MV-320 ZDA (LDS) ....................................................................... 605.14. POS/MV PASHR (LDS) ....................................................................................... 615.15. POS/MV PRIDD (LDS) ....................................................................................... 615.16. POS/MV INGST (LDS) ........................................................................................ 625.17. POS/MV $INGGA Message .................................................................................. 625.18. POS/MV HTD Record (LDS) ................................................................................ 635.19. POS/MV $VTG Message ...................................................................................... 645.20. Sperry IBS NVRTE Record (LDS) ......................................................................... 655.21. Sperry IBS NVXDR Record (LDS) ........................................................................ 655.22. Sperry IBS NVWPL ............................................................................................ 665.23. LDS Kongsberg EM multibeam center beam Message ................................................ 685.24. LDS sound speed at the keel for the Kongsberg EM122 multibeam .............................. 685.25. BGM3 Gravity meter log file format ...................................................................... 695.26. All SIO TSG and MET Data ................................................................................. 705.27. Data from the Aft winch (LDS ) ............................................................................ 715.28. Data from the Aft winch (LDS ) ............................................................................ 726.1. Derived air temperature .......................................................................................... 746.2. HCO Met3A Air Temperatures (Derived) .................................................................. 756.3. True Wind, Ship Port Yardarm (Derived) ................................................................. 756.4. True Wind, Ship Starboard Yardarm (Derived) ........................................................... 766.5. Example SAMOS data record (scalar) ....................................................................... 776.6. Example SAMOS data record (degrees) .................................................................... 786.7. SAMOS File Name Components .............................................................................. 786.8. SAMOS Data Types .............................................................................................. 79A.1. Revision History of the Healy Data Formats Document ............................................... 81

vii
PrefaceAlthough the science component of many cruises on the Healy, including this one, are fundedfrom various sources, science technical support is largely funded by the Logistics and ResearchSupport within the Arctic Section of the US National Science Foundation Office of Polar Programsthrough grants to the Lamont-Doherty Earth Observatory of Columbia University, the UniversityCorporation for Atmospheric Research, the Woods Hole Oceanographic Institution, Scripps Institutionof Oceanography, and through congressionally mandated budget authority for the US Coast Guardpolar icebreakers.
The opinions contained in this document are those of the authors and do not represent the officialpositions of any organization.
This document was authored using SyncroSoft oXygen Version 10.2 and a DocBook V5 DTD. July8, 2010 switched to oXygen 11.2

1
Chapter 1. IntroductionThis document provides detailed documentation about the individual file formats for data files fromthe USCGC Healy. Driven by science needs and ever changing technology, the file types, formats, andcontents change over time and as a result, this document is updated frequently, often for each cruise.If you have questions about a data set, please be sure that you are working with the matching formatdescription and then don't hesitate to get in touch with us.
Since these files are frequently encountered on post-cruise data distribution disks, there is a briefoverview of the file structure on these disks.
For historical and organizational reasons, digital data on Healy are logged in on two different datalogging systems. Some data are logged with the NOAA Ship's Computer System (SCS) software whichwas implemented to replace the Wonderware system from EDI, Inc. which was provided as part thedelivery by the shipyard and quickly proved to have untenable problems. The Lamont Data System(LDS) is used for a number of data types, particularly where real-time performance is required suchas logging the multibeam data from the Kongsberg EM122.
In addition some data sources are logged by system-specific data logging mechanisms (e.g. UHDASfor the ADCPCs, WDS for Terrascan satellite down-link data, and Echo Control for the Knudsen 320.)
Discussion about specific systems, sensors, calibrations, offsets, logging history, and issuesencountered during a cruise are covered in the data report for each cruise.

2
Chapter 2. End of Cruise ArchiveDirectory Structure
This chapter provides a brief overview of the directory structure on the "boomerang" drive (external,USB "pocket" disk) that is provided to the chief scientist at the end of each cruise. There are five top-level directories on the disk. The contents of these directories are briefly described in this chapter.
More details about the content of the directories is provided along with the data file descriptions insubsequent chapters
Table 2.1. Archive Directory Structure
File/Directory Name Description
1_Minute_Averaged_Data Summary digital data
ice_observations Data entered by ice observers if there areobservers on board and they use our form.
LDS_Data Data logged by LDS
master.index Text file containing a list of all the files on the disk
master.md5 Text file continuing the MD5 checksums for allthe files
Meta_Data Directory containing descriptions about the data
plots Directory of various kinds of data plots
Raw Raw data from some sub-systems
Satellite_Images Directory containing satellite images
SCS_Data Directory of data logged by SCS
sea_ice_movie Directory of movie(s) made from satellite imagesshowing sea ice motion during the cruise.
One (1) Minute Averaged DataThe raw data in the LDS, SCS and Raw directories is time-stamped and logged as it is provided bythe sensors and sources. In many cases data comes once per second (or faster.) For many applicationsa smaller data set is desirable. Therefore we provide one minute data. This data set is created bycalculating the average values for each minute.
Ice ObservationsThis directory contains the data files recorded by ice observers using our web-based forms during thecruise. If there were no ice observers or if they did not use our forms, this directory may be empty.
LDS_DataThis directory contains all data logged by the Lamont Data System (LDS) is in subdirectories underLDS_Data
master.indexA text file containing a complete list of all of the files in the archive.

End of Cruise ArchiveDirectory Structure
3
master.md5A text file containing the names of all the files along with their MD5 checksums. Using the checksumsyou can determine if the contents of a file have been modified.
MetadataThis directory contains descriptions of the data, the data system, and data formats are included in theMetadata
PlotsA collection of image files containing plots of various data types.
RawData that is logged to disk by sensor software (such as VMDAS for ADCPs) is found here.
Satellite ImagesImage data received from Navy DMSP and NOAA HRPT satellites.
SCS_DataAll data (raw and derived) logged by SCS is in subdirectories under SCS_Data
sea_ice_movieIf there was sea ice in the area of the cruise and a movie was made, this directory contains one ormore QuickTime movies from satellite image data and the source data files from which the movieswere made.

4
Chapter 3. SCS Primary DataThis section describes the format of raw data files logged by SCS.
Overview of SCS recordsIn the Healy implementation most of the SCS data are received as asynchronous serial messages byway of individual RS-232-C connections from the source device to the logging computer via a serialmultiplexer. Each SCS data record has a time tag prepended (added in front of the data.) Time tagsare in the form:
MM/DD/YYYY,hh:mm:ss.sss
Table 3.1. SCS Time Stamp Format
Content Description
MM Two digit month of the year, January == 1
DD Two digits, day of the month, January 1 == 1
YYYY Four digit year in the modern calendar
hh Two digits for hour of the day (0 - 23
mm Two digits minutes of the hour: 00 - 59
ss.sss Seconds w/ 1 millisecond resolution
SCS time stamps are derived from the underlying Windows operating system time of day clock. Theoperating system clock is synchronized to UTC using a pair of on board GPS station clocks and thexntp protocol. The accuracy of this time stamp is in the range of 50-200 milliseconds. All time stampsin SCS are in Universal Coordinated Time (UTC) sometimes known as GMT or Zulu.
The data message follows the time stamp and is terminated with a Carriage Return (0xD) and LineFeed (0xA) end of line (EOL) sequence.
The following example is the centerbeam record derived by LDS and transmitted to SCS on an RS-232-C link: (due to formatting of page and font sizes this record may wrap but it is a single "line.")
04/13/2007,06:49:20.920,$SBCTR,2007,4,13,06:49:09.437,57.158792,-165.664322 ,69.15,60*00
Note: The "comma" after the time stamp and before the $ (dollar sign) which (in this case) is the firstcharacter of the data record. Not all data records start with a dollar sign ($).
Many but not all devices that send serial data to SCS emit more than one type of data record.For instance, most GPS receivers emit several different data records on a single serial port. SCS isconfigured to output each record type to a different data file. This results in many more data files andit is not always possible to accurately determine the exact time of a particular data record.
Meteorological data
Air Temperature Sensors
Meteorological data from the Bridge
Description: Air temperature, relative humidity, air pressure data from the ship's RM Youngmeteorological system sensors on the Flying Bridge (06.)
Directory: SCS_Data/rmyoung_air
SCS Primary Data
5
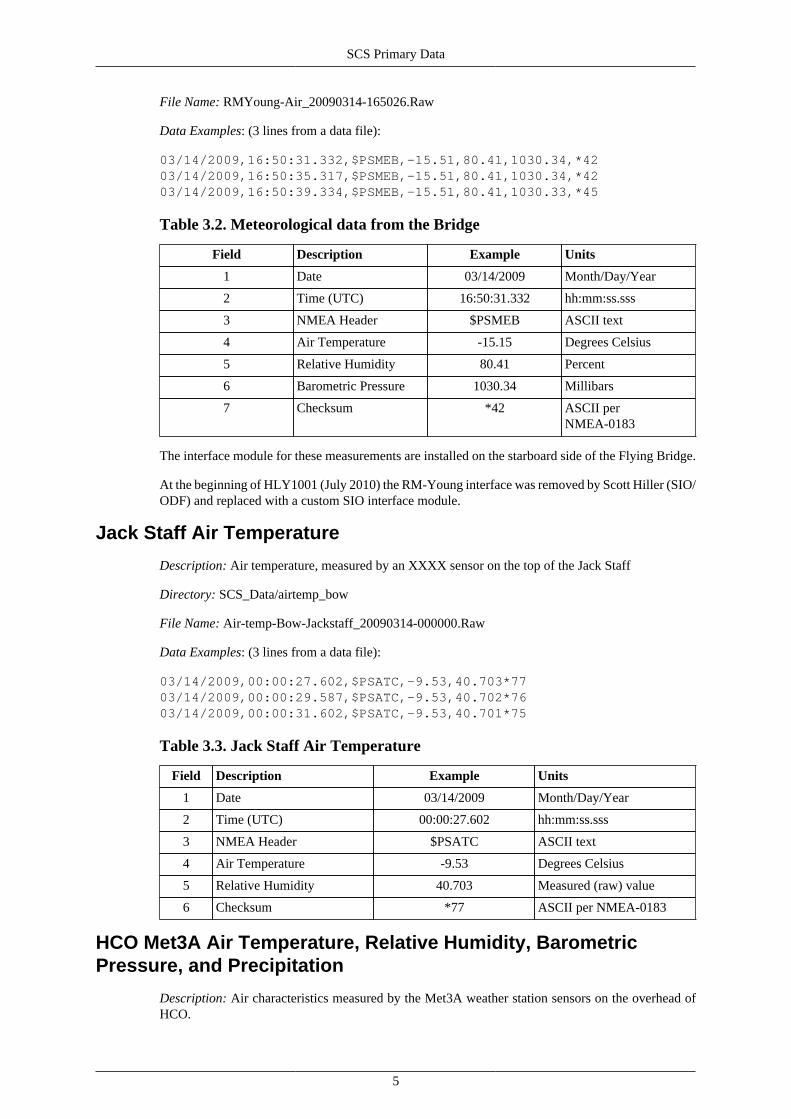
File Name: RMYoung-Air_20090314-165026.Raw
Data Examples: (3 lines from a data file):
03/14/2009,16:50:31.332,$PSMEB,-15.51,80.41,1030.34,*4203/14/2009,16:50:35.317,$PSMEB,-15.51,80.41,1030.34,*4203/14/2009,16:50:39.334,$PSMEB,-15.51,80.41,1030.33,*45
Table 3.2. Meteorological data from the Bridge
Field Description Example Units
1 Date 03/14/2009 Month/Day/Year
2 Time (UTC) 16:50:31.332 hh:mm:ss.sss
3 NMEA Header $PSMEB ASCII text
4 Air Temperature -15.15 Degrees Celsius
5 Relative Humidity 80.41 Percent
6 Barometric Pressure 1030.34 Millibars
7 Checksum *42 ASCII perNMEA-0183
The interface module for these measurements are installed on the starboard side of the Flying Bridge.
At the beginning of HLY1001 (July 2010) the RM-Young interface was removed by Scott Hiller (SIO/ODF) and replaced with a custom SIO interface module.
Jack Staff Air Temperature
Description: Air temperature, measured by an XXXX sensor on the top of the Jack Staff
Directory: SCS_Data/airtemp_bow
File Name: Air-temp-Bow-Jackstaff_20090314-000000.Raw
Data Examples: (3 lines from a data file):
03/14/2009,00:00:27.602,$PSATC,-9.53,40.703*77 03/14/2009,00:00:29.587,$PSATC,-9.53,40.702*76 03/14/2009,00:00:31.602,$PSATC,-9.53,40.701*75
Table 3.3. Jack Staff Air Temperature
Field Description Example Units
1 Date 03/14/2009 Month/Day/Year
2 Time (UTC) 00:00:27.602 hh:mm:ss.sss
3 NMEA Header $PSATC ASCII text
4 Air Temperature -9.53 Degrees Celsius
5 Relative Humidity 40.703 Measured (raw) value
6 Checksum *77 ASCII per NMEA-0183
HCO Met3A Air Temperature, Relative Humidity, BarometricPressure, and Precipitation
Description: Air characteristics measured by the Met3A weather station sensors on the overhead ofHCO.

SCS Primary Data
6
Directory: SCS_Data/met3a_sen
File Name: MET3A-Sen_20090129-173743.Raw
Data Examples: (3 lines from a data file):
01/29/2009,17:37:46.997,$PSMEA,5.23,89.90,1035.61,0.16*4101/29/2009,17:37:48.805,$PSMEA,5.23,89.90,1035.61,0.16*4101/29/2009,17:37:50.612,$PSMEA,5.23,89.90,1035.61,0.16*41
Table 3.4. HCO Met3A Air Temperature, Relative Humidity, BarometricPressure, and Precipitation
Field Description Example Units
1 Date 01/29/2009 Month/Day/Year
2 Time (UTC) 17:37:46.997 hh:mm:ss.sss
3 NMEA Header $PSMEA ASCII text
4 Air Temperature 5.23 Degrees Celsius
5 Relative Humidity 89.90 Percentage
6 Barometric Pressure 1035.61 Millibars
7 Liquid precipitation 0.16 Millimeters of rain
8 Checksum *41 ASCII per NMEA-0183
Wind Sensors
Ship Wind Sensor, Port Yardarm
Description: Relative wind speed and direction data from the ship RM Young mechanical wind birdon the Port side of the main mast yardarm.
Directory: SCS_Data/rmyportwind
File Name: RMYPortWind_20070414-182437.Raw
Data Examples: (3 lines from a data file):
04/14/2007,18:24:38.490,$WIMWV,033,R,028.1,N,A*3604/14/2007,18:24:39.505,$WIMWV,041,R,028.7,N,A*3504/14/2007,18:24:40.521,$WIMWV,034,R,029.4,N,A*35
Table 3.5. Ship Wind Sensor, Port Yardarm
Field Description Example Units
1 Date 04/14/2007 Month/Day/Year
2 Time (UTC) 18:24:38.490 hh:mm:ss.sss
3 NMEA Header $WIMWV ASCII text
4 Wind Direction 033 Angle from the bow in clockwise (compass direction)
5 Direction type R "R" == relative direction
6 Wind Speed 028.1 Speed
7 Wind speed units K "K" == knots (nautical milesper hour)
8 Status A "A" == valid reading

SCS Primary Data
7
Field Description Example Units
9 Separator * ASCII Astrix ("*")
10 Checksum *36 ASCII per NMEA-0183
Ship Wind Sensor, Starboard Yardarm
Description: Relative wind speed and direction data from the ship RM Young mechanical wind birdon the Starboard side of the main mast yardarm.
Directory: SCS_Data/rmstbwind
File Name: RMYStbdWind_20070414-182437.Raw
Data Examples: (3 lines from a data file):
04/14/2007,18:24:38.677,$WIMWV,044,R,025.4,N,A*3E04/14/2007,18:24:39.693,$WIMWV,045,R,025.6,N,A*3D04/14/2007,18:24:40.724,$WIMWV,042,R,025.2,N,A*3E
Table 3.6. Ship Wind Sensor, Starboard Yardarm
Field Description Example Units
1 Date 04/14/2007 Month/Day/Year
2 Time (UTC) 18:24:38.677 hh:mm:ss.sss
3 NMEA Header $WIMWV ASCII text
4 Wind Direction 044 Angle from the bow in clockwise (compass direction)
5 Direction type R "R" == relative direction
6 Wind Speed 025.4 Speed
7 Wind speed units K "K" == knots (nautical milesper hour)
8 Status A "A" == valid reading
9 Separator * ASCII "*"
10 Checksum 3E ASCII per NMEA-0183
Ultrasonic Wind Sensor, Starboard Yardarm
Description: True and relative wind speed and direction data from the ultrasonic anemometer on theStarboard side of the main mast yardarm.
Directory: SCS_Data/wind_mid
File Name: WIND-MID_20090129-173743.Raw
Data Examples: (3 lines from a data file):
01/29/2009,17:37:47.026,$PSWDB,18.00,13.18,124.12,7.87*5C01/29/2009,17:37:48.833,$PSWDB,18.00,13.18,121.95,7.98*5801/29/2009,17:37:50.640,$PSWDB,18.08,13.23,125.38,8.01*54
Table 3.7. Ultrasonic Wind Sensor, Starboard Yardarm
Field Description Example Units
1 Date 01/29/2009 Month/Day/Year (fromSCS)

SCS Primary Data
8
Field Description Example Units
2 Time (UTC) 17:37:47 hh:mm:ss.sss
3 NMEA Header $PSWDB ASCII text
4 Relative Wind Direction 18.00 Angle in degrees from thebow clockwise (compassdirection)
5 Relative Wind Direction 13.18 meters per second (m/s)
6 True Wind Direction 124.12 Degrees, angle from TrueNorth
7 True Wind Speed 7.87 meters per second (m/s)
8 Separator * ASCII "*"
9 Checksum 3E ASCII per NMEA-0183
Ultrasonic Wind Sensor, Jack staff
Description: True and relative wind speed and direction data from the ultrasonic anemometer on theJack staff on the bow.
Directory: SCS_Data/wind_bow
File Name: WIND-BOW_20090129-173743.Raw
Data Examples: (3 lines from a data file):
01/29/2009,17:37:47.026,$PSWDB,18.00,13.18,124.12,7.87*5C01/29/2009,17:37:48.833,$PSWDB,18.00,13.18,121.95,7.98*5801/29/2009,17:37:50.640,$PSWDB,18.08,13.23,125.38,8.01*54
Table 3.8. Ultrasonic Wind Sensor, Jack staff
Field Description Example Units
1 Date 01/29/2009 Month/Day/Year (fromSCS)
2 Time (UTC) 17:37:47 hh:mm:ss.sss
3 NMEA Header $PSWDB ASCII text
4 Relative Wind Direction 18.00 Angle in degrees from thebow clockwise (compassdirection)
5 Relative Wind Direction 13.18 meters per second (m/s)
6 True Wind Direction 124.12 Degrees, angle from TrueNorth
7 True Wind Speed 7.87 meters per second (m/s)
8 Separator * ASCII "*"
9 Checksum 3E ASCII per NMEA-0183
Ultrasonic Wind Sensor, HCO Shack
Description: True and relative wind speed and direction data from the ultrasonic anemometer atopthe HCO shack.Note: The ultrasonic anemometer was on the HCO Shack from the start of the 2009 field season tothe end of the 2009 field season.

SCS Primary Data
9
Directory: SCS_Data/wind_aft
File Name: WIND-AFT_20090129-173743.Raw
Data Examples: (3 lines from a data file):
01/29/2009,17:37:47.026,$PSWDB,18.00,13.18,124.12,7.87*5C01/29/2009,17:37:48.833,$PSWDB,18.00,13.18,121.95,7.98*5801/29/2009,17:37:50.640,$PSWDB,18.08,13.23,125.38,8.01*54
Table 3.9. Ultrasonic Wind Sensor, HCO Shack
Field Description Example Units
1 Date 01/29/2009 Month/Day/Year (fromSCS)
2 Time (UTC) 17:37:47 hh:mm:ss.sss
3 NMEA Header $PSWDB ASCII text
4 Relative Wind Direction 18.00 Angle in degrees from thebow clockwise (compassdirection)
5 Relative Wind Direction 13.18 meters per second (m/s)
6 True Wind Direction 124.12 Degrees, angle from TrueNorth
7 True Wind Speed 7.87 meters per second (m/s)
8 Separator * ASCII "*"
9 Checksum 3E ASCII per NMEA-0183
Solar Sensors
Photosynthetic Active Radiation (PAR) Sensor, HCO Shack
Description: Photosyntheticly Active Radiation (PAR) MicroEinstens/m^2/sec and volts from thesensor on top of HCO.
Directory: SCS_Data/suface_par
File Name: Surface-PAR_20080312-000000.Raw
Data Examples: (3 lines from a data file):
03/12/2008,22:02:46.872,$PSSPA,1749.51,1.056*4C03/12/2008,22:02:48.872,$PSSPA,1755.43,1.060*4703/12/2008,22:02:50.888,$PSSPA,1755.43,1.060*47
Table 3.10. Surface PAR
Field Description Example Units
1 Date 03/12/2008 Month/Day/Year (fromSCS)
2 Time (UTC) 22:02:46.872 hh:mm:ss.sss
3 NMEA Header $PSSPA ASCII text
4 Surface PAR 1749.51 microEinstiens/sec/m2)
5 Sensor output (voltage) 1.056 Digitized voltage
6 Separator * ASCII "*"

SCS Primary Data
10
Field Description Example Units
7 Checksum 4C ASCII per NMEA-0183
Solar Radiometers, Pyranometer and Pyrgeometer, HCO Shack
Description: Solar Radiometers data from the sensors on top of HCO. The short wave radiometer isthe Pyranometer and the Long wave radiometer is the Pyrgeometer.
Directory: SCS_Data/solar_radiometers
File Name: SRM_20080314-000000.Raw
Data Examples: (3 lines from a data file):
03/14/2008,12:31:43.329,$PSSRA,1.20,0.010,338.30,0.034,276.02,1.192,275.97,1.194*4403/14/2008,12:31:45.329,$PSSRA,1.20,0.010,338.30,0.034,276.02,1.192,275.97,1.194*4403/14/2008,12:31:47.328,$PSSRA,1.20,0.010,339.20,0.037,276.02,1.192,275.97,1.194*47
Table 3.11. Surface Solar Radiometers
Field Description Example Units
1 Date 03/12/2008 Month/Day/Year (fromSCS)
2 Time (UTC) 22:02:46.872 hh:mm:ss.sss
3 NMEA Header $PSSRA ASCII text
4 Short Wave Radiation(SWR)
1.20 Watts/m2
5 Short wave sensor output(voltage)
0.010 millivolts, digitized value
6 Calculated Long WaveRadiation (LWR)
338.30 Watts/m2
7 Short wave sensor output(voltage)
0.034 millivolts, digitized value
8 LWR, Dome temperature 276.02 Degrees Kelvin
9 LWR, Dome temp, RAW 1.192 Volts, digitized value
10 LWR, Body temperature 275.97 Degrees Kelvin
11 LWR, Body temp sensoroutput (voltage)
1.194 Volts, digitized value
12 Separator * ASCII "*"
13 Checksum 4C ASCII per NMEA-0183
Oceanograpahic DataFlow Through Sensors
Thermosalinograph (TSG), BioChem Lab
Description: Data from the Seabird SBE45 Thermosalinograph (TSG) sensors in the Bio Chem Lab.
Directory: SCS_Data/tsg

SCS Primary Data
11
File Name: TSG-A_20080313-000000.Raw
Data Examples: (3 lines from a data file):
03/13/2008,04:46:03.355,$PSTSA,2.565,28.4522,31.526,1456.01*7E03/13/2008,04:46:05.340,$PSTSA,2.566,28.4529,31.526,1456.02*7503/13/2008,04:46:07.355,$PSTSA,2.565,28.4519,31.525,1456.01*75
Table 3.12. TSG, SBE-45, BioChem
Field Description Example Units
1 Date 03/13/2008 Month/Day/Year (fromSCS)
2 Time (UTC) 04:46:03.355 hh:mm:ss.sss
3 NMEA Header $PSTSA ASCII text
4 Temperature 2.565 Degrees Celsius, measuredat the Conductivity cell(internal)
5 Conductivity 28.4522 milliSiemens/centimeter
6 Salinity 31.526 Practical Salinity Units(PSU) per UNESCO-XX
7 Sound Speed 1456.01 meters per second (m/s),calculated using ------,Where?
8 Separator * ASCII "*"
9 Checksum 3E ASCII per NMEA-0183
Warning
The only sound speed that the SBE-45 can calculate by itself is the speed of sound insidethe sensor (from the water temperature and the conductivity.) This number is useless forpractical purposes such as sonar system beamformers and could easily be misleading.A sound speed that makes sense for use with sonar systems can be calculated fromthe salinity (derived from measured conductivity from the SBE-45) with the seawatertemperature measured at (significantly nearer) the intake by the remote temperaturesensor.
Second Thermosalinograph
On some (rare) cruises a second has been installed in the BioChem Lab. We intend to install a TSGwhen we implement the new TSG/pCO2 suite, perhaps in the fall of 2010.
Sea Surface Temperature
Description: This file contains data from a Seabird SBE-3S Sensor near the port side SSW intake tomeasure a closer approximation of sea surface temperature.
Directory: SCS_Data/surface_temp
File Name: Sea-Surface_20080313-000000.Raw
Data Examples: (3 lines from a data file):
03/13/2008,05:46:40.402,$PSSTA,2.039,2945.900*7E03/13/2008,05:46:42.402,$PSSTA,2.039,2945.900*7E03/13/2008,05:46:44.402,$PSSTA,2.039,2945.900*7E

SCS Primary Data
12
Table 3.13. Sea Surface Temperature
Field Data Type Example Units
1 SCS logged Date 03/13/2008 MM/DD/YYYY (from SCS)
2 SCS logged Time UTC 05:46:40.402 hh:mm:ss.sss
3 NMEA-like Header $PSSTA ASCII text
4 Surface temperature 2.039 Celsius
5 Sensor output 2945.900 millivolts
6 Separator "*" from NMEA-0183 standard
7 Checksum 7E ASCII Hex per NMEA
Thermosalinograph Flowmeter, BioChem Lab
Description: This file contains data from a Flocat C-ES45-B003 flow meter in-line with the TSG inthe Bio/Chem Lab. It is used for monitoring the flow through the sensor.
Directory: SCS_Data/flomet
File Name: FlowMeter_20080314-000000.Raw
Data Examples: (3 lines from a data file):
03/14/2008,13:44:44.640,$PSFMA,2.51,38.000*4403/14/2008,13:44:46.624,$PSFMA,2.64,40.000*4D03/14/2008,13:44:48.624,$PSFMA,2.64,40.000*4D
Table 3.14. Flow Meter
Field Data Type Example Units
1 SCS logged Date 03/13/2008 MM/DD/YYYY (from SCS)
2 SCS logged Time UTC 05:46:40.402 hh:mm:ss.sss
3 NMEA-like Header $PSFMA ASCII text
4 Surface temperature 2.51 ??
5 Sensor output 38.000 millivolts
6 Separator "*" from NMEA-0183 standard
7 Checksum 44 ASCII Hex per NMEA
Flowmeter, Bow Incubators
This sensor is not installed and active on all cruises, only when there are incubators on the bow.
Description: If it exists, this file contains data from a flow meter installed in the incubator watermanifold on the bow and is used to monitor flow there.
Directory: SCS_Data/flomet_b
File Name: FlowMeter-BOW_20080313-000000.Raw
Data Examples: (3 lines from a data file):
03/13/2008,02:51:49.277,$PSFMB,2.91,15.000*4403/13/2008,02:51:51.277,$PSFMB,2.91,15.000*4403/13/2008,02:51:53.261,$PSFMB,2.91,15.000*44

SCS Primary Data
13
Table 3.15. Flow Meter
Field Data Type Example Units
1 SCS logged Date 03/13/2008 MM/DD/YYYY (from SCS)
2 SCS logged Time UTC 02:51:49.277 hh:mm:ss.sss
3 NMEA-like Header $PSFMB ASCII text
4 Calculated flow 2.91 Liters/minute
5 Sensor output 15.000 Frequency
6 Separator "*" from NMEA-0183 standard
7 Checksum 7E ASCII Hex per NMEA
Note
Flow meters are only installed on some cruises.
Incubator Water Temperature, Bow
This sensor is not installed and active on all cruises, only when there are incubators on the bow.
Description: This file contains data from a Seabird SBE-3S Sensor near the incubator water manifoldon the bow.
Directory: SCS_Data/temp_incubat
File Name: Temp-Bow-Incubator_20090416-000000.Raw
Data Examples: (3 lines from a data file):
04/16/2009,00:00:19.272,$PSXTA,-1.32,2966.00*5804/16/2009,00:00:21.256,$PSXTA,-1.32,2966.00*5804/16/2009,00:00:23.256,$PSXTA,-1.32,2966.00*58
Table 3.16. Bow Incubator Water Temperature Temperature
Field Data Type Example Units
1 SCS logged Date 04/16/2009 MM/DD/YYYY (from SCS)
2 SCS logged Time UTC 00:00:19.272 hh:mm:ss.sss
3 NMEA-like Header $PSXTA ASCII text
4 Surface temperature -1.32 Celsius
5 Sensor output 2966.00 millivolts
6 Separator "*" from NMEA-0183 standard
7 Checksum 7E ASCII Hex per NMEA
Note
Temperature sensors are only installed on the incubator water by prior arrangementthorugh the cruise planning process.
Dissolved Oxygen A, BioChem lab
This sensor is normally installed and operated on all cruises.
Description: This file contains data from a Seabird SBE-43 Dissolve Oxygen (DO) sensor in theBioChem Lab.

SCS Primary Data
14
Directory: SCS_Data/oxygen
File Name: OXYGEN_20080313-000000.Raw
Data Examples: (3 lines from a data file):
03/13/2008,05:25:28.371,$PSOXA,7.265,2.922,2.576,2.576*5803/13/2008,05:25:30.386,$PSOXA,7.265,2.922,2.577,2.577*5803/13/2008,05:25:32.371,$PSOXA,7.268,2.923,2.576,2.576*54
Table 3.17. Dissolved Oxygen
Field Data Type Example Units
1 SCS logged Date 04/16/2009 MM/DD/YYYY (from SCS)
2 SCS logged Time UTC 00:00:19.272 hh:mm:ss.sss
3 NMEA-like Header $PSOXA ASCII text
4 Dissolved Oxygen 7.265 ml/l
5 Sensor output 2.922 units?
6 Water Temperature 2.576 Degrees Celsius
7 ? 2.576 units?
8 Separator "*" from NMEA-0183 standard
9 Checksum 58 ASCII Hex per NMEA
Note
Need to verify the units and fields
Dissolved Oxygen B, BioChem lab
The second DO sensor is installed on some cruises.
Description: This file contains data from a Seabird SBE-43 Dissolved Oxygen (DO) sensor in theBioChem Lab.
Directory: SCS_Data/oxygen
File Name: OXYGEN_20080313-000000.Raw
Data Examples: (3 lines from a data file):
03/13/2008,05:25:28.371,$PSOXB,7.265,2.922,2.576,2.576*5803/13/2008,05:25:30.386,$PSOXB,7.265,2.922,2.577,2.577*5803/13/2008,05:25:32.371,$PSOXB,7.268,2.923,2.576,2.576*54
Table 3.18. Dissolved Oxygen
Field Data Type Example Units
1 SCS logged Date 04/16/2009 MM/DD/YYYY (from SCS)
2 SCS logged Time UTC 00:00:19.272 hh:mm:ss.sss
3 NMEA-like Header $PSOXA ASCII text
4 Dissolved Oxygen 7.265 ml/l
5 Sensor output 2.922 units?
6 Water Temperature 2.576 Degrees Celsius
7 ? 2.576 units?

SCS Primary Data
15
Field Data Type Example Units
8 Separator "*" from NMEA-0183 standard
9 Checksum 58 ASCII Hex per NMEA
Note
Need to check the units and fields
Fluorometer A, BioChem lab
The flourometer is normally operated on all cruises.
Description: This file contains data from a Seapoint SCF flourometer in the BioChem Lab.
Directory: SCS_Data/fluro
File Name: Fluro_20080313-000000.Raw
Data Examples: (3 lines from a data file):
03/13/2008,03:19:57.277,$PSFLA,0.330,0.033,0.000,0.010*4903/13/2008,03:19:59.277,$PSFLA,0.330,0.033,0.000,0.010*4903/13/2008,03:20:01.277,$PSFLA,0.360,0.036,0.000,0.010*49
Table 3.19. Sea Surface Temperature
Field Data Type Example Units
1 SCS logged Date 04/16/2009 MM/DD/YYYY (from SCS)
2 SCS logged Time UTC 00:00:19.272 hh:mm:ss.sss
3 NMEA-like Header $PSFLA ASCII text
4 ? 0.330 ml/l
5 ? 0.330 units?
6 ? 0.000 ?
7 ? 0.010 ?
8 Separator "*" from NMEA-0183 standard
9 Checksum 49 ASCII Hex per NMEA
Note
Need to check the units and fields
Fluorometer B
Description: This file contains data from a Turner Scufa flourometer in the BioChem Lab. It is notused on all cruises.
Directory: SCS_Data/fluro_b
File Name: Fluro-B_20080313-000000.Raw
Data Examples: (3 lines from a data file):
3/13/2008,03:24:49.293,$PSFLB,0.910,0.091,0.200,0.020*4B03/13/2008,03:24:51.293,$PSFLB,0.910,0.091,0.200,0.020*4B03/13/2008,03:24:53.308,$PSFLB,0.910,0.091,0.200,0.020*4B

SCS Primary Data
16
Table 3.20. Fluorometer B
Field Data Type Example Units
1 SCS logged Date 3/13/2008 MM/DD/YYYY (from SCS)
2 SCS logged Time UTC 03:24:49.293 hh:mm:ss.sss
3 NMEA-like Header $PSFLB ASCII text
4 Flourometer 0.910 ug/l
5 Flourometer, RAW 0.091 Volts
6 Turbidity 0.200 NTU (not used)
7 Turbidity, RAW 0.020 Volts (not used)
8 Separator "*" from NMEA-0183 standard
9 Checksum 4B ASCII Hex per NMEA
Note
Need to check terminology, units, and fields
ISUS Nitrate sensor small file
Note: The ISUS Nitrate sensor is not a routine instrument on Healy. It has been provided by specificscience programs and logged in our data system by pre-arrangement through the cruise planningprocess.
Description: This file contains data from ISUS Nitrate Sensor, MBARI/Satlatic ISIS V3, in the Bio/Chem Lab. Data is logged every 5 minutes for about 30 seconds. For the times in between this thevalues in the volts columns are 0.0 in the BioChem Lab. It is not used on all cruises.
Directory: SCS_Data/isus
File Name: Isus_20080422-000000.Raw
Data Examples: (3 lines from a data file):
04/22/2008,00:04:31.275,$PSNTA,-0.308,0.478*7504/22/2008,00:04:33.275,$PSNTA,-0.308,0.478*7504/22/2008,00:04:35.275,$PSNTA,-0.308,0.478*75
Table 3.21. ISUS Nitrate sensor small file
Field Data Type Example Units
1 SCS logged Date 04/22/2008 MM/DD/YYYY (from SCS)
2 SCS logged Time UTC 00:04:31.275 hh:mm:ss.sss
3 NMEA-like Header $PSNTA ASCII text
4 ISUS Aux 1 -0.308 Volts
5 ISUS Aux 1 0.478 Volts
6 Separator "*" from NMEA-0183 standard
7 Checksum 75 ASCII Hex per NMEA
ISUS Nitrate Sensor 3V large fileNote: The ISUS Nitrate sensor is not a routine instrument on Healy. It has been provided by specificscience programs and logged in our data system by pre-arrangement through the cruise planningprocess.
SCS Primary Data
17
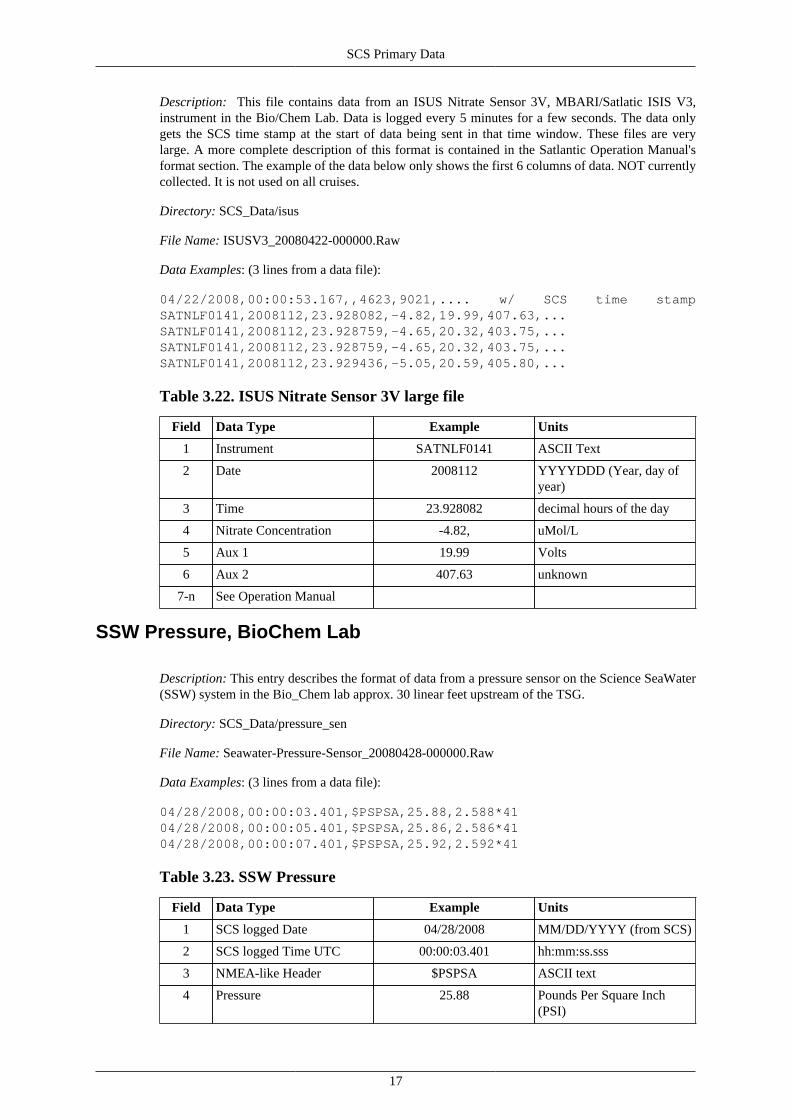
Description: This file contains data from an ISUS Nitrate Sensor 3V, MBARI/Satlatic ISIS V3,instrument in the Bio/Chem Lab. Data is logged every 5 minutes for a few seconds. The data onlygets the SCS time stamp at the start of data being sent in that time window. These files are verylarge. A more complete description of this format is contained in the Satlantic Operation Manual'sformat section. The example of the data below only shows the first 6 columns of data. NOT currentlycollected. It is not used on all cruises.
Directory: SCS_Data/isus
File Name: ISUSV3_20080422-000000.Raw
Data Examples: (3 lines from a data file):
04/22/2008,00:00:53.167,,4623,9021,.... w/ SCS time stampSATNLF0141,2008112,23.928082,-4.82,19.99,407.63,...SATNLF0141,2008112,23.928759,-4.65,20.32,403.75,...SATNLF0141,2008112,23.928759,-4.65,20.32,403.75,...SATNLF0141,2008112,23.929436,-5.05,20.59,405.80,...
Table 3.22. ISUS Nitrate Sensor 3V large file
Field Data Type Example Units
1 Instrument SATNLF0141 ASCII Text
2 Date 2008112 YYYYDDD (Year, day ofyear)
3 Time 23.928082 decimal hours of the day
4 Nitrate Concentration -4.82, uMol/L
5 Aux 1 19.99 Volts
6 Aux 2 407.63 unknown
7-n See Operation Manual
SSW Pressure, BioChem Lab
Description: This entry describes the format of data from a pressure sensor on the Science SeaWater(SSW) system in the Bio_Chem lab approx. 30 linear feet upstream of the TSG.
Directory: SCS_Data/pressure_sen
File Name: Seawater-Pressure-Sensor_20080428-000000.Raw
Data Examples: (3 lines from a data file):
04/28/2008,00:00:03.401,$PSPSA,25.88,2.588*4104/28/2008,00:00:05.401,$PSPSA,25.86,2.586*4104/28/2008,00:00:07.401,$PSPSA,25.92,2.592*41
Table 3.23. SSW Pressure
Field Data Type Example Units
1 SCS logged Date 04/28/2008 MM/DD/YYYY (from SCS)
2 SCS logged Time UTC 00:00:03.401 hh:mm:ss.sss
3 NMEA-like Header $PSPSA ASCII text
4 Pressure 25.88 Pounds Per Square Inch(PSI)

SCS Primary Data
18
Field Data Type Example Units
5 Sensor output 2.588 Volts
8 Separator "*" from NMEA-0183 standard
9 Checksum 41 ASCII Hex per NMEA
Sonar Data
SeaBeam 2112 Center Beam (SCS)Note: The SeaBeam 2112 multibeam bottom mapping sonar was removed from the Healy during theCY2009-2010 drydock. Center beam records starting in 2010 are forthe EM122 in a different format.
Description: This entry describes the format of data sent to SCS from LDS. LDS assembles thismessage from the real-time SB2112 data.
Directory: SCS_Data/seabeam_center
File Name: Seabeam-Centerbeam_20070414-182437.Raw
Data Examples: (3 lines from a data file):
04/14/2007,18:24:38.427,$SBCTR,2007,4,14,18:24:35.713,58.119110,-169.839278,70.70,60*0004/14/2007,18:24:40.177,$SBCTR,2007,4,14,18:24:37.213,58.119152,-169.839367,70.49,61*0004/14/2007,18:24:40.615,$SBCTR,2007,4,14,18:24:38.734,58.119193,-169.839452,70.92,60*00
Table 3.24. SB2112 Center Beam
Field Data Type Example Units
1 SCS logged Date 04/14/2007 MM/DD/YYYY (from SCS)
2 SCS logged Time UTC 18:24:38.427 hh:mm:ss.sss
3 NMEA-like Header $SBCTR ASCII
4 Ping Year 2007 YYYY (UTC)
5 Ping Month 4 D or DD (per NMEA)
6 Ping Day 14 ------"-------
7 Ping Time 18:24:35.713 hh:mm:ss.sss
8 Ping Latitude 58.119110 decimal degrees, N is +
9 Ping Longitude -169.839278 decimal degrees, E is +
10 Ping depth 70.92 corrected meters
11 Number of beams 60 ASCII
8 Separator "*" from NMEA-0183 standard
9 Checksum 00 Not calculated, place holderonly
Kongsberg EM122 Center Beam (SCS)Note: The Kongsberg EM122 multibeam bottom mapping sonar was installed on the Healy during theCY2009-2010 drydock. Center beam records are generated by the Lamont Data System (LDS) andavailable to SCS via UDP broadcast datagrams. At present SCS has not been able to log them. Thesame data record is available in the LDS data records.
SCS Primary Data
19
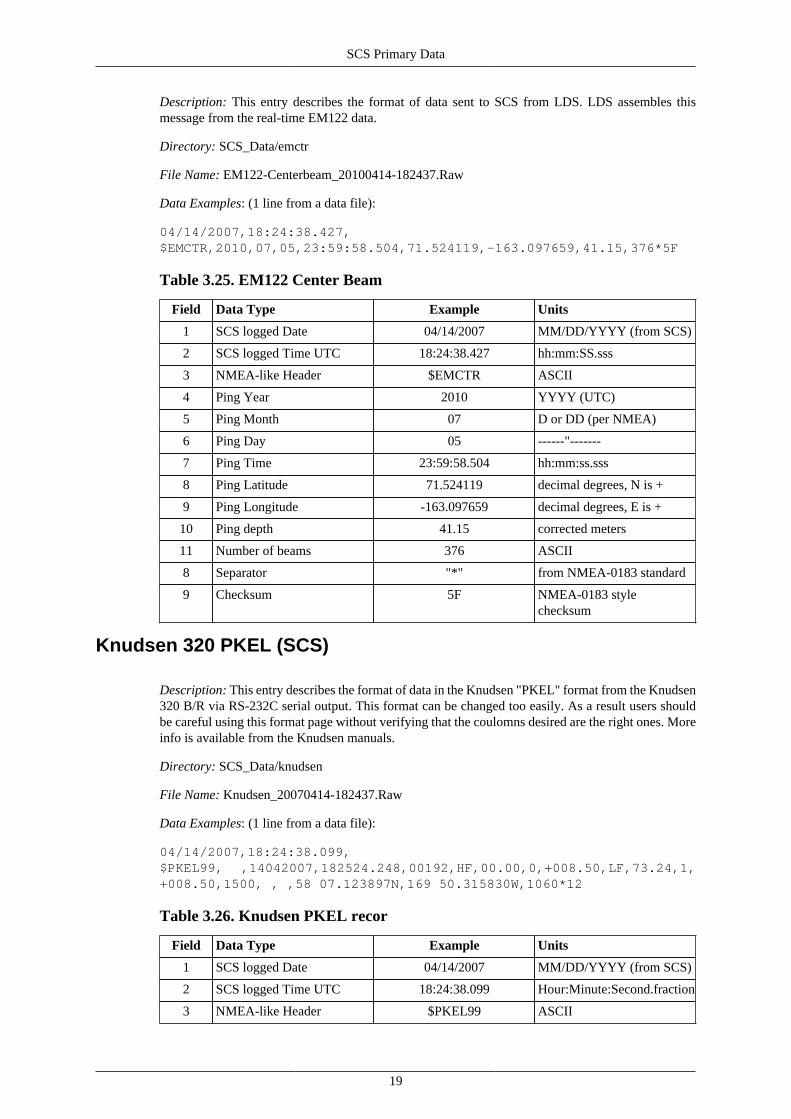
Description: This entry describes the format of data sent to SCS from LDS. LDS assembles thismessage from the real-time EM122 data.
Directory: SCS_Data/emctr
File Name: EM122-Centerbeam_20100414-182437.Raw
Data Examples: (1 line from a data file):
04/14/2007,18:24:38.427,$EMCTR,2010,07,05,23:59:58.504,71.524119,-163.097659,41.15,376*5F
Table 3.25. EM122 Center Beam
Field Data Type Example Units
1 SCS logged Date 04/14/2007 MM/DD/YYYY (from SCS)
2 SCS logged Time UTC 18:24:38.427 hh:mm:SS.sss
3 NMEA-like Header $EMCTR ASCII
4 Ping Year 2010 YYYY (UTC)
5 Ping Month 07 D or DD (per NMEA)
6 Ping Day 05 ------"-------
7 Ping Time 23:59:58.504 hh:mm:ss.sss
8 Ping Latitude 71.524119 decimal degrees, N is +
9 Ping Longitude -163.097659 decimal degrees, E is +
10 Ping depth 41.15 corrected meters
11 Number of beams 376 ASCII
8 Separator "*" from NMEA-0183 standard
9 Checksum 5F NMEA-0183 stylechecksum
Knudsen 320 PKEL (SCS)
Description: This entry describes the format of data in the Knudsen "PKEL" format from the Knudsen320 B/R via RS-232C serial output. This format can be changed too easily. As a result users shouldbe careful using this format page without verifying that the coulomns desired are the right ones. Moreinfo is available from the Knudsen manuals.
Directory: SCS_Data/knudsen
File Name: Knudsen_20070414-182437.Raw
Data Examples: (1 line from a data file):
04/14/2007,18:24:38.099,$PKEL99, ,14042007,182524.248,00192,HF,00.00,0,+008.50,LF,73.24,1,+008.50,1500, , ,58 07.123897N,169 50.315830W,1060*12
Table 3.26. Knudsen PKEL recor
Field Data Type Example Units
1 SCS logged Date 04/14/2007 MM/DD/YYYY (from SCS)
2 SCS logged Time UTC 18:24:38.099 Hour:Minute:Second.fraction
3 NMEA-like Header $PKEL99 ASCII

SCS Primary Data
20
Field Data Type Example Units
4 ??
5 Ping date 14042007 DDMMYYYY
6 Ping time 182524.248 hhmmss.sss
7 00192
8 Frequency key HF HF = 12 kHz
9 HF Depth 00.00 Meters, corrected for draft
10 HF Depth Valid 0 1 == valid
11 HF Draft +008.50 Meters, used for draftcorrection
12 Frequency key LF Subbottom
13 LF Depth 73.22 Meters using sound speed
14 LF Depth Valid 1 1 == valid
15 LF Draft +008.50 Meters
16 Sound speed 1500 meters/second
17
18
19 Ping Latitude 58 07.128948N DD MM.MMMMMM
20 Ping Longitude 169 50.326409W DDD MM.MMMMMM
21 Position Latency 1078 units?
22 Separator "*" from NMEA-0183 standard
23 Checksum 12 Not calculated, place holderonly
Winches
Starboard A-Frame Winch Wire Data (SCS)
Description: This entry describes the format of data sent to SCS from the winch system through theSIO/ODF interface.
Directory: SCS_Data/stbd_a_frame
File Name: Winch-Control-Stbd_20070418-000000.Raw
Data Examples: (3 lines from a data file):
04/18/2007,06:13:18.281,01, 36, , -27, ,0000 04/18/2007,06:13:19.250,01, 890, , 35, , -28, ,0000 04/18/2007,06:13:20.235,01, 900, , 35, , -28, ,0000
Table 3.27. Starboard Winch Wire
Field Data Type Example Units
1 SCS logged Date 04/14/2007 MM/DD/YYYY (from SCS)
2 SCS logged Time UTC 18:24:38.427 hh:mm:ss.sss
3 Sensor number 01 Indicates which TOTCO thedata is from
5 Wire tension 900 Pounds

SCS Primary Data
21
Field Data Type Example Units
6 blank
7 Wire out 35 Meters
8 blank
9 Wire Speed -28 Meters/Minute (- == out)
Aft A-Frame Winch Wire Data (SCS)
Description: This entry describes the format of data sent to SCS from the winch system through theSIO/ODF interface.
Directory: SCS_Data/stbd_a_frame
File Name: Winch-Control-Aft_20070418-000000.Raw
Data Examples: (3 lines from a data file):
04/18/2007,06:13:18.281,01, 36, , -27, ,0000 04/18/2007,06:13:19.250,01, 890, , 35, , -28, ,0000 04/18/2007,06:13:20.235,01, 900, , 35, , -28, ,0000
Table 3.28. Aft Winch Wire
Field Data Type Example Units
1 SCS logged Date 04/14/2007 MM/DD/YYYY (from SCS)
2 SCS logged Time UTC 18:24:38.427 hh:mm:ss.sss
3 Sensor number 02 Indicates which TOTCO thedata is from
5 Wire tension 900 Pounds
6 blank
7 Wire out 35 Meters
8 blank
9 Wire Speed -28 Meters/Minute (- == out)
Navigational Data
POS/MV
POS/MV GGA (SCS)
Description: This entry describes the format of data from the POS/MV-320 as logged by SCS. ThePOS/MV uses the WGS-84 datum.
Directory: SCS_Data/posmv_gga
File Name: POSMV-GGA_20070415-000000.Raw
Data Examples: (3 lines from a data file):
04/15/2007,00:00:03.052,$INGGA,000002.737,5830.47054,N,17012.64182,W,2,08,1.0,1.80,M,,,4,0297*07

SCS Primary Data
22
04/15/2007,00:00:04.052,$INGGA,000003.737,5830.47385,N,17012.64365,W,2,08,1.0,1.76,M,,,5,0297*0A04/15/2007,00:00:05.052,$INGGA,000004.737,5830.47716,N,17012.64550,W,2,08,1.0,1.71,M,,,6,0297*07
Table 3.29. POS/MV GGA Record (SCS)
Field Data Type Example Units
1 SCS logged Date 04/15/2007 MM/DD/YYYY (from SCS)
2 SCS logged Time UTC 00:00:03.052 hh:mm:ss.sss
3 NMEA Header $INGGA NMEA-0183
4 Position Time (UTC) 000002.737 hhmmss.sss
5 Latitude 5830.47054 DDMM.mmmmm
6 Latitude hemisphere N [N|S] N=North
7 Longitude 17012.64182 DDMM.mmmmm
8 Longitude hemisphere W [E|W]
9 GPS Quality 2 1=GPS, 2=DGP
10 Number of satellites used 08
11 HDOP 1.0 Horizontal Dilution ofPrecision
12 Height 1.8 see Height units
13 Height units M M=Meters
14 Geoidal Height Height of the MasterReference Point in IC/Gyro
15 Geoidal height units M=meters
16 DGPS Station ID 0297 Reference?
17 Separator "*" NMEA-0183
18 Checksum 07 NMEA-0183
Note
Check: line 15 (could be a typo) probably not two units. Check terminology for Geoidalheight. Verify that "height" is really the fix height not the antenna height.
POS/MV Pseudo range Noise Statistics (SCS)
Description: This entry describes the format of data from the POS/MV-320 pseudo noise range errorstatistics. These numbers are very useful for estimating the quality of attitude and position data.
Directory: SCS_Data/posmv_gst
File Name: POSMV-Pseudo-Noise_20070415-000000.Raw
Data Examples: (3 lines from a data file):
04/15/2007,00:00:02.990,$INGST,000002.737,,0.6,0.4,22.3,0.4,0.6,0.8*6304/15/2007,00:00:03.990,$INGST,000003.737,,0.6,0.4,22.3,0.4,0.6,0.8*6204/15/2007,00:00:04.990,$INGST,000004.737,,0.6,0.4,22.3,0.4,0.6,0.8*65

SCS Primary Data
23
Table 3.30. POS/MV Pseudo range noise statistics (SCS)
Field Data Type Example Units
1 SCS logged Date 04/15/2007 MM/DD/YYYY (fromSCS)
2 SCS logged Time UTC 00:00:02.990 hh:mm:ss.ss
3 NMEA Header $INGST NMEA-0183
4 Position Time (UTC) 000002.737 hhmmss.sss
5 blank
6 Semi major axis 0.6 meters
7 semi minor axis 0.04 DDMM.mmmmm
8 Longitude hemisphere W [E|W]
9 GPS Quality 2 1=GPS, 2=DGP
10 Number of satellitesused
08 meters
11 HDOP 1.0 Horizontal Dilution ofPrecision
12 Height 1.8 see Height units
13 Height units M M=Meters
14 Geoidal Height see Geoidal heightunits
15 Geoidal height units M=meters
16 DGPS Station ID 0297 Reference?
17 Separator "*" NMEA-0183
18 Checksum 07 NMEA-0183
Note
Check: line 15 (could be a typo) probably not two units. Check terminology for Geoidalheight. Verify that "height" is really the fix height not the antenna height.
POS/MV HDT (SCS)
Description: This entry describes the format of heading data from the POS/MV-320 heading recordsas logged by SCS.
Directory: SCS_Data/posmv_hdt
File Name: POSMV-HDT_20090806-133536.Raw
Data Examples: (3 lines from a data file):
08/06/2009,17:30:00.565,$INHDT,345.9,T*2E 08/06/2009,17:30:01.565,$INHDT,345.8,T*2F 08/06/2009,17:30:02.565,$INHDT,345.7,T*20
Table 3.31. POS/MV Heading (SCS)
Field Data Type Example Units
1 SCS logged Date 08/06/2009 MM/DD/YYYY (from SCS)

SCS Primary Data
24
Field Data Type Example Units
2 SCS logged Time UTC 17:30:00.565 hh:mm:ss.ss
3 NMEA Header $INHDT NMEA-0183
4 Vessel heading 345.9 Degrees
5 Heading reference T True north
17 Separator "*" NMEA-0183
18 Checksum 2E NMEA-0183
POS/MV PASHR (SCS)
Description: This entry describes the format of data from the POS/MV-320 pitch and roll records inNMEA PASHR-format as logged by SCS.
Directory: SCS_Data/posmv_pashr
File Name: POSMV-PASHR_20070415-000000.Raw
Data Examples: (3 lines from a data file):
08/06/2009,17:40:00.374,$PASHR,174000.190,313.58,T,-0.17,-0.23,0.02,0.018,0.018,0.011,2,1*1008/06/2009,17:40:01.374,$PASHR,174001.190,313.59,T,-0.15,-0.25,0.02,0.018,0.018,0.011,2,1*1408/06/2009,17:40:02.374,$PASHR,174002.190,313.54,T,-0.13,-0.14,0.03,0.018,0.018,0.011,2,1*1F
Table 3.32. POS/MV PASHR (SCS)
Field Data Type Example Units
1 SCS logged Date 08/06/2009 MM/DD/YYYY (from SCS)
2 SCS logged Time UTC 17:30:00.565 hh:mm:ss.ss
3 NMEA Header $INHDT NMEA-0183
4 Vessel heading 345.9 Degrees
5 Heading reference T True north
17 Separator "*" NMEA-0183
18 Checksum 2E NMEA-0183
POS/MV VTG (SCS)
Description: This entry describes the format of data from the POS/MV-320 course and speed overground in NMEA VTG-format as logged by SCS.
Directory: SCS_Data/posmv_vtg
File Name: POSMV-VTG_20070415-000000.Raw
Data Examples: (3 lines from a data file):
08/06/2009,18:50:00.372,$INVTG,326.5,T,,M,5.5,N,10.2,K*4108/06/2009,18:50:01.388,$INVTG,327.5,T,,M,5.5,N,10.3,K*4108/06/2009,18:50:02.388,$INVTG,326.2,T,,M,5.5,N,10.3,K*47

SCS Primary Data
25
Table 3.33. POS/MV VTG (SCS)
Field Data Type Example Units
1 SCS logged Date 08/06/2009 MM/DD/YYYY (fromSCS)
2 SCS logged Time UTC 18:50:00.372 hh:mm:ss.ss
3 NMEA Header $INVTG NMEA-0183
4 Vessel heading 326.5 Degrees
5 Heading reference T T=True north
6 Vessel Heading not used
7 Heading reference M M=Magnetic
8 Vessel speed 5.5 see speed units field
9 Sped units N N=Knots
10 Vessel speed 10.2 see speed units field
11 Speed units K K=km/hr
11 Separator "*" NMEA-0183
12 Checksum 41 NMEA-0183
POS/MV ZDA (SCS)
Description: This entry describes the format of data from the POS/MV-320 precision time record inNMEA ZDA-format as logged by SCS.
Directory: SCS_Data/posmv_zda
File Name: POSMV-ZDA_20070415-000000.Raw
Data Examples: (3 lines from a data file):
08/06/2009,20:19:59.275,$INZDA,201959.0026,06,08,2009,,*7108/06/2009,20:20:00.275,$INZDA,202000.0025,06,08,2009,,*7408/06/2009,20:20:01.275,$INZDA,202001.0025,06,08,2009,,*75
Table 3.34. POS/MV ZDA (SCS)
Field Data Type Example Units
1 SCS logged Date 08/06/2009 MM/DD/YYYY (fromSCS)
2 SCS logged Time UTC 20:19:59.275 hh:mm:ss.ss
3 NMEA Header $INZDA NMEA-0183
4 Time (UTC) 201959.0026 HHMMSS.ssss
5 Day 06 DD
6 Month 08 MM
7 Year 2009 YYYY
8 Local zone hours HH
9 Local zone minutes MM
11 Separator "*" NMEA-0183
12 Checksum 71 NMEA-0183

SCS Primary Data
26
Ashtech ADU5 (SCS)
Ashtech ADU5 Attitude (SCS)
Description: This entry describes the format of attitude data from the Thales (ex Ashtech) ADU5 GPSreceiver's GPS receiver in NMEA GPATT-format as logged by SCS.
Directory: SCS_Data/ashtech_attiude
File Name: Ashtech-Attitude_20090806-133536.Raw
Data Examples: (3 lines from a data file):
08/06/2009,20:29:59.428,$GPPAT,202959.00,7132.00906,N,15751.83798,W,00025.84,337.6729,-000.00,000.21,0.0013,0.0147,0*4A08/06/2009,20:30:00.428,$GPPAT,203000.00,7132.00913,N,15751.83882,W,00025.89,337.5929,-000.02,000.21,0.0015,0.0160,0*4F08/06/2009,20:30:01.428,$GPPAT,203001.00,7132.00920,N,15751.83963,W,00025.86,337.5559,000.10,000.27,0.0015,0.0203,0*6A
Table 3.35. ADU5 Attitude (SCS)
Field Data Type Example Units
1 SCS logged Date 08/06/2009 MM/DD/YYYY (fromSCS)
2 SCS logged Time UTC 20:29:59.428 hh:mm:ss.ss
3 NMEA Header $GPPAT NMEA-0183
4 Time of the position 202959.00 HHMMSS.ssss
5 Latitude 7132.00906 DDMM.mmmmm
6 Latitude hemisphere N N=North
7 Longitude 15751.83798 DDMM.mmmmm
8 Longitude hemisphere W W= West
9 Altitude 00025.84 Meters
10 Heading 337.6729 Degrees ref. True North
11 Pitch -000.00 Degrees (1)
12 Roll 000.21 Degrees (1)
13 Attitude phasemeasurement RMDerror (MRMS)
0.0013 Meters
14 Attitude baseline lengthRMS error (BRMS)
0.0147 Meters
15 Attitude reset flag 0 0=good, 1=rough orbad
20 Separator "*" NMEA-0183
21 Checksum 71 NMEA-0183
Warning
1) Add reference frame info (e.g. port up, bow up) for attitude data

SCS Primary Data
27
Ashtech (ADU5) GGA (SCS)
Description: This entry describes the format of data from the Thales (ex. Ashtech) ADU5 GPSreceiver's NMEA-GGA position data as logged by SCS.
Directory: SCS_Data/ashtech_gga
File Name: Ashtech-GGA_20090806-133536.Raw
Data Examples: (3 lines from a data file):
08/06/2009,20:49:59.279,$GPGGA,204959.00,7132.93308,N,15753.94937,W,1,12,0.7,21.05,M,-0.49,M,,*5C08/06/2009,20:50:00.279,$GPGGA,205000.00,7132.93494,N,15753.95250,W,1,12,0.7,21.03,M,-0.49,M,,*5708/06/2009,20:50:01.279,$GPGGA,205001.00,7132.93680,N,15753.95554,W,1,12,0.7,20.96,M,-0.49,M,,*5F
Table 3.36. ADU5 GGA Record (SCS)
Field Data Type Example Units
1 SCS logged Date 08/06/2009 MM/DD/YYYY (from SCS)
2 SCS logged Time UTC 20:49:59.279 hh:mm:ss.ss
3 NMEA Header $GPGGA NMEA-0183
4 Position Time (UTC) 204959.00 hhmmss.ss
5 Latitude 7132.93308 DDMM.mmmmm
6 Latitude hemisphere N [N|S] N=North
7 Longitude 15753.94937 DDMM.mmmmm
8 Longitude hemisphere W [E|W]
9 GPS Quality 1 1=GPS, 2=DGP
10 Number of satellites used 12 Integer
11 HDOP 0.7 Horizontal Dilution ofPrecision
12 Height 21.05 see Height units
13 Height units M M=Meters
14 Geoidal Height -0.49 see Geoidal height units
15 Geoidal height units M M=meters
17 Separator "*" NMEA-0183
18 Checksum 07 NMEA-0183
Note
Add reference the user/operator/ICD manual
Ashtech (ADU5) GLL (SCS)
Description: This entry describes the format of data from the Thales (ex. Ashtech) ADU5 GPSreceiver's NMEA-GLL position data as logged by SCS.
Directory: SCS_Data/ashtech_gll

SCS Primary Data
28
File Name: Ashtech-GLL_20090807-000000.Raw
Data Examples: (3 lines from a data file):
08/07/2009,13:00:00.162,$GPGLL,7124.44850,N,15719.02547,W,130000.00,A,A*7B08/07/2009,13:00:01.162,$GPGLL,7124.44732,N,15719.01959,W,130001.00,A,A*7108/07/2009,13:00:02.162,$GPGLL,7124.44614,N,15719.01368,W,130002.00,A,A*7F
Table 3.37. ADU5 GLL Record (SCS)
Field Data Type Example Units
1 SCS logged Date 08/07/2009 MM/DD/YYYY (from SCS)
2 SCS logged Time UTC 13:00:00.162 hh:mm:ss.ss
3 NMEA Header $GPGLL NMEA-0183
4 Latitude 7124.44850 DDMM.mmmmm
5 Latitude hemisphere N [N|S] N=North
6 Longitude 15719.02547 DDMM.mmmmm
7 Longitude hemisphere W [E|W]
8 Time of position (UTC) 130000.00 hhmmss.ss
9 Data status A A== valid
10 Mode indicator A A== autonomous
11 Separator "*" NMEA-0183
12 Checksum 07 NMEA-0183
Note
Add reference the user/operator/ICD manual.
Ashtech (ADU5) HDT (SCS)
Description: This entry describes the format of data from the Thales (ex. Ashtech) GPS ADU5 GPSreceiver's NMEA-HTD heading data as logged by SCS.
Directory: SCS_Data/ashtech_hdt
File Name: Ashtech-HDT_20090807-000000.Raw
Data Examples: (3 lines from a data file):
08/07/2009,12:59:59.412,$GPHDT,131.108,T*3F08/07/2009,13:00:00.412,$GPHDT,131.138,T*3C08/07/2009,13:00:01.412,$GPHDT,131.172,T*32
Table 3.38. ADU5 GLL Record (SCS)
Field Data Type Example Units
1 SCS logged Date 08/07/2009 MM/DD/YYYY (from SCS)
2 SCS logged Time UTC 12:59:59.412 hh:mm:ss.ss
3 NMEA Header $GPHDT NMEA-0183

SCS Primary Data
29
Field Data Type Example Units
4 Heading 131.108 Degrees
5 Heading Reference T T== True North
6 Separator "*" NMEA-0183
7 Checksum 07 NMEA-0183
Note
Add reference the user/operator/ICD manual.
P-Code (SCS)
Centurion P-Code (Aft) GGA (SCS)
Description: This entry describes the format of data from the Trimble Centurion GPS receiver'sNMEA-GGA position data as logged by SCS.
Directory: SCS_Data/pcode_aft_gga
File Name: PCode-AFT-GGA_20090807-000000.Raw
Data Examples: (3 lines from a data file):
08/07/2009,13:09:58.221,$GPGGA,130957.414,7123.6883,N,15715.5548,W,1,06,1.2,015.7,M,-000.5,M,,*5108/07/2009,13:09:59.221,$GPGGA,130958.414,7123.6869,N,15715.5490,W,1,06,1.2,015.8,M,-000.5,M,,*5108/07/2009,13:10:00.221,$GPGGA,130959.414,7123.6856,N,15715.5432,W,1,06,1.2,015.8,M,-000.5,M,,*54
Table 3.39. Centurion (Aft P-Code) GGA Record (SCS)
Field Data Type Example Units
1 SCS logged Date 08/06/2009 MM/DD/YYYY (from SCS)
2 SCS logged Time UTC 13:09:58.221 hh:mm:ss.ss
3 NMEA Header $GPGGA NMEA-0183
4 Position Time (UTC) 130957.414 hhmmss.ss
5 Latitude 7123.6883 DDMM.mmmmm
6 Latitude hemisphere N [N|S] N=North
7 Longitude 15715.5548 DDMM.mmmmm
8 Longitude hemisphere W [E|W]
9 GPS Quality 1 1=GPS, 2=DGP
10 Number of satellites used 6 Integer
11 HDOP 1.2 Horizontal Dilution ofPrecision
12 Height 015.7 see Height units
13 Height units M M=Meters
14 Geoidal Height -000.5 see Geoidal height units
15 Geoidal height units M M=meters

SCS Primary Data
30
Field Data Type Example Units
16 Differential reference station no DGPS input
17 Separator "*" NMEA-0183
18 Checksum 07 NMEA-0183
Note
Add reference the user/operator/ICD manual
Centurion P-Code (Aft) GLL (SCS)
Description: This entry describes the format of data from the Trimble Centurion GPS receiver'sNMEA-GLL position data as logged by SCS.
Directory: SCS_Data/pcode_aft_gll
File Name: Pcode-AFT-GLL_20090807-000000.Raw
Data Examples: (3 lines from a data file):
08/07/2009,13:10:00.283,$GPGLL,7123.6856,N,15715.5432,W,130959.414,A*2D08/07/2009,13:10:01.283,$GPGLL,7123.6843,N,15715.5374,W,131000.414,A*2808/07/2009,13:10:02.283,$GPGLL,7123.6829,N,15715.5316,W,131001.414,A*21
Table 3.40. Centurion P-Code GLL Record (SCS)
Field Data Type Example Units
1 SCS logged Date 08/07/2009 MM/DD/YYYY (from SCS)
2 SCS logged Time UTC 13:00:00.162 Hour:Minute:Second.fraction
3 NMEA Header $GPGLL NMEA-0183
4 Latitude 7124.44850 DDMM.mmmmm
5 Latitude hemisphere N [N|S] N=North
6 Longitude 15719.02547 DDMM.mmmmm
7 Longitude hemisphere W [E|W]
8 Time of position (UTC) 130000.00 hhmmss.ss
9 Data status A A== valid
10 Mode indicator A A== autonomous
11 Separator "*" NMEA-0183
12 Checksum 07 NMEA-0183
Note
Add reference the user/operator/ICD manual.
Centurion P-Code (Aft) VTG (SCS)
Description: This entry describes the format of data from the Trimble Centurion P-Code GPSreceiver's Course and Speed over ground in NMEA VTG-format as logged by SCS.

SCS Primary Data
31
Directory: SCS_Data/pcode_aft_vtg
File Name: Pcode-AFT-VTG_20090807-000000.Raw
Data Examples: (3 lines from a data file):
08/07/2009,13:30:00.323,$GPVTG,125.1,T,100.6,M,008.1,N,015.0,K*4308/07/2009,13:30:01.323,$GPVTG,125.5,T,101.1,M,008.1,N,015.0,K*4108/07/2009,13:30:02.323,$GPVTG,124.5,T,100.1,M,008.1,N,015.0,K*41
Table 3.41. Centurion VTG (SCS)
Field Data Type Example Units
1 SCS logged Date 08/07/2009 MM/DD/YYYY (from SCS)
2 SCS logged Time UTC 13:30:00.323 Hour:Minute:Second.fraction
3 NMEA Header $GPVTG NMEA-0183
4 Vessel heading 125.1 Degrees
5 Heading reference T T=True north
6 Vessel Heading 100.6 Degrees
7 Heading reference M M=Magnetic
8 Vessel speed 008.1 see speed units field
9 Sped units N N=Knots
10 Vessel speed 015.0 see speed units field
11 Speed units K K=km/hr
11 Separator "*" NMEA-0183
12 Checksum 43 NMEA-0183
Centurion P-Code (Aft) ZDA (SCS)
Description: This entry describes the format of data from the Trimble Centurion GPS receiver'sprecision time record in NMEA ZDA-format as logged by SCS.
Directory: SCS_Data/pcode_aft_zda
File Name: Pcode-AFT-ZDA_20090807-000000.Raw
Data Examples: (3 lines from a data file):
08/07/2009,13:30:00.057,$GPZDA,133000.00,07,08,2009,00,00,*4F08/07/2009,13:30:01.057,$GPZDA,133001.00,07,08,2009,00,00,*4E08/07/2009,13:30:02.057,$GPZDA,133002.00,07,08,2009,00,00,*4D
Table 3.42. Centurion ZDA (SCS)
Field Data Type Example Units
1 SCS logged Date 08/07/2009 MM/DD/YYYY (from SCS)
2 SCS logged Time UTC 13:30:00.057 Hour:Minute:Second.fraction
3 NMEA Header $GPZDA NMEA-0183
4 Time (UTC) 133000.00 HHMMSS.ssss
5 Day 07 DD

SCS Primary Data
32
Field Data Type Example Units
6 Month 08 MM
7 Year 2009 YYYY
8 Local zone hours 00 HH
9 Local zone minutes 00 MM
11 Separator "*" NMEA-0183
12 Checksum 71 NMEA-0183
Rockwell-Collins P-Code (Bridge) GGA (SCS)
Description: This entry describes the format of data from the Rockwell-Collins GPS receiver's NMEA-GGA position data as logged by SCS. This receiver is installed on the Bridge.
Directory: SCS_Data/pcode_bridge_gga
File Name: PCode-Bridge-GGA_20090807-000000.Raw
Data Examples: (3 lines from a data file):
08/07/2009,13:49:58.596,$GPGGA,134957.00,7120.604,N,15701.687,W,1,04,1.534,12.48,M,0.438,M,,*4908/07/2009,13:50:00.596,$GPGGA,134959.00,7120.601,N,15701.676,W,1,04,1.534,12.63,M,0.438,M,,*4508/07/2009,13:50:02.596,$GPGGA,135001.00,7120.599,N,15701.665,W,1,04,1.534,12.77,M,0.438,M,,*45
Table 3.43. Rockwell-Collins P-Code GGA Record (SCS)
Field Data Type Example Units
1 SCS logged Date 08/07/2009 MM/DD/YYYY (from SCS)
2 SCS logged Time UTC 13:49:58.596 Hour:Minute:Second.sss
3 NMEA Header $GPGGA NMEA-0183
4 Position Time (UTC) 134957.00 hhmmss.ss
5 Latitude 7120.604 DDMM.mmmm
6 Latitude hemisphere N [N|S] N=North
7 Longitude 15701.687 DDMM.mmmm
8 Longitude hemisphere W [E|W]
9 GPS Quality 1 1=GPS, 2=DGP
10 Number of satellites used 04 Integer
11 HDOP 1.534 Horizontal Dilution ofPrecision
12 Height 12.48 see Height units
13 Height units M M=Meters
14 Geoidal Height 0.438 see Geoidal height units
15 Geoidal height units M M=meters
16 Differential reference station no DGPS input
17 Separator "*" NMEA-0183
18 Checksum 49 NMEA-0183

SCS Primary Data
33
Note
Add reference the user/operator/ICD manual
Rockwell-Collins P-Code (Bridge) GLL (SCS)
Description: This entry describes the format of data from the Rockwell-Collins P-Code GPS receiver'sNMEA-GLL position data as logged by SCS.
Directory: SCS_Data/pcode_bridge_gll
File Name: Pcode-Bridge-GLL_20090807-000000.Raw
Data Examples: (3 lines from a data file):
08/07/2009,13:59:58.671,$GPGLL,7120.231,N,15659.490,W,135957.00,A*1D
08/07/2009,14:00:00.671,$GPGLL,7120.231,N,15659.486,W,135959.00,A*14
08/07/2009,14:00:02.655,$GPGLL,7120.231,N,15659.483,W,140001.00,A*17
Table 3.44. Rockwell-Collins P-Code GLL Record (SCS)
Field Data Type Example Units
1 SCS logged Date 08/07/2009 MM/DD/YYYY (fromSCS)
2 SCS logged Time UTC 13:00:00.162 Hour:Minute:Second.fraction
3 NMEA Header $GPGLL NMEA-0183
4 Latitude 7124.44850 DDMM.mmmmm
5 Latitude hemisphere N [N|S] N=North
6 Longitude 15719.02547 DDMM.mmmmm
7 Longitude hemisphere W [E|W]
8 Time of position (UTC) 130000.00 hhmmss.ss
9 Data status A A== valid
10 Mode indicator A A== autonomous
11 Separator "*" NMEA-0183
12 Checksum 07 NMEA-0183
Note
Add reference the user/operator/ICD manual.
Rockwell-Collins P-Code (Bridge) VTG (SCS)
Description: This entry describes the format of data from the Trimble Centurion P-Code GPSreceiver's Course and Speed over ground in NMEA VTG-format as logged by SCS.
Directory: SCS_Data/pcode_aft_vtg
File Name: Pcode-AFT-VTG_20090807-000000.Raw

SCS Primary Data
34
Data Examples: (3 lines from a data file):
08/07/2009,13:30:00.323,$GPVTG,125.1,T,100.6,M,008.1,N,015.0,K*43
08/07/2009,13:30:01.323,$GPVTG,125.5,T,101.1,M,008.1,N,015.0,K*41
08/07/2009,13:30:02.323,$GPVTG,124.5,T,100.1,M,008.1,N,015.0,K*41
Table 3.45. Centurion VTG (SCS)
Field Data Type Example Units
1 SCS logged Date 08/07/2009 MM/DD/YYYY (from SCS)
2 SCS logged Time UTC 13:30:00.323 Hour:Minute:Second.fraction
3 NMEA Header $GPVTG NMEA-0183
4 Vessel heading 125.1 Degrees
5 Heading reference T T=True north
6 Vessel Heading 100.6 Degrees
7 Heading reference M M=Magnetic
8 Vessel speed 008.1 see speed units field
9 Sped units N N=Knots
10 Vessel speed 015.0 see speed units field
11 Speed units K K=km/hr
11 Separator "*" NMEA-0183
12 Checksum 43 NMEA-0183
Glonass (SCS)
Glonass GGA (SCS)Note: Starting in May 2009 the Glonas Receiver is no longer used.
Description: This entry describes the format of data from the ------- Glonass/GPS receiver's NMEA-GGA position data as logged by SCS.
Directory: SCS_Data/glonass_gga
File Name: Glonass-GGA_20090807-000000.Raw
Data Examples: (3 lines from a data file):
08/07/2009,14:39:59.311,$GPGGA,143959.00,7119.309245,N,15651.055941,W,1,06,1.6,15.893,M,-0.40,M,,*6E08/07/2009,14:40:00.311,$GPGGA,144000.00,7119.309154,N,15651.054451,W,1,06,1.6,15.655,M,-0.40,M,,*6608/07/2009,14:40:01.327,$GPGGA,144001.00,7119.309055,N,15651.053065,W,1,06,1.6,15.442,M,-0.40,M,,*67
Table 3.46. Centurion (Aft P-Code) GGA Record (SCS)
Field Data Type Example Units
1 SCS logged Date 08/07/2009 MM/DD/YYYY (from SCS)
2 SCS logged Time UTC 14:39:59.311 Hour:Minute:Second.fraction
3 NMEA Header $GPGGA NMEA-0183
4 Position Time (UTC) 143959.00 hhmmss.ss

SCS Primary Data
35
Field Data Type Example Units
5 Latitude 7119.309245 DDMM.mmmmm
6 Latitude hemisphere N [N|S] N=North
7 Longitude 15651.055941 DDMM.mmmmm
8 Longitude hemisphere W [E|W]
9 GPS Quality 1 1=GPS, 2=DGP
10 Number of satellites used 06 Integer
11 HDOP 1.6 Horizontal Dilution ofPrecision
12 Height 15.893 see Height units
13 Height units M M=Meters
14 Geoidal Height -0.40 see Geoidal height units
15 Geoidal height units M M=meters
16 Differential reference station no DGPS input
17 Separator "*" NMEA-0183
18 Checksum 6E NMEA-0183
Note
Add reference the user/operator/ICD manual
Glonass/GPS GLL (SCS)Note: Starting in May 2009 the Glonas Receiver is no longer used.
There is an amusing pun, typo, or slip in Tom's July 2009 edition in which this data type is referredto as glasnoss (almost glasnost)
Description: This entry describes the format of data from the Trimble Centurion GPS receiver'sNMEA-GLL position data as logged by SCS.
Directory: SCS_Data/glonass_gll
File Name: Glonass-GLL_20090807-000000.Raw
Data Examples: (3 lines from a data file):
08/07/2009,14:40:00.155,$GPGLL,7119.309154,N,15651.054451,W,144000.00,A*1408/07/2009,14:40:01.155,$GPGLL,7119.309055,N,15651.053065,W,144001.00,A*1108/07/2009,14:40:02.155,$GPGLL,7119.309063,N,15651.051727,W,144002.00,A*14
Table 3.47. Glonass/GPS GLL Record (SCS)
Field Data Type Example Units
1 SCS logged Date 08/07/2009 MM/DD/YYYY (from SCS)
2 SCS logged Time UTC 14:40:00.155 Hour:Minute:Second.sss
3 NMEA Header $GPGLL NMEA-0183
4 Latitude 7119.309154 DDMM.mmmmmm
5 Latitude hemisphere N [N|S] N=North

SCS Primary Data
36
Field Data Type Example Units
6 Longitude 15651.054451 DDMM.mmmmmm
7 Longitude hemisphere W [E|W]
8 Time of position (UTC) 1144000.00 hhmmss.ss
9 Data status A A== valid
10 Separator "*" NMEA-0183
11 Checksum 07 NMEA-0183
Note
Add reference the user/operator/ICD manual.
Sperry MX512
Sperry (MX512) GGA (SCS)
Description: This entry describes the format of data from the Sperry MX512 GPS receiver's NMEA-GGA position data as logged by SCS.
Directory: SCS_Data/mx512_gga
File Name: MX512-GGA_20100901-000000.Raw
Data Examples: (3 lines from a data file):
09/01/2010,00:00:24.754,$GPGGA,000024,7508.5959,N,13857.8750,W,2,10,01.0,20.9,M,-3.2,M,07.0,0138*5909/01/2010,00:00:25.770,$GPGGA,000025,7508.5941,N,13857.8703,W,2,10,01.0,20.9,M,-3.2,M,07.0,0138*5709/01/2010,00:00:26.785,$GPGGA,000026,7508.5923,N,13857.8657,W,2,10,01.0,20.9,M,-3.2,M,04.0,0138*53
Table 3.48. MX512 GGA Record (SCS)
Field Data Type Example Units
1 SCS logged Date 09/01/2010 MM/DD/YYYY (from SCS)
2 SCS logged Time UTC 00:00:24.754 hh:mm:ss.sss
3 NMEA Header $GPGGA NMEA-0183
4 Position Time (UTC) 000024 hhmmss.ss
5 Latitude 7508.5959 DDMM.mmmmm
6 Latitude hemisphere N [N|S] N=North
7 Longitude 13857.8750 DDMM.mmmmm
8 Longitude hemisphere W [E|W]
9 GPS Quality 2 1=GPS, 2=DGP
10 Number of satellites used 10 Integer
11 HDOP 1.0 Horizontal Dilution ofPrecision
12 Altitude re: mean-sea-level(geoid)
20.09 meters
13 Height units M M=Meters

SCS Primary Data
37
Field Data Type Example Units
14 Geoidal Separation -3.2 meters
15 Geoidal height units M M=meters
16 Age of Differential GPSdata
07.0 seconds
17 Differential reference stationID
0138 integer
18 separator "*" NMEA-0183
19 Checksum 07 NMEA-0183
Note
Add reference the user/operator/ICD manual
Sperry (MX512) GLL (SCS)
Description: This entry describes the format of data from the Sperry MX512 GPS receiver's NMEA-GLL position data as logged by SCS.
Directory: SCS_Data/mx512_gll
File Name: Pcode-AFT-GLL_20100901-000000.Raw
Data Examples: (3 lines from a data file):
09/01/2010,00:01:46.005,$GPGLL,7508.4553,N,13857.4738,W,000144.714,A*2809/01/2010,00:01:47.005,$GPGLL,7508.4536,N,13857.4688,W,000145.714,A*2009/01/2010,00:01:48.052,$GPGLL,7508.4519,N,13857.4640,W,000146.714,A*2A
Table 3.49. MX512 GLL Record (SCS)
Field Data Type Example Units
1 SCS logged Date 09/01/2010 MM/DD/YYYY (from SCS)
2 SCS logged Time UTC 00:01:46.005 hh:mm:ss.sss
3 NMEA Header $GPGLL NMEA-0183
4 Latitude 7508.4553 DDMM.mmmmm
5 Latitude hemisphere N [N|S] N=North
6 Longitude 13857.4738 DDMM.mmmmm
7 Longitude hemisphere W [E|W]
8 Time of position (UTC) 000144.714 hhmmss.ss
9 Mode indicator A A== autonomous
10 Separator "*" NMEA-0183
11 Checksum 07 NMEA-0183
Note
Add reference the user/operator/ICD manual.

SCS Primary Data
38
Sperry (MX512) HDT (SCS)
Description: This entry describes the format of data from the Sperry MX512 GPS receiver's NMEA-HDT heading data as logged by SCS.
Directory: SCS_Data/mx512_hdt
File Name: MX512-HDT_20100901-000000.Raw
Data Examples: (3 lines from a data file):
09/01/2010,00:03:38.788,$GPHDT,142.47,T*0109/01/2010,00:03:40.757,$GPHDT,142.47,T*01 09/01/2010,00:03:42.804,$GPHDT,142.46,T*00
Table 3.50. MX512 GLL Record (SCS)
Field Data Type Example Units
1 SCS logged Date 09/01/2010 MM/DD/YYYY (from SCS)
2 SCS logged Time UTC 00:03:38.788 hh:mm:ss.sss
3 NMEA Header $GPHDT NMEA-0183
4 Heading 142.47 Degrees
5 Heading Reference T T== True North
6 Separator "*" NMEA-0183
7 Checksum 01 NMEA-0183
Note
Add reference the user/operator/ICD manual.
Sperry (MX512) VTG (SCS)
Description: This entry describes the format of data from the Sperry MX512 GPS receiver's Courseand Speed over ground in NMEA VTG-format as logged by SCS.
Directory: SCS_Data/mx512_vtg
File Name: MX512-VTG_20100901-000000.Raw
Data Examples: (3 lines from a data file):
09/01/2010,00:03:07.866,$GPVTG,144,T,106,M,07.7,N,14.3,K,D*2609/01/2010,00:03:09.866,$GPVTG,145,T,107,M,07.7,N,14.2,K,D*2709/01/2010,00:03:11.881,$GPVTG,145,T,106,M,07.8,N,14.5,K,D*2E
Table 3.51. MX512 VTG (SCS)
Field Data Type Example Units
1 SCS logged Date 09/01/2010 MM/DD/YYYY (from SCS)
2 SCS logged Time UTC 00:03:07.866 hh:mm:ss.sss
3 NMEA Header $GPVTG NMEA-0183
4 Vessel heading 144 Degrees
5 Heading reference T T=True north

SCS Primary Data
39
Field Data Type Example Units
6 Vessel Heading 106 Degrees
7 Heading reference M M=Magnetic
8 Vessel speed 07.7 see speed units field
9 Speed units N N=Knots
10 Vessel speed 14.3 see speed units field
11 Speed units K K=km/hr
11 Mode Indicator D NMEA-0183
12 Separator "*" NMEA-0183
13 Checksum 26 NMEA-0183
Sperry Gyroscopes
MK27 Sperry Gyroscope
Description: This entry describes the format of data from Sperry MK27 NMEA-HTD heading dataas logged by SCS.
Directory: SCS_Data/gyro_mk27
File Name: Gyro-MK27_20090807-000000.Raw
Data Examples: (3 lines from a data file):
08/07/2009,14:50:01.729,$HEHDT,206.79,T*15
08/07/2009,14:50:01.823,$HEHDT,206.80,T*13
08/07/2009,14:50:01.933,$HEHDT,206.77,T*1B
Table 3.52. MK27 Gyro Record (SCS)
Field Data Type Example Units
1 SCS logged Date 08/07/2009 MM/DD/YYYY (from SCS)
2 SCS logged Time UTC 14:50:012 Hour:Minute:Second.fraction
3 NMEA Header $GPHDT NMEA-0183
4 Heading 206.79 Degrees
5 Heading Reference T T== True North
6 Separator "*" NMEA-0183
7 Checksum 15 NMEA-0183
Note
Add reference the user/operator/ICD manual.
MK39 Sperry Gyrocompass
Description: This entry describes the format of data from the Sperry MK39 Gyro's NMEA-HTDheading data as logged by SCS.
Directory: SCS_Data/gyro_mk39

SCS Primary Data
40
File Name: Gyro-MK39_20090807-000000.Raw
Data Examples: (3 lines from a data file):
08/07/2009,14:50:01.933,$INHDT,206.11,T*11
08/07/2009,14:50:02.026,$INHDT,206.10,T*10
08/07/2009,14:50:02.136,$INHDT,206.10,T*10
Table 3.53. MK39 Gyro Record (SCS)
Field Data Type Example Units
1 SCS logged Date 08/07/2009 MM/DD/YYYY (from SCS)
2 SCS logged Time UTC 14:50:01.933 Hour:Minute:Second.fraction
3 NMEA Header $INHDT NMEA-0183
4 Heading 206.11 Degrees
5 Heading Reference T T== True North
6 Separator "*" NMEA-0183
7 Checksum 11 NMEA-0183
Note
Add reference the user/operator/ICD manual.
IBS way points (SCS)
Description: This entry describes the format of data from the Integrated Bridge System (IBS) NMEA-NVWPL way point data as logged by SCS.
Directory: SCS_Data/ibs_waypoints
File Name: IBS-WayPoints_20070415-000000.Raw
Data Examples: (3 lines from a data file):
04/15/2007,00:00:03.193,$NVWPL,6152.68,N,17402.58,W,62*5104/15/2007,00:00:04.193,$NVWPL,6156.58,N,17422.68,W,63*5604/15/2007,00:00:05.193,$NVWPL,6202.16,N,17439.96,W,64*52
Table 3.54. IBS way points Record (SCS)
Field Data Type Example Units
1 SCS logged Date 04/15/2007 MM/DD/YYYY (from SCS)
2 SCS logged Time UTC 00:00:03.193 Hour:Minute:Second.fraction
3 NMEA Header $NVWPL NMEA-0183
4 Latitude 6152.68 DDMM.mm
5 Latitude Hemisphere N N==North
6 Longitude 17402.58 DDDMM.mm
7 Longitude Hemisphere W W==West
8 way point Number 62 ASCII Integer
9 Separator "*" NMEA-0183

SCS Primary Data
41
Field Data Type Example Units
10 Checksum 51 NMEA-0183
Note
Add reference the user/operator/ICD manual.
Sperry SRD500 Doppler Speed Log (SCS)
Note
The Sperry SRD500 installation was not designed with an ice window to protect thetransducer so, after damaging two transdcuers, we normally retract the transducer whenoperating in or near ice to prevent damage. Therefore there are often long periods,sometimes whole cruises, when there is no data from the SRD500.
Description: This entry describes the format of data from the Sperry SRD500 doppler speed log'sNMEA-VDVBW ground and water speed data as logged by SCS.
Directory: SCS_Data/sperry_speedlog
File Name: Sperry-Speedlog_20070415-000000.Raw
Data Examples: (3 lines from a data file):
04/15/2007,00:00:02.755,$VDVBW,12.32,0.85,A,12.43,0.66,A*5A04/15/2007,00:00:03.271,$VDVBW,12.33,0.80,A,12.44,0.66,A*5904/15/2007,00:00:03.771,$VDVBW,12.34,0.78,A,12.45,0.68,A*56
Table 3.55. SRD500 Record (SCS)
Field Data Type Example Units
1 SCS logged Date 04/15/2007 MM/DD/YYYY (from SCS)
2 SCS logged Time UTC 00:00:02.755 Hour:Minute:Second.sss
3 NMEA Header $VDVBW NMEA-0183
4 Fore/aft water speed 12.32 Knots, - = Astern
5 Stbd/port water Speed T Knots, - = Stbd
6 Water Speed Flag A A= Data Valid V=Invalid
7 Fore/aft bottom speed 12.43 Knots, - = Astern
8 Stbd/port bottom speed 0.66 Knots, - = Stbd
9 Bottom Speed Flag A A=Data Valid V=Invalid
10 Separator "*" NMEA-0183
11 Checksum 11 NMEA-0183
Note
Add reference the user/operator/ICD manual.
SV2000 (SCS)Note: The SV2000 installed in the ADCP150 well was only used for the BB150 ADCP. Since the BB150was replaced with an OS150 (on loan from UAF) in April 2010, this sensor is no longer necessaryso it is no longer in operation.

SCS Primary Data
42
This sensor is installed inside the ADCP150 transducer well and measures the speed of sound in thefluid in the well. These measurements should only be used for processing ADCP150 data.
Description: This entry describes the format of data from the ODEC SV2000 direct measuring acousticvelocimeter data as logged by SCS.
Directory: SCS_Data/sv2000
File Name: Sound-Velocimeter_20080314-000000.Raw
Data Examples:(3 lines from a data file):
03/14/2008,00:00:24.999, 1470.87
03/14/2008,00:00:55.030, 1470.87
03/14/2008,00:01:25.045, 1470.87
Table 3.56. SV2000 Record (SCS)
Field Data Type Example Units
1 SCS logged Date 08/07/2009 MM/DD/YYYY (from SCS)
2 SCS logged Time UTC 14:50:01.933 Hour:Minute:Second.fraction
3 Sound speed 1470.87 dddd.dd, meters/second
4 Separator "*" NMEA-0183
5 Checksum 11 NMEA-0183
Note
Add reference the user/operator/ICD manual.
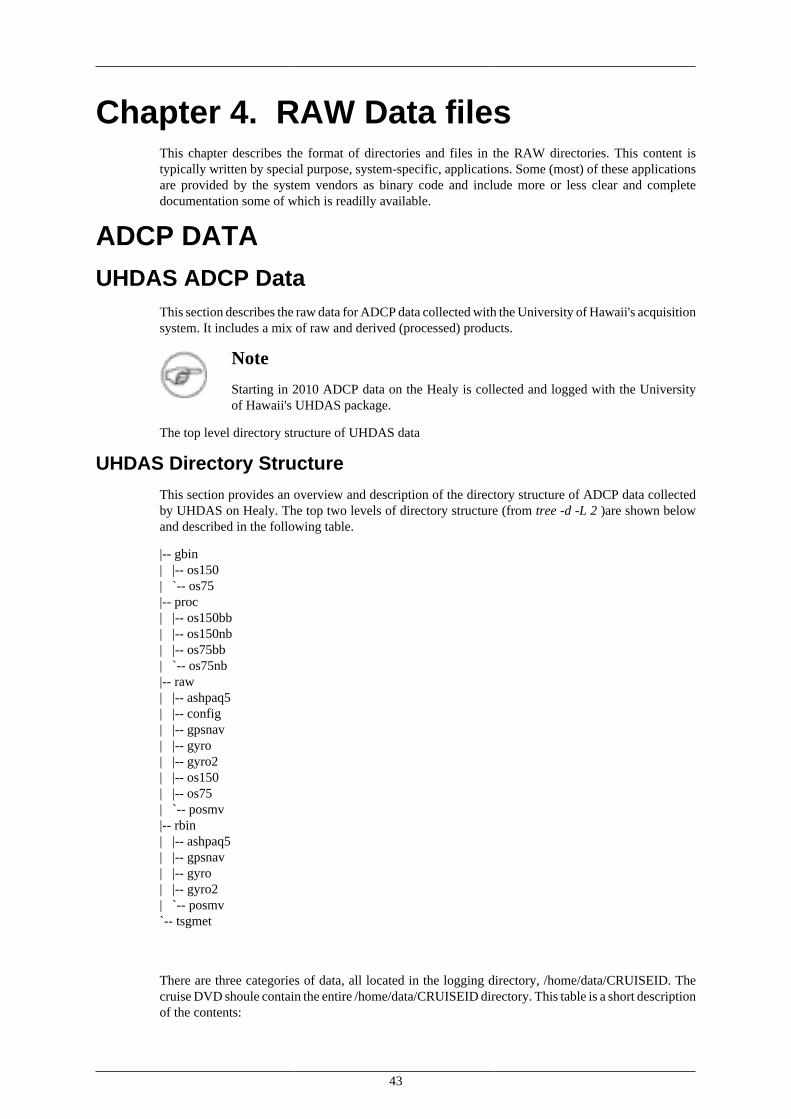
43
Chapter 4. RAW Data filesThis chapter describes the format of directories and files in the RAW directories. This content istypically written by special purpose, system-specific, applications. Some (most) of these applicationsare provided by the system vendors as binary code and include more or less clear and completedocumentation some of which is readilly available.
ADCP DATAUHDAS ADCP Data
This section describes the raw data for ADCP data collected with the University of Hawaii's acquisitionsystem. It includes a mix of raw and derived (processed) products.
Note
Starting in 2010 ADCP data on the Healy is collected and logged with the Universityof Hawaii's UHDAS package.
The top level directory structure of UHDAS data
UHDAS Directory Structure
This section provides an overview and description of the directory structure of ADCP data collectedby UHDAS on Healy. The top two levels of directory structure (from tree -d -L 2 )are shown belowand described in the following table.
|-- gbin| |-- os150| `-- os75|-- proc| |-- os150bb| |-- os150nb| |-- os75bb| `-- os75nb|-- raw| |-- ashpaq5| |-- config| |-- gpsnav| |-- gyro| |-- gyro2| |-- os150| |-- os75| `-- posmv|-- rbin| |-- ashpaq5| |-- gpsnav| |-- gyro| |-- gyro2| `-- posmv`-- tsgmet
There are three categories of data, all located in the logging directory, /home/data/CRUISEID. Thecruise DVD shoule contain the entire /home/data/CRUISEID directory. This table is a short descriptionof the contents:

RAW Data files
44
Table 4.1. Top Level UHDAS Directory Structure: Data for Scientists
subdirectory contents importance back up for ...
raw all raw data critical archiving
rbin intermediate files nice to have anyone who gets ‘raw’
gbin intermediate files nice to have anyone who gets ‘raw’
proc processed data
codas database
underway figure archive
matlab files
final at-sea product science CD after cruise
RDI VMDAS ADCP DataThis section describes the data format for files logged with the RDI VMDAS Windows application.Starting in 2010 ADCP data on the Healy is collected and logged with the University of Hawaii'sUHDAS package.
75 kHz RDI ADCP (OS75)
Description: The shipboard ADCP system measures currents in the depth range from about 30 to 300m -- in good weather. In bad weather or in ice, the range is less, and sometimes no valid measurementsare made. ADCP data collection occurs on the Healy for the benefit of the scientists on individualcruises and for the long-term goal of building a climatology of current structure in the ocean. TheADCP 75 data set collected during this cruise are placed in the directory ./Raw/adcp75. The filesare named by the cruise, HLY0902, a three place number of the sequence in the files, then an extra“_000000”, and then an extention for the kind of data in the file. An example of the files for one setis shown in the table below.
Directory: Raw/adcp75
ADCP75 Files
Table 4.2. ADCP 75 File Types
Item File Name Extension Content
1 HLY0901022_000000 Raw Binary ADCPData
2 HLY0901022_000000 .ENS Binary Adcp Data
3 HLY0901022_000000 .ENX Binary Ensemble Data
4 HLY0901022_000000 .STA Short Term Averages
5 HLY0901022_000000 .LTA Long Term Averages
6 HLY0901022_000000 .N1R Raw NMEA ASCIIinput
7 HLY0901022_000000 .N2R Raw NMEA ASCIIinput
8 HLY0901022_000000 .NMS Averaged Nav Data
9 ...
12 HLY0901* .INI Configuration File

RAW Data files
45
RDI 150 kHz ADCP (OS150)This section describes the data format for ADCP data logged with the RDI VMDAS Windowsapplication.Starting in 2010 ADCP data on the Healy is collected and logged with the University of Hawaii'sUHDAS package.
Description: The shipboard ADCP system measures currents in the depth range from about 30 to 300m -- in good weather. In bad weather or in ice, the range is less, and sometimes no valid measurementsare made. ADCP data collection occurs on the Healy for the benefit of the scientists on individualcruises and for the long-term goal of building a climatology of current structure in the Ocean. TheADCP150 data set collected during this cruise are placed in the directory ./Raw/adcp150. The filesare named by the cruise, HLY0902, a three place number of the sequence in the files, then an extra“_000000”, and then an extent for the kind of data in the file. An example of the files for one set isshown in the table below.
Directory: Raw/adcp150
Table 4.3. ADCP 150 File Types
Item File Name Extension Content
1 HLY0901022_000000 Raw Binary ADCPData
2 HLY0901022_000000 .ENS Binary Adcp Data
3 HLY0901022_000000 .ENX Bniary Ensemble Data
4 HLY0901022_000000 .STA Short Term Averages
5 HLY0901022_000000 .LTA Long Term Averages
6 HLY0901022_000000 .N1R Raw NMEA ASCIIinput
7 HLY0901022_000000 .N2R Raw NMEA ASCIIinput
8 HLY0901022_000000 .NMS Averaged Nav Data
9 ...
12 HLY0901* .INI Configuration File
Bathymetry Data
Kongsberg EM122 multibeamVerification of real-time logging of EM122 data is still in process. Until this data stream is validated,the raw data files as logged on the Kongsberg SIS Hyrdographic Workstation (HWS) is included inthe "raw" section of the data distribution.
Description: The Kongsberg EM122 multibeam bottom mappig sonar was installed on the Healyduring the CY2009-2010 maintenance period at Todd Pacific Shipyard in Seattle, WA. This sonarroutinely collects bathymetry and seafloor image data as well as water column. It is also capable ofcollecting raw "stave" (or hydrophone data) but this is not done routinely.
Directory: Raw/EM_122_RawData/HLY1001_01/
Within this directory, there are separate directories for each "survey" collected by the SIS application.Survey's tend to end when the SIS is restarted for some reason. Under special circumstances, survey'smay be used to separate data from different events. Survey directories are named: HLY1001_01/

RAW Data files
46
Table 4.4. Kongsberg EM122 Raw data file types
Item File Name Extension Content
1 0000_20100619_233632_Healy .all Binary Kongsberg".all" format. MB-System type 58 fileor .mb58
2 0000_20100619_233632_Heal .wcd Binary Kongsbergwater column data
KNUDSEN 320B/R
Description: The Knudsen 320B/R depth sounder has two independent transceivers. One is tuned forand connected to an ODEC TC12/36 hull mounted transducer. The other is matched to an array of 16tr-109 subbottom transducers. It is capable of simultaneously operating at 12 kHz and as a subbottomprofiler in either tone burst (3.5 kHz) or "chirp" (3-6kHz) mode. The Healy routinely operates the 3 -6kHz "chirp" (Sub Bottom Profile) mode except in special situation such as communicating with and,or ranging on acoustic releases or bottom tracking pingers. We do not operate the 12 kHz sounder asit interferes with the multibeam. Historically, Knudsen data has been saved in all of the formats thatthe Knudsen can record data in. These files are ASCII, mixed ASCII/Binary and binary format (seethe table below). In the future we may elect to drop logging the Knudsen binary data and continuelogging the SEG-Y formatted data. The nominal, uncorrected, water depth is also logged as an ASCIINMEA data type by SCS.
Directory: Raw/knudsenraw
Table 4.5. Knudsen File Types
Item File Name Extension Content
1 2007_102_0005_004 .keb Binary Knudsen format
2 2007_102_0005_004 .kea Log file ofconfiguration data,ASCII
3 2007_102_0005_HF_001 .sgy SEG-Y subbottom data,Mixed
CTDDescription: Data for the each CTD cast are contained in subdirectories under this directory. Thesefiles are in the native format written by SeaBird's SeaSave application format. Each cast is in aseparately numbered subdirectory. The Names of the files vary by cruise but file extent examplesbelow will be consistent.
Directory: Raw/ctd
Table 4.6. CTD File Types
Item File Name Extension Content
1 021 .BL Bottle firing info
2 021 .CON Configuration File
3 021 .HDR Header information forthe cast
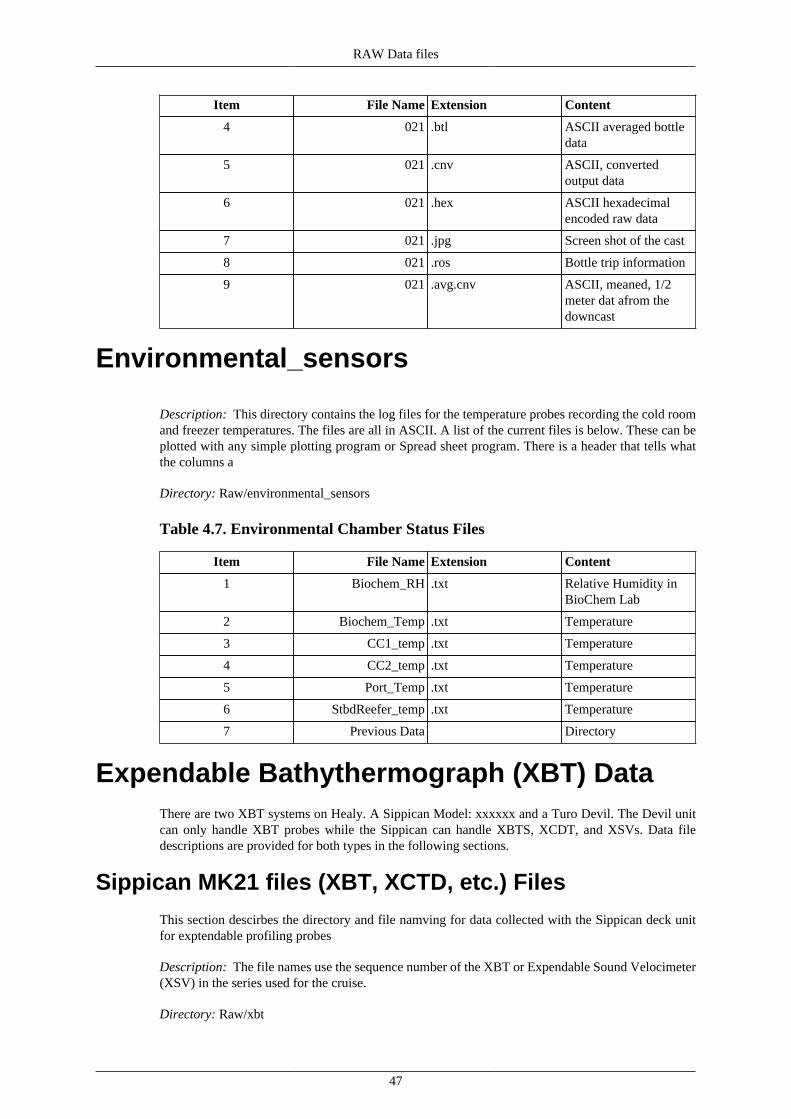
RAW Data files
47
Item File Name Extension Content
4 021 .btl ASCII averaged bottledata
5 021 .cnv ASCII, convertedoutput data
6 021 .hex ASCII hexadecimalencoded raw data
7 021 .jpg Screen shot of the cast
8 021 .ros Bottle trip information
9 021 .avg.cnv ASCII, meaned, 1/2meter dat afrom thedowncast
Environmental_sensors
Description: This directory contains the log files for the temperature probes recording the cold roomand freezer temperatures. The files are all in ASCII. A list of the current files is below. These can beplotted with any simple plotting program or Spread sheet program. There is a header that tells whatthe columns a
Directory: Raw/environmental_sensors
Table 4.7. Environmental Chamber Status Files
Item File Name Extension Content
1 Biochem_RH .txt Relative Humidity inBioChem Lab
2 Biochem_Temp .txt Temperature
3 CC1_temp .txt Temperature
4 CC2_temp .txt Temperature
5 Port_Temp .txt Temperature
6 StbdReefer_temp .txt Temperature
7 Previous Data Directory
Expendable Bathythermograph (XBT) DataThere are two XBT systems on Healy. A Sippican Model: xxxxxx and a Turo Devil. The Devil unitcan only handle XBT probes while the Sippican can handle XBTS, XCDT, and XSVs. Data filedescriptions are provided for both types in the following sections.
Sippican MK21 files (XBT, XCTD, etc.) Files
This section descirbes the directory and file namving for data collected with the Sippican deck unitfor exptendable profiling probes
Description: The file names use the sequence number of the XBT or Expendable Sound Velocimeter(XSV) in the series used for the cruise.
Directory: Raw/xbt

RAW Data files
48
Table 4.8. Sipppican XBT File Types
Item File Name Extension Content
1 T7_00036 EDF T7 XBT data in ExportData Format (ASCII)
2 T7_00036 RDF T7 XBT data inSippican proprietaryRaw Data Format
An example of an Export Data File is shown here:
// This is a MK21 EXPORT DATA FILE (EDF)//Date of Launch: 07/06/2010Time of Launch: 05:49:51Sequence # : 45Latitude : 71 50.45264NLongitude : 165 10.30078WSerial # : 00000000//// Here are the contents of the memo fields.//HLY1001//// Here is some probe information for this drop.//Probe Type : T-7Terminal Depth : 760 mDepth Equation : StandardDepth Coeff. 1 : 0.0Depth Coeff. 2 : 6.691Depth Coeff. 3 : -0.00225Depth Coeff. 4 : 0.0Pressure Pt Correction: 100.0%//Raw Data Filename: C:\Program Files\Sippican\WinMK21\DATA\T7_00045.RDF//Display Units : Metric//// This XBT export file has not been noise reduced or averaged.//// Sound velocity derived with assumed salinity: 34.00 ppt//Depth (m) - Temperature (<B0>C) - Sound Velocity (m/s)0.0 1.30 1453.670.7 1.22 1453.361.3 1.15 1453.052.0 1.10 1452.842.7 1.09 1452.813.3 1.07 1452.724.0 0.97 1452.294.7 0.89 1451.955.4 0.88 1451.87
Sippican MK21 files XCTD FilesThis section describes the directory and file naming for data collected with the Sippican MK21 deckunit for eXpendable CTD profiling probes

RAW Data files
49
Description: The file names use the sequence number of the probe in the series used for the cruise.
Directory: Raw/xctd
Table 4.9. Sipppican XBT File Types
Item File Name Extension Content
1 C3_00021 EDF XCTD data in ExportData Format (ASCII)
2 C3_00021 RDF XCTD data in Sippicanproprietary format
An example of an Export Data File is shown here:
// This is a MK21 EXPORT DATA FILE (EDF)//Date of Launch: 07/05/2010Time of Launch: 17:44:03Sequence # : 34Latitude : 71 23.83252NLongitude : 162 15.91797WSerial # : 08112231//// Here are the contents of the memo fields.//HLY1001//// Here is some probe information for this drop.//Probe Type : XCTD-1Terminal Depth : 1100 mDepth Equation : StandardDepth Coeff. 1 : 0.0Depth Coeff. 2 : 3.425432Depth Coeff. 3 : -0.00047Depth Coeff. 4 : 0.0Pressure Pt Correction: 100.0%//Raw Data Filename: C:\Program Files\Sippican\WinMK21\DATA\C3_00034.RDF//Display Units : Metric//// This XCTD export file has not been noise reduced or averaged.//Depth (m) - Temperature (<B0>C) - Conductivity (mS/cm) - Salinity (ppt) - Sound Velocity (m/s) - Density (kg/m<B3>)0.0 3.60 17.02 17.41 1442.29 1013.840.1 3.61 27.24 29.09 1457.35 1023.120.3 3.61 29.01 31.19 1460.06 1024.790.4 3.61 29.50 31.76 1460.80 1025.250.5 3.61 29.99 32.35 1461.57 1025.720.7 3.61 30.17 31.19 1460.07 1024.800.8 3.60 30.28 31.76 1460.77 1025.251.0 3.58 30.31 32.36 1461.45 1025.731.1 3.58 30.34 32.59 1461.75 1025.921.2 3.59 30.37 32.73 1461.97 1026.02
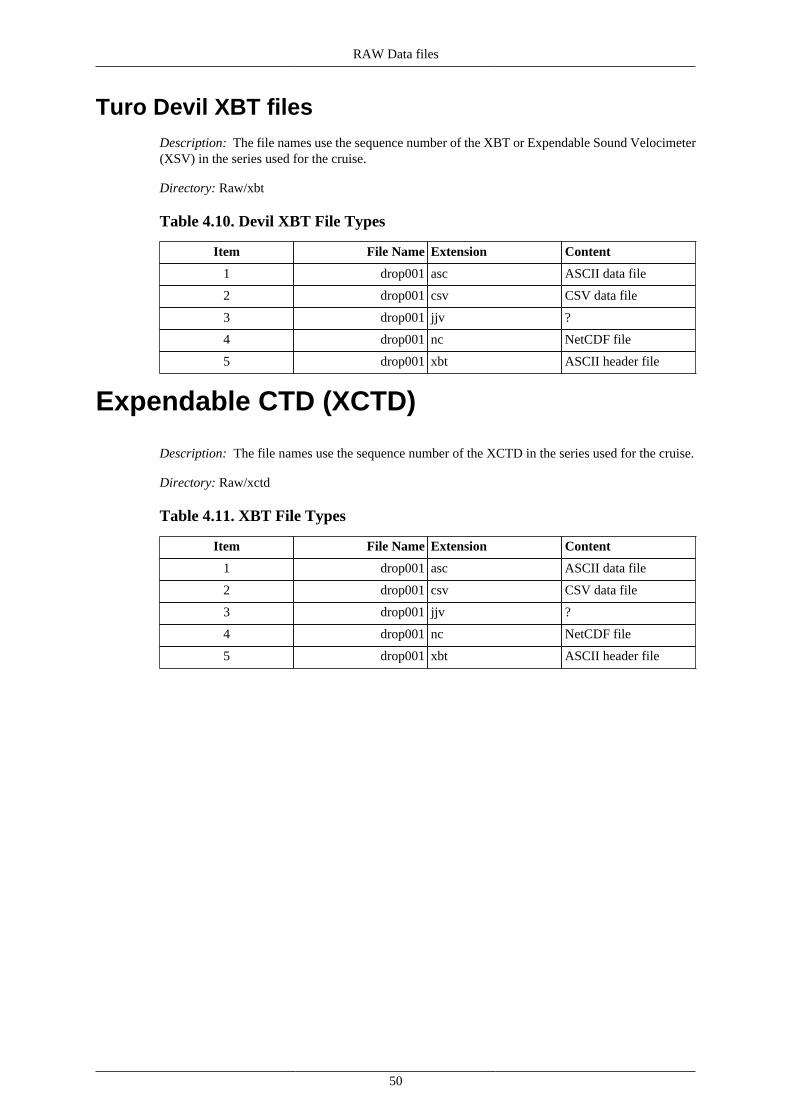
RAW Data files
50
Turo Devil XBT filesDescription: The file names use the sequence number of the XBT or Expendable Sound Velocimeter(XSV) in the series used for the cruise.
Directory: Raw/xbt
Table 4.10. Devil XBT File Types
Item File Name Extension Content
1 drop001 asc ASCII data file
2 drop001 csv CSV data file
3 drop001 jjv ?
4 drop001 nc NetCDF file
5 drop001 xbt ASCII header file
Expendable CTD (XCTD)
Description: The file names use the sequence number of the XCTD in the series used for the cruise.
Directory: Raw/xctd
Table 4.11. XBT File Types
Item File Name Extension Content
1 drop001 asc ASCII data file
2 drop001 csv CSV data file
3 drop001 jjv ?
4 drop001 nc NetCDF file
5 drop001 xbt ASCII header file

51
Chapter 5. Lamont Data System (LDS)Primary Data
Many of the data types logged by LDS are also logged by SCS. There are two primary differences:
1. LDS uses a different format of time stamp
2. LDS does not separate different records from the same device into different data files the way SCSdoes.
The format descriptions of many of the LDS files will be added in a later version.
Navigational Data
Thales (Ashtech) ADU5 GPSThe ADU5 is an upgraded version of the original ADU2 3D GPS orignally introduced by Ashtech.The ADU 2 was replaced with the ADU 5 in ~2005. Ashtech was bought by Thales.
Description: This entry describes the format of data from the Thales ADU5 GPS receiver's NMEA-GGA position data as logged by LDS.
Directory: LDS_Data/adu5
File Name: HLY1001-adu5.y2010d190
Data Examples: A typical sequence from the a data file:
adu5 2010:190:17:50:01.1917$GPGLL,7144.88657,N,15600.29039,W,175001.00,A,A*78 adu52010:190:17:50:01.2447$GPGGA,175001.00,7144.88657,N,15600.29039,W,1,11,0.7,22.03,M,-0.89,M,,*55adu5 2010:190:17:50:01.2977$GPVTG,106.86,T,086.14,M,000.29,N,000.54,K,A*2B adu52010:190:17:50:01.4038$GPPAT,175001.00,7144.88657,N,15600.29039,W,00021.14,135.9840,000.12,000.63,0.0016,0.0161,0*65adu5 2010:190:17:50:01.4177 $GPHDT,135.984,T*37
Ashtech (ADU5) $GPGLL Message format
adu5 2010:190:17:50:01.1917$GPGLL,7144.88657,N,15600.29039,W,175001.00,A,A*78
Table 5.1. ADU5 GLL Message
Field Data Type Example Units
1 Tag adu5 Data type/source ID in LDS
2 LDS logged date & Time 2010:190:17:50:01.1917 YYYY:DDD:HH:MM:SS.ssss
3 NMEA Header $GPGLL NMEA-0183
4 Latitude 7144.88657 DDMM.mmmmm
5 Latitude hemisphere N [N|S] N=North
6 Longitude 15600.29039 DDMM.mmmmm
7 Longitude hemisphere W [E|W]

Lamont Data System(LDS) Primary Data
52
Field Data Type Example Units
8 Fix Time 175001.00 HHMMSS.ss
9 Fix Status A Status of the position fix(always A): A = valid V =invalid
10 Positioning system modeindicator:
A A: Autonomous mode D: Differential mode E: Estimated (DR) mode M: Manual input mode S: Simulator mode N: Data not valid
11 Separator "*" NMEA-0183
12 Checksum 55 NMEA-0183
Ashtech (ADU5) $GPVTG NMEA Message format
adu5 2010:190:17:50:01.2977$GPVTG,106.86,T,086.14,M,000.29,N,000.54,K,A*2B
The VTG message contains the actual track (COG) and speed (SOG) over the ground.
Table 5.2. ADU5 $VTG Message
Field Data Type Example Units
1 Tag adu5 Data type/source ID in LDS
2 LDS logged date & Time 2010:190:17:50:01.2447 YYYY:DDD:HH:MM:SS.ssss
3 NMEA Header $GPVTG NMEA-0183
4 Course 106.86 Decimal degrees
5 Course Refernece T Always T=True North
6 Course over the ground 086.14 Decimal degrees
7 Course reference M Always M=Magnetic North
8 Speed over the ground 000.29 Speed
9 Speed Units N Speed units = Knots
10 Speed 000.54 Speed
11 Speed units K k=Kilometers/hour
12 Positioning system modeindicator
AA—Autonomous modeD—Differential modeE—Estimated (DR) modeM—Manual input modeS—Simulator mode N—Data not valid
13 Separator "*" NMEA-0183
14 Checksum 55 NMEA-0183
Ashtech (ADU5) $GPGGA NMEA Message format
adu5 2010:190:17:50:01.2447$GPGGA,175001.00,7144.88657,N,15600.29039,W,1,11,0.7,22.03,M,-0.89,M,,*55

Lamont Data System(LDS) Primary Data
53
Table 5.3. ADU5 $GPGGA Message
Field Data Type Example Units
1 Tag adu5 Data type/source ID in LDS
2 LDS Time Stamp 2010:190:17:50:01.2447 YYYY:DDD:HH:MM:SS.ssss
3 NMEA Header $GPGGA NMEA-0183
4 Position Time (UTC) 175001.00 hhmmss.ss
5 Latitude 7144.88657 DDMM.mmmmm
6 Latitude hemisphere N [N|S] N=North
7 Longitude 15600.29039 DDMM.mmmmm
8 Longitude hemisphere W [E|W]
9 GPS Quality 1 1=GPS, 2=DGP
10 Number of satellites used 11 Integer
11 HDOP 0.7 Horizontal Dilution ofPrecision
12 Height 22.03 see Height units
13 Height units M M=Meters
14 Geoidal Height -0.89 see Geoidal height units
15 Geoidal height units M M=meters
17 Separator "*" NMEA-0183
18 Checksum 55 NMEA-0183
Ashtech (ADU5) $GPHDT NMEA Message format
adu5 2010:190:17:50:01.4038$GPPAT,175001.00,7144.88657,N,15600.29039,W,00021.14,135.9840,000.12,000.63,0.0016,0.0161,0*65
Table 5.4. ADU5 HTD Record (SCS)
Field Data Type Example Units
1 LDS ID adu5 MM/DD/YYYY (from SCS)
2 LDS Time Tag 2010:190:17:50:01.4177 YYYY:DDD:HH:MM:SS.ssss
3 NMEA Header $GPHDT NMEA-0183
4 Heading 135.984 Degrees
5 Heading Reference T T== True North
6 Separator "*" NMEA-0183
7 Checksum 07 NMEA-0183
Ashtech (ADU5) $GPPAT NMEA Message format
This section describes the $GPPAT, the Ashtech proprietary position and altitude message .
adu5 2010:190:17:50:01.4038$GPPAT,175001.00,7144.88657,N,15600.29039,W,00021.14,135.9840,000.12,000.63,0.0016,0.0161,0*65
Table 5.5. ADU5 GPPAT Record Format (LDS)
Field Data Type Example Units
1 LDS ID adu5 MM/DD/YYYY (from SCS)

Lamont Data System(LDS) Primary Data
54
Field Data Type Example Units
2 LDS Time Tag 2010:190:17:50:01.4038 YYYY:DDD:HH:MM:SS.ssss
3 NMEA Header $GPPAT NMEA-0183
4 Time 175001.00 HHMMSS.ss
5 Latitude 7144.88657 DDMM.mmmmm
Latitude Hemisphere N N: NorthS: South
Longitude 15600.29039 DDD.MM.mmmmm(Degrees, Minutes)
Longitude Hemisphere W W: WestE: East
Altitude 00021.14 +/-mmmm.mm (Meters)
Heading 135.9840 Degrees relative True North
Pitch 000.12 +/-ddd.dd (Degrees)
Roll 000.63 +/-ddd.dd (Degrees)
Attitude phase measurementRMS error, MRMS
0.0016 m.mmmm, (Meters)
Attitude baseline length rmserror, BRMS
0.0161 m.mmmm(Meters)
Attitude reset flag 0 0:good attitude1:rough estimate or bad attitude
6 Separator "*" NMEA-0183
7 Checksum 65 NMEA-0183: Hexadecimalchecksum computed byexclusive ORing all bytesbetween, but not including,$ and *
Trimble AG132 Differential Global Positioning System(GPS)
The Trimble AG132 is single frequency (L1) GPS receiver with two DGPS receivers. DGPScorrections can be received from the 100 kHz USCG reference stations or from corrections broadcastby satellite. USCG corrections are general not available in Healy's areas of science operation. SatelliteDGPS corrections require a subscription which has to be arranged well in advance of use.
Description: This entry describes the format of data from the Trimbel AG132 DGPS receiver's dataas logged by LDS.
Directory: LDS_Data/aggps
File Name: HLY1001-aggps.y2010d191
Data Examples: A typical sequence from the a data file:
aggps 2010:191:12:40:55.2310$GPGGA,124055.00,7203.058972,N,15607.704972,W,1,10,0.7,23.34,M,0.04,M,,*70aggps 2010:191:12:40:55.2810$GPGLL,7203.058972,N,15607.704972,W,124055.00,A,A*71 aggps2010:191:12:40:55.3310 $GPVTG,291.4,T,,,000.51,N,000.94,K,A*47aggps 2010:191:12:40:55.4060

Lamont Data System(LDS) Primary Data
55
$GPGSV,3,1,10,32,27,222,46,28,25,289,45,11,48,257,50,17,18,323,45*74aggps 2010:191:12:40:55.4811$GPGSV,3,2,10,19,24,191,46,27,25,012,47,09,28,024,49,24,16,124,40*74aggps 2010:191:12:40:55.5310$GPGSV,3,3,10,14,44,125,49,22,33,085,50,,,,,,,,*7E aggps2010:191:12:40:55.6071$GPGSA,A,3,32,28,11,17,19,27,09,24,14,22,,,2.4,0.7,2.3*38 aggps2010:191:12:40:55.6320 $GPZDA,124055.13,10,07,2010,00,00*66 aggps2010:191:12:40:55.7071$GPRMC,124055,V,7203.058972,N,15607.704972,W,000.51,291.4,100710,27.8,E,N*1Baggps 2010:191:12:40:55.7381 $PTNLDG,,291.5,,1,2,,,,,*27
Trimble AG132 $GPGGA NMEA Message formataggps 2010:191:12:40:55.2310$GPGGA,124055.00,7203.058972,N,15607.704972,W,1,10,0.7,23.34,M,0.04,M,,*70
Table 5.6. AG132 $GPGGA Message
Field Data Type Example Units
1 Tag aggps Data type/source ID in LDS
2 LDS Time Stamp 2010:191:12:40:55.2310 YYYY:DDD:HH:MM:SS.ssssDDD is Day of the Year. January 1 is 001
3 NMEA Header $GPGGA NMEA-0183
4 Position Time (UTC) 124055.00 hhmmss.ss
5 Latitude 7203.058972 DDMM.mmmmmm
6 Latitude hemisphere N [N|S] N=North
7 Longitude 15607.704972 DDMM.mmmmmm
8 Longitude hemisphere W [E|W]
9 GPS Quality 1 0: fix not valid1: GPS fix 2: DGPS fix
10 Number of satellites used 10 Integer
11 HDOP 0.7 Horizontal Dilution ofPrecision
12 Height 23.34 Antenna Height re: MeanSea Level
13 Height units M M=Meters
14 Geoidal Height 0.04 +/-mm.mmGeoidalseparation
15 Geoidal height units M M=meters
Age of DGPS data Seconds or empty when noDGPS
Base Station ID ID or blank when on DGPS
17 Separator "*" NMEA-0183
18 Checksum 70 NMEA-0183 Checksum
Trimble AG132 $GPGGA NMEA Message formataggps 2010:191:12:40:55.2310$GPGGA,124055.00,7203.058972,N,15607.704972,W,1,10,0.7,23.34,M,0.04,M,,*70

Lamont Data System(LDS) Primary Data
56
Table 5.7. AG132 $GPGGA Message
Field Data Type Example Units
1 Tag aggps Data type/source ID in LDS
2 LDS Time Stamp 2010:191:12:40:55.2310 YYYY:DDD:HH:MM:SS.ssssDDD is Day of the Year. January 1 is 001
3 NMEA Header $GPGGA NMEA-0183
4 Position Time (UTC) 124055.00 hhmmss.ss
5 Latitude 7203.058972 DDMM.mmmmmm
6 Latitude hemisphere N [N|S] N=North
7 Longitude 15607.704972 DDMM.mmmmmm
8 Longitude hemisphere W [E|W]
9 GPS Quality 1 0: fix not valid1: GPS fix 2: DGPS fix
10 Number of satellites used 10 Integer
11 HDOP 0.7 Horizontal Dilution ofPrecision
12 Height 23.34 Antenna Height re: MeanSea Level
13 Height units M M=Meters
14 Geoidal Height 0.04 +/-mm.mmGeoidalseparation
15 Geoidal height units M M=meters
Age of DGPS data Seconds or empty when noDGPS
Base Station ID ID or blank when on DGPS
17 Separator "*" NMEA-0183
18 Checksum 70 NMEA-0183 Checksum
Trimble AG132 $GPGLL Message format
aggps 2010:191:12:40:55.2810$GPGLL,7203.058972,N,15607.704972,W,124055.00,A,A*71
Table 5.8. AG132 GLL Message
Field Data Type Example Units
1 Tag aggps Data type/source ID in LDS
2 LDS logged date & Time 2010:191:12:40:55.2810 YYYY:DDD:HH:MM:SS.ssss
3 NMEA Header $GPGLL NMEA-0183
4 Latitude 7203.058972 DDMM.mmmmm
5 Latitude hemisphere N [N|S] N=North
6 Longitude 15607.704972 DDMM.mmmmm
7 Longitude hemisphere W [E|W]
8 UTC Fix Time 124055.00 HHMMSS.ss

Lamont Data System(LDS) Primary Data
57
Field Data Type Example Units
9 Fix Status A A = valid V = invalidAlways A
10 Positioning system modeindicator
A A: Autonomous mode D: Differential mode N: Data not valid
11 Separator "*" NMEA-0183
12 Checksum 55 NMEA-0183
Trimble AG132 $GPGSV NMEA Message format
aggps 2010:191:12:40:55.4060$GPGSV,3,1,10,32,27,222,46,28,25,289,45,11,48,257,50,17,18,323,45*74aggps 2010:191:12:40:55.4811$GPGSV,3,2,10,19,24,191,46,27,25,012,47,09,28,024,49,24,16,124,40*74aggps 2010:191:12:40:55.5310$GPGSV,3,3,10,14,44,125,49,22,33,085,50,,,,,,,,*7E
The GSV message identifies the number of Space Vehicles (SVs) in view, the PRN (Satellite) numbers,elevation, azimuth and Signal to Noise Ratio (SNR) values. Multiple $GPGSV messages may betransmitted in a single data cycle in order to accommodate data from all of the satellites currentlybeing tracked by the receiver.
Table 5.9. AG132 $GPGSVMessage
Field Data Type Example Units
1 Tag aggps Data type/source ID in LDS
2 LDS logged date & Time 2010:191:12:40:55.4060 YYYY:DDD:HH:MM:SS.ssss
3 NMEA Message Type $GPGSV NMEA-0183
4 Total number of GSVmessages in this "cycle"
3 Integer
5 Message number (in thiscycle)
1 Integer
6 Total number of SVs visible 10 Integer
7 SV PRN 32 Integer indicating whichsatellite
8 SV Elevation 27 Degrees above horizontal(0<n<90.5)
9 SV Azimuth 222 Degrees from True North
10 SV SNR 46 00-99 dB (null when nosatellite)
Fields 7,8,9, & 10 (PRN, Elevation, Azimuth and SNR) repeat up to three more times ineach message
Multiple GSV messages are sent in one "cycle" to accommodate the number of satellitesbeing tracked.
Separator "*" NMEA-0183
Checksum 47 NMEA-0183

Lamont Data System(LDS) Primary Data
58
Trimble AG132 $GPZDA Message Format
The ZDA message identifies UTC time, day, month, and year, local zone number and local zoneminutes.
aggps 2010:191:12:40:55.6320 $GPZDA,124055.13,10,07,2010,00,00*66
Table 5.10. Trimble AG132 ZDA (LDS)
Field Data Type Example Units
1 LDS Tag aggps
2 LDS Time Stamp 2010:191:12:40:55.6320 YYYY:DDD:HH:MM:SS.ssss
3 NMEA Header $GPZDA NMEA-0183
4 Time (UTC) 133000.00 HHMMSS.ssss
5 Day 10 DD
6 Month 07 MM
7 Year 2010 YYYY
8 Local zone hours 00 HH
9 Local zone minutes 00 MM
11 Separator "*" NMEA-0183
12 Checksum 66 NMEA-0183
Trimble AG132 $GPRMC NMEA Message format
aggps 2010:191:12:40:55.7071$GPRMC,124055,V,7203.058972,N,15607.704972,W,000.51,291.4,100710,27.8,E,N*1B
The RMC message identifies the UTC time, status, latitude, longitude, speed over ground (SOG),date, and magnetic variation of the position fix. It is the "Recommended Minimum Content" NMEAmessage for GPS receivers.
Table 5.11. AG132 $GPRMC Message
Field Data Type Example Units
1 Tag aggps Data type/source ID in LDS
2 LDS Time Stamp 2010:191:12:40:55.7071 YYYY:DDD:HH:MM:SS.ssssDDD is Day of the Year. January 1 is 001
3 NMEA Header $GPRMC NMEA-0183
4 Position Time (UTC) 124055 hhmmss
5 Status V A: Valid V: NavigationReceiver Warning (V isoutput whenever the receiversuspects something is wrong)
6 Latitude 7203.058972 DDMM.mmmmmm
7 Latitude hemisphere N [N|S] N=North
8 Longitude 15607.704972 DDMM.mmmmmm
9 Longitude hemisphere W [E|W]
10 Speed Over Ground 000.51 Knots kkk.kk
11 Course Over Ground 291.4 Degrees relative to True North
12 Date 100710 DDMMYY

Lamont Data System(LDS) Primary Data
59
Field Data Type Example Units
13 Magnetic Variation 27.8 Degrees
14 Direction of MagneticVariation
E E: Easterly variation fromTrue course (subtracts fromTrue course) W: Westerlyvariation from True course(adds to True course)
15 Status (Mode) N A: AutonomousD: DifferentialN: Data not valid
16 Separator "*" NMEA-0183
17 Checksum 70 NMEA-0183 Checksum
Trimble AG132 $PTNLDG Message Format
The PTNLDG message is a Trimble proprietary message for identifying the DGPS receiver channelstrength, channel SNR, channel frequency, channel bit rate, channel number, channel tracking status,RTCM source, and channel performance indicator for either beacon DGPS or satellite DGPS.
aggps 2010:191:12:40:55.7381 $PTNLDG,,291.5,,1,2,,,,,*27
Table 5.12. Trimble AG132 PTNLDG (LDS)
Field Data Type Example Units
1 LDS Tag aggps
2 LDS Time Stamp 2010:191:12:40:55.7381 YYYY:DDD:HH:MM:SS.ssss
3 NMEA Header $PTNLDG Trimble proprietaryNMEA-0183
4 Channel signal strength 1 dBuV/m. For beacon, thisis the electromagnetic fieldintensity level. For satellite,this is the ADC input voltagelevel.
5 Channel signal to noise(SNR)
dB
6 Channel frequency kHz
7 Channel bit rate Bits per Second (bps)
8 Channel Number Integer: 00-99
9 Channel tracking status 0: Channel idle 1: Wideband FFT search 2: Searching for signal 3: Channel has acquired signal 4: Channel has locked on signal 5: Channel disabled
10 Separator "*" NMEA-0183
11 Checksum 66 NMEA-0183
Applanix POS/MV-320 Global Positioning System(GPS)
Applanix POS/MV-320 GPS aided inertial navigation system.

Lamont Data System(LDS) Primary Data
60
With the installation of the EM122 multibeam the output of the POS/MV Attitude is in a binary formatat a very high (100 Hz) update rate so it is not logged. Attitude data is logged in the EM122 multibeamdata records
Description: This entry describes the format of data from the POSMV data as logged by LDS.
Directory: LDS_Data/posnav
File Name: HLY1001-posnav.y2010d192
Data Examples: A typical sequence from the a data file:
posnav 2010:192:03:02:14.2871 $INZDA,030214.0042,11,07,2010,,*70posnav 2010:192:03:02:15.0571$PASHR,030214.964,345.27,T,1.15,0.04,0.04,0.018,0.018,0.011,2,1*1Eposnav 2010:192:03:02:15.0701 $PRDID,0.04,1.15,345.27*7F posnav2010:192:03:02:15.1261$INGST,030214.964,,1.9,1.2,3.8,2.0,2.2,4.5*55 posnav2010:192:03:02:15.1941$INGGA,030214.964,7211.52499,N,15628.25084,W,1,11,0.7,4.28,M,,,,*3Eposnav 2010:192:03:02:15.2181 $INHDT,345.3,T*24 posnav2010:192:03:02:15.2631 $INVTG,345.4,T,,M,7.4,N,13.7,K*40
Applanix POS/MV $GPZDA
The ZDA message identifies UTC time, day, month, and year, local zone number and local zoneminutes.
posnav 2010:192:03:02:14.2871 $INZDA,030214.0042,11,07,2010,,*70
Table 5.13. Applanix POS/MV-320 ZDA (LDS)
Field Data Type Example Units
1 LDS Tag posnav
2 LDS Time Stamp 2010:192:03:02:14.2871 YYYY:DDD:HH:MM:SS.ssss
3 NMEA Header $INZDA NMEA-0183
4 Time (UTC) 030214.0042 HHMMSS.ssss
5 Day 11 DD
6 Month 07 MM
7 Year 2010 YYYY
8 Null blank
9 Null 00 blank
11 Separator "*" NMEA-0183
12 Checksum 70 NMEA-0183
Applanix POS/MV $PASHR
Description: This entry describes the format of data from the POS/MV-320 pitch and roll records inNMEA PASHR-format as logged by LDS.
Directory: LDS_Data/posnav
File Name: HLY1001-posnav.y2010d192

Lamont Data System(LDS) Primary Data
61
Data Examples
posnav 2010:192:03:02:15.0571$PASHR,030214.964,345.27,T,1.15,0.04,0.04,0.018,0.018,0.011,2,1*1E
Table 5.14. POS/MV PASHR (LDS)
Field Data Type Example Units
1 LDS Tag posnav ASCII text
2 LDS Timestamp 2010:192:03:02:15.0571 YYYY:DDD:HH:MM:SS.ssss
3 NMEA Header $PASHR NMEA-0183
4 UTC Time 030214.964 HHMMSS.sss
6 Heading 345.27 DDD.dd degrees
6 Heading reference T True north
7 Roll 1.15 +/-dd.dd degrees
8 Pitch 0.04 +/-00.00 degrees
9 Heave 0.018 +/-00.00 meters
10 Roll Accuracy 0.018 0.000 degrees
11 Pitch Accuracy 0.018 0.000 degrees
12 Heading Accuracy 0.011 0.000 degrees
13 Flag - accuracy heading [0 | 1 | 2] 0 = no aiding 1 = GPS aiding 2 = GPS & GAMS aiding
14 Flag - IMU [0|1] 0 = IMU out 1 = IMU satisfactory
15 Separator "*" NMEA-0183
16 Checksum 2E NMEA-0183
Applanix POS/MV $PRIDD
Description: This entry describes the format of data from the POS/MV-320 attitude data PRIDD-format as logged by LDS.
Directory: LDS_Data/posnav
File Name: HLY1001-posnav.y2010d192
Data Examples
posnav 2010:192:03:02:15.0701 $PRDID,0.04,1.15,345.27*7F
Table 5.15. POS/MV PRIDD (LDS)
Field Data Type Example Units
1 LDS Tag posnav ASCII text
2 LDS Timestamp 2010:192:03:02:15.0701 YYYY:DDD:HH:MM:SS.ssss
3 NMEA Header $PRDID NMEA-0183
4 Pitch 0.04 +/-dd.dd Degrees
6 Roll 1.15 +/-ddd.dd Degrees
6 Heading 345.27 ddd.dd Degrees True north
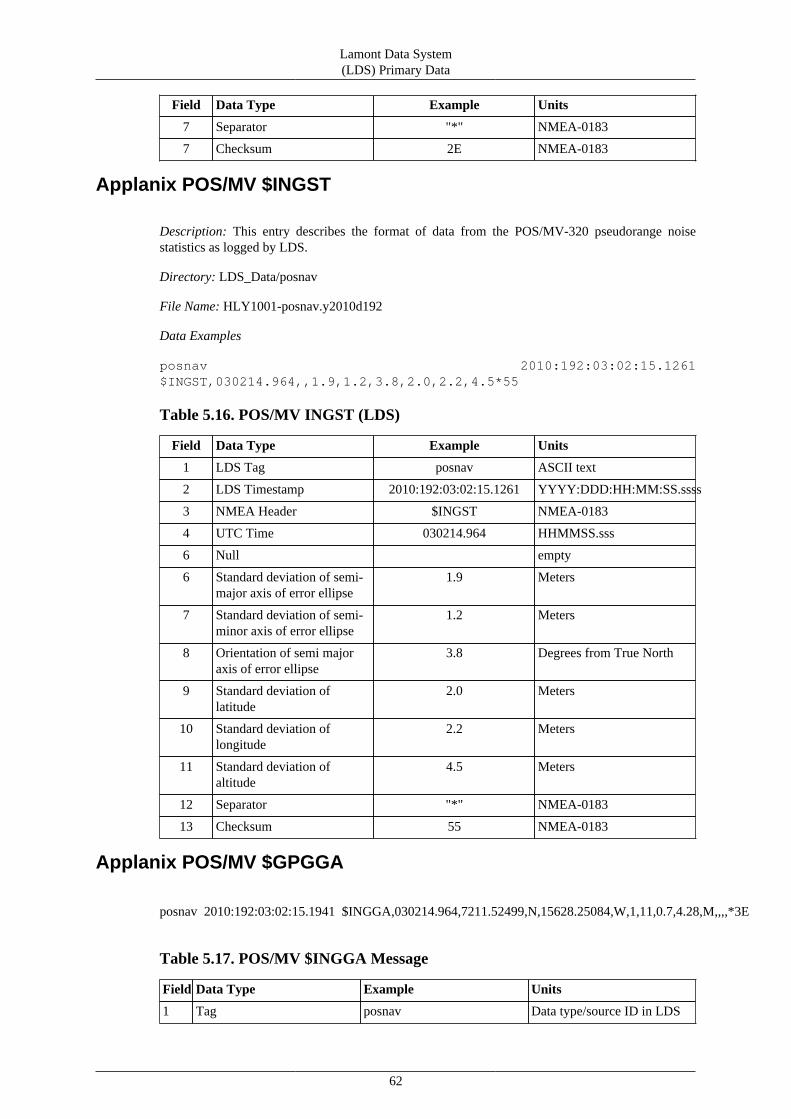
Lamont Data System(LDS) Primary Data
62
Field Data Type Example Units
7 Separator "*" NMEA-0183
7 Checksum 2E NMEA-0183
Applanix POS/MV $INGST
Description: This entry describes the format of data from the POS/MV-320 pseudorange noisestatistics as logged by LDS.
Directory: LDS_Data/posnav
File Name: HLY1001-posnav.y2010d192
Data Examples
posnav 2010:192:03:02:15.1261$INGST,030214.964,,1.9,1.2,3.8,2.0,2.2,4.5*55
Table 5.16. POS/MV INGST (LDS)
Field Data Type Example Units
1 LDS Tag posnav ASCII text
2 LDS Timestamp 2010:192:03:02:15.1261 YYYY:DDD:HH:MM:SS.ssss
3 NMEA Header $INGST NMEA-0183
4 UTC Time 030214.964 HHMMSS.sss
6 Null empty
6 Standard deviation of semi-major axis of error ellipse
1.9 Meters
7 Standard deviation of semi-minor axis of error ellipse
1.2 Meters
8 Orientation of semi majoraxis of error ellipse
3.8 Degrees from True North
9 Standard deviation oflatitude
2.0 Meters
10 Standard deviation oflongitude
2.2 Meters
11 Standard deviation ofaltitude
4.5 Meters
12 Separator "*" NMEA-0183
13 Checksum 55 NMEA-0183
Applanix POS/MV $GPGGA
posnav 2010:192:03:02:15.1941 $INGGA,030214.964,7211.52499,N,15628.25084,W,1,11,0.7,4.28,M,,,,*3E
Table 5.17. POS/MV $INGGA Message
Field Data Type Example Units
1 Tag posnav Data type/source ID in LDS

Lamont Data System(LDS) Primary Data
63
Field Data Type Example Units
2 LDS Time Stamp 2010:192:03:02:15.1941 YYYY:DDD:HH:MM:SS.ssss(DDD is Day of the Year,January 1 is 001)
3 NMEA Header $INGGA NMEA-0183
4 Position Time (UTC) 030214.964 hhmmss.ss
5 Latitude 7211.52499 DDMM.mmmmmm
6 Latitude hemisphere N [N|S] N=North
7 Longitude 15628.25084 DDMM.mmmmmm
8 Longitude hemisphere W [E|W]
9 GPS Quality 1 0 = fix not available or invalid 1 = C/A standard GPS; fix valid 2 = DGPS mode; fix valid 3 = GPS PPS mode; fix valid 4 = RTK fixed 5 = RTK float 6 = free inertial
10 Number of satellites used 11 Integer
11 HDOP 0.7 Horizontal Dilution ofPrecision
12 Altitude 4.28 Height of the Healy's MasterReference Mark (in IC/Gyro)above/below re: Mean SeaLevel in Meters
13 Height units M M=Meters
14 Null
15 Null
16 Age of DGPS data Seconds since lastRTCM-104 correctionmessage or Nul
17 Base Station ID ID (0<= x ,= 1023) or blankwhen no DGPS
18 Separator "*" NMEA-0183
19 Checksum 70 NMEA-0183 Checksum
Applanix POS/MV $GPHDT
posnav 2010:192:03:02:15.2181 $INHDT,345.3,T*24
Table 5.18. POS/MV HTD Record (LDS)
Field Data Type Example Units
1 LDS ID posnav MM/DD/YYYY (from SCS)
2 LDS Time Tag 2010:192:03:02:15.2181 YYYY:DDD:HH:MM:SS.ssss
3 NMEA Header INPHDT NMEA-0183
4 Heading 345.3 Degrees
5 Heading Reference T T== True North
6 Separator "*" NMEA-0183

Lamont Data System(LDS) Primary Data
64
Field Data Type Example Units
7 Checksum 24 NMEA-0183
Applanix POS/MV $GPVTG
posnav 2010:192:03:02:15.2631 $INVTG,345.4,T,,M,7.4,N,13.7,K*40
The VTG message contains the actual track (COG) and speed (SOG) over the ground.
Table 5.19. POS/MV $VTG Message
Field Data Type Example Units
1 Tag adu5 Data type/source ID in LDS
2 LDS logged date & Time 2010:190:17:50:01.2447 YYYY:DDD:HH:MM:SS.ssss
3 NMEA Header $GPVTG NMEA-0183
4 Course 106.86 Decimal degrees
5 Course Refernece T Always T=True North
6 Course over the ground 086.14 Decimal degrees
7 Course reference M Always M=Magnetic North
8 Speed over the ground 000.29 Speed
9 Speed Units N Speed units = Knots
10 Speed 000.54 Speed
11 Speed units K k=Kilometers/hour
12 Positioning system modeindicator
AA—Autonomous modeD—Differential modeE—Estimated (DR) modeM—Manual input modeS—Simulator mode N—Data not valid
13 Separator "*" NMEA-0183
14 Checksum 55 NMEA-0183
Bridge IBS Navigation System Way PointsThis section describes the file format of records logged by LDS from the Sperry integrated navigationsystem on the bridge of the Healy. This system is referred to as the IBS or sometimes as the VesselManagement System (VMS.) The IBS waypoint data consists of several different messages that arriveon a single asynchronous serial data connection.
Description: This entry describes the format of LDS centerbeam record derived from the EM122.
Directory: LDS_Data/ibs_waypoints
File Name: HLY1001-ibs_waypoints.y2010d192
Data Examples: A typical sequence from the a data file:
ibs_waypoints 2010:192:16:10:56.7268$NVRTE,01,01,w,2010_HLY-10-01_11JUL.PLN,9,10,11,12,13,14,15,16,17,18*6Dibs_waypoints 2010:192:16:10:57.5118 $NVXDR,D,3696.82,M,WPTDTG*75ibs_waypoints 2010:192:16:10:57.5717 $NVXDR,G,36410.3,,WPTTTG*28ibs_waypoints 2010:192:16:10:57.6428

Lamont Data System(LDS) Primary Data
65
$NVWPL,7157.73,N,15633.85,W,9*60 ibs_waypoints2010:192:16:10:58.5148 $NVXDR,D,3696.82,M,WPTDTG*75 ibs_waypoints2010:192:16:10:58.5748 $NVXDR,G,36410.3,,WPTTTG*28
Sperry IBS $NVRTE (LDS)
ibs_waypoints 2010:192:16:10:56.7268$NVRTE,01,01,w,2010_HLY-10-01_11JUL.PLN,9,10,11,12,13,14,15,16,17,18*6D
Table 5.20. Sperry IBS NVRTE Record (LDS)
Field Data Type Example Units
1 LDS ID ibs_waypoints ASCII
2 LDS Time Tag 2010:192:16:10:56.7268 YYYY:DDD:HH:MM:SS.ssss
3 NMEA Header $NVRTE NMEA-0183
4 01
5 01
6 W
7 2010_HLY-10-01_11JUL.PLN
8 9
9 10
10 11
11 12
12 13
13 14
14 15
15 16
16 17
17 18
18 Separator "*" NMEA-0183
19 Checksum 6D NMEA-0183
Sperry IBS $NVXDR (LDS)
Need some words for this one
ibs_waypoints 2010:192:16:10:57.5118 $NVXDR,D,3696.82,M,WPTDTG*75
Table 5.21. Sperry IBS NVXDR Record (LDS)
Field Data Type Example Units
1 LDS ID ibs_waypoints ASCII
2 LDS Time Tag 2010:192:16:10:56.7268 YYYY:DDD:HH:MM:SS.ssss
3 NMEA Header $NVXDR NMEA-0183
4 D [D|G]D: ?????G: ??????
5 3696.82

Lamont Data System(LDS) Primary Data
66
Field Data Type Example Units
6 M
7 WPTDTG
8 Separator "*" NMEA-0183
9 Checksum 75 NMEA-0183
Sperry IBS $NVWPL (LDS)
Need some words for this one
ibs_waypoints 2010:192:16:10:57.6428$NVWPL,7157.73,N,15633.85,W,9*60
Table 5.22. Sperry IBS NVWPL
Field Data Type Example Units
1 LDS ID ibs_waypoints ASCII
2 LDS Time Tag 2010:192:16:10:57.6428 YYYY:DDD:HH:MM:SS.ssss
3 NMEA Header $NVWPL NMEA-0183
4 Way Point Latitude 7157.73 DDMM.mm
5 Latitude Hemisphere N [N|S]
6 Latitude Longitude 15633.85 DDDMM.ss
7 Longitude Hemisphere W [W|E]
8 Waypoint Number 9 Integer
10 Separator "*" NMEA-0183
11 Checksum 60 NMEA-0183
Automatic Identification System (AIS) (LDS)This section describes the data from a receive-only AIS receiver on Healy. The AIS data allows us toplot the location of nearby ships on our real-time GIS. This situational information is particularly usefulwhen we are operating with other ships which is relatively common in the Arctic. More informationabout AIS is available from US Coast Guard site:
http://www.navcen.uscg.gov/marcomms/ais.htm
The full text for the AIS standard: “RECOMMENDATION ITU-R M.1371-1 - Technicalcharacteristics for a universal shipborne automatic identification system using time division multipleaccess in the VHF maritime mobile band” is at:
http://www.itu.int/rec/recommendation.asp?type=items&lang=E&parent=R-REC- M.1371-1-200108-I
Description: This entry describes data from the Milltech Marine SMART RADIO SR161 Science AISreceiver as logged by LDS.
Directory: LDS_Data/ais
File Name: HLY1001-ais.y2010d189
Data Examples: A typical sequence from the a data file:
ais 2010:189:23:57:25.1091 !AIVDM,1,1,,B,14Qle<000JDW0H8`Wt3jrDdh0<00,0*41 ais

Lamont Data System(LDS) Primary Data
67
2010:189:23:57:30.3792 !AIVDM,2,1,0,B,54Qle<000000pE12221E<<L>0PD4iV222222220S2P:235L80KPDPm2@,0*37ais 2010:189:23:57:30.3792 !AIVDM,2,2,0,B,p88888888888880,2*6F ais2010:189:23:57:45.1884 !AIVDM,1,1,,B,14Qle<000IDW0U8`Wt:C3TiH06sT,0*2E
The AIS messages are ASCII-encoded binary data with the content often spread across multiplemessages. LDS uses Kurt Schwer's python application http://vislab-ccom.unh.edu/~schwehr/ais/ to parse these messages in real-time.
Multibeam Data
Real-time position for the SeaBeamPrior to 2010 LDS generated a reformatted position data from the POS/VMV-320 in real-time tosatisfy the navigation input requirement for the SB2112
Starting in 2010 (after we replaced the SeaBeam 2112 multibeam with a Kongsberg EM122multibeam) we no longer produce a special output from LDS for the multibeam. The POS/MV-320provides navigation and attitude data directly to the EM122.
Raw Multibeam dataRaw data from the Kongsberg EM122 multibeam is logged in real-time by LDS over a networkconnection. Two types of files are logged: bathymetry and watercolumn data.Verification of real-time logging of EM122 data is still in process. Until this data stream is validated,the raw data files as logged on the Kongsberg SIS Hyrdographic Worksatin (HWS) is included in the"raw" section of the data distribution.
Description: Raw data from the Kongsberg EM122 multibeam is logged by LDS in two types of files.Files ending in .mb58 contain traditional multibeam data in the manufacturer's "Raw.all" format whichis defined in MB-System http://www.ldeo.columbia.edu/MB-System as type 58. Thesefiles have a file name extenion of .mb58. The EM122 also generates beam formed water column datawhich is logged in files with a ".wcd" extension.
Water column data is very voluminous and is not normally included in the end of cruise distributionprovided to the departing chief scientist. It is archived ashore and can be provided by request.
Directory: LDS_Data/em122
File Names:
HLY1001-em122.20100711_1400.mb58HLY1001-em122.20100711_1400.wcd
Multibeam Center Beam (LDS)Central beam water depth extracted in real-time from the Kongsberg EM122 data.
Description: This entry describes the format of LDS centerbeam record derived from the EM122.
Directory: LDS_Data/emctr
File Name: HLY1001-emctr.y2010d192
Data Examples: A typical sequence from the a data file:

Lamont Data System(LDS) Primary Data
68
emctr 2010:192:14:31:00.5425$EMCTR,2010,07,11,14:30:59.922,71.952202,-156.542031,69.88,432*56emctr 2010:192:14:31:01.0698$EMCTR,2010,07,11,14:31:00.441,71.952202,-156.542031,69.82,425*5Femctr 2010:192:14:31:01.0863$EMCTR,2010,07,11,14:31:00.465,71.952202,-156.542031,69.85,427*5C
Table 5.23. LDS Kongsberg EM multibeam center beam Message
Field Data Type Example Units
1 Tag emctr Data type/source ID in LDS
2 LDS logged date & Time 2010:192:14:31:01.0698 YYYY:DDD:HH:MM:SS.ssss
3 NMEA Header $EMCTR NMEA-0183
4 Year 2010 UUUU
5 Month 07 MM
6 Day 11 DD
7 Time of the ping 14:30:59.922 HH:MM:SS.sss
8 Latitude 71.952202 Decimal Degrees (+/-DD.ddddd)
9 Longitude -156.542031 Decimal Degrees (+/-DDD.ddddd)
10 Depth 69.82 Meters
11 Number of reported beams 432 Integer.
12 Separator "*" NMEA-0183
13 Checksum 55 NMEA-0183
Sound Speed at the keelsound speed at the keel formatted in real-time for the EM122 real-time input by LDS.
Description: This entry describes the format of LDS centerbeam record derived from the EM122.
Directory: LDS_Data/emsv
File Name: HLY1001-emsv.y2010d192
Data Examples: A typical sequence from the a data file:
emsv 2010:192:14:51:15.7117 $KSSIS,80,1435.79,-1.37,emsv 2010:192:14:51:17.6958 $KSSIS,80,1435.79,-1.37, emsv2010:192:14:51:19.7098 $KSSIS,80,1435.78,-1.37,
Table 5.24. LDS sound speed at the keel for the Kongsberg EM122 multibeam
Field Data Type Example Units
1 Tag emsv Data type/source ID in LDS
2 LDS logged date & Time 2010:192:14:31:01.0698 YYYY:DDD:HH:MM:SS.ssss
3 NMEA Header $KSSIS NMEA-0183
4 EM datagram type 80 hexadecimal
5 Speed of sound 1435.79 meters/second
6 Water Temperature -1.37 degrees Celsius

Lamont Data System(LDS) Primary Data
69
BGM-3 Gravity Meter dataAt present there are two Bell BGM-3 marine gravity meters on the Healy. They are identified by theirserial numbers: 221 and 222. One of them is destined for the Alaska Region Research Vessel, Sikuliaq.The interface to the BGM-3 meters is a second (third?) generation of the original interface designedby Joe Stennett at Lamont in the 1980s.
Description: This entry describes the format of the gravity meter as logged by LDS.
Directory: LDS_Data/bgm222 or LDS_Data/bgm221
File Name: HLY1001-bgmSSS.y2010d192 (where SSS is the serial number of the meter.)
Data Examples: A few lines from a data file:
bgm222 2010:192:21:10:06.6352 04:025444 00 bgm2222010:192:21:10:07.6262 04:025444 00 bgm222 2010:192:21:10:08.631904:025444 00
Table 5.25. BGM3 Gravity meter log file format
Field Data Type Example Units
1 Tag bgm222 Data type/source ID in LDS
2 LDS logged date & Time 2010:192:21:10:06.6352 YYYY:DDD:HH:MM:SS.ssss
3 Interface Counter periods 04 Seconds = 0.25 seconds thevalue. 4= 1 second countwindow
4 Separator : Always = ":"
5 Raw meter counts 025444 Integer
6 Eror Flags 00 00 = No errors01: Failure 10: DNV
LDS EventsThe events directory contains one file for each LDS logger that is launched. If a logger is restarted,there will be more than one event file for each start. Event files have he same naming convention as datafiles with the addition of a "-ev" in front of the device, for instance: HLY1001-ev-bgm222.y2010d163is the event file for the logger that is handling data from the BGM3 serial number 222.
Images
Aloft Con ImagesThere is an digital camera mounted in the overhead in Aloft Con looking forward over the bow to thehorizon. Pictures are taken from this camera are in the directory named: LDS_Data/AloftConnCamwithin that directory there are subdirectories for each day. The subdirectories are named with the fourdigit year and three digit day of the year, for instance: 2010192. Each photograph is named accordingto the time and date, for instance: 2010-192-235900.jpg.
Fantail ImagesThere is an digital camera mounted in the overhead in Aft Con looking out over the fantail. Picturesare taken from this camera are in the directory named: LDS_Data/FantailCam within that directory

Lamont Data System(LDS) Primary Data
70
there are subdirectories for each day. The subdirectories are named with the four digit year and threedigit day of the year, for instance: 2010192. Each photograph is named according to the time and date,for instance: 2010-192-235900.jpg.
SIO TSG and MET Data
All SIO TSG and MET DataDescription: All of the data from the SIO TSG and Meteorological Sensors are sent in one serial linefrom an SIO PC. All of these data have different NMEA strings and formats. This is a single file forall these data. All of these data are also in the SCS data sections above in the Meteorological section.The NMEA striigs shown here can be found in the SIO MET Data formats document and by lookingin the file format descriptions above.
Directory: LDS_Data/tsg_met
File Name: HLY0801-tsg_met.y2008d082
Data Examples: A typical sequence from a data file:
tsg_met 2008:082:00:00:00.3272$PSSRA,501.80,4.190,349.54,0.257,261.02,1.951,261.51,1.922*4Etsg_met 2008:082:00:00:00.3275 $PSSPA,1665.98,1.006*43 tsg_met2008:082:00:00:00.3542 $PSMEA,-11.56,87.90,1022.45,0.03*51 tsg_met2008:082:00:00:00.3543 $PSWDA,240.50,11.88,243.30,11.08*5C tsg_met2008:082:00:00:00.3872 $PSWDB,234.33,10.31,233.57,11.74*57 tsg_met2008:082:00:00:00.4142 $PSSTA,-1.721,2708.200*52 tsg_met2008:082:00:00:00.4143 $PSTSA,-1.274,27.0231,33.728,1441.48*5Ctsg_met 2008:082:00:00:00.4432 $PSTSB,,,,*46 tsg_met2008:082:00:00:00.4432 $PSOXA,7.350,2.768,-1.274,-1.274*5F tsg_met2008:082:00:00:00.4433 $PSOXB,,,,*56 tsg_met 2008:082:00:00:00.4732$PSFLA,0.300,0.030,0.000,0.013*4A tsg_met 2008:082:00:00:00.5012$PSFLB,1.150,0.115,0.430,0.043*4B tsg_met 2008:082:00:00:00.5013$PSNTA,0.000,0.000*58 tsg_met 2008:082:00:00:00.5311$PSFMA,3.04,46.000*4C tsg_met 2008:082:00:00:00.5313$PSFMB,3.30,17.000*4C tsg_met 2008:082:00:00:00.5371$GPZDA,000000.00,22,03,2008,00,00*6F
SIO TSG data from BioChem LabDescription: This data is directly from the TSG sensors in the BioChem Lab to the LDS loggingprogram.
Directory: LDS_Data/tsg
File Name: HLY1002-tsg.y2010d232
Data Examples: A typical sequence from a data file:
tsg 2010:232:00:25:53.0612 -0.6029, 2.10927, 25.1380, 1433.110tsg 2010:232:00:26:03.0614 -0.6036, 2.10912, 25.1367, 1433.105 tsg2010:232:00:26:13.0615 -0.6040, 2.10898, 25.1352, 1433.101
Table 5.26. All SIO TSG and MET Data
Field Data Type Example Units
1 Data Stream Name tsg ASCII text

Lamont Data System(LDS) Primary Data
71
Field Data Type Example Units
2 LDS logged Time GMT 2010:232:00:25:53.0612 yyyy:ddd:hh:mm:ss.ssss
3 Temperature -0.6029 Degrees Celcius
4 Conductivity 2.10927 S/m
5 Salinity 25.1380 PSU
6 Sound Velocity 1433.110 meters / second
Winches
Starboard WinchDescription: This entry describes the format of winch wire data from the Starboard Winch as loggedby LDS
Directory: LDS_Data/winch_stb
File Name: HLY1001-winch_stb.y2010d192
Data Examples: A typical sequence from a data file:
winch_stbd 2010:192:21:10:30.3421 02, 33, , -11, , 0.0, ,0000winch_stbd 2010:192:21:10:30.5861 02, 33, , -11, , 0.0, ,0000winch_stbd 2010:192:21:10:30.8331 02, 28, , -11, , 0.0, ,0000
Table 5.27. Data from the Aft winch (LDS )
Field Data Type Example Units
1 Tag winch_stb Data type/source ID in LDS
2 LDS logged date & Time 2010:192:21:00:23.6660 YYYY:DDD:HH:MM:SS.ssss
3 ?? 01 ??
4 Wire tension -40 pounds
5 ?? ?? ??
6 Wire speed -5 meters/minute
0.0
Wire out 0000 Meters
Aft WinchDescription: This entry describes the format of winch wire data from the Aft Winch as logged by LDS
Directory: LDS_Data/winch_aft
File Name: HLY1001-winch_aft.y2010d192
Data Examples: A typical sequence from a data file:
winch_aft 2010:192:21:00:23.6660 01, -40, , -5, , 0.0, ,0000winch_aft 2010:192:21:00:23.9120 01, -40, , -5, , 0.0, ,0000 winch_aft2010:192:21:00:24.1580 01, -40, , -5, , 0.0, ,0000
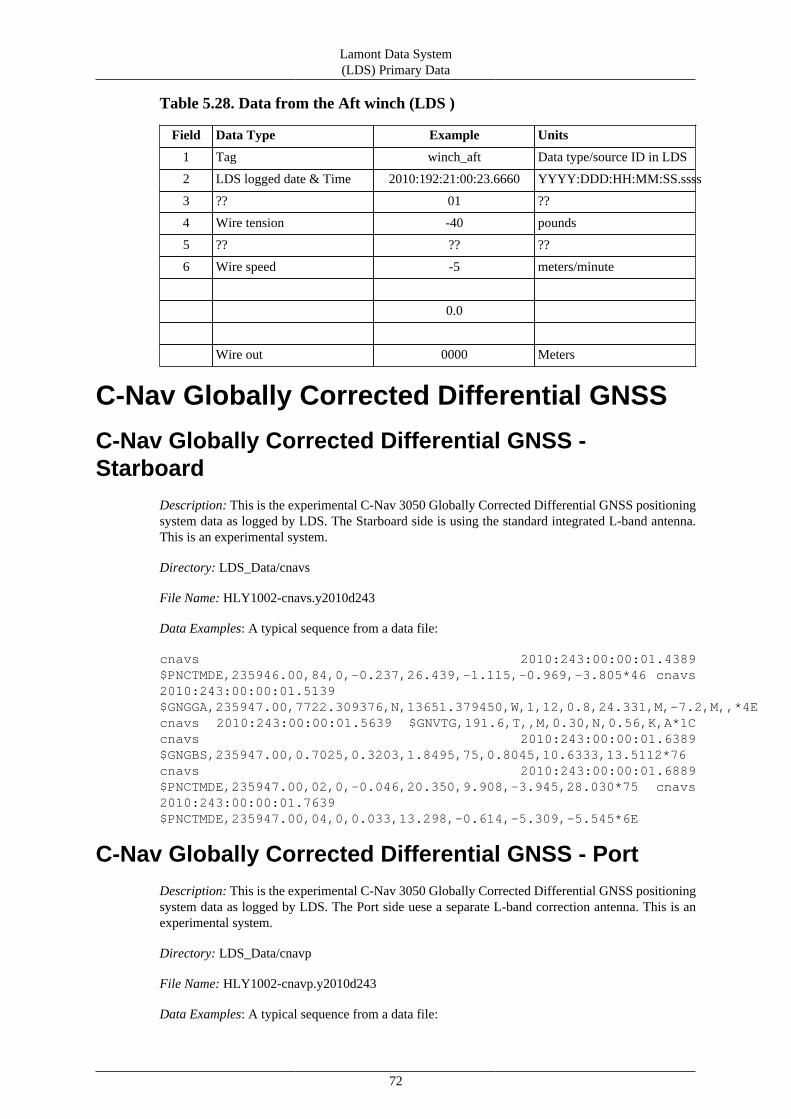
Lamont Data System(LDS) Primary Data
72
Table 5.28. Data from the Aft winch (LDS )
Field Data Type Example Units
1 Tag winch_aft Data type/source ID in LDS
2 LDS logged date & Time 2010:192:21:00:23.6660 YYYY:DDD:HH:MM:SS.ssss
3 ?? 01 ??
4 Wire tension -40 pounds
5 ?? ?? ??
6 Wire speed -5 meters/minute
0.0
Wire out 0000 Meters
C-Nav Globally Corrected Differential GNSS
C-Nav Globally Corrected Differential GNSS -Starboard
Description: This is the experimental C-Nav 3050 Globally Corrected Differential GNSS positioningsystem data as logged by LDS. The Starboard side is using the standard integrated L-band antenna.This is an experimental system.
Directory: LDS_Data/cnavs
File Name: HLY1002-cnavs.y2010d243
Data Examples: A typical sequence from a data file:
cnavs 2010:243:00:00:01.4389$PNCTMDE,235946.00,84,0,-0.237,26.439,-1.115,-0.969,-3.805*46 cnavs2010:243:00:00:01.5139$GNGGA,235947.00,7722.309376,N,13651.379450,W,1,12,0.8,24.331,M,-7.2,M,,*4Ecnavs 2010:243:00:00:01.5639 $GNVTG,191.6,T,,M,0.30,N,0.56,K,A*1Ccnavs 2010:243:00:00:01.6389$GNGBS,235947.00,0.7025,0.3203,1.8495,75,0.8045,10.6333,13.5112*76cnavs 2010:243:00:00:01.6889$PNCTMDE,235947.00,02,0,-0.046,20.350,9.908,-3.945,28.030*75 cnavs2010:243:00:00:01.7639$PNCTMDE,235947.00,04,0,0.033,13.298,-0.614,-5.309,-5.545*6E
C-Nav Globally Corrected Differential GNSS - PortDescription: This is the experimental C-Nav 3050 Globally Corrected Differential GNSS positioningsystem data as logged by LDS. The Port side uese a separate L-band correction antenna. This is anexperimental system.
Directory: LDS_Data/cnavp
File Name: HLY1002-cnavp.y2010d243
Data Examples: A typical sequence from a data file:

Lamont Data System(LDS) Primary Data
73
cnavp 2010:243:00:00:00.9689$PNCTMDE,235943.00,32,0,0.052,12.803,-2.952,-0.163,1.024*4E cnavp2010:243:00:00:01.0439$PNCTMDE,235943.00,67,0,0.135,41.463,-0.080,0.472,2.531*6C cnavp2010:243:00:00:01.1609$PNCTMDE,235943.00,68,0,-0.096,300.448,-1.116,-0.710,-1.356$GPGGA,235944.00,7722.309032,N,13651.371780,W,1,10,0.7,22.471,M,-7.2,M,,*5Ecnavp 2010:243:00:00:01.2190 $GPVTG,192.0,T,,M,0.31,N,0.57,K,A*07cnavp 2010:243:00:00:01.2949$GPGBS,235944.00,0.0190,-0.1006,0.2321,76,0.8937,-3.8900,9.7613*63cnavp 2010:243:00:00:01.3449$PNCTMDE,235944.00,02,0,0.015,15.909,7.248,-1.244,15.577*5C

74
Chapter 6. SCS Derived DataMany (most -tbd) of the data files generated by SCS on the Healy contain "derived" data. That is datathat is calculated from other data. For instance, if the raw temperature is logged in degrees Celsius,the a file containing temperatures in Fahrenheit would be a derived data set. In fact, it is not necessaryto log and derived data sets but some folks find them useful.
Air temperature (Derived)Description: This file contains air temperature in degrees Fahrenheit calculated from the measuredtemperature
Directory: SCS_Data/air_temp_f
File Name: AirTemp-F_20070413-000000.Raw
Data Examples: (3 lines from a data file):
04/13/2007,00:00:02.074,$DERIV,28.83,-1.76,04/13/2007,00:00:05.074,$DERIV,28.62,-1.88,04/13/2007,00:00:08.074,$DERIV,28.62,-1.88,
Note
These derived records are supposed to be formated as NMEA-0183 records but thechecksum field is missing and there is a dangling comma.
Table 6.1. Derived air temperature
Field Description Example Units
1 Date 03/14/2009 Month/Day/Year
2 Time (UTC) 00:00:02.074 Hour:Minute:Second.fraction
3 NMEA Header $DERIV ASCII text (likeNMEA-0183)
4 Calculated Air Temperature 28.83 Degrees Fahrenheit
5 Measured Air Temperature -1.76 Degrees Celsius
7 - - (missing)
The sensors for this measurement are installed on the starboard side of the Flying Bridge.
HCO Met3A Air Temperatures (Derived)Description: This file contains derived data From the HCO Met3A weather station temperature sensor.Temperature is reported in degrees Fahrenheit and Celsius.
Directory: SCS_Data/air_temp3a_f
File Name: Met3a-Air-Temp-F_20090129-173743.Raw
Data Examples: (3 lines from a data file):
01/29/2009,17:37:47.068,$DERIV,41.41,5.23, 01/29/2009,17:37:50.683,$DERIV,41.41,5.23, 01/29/2009,17:37:54.297,$DERIV,41.41,5.23,
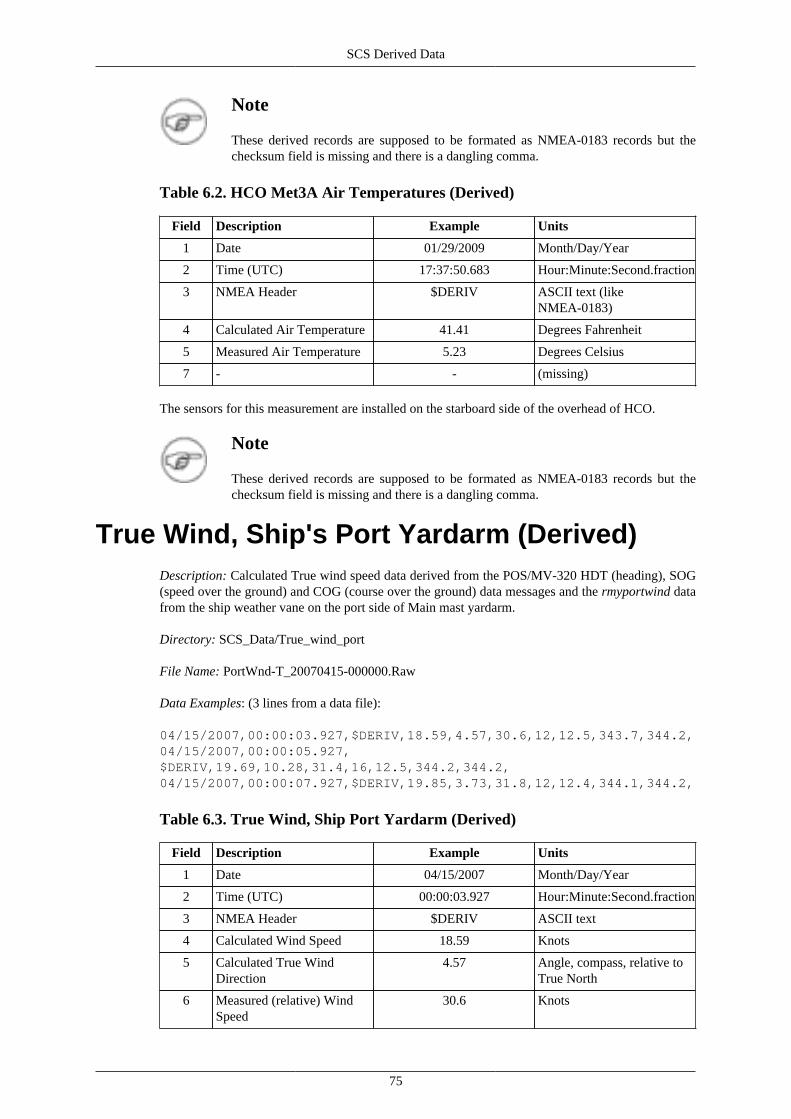
SCS Derived Data
75
Note
These derived records are supposed to be formated as NMEA-0183 records but thechecksum field is missing and there is a dangling comma.
Table 6.2. HCO Met3A Air Temperatures (Derived)
Field Description Example Units
1 Date 01/29/2009 Month/Day/Year
2 Time (UTC) 17:37:50.683 Hour:Minute:Second.fraction
3 NMEA Header $DERIV ASCII text (likeNMEA-0183)
4 Calculated Air Temperature 41.41 Degrees Fahrenheit
5 Measured Air Temperature 5.23 Degrees Celsius
7 - - (missing)
The sensors for this measurement are installed on the starboard side of the overhead of HCO.
Note
These derived records are supposed to be formated as NMEA-0183 records but thechecksum field is missing and there is a dangling comma.
True Wind, Ship's Port Yardarm (Derived)Description: Calculated True wind speed data derived from the POS/MV-320 HDT (heading), SOG(speed over the ground) and COG (course over the ground) data messages and the rmyportwind datafrom the ship weather vane on the port side of Main mast yardarm.
Directory: SCS_Data/True_wind_port
File Name: PortWnd-T_20070415-000000.Raw
Data Examples: (3 lines from a data file):
04/15/2007,00:00:03.927,$DERIV,18.59,4.57,30.6,12,12.5,343.7,344.2,04/15/2007,00:00:05.927,$DERIV,19.69,10.28,31.4,16,12.5,344.2,344.2,04/15/2007,00:00:07.927,$DERIV,19.85,3.73,31.8,12,12.4,344.1,344.2,
Table 6.3. True Wind, Ship Port Yardarm (Derived)
Field Description Example Units
1 Date 04/15/2007 Month/Day/Year
2 Time (UTC) 00:00:03.927 Hour:Minute:Second.fraction
3 NMEA Header $DERIV ASCII text
4 Calculated Wind Speed 18.59 Knots
5 Calculated True WindDirection
4.57 Angle, compass, relative toTrue North
6 Measured (relative) WindSpeed
30.6 Knots

SCS Derived Data
76
Field Description Example Units
7 Measured (relative) WindDirection
12 Angle, compass, relative tothe ship's bow
8 Ship speed over the ground(from POS/MV)
12.5 Knots
9 Ship course over the ground(from POS/MV)
343.7 Degrees of angle, compass,relative to True north
10 Ship heading (from POS/MV)
344.2 Degrees of angle, compass,relative to True north
11 missing - -
10 missing - -
Note
These derived records are supposed to be formated as NMEA-0183 records but thechecksum field is missing and there is a dangling comma.
True Wind, Ship's Starboard Yardarm(Derived)
Description: Calculated True wind speed data derived from the POS/MV-320 HDT (heading), SOG(speed over the ground) and COG (course over the ground) data messages and the rmystbdwind datafrom the ship weather vane on the port side of Main mast yardarm.
Directory: SCS_Data/True_wind_stbd
File Name: StbdWnd-T_20070415-000000.Raw
Data Examples: (3 lines from a data file):
04/15/2007,00:00:03.396,$DERIV,17.33,3.47,29.4,11,12.5,343.7,344.2,04/15/2007,00:00:05.396,$DERIV,17.05,15.29,28.5,18,12.5,344.2,344.2,04/15/2007,00:00:07.396,$DERIV,19.99,13.31,31.4,18,12.4,344.1,344.2,
Table 6.4. True Wind, Ship Starboard Yardarm (Derived)
Field Description Example Units
1 Date 04/15/2007 Month/Day/Year
2 Time (UTC) 00:00:03.927 Hour:Minute:Second.fraction
3 NMEA Header $DERIV ASCII text
4 Calculated Wind Speed 19.99 Knots
5 Calculated True WindDirection
13.31 Angle, compass, relative toTrue North
6 Measured (relative) WindSpeed
30.6 Knots
7 Measured (relative) WindDirection
18 Angle, compass, relative tothe ship's bow
8 Ship speed over the ground(from POS/MV)
12.4 Knots

SCS Derived Data
77
Field Description Example Units
9 Ship course over the ground(from POS/MV)
344.1 Degrees of angle, compass,relative to True north
10 Ship heading (from POS/MV)
344.2 Degrees of angle, compass,relative to True north
11 missing - -
10 missing - -
Note
These derived records are supposed to be formated as NMEA-0183 records but thechecksum field is missing and there is a dangling comma.
Shipboard Automated Meteorological andOceanographic Systems (SAMOS) deriveddata
Healy routinely sends data in SAMOS format by email to ------- under a program coordinated byShawn Smith of whatever. This section describes the data formats for the files created by SCS fromwhich data is taken to construct these messages.
Example SAMOS format (scalar)
Description: Example file using the Oxygen data
Directory: SCS_Data/SAMOS
File Name: SAMOS-OX_20080325-000000.Raw
Data Examples: (3 lines from a data file):
03/25/2008,00:00:04.710,$DERIV,7.71,7.712,215.893,28,03/25/2008,00:00:06.132,$DERIV,7.71,7.712,223.605,29,03/25/2008,00:00:07.475,$DERIV,7.71,7.709,223.605,29,
Table 6.5. Example SAMOS data record (scalar)
Field Description Example Units
1 Date 03/25/2008 Month/Day/Year (fromSCS)
2 Time (UTC) 00:00:04.710 Hour:Minute:Second.fraction(from SCS)
3 NMEA Header $DERIV ASCII text
4 Mean value (calculated) 7.71 Need to define the periodover which this is calculated
5 Last value used 7.712 meters per second (m/s)
6 Sum of values 124.12 Degrees, angle from TrueNorth
7 number of values 7.87 meters per second (m/s)

SCS Derived Data
78
Field Description Example Units
8 missing - -
9 missing - -
Example SAMOS format (data in degrees)
Description: Example file using the Jack Staff True Wind data
Directory: SCS_Data/SAMOS
File Name: SAMOS-TIB_20080326-000000.Raw
Data Examples: (3 lines from a data file):
Get THE RIGHT EXAMPLE DATA
Table 6.6. Example SAMOS data record (degrees)
Field Description Example Units
1 Date 03/26/2008 Month/Day/Year (fromSCS)
2 Time (UTC) 00:00:04.561 Hour:Minute:Second.fraction(from SCS)
3 NMEA Header $DERIV ASCII text
4 Arctangent of the sums 79.39 Need better description orreference
5 Last value used 93.174 Need better description orreference
6 Mean of the Sines() 57.4453621646971 Need better description orreference
7 Mean of the Sines() 10.7645427712987 Need better description orreference
8 Number of values 59 -
SAMOS Data Designator Keys
The SAMOS data file names are constructed by including a multi-letter key to indicate the data type.This section describes those keys.
Description: E The data filenames each have a 2 (or more) letter data type designator. Files namesare composed shown in the following table.
Table 6.7. SAMOS File Name Components
Component Example Comment
Identifier SAMOS- Fixed for SAMOS records
XX[X] Key From the designators shown inthe table below
YYYMMDD Date Year Month Day
.Raw Extension Fixed for SAMOS records

SCS Derived Data
79
Directory: SCS_Data/SAMOS
File Name: SAMOS-OX_20080325-000000.Raw
Table 6.8. SAMOS Data Types
Parameter Designator Source Data File Identifier
Air Temperature AT
Air temperature) AT1 $PSMEA(2
Atmospheric Pressure BP
Atmospheric. Pressure BP1 $PSMEA(4)
Conductivity TC $PSTSA(3)
Course over ground CR
Depth to Surface BT
Dew point temperature DP
Earth relative wind direction TIP
Earth relative wind direction TIB $PSWDA(4)
Earth relative wind direction TIS1 $PSWDB(4)
Earth Relative Wind DirectionStbd
TIS
Earth relative wind speed TKP
Earth relative wind Speed TWB $PSWDA(5)
Earth relative wind speed TWS $PSWDB(5)
Earth Relative Wind Speed Stbd TKS
Flow through TSG FI $PSFMA(2)
Heading GY
Heave VH
Latitude LA
Longitude LO
Longitudinal Water Speed Fore -Aft
SL
Long wave radiation LW $PSSRA(4)
Long wave radiation LD $PSSRA(6)
Long wave radiation LB $PSSRA(8)
Oxygen OX $PSOXA(2)
Oxygen OT $PSOXA(4)
Photo synthetically ActiveRadiation
PA $PSSPA(2)
Pitch VP
POS-MV Heading SH
Precipitation PR $PSMEA(5)
Relative humidity RH
Relative humidity RH1 $PSMEA(3)
Roll VR
Salinity $PSTSA(4) SA

SCS Derived Data
80
Parameter Designator Source Data File Identifier
Sea Surface Temp ST $PSSTA(2)
Ship relative wind direction WDP
Ship relative wind direction WDB $PSWDA(2)
Ship Relative Wind DirectionStbd
WDS
Ship relative wind speed WKP
Ship relative wind speed WSB $PSWDA(3)
Ship relative wind speed WSS $PSWDB(3)
Ship Relative Wind Speed Stbd WKS
Shortwave radiation SW $PSSRA(2)
Speed over ground SP
Transverse Water Speed Port toStbd
SX
TSG Fluorescence FL1 $PSFLA(2)
TSG Fluorescence FL $PSFLB(2)
TSG internal water temperature TT $PSTSA(2)
Turbidity TB $PSFLB(4)

81
Appendix A. Revision HistoryTable A.1. Revision History of the Healy Data Formats Document
Date Version Author Comment
- 1 Tom Bolmer The original versionwas part of the mondoMS-Word file -Tom
July 2009 1.01 Tom Bolmer HTML-only version forHLY0902 -Tom
August 1-6, 2009 2.01 Dale Chayes Converted to XMLand DocBook 5.0 forHLY0904 (Pickart -ONR/NSF) -Dale
Fri, 09 Jul 2010 5 Dale Very early in the switchto Subversion duringHLY1001 (Arrigo -NASA) -Dale
Sat, 10 Jul 2010 10 Dale Significantly furtherdown the road but notquite done. Finish upand then have othersreview it.
11 Jul 2010 12 Dale First pass throughwith raw entry andconstruction
12 Jul 2010 14 Dale Fixing layout issues:converting "literal" to"literallayout".
Mon, 30 Aug 2010 16 dale Incorporate commentsfrom Steve Robers. Stillworking on how tolayout the examples.
Tues, 31 Aug 2010 18 Tom Add TSG sectionto LDS. Generalediting. Add shortCNAV in LDS section.Add MX512 section.Reorganized sections.
Wed, 1 Sept 2010 19 Tom Add actual data toMX512 section. Moreorganizing.
Fri, 3 Sept 2010 20 Tom Fix paths. Revisionhistory should be at thebottom - need to figurethat out. Note that theXCTD section sems abit mixed up - we needto check it.
Sat, 4 Sept 2010 21 Tom Placed Revision historyat the bottom.