Embed Size (px)
Citation preview

8/3/2019 USANA 2010 Annual Report
http://slidepdf.com/reader/full/usana-2010-annual-report 1/104
ANA DECADES EXECUTIVE TEAM DIVERSE EXPERIENCE HISTORY SUCCESS HELP COMPANY ACH
ION SUCCESS USANA DECADES EXECUTIVE TEAM DIVERSE EXPERIENCE HISTORY SUCCESS HELP COM
CHIEVE VISION USANA DECADES EXECUTIVE TEAM DIVERSE EXPERIENCE HISTORY SUCCESS
MPANY ACHIEVE VISION USANA DECADES EXECUTIVE TEAM DIVERSE EXPERIENCE HISTORY SUC
LP COMPANY ACHIEVE VISION USANA DECADES EXECUTIVE TEAM DIVERSE EXPERIENCE HIST
CCESS HELP COMPANY ACHIEVE VISION USANA DECADES EXECUTIVE TEAM DIVERSE EXPERI
TORY SUCCESS HELP COMPANY ACHIEVE VISION USANA DECADES EXECUTIVE TEAM DIV
XPERIENCE HISTORY SUCCESS HELP ACHIEVE VISION USANA COMPANY DECADES EXECU
AM DIVERSE EXPERIENCE HISTORY SUCCESS HELP COMPANY ACHIEVE VISION USANA DEC
ECUTIVE TEAM DIVERSE USANA EXPERIENCE HISTORY SUCCESS HELP COMPANY ACHIEVE V
ANA DECADES EXECUTIVE TEAM INNOVATIVE DIVERSE EXPERIENCE HISTORY SUCCESS HELP COM
HIEVE VISION USANA DECADES EXECUTIVE TEAM DIVERSE EXPERIENCE HISTORY SUCCESS
MPANY USANA DECADES EXECUTIVE VISION HELP DIVERSE ACHIEVE INNOVATIVE COMPANY SUCCE
OVATIVE ACHIEVE VISION USANA DECADES EXECUTIVE TEAM DIVERSE EXPERIENCE HISTORY SUC
MPANY HELP ACHIEVE INNOVATIVE USANA DECADES DIVERSE EXPERIENCE HISTORY HELP COM
XECUTIVE ACHIEVE VISION USANA DECADES EXECUTIVE TEAM DIVERSE EXPERIENCE HIST
CCESS HELP COMPANY ACHIEVE VISION USANA DECADES EXECUTIVE TEAM DIVERSE EXPERI
TORY USANA SUCCESS HELP COMPANY ACHIEVE EXPERIENCE VISION USANA EXECUTIVE T
OVATIVE DIVERSE HISTORY SUCCESS HELP COMPANY ACHIEVE VISION USANA DECADES EXECU
M DIVERSE EXPERIENCE HISTORY SUCCESS HELP COMPANY EXECUTIVE ACHIEVE VISION USANA DEC
TORY DIVERSE DECADES SUCCESS EXPERIENCE HELP ACHIEVE VISION USANA EXECUTIVE T
VERSE EXPERIENCE HISTORY SUCCESS VISION TEAM COMPANY ACHIEVE VISION USANA DEC
ECUTIVE TEAM DIVERSE EXPERIENCE HISTORY SUCCESS HELP COMPANY ACHIEVE V
ANA DECADES SUCCESS EXECUTIVE TEAM DIVERSE EXPERIENCE HISTORY SUCCESS HELP COM
CHIEVE VISION USANA DECADES EXECUTIVE TEAM DIVERSE EXPERIENCE DECADES HISTORY SUC
LP COMPANY ACHIEVE VISION USANA DECADES EXECUTIVE TEAM DIVERSE EXPERIENCE HIST
CCESS HELP COMPANY ACHIEVE VISION USANA DECADES EXECUTIVE INNOVATIVE DIVERSE EXPERIE
TORY SUCCESS HELP COMPANY ACHIEVE VISION USANA DECADES EXECUTIVE TEAM DIV
PERIENCE HISTORY SUCCESS HELP COMPANY ACHIEVE VISION USANA DECADES EXECUTIVE T
VERSE EXPERIENCE HISTORY SUCCESS HELP COMPANY ACHIEVE VISION USANA DECADES EXECU
AM DIVERSE EXPERIENCEHISTORY SUCCESS INNOVATIVE HELP COMPANY ACHIEVE VISION USANA DE
ECUTIVE TEAM DIVERSE EXPERIENCE HISTORY INNOVATIVE HELP COMPANY ACHIEVE VISION U
CADES EXECUTIVE TEAM DIVERSE EXPERIENCE HISTORY SUCCESS HELP COMPANY ACHIEVE V
ANA DECADES EXECUTIVE TEAM DIVERSE EXPERIENCE HISTORY SUCCESS HELP COMPANY ACH
ION USANA DECADES EXECUTIVE TEAM HISTORY DIVERSE EXPERIENCE COMPANY USANA SUC
NOVATIVE DIVERSE VISION USANA DECADES EXECUTIVE DIVERSE EXPERIENCE HISTORY SUCCESS
MPANY ACHIEVE VISION USANA HISTORY DECADES EXECUTIVE TEAM DIVERSE EXPERIENCE COM
CCESS COMPANY ACHIEVE VISION USANA INNOVATIVE EXECUTIVE COMPANY DIVERSE EXPERIENCE HIST
LP VISION ACHIEVE VISION USANA DECADES EXECUTIVE HELP TEAM DIVERSE EXPERIE
TORY SUCCESS HELP COMPANY ACHIEVE VISION USANA DECADES EXECUTIVE TEAM DIVERSE SUC
P COMPANY ACHIEVE VISION USANA DECADES EXECUTIVE TEAM DIVERSE INNOVATIVE EXPERI
OMPANY HISTORY SUCCESS HELP COMPANY ACHIEVE VISION USANA DECADES EXECUTIVE TE
VERSE SUCCESS HELP COMPANY ACHIEVE VISION USANA DECADES EXECUTIVE TEAM DIVERSE EXPERI
TORY SUCCESS ACHIEVEUSANA DECADES EXECUTIVE TEAM DIVERSE ACHIEVE HISTORY SUCCES
ANNUAL REPORT 2010

8/3/2019 USANA 2010 Annual Report
http://slidepdf.com/reader/full/usana-2010-annual-report 2/104
Dear Fellow Shareholders,
I am excited to say that 2010 was a period of record results and historic endeavors for USANA. I am happy to share that
we exceeded a half billion dollars in sales for the first time in our 18-year history, which resulted in our eighth consecutive
year of record sales, at $518 million. While our Associates worked hard to gain market share and overcome challenging
economic circumstances, our management team focused on improving operating margins, and reported record earnings of
$2.86 per share. Most importantly, we continued to advance the long-term growth strategy for USANA with our entrance
into China through our indirect acquisition of BabyCare Ltd., a successful and licensed direct-selling company based in Beijing.
China is the second largest direct selling market in the world. In light of our rapid growth in the Asia Pacific markets and
the strength of our Asian Associate base, China represents a significant growth opportunity for USANA. We believe our
acquisition of BabyCare is the most efficient way for USANA to capitalize this market. Although we will need to make
meaningful investments to integrate and align USANA and BabyCare in the short-term, we are positioning ourselves and
laying the foundation for a successful future in China. Our BabyCare staff is among the most experienced and qualified
in China, and with their assistance and our in-house expertise, we expect to begin introducing USANA-labeled products
into the Chinese market through BabyCare in the next three to nine months. With the introduction of these products, we
anticipate that sales in BabyCare will meaningfully increase.
This past year was also a time for immense advances and updates in our product line. We introduced several new products,thanks in part to USANA’s research relationship with Sanoviv Medical Institute. Three new Digestive/Detox products were
introduced: Digestive Enzyme; an updated, more effective and cost-efficient Fibergy ® Plus; and our new Hepasil DTX ™,
which was manufactured with our new Hybrid Nutritional Technology. We also launched Proflavanol® C100, another
Hybrid Nutritional, and Sensé’s new, all-natural toothpaste.
We also focused our attention on helping Associates spread the USANA message easier and more effectively than ever
before. The Health & Freedom Solution, an interactive DVD presentation system, was designed to provide prospects with
detailed and all-encompassing information about USANA and our products, while still allowing Associate presenters to
share their unique USANA message. And with an updated Media Center, eApprentice tools, and much more, Associates
can now choose how and when they’d like to share the USANA opportunity with others.
In addition to these new tools, we are magnifying our efforts to enhance our global brand. We increased our sponsorship of
the Women’s Tennis Association (WTA), receiving access to six of the top tennis players in the world to support USANA’s
top-rated nutritional products. And we are currently on the road promoting our new book, The Healthy Home, with a
book tour that includes scientific demonstrations and information everyone should know about how to keep their homes
and their families healthy. With all of our activities, we are confident USANA will be catching the public’s eye this year,
giving our Associates more ways than ever to talk about USANA’s products.
As we move into 2011, our primary corporate performance objectives will largely focus on our integration of the BabyCare
line, as well as growth in our North America region. We believe 2011 will be a transitional year for us, as we will continue
to make the necessary long-term growth investments that will keep USANA a strong and growing company. Our
continued growth, along with our world-class products, entrepreneurial-minded Associates, exceptional cash flow, andour solid balance sheet, make USANA Health Sciences a unique and exceptional investment.
We thank you, our investors, for your continued interest and support.
Sincerely,
David A. Wentz Myron W. Wentz, Ph.D.
Chief Executive Officer Founder and Chairman of the Board

8/3/2019 USANA 2010 Annual Report
http://slidepdf.com/reader/full/usana-2010-annual-report 3/104
UNITED STATESSECURITIES AND EXCHANGE COMMISSION
Washington, D.C. 20549 ___________________
FORM 10-K (Mark One)[X] ANNUAL REPORT PURSUANT TO SECTION 13 OR 15(d) OF THE SECURITIES EXCHANGE
ACT OF 1934
For the fiscal year ended January 1, 2011
OR
[ ] TRANSITION REPORT PURSUANT TO SECTION 13 OR 15(d) OF THE SECURITIESEXCHANGE ACT OF 1934
For the transition period from ___________ to ____________
Commission file number: 0-21116 ____________________
USANA HEALTH SCIENCES, INC.(Exact name of registrant as specified in its charter)
Utah 87-0500306
(State or other jurisdiction of incorporation or organization) (I.R.S. Employer Identification No.)
3838 West Parkway Blvd., Salt Lake City, Utah 84120
(Address of principal executive offices, Zip Code)
(801) 954-7100
(Registrant's telephone number, including area code) ____________________
Securities registered pursuant to Section 12(b) of the Act:
(Title of each class) (Name of each exchange on which registered)Common Stock, Par Value $0.001 Per Share New York Stock Exchange
Securities registered pursuant to Section 12(g) of the Act:None
____________________
Indicate by check mark if the registrant is a well-known seasoned issuer, as defined in Rule 405 of the Securities Act. Yes [ ] No [X]
Indicate by check mark if the registrant is not required to file reports pursuant to Section 13 or 15(d) of the Act. Yes [ ] No [X]
Indicate by check mark whether the registrant (1) has filed all reports required to be filed by Section 13 or 15(d) of the Securities Exchange Act of 1934 during the preceding 12 months (or for such shorter period that the registrant was required to file such reports), and (2) has beensubject to such filing requirements for the past 90 days. Yes [X] No [ ]
Indicate by check mark whether the registrant has submitted electronically and posted on its corporate Website, if any, every InteractiveData File required to be submitted and posted pursuant to Rule 405 of Regulation S-T (§ 232.405 of this chapter) during the preceding 12months (or for such shorter period that the registrant was required to submit and post such files). Yes [ ] No [ ]
Indicate by check mark if disclosure of delinquent filers pursuant to Item 405 of Regulation S-K (§ 229.405 of this chapter) is notcontained herein, and will not be contained, to the best of the registrant's knowledge, in definitive proxy or information statementsincorporated by reference in Part III of this Form 10-K or any amendment to this Form 10-K. [ ]
Indicate by check mark whether the registrant is a large accelerated filer, an accelerated filer, a non-accelerated filer, or a smaller reporting company. See the definitions of “large accelerated filer,” “accelerated filer” and “smaller reporting company” in Rule 12b-2 of the Exchange
Act. Large accelerated filer [ ] Accelerated filer [X] Non-accelerated filer [ ] Smaller reporting company [ ]
Indicate by check mark whether the registrant is a shell company (as defined in Rule 12b-2 of the Act). Yes [ ]No [X]
The aggregate market value of common stock held by non-affiliates of the registrant as of July 2, 2010 was approximately $259,102,000,based on a closing market price of $37.07 per share.
There were 15,843,837 shares of the registrant’s common stock outstanding as of March 7, 2011.
Documents incorporated by reference. The registrant incorporates information required by Part III (Items 10, 11, 12, 13, and 14) of thisreport by reference to the registrant’s definitive proxy statement to be filed pursuant to Regulation 14A for its 2011 Annual ShareholdersMeeting.

8/3/2019 USANA 2010 Annual Report
http://slidepdf.com/reader/full/usana-2010-annual-report 4/104
2
USANA HEALTH SCIENCES, INC. FORM 10-K
For the Fiscal Year Ended January 1, 2011INDEX
Page
Part I
Item 1 Business................................................................................................... 3
Item 1A Risk Factors............................................................................................. 26
Item 1B Unresolved Staff Comments..................................................................... 40
Item 2 Properties................................................................................................. 40
Item 3 Legal Proceedings..................................................................................... 41
Item 4 (Removed and Reserved)......................................................................... 41
Part II
Item 5 Market for Registrant's Common Equity, Related Stockholder Matters
and Issuer Purchases of Equity Securities............ ......... ........ ........ ......... 41
Item 6 Selected Financial Data............................................................................ 43
Item 7 Management's Discussion and Analysis of Financial Condition and
Results of Operations............................................................................ 44
Item 7A Quantitative and Qualitative Disclosures About Market Risk................. 63
Item 8 Financial Statements and Supplementary Data........................................ 64
Item 9 Changes in and Disagreements with Accountants on Accounting and
Financial Disclosure............................................................................... 64
Item 9A Controls and Procedures.......................................................................... 64
Item 9B Other Information.................................................................................... 66
Part III
Item 10 Directors, Executive Officers and Corporate Governance....................... 66
Item 11 Executive Compensation......................................................................... 66
Item 12 Security Ownership of Certain Beneficial Owners and Management and
Related Stockholder Matters.................................................................. 66
Item 13 Certain Relationships and Related Transactions, and
Director Independence........ ........ ......... ......... ......... ....... ........ ......... ........ 66
Item 14 Principal Accounting Fees and Services................................................... 66
Part IV
Item 15 Exhibits, Financial Statement Schedules.................................................. 66
Signatures ................................................................................................................. 69

8/3/2019 USANA 2010 Annual Report
http://slidepdf.com/reader/full/usana-2010-annual-report 5/104
3
The statements contained in this report on Form 10-K that are not purely historical are considered to be “forward-looking statements” within the meaning of the Private Securities Litigation Reform Act of 1995 and Section 21E of the Securities Exchange Act of 1934, as amended (the “Exchange Act”). These statements represent our expectations, beliefs, anticipations, commitments, intentions, and strategies regarding the future and include, but are not limited to, the risks and uncertainties outlined in Item 1A Risk Factors and Item 7 Management’s Discussion and Analysis of Financial Condition and Results of Operations. Readers are cautioned
that actual results could differ materially from the anticipated results or other expectations that are expressed in forward-looking statements within this report. The forward-looking statements included in this report speak only as of the date hereof.
In this Annual Report on Form 10-K, references to “dollars” and “$” are to United States dollars.
All references to our “Associates” and “Preferred Customers” in this Annual Report on Form 10-K also now include the non-employee distributor sales force and preferred customers of our wholly-owned subsidiary, BabyCare,Ltd. (“BabyCare”) in China. Additionally, for ease of reference, and unless otherwise noted in this Annual Report,USANA’s compensation plan and BabyCare’s compensation plan are sometimes referred to in this report collectively as “Compensation Plan.”
PART I
Item 1. Business
General
USANA Health Sciences, Inc. (“we,” “USANA” or the “Company”) is a Utah corporation,founded in 1992 by Myron W. Wentz, Ph.D. We develop and manufacture high-quality, science-based nutritional and personal care products with a focus on reducing the risk of chronicdegenerative disease and promoting long-term health. In so doing, we are committed tocontinuous product innovation and sound scientific research. We have operations in 15 markets worldwide where we distribute and sell our products by way of direct selling. Our net sales in fiscalyear 2010 were $517.6 million, which marks the first year in which we have exceeded a half billion
dollars in net sales.
Our customer base is comprised of two types of customers: “Associates” and “PreferredCustomers.” Associates are independent distributors of our products, who also purchase ourproducts for personal use. Preferred Customers purchase our products strictly for personal use andare not permitted to resell or to distribute the products. As of January 1, 2011, we had 228,000active Associates and 77,000 active Preferred Customers worldwide. For purposes of this report, we only count as active customers those Associates and Preferred Customers who have purchasedproduct from us at any time during the most recent three-month period, either for personal use orfor resale.
Recent Developments
In August 2010, we indirectly acquired BabyCare, Ltd, a direct selling company organizedunder the laws of China. BabyCare is principally engaged in developing, manufacturing and selling nutritional products for the entire family, with an emphasis on infant nutrition. BabyCare has beengranted a license to engage in direct selling in the municipality of Beijing and is working to obtainadditional direct selling licenses in other Chinese provinces and cities. BabyCare’s products are soldthrough both a distributor sales force and a chain of retail centers in China. This acquisition added$7.4 million in net sales during 2010 and reduced net earnings by approximately $3.1 million, which

8/3/2019 USANA 2010 Annual Report
http://slidepdf.com/reader/full/usana-2010-annual-report 6/104
4
includes $2.0 million in acquisition costs, as well as other corporate items related to the BabyCareoperation. BabyCare also added 12,000 Associates and 14,000 Preferred Customers to the totalnumber of our active customers at year-end. Our acquisition of BabyCare is significant to us, as itprovides a growth opportunity for USANA in China. In accordance with Chinese law, BabyCarecontinues to operate independently from USANA in China. We are, however, working closely withregulatory agencies in China to have USANA products registered and approved for sale by
BabyCare in China.
Also in August 2010, we launched new products and a new manufacturing technology,introduced a new interactive presentation tool for our Associates, and announced enhancements toour Associate recognition and rewards programs. Our new manufacturing technology, which wecall Nutritional Hybrid Technology™, allows us to combine two distinct formulas into one bi-layered tablet, allowing for advanced ingredient combinations, while providing product stability.Our new interactive presentation tool, called Health and Freedom Solution™, was created anddesigned to help our Associates, many of whom are new to network marketing, explain and sharethe USANA opportunity, including the benefits of our products and our Associate CompensationPlan.
Finally, the difficult global economic conditions continue to hamper growth in many of themarkets where we have operations, particularly in our North America region. During these difficulteconomic times, North America experienced a decline in the number of Associates and PreferredCustomers purchasing our products and building a home-based business. To offset these declines, we will be introducing several key initiatives in 2011, including a greater emphasis on brandrecognition, to grow sales and the number of Associates and Preferred Customers in North America.
Products
Our primary product lines consist of USANA® Nutritionals and Sensé – beautiful science®
(“Sensé”), a unique line of skin and personal care products. The USANA® Nutritionals product
line is further categorized into three separate classifications: Essentials, Optimizers, and Foods(formerly Macro-Optimizers). BabyCare’s core nutritional products are categorized similarly.
USANA® Nutritionals
-Essentials
The Essentials category includes core vitamin and mineral supplements that provide afoundation of advanced total body nutrition for every age group beginning with children 13 monthsof age. Two of our three top selling products, the USANA® Essentials and the HealthPak 100™,are from this category. The USANA® Essentials consist of two products: Mega Antioxidant andChelated Mineral. The HealthPak 100™ includes the USANA® Essentials and some key Optimizersconveniently packaged in a daily pillow pack form. USANA’s customers in the United States alsohave the option of creating their own customized pre-packaged supplement regimen, similar to theHealthPak 100™, called MyHealthPak ™. MyHealthPaks can include virtually any of the Optimizersand Essentials. Additionally, BabyCare offers a line of core vitamin and mineral supplements very similar to the Essentials that provide a foundation of advanced nutrition with three productsdesigned specifically for prenatal, infant, and young child age groups.

8/3/2019 USANA 2010 Annual Report
http://slidepdf.com/reader/full/usana-2010-annual-report 7/104
5
-Optimizers
The Optimizers category consists of our targeted supplements that are designed to meetindividual health and nutritional needs. These products support needs such as cardiovascularhealth, skeletal/structural health, and digestive health, and are intended to be used in conjunction with the Essentials. Our third top selling product, Proflavanol, is from this category. Other key
products in this category include BiOmega-3
™
, CoQuinone
®
30, Active Calcium
™
, and Procosa
®
II.BabyCare offers a line of targeted supplements very similar to the Optimizers.
As is customary at USANA, during the second half of 2010 we launched some new products,two of which feature our new Nutritional Hybrid Technology. The first of these products isProflavanol® C100, which is a combination of two of our most popular Optimizers, Proflavanol ® and Poly C®. The second of these products is Hepasil DTX ™, a comprehensive liver supportformula. The other products that we introduced include a Digestive Enzyme tablet; Fibergy ® Plus, aflavorless fiber blend additive; and Booster C 600™, a lemon-berry flavored immune supportsupplement.
-Foods
USANA Foods rounds out the USANA Nutritionals product line and includes low-glycemicmeal replacement shakes, snack bars, and other related products that provide optimal macro-nutrition (complex carbohydrates, complete proteins, and beneficial fats) in great tasting andconvenient formats. USANA Foods can be used along with Essentials and Optimizers to provide acomplete and healthy diet and sustained energy throughout the day. Also included in this category is our RESET™ weight-management program and accompanying RESET kit, which is conveniently packaged in a self-contained box with all of the USANA products that are needed to complete afive-day regimen designed to assist adults in losing weight and to begin a positive, long-term changein their diet.
Sensé – beautiful science ®
The Sensé – beautiful science product line includes premium, science-based, personal careproducts that support healthy skin and hair by providing advanced topical nourishment,moisturization, and protection. These products are designed to complement inner nutrition for theskin provided by the USANA® Nutritionals. Sensé products are manufactured with our patented,self-preserving technology, which uses a unique blend of botanicals, antioxidants, and activeingredients to keep products fresh, without adding traditional chemical preservatives.
All Other
In addition to our primary product lines, we develop and sell materials and online tools that aredesigned to assist our Associates in building their businesses and in marketing our products. Theseinclude items such as product brochures, business forms, and DVD’s. New Associates are required
to purchase a starter kit, which contains USANA training materials that help them build theirbusinesses. The kit includes an online training system that we call eApprentice™, which wasdeveloped to provide new Associates with immediate access to network marketing training that isboth simple to use and easy to understand. BabyCare offers similar resource materials and businesstools to assist their Associates in building their businesses and marketing BabyCare products. Wedo not pay any commissions on the sale of starter kits or sales tools.

8/3/2019 USANA 2010 Annual Report
http://slidepdf.com/reader/full/usana-2010-annual-report 8/104
6
Key Products Sales Data
The following table summarizes the approximate percentages of total product sales that werecontributed by our major product lines for the last three fiscal years:
Year Ended
2008 2009 2010USANA® NutritionalsEssentials............................................................................ 34% 33% 30%Optimizers.......................................................................... 41% 43% 47%USANA Foods.................................................................. 12% 12% 12%
Sens – beautiful science®..................................................... 10% 9% 8% All Other................................................................................... 3% 3% 3%
The following table highlights sales data for our top-selling products as a percentage of totalproduct sales for the last three fiscal years.
2008 2009 2010
USANA® Essentials............................................................... 20% 19% 18%HealthPak 100™..................................................................... 12% 12% 10%Proflavanol® ........................................................................... 10% 11% 11%
Year Ended
Geographic Presence
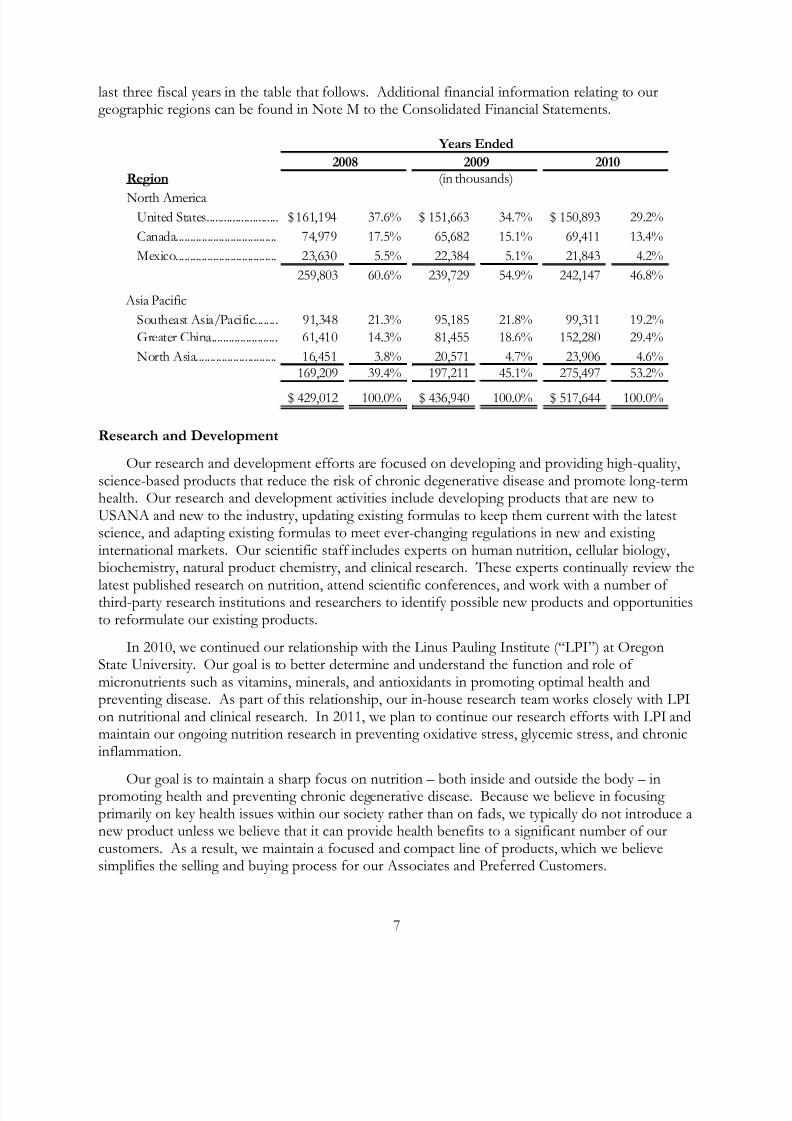
Our products are distributed and sold in 15 markets. We present information for thesemarkets in two geographic regions: North America and Asia Pacific, with three sub-regions under Asia Pacific. Markets are categorized into these regions as follows:
• North America –
• United States (including direct sales from the United States to the United Kingdom and
the Netherlands)
• Canada
• Mexico
• Asia Pacific –
• Southeast Asia/Pacific – Australia, New Zealand, Singapore, Malaysia, and thePhilippines
• Greater China(1) – Hong Kong, Taiwan, and China(2)
• North Asia – Japan and South Korea
(1) Formerly referred to as East Asia.(2) Our business in China is that of BabyCare, which we indirectly acquired on August 16, 2010.
As a U.S.-based multi-national company with an expanding international presence, ouroperating results are becoming more sensitive to currency fluctuations, as well as economic andpolitical conditions in markets throughout the world. Net sales reported for each geographic regionare determined by the location from which the product shipment originates and are reported for the
8/3/2019 USANA 2010 Annual Report
http://slidepdf.com/reader/full/usana-2010-annual-report 9/104
7
last three fiscal years in the table that follows. Additional financial information relating to ourgeographic regions can be found in Note M to the Consolidated Financial Statements.
Years Ended
2008 2009 2010
Region (in thousands)
North AmericaUnited States......................... 161,194$ 37.6% 151,663$ 34.7% 150,893$ 29.2%
Canada................................... 74,979 17.5% 65,682 15.1% 69,411 13.4%
Mexico................................... 23,630 5.5% 22,384 5.1% 21,843 4.2%
259,803 60.6% 239,729 54.9% 242,147 46.8%
Asia Pacific
Southeast Asia/Pacific........ 91,348 21.3% 95,185 21.8% 99,311 19.2%
Greater China....................... 61,410 14.3% 81,455 18.6% 152,280 29.4%
North Asia............................ 16,451 3.8% 20,571 4.7% 23,906 4.6%169,209 39.4% 197,211 45.1% 275,497 53.2%
429,012$ 100.0% 436,940$ 100.0% 517,644$ 100.0%
Research and Development
Our research and development efforts are focused on developing and providing high-quality,science-based products that reduce the risk of chronic degenerative disease and promote long-termhealth. Our research and development activities include developing products that are new toUSANA and new to the industry, updating existing formulas to keep them current with the latestscience, and adapting existing formulas to meet ever-changing regulations in new and existing international markets. Our scientific staff includes experts on human nutrition, cellular biology,biochemistry, natural product chemistry, and clinical research. These experts continually review the
latest published research on nutrition, attend scientific conferences, and work with a number of third-party research institutions and researchers to identify possible new products and opportunitiesto reformulate our existing products.
In 2010, we continued our relationship with the Linus Pauling Institute (“LPI”) at OregonState University. Our goal is to better determine and understand the function and role of micronutrients such as vitamins, minerals, and antioxidants in promoting optimal health andpreventing disease. As part of this relationship, our in-house research team works closely with LPIon nutritional and clinical research. In 2011, we plan to continue our research efforts with LPI andmaintain our ongoing nutrition research in preventing oxidative stress, glycemic stress, and chronicinflammation.
Our goal is to maintain a sharp focus on nutrition – both inside and outside the body – inpromoting health and preventing chronic degenerative disease. Because we believe in focusing primarily on key health issues within our society rather than on fads, we typically do not introduce anew product unless we believe that it can provide health benefits to a significant number of ourcustomers. As a result, we maintain a focused and compact line of products, which we believesimplifies the selling and buying process for our Associates and Preferred Customers.

8/3/2019 USANA 2010 Annual Report
http://slidepdf.com/reader/full/usana-2010-annual-report 10/104
8
We follow pharmaceutical standards established by the U.S. Pharmacopeia and otherpharmacopeias in the development and formulation of our products. Our ingredients are selectedto meet a number of criteria, including, but not limited to: safety, potency, purity, stability, bio-availability, and natural versus synthetic. We control the quality of our products beginning at theformulation stage, and we maintain our quality control through controlled sourcing of raw ingredients, manufacturing, packaging, and labeling. In fiscal years 2008, 2009, and 2010, we
expended $3.3 million, $3.6 million, and $3.8 million respectively, on product research anddevelopment activities. We intend to continue dedicating resources at similar levels for researchand development in future years.
Manufacturing and Quality Assurance
We conduct nearly all of the manufacturing, production and quality control operations for ournutritional and personal care products in-house. We have established and maintain manufacturing and quality control facilities in Salt Lake City, Utah and Draper, Utah. We also have amanufacturing and quality control facility in Tianjin, China. Currently, however, this facility doesnot manufacture any of our products. BabyCare manufactures and produces nearly all of itsproducts in-house and maintains manufacturing and quality control facilities in Beijing, China, and
will also utilize our facility in Tianjin, China. Additional information about our U.S. manufacturing,production and quality control operations is set out below.
Tablet Manufacturing
Tablet manufacturing is conducted at our Salt Lake City, Utah manufacturing facility. Ourtablet production process uses automatic and semi-automatic equipment and includes the following activities: identifying and evaluating suppliers of raw materials, acquiring raw materials, analyzing raw material quality, weighing or otherwise measuring raw materials, mixing raw materials intobatches, forming mixtures into tablets, coating and sorting the tablets, analyzing tablet quality,packaging finished products, and analyzing finished product quality. We conduct sample testing of raw materials, in-process materials, and finished products for purity, potency, and composition to
determine whether our products conform to our internal specifications, and we maintain completedocumentation for each of these tests. We employ a qualified staff of professionals to develop,implement and maintain a quality system designed to assure that our products are manufactured toour internal and applicable regulatory agency specifications.
Our Salt Lake City manufacturing facility is registered with the U.S. Food and Drug Administration (“FDA”), Health Canada Natural Health Products Directorate, the Australian Therapeutic Goods Administration (“TGA”), and other governmental agencies, as required. Thisfacility is audited regularly by various organizations and government agencies to assess, among other things, compliance with Good Manufacturing Practice regulations (“GMPs”) and withlabeling claims. Based on these audits, our Salt Lake City manufacturing facility has received andmaintains certifications from the Islamic Foods and Nutrition Counsel of America in compliance
with Halal, NSF International in compliance with product testing and GMPs, and the TGA incompliance with the Therapeutic Goods Act of 1989.
Historically, the manufacture of nutritional or dietary supplements and related products in theUnited States has required compliance with food-model GMPs promulgated by the FDA. In June2007, however, the FDA published GMPs for dietary supplements, which became effective June 1,2008. The dietary supplement GMPs are based on the food-model GMPs, with additional

8/3/2019 USANA 2010 Annual Report
http://slidepdf.com/reader/full/usana-2010-annual-report 11/104
9
requirements that are specific to dietary supplements. We believe our manufacturing processescomply with the GMPs for dietary supplements.
Personal Care Manufacturing
We manufacture the majority of our personal care products at our Draper, Utah manufacturing facility. The production process for personal care products includes identifying and evaluating
suppliers of raw materials, acquiring raw materials, analyzing raw material quality, weighing orotherwise measuring the raw materials, mixing raw materials into batches, analyzing liquid batchquality, packaging finished products, and analyzing finished product quality. We conduct sampletesting of raw materials, in-process materials, and finished products for purity, potency, andcomposition to determine whether our products conform to our internal specifications, and wemaintain complete documentation for each of these tests.
At our Draper facility, we have standard technology for producing batches of personal careitems, and we have semi-automatic packaging equipment for packaging end products. We employ qualified staff to develop, implement, and maintain a quality system. Although the FDA has notpromulgated GMPs for personal care items, it has issued guidelines for manufacturing personal careproducts. We voluntarily maintain compliance with the guidance established by FDA and thePersonal Care Products Council.
Third-Party Suppliers and Manufacturers
We contract with third-party suppliers and manufacturers for the production of some of ourproducts, which account for approximately 27% of our product sales. These third-party suppliersand manufacturers produce and, in most cases, package these products according to formulationsthat have been developed by, or in conjunction with, our in-house product development team. These products include gelatin-capsulated supplements, Rev3 Energy™ Drink, Probiotic, ourpowdered drink mixes and nutrition bars, and certain of our personal care products. Productsmanufactured at these locations must also go through quality control and assurance procedures toensure they are manufactured in conformance with our specifications.
Quality Control/Assurance
We conduct quality control processes in two in-house laboratories that are located in Salt LakeCity, Utah. In our microbiology laboratory, scientists test for biological contamination of raw materials and finished goods. In our analytical chemistry laboratory, scientists test for chemicalcontamination and accurate levels of active ingredients in both raw materials and finished products.Both laboratories conduct stability tests on finished products to determine the shelf life of ourproducts. Our laboratory staff also performs chemical assays on vitamin and mineral constituents,using United States Pharmacopoeia methods and other internally validated methods. In addition toour quality control and clinical laboratories, our headquarters facility also houses a laboratory designated for research and development.
Raw Materials
Most of the raw ingredients that are used in the manufacture of our products are availablefrom a number of suppliers. We have not generally experienced difficulty in obtaining necessary quantities of raw ingredients. When supplies of certain raw materials have tightened, we have beenable to find alternative sources of raw materials, and believe we will be able to do so in the future, if the need arises. Accordingly, we are not subject to a single-source supplier for our required supplies
8/3/2019 USANA 2010 Annual Report
http://slidepdf.com/reader/full/usana-2010-annual-report 12/104
10
of raw ingredients. Our raw material suppliers must demonstrate stringent process and quality control before we use their products in our manufacturing process.
Distribution and Marketing
General
We distribute our products internationally through a network marketing system, which is aform of person-to-person direct selling. Under this system, distributors purchase products at wholesale prices from the manufacturer for resale to consumers and for personal consumption. The concept of network marketing is based on the strength of personal recommendations thatfrequently come from friends, neighbors, relatives, and close acquaintances. We believe thatnetwork marketing is an effective way to distribute our products because it allows person-to-personproduct education and testimonials as well as higher levels of customer service, all of which are notas readily available through other distribution channels.
Structure of Network Marketing Program
Associates . A person who wishes to sell USANA products must join our independent sales
force as an Associate. A person becomes an Associate by completing an application under thesponsorship of an existing Associate. The new Associate then becomes part of the sponsoring Associate’s “down-line” sales organization. New Associates sign a written contract and agree toadhere to the USANA policies and procedures. Under the policies and procedures, Associates may not, among other things: (i) use deceptive or unlawful practices to sell USANA products; (ii) makedeceptive or unlawful claims or representations concerning our products or Compensation Plan;and (iii) sell competitive products to other USANA Associates or solicit USANA Associates toparticipate in other network marketing opportunities. New Associates are required to purchase astarter kit that includes a detailed manual describing our business and products as well as ourpolicies and procedures. We sell these kits at a nominal cost of less than $50 in each of ourmarkets. No other investment is required to become an Associate and start a home-based business with USANA.
Once a person becomes an Associate, he or she is able to purchase products directly from us at wholesale prices for personal use and resale to customers. Our Associates are also entitled to buildsales organizations by attracting and enrolling new Associates and establishing a network of productusers. The sponsoring of new Associates results in the creation of multiple levels within ournetwork marketing structure. Sponsored Associates are referred to as part of the “down-line” of the sponsoring Associate. Down-line Associates may also sponsor new Associates, creating additional levels in their network, but also forming a part of the same down-line as the originalsponsoring Associate. As outlined below, Associates who are interested in earning additionalincome must successfully sell USANA products and establish a business network/down-line inorder to qualify for commissions, including bonuses. Subject to payment of a minimal annual
account renewal fee, Associates may continue to distribute or consume our products as long as they adhere to our policies and procedures.
Individuals who reside in China and who are interested in being part of USANA’s organizationin China may do so by joining BabyCare as an Associate. The process for becoming a BabyCare Associate is very similar to the process for joining USANA and requires an initial Associateapplication and an agreement by the Associate to adhere to BabyCare’s policies and procedures.BabyCare, like USANA, provides an Associate with opportunities to build a sales organization and

8/3/2019 USANA 2010 Annual Report
http://slidepdf.com/reader/full/usana-2010-annual-report 13/104
11
receive compensation for sales generated by that organization. In accordance with the direct selling laws in China, however, BabyCare Associates do not participate in USANA’s Compensation Plan.Instead, they are compensated under BabyCare’s compensation plan only, which has been createdand implemented specifically for China.
Preferred Customers . We also sell directly to customers who purchase products only for personal
use. This program is our “Preferred Customer” program. Preferred Customers may not resell ordistribute our products. We believe this program gives us access to a market that would otherwisebe missed, by targeting customers who enjoy USANA products, but who prefer not to maintain adistribution relationship with us. Although our policies prohibit Preferred Customers fromengaging in retail sales of products, they may enroll as Associates at any time, if they desire.Preferred Customers are not eligible to earn commissions or to participate in our CompensationPlan. BabyCare also utilizes a Preferred Customer program, which is similar to USANA’s PreferredCustomer program.
Associate Training and Motivation
Initial training of Associates about the products, the Compensation Plan, network marketing,and about USANA is provided primarily by an Associate’s sponsor and others in their salesorganization. We develop and sell training materials and sales tools to assist Associates in building their businesses, as well as provide reprints from other commercial publications that featureUSANA and may be used as sales tools. We also sponsor and conduct regional, national, andinternational Associate events, as well as intensive leadership training seminars. Attendance at thesesessions is voluntary, and we undertake no generalized effort to provide individualized training to Associates, although experience shows that the most effective and successful Associates participatein training activities. Although we provide leadership training and sales tools, we ultimately rely onour Associates to: (i) sell our products, (ii) attract new Associates and Preferred Customers topurchase our products, and (iii) educate and train new Associates regarding our products andCompensation Plan.
Associate Compensation As outlined below, our Compensation Plan provides several opportunities for Associates to
earn compensation, provided they are willing to consistently work at building, training, andretaining their down-line organizations to sell USANA products to consumers. The purposebehind each form of compensation under our Compensation Plan is to reward Associates forgenerating product sales either directly or indirectly through their down-line sales organization andnetwork of product consumers. We believe our Compensation Plan is among the most generous inthe network marketing industry and distinctive for its weekly payouts to Associates.
Associates can earn compensation in four ways:
• Commissions . The primary way an Associate is compensated is through earning
commissions. Associates earn commissions through generating sales volume points, whichare a measure of the product sales of their down-line sales organization. Sales volumepoints are assigned to each of our products and comprise a certain percent of the productprice in U.S. dollars. To be eligible to earn commissions, an Associate must purchase acertain amount of product each month (“Qualifying Purchases”), which they may resell toconsumers or use personally. Associates do not earn commissions on these Qualifying Purchases. Associates only earn commissions on the purchase of products by Associates in

8/3/2019 USANA 2010 Annual Report
http://slidepdf.com/reader/full/usana-2010-annual-report 14/104
12
their down-line organization and Preferred Customers. Additionally, Associates do notearn commissions for simply recruiting and enrolling others in their down-lineorganization. Commissions are paid only when products are sold. We pay Associatecommissions on a weekly basis. As noted elsewhere in this report, BabyCare maintains itsown compensation plan for its operations in China. Commissions paid under theBabyCare compensation plan are structured differently than commissions paid by USANA
in its other markets, as necessary to comply with Chinese direct selling law.• Bonuses . We offer Associates several bonus opportunities, including our leadership bonus,
elite bonus, and matching bonus. Historically, leadership bonus has been our primary incentive bonus to Associates. However, in 2008, we introduced two new ways for Associates to earn additional compensation: elite bonus and matching bonus. These bonusopportunities are based on a pay-for-performance philosophy and, therefore, are paid out when the Associate achieves the required performance measures.
• Retail Mark-Ups . As discussed previously, our Associates purchase products from us at wholesale prices and resell them to consumers at higher retail prices. The Associate retainsthe retail mark-up as another form of compensation.
• Contests and Promotions . We periodically sponsor contests and promotions designed toincentivize Associates to generate sales and grow their down-line organization and productusers. These promotions are also based on a pay-for-performance philosophy and,therefore, are only paid upon the achievement of the promotion objectives.
We endeavor to integrate our Compensation Plan seamlessly across all markets where legally permissible, allowing Associates to receive commissions for global—not merely local—productsales. This seamless down-line structure is designed to allow an Associate to build a global network by establishing or expanding their down-line in any of the markets where we operate. We believeour Compensation Plan significantly enhances our ability to expand internationally, and we intend, where permitted, to continue to integrate new markets into our Compensation Plan. However, inlight of the direct selling laws in China, BabyCare Associates do not participate in USANA’s
Compensation Plan. Instead, they are compensated under BabyCare’s compensation plan, whichhas been created and implemented specifically for China.
Industry Overview
As both a manufacturer and a direct seller of nutritional and personal care products, wecompete within two industries: nutrition and direct selling. The nutrition industry includes many companies that manufacture and distribute products that are generally intended to maintain thebody’s health and general well-being, including the following:
• Nutritional Supplements—products such as vitamins and minerals, specialty supplements,herbs and botanicals, meal replacements, dietary supplements, and derivative compounds;
• Natural and Organic Foods—products such as cereals, milk, non-dairy beverages, andfrozen entrees;
• Functional Foods—products with added ingredients or fortification that are designedspecifically for health or performance purposes; and
• Natural Personal Care—products combining nutrition with skin care.

8/3/2019 USANA 2010 Annual Report
http://slidepdf.com/reader/full/usana-2010-annual-report 15/104
13
In its November/December 2009 issue, the Nutrition Business Journal (“NBJ”) reported thatglobal nutrition industry sales increased 8% to $270 billion in 2008 compared with 2007. As notedin this issue, the 8% increase was down only slightly from the 8.6% compound annual growth rateachieved by the industry between 2001 and 2008. According to NBJ, in 2008 functional foods andbeverages represented 36% of global industry sales, nutritional supplements represented 28%,natural and organic foods represented 26%, and natural and organic personal care and household
products represented 10%. Notably, NBJ does not publish a Global Nutrition Industry Overview on an annual basis and, therefore, the most recent global sales information provided above does notreflect the impact of the global economic challenges that have been present since late 2008.
In its June/July 2010 issue, NBJ reported that U.S. consumer sales of nutrition products, whichinclude the product categories listed above, increased an estimated 4.4% to $108.3 billion in 2009. They noted that while any level of growth during the worst economic downturn since the GreatDepression should be viewed as a positive, 2009 was the lowest year-over-year growth rate that they have seen since they began tracking nutrition product sales in 1996. According to NBJ, in 2009,functional foods and beverages represented 34% of industry sales in the U.S., natural and organicfoods represented 31%, nutritional supplements represented 25%, and natural and organic personalcare and household products represented 10%. NBJ also noted in this issue that the U.S. nutrition
industry is predicted to post a compound annual growth rate of 7% over the next four years(beginning with 2010).
We believe that the following factors drive growth in the nutrition industry:
• The general public’s heightened awareness and understanding of the connection betweendiet and health;
• The aging population, particularly the baby-boomer generation in the U.S., who tend to usemore nutritional supplementation as they age;
• Rising health care costs and the worldwide trend toward preventative health care; and
• Product introductions in response to new scientific findings.
NBJ has also noted in a few of its issues published during 2009 and 2010 that, despite theeconomic downturn over the last few years, the nutrition industry has fared well because of growing consumer interest in self care. In its June/July 2009 issue, it noted that dietary supplements in theU.S. have been particularly resilient because, as more people lose their jobs and ability to pay forhealthcare, many are turning to supplements to remain healthy. The global recession has, however,presented more of a growth challenge for premium products. Another challenge for the nutritionindustry that NBJ highlighted in its June/July 2010 issue is the increased regulatory and otherscrutiny against companies within the industry for various reasons, including the fraudulentmarketing of steroids as supplements, and the adulteration of supplements with prescription drugsor banned substances.
Nutritional products are distributed through six major sales channels:
• Mass market retailers, including mass merchandisers, drug stores, supermarkets, anddiscount stores;
• Natural health food retailers;
• Network marketing;

8/3/2019 USANA 2010 Annual Report
http://slidepdf.com/reader/full/usana-2010-annual-report 16/104
14
• Mail order;
• Healthcare professionals and practitioners; and
• The Internet.
We distribute our products through a network marketing system, which is a common form of
direct selling. According to the World Federation of Direct Selling Associations (“WFDSA”), thedirect selling industry currently generates approximately $117 billion annually in worldwide retailsales, through approximately 74 million independent distributors.
Although U.S. retail sales in the direct selling industry have declined slightly over the last few years, according to statistics compiled by the Direct Selling Association (the U.S. member of WFDSA) the United States remains the largest market for direct selling, with $28.3 billion in annualretail sales and 16 million independent distributors in 2009. According to the Direct Selling Association, wellness products, which include nutritional supplements and functional foods,accounted for 22.8% of the U.S. direct retail sales in 2009 and personal care products accounted for21.3% of such sales.
Operating Strengths
Our principal objective is to be a leading developer, manufacturer and distributor of science-based nutritional and personal care products and to create a rewarding opportunity throughnetwork marketing for our Associates who distribute our products. Our strategy is to capitalize onour operating strengths, which include: a strong research and development program; in-housemanufacturing capability; science-based products; an attractive Associate compensation plan; ascalable business model; and an experienced management team.
Emphasis on Research and Development. We have a technical team of experienced scientists,including several holding Ph.D. degrees, quality engineers, and regulatory specialists who contributeto our research and development activities. In our research and development laboratories, ourscientists and researchers:
• Investigate activities of natural extracts and formulated products in both laboratory and inclinical settings;
• Identify and research combinations of nutrients that may be candidates for new products;
• Develop new nutritional ingredients for use in supplements;
• Study the metabolic activities of existing and newly identified nutritional ingredients;
• Enhance existing products, as new discoveries in nutrition and skin care are made; and
• Formulate products to meet diverse regulatory requirements across all of our markets.
Our scientists and researchers also conduct double-blind, placebo-controlled, clinical studies
which are intended to further evaluate the efficacy of our products. In addition, we work withoutside research organizations to further support various aspects of our research and developmentefforts. One of these organizations is the Linus Pauling Institute at Oregon State University. Our work with the Linus Pauling Institute will advance the science of human nutrition and health,provide us with valuable information to formulate and upgrade our nutritional products, and betteradvise our customers on how to use USANA products. We have also funded clinical researchprograms at Boston University, the University of Colorado, the University of Utah, and Sydney

8/3/2019 USANA 2010 Annual Report
http://slidepdf.com/reader/full/usana-2010-annual-report 17/104
15
University in Australia. Additionally, our Scientific Advisory Council, comprised of health careprofessionals worldwide, provides us with valuable insights into product applications and efficacy.It is through our internal research and development efforts and our relationships with outsideresearch organizations and health care providers that we can provide what we believe to be some of the highest quality health products in the industry.
In-house Manufacturing. We manufacture products that account for approximately 73% of ourproduct sales. We believe that our ability to manufacture our own products in-house is a significantcompetitive advantage for the following reasons:
• We can better control the quality of raw materials and finished products;
• We can more reliably monitor the manufacturing process to better guarantee potency andbioavailability and to reduce the risk of product contamination;
• We can better control production schedules to increase the likelihood of maintaining anuninterrupted supply of products for our customers;
• We are able to produce most of our own prototypes in the research phase of productdevelopment; and
• We are better able to manage the underlying costs associated with manufacturing ourproducts.
Science-based Products. As a result of our emphasis on research and development and our in-house manufacturing capabilities, we have developed a focused and relatively limited line of high-quality health products that we believe provides health benefits to our customers. Our productshave been developed based on a combination of published research, in-house laboratory and third-party clinical studies, and sponsored research. Additionally, we design, manufacture, package, andlabel our products in a manner that we believe is consistent with the more stringent pharmaceuticalstandards, rather than the standards set for dietary supplements.
Attractive Associate Compensation Plan and Support. We are committed to increasing our product
sales by providing a highly competitive compensation plan to attract and retain Associates whoconstitute our sales force. We believe that our Compensation Plan is one of the most financially rewarding in the network marketing industry. We further incent our Associates by paying incentives on a weekly basis. Additionally, our Compensation Plan is, where legally permissible, aglobal-seamless plan, meaning that Associates can be compensated each week for their businesssuccess in any market in which they have a down-line organization where we conduct business. Asdiscussed elsewhere in this report, in accordance with the direct selling laws in China, BabyCare Associates do not participate in USANA’s Compensation Plan. Instead, they are compensatedunder BabyCare’s compensation plan, which has been created specifically to comply with theregulations in China. We believe that BabyCare’s compensation plan is among the most rewarding distributor compensation plans in China.
To support our Associates, we sponsor meetings and events throughout the year, which offerinformation about our products and our network marketing system. These meetings are designedto assist Associates in business development and to provide a forum for interaction with some of our Associate leaders and with members of the USANA management team. We also provide low-cost sales tools and resources, which we believe are an integral part of building and maintaining asuccessful home-based business for our Associates. For example, during the third quarter of 2010, we introduced a new interactive presentation tool, called Health and Freedom Solution, which was

8/3/2019 USANA 2010 Annual Report
http://slidepdf.com/reader/full/usana-2010-annual-report 18/104
16
created and designed to help our Associates easily explain and share the USANA opportunity,including the benefits of our products and our Compensation Plan.
In addition to Company-sponsored meetings and sales tools and resources, we maintain a website exclusively for our Associates, where they can keep up on the latest USANA news, obtaintraining materials, manage their personal information, enroll new customers, shop for products, and
register for Company-sponsored events. Additionally, through this website, Associates can accessother online services to which they may subscribe. For example, we offer an online businessmanagement service, which includes a tool that helps Associates track and manage their businessactivity, a personal webpage to which prospects or retail customers can be directed, e-cards foradvertising, and a tax tracking tool.
We also believe that recognition is an important factor in supporting and retaining our Associates. We understand that being a successful USANA Associate requires hard work anddedication. We frequently hold a variety of contests and promotions, rewarding our Associates fortheir achievements to help motivate them and recognize their efforts. We also celebrate key achievements and rank advancements of our Associates. We believe that our recognition programsand contests greatly contribute to our ability to retain our Associates.
Business Model. We believe that our business model provides, among others, the following advantages:
• Our business model does not require a company-employed sales force to sell our products,and we experience a minimal incremental cost to add a new Associate;
• Commissions paid to our Associates are tied to sales performance;
• Because payment is required at the time an Associate or Preferred Customer purchasesproduct, accounts receivable are avoided on the sale of products;
• We have a monthly product subscription program known as “Autoship,” which we utilizein all of our markets and provides a stream of recurring revenue (for the year ended
January 1, 2011, this program represented 40% of our sales); and• We can readily expand into new international markets with only moderate investment
because, for markets other than China, we generally maintain only one administrative andcustomer support office and one or two warehouses in each of these markets.
Experienced Management Team. Our management team includes individuals with expertise in various scientific and managerial disciplines, including nutrition, product research and development,international development, marketing, customer network development, information technology,finance, and operations. This team is responsible for supporting growth, research anddevelopment, international expansion, strengthening our financial condition, and improving ourinternal controls.
Growth Strategy
We seek to grow our business by pursuing the following strategies:
Attract and Retain Associates. Our Associates are the key to the growth of our business. Accordingly, we must continue to attract and retain Associates. For this reason, our managementteam maintains a close working relationship with our Associate leaders. In addition to our AnnualInternational Convention and our Asia Pacific Convention, we hold several regional events in key

8/3/2019 USANA 2010 Annual Report
http://slidepdf.com/reader/full/usana-2010-annual-report 19/104
17
growth areas to provide support and training to new Associates. Additionally, we continue toincrease our investment in these events and in the marketing of our Compensation Plan to aid Associates in improving the productivity of their businesses. Over the last couple of years we have worked closely with certain of our Associate leaders to develop new and unique training tools toassist in the personal development and growth of our new Associates. These training tools aredesigned to serve as a guide for someone new to USANA and network marketing who has the
entrepreneurial spirit to own and operate a home-based business. In addition to these new salestools, we have also increased our emphasis on building global awareness of the USANA brand. This includes our enhanced partnership with the Women’s Tennis Association (“WTA”). Not only are we the official health supplement supplier to the WTA, but we now have six top players whoare dedicated to promoting our products and brand. We seek to leverage this relationship to buildbrand credibility and increase product consumption and loyalty. While these branding efforts havea global reach, the primary objective of this initiative is to grow sales and the number of Associatesin North America.
Successfully Develop China. In light of the rapid growth in our Asia Pacific region and oursuccessful Asian Associate base, we believe that China represents the most significant and imminentgrowth opportunity for us. To capitalize on this opportunity, in August 2010, we indirectly
acquired BabyCare, a direct selling company organized under the laws of China. We believe ouracquisition of BabyCare accelerates our growth potential in China for several reasons, including: (i)the license granted to BabyCare from the Chinese government, which allows BabyCare to engage indirect selling in the municipality of Beijing; and (ii) BabyCare’s existing management team, whichhas agreed to continue to operate BabyCare and has extensive experience in the Chinese directselling market as well as in Chinese government relations. BabyCare is working to obtain similardirect selling licenses in other provinces within China. We are also working with the Chinesegovernment to have several USANA products approved for sale by BabyCare in China. We hopeto have many of these products approved in 2011.
Introduce New and Re-formulate Existing Products. Our research and development team is
continually reviewing the latest scientific findings related to nutrition, conducting in-house researchand clinical trials, looking at new technologies, and attending scientific conferences. If, in theprocess, we see potential for a new product or ingredient that provides a measurable and importanthealth benefit, and if we believe this benefit can be realized by our customers, we will generally pursue development of that product. During the third and fourth quarters of 2010, we launchedsome new products, two of which feature our new Nutritional Hybrid Technology, which allows usto combine two distinct formulas into one bi-layered tablet for advanced ingredient combinationsand improved product stability. The first of these products is Proflavanol® C100, which is acombination of two of our most popular Optimizers, Proflavanol® and Poly C®. The second of these products is Hepasil DTX ™, a comprehensive liver support formula. The other products that we introduced include a Digestive Enzyme tablet; Fibergy ® Plus, a flavorless fiber blend additive;and Booster C 600™, a lemon-berry flavored immune support supplement.
Enter New Markets. We believe that significant growth opportunities continue to exist inmarkets where we currently conduct business and in new international markets. New markets areselected following an assessment of several factors, including market size, anticipated demand forUSANA products, receptiveness to network marketing, and the market entry process, whichincludes consideration of possible regulatory restrictions on our products or our network marketing system. We have begun to register certain products with regulatory and government agencies in

8/3/2019 USANA 2010 Annual Report
http://slidepdf.com/reader/full/usana-2010-annual-report 20/104
18
preparation for further international expansion. Wherever possible, we expect to seamlessly integrate the Compensation Plan in each market to allow Associates to receive commissions forglobal—not merely local—product sales. This seamless down-line structure is designed to allow an Associate to build a global network by creating a down-line across national borders. We believe ourseamless Compensation Plan significantly enhances our ability to expand internationally, and weintend, where permitted, to integrate the future markets that we open into this plan. While we
deem new market expansion as a key growth strategy, given the significant opportunity thatcurrently exists in China, we plan to focus the majority of our time and resources on growing salesin that market.
Pursue Strategic Acquisitions. We believe that attractive acquisition opportunities may arise in thefuture. We intend to pursue strategic acquisition opportunities that would grow our customer base,expand our product lines, enhance our manufacturing and technical expertise, allow verticalintegration, or otherwise complement our business or further our strategic goals.
Competition
We compete with manufacturers, distributors, and retailers of nutritional products forconsumers, and with network marketing companies for distributors. On both fronts, some of ourcompetitors are significantly larger than we are, have longer operating history, higher visibility andname recognition, and greater financial resources than we do. We compete with these entities by emphasizing the underlying science, value, and superior quality of our products, the simplicity inour product offerings, and the convenience and financial benefits afforded by our network marketing system and global seamless Compensation Plan.
Our business is driven primarily by our distributors, whom we refer to as Associates. Ourability to compete with other network marketing companies depends, in significant part, on oursuccess in attracting and retaining Associates. There can be no assurance that our programs forattracting and retaining Associates will be successful. The pool of individuals interested in network marketing is limited in each market and is reduced to the extent other network marketing
companies successfully attract these individuals into their businesses. Although we believe that weoffer an attractive opportunity for our Associates, there can be no assurance that other network marketing companies will not be able to recruit our existing Associates or deplete the pool of potential Associates in a given market.
We believe that the leading network marketing company in the world, based on total sales, is Amway Corporation and its affiliates, and that Avon Products, Inc. is the leading direct seller of beauty and related products worldwide. Leading competitors in the nutritional network marketing and nutritional product industry include Herbalife Ltd., Inc.; Nu Skin Enterprises, Inc; NBTY, Inc.;and Schiff Nutrition International, Inc. Based on information that is publicly available, 2009 netsales of the aforementioned companies range from $205 million to $10.3 billion. We believe thereare other manufacturers of competing product lines that may launch direct selling enterprises that
will compete with us in certain product lines and in the recruiting of Associates. There can be noassurance that we will be able to successfully meet the challenges posed by increased competition.
Product Returns
Product returns have not been a material factor in our business, totaling approximately 1.6% inboth 2008 and 2009, and 1.1% in 2010. Because our emphasis on customer satisfaction is ahallmark of our business model, our standard policy allows Associates to return any unused product

8/3/2019 USANA 2010 Annual Report
http://slidepdf.com/reader/full/usana-2010-annual-report 21/104
19
from their first purchase within the first 30 days following their purchase for a 100% refund of thesales price. Thereafter, any returned product that is unused and resalable is refunded up to one yearfrom the date of purchase at 100% of the sales price, less a 10% restocking fee. According to theterms of the Associate agreement, return of product where the purchase amount exceeds $100 and was not damaged at the time of receipt by the Associate may result in cancellation of the Associate’sdistributorship. Depending upon the conditions under which product was returned Associates and
Preferred Customers may either receive a refund based on their original form of payment, or crediton account for a product exchange. This standard policy differs slightly in a few of ourinternational markets due to the regulatory environment in those markets.
Major Customers
Sales are made to independent Associates and Preferred Customers. No single customer hasever accounted for 10% or more of net sales in any fiscal year. Notwithstanding the foregoing, thenature of our business model results in a significant amount of sales to several different Associateleaders and their downline sales organizations. Although no single Associate has ever accountedfor 10% or more of our net sales, the loss of a key Associate leader or that Associate’s downlinesales organization would adversely affect our net sales and our overall operating results.
Compliance by Associates
We continually monitor and review our Associates’ compliance with our policies andprocedures as well the laws and regulations applicable to our business. Part of this review entails anassessment of our Associates’ sales activities to ensure that Associates are actually selling productsto consumers. Our policies and procedures require Associates to present our products and theUSANA opportunity ethically and honestly. Associates are not permitted to make claims about ourproducts or Compensation Plan that are not consistent with our policies and procedures andapplicable laws and regulations. The majority of our Associates must use marketing andpromotional materials provided by USANA. Associates who have achieved a certain leadershipthreshold are permitted, however, to produce marketing and promotional materials, but only if such
materials are approved by USANA prior to use.From time to time, some Associates fail to adhere to our policies and procedures. We
systematically review reports of alleged Associate misbehavior. Infractions of the policies andprocedures are reported to our compliance group, who determine what disciplinary action is warranted in each case. More serious infractions are reported to our Compliance Committee, which includes USANA executives. If we determine that an Associate has violated any of ourpolicies and procedures, we may take a number of disciplinary actions, such as warnings, fines orprobation. We may also withdraw or deny awards, suspend privileges, withhold commissions untilspecific conditions are satisfied, or take other appropriate actions in our discretion. More seriousinfractions may result in termination of the Associate’s purchase and distribution rights.
We believe that Associate compliance is critical to the integrity of our business, and, therefore, we are aggressive in ensuring that our Associates comply with our policies and procedures. Asexplained above, when an Associate fails to comply with our policies and procedures, we may terminate their purchase and distribution rights. From time to time, we become involved inlitigation with an Associate whose purchase and distribution rights have been terminated. Weconsider such litigation to be routine and incidental to our business and will continue to beaggressive in ensuring that our Associates comply with our policies and procedures.

8/3/2019 USANA 2010 Annual Report
http://slidepdf.com/reader/full/usana-2010-annual-report 22/104
20
Information Technology
We believe that the ability to efficiently manage distribution, compensation, manufacturing,inventory, and communication functions through the use of sophisticated and dependableinformation processing systems is critical to our success. Our information technology resources aremaintained primarily by our in-house staff to optimally support our customer base and core
business processes. Our IT staff manages an array of systems and processes which support ourglobal operations 24 hours a day and 365 days a year. Three of our critical applications include thefollowing:
• A web-based application that provides online services to Associates, such as training sessions and presentations, online shopping, enrollment, Company and productinformation, and other tools to help Associates effectively manage their business anddown-line organizations.
• A web-enabled order-entry system that handles order entry, customer information,compensation, the hierarchy of Associates, returns, invoices, and other transactional-basedprocesses.
• A fully integrated world-wide Enterprise Resource Planning (“ERP”) system that handlesaccounting, human resources, inventory management, production processes, quality assurance, and reporting requirements in a multinational environment. This Oracle-basedERP system supports global data integrity and multinational corporate governance andcompliance.
Our web applications are supported by a clustered environment and a redundant systemoutside of our home office, which serves as a disaster recovery site.
Regulatory Matters
Product Regulation. Numerous governmental agencies in the United States and other countriesregulate the manufacturing, packaging, labeling, advertising, promoting, distributing, and the selling of nutrition, health, beauty, and weight-management products. In the United States, advertisementof our products is regulated by the Federal Trade Commission (“FTC”) under the FTC Act and, where such advertising is considered to be product labeling by the FDA, under the Food, Drug, andCosmetic Act (“FDCA”) and the regulations thereunder. USANA products in the U.S. are alsosubject to regulation by, among others, the Consumer Product Safety Commission, the U.S.Department of Agriculture, and the Environmental Protection Agency. The manufacturing,labeling, and advertising of our products are also regulated by various governmental agencies ineach country in which they are distributed. For example, in Australia, product registration, labeling and manufacturing is regulated by the Therapeutic Goods Administration and, in Japan, theMinistry of Health, Labor and Welfare. In our newest market, China, the State Food and Drug Administration (“SFDA”) regulates product registration, labeling and manufacturing.
Our largest selling product group includes products that are regulated as dietary supplementsunder the FDCA. Dietary supplements are also regulated in the United States under the Dietary Supplement Health and Education Act of 1994 (“DSHEA”), which we believe is generally favorable to the dietary supplement industry. Some of our powdered drink, food bar, and othernutrition products are regulated as foods under the Nutrition Labeling and Education Act of 1990(“NLEA”). The NLEA establishes requirements for ingredient and nutritional labeling including product labeling claims.

8/3/2019 USANA 2010 Annual Report
http://slidepdf.com/reader/full/usana-2010-annual-report 23/104
21
Under these regulations, a dietary supplement that contains a new dietary ingredient (defined asan ingredient not on the market before October 15, 1994) must have a history of use or otherevidence of safety establishing that it is reasonably expected to be safe. The manufacturer mustnotify the FDA at least 75 days before marketing products containing new dietary ingredients andmust provide the FDA with the information upon which the manufacturer has based its conclusionthat the product has a reasonable expectation of safety.
Historically, the manufacture of nutritional or dietary supplements and related products in theUnited States has required compliance with food-model GMPs promulgated by the FDA. In June2007, however, the FDA published GMPs for dietary supplements, which became effective June 1,2008. The dietary supplement GMPs are based on the food-model GMPs, with additionalrequirements that are specific to dietary supplements. We believe our manufacturing processescomply with these GMPs for dietary supplements.
In general, our personal care products, which are regulated as cosmetic products by the FDA,are not subject to pre-market approval by that agency. Cosmetics, however, are subject toregulation by the FDA under the FDCA adulteration and misbranding provisions. Cosmetics alsoare subject to specific labeling regulations, including warning statements, if the safety of a cosmetic
is not adequately substantiated or if the product may be hazardous, as well as ingredient statementsand other packaging requirements under the Fair Packaging and Labeling Act. Cosmetics that meetthe definition of a drug (i.e., that are intended to treat or prevent disease or affect the structure orfunction of the body), such as sunscreens, are regulated as drugs. Over-the-counter (“OTC”) drug products, including cosmetics, may be marketed if they conform to the requirements of the OTCmonograph that is applicable to that drug. Drug products not conforming to monographrequirements require an approved New Drug Application (“NDA”) before marketing may begin.Under these provisions, if the agency were to find that a product or ingredient of one of our OTCdrug products is not generally recognized as safe and effective or is not included in a finalmonograph that is applicable to one of our OTC drug products, we would be required toreformulate or cease marketing that product until it is the subject of an approved NDA or until the
time, if ever, that the monograph is amended to include such product. Advertising of our products in the U.S. is subject to regulation by the FTC under the FTC Act.
Section 5 of the FTC Act prohibits unfair methods of competition and unfair or deceptive acts orpractices in or affecting commerce. Section 12 of the FTC Act provides that disseminating any false advertisement pertaining to drugs or foods, which includes dietary supplements, is an unfair ordeceptive act or practice. Under the FTC's Substantiation Doctrine, an advertiser is required tohave a “reasonable basis” for all objective product claims before the claims are made. Failure toadequately substantiate claims may be considered either deceptive or unfair practices. Pursuant tothis FTC requirement, we are required to have adequate substantiation for all material advertising claims that we make for our products in the U.S.
In recent years, the FTC has initiated numerous investigations of and actions againstcompanies that sell dietary supplement, weight-management, and cosmetic products. The FTC hasissued guidance to assist companies in understanding and complying with its substantiationrequirement. We believe that we have adequate substantiation for all material advertising claimsthat we make for our products in the U.S., and we believe that we have organized thedocumentation to support our advertising and promotional practices in compliance with theseguidelines. However, no assurance can be given that the FTC would reach the same conclusion if it were to review or question our substantiation for our advertising claims in the U.S.
8/3/2019 USANA 2010 Annual Report
http://slidepdf.com/reader/full/usana-2010-annual-report 24/104
22
The FTC may enforce compliance with the law in a variety of ways, both administratively andjudicially, using compulsory process, cease and desist orders, and injunctions. FTC enforcementcan result in orders requiring, among other things, limits on advertising, corrective advertising,consumer redress, divestiture of assets, rescission of contracts, and such other relief as the agency deems necessary to protect the public. Violation of these orders could result in substantial financialor other penalties. Although, to our knowledge, we have not been the subject of any action by the
FTC, no assurance can be given that the FTC will not question our advertising or other operationsin the U.S. in the future. Any action in the future by the FTC could materially and adversely affectour ability to successfully market our products in the U.S.
In December 2007, the Dietary Supplement & Nonprescription Drug Consumer Protection Act went into effect and requires manufacturers of dietary supplement and over-the-counterproducts to notify the FDA when they receive reports of serious adverse events occurring withinthe United States. We have an internal adverse event reporting system that has been in place forseveral years and believe that we are in compliance with this law.
In markets outside the United States, prior to commencing operations or marketing products, we may be required to obtain approvals, licenses, or certifications from a country’s Food
Administration, Ministry of Health or comparable agency. Approvals or licensing may beconditioned on reformulation of USANA products for the market or may be unavailable withrespect to certain products or product ingredients. We must also comply with local productlabeling and packaging regulations that vary from country to country. For example, China, ournewest market, extensively regulates the registration, labeling and marketing of our products. InChina, our nutritional products are typically classified as “health foods” and our personal careproducts are typically classified as “non-special purpose cosmetics”. The registration process forhealth foods is complex and generally requires extensive analysis and approval by the SFDA. As aresult, it may take several years to register a product as a health food in China. BabyCare hassuccessfully completed the registration process for its health food products. We have completedthe registration process for several of our health food products and anticipate having these
products available for sale through BabyCare in 2011. We continue to work through theregistration process for other health food products and certain cosmetic products, which we alsohope to begin selling through BabyCare in 2011.
We cannot predict the nature of any future laws, regulations, interpretations, or applications,nor can we determine what effect additional governmental regulations or administrative orders, when and if promulgated, would have on our business. Future changes could include requirementsfor the reformulation of certain products to meet new standards, the recall or discontinuation of certain products that cannot be reformulated, additional record keeping, expanded documentationof the properties of certain products, expanded or different labeling, and additional scientificsubstantiation. Any or all of these requirements could have a material adverse effect on ourbusiness, financial condition, and operating results.
Network Marketing Regulation. Laws and regulations in each country in which we operateprevent the use of deceptive or fraudulent practices that have sometimes been inappropriately associated with legitimate direct selling and network marketing activities. Generally these laws aredirected at ensuring that product sales ultimately are made to consumers and that advancement within sales organizations is based on sales of the enterprise’s products, rather than on investmentsin the organizations or on other criteria or activity that are not related to retail sales. Whererequired by law, we obtain regulatory approval of our network marketing system, or, where

8/3/2019 USANA 2010 Annual Report
http://slidepdf.com/reader/full/usana-2010-annual-report 25/104
23
approval is not required or available, the favorable opinion of local counsel as to regulatory compliance.
In addition to federal regulation in the United States by the FTC, each state has enacted itsown “Little FTC Act” to regulate sales and advertising. Occasionally, we receive requests to supply information regarding our network marketing plan to regulatory agencies. Although we have, from
time to time, modified our network marketing system to comply with interpretations of variousregulatory authorities, we believe that our network marketing program is in compliance with thelaws and regulations relating to network marketing activities in our current markets. Nevertheless, we remain subject to the risk that, in one or more of our present or future markets, the marketing system or the conduct of certain Associates could be found not to be in compliance with applicablelaws and regulations. Failure by an Associate or by us to comply with these laws and regulationscould have a material adverse effect on our business in a particular market or in general.
In April 2006, the FTC released a proposed New Business Opportunity Rule. As initially drafted, the proposed rule would have required pre-sale disclosures for all business opportunities, which may have included network marketing compensation plans such as ours. However, in March2008 the FTC issued a revised notice of proposed rulemaking, which indicates that the New
Business Opportunity Rule as drafted will not apply to multi-level marketing companies. Thecomment and rebuttal periods regarding the proposed rule have closed, but the FTC has not yetissued a final rule. The New Business Opportunity Rule is currently only a proposed rule and may change before it is implemented, if it is implemented at all. If this proposed rule were adopted as itis currently proposed, it would not require us to change any of our current marketing practices.
The direct selling laws and regulations in China require us to operate under a business model, which is different from our global business model. To expand into China and comply with theseregulations, we indirectly acquired BabyCare in August 2010 and will utilize BabyCare’s existing business model, which has been designed specifically for China. China’s direct selling regulationscontain both financial and operational restrictions for direct selling companies. For example,BabyCare, and other direct selling companies, are not permitted to pay multi-level compensation to
sales representatives and are also limited in the amount of single-level compensation that they may pay to sales representatives. Additionally, BabyCare is required to obtain various licenses andapprovals to conduct its direct selling business in China. BabyCare has been granted a license toengage in direct selling activities in the municipality of Beijing and is working to obtain similarlicenses in other cities and provinces. This license allows BabyCare to operate under its directselling business model in Beijing by utilizing non-employee sales representatives to sell productsaway from fixed retail locations. In cities and provinces where BabyCare has not been issued adirect selling license, it must operate under a retail sales model. Under this retail model, BabyCareutilizes non-employee sales representatives to sell its products through retail stores in the applicablecity or province. BabyCare has also engaged independent service providers that meet both therequirements to operate their own business under Chinese law as well as the conditions set forth by
BabyCare to sell products and provide services to BabyCare customers. If, and when, BabyCarereceives a direct selling license in other cities and provinces, it will continue to transition away fromthis retail model and integrate its direct selling business model in these cities and provinces.
We cannot predict the nature of any future law, regulation, interpretation, or application, norcan we predict what effect additional governmental legislation or regulations, judicial decisions, oradministrative orders, when and if promulgated, would have on our business. It is possible thatfuture legal requirements may require that we revise our network marketing program. Such new
8/3/2019 USANA 2010 Annual Report
http://slidepdf.com/reader/full/usana-2010-annual-report 26/104
24
requirements could have a material adverse effect on our business, financial condition, andoperating results.
Transfer Pricing Regulation. In the U.S. and many other countries, we are subject to transferpricing and other tax regulations that are designed to ensure that appropriate levels of income arereported by our U.S. or international entities and are taxed accordingly. We have adopted transfer
prices, which are supported by a formal transfer pricing study for the sale of products to oursubsidiaries in accordance with applicable transfer pricing laws. In addition, agreements betweenour subsidiaries and us have been entered into for services and contractual obligations, such as thepayment of Associate incentives that are also supported by the same formal transfer pricing study.If the U.S. Internal Revenue Service or the taxing authorities of any other jurisdiction were tosuccessfully challenge these agreements or require changes in our standard transfer pricing practicesfor products, we could become subject to higher taxes and our earnings may be adversely affected. The tax treaties between the U.S. and most countries provide for competent authority relief toavoid any double taxation. We believe that we operate in compliance with all applicable transferpricing regulations. There can be no assurance, however, that we will continue to be found to beoperating in compliance with transfer pricing regulations or that those laws will not be modified, which may require that we change our operating procedures.
Intellectual Property
Trademarks. We have developed and we use registered trademarks in our business, particularly relating to our corporate and product names. We own 14 trademarks that are registered with theUnited States Patent and Trademark Office. Federal registration of a trademark enables theregistered owner of the mark to bar the unauthorized use of the registered mark in connection witha similar product in the same channels of trade by any third-party anywhere in the United States,regardless of whether the registered owner has ever used the trademark in the area where theunauthorized use occurs. We have filed applications and own trademark registrations, and weintend to register additional trademarks in countries where USANA products are or may be sold inthe future. Protection of registered trademarks in some jurisdictions may not be as extensive as the
protection in the United States.
We also claim ownership and protection of certain product names, unregistered trademarks,and service marks under common law. Common law trademark rights do not provide the samelevel of protection that is afforded by the registration of a trademark. In addition, common law trademark rights are limited to the geographic area in which the trademark is actually used. Webelieve these trademarks, whether registered or claimed under common law, constitute valuableassets, adding to recognition of USANA and the effective marketing of USANA products. Trademark registration once obtained is essentially perpetual, subject to the payment of a renewalfee. We therefore believe that these proprietary rights have been and will continue to be importantin enabling us to compete.
Trade Secrets. We own certain intellectual property, including trade secrets that we seek toprotect, in part, through confidentiality agreements with employees and other parties. Even wherethese agreements exist, there can be no assurance that these agreements will not be breached, that we would have adequate remedies for any breach, or that our trade secrets will not otherwisebecome known to or independently developed by competitors. Our proprietary productformulations are generally considered trade secrets, but are not otherwise protected underintellectual property laws.

8/3/2019 USANA 2010 Annual Report
http://slidepdf.com/reader/full/usana-2010-annual-report 27/104
25
Patents. We have three U.S. patents. Two of our patents relate to the method of extracting anantioxidant from olives and the byproducts of olive oil production. These patents were issued in2002 and will continue in force until December 20, 2019. In 2003, we entered into a licensing agreement with a supplier to make olive extract using our patented process. Our third patentrelates to a method of self preserving our Sensé™ line of personal care products. This patent wasissued in May 2007 and will continue in force until August 5, 2024.
We intend to protect our legal rights concerning intellectual property by all appropriate legalaction. Consequently, we may become involved from time to time in litigation to determine theenforceability, scope, and validity of any of the foregoing proprietary rights. Any patent litigationcould result in substantial cost and divert the efforts of management and technical personnel.
Seasonality
We typically see a decrease in the activity of many of our North American Associates during the third quarter due to the summer vacation season. Additionally, many Associates reduce theirspending prior to our International Convention, which is held toward the end of the third quarterevery year, in anticipation of new product launches or product upgrades.
Similarly, we typically see a decrease in the activity of many of our Asia Pacific Associatesduring the first quarter due to cultural events such as Chinese New Year.
Backlog
Our products are typically shipped within 72 hours after receipt of an order. As of March 7,2011 we had no significant backlog of orders.
Working Capital Practices
We maintain sufficient amounts of inventory in stock in order to provide a high level of serviceto our Associates and Preferred Customers. Substantial inventories are required to meet the needsof our dual role as manufacturer and distributor. We also watch seasonal commodity markets and
may buy ahead of normal demand to hedge against cost increases and supply risks.
Environment
We are not aware of any instance in which we have contravened federal, state, or local lawsrelating to protection of the environment or in which we otherwise may be subject to liability forenvironmental conditions that could materially affect operations.
Employees
As of March 7, 2011 we had approximately 1,240 employees worldwide, as measured by full-time equivalency. Our employees are not currently represented by a collective bargaining agreement, and we have not experienced work stoppages as a result of labor disputes. We believe
that we have a good relationship with our employees.
Additional Available Information
We maintain executive offices and principal facilities at 3838 West Parkway Boulevard, SaltLake City, Utah 84120. Our telephone number is (801) 954-7100. We maintain a World Wide Website at www.usanahealthsciences.com. The information on our web site should not be consideredpart of this report on Form 10-K.

8/3/2019 USANA 2010 Annual Report
http://slidepdf.com/reader/full/usana-2010-annual-report 28/104
26
We make available, free of charge at our corporate web site, copies of our annual reports onSEC Form 10-K, quarterly reports on SEC Form 10-Q, current reports on SEC Form 8-K, proxy statements, and all amendments to these reports, as soon as reasonably practicable after suchmaterial is electronically filed with or furnished to the SEC pursuant to Section 13(a) or 15(d) of theExchange Act. This information may also be obtained from the SEC’s on-line database, which islocated at www.sec.gov.
Item 1A. Risk Factors
Forward-Looking Statements and Certain Risks
Statements contained in this report that are not purely historical are “forward-looking statements” within the meaning of Section 21E of the Exchange Act. These statements relate to our expectations, hopes, beliefs,commitments, intentions, and strategies regarding the future. They may be identified by the use of words or phrases,such as “believe,” “expect,” “anticipate,” “should,” “plan,” “estimate,” and “potential,” among others. Forward- looking statements include, but are not limited to, statements contained in “Business” and “Management’s Discussion and Analysis of Financial Condition and Results of Operations” regarding our financial performance, revenue and expense levels in the future, and the sufficiency of our existing assets to fund future operations and capital spending needs. Actual results could differ materially from the anticipated results or other expectations expressed in these forward-looking statements for the reasons discussed below. The forward-looking statements in this report are made as of the date of this report, and we assume no obligation to update them or to update the reasons why our actual results could differ from those that we have projected in these forward-looking statements.
We encounter substantial risks in our business, any one of which may adversely affect our business, results of operations or financial condition. The fact that some of these risk factors may be the same or similar to those that we have filed with the Securities and Exchange Commission in past reports, means only that the risks are present in multiple periods. We believe that many of the risks that are described here are part of doing business in the industry in which we operate and will likely be present in all periods. The fact that certain risks are endemic to the industry does not lessen their significance. These risk factors should be read together with the other items in this report,including Item 1, “Business,” and Item 7, “Management’s Discussion and Analysis of Financial Condition and
Results of Operations.” Among others, risks and uncertainties that may affect our business, financial condition, performance, development, and results of operations include the following:
Our Hong Kong market accounts for a significant part of our business. Any decline insales or customers in this market, without a corresponding increase in sales and customersin our China market through BabyCare, would harm our business, financial condition andresults of operations. Over the past few years, the majority of our sales and Associate growth hasoccurred in our Hong Kong market, which represented 23.5% of our 2010 net sales. In 2010, weannounced our acquisition of BabyCare in China, and in 2011, we announced that we would shiftour international attention to assisting BabyCare with customer growth in China. As a result of our2011 strategy, we will likely experience a decline in sales and/or customers in our Hong Kong market. Factors that could contribute to a decline in Hong Kong include, among other things: (i)
that we have many Associate leaders in Hong Kong who qualify to do business in both Hong Kong and China and who may shift their attention to growing their businesses in China throughBabyCare; and (ii) that many of our Associates, who act simply as consumers of our products andhave historically purchased our products in Hong Kong, may begin to purchase our products inChina through BabyCare, if and when our products are available for sale by BabyCare in China. Any decline in the performance of our Hong Kong market without a corresponding increase in theperformance of BabyCare in China would harm our business, financial condition and results of

8/3/2019 USANA 2010 Annual Report
http://slidepdf.com/reader/full/usana-2010-annual-report 29/104
27
operations. We must comply with significant legal and regulatory requirements to engage in directselling in China. Chinese laws and regulations require, among other things, that we use a businessmodel and Associate compensation plan that is different from all of our other markets and that hasbeen developed specifically to comply with the regulations in China – namely, BabyCare’s businessmodel and Associate compensation plan. Although we believe that, in light of our successful Asian Associate base, we will be successful in growing BabyCare’s business in China, it is difficult to
assess the extent to which BabyCare’s business model and Associate compensation plan will beaccepted or successful in China. Although we are required to conduct our operations in Chinathrough BabyCare, we believe that our success in China will depend on our ability to successfully integrate, to the extent legally possible, our operations with BabyCare’s operations. This includes,among other things, registering USANA products, in a timely manner, for sale by BabyCare inChina. In light of the factors listed above, and the other risks to our business, there can be noassurance that we will not experience a decline in sales and / or customers in our Hong Kong market or that we will be successful in assisting BabyCare with growing sales and customers inChina.
As a network marketing company, we are dependent upon an independent sales forceand we do not have direct control over the marketing of our products. We rely on non-
employee, independent Associates to market and sell our products and to generate our sales. Associates typically market and sell our products on a part-time basis and likely will engage in otherbusiness activities, some of which may compete with us. We have a large number of Associates anda relatively small corporate staff to implement our marketing programs and to provide motivationalsupport to our Associates. We rely primarily upon our Associates to attract, train and motivate new Associates. Our sales are directly dependent upon the efforts of our Associates. Our ability tomaintain and increase sales in the future will depend in large part upon our success in increasing thenumber of new Associates, retaining and motivating our existing Associates, and in improving theproductivity of our Associates.
We can provide no assurances that the number of Associates will increase or remain constant
or that their productivity will increase. We experienced a 14.6% increase in the number of active Associates during 2010, a 0.5% increase during 2009, and a 12.5% increase during 2008. Thenumber of active Associates may not increase and could decline in the future. Associates may terminate their services at any time, and, like most direct selling companies, we experience a highturnover among new Associates from year to year. We cannot accurately predict any fluctuation inthe number and productivity of Associates because we primarily rely upon existing Associates tosponsor and train new Associates and to motivate new and existing Associates. Our operating results could be adversely affected if we and our existing Associates do not generate sufficientinterest in our business to successfully retain existing Associates and attract new Associates.
The loss of a significant USANA Associate or downline sales organization couldadversely affect our business. We rely on the successful efforts of our Associates that become
leaders within our Compensation Plan. Our Compensation Plan is designed to permit Associates tosponsor new Associates, creating multiple “business centers,” or levels in the downlineorganization. Sponsored Associates are referred to as “downline” Associates within the sponsoring Associate’s “downline network.” If these downline Associates in turn sponsor new Associates,additional business centers are created, with the new downline Associates becoming part of theoriginal sponsoring Associate’s downline network. As a result of this network marketing system, Associates develop business relationships with other Associates. The loss of a key Associate or

8/3/2019 USANA 2010 Annual Report
http://slidepdf.com/reader/full/usana-2010-annual-report 30/104
28
group of Associates, large turnover or decreases in the size of the key Associate force, seasonal orother decreases in purchase volume, sales volume reduction, the costs associated with training new Associates, and other related expenses may adversely affect our business, financial condition, orresults of operations. Moreover, our ability to continue to attract and retain Associates can beaffected by a number of factors, some of which are beyond our control, including:
• General business and economic conditions;
• Adverse publicity or negative misinformation about us or our products;
• Public perceptions about network marketing programs;
• High-visibility investigations or legal proceeding against network marketing companies by federal or state authorities or private citizens;
• Public perceptions about the value and efficacy of nutritional, personal care, or weightmanagement products generally;
• Other competing network marketing organizations entering into the marketplace that may recruit our existing Associates or reduce the potential pool of new Associates; and
• Changes to the Compensation Plan required by law or implemented for business reasonsthat make attracting and retaining Associates more difficult.
There can be no assurance that we will be able to continue to attract and retain Associates insufficient numbers to sustain future growth or to maintain our present growth levels, which couldhave a material adverse effect on our business, financial condition, or results of operations.
The violation of marketing or advertising laws by Associates in connection with thesale of our products or the improper promotion of our Compensation Plan could adverselyaffect our business. All Associates sign a written contract and agree to adhere to our policies andprocedures. Although these policies and procedures prohibit Associates from making false,misleading and other improper claims regarding products or income potential from the distributionof the products, Associates may, from time to time, without our knowledge and in violation of ourpolicies, create promotional materials or otherwise provide information that does not accurately describe our marketing program. They also may make statements regarding potential earnings,product claims, or other matters in violation of our policies or applicable laws and regulationsconcerning these matters. These violations may result in legal action against us by regulatory agencies, state attorneys general, or private parties. Legal actions against our Associates or others who are associated with us could lead to increased regulatory scrutiny of our business, including ournetwork marketing system. We take what we believe to be commercially reasonable steps tomonitor the activities of our Associates to guard against misrepresentation and other illegal orunethical conduct by Associates and to assure that the terms of our policies and procedures andCompensation Plan are observed. There can be no assurance, however, that our efforts in thisregard will be sufficient to accomplish this objective. Adverse publicity resulting from such
activities could also make it more difficult for us to attract and retain Associates and may have anadverse effect on our business, financial condition, and results of operations.
Network marketing is subject to intense government scrutiny and regulation, whichadds to the expense of doing business and the possibility that changes in the law mightadversely affect our ability to sell some of our products in certain markets. Network marketing systems, such as ours, are frequently subject to laws and regulations, both in the U.S. and

8/3/2019 USANA 2010 Annual Report
http://slidepdf.com/reader/full/usana-2010-annual-report 31/104
29
internationally, that are directed at ensuring that product sales are made to consumers of theproducts and that compensation, recognition, and advancement within the marketing organizationare based on the sale of products rather than on investment in the sponsoring company.Regulatory authorities, in one or more of our present or future markets, could determine that ournetwork marketing system does not comply with these laws and regulations or that it is prohibited.Failure to comply with these laws and regulations or such a prohibition could have a material
adverse effect on our business, financial condition, or results of operations. Further, we may simply be prohibited from distributing products through a network-marketing channel in some countries,or we may be forced to alter our Compensation Plan.
We are also subject to the risk that new laws or regulations might be implemented or thatcurrent laws or regulations might change, which could require us to change or modify the way weconduct our business in certain markets. This could be particularly detrimental to us if we had tochange or modify the way we conduct business in markets that represent a significant percentage of our net sales. For example, the FTC released a proposed New Business Opportunity Rule in April2006. As initially drafted, the proposed rule would have required pre-sale disclosures for all businessopportunities, which may have included network marketing compensation plans such as ours.However, in March 2008 the FTC issued a revised notice of proposed rulemaking, which indicates
that the New Business Opportunity Rule as drafted will not apply to multi-level marketing companies. The comment and rebuttal periods regarding the proposed rule have closed, but theFTC has not yet issued a final rule. The New Business Opportunity Rule is currently only aproposed rule and may change before it is implemented, if it is implemented at all.
We may have or incur obligations relating to the activities of our Associates. Our Associates are subject to taxation, and, in some instances, legislation or governmental agenciesimpose an obligation on us to collect taxes, such as sales taxes or value added taxes, and to maintainappropriate records of such transactions. In addition, we are subject to the risk in somejurisdictions of being responsible for social security and similar taxes with respect to our Associates.In the event that local laws and regulations or the interpretation of local laws and regulations
change to require us to treat our independent Associates as employees, or if our Associates aredeemed by local regulatory authorities in one or more of the jurisdictions in which we operate to beour employees rather than independent contractors, under existing laws and interpretations, we may be held responsible for a variety of obligations that are imposed upon employers relating to theiremployees, including social security and related taxes in those jurisdictions, plus any relatedassessments and penalties, which could harm our financial condition and operating results.
Our business is subject to the effects of adverse publicity and negative public perception. Our ability to attract and retain Associates and to sustain and enhance sales throughour Associates can be affected by adverse publicity or negative public perception regarding ourindustry, our competition, or our business generally. This negative public perception may includepublicity regarding the legality of network marketing, the quality or efficacy of nutritional
supplement products or ingredients in general or our products or ingredients specifically, andregulatory investigations, regardless of whether those investigations involve us or our Associates orthe business practices or products of our competitors or other network marketing companies. In2007, we were the victim of false statements made to the press and regulatory agencies, causing usto incur significant expense in defending and dispelling the allegations during 2007 and 2008. Thisadverse publicity also adversely impacted the market price of our stock and caused insecurity among our Associates. There can be no assurance that we will not be subject to adverse publicity

8/3/2019 USANA 2010 Annual Report
http://slidepdf.com/reader/full/usana-2010-annual-report 32/104
30
or negative public perception in the future or that such adverse publicity will not have a materialadverse effect on our business, financial condition, or results of operations.
The loss of key management personnel could adversely affect our business. OurFounder, Dr. Myron Wentz, is a highly visible spokesman for our products and our business, andour message is based in large part on his vision and reputation, which helps distinguish us from our
competitors. Any loss or limitation on Dr. Wentz as a lead spokesman for our mission, business,and products could have a material adverse effect upon our business, financial condition, or resultsof operations. In addition, our executive officers are primarily responsible for our day-to-day operations, and we believe our success depends in part on our ability to retain our executiveofficers, to compensate our executive officers at attractive levels, and to continue to attractadditional qualified individuals to our management team. We cannot guarantee continued serviceby our key executive officers. We do not maintain key man life insurance on any of our executiveofficers, nor do we have an employment agreement with any of our executive officers. The loss orlimitation of the services of any of our executive officers or the inability to attract additionalqualified management personnel could have a material adverse effect on our business, financialcondition, or results of operations.
The beneficial ownership of a significant percentage of our common stock gives ourfounder and parties related to or affiliated with him effective control, and limits theinfluence of other shareholders on important policy and management issues. Gull Holdings,Ltd., an entity that is solely owned and controlled by Dr. Wentz, owned 50.1% of our outstanding common stock at January 1, 2011. By virtue of this stock ownership, Dr. Wentz is able to exertsignificant influence over the election of the members of our Board of Directors and our businessaffairs. This concentration of ownership could also have the effect of delaying, deterring, orpreventing a change in control that might otherwise be beneficial to shareholders. In addition, Dr. Wentz also currently serves as Chairman of our Board of Directors. There can be no assurance thatconflicts of interest will not arise with respect to this directorship or that conflicts will be resolvedin a manner favorable to other shareholders of the Company.
Sales by our shareholders of a substantial number of shares of our common stock in the public market could adversely affect the market price of our common stock. A large numberof outstanding shares of our common stock are held by several of our principal shareholders. If any of these principal shareholders were to decide to sell large amounts of stock over a short periodof time such sales could cause the market price of our common stock to decline.
Our stock price has been volatile and subject to various market conditions. There canbe no assurance that an active market in our stock will be sustained. The trading price of ourcommon stock has been subject to wide fluctuations. The price of our common stock may fluctuate in the future in response to quarter-to-quarter variations in operating results, materialannouncements by us or our competitors, governmental regulatory action, conditions in thenutritional supplement industry, negative publicity, or other events or factors, many of which arebeyond our control. In addition, the stock market has historically experienced significant price and volume fluctuations, which have particularly affected the market prices of many dietary andnutritional supplement companies and which have, in certain cases, not had a strong correlation tothe operating performance of these companies. Our operating results in future quarters may bebelow the expectations of securities analysts and investors. If that were to occur, the price of ourcommon stock would likely decline, perhaps substantially.

8/3/2019 USANA 2010 Annual Report
http://slidepdf.com/reader/full/usana-2010-annual-report 33/104
31
Our products and manufacturing activities are subject to extensive governmentregulation, which could limit or prevent the sale of our products in some markets. Themanufacture, packaging, labeling, advertising, promotion, distribution, and sale of our products aresubject to regulation by numerous national and local governmental agencies in the United Statesand other countries, including the U.S. Food and Drug Administration (“FDA”) and the U.S.Federal Trade Commission (“FTC”). For example, failure to comply with FDA regulatory
requirements may result in, among other things, injunctions, product withdrawals, recalls, productseizures, fines, and criminal prosecutions. Any action of this type by the FDA could materially adversely affect our ability to successfully market our products. With respect to FTC matters, if theFTC has reason to believe the law is being violated (e.g., failure to possess adequate substantiationfor product claims), it can initiate an enforcement action. The FTC has a variety of processes andremedies available to it for enforcement, both administratively and judicially, including compulsory process authority, cease and desist orders, and injunctions. FTC enforcement could result in ordersrequiring, among other things, limits on advertising, consumer redress, divestiture of assets,rescission of contracts, or such other relief as may be deemed necessary. Violation of these orderscould result in substantial financial or other penalties. Any action against us by the FTC couldmaterially and adversely affect our ability to successfully market our products.
In December 2007, the Dietary Supplement & Nonprescription Drug Consumer Protection Act went into effect and requires manufacturers of dietary supplement and over-the-counterproducts to notify the FDA when they receive reports of serious adverse events occurring withinthe United States. Potential FDA responses to any such report could include injunctions, product withdrawals, recalls, product seizures, fines, or criminal prosecutions. We have an internal adverseevent reporting system that has been in place for several years and believe that we are in compliance with this new law. Nevertheless, any action by the FDA in response to a serious adverse eventreport that may be filed by us could materially and adversely affect our ability to successfully marketour products.
In markets outside the United States, prior to commencing operations or marketing our
products, we may be required to obtain approvals, licenses, or certifications from a country’sministry of health or a comparable agency. For example, our manufacturing facility has beenregistered with the FDA and Health Canada and is certified by Australia’s Therapeutic Goods Administration. Approvals or licensing may be conditioned on reformulation of products or may beunavailable with respect to certain products or product ingredients. We must also comply withproduct labeling and packaging regulations that vary from country to country. These activities arealso subject to regulation by various agencies of the countries in which our products are sold.
We cannot predict the nature of any future laws, regulations, interpretations, or applications,nor can we determine what effect additional governmental regulations or administrative orders, when and if promulgated, could have on our business. These potential effects could include,however, requirements for the reformulation of certain products to meet new standards, the recall
or discontinuance of certain products, additional record keeping and reporting requirements,expanded documentation of the properties of certain products, expanded or different labeling, oradditional scientific substantiation. Any or all of these requirements could have a material adverseeffect on our business, financial condition, or results of operations.
Risks associated with operating in international markets could restrict our ability toexpand globally and harm our business and prospects, and we could be adversely affectedby our failure to comply with the laws applicable to our foreign activities, including the U.S.

8/3/2019 USANA 2010 Annual Report
http://slidepdf.com/reader/full/usana-2010-annual-report 34/104
32
Foreign Corrupt Practices Act and other similar worldwide anti-bribery laws. Ourinternational operations are presently conducted in various foreign countries, and we expect thatthe number of countries in which we operate could expand over the next few years. Economicconditions, including those resulting from wars, civil unrest, acts of terrorism and other conflicts or volatility in the global markets, may adversely affect our customers, their demand for our productsand their ability to pay for our products. In addition, there are numerous risks inherent in
conducting our business internationally, including, but not limited to, potential instability ininternational markets, changes in regulatory requirements applicable to international operations,currency fluctuations in foreign countries, political, economic and social conditions in foreigncountries and complex U.S. and foreign laws and treaties, including tax laws and the U.S. ForeignCorrupt Practices Act (FCPA). These risks could restrict our ability to sell products to or to obtaininternational customers or to operate our international business profitably, and our overall businessand results of operations could be negatively impacted by our foreign activities.
The FCPA and similar anti-bribery laws in other jurisdictions prohibit U.S.-based companiesand their intermediaries from making improper payments to non-U.S. officials for the purpose of obtaining or retaining business. We pursue opportunities in certain parts of the world thatexperience government corruption, and in certain circumstances, compliance with anti-bribery laws
may conflict with local customs and practices. Our policies mandate compliance with all applicableanti-bribery laws. Further, we require our partners, subcontractors, agents and others who work forus or on our behalf to comply with the FCPA and other anti-bribery laws. Although we havepolicies and procedures designed to ensure that we, our employees, our agents and others who work with us in foreign countries comply with the FCPA and other anti-bribery laws, there is noassurance that such policies or procedures will protect us against liability under the FCPA or otherlaws for actions taken by our agents, employees and intermediaries. If we are found to be liable forFCPA violations (either due to our own acts or our inadvertence, or due to the acts or inadvertenceof others), we could suffer from severe criminal or civil penalties or other sanctions, which couldhave a material adverse effect on our reputation, business, results of operations or cash flows. Inaddition, detecting, investigating and resolving actual or alleged FCPA violations is expensive and
could consume significant time and attention of our senior management.
Our net sales are significantly affected by our success in growing existing markets, as well as opening new markets. As we continue to expand into international markets, ourbusiness becomes increasingly subject to political, economic, legal and other risks.Changes in these markets could adversely affect our business. We have a history of expanding into new international markets. We believe that our ability to achieve future growth isdependent in part on our ability to continue our international expansion efforts. There can be noassurance, however, that we will be able to grow in our existing international markets, enter new international markets on a timely basis, or that new markets will be profitable. We must overcomesignificant regulatory and legal barriers before we can begin marketing in any international market. Also, before marketing commences in a new country or market, it is difficult to assess the extent to
which our products and sales techniques will be accepted or successful in any given country. Inaddition to significant regulatory barriers, we may also encounter problems conducting operationsin new markets with different cultures and legal systems from those encountered elsewhere. Wemay be required to reformulate certain of our products before commencing sales in a given country.Once we have entered a market, we must adhere to the regulatory and legal requirements of thatmarket. No assurance can be given that we will be able to successfully reformulate our products inany of our current or potential international markets to meet local regulatory requirements or to

8/3/2019 USANA 2010 Annual Report
http://slidepdf.com/reader/full/usana-2010-annual-report 35/104
33
attract local customers. Our failure to do so could have a material adverse effect on our business,financial condition, or results of operations. There can be no assurance that we will be able toobtain and retain necessary permits and approvals in new markets, or that we will have sufficientcapital to finance our expansion efforts in a timely manner.
In many market areas, other network marketing companies already have significant market
penetration, the effect of which could be to desensitize the local Associate population to a new opportunity, such as USANA, or to make it more difficult for us to attract qualified Associates.Even if we are able to commence operations in new markets, there may not be a sufficientpopulation of persons who are interested in our network marketing system. We believe our futuresuccess will depend in part on our ability to seamlessly integrate our Compensation Plan across allmarkets where legally permissible. There can be no assurance, however, that we will be able toutilize our Compensation Plan seamlessly in all existing or future markets. For example, in August 2010, we indirectly acquired BabyCare, a nutritional supplement company that is licensed by the government of the People’s Republic of China (the “PRC” or “China”) to engage in directselling in the Municipality of Beijing. Under Chinese law, single-level compensation models arepermitted, but multi-level compensation models, as practiced by USANA and many other directselling companies, are not. BabyCare utilizes a single-level compensation model in connection with
its business in China, which is separate and different from our Compensation Plan in our othermarkets. In order to comply with China law, BabyCare will continue to utilize its compensationmodel, and USANA’s Compensation Plan will not be integrated into BabyCare or utilized in China.
Our operations in China are subject to significant government scrutiny and may beharmed by the results of such scrutiny. Because of the government’s significant concerns aboutdirect selling activities, government regulators in China closely scrutinize activities of direct selling companies or activities that resemble direct selling. The regulatory environment in China withregard to direct selling is evolving, and officials in multiple national and local levels in the Chinesegovernment often exercise broad discretion in deciding how to interpret and apply applicableregulations. In the past, the government has taken significant actions against companies that the
government has found have been engaging in direct selling activities in violation of applicable law,including shutting down their businesses and imposing substantial fines.
Any determination that our operations or activities, or the activities of our sales employees,contractual sales promoters, direct sellers or Associates are not in compliance with applicableregulations could result in substantial fines, extended interruptions of business, termination of necessary licenses and permits, including our direct selling licenses, or restrictions on our ability toopen new stores, obtain approvals for service centers or expand into new locations, all of whichcould harm our business.
Our business will be adversely affected if Chinese regulatory authorities view our directselling and other corporate activities as non-compliant with applicable Chinese laws andregulations. Our operations in China may be deemed to be subject to numerous Chinesecommercial laws, including restrictions on foreign investments. In addition, the Chinese regulatory authorities with jurisdiction over our operations may change applicable laws and regulations orimpose additional requirements and conditions with which we may be unable to comply. BabyCareis licensed to engage in direct selling activity in the Municipality of Beijing. We have not soughtconfirmation from Chinese regulatory governmental authorities whether our structure and businessarrangement with BabyCare comply with applicable Chinese laws and regulations, including regulation of direct selling business in China. If:

8/3/2019 USANA 2010 Annual Report
http://slidepdf.com/reader/full/usana-2010-annual-report 36/104
34
• Chinese authorities deem BabyCare’s corporate activities as violating applicable Chineselaws and regulations (including restrictions on foreign investments);
• Chinese regulatory authorities change applicable laws and regulations or impose additionalrequirements and conditions with which BabyCare is unable to comply; or
• BabyCare is found to violate any existing or future Chinese laws or regulations;
the relevant Chinese authorities would have broad discretion to deal with such a violation by levying fines, revoking business licenses, requiring us to restructure BabyCare’s ownership oroperations, and requiring BabyCare and/or USANA to discontinue some or all of their business inChina. Any of these actions would adversely affect our business.
The direct selling license granted to BabyCare is limited in its scope. To engage in directselling activity outside the Municipality of Beijing, BabyCare will be required to obtain licenses fromother municipalities and provinces within China. If BabyCare is unable to obtain additionalnecessary national and local government approvals in China as quickly as we would like, our ability to expand and grow our business could be negatively impacted. The process for obtaining thenecessary government approvals to conduct direct selling continues to evolve. The process is time-
consuming and expensive. The complexity of the approval process, as well as the government’scontinued cautious approach as direct selling develops in China, makes it difficult to predict thetimeline for obtaining additional approvals. If the results of the government’s evaluation of ourdirect selling activities result in further delays in obtaining licenses elsewhere, or if the currentprocesses for obtaining approvals are delayed further for any reason or are changed or areinterpreted differently than currently understood, BabyCare’s ability to expand direct selling inChina and its growth prospects in this market, could be negatively impacted. BabyCare currently isonly allowed by the PRC to sell through direct selling the limited number of products that aremanufactured by BabyCare itself. If BabyCare wishes to sell additional products (other than thosealready approved) through the direct-selling channel, it must successfully complete a productapproval process similar to the process described above. We cannot assure that BabyCare will besuccessful in obtaining such additional product approvals on a timely basis or at all.
A return to profit repatriation controls may limit the ability to expand business andreduce the attractiveness of investing in Chinese business opportunities. Chinese law allowsenterprises owned by foreign investors to remit their profits, dividends and bonuses earned inChina to other countries, and the remittance does not require prior approval by the State Administration of Foreign Exchange (“SAFE”). SAFE regulations require extensivedocumentation and reporting, some of which are burdensome and slows payments. If there is areturn to payment restrictions and reporting, the ability of a Chinese company to attract investors will be reduced. Also, current investors may not be able to obtain the profits of the businesses they own for other reasons. Relevant Chinese law and regulation permit payment of dividends only from retained earnings, if any, determined in accordance with Chinese accounting standards and
regulations. It is possible that the Chinese tax authorities may require changes in the calculation of distributable net income of BabyCare that may limit its ability to pay dividends and otherdistributions to stockholders. Chinese law requires companies to set aside a portion of net incometo fund certain reserves, which amounts are not distributable as dividends. These rules and possiblechanges could restrict BabyCare from repatriating funds.
Our ability to enforce BabyCare’s material agreements in China is uncertain. Chineselaw will govern BabyCare’s material operating agreements. There is no assurance that BabyCare will

8/3/2019 USANA 2010 Annual Report
http://slidepdf.com/reader/full/usana-2010-annual-report 37/104
35
be able to enforce those material agreements or that remedies will be available outside China. TheChinese judiciary is relatively inexperienced in enforcing corporate and commercial laws, leading toa substantial degree of uncertainty as to the outcome of litigation. The inability to enforce or obtaina remedy under our agreements may have a material adverse impact on our operations.
Intellectual property rights are difficult to enforce in China. Chinese commercial law is
relatively undeveloped compared to most of our other major markets, and, as a result, we may havelimited legal recourse in the event we encounter significant difficulties with patent or trademark infringers. Limited protection of intellectual property is available under Chinese law, and the localmanufacturing of our products may subject us to an increased risk that unauthorized parties may attempt to manufacture and sell counterfeited products or copy or otherwise obtain or use ourproduct formulations. As a result, we cannot assure that we will be able to adequately protect ourproduct formulations or other intellectual property in China.
An increase in the amount of incentives paid to Associates reduces our profitability. The payment of Associate incentives is our most significant expense. These incentives includecommissions, bonuses, and certain awards and prizes. From time to time, we adjust ourCompensation Plan to better manage these incentives as a percentage of net sales. We closely
monitor the amount of Associate incentives that are paid as a percentage of net sales, and may periodically adjust our Compensation Plan to prevent Associate incentives from having a significantadverse effect on our earnings. There can be no assurance that changes to the Compensation Planor product pricing will be successful in achieving target levels of Associate incentives as apercentage of net sales. Furthermore, such changes may make it difficult to attract and retainqualified and motivated Associates or cause us to lose some of our longer-standing Associates.
Our business is subject to the risks associated with intense competition from larger, wealthier, and more established competitors. We face intense competition in the business of distributing and marketing nutritional supplements, vitamins and minerals, personal care products,and other nutritional products, as described in greater detail in “Business — Competition.”Numerous manufacturers, Associates, and retailers compete actively for consumers and, in the case
of other network marketing companies, for Associates. There can be no assurance that we will beable to compete in this intensely competitive environment. In addition, nutrition and personal careproducts can be purchased in a wide variety of channels of distribution, including retail stores. Ourproduct offerings in each product category are also relatively small, compared to the wide variety of products offered by many of our competitors.
We are also subject to significant competition from other network marketing organizations forthe time, attention, and commitment of new and existing Associates. Our ability to remaincompetitive depends, in significant part, on our success in recruiting and retaining Associates. There can be no assurance that our programs for recruiting and retaining Associates will besuccessful. The pool of individuals who may be interested in network marketing is limited in eachmarket, and it is reduced to the extent other network marketing companies successfully recruitthese individuals into their businesses. Although we believe we offer an attractive opportunity for Associates, there can be no assurance that other network marketing companies will not be able torecruit our existing Associates or deplete the pool of potential Associates in a given market.
Taxation and transfer pricing considerations affect our operations. In many countries,including the United States, we are subject to transfer pricing and other tax regulations that aredesigned to ensure that appropriate levels of income are reported by our U.S. and foreign entities

8/3/2019 USANA 2010 Annual Report
http://slidepdf.com/reader/full/usana-2010-annual-report 38/104
36
and are taxed appropriately. Although we believe that we are in compliance with all materialregulations and restrictions in this regard, we are subject to the risk that taxing authorities couldaudit our transfer pricing and related practices and assert that additional taxes are owed. We arealso subject to the risk that taxing authorities in any of our markets could change the laws in amanner that may increase our effective tax rate and/or duties on our products. Under tax treaties, we are eligible to receive foreign tax credits in the United States for foreign taxes actually paid
abroad. In the event any audits or assessments are concluded adversely to us, we may or may notbe able to offset the consolidated effect of foreign income tax assessments through the use of U.S.foreign tax credits. Currently, we are utilizing all foreign tax credits in the year in which they arise.Because the laws and regulations governing U.S. foreign tax credits are complex and subject toperiodic legislative amendment, we cannot be sure that we would in fact be able to take advantageof any foreign tax credits in the future. As a result, adverse outcomes in these matters could have amaterial impact on our financial condition or operating results.
Fluctuation in the value of currency exchange rates with the U.S. dollar affects ouroperations and our net sales and earnings. Over the past several years, a significant portion of our net sales have been generated outside the United States. Such sales for the year ended January 1, 2011 represented 70.9% of our total net sales. We will likely continue to expand our operations
into new markets, exposing us to expanding risks of changes in social, political, and economicconditions, including changes in the laws and policies that govern investment or exchange in thesemarkets. Because a significant portion of our sales are generated outside the United States,exchange rate fluctuations will have a significant effect on our sales and earnings. Further, if exchange rates fluctuate dramatically, it may become uneconomical for us to establish or tocontinue activities in certain countries. For instance, changes in currency exchange rates may affectthe relative prices at which we and our competitors sell similar products in the same market. Asour business expands outside the United States, an increasing share of our net sales and operating costs will be transacted in currencies other than the U.S. dollar. Accounting practices require thatour non-U.S. financial results be converted to U.S. dollars for reporting purposes. Consequently,our reported net earnings may be significantly affected by fluctuations in currency exchange rates,
with earnings generally increasing with a weaker U.S. dollar and decreasing with a strengthening U.S. dollar. Product purchases by our subsidiaries are transacted in U.S. dollars. As our operationsexpand in countries where transactions may be made in currencies other than the U.S. dollar, ouroperating results will be increasingly subject to the risks of exchange rate fluctuations and we may not be able to accurately estimate the impact that these changes might have on our future business,product pricing, results of operations, or financial condition. In addition, the value of the U.S.dollar in relation to other currencies may also adversely affect our sales to customers outside theUnited States. At times we have sought to reduce exposure to fluctuations in currency exchangerates by creating offsetting positions through the use of currency exchange contracts on cash that we repatriate. We did not enter into any such contracts during 2010. We do not use derivativeinstruments for speculative purposes. There can be no assurance that currency contract
transactions will protect our operating results or cash flows from potentially adverse effects of currency exchange fluctuations. Any such adverse effects could also adversely affect our business,financial condition, or results of operations.
Disruptions to shipping channels that we use to distribute our products to international warehouses may adversely affect our margins and profitability in those markets. In the past, we have felt the impact of disruptions to the shipping channels used to distribute our products;these disruptions have included increased port congestion, a lack of capacity on the railroads, and a

8/3/2019 USANA 2010 Annual Report
http://slidepdf.com/reader/full/usana-2010-annual-report 39/104
37
shortage of manpower. Although we have not recently experienced significant shipping disruptions, we continue to watch for signs of upcoming congestion. Congestion to ports canaffect previously negotiated contracts with shipping companies, resulting in unexpected increases inshipping costs and reduction in our net sales.
The inability to obtain adequate supplies of raw materials for products at favorable
prices, or at all, or the inability to obtain certain products from third-party suppliers, couldhave a material adverse effect on our business, financial condition, or results of operations. We acquire all of our raw materials for the manufacture of our products from third-party suppliers.Materials used in manufacturing our products are purchased through purchase order, ofteninvoking pre-negotiated annual supply agreements. We have very few long-term agreements for thesupply of these materials. We also contract with third-party manufacturers and suppliers for theproduction of some of our products, including gelatin-capsuled supplements, Probiotic, Rev3Energy™ Drink, our powdered drink mixes and nutrition bars, and certain of our personal careproducts. These third-party suppliers and manufacturers produce and, in most cases, package theseproducts according to formulations that have been developed by, or in conjunction with, our in-house product development team. There is a risk that any of our suppliers or manufacturers coulddiscontinue manufacturing our products or selling their products to us. Although we believe that
we could establish alternate sources for most of our products, any delay in locating and establishing relationships with other sources could result in product shortages or back orders for products, witha resulting loss of net sales. In certain situations, we may be required to alter our products or tosubstitute different products from another source. We have, in the past, discontinued ortemporarily stopped sales of certain products that were manufactured by third parties while thoseproducts were on back order. There can be no assurance that suppliers will provide the raw materials or manufactured products that are needed by us in the quantities that we request or at theprices that we are willing to pay. Because we do not control the actual production of certain raw materials and products, we are also subject to delays caused by any interruption in the productionof these materials, based on conditions not within our control, including weather, crop conditions,transportation interruptions, strikes by supplier employees, and natural disasters or other
catastrophic events.
Shortages of raw materials may temporarily adversely affect our margins or our profitability related to the sale of those products. In the past, we have experienced temporary shortages of the raw materials used in certain of our nutritional products. Although we hadidentified multiple sources to supply such raw material ingredients, quantities of the materials wepurchased during these shortages were at higher prices, which negatively impacted our grossmargins for those products. While we periodically experience price increases due to unexpectedraw material shortages and other unanticipated events, this has historically not resulted in a materialeffect on our overall cost of goods sold. However, there is no assurance that our raw materials willnot be significantly adversely affected in the future, causing our profitability to be reduced.
Nutritional supplement products may be supported by only limited availability of conclusive clinical studies. Our products include nutritional supplements that are made from vitamins, minerals, herbs, and other substances for which there is a long history of humanconsumption. Some of our products contain innovative ingredients or combinations of ingredients. Although we believe that all of our products are safe when taken as directed, there is little long-termexperience with human consumption of certain of these product ingredients or combinations of ingredients in concentrated form. We conduct research and test the formulation and production of

8/3/2019 USANA 2010 Annual Report
http://slidepdf.com/reader/full/usana-2010-annual-report 40/104
38
our products, but we have performed or sponsored only limited clinical studies. Furthermore,because we are highly dependent on consumers’ perception of the efficacy, safety, and quality of our products, as well as similar products distributed by other companies, we could be adversely affected in the event that those products prove or are asserted to be ineffective or harmful toconsumers or in the event of adverse publicity associated with any illness or other adverse effectsresulting from consumers' use or misuse of our products or similar products of our competitors.
As a manufacturer, we may be subject to product liability claims. As a manufacturer anda distributor of products for human consumption and topical application, we could becomeexposed to product liability claims and litigation. Additionally, the manufacture and sale of theseproducts involves the risk of injury to consumers due to tampering by unauthorized third parties orproduct contamination. To date, we have not been a party to any product liability litigation,although, like any dietary supplement company, we have received reports from individuals whohave asserted that they suffered adverse consequences as a result of using our products. Thenumber of reports we have received to date is nominal. These matters historically have been settledto our satisfaction and have not resulted in material payments. We are aware of no instance in which any of our products are or have been defective in any way that could give rise to materiallosses or expenditures related to product liability claims. Although we maintain product liability
insurance, which we believe to be adequate for our needs, there can be no assurance that we willnot be subject to such claims in the future or that our insurance coverage will be adequate.
Our business is subject to particular intellectual property risks. Most of our products arenot protected by patents. The labeling regulations governing our nutritional supplements requirethat the ingredients of such products be precisely and accurately indicated on product containers. Accordingly, patent protection for nutritional supplements often is impractical given the largenumber of manufacturers who produce nutritional supplements having many active ingredients incommon. Additionally, the nutritional supplement industry is characterized by rapid change andfrequent reformulations of products, as the body of scientific research and literature refines currentunderstanding of the application and efficacy of certain substances and the interactions among
various substances. In this respect, we maintain an active research and development program thatis devoted to developing better, purer, and more effective formulations of our products. Weprotect our investment in research, as well as the techniques we use to improve the purity andeffectiveness of our products, by relying on trade secret laws. We have also entered intoconfidentiality agreements with certain of our employees involved in research and developmentactivities. Additionally, we endeavor to seek, to the fullest extent permitted by applicable law,trademark and trade dress protection for our products, which protection has been sought in theUnited States, Canada, and in many of the other countries in which we are either presently operating or plan to commence operations in the future. Notwithstanding our efforts, there can beno assurance that our efforts to protect our trade secrets and trademarks will be successful. Norcan there be any assurance that third-parties will not assert claims against us for infringement of their intellectual proprietary rights. If an infringement claim is asserted, we may be required to
obtain a license of such rights, pay royalties on a retrospective or prospective basis, or terminate ourmanufacturing and marketing of our infringing products. Litigation with respect to such matterscould result in substantial costs and diversion of management and other resources and could have amaterial adverse effect on our business, financial condition, or operating results.
Our manufacturing activity is subject to certain risks. We manufacture approximately 73% of the products sold to our customers. As a result, we are dependent upon the uninterrupted

8/3/2019 USANA 2010 Annual Report
http://slidepdf.com/reader/full/usana-2010-annual-report 41/104
39
and efficient operation of our manufacturing facilities. Those operations are subject to powerfailures, the breakdown, failure, or substandard performance of equipment, the improperinstallation or operation of equipment, natural or other disasters, and the need to comply with therequirements or directives of government agencies, including the FDA. There can be no assurancethat the occurrence of these or any other operational problems at our facility would not have amaterial adverse effect on our business, financial condition, or results of operations. We are subject
to a variety of environmental laws relating to the storage, discharge, handling, emission, generation,manufacture, use and disposal of chemicals, solid and hazardous waste, and other toxic andhazardous materials. Our manufacturing operations presently do not result in the generation of material amounts of hazardous or toxic substances. Nevertheless, complying with new or morestringent laws or regulations, or more vigorous enforcement of current or future policies of regulatory agencies, could require substantial expenditures by us that could have a material adverseeffect on our business, financial condition, or results of operations. Environmental laws andregulations require us to maintain and comply with a number of permits, authorizations, andapprovals and to maintain and update training programs and safety data regarding materials used inour processes. Violations of those requirements could result in financial penalties and otherenforcement actions and could require us to halt one or more portions of our operations until a
violation is cured. The combined costs of curing incidents of non-compliance, resolving enforcement actions that might be initiated by government authorities, or of satisfying new legalrequirements could have a material adverse effect on our business, financial condition, or results of operations.
A failure of our information technology systems would harm our business. The globalnature of our business and our seamless global compensation plan requires the development andimplementation of robust and efficiently functioning information technology systems. Suchsystems are vulnerable to a variety of potential risks, including damage or interruption resulting from natural disasters and telecommunication failures and human error or intentional acts of sabotage, vandalism, break-ins and similar acts. Although we have adopted and implemented abusiness continuity and disaster recovery plan, which includes routine back-up, off-site archiving
and storage, and certain redundancies, the occurrence of any of these events could result in costly interruptions or failures adversely affecting our business and the results of our operations.
We may incur liability under our “Athlete Guarantee” program, if and to the extent participating athletes make a successful claim against USANA for testing positive forcertain banned substances while taking USANA nutritional supplements. USANA believesthat its nutritional supplement products are free from substances that have been banned by world-class training and competitive athletic programs. The Company retains independent testing agencies to conduct periodic checks for banned substances. The Company further believes that, while its products promote good health, they are not otherwise considered to be “performanceenhancing” as that term has been used in defining substances that are banned from use ininternational competition by the World Anti-Doping Agency (“WADA”). For many years,
USANA has been a sponsor of Olympic athletes and professional competitors around the world. These athletes have been tested on many occasions and have never tested positive for bannedsubstances as a result of taking USANA nutritional products. To back up its claim that athletes who use the Company’s products as part of their training regimen will not be consuming bannedsubstances, the Company has offered to enter into agreements with select athletes, some of whomhave high-profiles and are highly compensated, which state that, during the term of the agreement,should the athlete test positive for a banned substance included in the WADA, and should such
8/3/2019 USANA 2010 Annual Report
http://slidepdf.com/reader/full/usana-2010-annual-report 42/104
40
positive result be the result of taking USANA nutritional products, USANA will compensate thatathlete two times their current annual earnings up to one million dollars, based on the athlete’spersonal level of competition, endorsement, and other income, as well as other factors. To mitigatepotential exposure under these agreements, we:
• Designate lots identified as dedicated to the Athlete Guarantee program and retainadditional samples;
• Store designated lot samples externally with a third-party; and
• Establish a chain of custody that requires signatures on behalf of USANA and the third-party to transfer possession of the product lots and that restricts access by USANAemployees after the transfer.
All applicants to this Athlete Guarantee program are subject to screening and acceptance by the Company in its sole discretion. Contracts are tailored to fit the athlete’s individualcircumstances and the amount of the Company’s exposure is limited based on the level of sponsorship of the participating athlete. Although the Company believes that the pool of currentand potential participants in the program is small, there is no guarantee that an athlete who is
accepted in the program will not successfully make a claim against us. The Company currently hasno insurance to protect it from potential claims under this program.
Based on the mitigating factors, screening process and the Company’s view that its productsare not “performance enhancing,” management believes there is a less than remote chance that theCompany will incur a liability under the Athlete Guarantee program.
Item 1B. Unresolved Staff Comments
None.
Item 2. Properties
In Salt Lake City, Utah, we own a 354,000 square foot facility that we utilize as our world-wide
corporate headquarters. This facility includes space for manufacturing, distribution, andadministrative functions and is located on a company-owned 16-acre parcel of land.
In addition to our corporate headquarters, we own two other facilities. The first is a 45,000square foot office/warehouse building in Sydney, Australia, and the second is a 31,000 square footmanufacturing facility in Tianjin, China, which is currently used for a nominal amount of third-party skin-care manufacturing. Notably, we plan to manufacture our skin-care products that will be soldby BabyCare in China at the Tianjin facility, once they are approved by the appropriate authoritiesin China.
We lease regional offices and distribution warehouses located in each of the remainder of ourmarkets. Additionally, we lease a facility in Draper, Utah for the manufacture and packaging of our
Sensé™ products. BabyCare also leases facilities in China, which include manufacturing space andretail centers.
We believe that the facilities referenced above are in good condition and are adequately utilized. Further, we believe that our manufacturing facilities provide for the productive capacity tomeet our foreseeable needs.

8/3/2019 USANA 2010 Annual Report
http://slidepdf.com/reader/full/usana-2010-annual-report 43/104
41
Item 3. Legal Proceedings
From time to time we are involved in litigation arising out of our operations. We maintainliability insurance, including product liability coverage, in amounts our management believes isadequate. We are not currently engaged in any legal proceedings that we expect would materially harm our business or financial condition.
Item 4. (Removed and Reserved)
PART II
Item 5. Market for Registrant’s Common Equity, Related Stockholder Matters and IssuerPurchases of Equity Securities
Market Information
Our common stock has historically traded on The NASDAQ Global Select Market under thesymbol “USNA.” On January 3, 2011, however, we transferred the listing of our common stock tothe New York Stock Exchange (“NYSE”) and have continued to use the symbol “USNA.” The
following table contains the reported high and low sale prices for our common stock as reported on The NASDAQ Global Select Market for the periods indicated:
2009 High Low
First Quarter........................................................... 33.95$ 17.72$
Second Quarter...................................................... 30.22$ 22.41$
Third Quarter......................................................... 36.93$ 23.58$
Fourth Quarter....................................................... 37.19$ 27.87$
2010 High Low
First Quarter........................................................... 32.84$ 24.34$
Second Quarter...................................................... 39.20$ 30.11$ Third Quarter......................................................... 45.00$ 36.71$
Fourth Quarter....................................................... 45.50$ 39.00$
The market price of our common shares is subject to fluctuations in response to variations inour quarterly operating results, general trends in the market for our products and productcandidates, economic and currency exchange issues in the markets where we operate, as well asother factors, many of which are not within our control. In addition, broad market fluctuations, as well as general economic, business and political conditions may adversely affect the market for ourcommon shares, regardless of our actual or projected performance.
On March 7, 2011, the high and low sales prices of our common stock as reported by NYSE were $35.36 and $33.70, respectively.
Shareholders
As of March 7, 2011, we had 410 holders of record of our common stock.

8/3/2019 USANA 2010 Annual Report
http://slidepdf.com/reader/full/usana-2010-annual-report 44/104
42
Dividends
We have never declared or paid cash dividends on our common stock and we currently haveno plans to do so. Future cash dividends, if any, will be determined by our Board of Directors and will be based on earnings, available capital, our financial condition, and other factors that the Boardof Directors deems to be relevant.
Share Repurchases
Purchases made during the quarter ended January 1, 2011 for each fiscal month therein aresummarized in the following table:
Period
Total
Number of
Shares
Purchased
Average Price
Paid per
Share
Total Number of
Shares Purchased as
Part of Publicly
Announced Plans or
Programs
Approximate Dollar
Value of Shares that
May Yet Be
Purchased Under the
Plans or Programs *
Fiscal October............................................ 88 $44.98 88 $36,128
(Oct. 3, 2010 through Nov. 6, 2010)
Fiscal November........................................ 100 $44.23 100 $31,705
(Nov. 7, 2010 through Dec. 4, 2010)
Fiscal December......................................... 0 $0.00 0 $31,705
(Dec. 5, 2010 through Jan. 1, 2011)
188 $44.58 188
(amounts in thousands, except per share data)
Issuer Purchases of Equity Securities
* The Company's share repurchase plan has been ongoing since the fourth quarter of 2000, with the
Company's Board of Directors periodically approving additional dollar amounts for share repurchases underthe plan. The Company began the fourth quarter with $40,106 remaining under the plan. There currently is
no expiration date on the approved repurchase amount.

8/3/2019 USANA 2010 Annual Report
http://slidepdf.com/reader/full/usana-2010-annual-report 45/104
43
Item 6. Selected Financial Data
The following selected consolidated financial data should be read in conjunction with“Management’s Discussion and Analysis of Financial Condition and Results of Operations” and theConsolidated Financial Statements and related notes thereto that are included in this report.
Fiscal Year (1)
2006 2007 2008 2009 2010
Consolidated Statements of Earnings Data:
Net sales.............................................................. 365,166$ 423,149$ 429,012$ 436,940$ 517,644$
Cost of sales....................................................... 79,836 87,891 88,878 89,803 95,482
Gross profit.............................................. 285,330 335,258 340,134 347,137 422,162
Operating expenses:
Associate incentives....................................... 146,251 170,383 178,309 196,363 233,187 Selling, general and administrative (2)........ 76,566 94,174 113,828 99,983 120,759
otal operating expenses........................ 222,817 264,557 292,137 296,346 353,946
Earnings from continuing operations............ 62,513 70,701 47,997 50,791 68,216 t er ncome expense , net........................... , ,
arn ngs rom cont nu ng operat onsbefore income taxes....................................... 63,921 71,172 46,321 50,978 68,864 Income taxes...................................................... 22,679 25,530 16,376 17,422 23,213
Income from continuing operations........... 41,242 45,642 29,945 33,556 45,651 Loss from discontinued operations,
net of tax.......................................................... (877) (612) - - -
et earn ngs.................................................... , , , , ,
Earnings (loss) per common share:
Basic
Continuing operations............................... 2.29$ 2.73$ 1.87$ 2.19$ 2.94$
Discontinued operations........................... (0.05) (0.04) - - -
Net earnings................................................. 2.24$ 2.69$ 1.87$ 2.19$ 2.94$ute
Continuing operations............................... 2.20$ 2.65$ 1.85$ 2.17$ 2.86$
Discontinued operations........................... (0.04) (0.03) - - -
Net earnings................................................. 2.16$ 2.62$ 1.85$ 2.17$ 2.86$
Weighted average common shares
outstanding:Basic.............................................................. 18,053 16,734 16,048 15,340 15,528 Diluted.......................................................... 18,724 17,206 16,163 15,432 15,942
Dividends per share.......................................... - - - - -
Cash Flow Related Data:
Net cash provided by (used in):Operating activities..................................... 61,290$ 58,205$ 45,956$ 32,469$ 66,108$Investing activities...................................... (11,680) (26,010) (15,206) (3,197) (46,853) Financing activities..................................... (33,218) (46,886) (29,765) (29,502) (9,577) Purchase of property and equipment...... (11,038) (26,264) (16,061) (4,128) (4,192) Repurchase of common stock.................. (40,958) (79,580) (39,873) (1,654) (17,031)
(in thousands, except per share data)

8/3/2019 USANA 2010 Annual Report
http://slidepdf.com/reader/full/usana-2010-annual-report 46/104
44
Dec. 30, Dec. 29, Jan. 3, Jan. 2, Jan. 1,
Consolidated Balance Sheet Data:
Cash and cash equivalents......................... 27,029$ 12,865$ 13,281$ 13,658$ 24,222$
Working capital........................................... 16,275 118 (1,860) 11,448 22,648
Current assets.............................................. 60,615 45,992 52,674 51,926 80,272 Total assets................................................... 100,002 109,128 122,572 123,438 203,802
otal current liabilities............................... 44,340 45,874 54,534 40,478 57,624 Line of credit............................................... - 28,000 34,990 7,000 - Other long-term liabilities......................... - 2,305 1,212 1,587 1,012
Stockholders' equity.................................... 55,662 32,949 31,836 74,373 145,166
Other Data:
Active Associates........................................ 153,000 176,000 198,000 199,000 228,000
Active Preferred Customers...................... 78,000 78,000 71,000 67,000 77,000
Total Active Customers............................. 231,000 254,000 269,000 266,000 305,000
(in thousands, except other data)
As of
(1) The Company’s fiscal year ends on the Saturday that is closest to December 31. The 2006,2007, 2009, and 2010 fiscal years were 52-week years. Fiscal year 2008 was a 53-week year. Theextra week in 2008 added nearly $7,000 to net sales.(2) During 2008, an unanticipated arbitration award was rendered against the Company in theamount of $7,020.
Item 7. Management’s Discussion and Analysis of Financial Condition and Results of Operations
The following discussion and analysis of financial condition and results of operations shouldbe read in conjunction with the Consolidated Financial Statements and notes thereto appearing elsewhere in this report.
Overview
We develop and manufacture high-quality nutritional and personal care products that aredistributed internationally through a network marketing system, which is a form of direct selling.Our customer base comprises two types of customer: “Associates” and “Preferred Customers.” Associates are independent distributors of our products who also purchase our products for theirpersonal use. Preferred Customers purchase our products strictly for their personal use and are notpermitted to resell or to distribute the products. As of January 1, 2011, we had approximately 228,000 active Associates and approximately 77,000 active Preferred Customers worldwide. Forpurposes of this report, we only count as active customers those Associates and PreferredCustomers who have purchased product from us at any time during the most recent three-monthperiod, either for personal use or for resale.
We group and present the markets in which we have ongoing operations as follows:
• North America –
• United States
• Canada
• Mexico
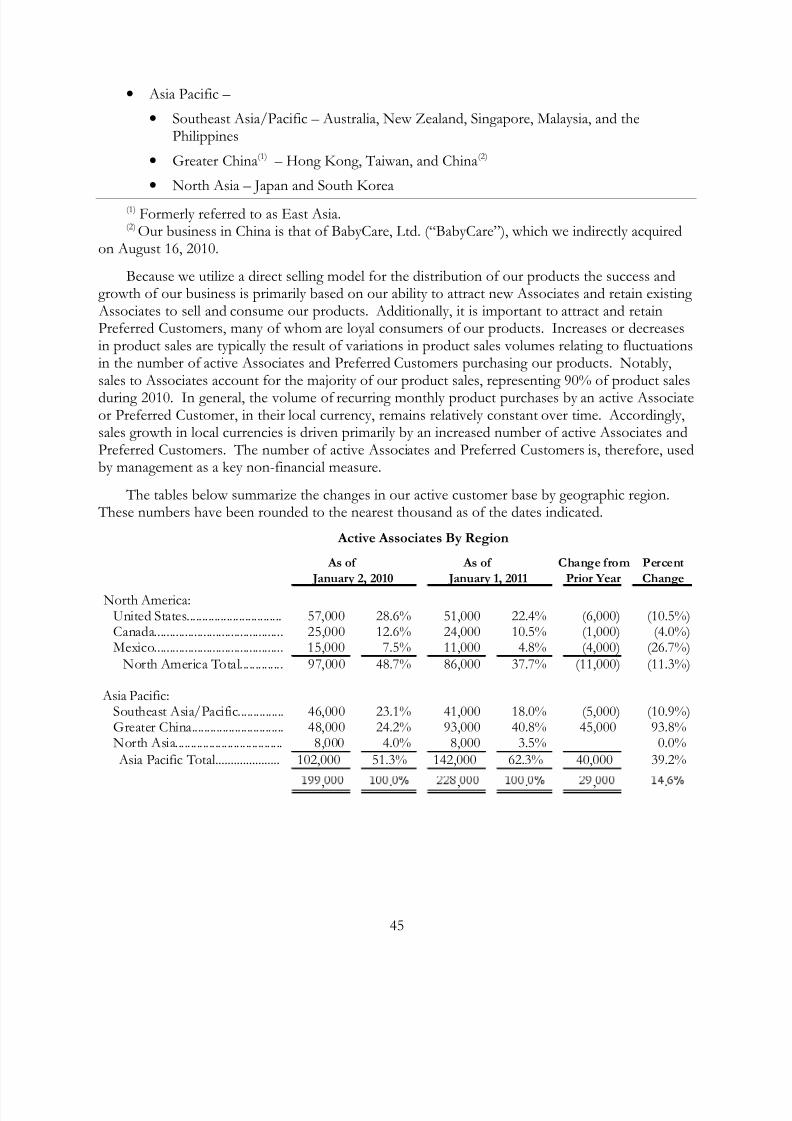
8/3/2019 USANA 2010 Annual Report
http://slidepdf.com/reader/full/usana-2010-annual-report 47/104
45
• Asia Pacific –
• Southeast Asia/Pacific – Australia, New Zealand, Singapore, Malaysia, and thePhilippines
• Greater China(1) – Hong Kong, Taiwan, and China(2)
• North Asia – Japan and South Korea
(1) Formerly referred to as East Asia.(2) Our business in China is that of BabyCare, Ltd. (“BabyCare”), which we indirectly acquired
on August 16, 2010.
Because we utilize a direct selling model for the distribution of our products the success andgrowth of our business is primarily based on our ability to attract new Associates and retain existing Associates to sell and consume our products. Additionally, it is important to attract and retainPreferred Customers, many of whom are loyal consumers of our products. Increases or decreasesin product sales are typically the result of variations in product sales volumes relating to fluctuationsin the number of active Associates and Preferred Customers purchasing our products. Notably,sales to Associates account for the majority of our product sales, representing 90% of product sales
during 2010. In general, the volume of recurring monthly product purchases by an active Associateor Preferred Customer, in their local currency, remains relatively constant over time. Accordingly,sales growth in local currencies is driven primarily by an increased number of active Associates andPreferred Customers. The number of active Associates and Preferred Customers is, therefore, usedby management as a key non-financial measure.
The tables below summarize the changes in our active customer base by geographic region. These numbers have been rounded to the nearest thousand as of the dates indicated.
Change from Percent
Prior Year Change
North America:United States............................... 57,000 28.6% 51,000 22.4% (6,000) (10.5%)Canada.......................................... 25,000 12.6% 24,000 10.5% (1,000) (4.0%)Mexico.......................................... 15,000 7.5% 11,000 4.8% (4,000) (26.7%)
North America Total.............. 97,000 48.7% 86,000 37.7% (11,000) (11.3%)
Asia Pacific:Southeast Asia/Pacific............... 46,000 23.1% 41,000 18.0% (5,000) (10.9%)Greater China.............................. 48,000 24.2% 93,000 40.8% 45,000 93.8%North Asia................................... 8,000 4.0% 8,000 3.5% - 0.0% Asia Pacific Total..................... 102,000 51.3% 142,000 62.3% 40,000 39.2%
, . , . , .
Active Associates By Region
As of As of
January 2, 2010 January 1, 2011

8/3/2019 USANA 2010 Annual Report
http://slidepdf.com/reader/full/usana-2010-annual-report 48/104
46
Change from Percent
Prior Year Change
North America:United States............................... 39,000 58.2% 36,000 46.7% (3,000) (7.7%)Canada.......................................... 16,000 23.9% 14,000 18.2% (2,000) (12.5%)
Mexico.......................................... 3,000 4.5% 4,000 5.2% 1,000 33.3%North America Total.............. 58,000 86.6% 54,000 70.1% (4,000) (6.9%)
Asia Pacific:Southeast Asia/Pacific............... 7,000 10.4% 6,000 7.8% (1,000) (14.3%)Greater China.............................. 1,000 1.5% 16,000 20.8% 15,000 1500.0%North Asia................................... 1,000 1.5% 1,000 1.3% - 0.0%
Asia Pacific Total..................... 9,000 13.4% 23,000 29.9% 14,000 155.6%
, . , . , .
Active Preferred Customers By Region
As of As of
January 2, 2010 January 1, 2011
Change from Percent
Prior Year Change
North America:United States............................... 96,000 36.1% 87,000 28.5% (9,000) (9.4%)Canada.......................................... 41,000 15.4% 38,000 12.5% (3,000) (7.3%)Mexico.......................................... 18,000 6.8% 15,000 4.9% (3,000) (16.7%)
North America Total.............. 155,000 58.3% 140,000 45.9% (15,000) (9.7%)
Asia Pacific:Southeast Asia/Pacific............... 53,000 19.9% 47,000 15.4% (6,000) (11.3%)Greater China.............................. 49,000 18.4% 109,000 35.7% 60,000 122.4%North Asia................................... 9,000 3.4% 9,000 3.0% - 0.0% Asia Pacific Total..................... 111,000 41.7% 165,000 54.1% 54,000 48.6%
266,000 100.0% 305,000 100.0% 39,000 14.7%
Total Active Customers By Region
As of As of
January 2, 2010 January 1, 2011
We are currently most focused on the development of China through BabyCare, as well asgrowing our North American markets during a difficult economic environment. Over the pastseveral years, we have experienced significant growth in our Asia Pacific region, particularly in ourHong Kong market. In light of this growth and our acquisition of BabyCare in China, we believethat we are well positioned for growth in China. During 2011, our efforts in Asia Pacific will betargeted at integrating BabyCare into our business and motivating our successful Asian Associatebase to grow BabyCare in China. These efforts will require an investment of both time and
resources. This includes working with the Chinese government to assist BabyCare in obtaining direct selling licenses in additional Chinese provinces and cities beyond Beijing and registering USANA products for sale by BabyCare in China. We are currently working with the Chinesegovernment to allow several USANA products to be manufactured and sold by BabyCare in China. We hope to have many of these products approved within 2011.
Difficult economic conditions continue to present a challenge for our overall business and Associate base, especially in our North American markets. In light of these conditions, a number

8/3/2019 USANA 2010 Annual Report
http://slidepdf.com/reader/full/usana-2010-annual-report 49/104
47
of our Associates and Preferred Customers have discontinued their product purchases as well astheir activity in introducing new customers to our products. During 2011, our primary corporateperformance objectives will largely be tied to sales and Associate growth in North America. Themeasures we are implementing to accomplish these objectives include (i) the introduction andpromotion of new training and presentation tools, which we believe are of significant assistance inhelping Associates grow their businesses; (ii) efforts to increase our global brand recognition, and
(iii) the enhancement of our Associate Rewards and Recognition program.
Because we have operations in multiple markets, with sales and expenses being generated andincurred in multiple currencies, our reported U.S. dollar sales and earnings can be significantly affected by fluctuations in currency exchange rates. In general, our reported sales and earnings areaffected positively by a weakening of the U.S. dollar and negatively by a strengthening of the U.S.dollar.
Presentation
Product sales and the shipping and handling fees billed to our customers are recorded asrevenue net of applicable sales discounts when the product is delivered, title has transferred, and therisk of loss passes to the customer. Payments received for undelivered products are recorded asdeferred revenue and are included in other current liabilities. Also reflected in net sales is aprovision for product returns and allowances, which is estimated based on our historical experience. Additionally, the Company collects an annual renewal fee from Associates that is deferred onreceipt and is recognized as income on a straight-line basis over a twelve-month period.
Cost of sales primarily consists of expenses related to raw materials, labor, quality assurance,and overhead costs that are directly associated with the production and distribution of our productsand sales materials, as well as duties and taxes that are associated with the import and export of ourproducts. As our international sales increase as a percentage of net sales, cost of sales areincreasingly affected by additional duties, freight, and other factors, such as changes in currency exchange rates.
Associate incentives expense includes all forms of commissions, compensation, and otherincentives paid to our Associates. Compensation paid to BabyCare Associates, although under adifferent compensation plan, is also included in Associate incentives expense. Incentives paid to Associates include bonuses earned, rewards from contests and promotions, and base commissions, which makes up the majority of our Associate incentives expense. Bonuses are paid out to Associates based on certain business growth criteria, total base commission earnings, and leadershiplevel. Contests and promotions are offered as an incentive and reward to our Associates and aretypically paid out only after an Associate achieves specific growth and advancement levels. Basecommissions are paid out on the sale of products. USANA Associates earn their commissionsbased on sales volume points that are generated in their down-line organization. Sales volumepoints are assigned to each commissionable product and comprise a certain percent of the product
price. Items such as our starter kits and sales tools have no sales volume point value, andcommissions are not paid on the sale of these items. Although insignificant to our financialstatements, a USANA Associate may earn commissions on sales volume points that are generatedfrom personal purchases that are not considered to be part of their “Qualifying Purchases.”Qualifying Purchases are the amount of product that Associates must purchase each month, whichthey must either resell to consumers or personally use in order to qualify to earn commissions or

8/3/2019 USANA 2010 Annual Report
http://slidepdf.com/reader/full/usana-2010-annual-report 50/104
48
bonuses under USANA’s Compensation Plan. Commissions paid to USANA Associates onpersonal purchases are considered a sales discount and are reported as a reduction to our net sales.
Selling, general and administrative expenses include wages and benefits, depreciation andamortization, rents and utilities, Associate event costs, advertising, professional fees, marketing, andresearch and development expenses. Wages and benefits represent the largest component of
selling, general and administrative expenses. Significant depreciation and amortization expense isincurred as a result of investments in physical facilities, computer and telecommunicationsequipment, and systems to support our international operations.
Sales to customers outside the United States are transacted in the respective local currenciesand are translated to U.S. dollars at weighted-average currency exchange rates for each monthly accounting period to which they relate. Most of our raw material purchases from suppliers and ourproduct purchases from third-party manufacturers are transacted in U.S. dollars. Consequently, oursales and net earnings are affected by changes in currency exchange rates, with sales and earningsgenerally increasing with a weakening U.S. dollar and decreasing with a strengthening U.S. dollar.In our net sales discussions that follow, we approximate the impact of currency fluctuations on netsales by translating current year net sales at the average exchange rates in effect during the
comparable prior year periods.
Results of Operations
The following table summarizes our consolidated operating results as a percent of net sales,respectively, for the periods indicated:
Fiscal Year2008 2009 2010
Consolidated Statements of Earnings Data:Net sales.................................................................................... 100.0% 100.0% 100.0%Cost of sales............................................................................. 20.7% 20.6% 18.4%
Gross profit...................................................................... 79.3% 79.4% 81.6%
Operating expenses:Associate incentives ................... .......... ........... .................. 41.6% 44.9% 45.0%Selling, general and administrative *............................... 26.5% 22.9% 23.3%
Total operating expenses........... ................................. ... 68.1% 67.8% 68.3%
Earnings from operations..... ................................. ................ 11.2% 11.6% 13.3%Other income (expense), net.................................................. (0.4%) 0.1% 0.0%
Earnings before income taxes.......... .......... ........... ................ 10.8% 11.7% 13.3%Income taxes....... ................................. ................................. ... 3.8% 4.0% 4.5%
Net earnings.......................................................................... 7.0% 7.7% 8.8%
* Included in selling, general and administrative during 2008 was $7.0 million related toan unanticipated arbitration award, without which selling, general and administrativeexpense as a percent of net sales would have been 24.9%.
Summary of 2010 Financial Results
Net sales increased $80.7 million to $517.6 million, which is an 18.5% increase from 2009. Themost significant item impacting net sales during 2010 was an increase in product sales volumesresulting from an increase in the number of active Associates in Greater China, partially offset by a

8/3/2019 USANA 2010 Annual Report
http://slidepdf.com/reader/full/usana-2010-annual-report 51/104
49
decrease in the number of active Associates in North America and Southeast Asia Pacific. Thisincrease includes the addition of $7.4 million in net sales from BabyCare, our newly acquiredsubsidiary in China. Net sales during 2010 also benefited from favorable changes in currency exchange rates by approximately $21.0 million.
Net earnings increased 36.0% to $45.7 million in 2010 from $33.6 million in 2009. This year-
over-year increase was primarily the result of higher net sales, improved gross profit margin, and alower effective tax rate. These improvements were partially offset by 10 basis point increase in Associate incentives as a percent of net sales, and a 40 basis point increase in selling, general andadministrative expense. Our acquisition of BabyCare reduced net earnings by approximately $3.1million, which includes $2.0 million of acquisition costs.
Fiscal Year 2010 compared to Fiscal Year 2009
Net Sales
The following table summarizes the changes in our net sales by geographic region for the fiscalyears ended January 2, 2010 and January 1, 2011:
Net Sales by Region(in thousands)
Year Ended
2009 2010
Change
from prior
year
Percent
change
Approximate
impact of
currency
exchange
Change
excluding the
impact of
currency
exchange
North America:
United States....... 151,663$ 34.7% 150,893$ 29.2% (770)$ (0.5%) $ N/A (0.5%)
Canada... ............... 65,682 15.1% 69,411 13.4% 3,729 5.7% 6,500 (4.2%)
Mexico.................. 22,384 5.1% 21,843 4.2% (541) (2.4%) 1,400 (8.7%)
North America
Total.............. 239,729 54.9% 242,147 46.8% 2,418 1.0% 7,900 (2.3%)
Asia Pacific:
Southeast Asia/
Pacific................ 95,185 21.8% 99,311 19.2% 4,126 4.3% 10,400 (6.6%)
Greater China...... 81,455 18.6% 152,280 29.4% 70,825 86.9% 800 86.0%
North Asia........... 20,571 4.7% 23,906 4.6% 3,335 16.2% 1,900 7.0%
Asia Pacific
Total.............. 197,211 45.1% 275,497 53.2% 78,286 39.7% 13,100 33.1%
436,940$ 100.0% 517,644$ 100.0% 80,704$ 18.5% 21,000$ 13.7%
North America: The decrease in local currency net sales in this region was the result of lower
product sales volume due to a decrease in the number of active Associates and Preferred Customersin this region. As a manufacturer of premium products, we believe that continued economicchallenges, particularly in the consumer products segment, have contributed meaningfully to thedecrease in active Associates and Preferred Customers. Part of the decrease in the number of active Associates is also due to an increase in the number of North America-based Associates building their businesses in Asia, which results in growth in sales and Associates in Asia Pacific rather thanNorth America. In the third quarter of 2010, we launched a new interactive presentation tool,

8/3/2019 USANA 2010 Annual Report
http://slidepdf.com/reader/full/usana-2010-annual-report 52/104
50
called Health and Freedom Solution, which was created and designed to help our Associates explainand share the USANA opportunity, including the benefits of our products and our CompensationPlan. Throughout 2011, we will heavily promote the use of this tool as well as our online training system in an effort to engage our Associates and help them become more effective at building theirbusinesses, especially in light of the difficult economic environment.
The decrease in active Associates throughout the year was partially offset by an increase incustomer spending, which was a result of two factors. First, during the year we changed thestructure of our compensation, recognition, and rewards programs in a way that we believe willencourage our Associates to build their businesses more effectively. We believe that these changes were the primary reason for the increase in product sales volume per customer from 2009 to 2010.Second, over the last couple of years we have implemented certain price increases, including a priceincrease of nearly ten percent on our products in Mexico. While our profitability in Mexico hasimproved, we believe that the price increases in this market contributed to the decline in our active Associate count.
Asia Pacific: The increase in net sales in this region was primarily due to higher product sales volume due to an increase in the number of active Associates. This increase came predominantly
from Greater China. Growth in Greater China was led by Hong Kong, where the number of active Associates increased 100.0% year-over-year and net sales increased 103.8%. Additionally, ouracquisition of BabyCare added approximately $7.4 million in net sales, 12,000 active Associates, and14,000 active Preferred Customers to this region. Excluding BabyCare, local currency net sales inthis region increased 29.4%, the number of active Associates increased 27.5%, and the number of active Preferred Customers remained unchanged.
Importantly, while we have achieved significant growth in Hong Kong, we anticipate that 2011 will be a transitional year as we turn much of our attention to integrating and growing BabyCare inChina. As such, we expect sales in Hong Kong to decline in 2011. We expect this change will beprimarily the result of three key factors. First, we believe that many of our key Associate leaders inHong Kong, who qualify to do business in both Hong Kong and China, will shift their attention to
growing their businesses in China through BabyCare. Second, we believe that many of our Associates in Hong Kong, who are simply consumers of our products, will begin purchasing ourproducts in China, if and when our products are registered for sale by BabyCare in China. Third,the average initial purchase amount per Associate is lower at BabyCare than our other markets,causing a natural decrease to our sales as some of our Associates who qualify to do business in bothHong Kong and China, and would have otherwise built their business in Hong Kong, beginbuilding in China through BabyCare.
Although smaller as a percent of sales, we also experienced double-digit local currency salesgrowth in the Philippines and South Korea. The increase in total Asia Pacific sales, on a localcurrency basis, was partially offset by an overall decline in sales and Associates in Southeast AsiaPacific, which we believe, similar to North America, is largely the result of difficult economicconditions.
Gross Profit
The increase in gross profit as a percent of net sales can be attributed to a decrease in overallraw materials cost, currency benefits, lower relative freight costs on shipments to our customers,production and shipping efficiency due to capital investments, and leverage gained on increased netsales. Additionally, we have implemented certain price increases, notably on some of our larger

8/3/2019 USANA 2010 Annual Report
http://slidepdf.com/reader/full/usana-2010-annual-report 53/104
51
packs and flagship products, and we discontinued several of our lower gross margin product pack offerings, all of which contributed to our improved gross profit.
Associate Incentives
Although Associate incentives as a percent of sales increased slightly for the year, on asequential quarter basis it has decreased modestly since the fourth quarter of 2009. Notably, during
the second quarter of 2010, we implemented a strategic initiative to reduce Associate incentivesexpense as a percent of net sales and, as a result, we expect a further decrease in 2011.
Selling, General and Administrative Expenses
The increase in selling, general and administrative expenses as a percent of net sales wasprimarily due to acquisition costs related to BabyCare.
In absolute terms, our selling, general and administrative expenses increased by $20.8 million in2010, compared with 2009. The most significant components of this increase in absolute terms were as follows:
• An increase in wage-related expenses of approximately $11.7 million, which includes $2.1
million of expenses related to BabyCare;
• Acquisition costs related to BabyCare of approximately $2.0 million;
• Expenses related to our Asia Pacific convention of approximately $1.7 million; and
• An increase in credit card fees of approximately $1.9 million related to the increase in sales.
We expect that selling, general and administrative expenses will increase in 2011 both inabsolute terms and as a percent of net sales. The reasons for this increase include; (i) increasedinvestments in human resources and other integration-related costs for BabyCare, (ii) a full year of regular BabyCare expense, which is relatively higher than USANA due to the required infrastructurein China, and (iii) increased spending related to our corporate branding efforts. Notably, in
connection with the acquisition of BabyCare, we issued equity awards to certain BabyCareexecutives, which will be part of the full year of regular BabyCare expenses, and which addedapproximately $1.2 million to wage-related expenses in 2010.
Other Income (Expense)
Other income increased nearly $0.5 million due to a $0.5 million reduction in interest expenseas a result of a lower average balance on our line of credit during the year.
Income Taxes
Income taxes totaled 33.7% of earnings before income taxes in 2010, compared to 34.2% in2009. This decrease is primarily due to increased tax benefits from the deduction for qualified
production activities and tax benefits recognized from stock option exercises in 2010.Diluted Earnings Per Share
Diluted earnings per share increased $0.69, or 31.8%, to $2.86 for the year. This increase is theresult of improved gross profit margins on higher net sales and a lower tax rate, partially offset by higher relative operating expenses and a higher average number of diluted shares outstanding.

8/3/2019 USANA 2010 Annual Report
http://slidepdf.com/reader/full/usana-2010-annual-report 54/104
52
Fiscal Year 2009 compared to Fiscal Year 2008
The tables below summarize the changes in our active customer base by geographic region asof the dates indicated.
Change from Percent
Prior Year Change
North America:United States............................... 63,000 31.8% 57,000 28.6% (6,000) (9.5%)Canada.......................................... 29,000 14.6% 25,000 12.6% (4,000) (13.8%)Mexico.......................................... 15,000 7.6% 15,000 7.5% - 0.0%
North America Total.............. 107,000 54.0% 97,000 48.7% (10,000) (9.3%)
Asia Pacific:Southeast Asia/Pacific............... 44,000 22.2% 46,000 23.1% 2,000 4.5%Greater China.............................. 40,000 20.2% 48,000 24.2% 8,000 20.0%North Asia................................... 7,000 3.6% 8,000 4.0% 1,000 14.3%
Asia Pacific Total..................... 91,000 46.0% 102,000 51.3% 11,000 12.1%
198,000 100.0% 199,000 100.0% 1,000 0.5%
Active Associates By Region
As of As of
January 3, 2009 January 2, 2010
Change from Percent
Prior Year Change
North America:United States............................... 43,000 60.6% 39,000 58.2% (4,000) (9.3%)Canada.......................................... 16,000 22.5% 16,000 23.9% - 0.0%Mexico.......................................... 3,000 4.2% 3,000 4.5% - 0.0%
North America Total.............. 62,000 87.3% 58,000 86.6% (4,000) (6.5%)
Asia Pacific:Southeast Asia/Pacific............... 7,000 9.9% 7,000 10.4% - 0.0%Greater China.............................. 1,000 1.4% 1,000 1.5% - 0.0%North Asia................................... 1,000 1.4% 1,000 1.5% - 0.0%
Asia Pacific Total..................... 9,000 12.7% 9,000 13.4% - 0.0%
, . , . , .
Active Preferred Customers By Region
As of As of
January 3, 2009 January 2, 2010

8/3/2019 USANA 2010 Annual Report
http://slidepdf.com/reader/full/usana-2010-annual-report 55/104
53
Change from Percent
Prior Year Change
North America:United States............................... 106,000 39.4% 96,000 36.1% (10,000) (9.4%)Canada.......................................... 45,000 16.7% 41,000 15.4% (4,000) (8.9%)
Mexico.......................................... 18,000 6.7% 18,000 6.8% - 0.0%North America Total.............. 169,000 62.8% 155,000 58.3% (14,000) (8.3%)
Asia Pacific:Southeast Asia/Pacific............... 51,000 19.0% 53,000 19.9% 2,000 3.9%Greater China.............................. 41,000 15.2% 49,000 18.4% 8,000 19.5%North Asia................................... 8,000 3.0% 9,000 3.4% 1,000 12.5%
Asia Pacific Total..................... 100,000 37.2% 111,000 41.7% 11,000 11.0%
, . , . , .
Total Active Customers By Region
As of As of
January 3, 2009 January 2, 2010
Net Sales
The following table summarizes the changes in our net sales by geographic region for the fiscalyears ended January 3, 2009 and January 2, 2010:
Net Sales by Region
(in thousands)
Year Ended
2008* 2009
Change
from prior
year
Percent
change
Approximate
impact of
currency
exchange
Change
excluding the
impact of
currency
exchange
North America:
United States... .... 161,194$ 37.6% 151,663$ 34.7% (9,531)$ (5.9%) $ N/A (5.9%)Canada....... ..... ..... . 74,979 17.5% 65,682 15.1% (9,297) (12.4%) (4,800) (6.0%)
Mexico...... ............ 23,630 5.5% 22,384 5.1% (1,246) (5.3%) (4,900) 15.5%
North America
Total... ..... ..... . 259,803 60.6% 239,729 54.9% (20,074) (7.7%) (9,700) (4.0%)
Asia Pacific:
Southeast Asia/ 91,348 21.3% 95,185 21.8% 3,837 4.2% (6,300) 11.1%
Pacific................
Greater China...... 61,410 14.3% 81,455 18.6% 20,045 32.6% (800) 33.9%
North Asia........... 16,451 3.8% 20,571 4.7% 4,120 25.0% (300) 26.9%
Asia Pacific
Total... ..... ..... . 169,209 39.4% 197,211 45.1% 28,002 16.5% (7,400) 20.9%
429,012$ 100.0% 436,940$ 100.0% 7,928$ 1.8% (17,100)$ 5.8%
*Fiscal year 2008 was a 53-week year resulting in one additional week of sales, which amounted to nearly $7.0 million.
North America: Fiscal 2009 was the first time in several years that net sales in North America were negatively affected by changes in currency exchange rates. The overall negative effect of currency fluctuations in 2009, when compared with 2008, accounted for nearly half of the $20.1

8/3/2019 USANA 2010 Annual Report
http://slidepdf.com/reader/full/usana-2010-annual-report 56/104
54
million decline in net sales in this region. Further changes in net sales in this region were due toreduced product sales related to an overall decrease in the number of active Associates andPreferred Customers. We believe that this decrease in the number of Associates and PreferredCustomers was largely due to difficult economic conditions in both the U.S. and Canada. As amanufacturer of premium products, we believe that the economic impact on consumer spending affected our ability to attract and retain Associates, Preferred Customers, and other consumers of
our products. We also believe that, due to the international nature of our business and our globalseamless Compensation Plan, many of our North American-based Associates were pursuing theopportunity to grow their business in markets outside of North America. We believe that this shiftalso negatively affected our sales and Associate growth in North America.
Net sales in local currency for the United States and Canada, our largest individual markets in2009, decreased 5.9% and 6.0%, respectively. These declines were due to fewer Associates andPreferred Customers purchasing our products in 2009. Additionally, we experienced a slightdecrease in the average product order size from many of our new Associates, primarily on theirinitial purchase. We believe this was due to the difficult economic conditions and the related effecton consumers, as well as from the matching bonus portion of our Compensation Plan. Net sales inMexico, however, increased 15.5% in local currency due primarily to an increase in the number of
Associates purchasing our products throughout most of 2009.
Asia Pacific: Sales growth in this region was also negatively affected by currency fluctuations, which reduced net sales in 2009 by approximately $7.4 million. Local currency sales growth,however, outpaced the negative effect of currency changes, resulting in a net sales increase of 16.5% in 2009. This increase in net sales in Asia Pacific was due mainly to higher product sales volume, resulting from double-digit, year-over-year increases in the number of active Associatesduring 2009. This increase in the number of active Associates came from Hong Kong, Malaysia,South Korea, and the Philippines. Similar to North America, we experienced a slight decrease inthe average product order size from many of our new Associates, primarily on their initial purchase. We believe this was primarily due to the matching bonus portion of our Compensation Plan.
Gross Profit
Gross profit in 2009 increased slightly to 79.4% of net sales, compared with 79.3% in 2008. This increase in gross profit margin was primarily the result of lower relative freight costs and selectproduct price increases. These improvements, however, were partially offset by increased costs of certain raw materials.
Associate Incentives
As a percentage of net sales, Associate incentives increased to 44.9% in 2009, compared with41.6% in 2008. This increase was due to the full-year effect of Compensation Plan enhancementsthat were introduced at the end of the third quarter of 2008.
Selling, General and Administrative Expenses
Selling, general and administrative expenses decreased to 22.9% of net sales in 2009, from26.5% in 2008. In absolute terms, our selling, general and administrative expenses decreased by $13.8 million. The most significant components of this decrease in absolute terms were as follows:
• An unanticipated arbitration award of $7.0 million that took place in 2008;
• A decrease in non-recurring legal and other professional fees of approximately $3.8 million;

8/3/2019 USANA 2010 Annual Report
http://slidepdf.com/reader/full/usana-2010-annual-report 57/104
55
• A decrease in wage-related expenses of approximately $2.1 million; and
• A decrease in promotional expenses of approximately $1.0 million.
The aggregate decrease in selling, general and administrative expenses listed above was partially offset by an increase in equity-based compensation expense of approximately $1.4 million.
Other Income (Expense)Other income (expense) improved by $1.9 million. The largest component of this change was
a $0.5 million gain relating to foreign currency exchange on intercompany transactions during 2009,compared with a $1.0 million loss during 2008.
Income Taxes
Income taxes totaled 34.2% of earnings before income taxes in 2009, compared with 35.4% in2008. This decrease was primarily due to increased tax benefits from a research tax credit.

8/3/2019 USANA 2010 Annual Report
http://slidepdf.com/reader/full/usana-2010-annual-report 58/104
56
Quarterly Financial Information (Unaudited)
The following tables set forth unaudited quarterly operating results for each of the last eightfiscal quarters, as well as percentages of net sales for certain data for the periods indicated. Thisinformation is consistent with the Consolidated Financial Statements herein and includes normally recurring adjustments that management considers to be necessary for a fair presentation of the data.
Quarterly results are not necessarily indicative of future results of operations. This informationshould be read in conjunction with the audited Consolidated Financial Statements and notes theretothat are included elsewhere in this report.
April 4, uly 4, Oct. 3, Jan. 2, April 3, uly 3, Oct. 2, an. 1,
2009 2009 2009 2010 2010 2010 2010 2011
Consolidated Statements of
Earnings Data:
Net sales........................................... 97,299$ 112,093$ 110,764$ 116,784$ 119,087$ 126,011$ 135,006$ 137,540$
Cost of sales.................................... 19,846 23,753 22,637 23,567 23,020 22,735 25,157 24,570
Gross profit..................................... 77,453 88,340 88,127 93,217 96,067 103,276 109,849 112,970
Operating expenses:
Associate incentives............... 41,890 50,321 50,799 53,353 54,118 57,065 60,560 61,444 Selling, general, and
administrative.......................... 25,330 24,719 25,414 24,520 27,458 29,149 30,751 33,401
Total operating
expenses...................... 67,220 75,040 76,213 77,873 81,576 86,214 91,311 94,845
Earnings from operations.............. 10,233 13,300 11,914 15,344 14,491 17,062 18,538 18,125
Other income (expense), net......... (90) 125 110 42 339 (587) 551 345
Earnings from operations
before income taxes................... 10,143 13,425 12,024 15,386 14,830 16,475 19,089 18,470
Income taxes................................... 3,497 4,634 4,112 5,179 5,189 5,705 6,240 6,079
Net earnings.................................... 6,646 8,791 7,912 10,207 9,641 10,770 12,849 12,391
Earnings per common share*:
Basic............................................. 0.43$ 0.57$ 0.52$ 0.67$ 0.63$ 0.70$ 0.83$ 0.78$Diluted.... .. .. .. .. .. .. .. .. .. .. .. .. .. .. .. .. .. .. . 0.43$ 0.57$ 0.51$ 0.66$ 0.62$ 0.69$ 0.79$ 0.75$
Weighted average shares
outstanding:
Basic............................................. 15,350 15,350 15,345 15,314 15,311 15,318 15,562 15,920
Diluted......................................... 15,382 15,385 15,547 15,558 15,513 15,697 16,247 16,479
* Earnings per common share is computed independently for each of the quarters presented. Therefore, the sum of the
quarterly earnings per share amounts does not necessarily equal the total for the year.
Quarter Ended
(in thousands, except per share data)

8/3/2019 USANA 2010 Annual Report
http://slidepdf.com/reader/full/usana-2010-annual-report 59/104
57
April 4, uly 4, Oct. 3, Jan. 2, April 3, uly 3, Oct. 2, an. 1,
2009 2009 2009 2010 2010 2010 2010 2011
Consolidated Statements of
Earnings as a percent
Net Sales:
Net sales........................................... 100.0% 100.0% 100.0% 100.0% 100.0% 100.0% 100.0% 100.0%
Cost of sales.... .. .. .. .. .. .. .. .. .. .. .. .. .. .. .. .. 20.4 21.2 20.4 20.2 19.3 18.0 18.6 17.9
Gross profit.. .. .. .. .. .. .. .. .. .. .. .. .. .. .. .. .. .. . 79.6 78.8 79.6 79.8 80.7 82.0 81.4 82.1
Operating expenses:
Associate incentives. ... .... ... .. .. 43.1 44.9 45.9 45.7 45.4 45.3 44.9 44.7
Selling, general
and administrative.............. 26.0 22.0 22.9 21.0 23.1 23.1 22.8 24.3
Total operating
expenses.............. .... .... 69.1 66.9 68.8 66.7 68.5 68.4 67.7 69.0
Earnings from operations... ... .. .. .. .. 10.5 11.8 10.8 13.1 12.2 13.6 13.7 13.1
Other income (expense), net... .. .. .. (0.1) 0.1 0.1 0.0 0.3 (0.5) 0.4 0.3
Earnings from operations
before income taxes. ... .... .... ... .. .. 10.4 11.9 10.9 13.1 12.5 13.1 14.1 13.4
Income taxes... ... .. .. .. .... .... ... .... .... .... 3.6 4.1 3.8 4.4 4.4 4.5 4.6 4.4 Net earnings.................................... 6.8% 7.8% 7.1% 8.7% 8.1% 8.6% 9.5% 9.0%
Quarter Ended
We may experience variations in the results of operations from quarter to quarter as a result of factors that include the following :
• The recruiting and retention of Associates and Preferred Customers;
• The opening of new markets;
• The timing of Company-sponsored events, contests, and promotions;
• Fluctuations in currency exchange rates;
• New product introductions;
• The timing of holidays, which may reduce the amount of time that our Associates spendselling products or recruiting new Associates;
• The negative impact of changes in or interpretations of regulations that may limit orrestrict the sale of certain products in some countries;
• The adverse effect of a failure by us or an Associate (or allegations of such failure) tocomply with applicable governmental regulations;
• The integration and operation of new information technology systems;
• The inability to introduce new products or the introduction of new products by
competitors;• Entry into one or more of our markets by competitors;
• Availability of raw materials;
• General conditions in the nutritional supplement, personal care, and weight-managementindustries or the network marketing industry; and
• Consumer perceptions of our products and operations.

8/3/2019 USANA 2010 Annual Report
http://slidepdf.com/reader/full/usana-2010-annual-report 60/104
58
Because our products are ingested by consumers or applied to their bodies, we are highly dependent upon consumers’ perception of the safety, quality, and efficacy of our products andnutritional supplements in general. As a result, substantial negative publicity, whether founded orunfounded, concerning one or more of our products or of other products that are similar to ourproducts could adversely affect our business, financial condition, or results of operations.
As a result of these and other factors, quarterly revenues, expenses, and results of operationscould vary significantly in the future, and period-to-period comparisons should not be relied uponas indications of future performance. There can be no assurance that we will be able to increaserevenues in future periods or be able to sustain the level of revenue or rate of revenue growth on aquarterly or annual basis that we have sustained in the past. Due to the foregoing factors, futureresults of operations could be below the expectations of public market analysts and investors. If that occurs, the market price of our common stock would likely decline.
Liquidity and Capital Resources
We have historically met our working capital and capital expenditure requirements by using both net cash flow from operations and by drawing from our line of credit. Our principal source of liquidity is our operating cash flow. There are no material restrictions on our ability to transfer andremit funds among our international markets.
Operating cash flow
We typically generate positive cash flow due to our strong operating margins. Net cash flow from operating activities totaled $66.1 million in 2010, compared with $32.5 million in 2009. Themost significant factors of this change were an increase in net sales and net earnings in 2010, theunfavorable effect of $14.4 million in payments made during 2009 for an unanticipated arbitrationaward and an IRS tax settlement, and an increase in other liabilities related to an increase indeferred revenue and accrued associate incentives and employee compensation. The overallimprovement in operating cash flow was partially offset by increased cash spent on the buildup of inventory to accommodate higher sales and by an increase in prepaid expenses and other currentassets.
As a U.S.-based, multi-national company, reporting in U.S. dollars, our net sales and earningscan be significantly affected by changes in currency exchange rates and it is difficult to estimate theimpact that these changes may have on our future operating results. In general, our reported salesand earnings are affected positively by a weakening of the U.S. dollar and negatively by astrengthening of the U.S. dollar relative to the currencies in the countries where we haveoperations. During 2010, we received a benefit to net sales of approximately $21.0 million relatedto changes in currency exchange rates.
Acquisition of BabyCare
On August 16, 2010, we indirectly acquired BabyCare, a direct selling company in China, for$62.7 million. The purchase price consisted of $28.5 million from our existing cash balance, $16.5million from our line of credit, and 400,000 shares of our common stock.
Line of credit
We currently maintain a $40.0 million credit facility with Bank of America. As of January 1,2011, our balance on this line of credit had been paid in full. During 2010, this line of credit was

8/3/2019 USANA 2010 Annual Report
http://slidepdf.com/reader/full/usana-2010-annual-report 61/104
59
primarily utilized for repurchase of our common stock and to partially fund our acquisition of BabyCare.
The agreement for the line of credit contains restrictive covenants, which require us tomaintain a consolidated rolling, four-quarter adjusted earnings before interest, taxes, depreciationand amortization (“adjusted EBITDA”) equal to or greater than $50.0 million, and a ratio of
consolidated funded debt to adjusted EBITDA of 2.5 to 1.0 at the end of each quarter. Theadjusted EBITDA under this agreement includes a modification for certain additional non-cashexpenses. As of January 1, 2011, we were in compliance with these covenants. Management is notaware of any issues currently impacting Bank of America’s ability to honor their commitment toextend credit under this facility.
The line of credit expires in May 2011, at which time we will be required to pay any outstanding balance unless the line is replaced or terms are renegotiated. We are currently in theprocess of evaluating options for replacing or renewing this line of credit. There can be noassurance that we will be able to secure the same or similar credit terms on a new line of credit orthat we will have the same amount available to us.
Working capital
Cash and cash equivalents increased to $24.2 million at January 1, 2011, from $13.7 million at January 2, 2010. Net working capital increased to $22.6 million at January 1, 2011, from $11.4million at January 2, 2010. This increase in cash and cash equivalents was due primarily to anincrease in net cash flow from operating activities and also from proceeds on equity awards that were exercised. These improvements to cash and cash equivalents and working capital were offsetin large part by our acquisition of BabyCare, as well as by share repurchases and the net paymentsmade on our line of credit.
Share repurchase
We have a share repurchase plan that has been ongoing since the fourth quarter of 2000. Our
Board of Directors has periodically approved additional dollar amounts for share repurchases underthat plan. Share repurchases are made from time-to-time, in the open market, through block tradesor otherwise, and are based on market conditions, the level of cash balances, general businessopportunities, and other factors. During 2010, we repurchased and retired 387 thousand shares of common stock for a total investment of $17.0 million, at an average market price of $43.99 pershare. Also during 2010, our Board of Directors authorized an additional $40.0 million for sharerepurchases under the plan. As of January 1, 2011, the remaining approved repurchase amountunder the plan was $31.7 million and there is no requirement for future share repurchases.
Summary
We believe that current cash balances, future cash provided by operations, and amounts
available under our line of credit will be sufficient to cover our operating and capital needs in theordinary course of business for the foreseeable future. If we experience an adverse operating environment or unusual capital expenditure requirements, additional financing may be required.No assurance can be given, however, that additional financing, if required, would be available or onfavorable terms. We might also require or seek additional financing for the purpose of expanding new markets, growing our existing markets, or for other reasons. Such financing may include theuse of additional debt or the sale of additional equity securities. Any financing which involves the

8/3/2019 USANA 2010 Annual Report
http://slidepdf.com/reader/full/usana-2010-annual-report 62/104
60
sale of equity securities or instruments that are convertible into equity securities could result inimmediate and possibly significant dilution to our existing shareholders.
Contractual Obligations and Commercial Contingencies
The following table summarizes our expected contractual obligations and commitmentssubsequent to January 1, 2011:
Contractual Obligations Total
than 1
year 1-3 years 3-5 years
than 5
years
Operating Leases...................................... 12,006$ 4,963$ 5,884$ 834$ 325$Capital Commitments.............................. 304 304 - - - Other Commitments .............................. 12,230 5,936 6,292 2 - Line of Credit............................................ 34 34 -
otal Contractual Obligations................ 24,574 11,237 12,176 836 325
Payments Due By Period(in thousands)
“Operating Leases” generally provide that property taxes, insurance, and maintenance expensesare the responsibility of the Company. Such expenses are not included in the operating leaseamounts that are outlined in the table above.
“Other Commitments” include consulting- and IT-related services, corporate and athletesponsorships, facility maintenance, services related to the events that we hold for our Associatesboth locally and internationally, and uncertain tax positions. Additionally, throughout the year we will enter into various short-term contracts, mostly for services related to events that we hold forour Associates.
The “Line of Credit” has a maturity date of May 2011. Although we currently have no balanceoutstanding on this line of credit, fees on the unused portion of this line are due periodically and are
reflected in the table above. If we utilize this line of credit prior to its maturity, we will be requiredto pay it in full at maturity.
Inflation
We do not believe that inflation has had a material impact on our historical operations orprofitability.
Critical Accounting Estimates
Our Consolidated Financial Statements included in this report have been prepared inaccordance with accounting principles generally accepted in the United States of America (USGAAP). Our significant accounting policies are described in Note A to the Consolidated Financial
Statements herein. The preparation of financial statements in accordance with US GAAP requiresmanagement to make estimates and assumptions that affect the amounts reported in theconsolidated financial statements and accompanying footnotes. Those estimates and assumptionsare derived and are continually evaluated based on our historical experiences, current facts andcircumstances, and on changes in the business environment. Actual results, however, may sometimes differ materially from estimates under different conditions. Critical accounting estimatesare defined as both those that are material to the portrayal of our financial condition and results of
8/3/2019 USANA 2010 Annual Report
http://slidepdf.com/reader/full/usana-2010-annual-report 63/104
61
operations and those that require management’s most subjective judgments. We believe that ourmost critical accounting estimates are described in this section.
Revenue Recognition.
• Revenue is recognized at the estimated point of delivery of the merchandise, at which pointthe risks and rewards of ownership have passed to the customer. Revenue is realizable when the following four criteria are met: persuasive evidence of a sale arrangement exists,delivery of the product has occurred, the price is fixed or determinable, and payment isreasonably assured. We require cash or credit card payment prior to shipping and do notextend credit to customers.
• Payments received for undelivered products are recorded as deferred revenue and areincluded in other current liabilities.
• A provision for product returns and allowances is established and is based on our historicalexperience.
• Amounts billed to customers for shipping and handling are classified as revenue.
• Commissions paid to an Associate on his or her own orders are captured and reported as areduction to net sales in the form of a sales discount. Management estimates, based on thestructure of USANA’s Compensation Plan, that an Associate who places an order withsales volume points in a personal sales position will eventually be paid commission on thatpurchase. Such reduction of revenue for Associates outside of the United States isconverted to U.S. Dollars at the average currency exchange rate for the applicable period.
• We collect an annual renewal fee from our Associates that is deferred when it is collectedand is recognized as income on a straight-line basis over the subsequent twelve-monthperiod.
Inventory Valuation. Inventories are stated at the lower of cost or market, using the first-in,first-out method. The components of inventory cost include raw materials, labor, and overhead.Inventories are assessed to ensure that they are valued at estimated market value using variousassumptions in regard to excess or slow-moving inventories, non-conforming inventories,expiration dates, current and future product demand, production planning, and market conditions. A change in any of these variables could result in an adjustment to inventory.
Impairment of Long-Lived Assets, Goodwill, and Other Intangible Assets. Long-livedassets are reviewed for impairment to determine whether events or changes in circumstances existthat indicate the carrying amount of the assets may not be recoverable. A long-lived asset isconsidered to be impaired when the carrying amount of an asset exceeds its fair value. Events orchanges in circumstances that would indicate the need for impairment testing include, among otherfactors: operating losses; unused capacity; market value declines; technological developments
resulting in obsolescence; changes in demand for products manufactured; changes in competitionand competitive practices; uncertainties associated with the world economies; and changes ingovernmental regulations or actions.
Goodwill represents the excess of purchase price paid over the fair market value of identifiablenet assets of companies acquired. Goodwill is not amortized, but rather it is tested at least annually for impairment (or more frequently if triggering events or changes in circumstances indicateimpairment). An impairment loss is recognized to the extent that the carrying amount exceeds the

8/3/2019 USANA 2010 Annual Report
http://slidepdf.com/reader/full/usana-2010-annual-report 64/104
62
reporting unit’s fair value. In order to estimate the fair value of goodwill, we primarily use thediscounted cash flow model, known as the income approach. The income approach requires theuse of estimates and assumptions in projecting future operating results and related cash flows. Thedetermination of impairment is made at the reporting unit level and consists of two steps. The firststep involves testing for impairment of goodwill by estimating the fair values of reporting units. If the carrying amount of goodwill exceeds its fair value, the second step of the impairment test is
performed to measure the amount of the impairment loss. In the second step, the implied fair value of the goodwill is estimated as the fair value of the reporting unit as determined in step one,less fair values of all other net tangible and intangible assets of the reporting unit. If the carrying amount of the goodwill exceeds its implied fair value, an impairment loss is recognized in anamount equal to that excess, not to exceed the carrying amount of the goodwill. Fair value of eachof the reporting units at January 1, 2011 was greater than the carrying amount; therefore, noimpairment was recorded.
Other intangible assets represent definite-lived and indefinite-lived intangible assets acquired inconnection with the purchase of BabyCare effective August 16, 2010. Definite-lived intangibleassets are amortized over their related useful lives and are tested for impairment if events orchanges in circumstances indicate impairment. Indefinite-lived intangible assets are not amortized;
however, they are tested at least annually for impairment or more frequently if events or changes incircumstances indicate impairment. There have been no events or changes in circumstances thathave occurred subsequent to the acquisition of the indefinite-lived assets that would indicateimpairment.
Accounting for Income Taxes. Income taxes are calculated in each of the jurisdictions in which we operate. This process involves estimating our current tax exposure, together withassessing temporary differences for items treated differently for tax and financial reporting. Taxbenefits are recognized from uncertain tax positions only if it is more likely than not that the taxposition will be sustained on examination by the taxing authorities, based on the technical merits of the position. The tax benefits recognized in the financial statements from such a position are
measured based on the largest benefit that has a greater than fifty percent likelihood of being realized upon ultimate resolution. Judgment is required in assessing the future tax consequences of events that have been recognized in our financial statements or tax returns. Variations in the actualoutcome of these future tax consequences could materially impact our financial position, results of operations, or cash flows. Additional information regarding income taxes is available in Note E tothe Consolidated Financial Statements herein.
On an interim basis, an estimate is made of what our effective tax rate will be for the full fiscalyear, and a quarterly income tax provision in accordance with this anticipated effective rate isrecorded. As the fiscal year progresses, we continually refine our estimate based upon actual eventsand earnings by jurisdiction during the year. This estimation process periodically results in changesto our expected effective tax rate for the fiscal year. When this occurs, we adjust the income tax
provision during the quarter in which the change in estimate occurs so that the year-to-dateprovision equals the expected annual rate.
Equity-Based Compensation. We record compensation expense in the financial statementsfor equity-based awards based on the grant date fair value and an estimate of forfeitures derived fromhistorical experience. Equity-based compensation expense is recognized on a straight-line basis overthe requisite service period, which is generally the vesting period. For more information regarding the
8/3/2019 USANA 2010 Annual Report
http://slidepdf.com/reader/full/usana-2010-annual-report 65/104
63
assumptions and estimates used in calculating this equity-based compensation expense, see Note K to the Consolidated Financial Statements herein.
Item 7A. Quantitative and Qualitative Disclosures About Market Risk
Our earnings, cash flows, and financial position are affected by fluctuations in currency exchange rates, interest rates, and other uncertainties that are inherent in doing business and selling
product in more than one currency. In addition, our operations are exposed to risks that areassociated with changes in social, political, and economic conditions in our international operations. This includes changes in the laws and policies that govern investment in international countries where we have operations, as well as, to a lesser extent, to changes in United States laws andregulations relating to international trade and investment.
Foreign Currency Risks. Net sales outside the United States represented 62.4%, 65.3%, and70.9% of our net sales in 2008, 2009, and 2010, respectively. Because a significant portion of oursales are generated outside the United States, currency exchange rate fluctuations may have asignificant effect on our sales and earnings. This risk is partially mitigated by the fact that our salesare spread across 15 markets, with Hong Kong (where the local currency is tied to the U.S. dollar)being our largest international market, at 23.5% of net sales in 2010, followed by Canada at 13.4%. The local currency of each international subsidiary is considered the functional currency, with allrevenue and expenses being translated at weighted-average currency exchange rates for theapplicable periods. In general, our reported sales and earnings are affected positively by a weakening of the U.S. dollar and negatively by a strengthening of the U.S. dollar. Changes incurrency exchange rates may also affect our product margins, because we manufacture the majority of our products in the U.S. and sell them to our international subsidiaries in their respectivefunctional currencies. We are unable to reasonably estimate the effect that currency fluctuationsmay have on our future business, results of operations, or financial condition. This is due to theuncertainty in, and the varying degrees and type of exposure that we face from, fluctuations in various currencies.
At times we have sought to reduce exposure to fluctuations in currency exchange rates by creating offsetting positions through the use of currency exchange contracts on cash that werepatriate. We do not use derivative financial instruments for trading or speculative purposes. Wehave also considered the costs and benefits of managing currency impacts on net sales and certainbalance sheet items. There can be no assurance that our practices will be successful in eliminating all or substantially all of the risks that may be encountered in connection with our currency transactions. As of January 1, 2011, we had no currency exchange contracts in place.
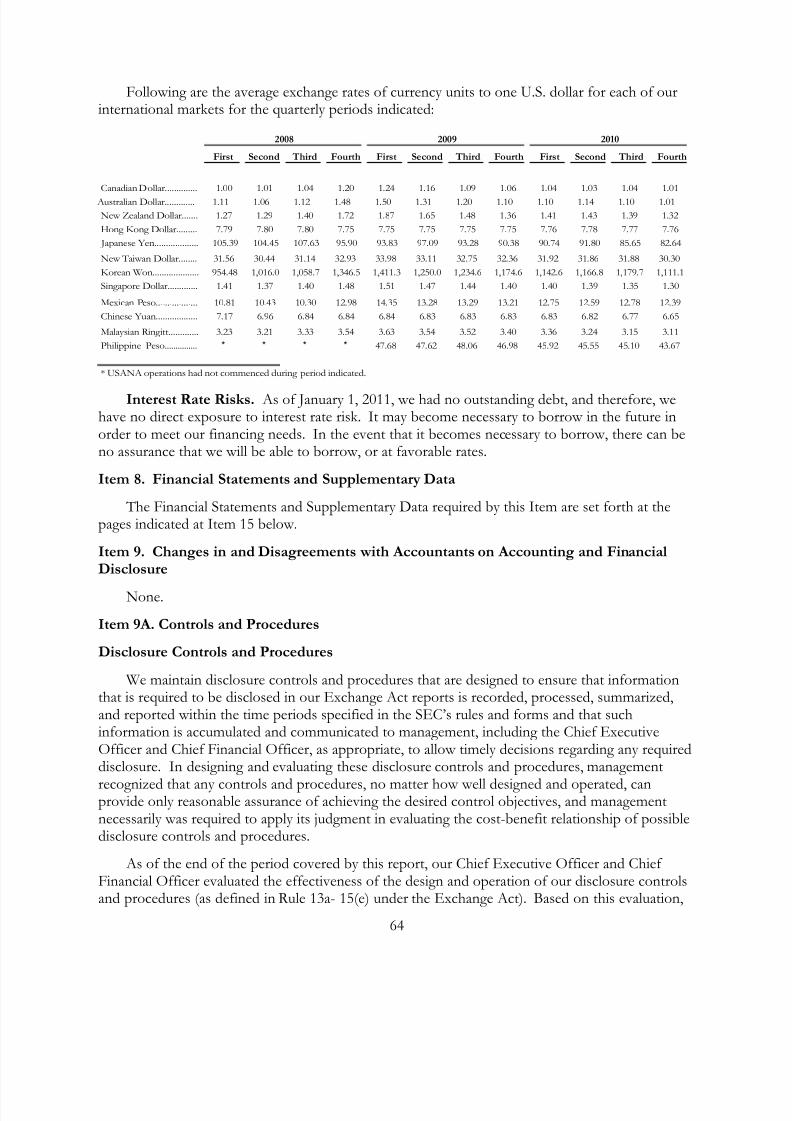
8/3/2019 USANA 2010 Annual Report
http://slidepdf.com/reader/full/usana-2010-annual-report 66/104
64
Following are the average exchange rates of currency units to one U.S. dollar for each of ourinternational markets for the quarterly periods indicated:
2008 2009 2010
First Second Third Fourth First Second Third Fourth First Second Third Fourth
Canadian Dollar.............. 1.00 1.01 1.04 1.20 1.24 1.16 1.09 1.06 1.04 1.03 1.04 1.01
Australian Dollar............. 1.11 1.06 1.12 1.48 1.50 1.31 1.20 1.10 1.10 1.14 1.10 1.01
New Zealand Dollar....... 1.27 1.29 1.40 1.72 1.87 1.65 1.48 1.36 1.41 1.43 1.39 1.32
Hong Kong Dollar......... 7.79 7.80 7.80 7.75 7.75 7.75 7.75 7.75 7.76 7.78 7.77 7.76
Japanese Yen................... 105.39 104.45 107.63 95.90 93.83 97.09 93.28 90.38 90.74 91.80 85.65 82.64
New Taiwan Dollar........ 31.56 30.44 31.14 32.93 33.98 33.11 32.75 32.36 31.92 31.86 31.88 30.30
Korean Won.................... 954.48 1,016.0 1,058.7 1,346.5 1,411.3 1,250.0 1,234.6 1,174.6 1,142.6 1,166.8 1,179.7 1,111.1
Singapore Dollar............. 1.41 1.37 1.40 1.48 1.51 1.47 1.44 1.40 1.40 1.39 1.35 1.30
Mexican Peso.................. 10.81 10.43 10.30 12.98 14.35 13.28 13.29 13.21 12.75 12.59 12.78 12.39
Chinese Yuan.................. 7.17 6.96 6.84 6.84 6.84 6.83 6.83 6.83 6.83 6.82 6.77 6.65
Malaysian Ringitt............. 3.23 3.21 3.33 3.54 3.63 3.54 3.52 3.40 3.36 3.24 3.15 3.11
Philippine Peso............... * * * * 47.68 47.62 48.06 46.98 45.92 45.55 45.10 43.67
* USANA operations had not commenced during period indicated.
Interest Rate Risks. As of January 1, 2011, we had no outstanding debt, and therefore, wehave no direct exposure to interest rate risk. It may become necessary to borrow in the future inorder to meet our financing needs. In the event that it becomes necessary to borrow, there can beno assurance that we will be able to borrow, or at favorable rates.
Item 8. Financial Statements and Supplementary Data
The Financial Statements and Supplementary Data required by this Item are set forth at thepages indicated at Item 15 below.
Item 9. Changes in and Disagreements with Accountants on Accounting and FinancialDisclosure
None.
Item 9A. Controls and Procedures
Disclosure Controls and Procedures
We maintain disclosure controls and procedures that are designed to ensure that informationthat is required to be disclosed in our Exchange Act reports is recorded, processed, summarized,and reported within the time periods specified in the SEC’s rules and forms and that suchinformation is accumulated and communicated to management, including the Chief ExecutiveOfficer and Chief Financial Officer, as appropriate, to allow timely decisions regarding any requireddisclosure. In designing and evaluating these disclosure controls and procedures, management
recognized that any controls and procedures, no matter how well designed and operated, canprovide only reasonable assurance of achieving the desired control objectives, and managementnecessarily was required to apply its judgment in evaluating the cost-benefit relationship of possibledisclosure controls and procedures.
As of the end of the period covered by this report, our Chief Executive Officer and Chief Financial Officer evaluated the effectiveness of the design and operation of our disclosure controlsand procedures (as defined in Rule 13a- 15(e) under the Exchange Act). Based on this evaluation,

8/3/2019 USANA 2010 Annual Report
http://slidepdf.com/reader/full/usana-2010-annual-report 67/104
65
the Chief Executive Officer and Chief Financial Officer concluded that the disclosure controls andprocedures were effective to provide reasonable assurance as of January 1, 2011.
Management’s Report on Internal Control Over Financial Reporting
Our management is responsible for establishing and maintaining adequate internal control overfinancial reporting, (as defined in Rule 13a- 15(f) under the Exchange Act). The Company’s
internal control over financial reporting is designed to provide reasonable assurance regarding thereliability of financial reporting and the preparation of the Company’s financial statements forexternal purposes in accordance with generally accepted accounting principles. Internal controlover financial reporting includes those policies and procedures that:
• Pertain to the maintenance of records that, in reasonable detail, accurately and fairly reflectthe transactions and dispositions of the assets of the Company;
• Provide reasonable assurance that transactions are recorded, as necessary, to permitpreparation of financial statements in accordance with generally accepted accounting principles and that receipts and expenditures of the Company are being made only inaccordance with authorizations of management and directors of the Company; and
• Provide reasonable assurance regarding the prevention or timely detection of any unauthorized acquisition, use or disposition of the Company’s assets that could have amaterial effect on the financial statements.
Because of its inherent limitations, internal control over financial reporting may not prevent ordetect misstatements. Projections of any evaluation of effectiveness to future periods are subject tothe risks that controls may become inadequate because of changes in conditions or that the degreeof compliance with the policies or procedures may deteriorate.
Our management assessed the effectiveness of the Company’s internal control over financialreporting as of January 1, 2011. In making this assessment, management used the criteria that havebeen set forth by the Committee of Sponsoring Organizations of the Treadway Commission
(COSO) in Internal Control-Integrated Framework. Based on its assessment, using those criteria,management concluded that, as of January 1, 2011, the Company’s internal control over financialreporting was effective.
Management’s assessment of the effectiveness of the Company’s internal control over financialreporting excluded BabyCare Holdings, Ltd., which is an entity that the Company indirectly acquired in August 2010. BabyCare represented, in the aggregate, 6.7% and 1.4% of consolidatedtotal assets and consolidated net sales, respectively, of the Company as of and for the year ended January 1, 2011. This acquisition is more fully discussed in Note B to our Consolidated FinancialStatements for the fiscal year ended January 1, 2011.
The effectiveness of the Company’s internal control over financial reporting as of January 1,
2011, has been audited by PricewaterhouseCoopers LLP, an independent registered publicaccounting firm, as stated in their report which appears herein.
Changes in Internal Control Over Financial Reporting There were no changes in our internal controls over financial reporting that occurred during
the quarter ended January 1, 2011, that have materially affected, or that are reasonably likely tomaterially affect, the Company’s internal control over financial reporting.

8/3/2019 USANA 2010 Annual Report
http://slidepdf.com/reader/full/usana-2010-annual-report 68/104
66
Item 9B. Other Information
None.
PART III
Item 10. Directors, Executive Officers and Corporate Governance
The information for this Item is incorporated by reference to the definitive proxy statement tobe filed pursuant to Regulation 14A under the Exchange Act.
Item 11. Executive Compensation
The information for this Item is incorporated by reference to the definitive proxy statement tobe filed pursuant to Regulation 14A under the Exchange Act.
Item 12. Security Ownership of Certain Beneficial Owners and Management and RelatedStockholder Matters
The information for this Item is incorporated by reference to the definitive proxy statement to
be filed pursuant to Regulation 14A under the Exchange Act.Item 13. Certain Relationships and Related Transactions, and Director Independence
The information for this Item is incorporated by reference to the definitive proxy statement tobe filed pursuant to Regulation 14A under the Exchange Act.
Item 14. Principal Accounting Fees and Services
The information for this Item is incorporated by reference to the definitive proxy statement tobe filed pursuant to Regulation 14A under the Exchange Act.
PART IV
Item 15. Exhibits, Financial Statement Schedules
(a) The following documents are filed as part of this Form:
1. Financial Statements
Report of Independent Registered Public Accounting Firm ....................................F-1Consolidated Balance Sheets .........................................................................................F-3Consolidated Statements of Earnings ..........................................................................F-4Consolidated Statements of Stockholders’ Equity and Comprehensive Income ..F-5Consolidated Statements of Cash Flows......................................................................F-6Notes to the Consolidated Financial Statements ........................................................F-7
2. Financial Statement Schedules. For the years ended January 3, 2009, January 2, 2010, and January 1, 2011
Schedule II – Valuation and Qualifying Accounts
3. Exhibits.

8/3/2019 USANA 2010 Annual Report
http://slidepdf.com/reader/full/usana-2010-annual-report 69/104
67
ExhibitNumber Description
3.1 Amended and Restated Articles of Incorporation (incorporated by reference to CurrentReport on Form 8-K, filed April 25, 2006)
3.2 Bylaws (incorporated by reference to Current Report on Form 8-K, filed April 25, 2006)4.1 Specimen Stock Certificate for Common Stock (incorporated by reference to Registration
Statement on Form 10, File No. 0-21116, effective April 16, 1993)
10.1 2002 USANA Health Sciences, Inc. Stock Option Plan (incorporated by reference toRegistration Statement on Form S-8, filed July 18, 2002)*
10.2 Form of employee or director non-statutory stock option agreement under the 2002USANA Health Sciences, Inc. Stock Option Plan (incorporated by reference to AnnualReport on Form 10-K, filed March 6, 2006)*
10.3 Form of employee incentive stock option agreement under the 2002 USANA Health
Sciences, Inc. Stock Option Plan (incorporated by reference to Annual Report on Form 10-K, filed March 6, 2006)*
10.4 Credit Agreement, dated as of June 16, 2004, by and between Bank of America, N.A. andUSANA Health Sciences, Inc. (incorporated by reference to Quarterly Report on Form 10-Q for the period ended July 3, 2004, filed August 5, 2004)
10.5 Amendment to Credit Agreement, dated as of May 17, 2006 (incorporated by reference toQuarterly Report on Form 10-Q for the period ended July 1, 2006, filed August 8, 2006)
10.6 Amendment to Credit Agreement, dated as of April 24, 2007 (incorporated by reference toQuarterly Report on Form 10-Q for the period ended March 31, 2007, filed May 7, 2007)
10.7 USANA Health Sciences, Inc. 2006 Equity Incentive Award Plan (incorporated by reference to Current Report on Form 8-K, filed April 25, 2006)*
10.8 Form of Stock Option Agreement for award of non-statutory stock options to employeesunder the USANA Health Sciences, Inc. 2006 Equity Incentive Award Plan (incorporatedby reference to Current Report on Form 8-K, filed April 26, 2006)*
10.9 Form of Stock Option Agreement for award of non-statutory stock options to directors who are not employees under the USANA Health Sciences, Inc. 2006 Equity Incentive Award Plan (incorporated by reference to Current Report on Form 8-K, filed April 26,2006)*
10.10 Form of Incentive Stock Option Agreement for award of incentive stock options to
employees under the USANA Health Sciences, Inc. 2006 Equity Incentive Award Plan(incorporated by reference to Current Report on Form 8-K, filed April 26, 2006)*
10.11 Form of Stock-Settled Stock Appreciation Rights Award Agreement for award of stock-settled stock appreciation rights to employees under the USANA Health Sciences, Inc. 2006Equity Incentive Award Plan (incorporated by reference to Current Report on Form 8-K,filed April 26, 2006)*

8/3/2019 USANA 2010 Annual Report
http://slidepdf.com/reader/full/usana-2010-annual-report 70/104
68
10.12 Form of Stock-Settled Stock Appreciation Rights Award Agreement for award of stock-settled stock appreciation rights to directors who are not employees under the USANAHealth Sciences, Inc. 2006 Equity Incentive Award Plan (incorporated by reference toCurrent Report on Form 8-K, filed April 26, 2006)*
10.13 Form of Deferred Stock Unit Award Agreement for grants of deferred stock units to
directors who are not employees under the USANA Health Sciences, Inc. 2006 Equity Incentive Award Plan (incorporated by reference to Current Report on Form 8-K, filed April 26, 2006)*
10.14 Form of Indemnification Agreement between the Company and its directors (incorporatedby reference to Current Report on Form 8-K, filed May 24, 2006)*
10.15 Share Purchase Agreement, dated as of August 16, 2010, among USANA Health Sciences,Inc., Petlane, Inc., Yaolan Ltd., and BabyCare Holdings Ltd. (Incorporated by Reference toReport on Form 8-K, filed August 16, 2010)
11.1 Computation of Net Income per Share (included in Notes to Consolidated FinancialStatements)
14 Code of Ethics of USANA Health Sciences, Inc. (posted on the Company’s Internet website at www.usanahealthsciences.com)
21 Subsidiaries of the Registrant, as of March 7, 2011 (filed herewith)
23.1 Consent of Independent Registered Public Accounting Firm (PricewaterhouseCoopersLLP) (filed herewith)
31.1 Certification of Chief Executive Officer pursuant to section 302 of the Sarbanes-Oxley Actof 2002 (filed herewith)
31.2 Certification of Chief Financial Officer pursuant to section 302 of the Sarbanes-Oxley Act
of 2002 (filed herewith)32.1 Certification of Chief Executive Officer pursuant to section 906 of the Sarbanes-Oxley Act
of 2002, 18 U.S.C. Section 1350 (filed herewith)
32.2 Certification of Chief Financial Officer pursuant to section 906 of the Sarbanes-Oxley Actof 2002, 18 U.S.C. Section 1350 (filed herewith)
* Denotes a management contract or compensatory plan or arrangement.

8/3/2019 USANA 2010 Annual Report
http://slidepdf.com/reader/full/usana-2010-annual-report 71/104

8/3/2019 USANA 2010 Annual Report
http://slidepdf.com/reader/full/usana-2010-annual-report 72/104
F-1
REPORT OF INDEPENDENTREGISTERED PUBLIC ACCOUNTING FIRM
To the Board of Directors and Shareholders of USANA Health Sciences, Inc.
In our opinion, the accompanying consolidated balance sheets and the related consolidated
statements of earnings, stockholders' equity and comprehensive income and cash flows presentfairly, in all material respects, the financial position of USANA Health Sciences, Inc. and itssubsidiaries at January 1, 2011 and January 2, 2010, and the results of their operations and their cashflows for each of the three years in the period ended January 1, 2011 in conformity with accounting principles generally accepted in the United States of America. In addition, in our opinion, thefinancial statement schedule listed in the index appearing under item 15(a)(2) presents fairly, in allmaterial respects, the information set forth therein when read in conjunction with the relatedconsolidated financial statements. Also in our opinion, the Company maintained, in all materialrespects, effective internal control over financial reporting as of January 1, 2011, based on criteriaestablished in Internal Control - Integrated Framework issued by the Committee of Sponsoring Organizations of the Treadway Commission (COSO). The Company's management is responsible
for these financial statements and financial statement schedule, for maintaining effective internalcontrol over financial reporting and for its assessment of the effectiveness of internal control overfinancial reporting included in Management's Report on Internal Control Over Financial Reporting appearing under Item 9A. Our responsibility is to express opinions on these financial statements,on the financial statement schedule, and on the Company's internal control over financial reporting based on our integrated audits. We conducted our audits in accordance with the standards of thePublic Company Accounting Oversight Board (United States). Those standards require that weplan and perform the audits to obtain reasonable assurance about whether the financial statementsare free of material misstatement and whether effective internal control over financial reporting wasmaintained in all material respects. Our audits of the financial statements included examining, on atest basis, evidence supporting the amounts and disclosures in the financial statements, assessing
the accounting principles used and significant estimates made by management, and evaluating theoverall financial statement presentation. Our audit of internal control over financial reporting included obtaining an understanding of internal control over financial reporting, assessing the risk that a material weakness exists, and testing and evaluating the design and operating effectiveness of internal control based on the assessed risk. Our audits also included performing such otherprocedures as we considered necessary in the circumstances. We believe that our audits provide areasonable basis for our opinions.
A company’s internal control over financial reporting is a process designed to providereasonable assurance regarding the reliability of financial reporting and the preparation of financialstatements for external purposes in accordance with generally accepted accounting principles. Acompany’s internal control over financial reporting includes those policies and procedures that
(i) pertain to the maintenance of records that, in reasonable detail, accurately and fairly reflect thetransactions and dispositions of the assets of the company; (ii) provide reasonable assurance thattransactions are recorded as necessary to permit preparation of financial statements in accordance with generally accepted accounting principles, and that receipts and expenditures of the company are being made only in accordance with authorizations of management and directors of thecompany; and (iii) provide reasonable assurance regarding prevention or timely detection of

8/3/2019 USANA 2010 Annual Report
http://slidepdf.com/reader/full/usana-2010-annual-report 73/104
F-2
unauthorized acquisition, use, or disposition of the company’s assets that could have a materialeffect on the financial statements.
Because of its inherent limitations, internal control over financial reporting may not prevent ordetect misstatements. Also, projections of any evaluation of effectiveness to future periods aresubject to the risk that controls may become inadequate because of changes in conditions, or that
the degree of compliance with the policies or procedures may deteriorate. As described in Management's Report on Internal Control Over Financial Reporting appearing
under Item 9A, management has excluded BabyCare Holdings, Ltd. from its assessment of internalcontrol over financial reporting as of January 1, 2011 because it was acquired by the Company in August 2010. We have also excluded BabyCare Holdings, Ltd. from our audit of internal controlover financial reporting. BabyCare Holdings, Ltd. is a wholly-owned subsidiary whose total assetsand total revenues represent 6.7% and 1.4%, respectively, of the related consolidated financialstatement amounts as of and for the year ended January 1, 2011.
/s/ PricewaterhouseCoopers LLP
Salt Lake City, UT
March 14, 2011

8/3/2019 USANA 2010 Annual Report
http://slidepdf.com/reader/full/usana-2010-annual-report 74/104
F-3
USANA HEALTH SCIENCES, INC. AND SUBSIDIARIES
CONSOLIDATED BALANCE SHEETS
(in thousands)
As of As of
January 2, January 1,
2010 2011
ASSETS
Current assets
Cash and cash equivalents............................................................................... 13,658$ 24,222$
Inventories......................................................................................................... 25,761 34,078
Prepaid expenses and other current assets................................................... 10,391 20,261
Deferred income taxes..................................................................................... 2,116 1,711
Total current assets....................................................................................... 51,926 80,272
Property and equipment, net.............................................................................. 57,241 57,568
Goodwill................................................................................................................ 5,690 16,930
Intangible assets, net............................................................................................ - 40,616
Other assets.......................................................................................................... 8,581 8,416
123,438$ 203,802$
LIABILITIES AND STOCKHOLDERS' EQUITY
Current liabilities
Accounts payable.............................................................................................. 5,810$ 6,445$
Other current liabilities.................................................................................... 34,668 51,179
Total current liabilities.................................................................................. 40,478 57,624
Line of credit - long term................................................................................... 7,000 -
Other long-term liabilities.................................................................................. 1,587 1,012
Stockholders' equity
Common stock, $0.001 par value; Authorized -- 50,000 shares,
issued and outstanding 15,309 as of January 2, 2010
and 15,985 as of January 1, 2011.................................................................... 15 16
Additional paid-in capital................................................................................ 16,425 51,222
Retained earnings.............................................................................................. 56,410 90,207
Accumulated other comprehensive income................................................. 1,523 3,721
Total stockholders' equity............................................................................ 74,373 145,166
123,438$ 203,802$
The accompanying notes are an integral part of these statements.

8/3/2019 USANA 2010 Annual Report
http://slidepdf.com/reader/full/usana-2010-annual-report 75/104
F-4
USANA HEALTH SCIENCES, INC. AND SUBSIDIARIES
CONSOLIDATED STATEMENTS OF EARNINGS
(in thousands, except per share data)
2008 2009 2010
Net sales......................................................................................... 429,012$ 436,940$ 517,644$
Cost of sales.................................................................................. 88,878 89,803 95,482
Gross profit........................................................................ 340,134 347,137 422,162
Operating expenses:
Associate incentives.............................................................. 178,309 196,363 233,187
Selling, general and administrative...................................... 113,828 99,983 120,759
Total operating expenses.................................................. 292,137 296,346 353,946
Earnings from operations. 47,997 50,791 68,216
Other income (expense):
Interest income...................................................................... 249 82 167
Interest expense..................................................................... (792) (609) (94)
Other, net................................................................................ (1,133) 714 575
Other income (expense), net............................................ (1,676) 187 648
Earnings from operations before income taxes...................... 46,321 50,978 68,864
Income taxes................................................................................. 16,376 17,422 23,213
Net earnings........................................................................... 29,945 33,556 45,651
Earnings per common share
Basic............................................................................................ 1.87$ 2.19$ 2.94$
Diluted........................................................................................ 1.85$ 2.17$ 2.86$
Weighted average common shares outstanding
Basic............................................................................................ 16,048 15,340 15,528
Diluted........................................................................................ 16,163 15,432 15,942
Year ended
The accompanying notes are an integral part of these statements.

8/3/2019 USANA 2010 Annual Report
http://slidepdf.com/reader/full/usana-2010-annual-report 76/104
F-5
USANA HEALTH SCIENCES, INC. AND SUBSIDIARIES
CONSOLIDATED STATEMENTS OF STOCKHOLDERS’ EQUITY ANDCOMPREHENSIVE INCOME
Years ended January 3, 2009; January 2, 2010; and January 1, 2011(in thousands)
Accumulated Additional Other
Paid-in Retained Comprehensive
Shares Value Capital Earnings Income (Loss) Total
Balance at December 29, 2007.......................... 16,198 16$ 5,636$ 26,308$ 989$ 32,949$
Comprehensive income
Net earnings for the year................................ - - - 29,945 - 29,945
Foreign currency translation
adjustment, net of tax benefit of
$1,267............................................................. - - - - (1,364) (1,364)
Comprehensive income.......................... 28,581
Common stock repurchased and retired......... (1,116) (1) (7,726) (32,146) - (39,873)
Equity-based compensation expense............... - - 7,688 - - 7,688
Common stock issued under equity award plans, including tax benefit of
$1,745................................................................. 268 - 2,491 - - 2,491
Balance at January 3, 2009 ................................ 15,350 15$ 8,089$ 24,107$ (375)$ 31,836$
Comprehensive income
Net earnings for the year................................ - - - 33,556 - 33,556
Foreign currency translation
adjustment, net of tax expense of
$1,852............................................................. - - - - 1,898 1,898
Comprehensive income.......................... 35,454
Common stock repurchased and retired......... (54) - (401) (1,253) - (1,654)
Equity-based compensation expense............... - - 8,925 - - 8,925
Common stock issued under equity
award plans, including tax expense of $319.................................................................... 13 - (188) - - (188)
Balance at January 2, 2010................................. 15,309 15$ 16,425$ 56,410$ 1,523$ 74,373$
Comprehensive income
Net earnings for the year................................ - - - 45,651 - 45,651
Foreign currency translation
adjustment, net of tax expense of
$906................................................................ - - - - 2,198 2,198
Comprehensive income.......................... 47,849
Common stock repurchased and retired......... (387) (1) (5,176) (11,854) - (17,031)
Common stock issued in connection
with acquisition................................................ 400 1 17,715 - - 17,716
Equity-based compensation expense............... - - 10,406 - - 10,406 Common stock issued under equity award
plans, including tax expense of $152............ 663 1 11,852 - - 11,853
Balance at January 1, 2011................................. 15,985 16$ 51,222$ 90,207$ 3,721$ 145,166$
Common Stock
The accompanying notes are an integral part of these statements.

8/3/2019 USANA 2010 Annual Report
http://slidepdf.com/reader/full/usana-2010-annual-report 77/104
F-6
USANA HEALTH SCIENCES, INC. AND SUBSIDIARIESCONSOLIDATED STATEMENTS OF CASH FLOWS
(in thousands)
2008 2009 2010
Cash flows from operating activities
Net earnings........................................................................................................... 29,945$ 33,556$ 45,651$ Adjustments to reconcile net earnings to net cash
provided by operating activities
Depreciation and amortization....................................................................... 6,697 7,069 7,916
(Gain) loss on sale of property and equipment............................................ (68) (149) 94
Equity-based compensation expense............................................................. 7,688 8,925 10,406
Excess tax benefits from equity-based payment arrangements................. (2,372) (11) (2,449)
Deferred income taxes..................................................................................... (2,435) (2,296) 3,194
Inventory valuation........................................................................................... 1,000 824 1,275
Changes in operating assets and liabilities:
Inventories...................................................................................................... (7,216) (1,123) (6,257)
Prepaid expenses and other assets.............................................................. (5,306) 1,685 (5,218)
Accounts payable........................................................................................... 686 (1,138) (1,981)
Other liabilities............................................................................................... 17,337 (14,873) 13,477
Total adjustments.......................................................................................... 16,011 (1,087) 20,457
Net cash provided by operating activities................................................. 45,956 32,469 66,108
Cash flows from investing activities
Acquisition, net of cash acquired....................................................................... - - (42,694)
Receipts on notes receivable............................................................................... 726 245 -
Increase in notes receivable................................................................................. (19) (151) -
Proceeds from sale of property and equipment.............................................. 148 837 33
Purchases of property and equipment............................................................... (16,061) (4,128) (4,192)
Net cash used in investing activities........................................................... (15,206) (3,197) (46,853)
Cash flows from financing activities
Proceeds from equity awards exercised............................................................ 746 131 12,005
Excess tax benefits from equity-based payment arrangements..................... 2,372 11 2,449
Repurchase of common stock............................................................................ (39,873) (1,654) (17,031)
Borrowings on line of credit................................................................................ 85,020 57,020 31,150
Payments on line of credit................................................................................... (78,030) (85,010) (38,150)
Net cash used in financing activities.......................................................... (29,765) (29,502) (9,577)
Effect of exchange rate changes on cash and cash equivalents........................ (569) 607 886
Net increase (decrease) in cash and cash equivalents.............................. 416 377 10,564
Cash and cash equivalents, beginning of year...................................................... 12,865 13,281 13,658
Cash and cash equivalents, end of year................................................................. 13,281$ 13,658$ 24,222$
Supplemental disclosures of cash flow information ___________________________________________ Cash paid during the year for:
Interest, net of amount capitalized................................................................. 714$ 552$ 99$
Income taxes...................................................................................................... 19,968 22,817 21,628
Non-cash financing activities
Common stock issued in connection with acquisitions.............................. - - 17,716
Year ended
The accompanying notes are an integral part of these statements.

8/3/2019 USANA 2010 Annual Report
http://slidepdf.com/reader/full/usana-2010-annual-report 78/104
USANA HEALTH SCIENCES, INC. AND SUBSIDIARIESNOTES TO CONSOLIDATED FINANCIAL STATEMENTS
(in thousands, except per share data)
F-7
NOTE A – SUMMARY OF SIGNIFICANT ACCOUNTING POLICIES
Financial statement presentation
The accounting and reporting policies of USANA Health Sciences, Inc. and its subsidiaries (the
Company) conform with accounting principles generally accepted in the United States of America(US GAAP).
Principles of consolidation
The Consolidated Financial Statements include the accounts and operations of USANA HealthSciences, Inc. and its wholly owned subsidiaries in two geographic regions: North America and AsiaPacific, which is further divided into three sub-regions; Southeast Asia/Pacific, Greater China, andNorth Asia. North America includes the United States, Canada, Mexico, and direct sales from theUnited States to the United Kingdom and the Netherlands. Southeast Asia/Pacific includes Australia,New Zealand, Singapore, Malaysia, and the Philippines; Greater China includes Hong Kong, Taiwanand China; and North Asia includes Japan and South Korea. All significant inter-company accounts
and transactions have been eliminated in this consolidation.Business activity
The Company operates in a single operating segment as a direct selling company that develops,manufactures, and distributes high-quality nutritional and personal care products that are sold througha global network marketing system of independent distributors (“Associates”) throughout the UnitedStates (including direct sales from the United States to the United Kingdom and Netherlands),Canada, Mexico, Australia, New Zealand, Singapore, Malaysia, the Philippines, Hong Kong, Taiwan, Japan, South Korea, and as of August 2010, the People’s Republic of China (“China”, “PRC”, or“BabyCare”). No single Associate accounted for more than 10% of net sales for the years ended2008, 2009, or 2010. An immaterial amount of third-party manufacturing is conducted at the
Company’s facility located in Tianjin, China.Fiscal year
The Company operates on a 52-53 week year, ending on the Saturday closest to December 31.Fiscal year 2008 was a 53-week year. Fiscal years 2009 and 2010 were 52-week years. Fiscal year2008 covered the period December 30, 2007 to January 3, 2009 (hereinafter 2008). Fiscal year 2009covered the period January 4, 2009 to January 2, 2010 (hereinafter 2009). Fiscal year 2010 coveredthe period January 3, 2010 to January 1, 2011 (hereinafter 2010).
Use of estimates
The preparation of financial statements in conformity with US GAAP requires management to
make estimates and assumptions that affect the amounts reported in the consolidated financialstatements and the related notes. Significant estimates for the Company relate to revenuerecognition, obsolescence, goodwill, equity-based compensation, and income taxes. Actual resultscould differ from those estimates. These estimates may be adjusted as more current informationbecomes available, and any adjustment could be significant.

8/3/2019 USANA 2010 Annual Report
http://slidepdf.com/reader/full/usana-2010-annual-report 79/104
USANA HEALTH SCIENCES, INC. AND SUBSIDIARIESNOTES TO CONSOLIDATED FINANCIAL STATEMENTS (Continued)
(in thousands, except per share data)
F-8
NOTE A – SUMMARY OF SIGNIFICANT ACCOUNTING POLICIES – CONTINUED
Fair value of financial instruments
The Company’s financial instruments include: cash and cash equivalents, term deposits,
accounts receivable, restricted cash, accounts payable, and a line of credit. The recorded values of cash and cash equivalents, accounts receivable, and accounts payable approximate their fair values,based on their short-term nature. The recorded value of restricted cash is determined based on theprincipal amount and interest accrual. The recorded value of the line of credit approximates fair value as interest adjusts to market based on LIBOR and prime rates.
The Company reports term deposits in accordance with established authoritative guidance, which requires a three-level valuation hierarchy for disclosure of fair value measurements. The valuation hierarchy is based upon the transparency of inputs to the valuation of an asset or liability as of the measurement date.
The three levels are defined as follows:
• Level 1 inputs are quoted market prices in active markets for identical assets or liabilitiesthat are accessible at the measurement date.
• Level 2 inputs are from other than quoted market prices included in Level 1 that areobservable for the asset or liability, either directly or indirectly.
• Level 3 inputs are unobservable and are used to measure fair value in situations where thereis little, if any, market activity for the asset or liability at the measurement date.
The fair values of term deposits placed with banks are determined based on the pervasiveinterest rates in the market, which are also the interest rates as stated in the contracts with thebanks. The Company classifies the valuation techniques that use the pervasive interest rates input as
Level 2. The carrying values of these term deposits approximate their fair values due to their short-term maturities. As of January 1, 2011, the fair value of term deposits in the consolidated balancesheet totaled $3,034. These term deposits have been classified within prepaid expenses and othercurrent assets.
Translation of foreign currencies
The functional currency of the Company’s foreign subsidiaries is the local currency of theircountry of domicile. Assets and liabilities of the foreign subsidiaries are translated into U.S. dollaramounts at month-end exchange rates. Revenue and expense accounts are translated at the weighted-average rates for the monthly accounting period to which they relate. Equity accounts aretranslated at historical rates. Foreign currency translation adjustments are accumulated as acomponent of other comprehensive income. Foreign currency gains and losses resulting fromintercompany transactions are included in the “Other, net” component of Other income (expense)in the Company’s consolidated statements of earnings.
Cash and cash equivalents
The Company considers all highly liquid investments with an original maturity of three monthsor less from the date of purchase to be cash equivalents.

8/3/2019 USANA 2010 Annual Report
http://slidepdf.com/reader/full/usana-2010-annual-report 80/104
USANA HEALTH SCIENCES, INC. AND SUBSIDIARIESNOTES TO CONSOLIDATED FINANCIAL STATEMENTS (Continued)
(in thousands, except per share data)
F-9
NOTE A – SUMMARY OF SIGNIFICANT ACCOUNTING POLICIES – CONTINUED
Restricted Cash
The Company is required to maintain cash deposits with banks in certain subsidiary locations for
various operating purposes.
The most significant of these cash deposits as of January 1, 2011 was $3,321 including corresponding accrued interest, which is held at a PRC bank for BabyCare operations. This deposit isrequired by the rules of the Ministry of Commerce and the State of Administration for Industry &Commerce of the PRC for BabyCare’s application for a direct sales license, and will continue to berestricted during the periods when BabyCare holds this license. Restricted cash is included in otherassets.
Inventories
Inventories consist of raw materials, work in progress and finished goods and are stated at thelower of cost or market, using the first-in, first-out method.
Income taxes
The Company accounts for income taxes using the asset and liability method, which requiresrecognition of deferred tax assets and liabilities for the expected future tax consequences of thedifferences between the financial statement assets and liabilities and their respective tax bases.Deferred tax assets and liabilities are measured using enacted tax rates that are expected to apply totaxable income in the year in which those temporary differences are expected to be recovered orsettled. The effect on deferred tax assets and liabilities of a change in tax rates is recognized inincome in the period that includes the enactment date. Deferred tax expense or benefit is the resultof changes in deferred tax assets and liabilities. The Company evaluates the probability of realizing the future benefits of its deferred tax assets and provides a valuation allowance for the portion of any
deferred tax assets where the likelihood of realizing an income tax benefit in the future does not meetthe “more-likely-than-not” criteria for recognition. The Company recognizes tax benefits fromuncertain tax positions only if it is more likely than not that the tax position will be sustained onexamination by the taxing authorities, based on the technical merits of the position. The tax benefitsrecognized in the financial statements from such a position are measured based on the largest benefitthat has a greater than fifty percent likelihood of being realized upon ultimate resolution. TheCompany recognizes interest and penalties related to unrecognized tax benefits in income taxes.Deferred taxes are not provided on the portion of undistributed earnings of subsidiaries outside of the United States when these earnings are considered permanently reinvested. At January 1, 2011,taxes had not been provided on $2,038 of accumulated undistributed earnings of subsidiaries that hasbeen or is intended to be permanently reinvested.
Interest cost capitalized
The Company capitalizes interest cost that it has incurred on funds that it has used to constructproperty, plant, and equipment. This capitalized interest is recorded as part of the asset to which itrelates and is amortized over the asset’s estimated useful life once placed in service.

8/3/2019 USANA 2010 Annual Report
http://slidepdf.com/reader/full/usana-2010-annual-report 81/104
USANA HEALTH SCIENCES, INC. AND SUBSIDIARIESNOTES TO CONSOLIDATED FINANCIAL STATEMENTS (Continued)
(in thousands, except per share data)
F-10
NOTE A – SUMMARY OF SIGNIFICANT ACCOUNTING POLICIES – CONTINUED
Property and equipment
Property and equipment are recorded at cost. Maintenance, repairs, and renewals, which
neither materially add to the value of the property nor appreciably prolong its life, are charged toexpense as incurred. Depreciation is provided in amounts sufficient to relate the cost of depreciable assets to operations over the estimated useful lives of the related assets. The straight-line method of depreciation and amortization is followed for financial statement purposes.Leasehold improvements are amortized over the shorter of the life of the respective lease or theuseful life of the improvements. Property and equipment are reviewed for impairment todetermine whether events or changes in circumstances exist that indicate the carrying amount of anasset may not be recoverable. When property and equipment are retired or otherwise disposed of,the cost and accumulated depreciation are removed from the accounts and any resulting gain or lossis included in the results of operations for the respective period.
Goodwill
Goodwill represents the excess of the purchase price over the fair market value of identifiablenet assets of acquired companies. Goodwill is not amortized, but rather is tested at least annually for impairment or more frequently if triggering events or changes in circumstances indicateimpairment. The first step involves comparing the fair value of a reporting unit to its carrying amount. If the carrying amount of the reporting unit exceeds its fair value, the second step of theprocess involves comparing the implied fair value to the carrying amount of the goodwill of thatreporting unit. If the carrying amount of the goodwill of a reporting unit exceeds the implied fair value of that goodwill, an impairment loss is recognized in an amount equal to that excess. Fair value of each reporting unit at January 1, 2011 was greater than the carrying amount; therefore, noimpairment was recorded.
Intangible Assets
Intangible assets represent definite-lived and indefinite-lived intangible assets acquired inconnection with the purchase of BabyCare, which was effective August 16, 2010. Definite-livedintangible assets are amortized over their related useful lives. Indefinite-lived intangible assets arenot amortized; however, they are tested at least annually for impairment or more frequently if events or changes in circumstances exist that may indicate impairment.
Self insurance
The Company is self-insured, up to certain limits, for employee group health claims. TheCompany has purchased stop-loss insurance on both an individual and an aggregate basis, which will reimburse the Company for individual claims in excess of $100 and aggregate claims that aregreater than 125% of projected claims. The Company’s recorded expense includes an estimate forclaims that have been incurred but not billed. A liability is accrued and reflected in the BalanceSheet for all unpaid and unbilled claims. Total expense under this self insurance program was$3,983, $3,355 and $3,391 in 2008, 2009 and 2010, respectively.

8/3/2019 USANA 2010 Annual Report
http://slidepdf.com/reader/full/usana-2010-annual-report 82/104
USANA HEALTH SCIENCES, INC. AND SUBSIDIARIESNOTES TO CONSOLIDATED FINANCIAL STATEMENTS (Continued)
(in thousands, except per share data)
F-11
NOTE A – SUMMARY OF SIGNIFICANT ACCOUNTING POLICIES – CONTINUED
Common stock and additional paid-in capital
The Company records cash that it receives upon the exercise of equity awards by crediting
common stock and additional paid-in capital. The Company received $746, $131 and $12,005 incash proceeds from the exercise of equity awards in 2008, 2009, and 2010, respectively. TheCompany also realizes an income tax benefit from the exercise of certain equity awards. For equity awards earned prior to January 1, 2006, this tax benefit resulted in a decrease in current incometaxes payable and an increase in additional paid-in capital. For equity awards earned after January 1,2006, the tax benefits are recorded in accordance with ASC 718-740, “Compensation-Stock Compensation.” Under ASC 718-740, the Company establishes deferred tax assets for the value of certain equity awards. Upon exercise, the deferred tax assets are reversed and the differencebetween the deferred tax assets and the realized tax benefit creates a tax windfall or shortfall thatincreases or decreases the additional paid-in capital pool (“APIC Pool”). If the APIC Pool isreduced to zero, additional shortfalls are treated as a current tax expense. The total tax benefit
recorded in additional paid-in capital was $1,745 in 2008. The total tax expense recorded inadditional paid-in capital was $319 in 2009 and $152 in 2010.
The Company has a stock repurchase plan in place that has been authorized by the Board of Directors. As of January 1, 2011, $31,705 was available to repurchase shares under this plan. TheCompany expended $39,873, $1,654, and $17,031 to repurchase and retire shares during 2008, 2009,and 2010, respectively. The excess of the repurchase price over par value is allocated betweenadditional paid-in capital and retained earnings.
Revenue recognition and deferred revenue
The Company receives payment, primarily via credit card, for the sale of products at the timecustomers place orders. Sales and related fees such as shipping and handling, net of applicable sales
discounts, are recorded as revenue when the product is delivered and when title and the risk of ownership passes to the customer. Payments received for unshipped products are recorded asdeferred revenue and are included in other current liabilities. Certain incentives offered to Associates, including sales discounts, are classified as a reduction of revenue. A provision forproduct returns and allowances is recorded and is founded on historical experience. Additionally,the Company collects an annual account renewal fee from Associates that is deferred on receipt andis recognized as income on a straight-line basis over the subsequent twelve-month period.
Taxes that have been assessed by governmental authorities and that are directly imposed onrevenue-producing transactions between the Company and its customers, including sales, use, value-added, and some excise taxes, are presented on a net basis (excluded from net sales).
Product return policy
All product that is returned within the first 30 days following purchase is refunded at 100% of the sales price to retail customers and Preferred Customers. This 30-day return policy is offered to Associates only on their first order. All other returned product that is unused and resalable isrefunded up to one year from the date of purchase at 100% of the sales price less a 10% restocking fee.

8/3/2019 USANA 2010 Annual Report
http://slidepdf.com/reader/full/usana-2010-annual-report 83/104
USANA HEALTH SCIENCES, INC. AND SUBSIDIARIESNOTES TO CONSOLIDATED FINANCIAL STATEMENTS (Continued)
(in thousands, except per share data)
F-12
NOTE A – SUMMARY OF SIGNIFICANT ACCOUNTING POLICIES – CONTINUED
According to the terms of the Associate agreement, return of product where the purchaseamount exceeds one hundred dollars and was not damaged at the time of receipt by the Associatemay result in cancellation of the Associate’s distributorship. Depending upon the conditions under
which product was returned Associates and Preferred Customers may either receive a refund basedon their original form of payment, or credit on account for a product exchange. This standard policy differs slightly in a few of our international markets due to the regulatory environment in thosemarkets. Product returns totaled approximately 1.6%, 1.6%, and 1.1% of net sales during fiscalyears 2008, 2009, and 2010, respectively.
Shipping and handling costs
The Company’s shipping and handling costs are included in cost of sales for all periodspresented.
Associate incentives
Associate incentives expenses include all forms of commissions, compensation, and otherincentives paid to our Associates.
Selling, general and administrative
Selling, general and administrative expenses include wages and benefits, depreciation andamortization, rents and utilities, Associate event costs, advertising and professional fees, marketing,and research and development expenses.
Equity-based compensation
The Company records compensation expense in the financial statements for equity-based awardsbased on the grant date fair value and an estimate of forfeitures derived from historical experience.Equity-based compensation expense is recognized under the straight-line method over the period thatservice is provided, which is generally the vesting term. Further information regarding equity awardscan be found in Note K – Equity-Based Compensation.
Advertising
Advertising costs are charged to expense as incurred. Advertising expense totaled $1,583 in2008, $1,575 in 2009 and $1,202 in 2010.
Research and development
Research and development costs are charged to expense as incurred and are presented as partof selling, general and administrative expense. Research and development expense totaled $3,306 in2008, $3,626 in 2009 and $3,842 in 2010.
Earnings per share
Basic earnings per common share (EPS) are based on the weighted-average number of commonshares that were outstanding during each period. Diluted earnings per common share are based onshares that were outstanding (computed as under basic EPS) and potentially dilutive common shares.

8/3/2019 USANA 2010 Annual Report
http://slidepdf.com/reader/full/usana-2010-annual-report 84/104
USANA HEALTH SCIENCES, INC. AND SUBSIDIARIESNOTES TO CONSOLIDATED FINANCIAL STATEMENTS (Continued)
(in thousands, except per share data)
F-13
NOTE A – SUMMARY OF SIGNIFICANT ACCOUNTING POLICIES – CONTINUED
Potential common shares that are included in the diluted earnings per share calculation include in-the-money, equity-based awards that have been granted but have not been exercised.
Recently adopted accounting pronouncements
In January 2010, the Financial Accounting Standards Board (FASB) issued Accounting StandardsUpdate No. 2010-06, Fair Value Measurements and Disclosures (Topic 820): Improving Disclosuresabout Fair Value Measurements (ASU 2010-06). ASU 2010-06 amends Subtopic 820-10 to requiredisclosure of the transfers in and out of Levels 1 and 2. The Company adopted ASU 2010-06 during the first quarter ended April 3, 2010, and its application had no impact on the Company’sconsolidated financial statements.
In October 2009, the FASB issued Accounting Standards Update No. 2009-13, RevenueRecognition (Topic 605): Multiple-Deliverable Revenue Arrangements—a consensus of the FASBEmerging Issues Task Force (ASU 2009-13). ASU 2009-13 addresses the accounting for sales
arrangements that include multiple products or services by revising the criteria for when deliverablesmay be accounted for separately rather than as a combined unit. Specifically, this guidance establishesa selling price hierarchy for determining the selling price of a deliverable, which is necessary toseparately account for each product or service. This hierarchy provides more options for establishing selling price than existing guidance. ASU 2009-13 is required to be applied prospectively to new ormaterially modified revenue arrangements in fiscal periods beginning on or after June 15, 2010. TheCompany adopted ASU 2009-13 during the second quarter ended July 3, 2010, and its application hadno impact on the Company’s consolidated financial statements.
Recently issued accounting pronouncements
In December 2010, the FASB issued Accounting Standards Update No. 2010-28, Intangibles –
Goodwill and Other (Topic 350): When to Perform Step 2 of the Goodwill Impairment Test forReporting Units with Zero or Negative Carrying Amounts (ASU 2010-28). ASU 2010-28 modifiesStep 1 of the goodwill impairment test for reporting units with zero or negative carrying amounts.For those reporting units, an entity is required to perform Step 2 of the goodwill impairment test if it is more likely than not that a goodwill impairment exists. In determining whether it is more likely than not that a goodwill impairment exists, an entity should consider whether there are any adversequalitative factors indicating that an impairment may exist. ASU 2010-28 is effective for fiscalyears, and interim periods within those years, beginning after December 15, 2010. Early adoption isnot permitted. The Company does not expect adoption of this standard to have a material impacton its consolidated financial statements.
In December 2010, the FASB issued Accounting Standards Update No. 2010-29, Business
Combinations (Topic 805): Disclosure of Supplementary Pro Forma Information for BusinessCombinations (ASU 2010-29). ASU 2010-29 has been issued to address diversity in practice aboutthe interpretation of the pro forma revenue and earnings disclosure requirements for businesscombinations. The amendments in this Update specify that if a public entity presents comparativefinancial statements, the entity should disclose revenue and earnings of the combined entity asthough the business combinations(s) that occurred during the current year had occurred as of thebeginning of the comparable prior annual reporting period only. The amendments also expand the

8/3/2019 USANA 2010 Annual Report
http://slidepdf.com/reader/full/usana-2010-annual-report 85/104
USANA HEALTH SCIENCES, INC. AND SUBSIDIARIESNOTES TO CONSOLIDATED FINANCIAL STATEMENTS (Continued)
(in thousands, except per share data)
F-14
NOTE A – SUMMARY OF SIGNIFICANT ACCOUNTING POLICIES – CONTINUED
supplemental pro forma disclosures under Topic 805 to include a description of the nature andamount of material, nonrecurring pro forma adjustments directly attributable to the businesscombination included in the reported pro forma revenue and earnings. ASU 2010-29 is effective
prospectively for business combinations for which the acquisition date is on or after the beginning of the first annual reporting period beginning on or after December 15, 2010. Early adoption ispermitted. The Company does not expect adoption of this standard to have a material impact onits consolidated financial statements.
NOTE B – ACQUISITION
On August 16, 2010, the Company indirectly acquired 100% of BabyCare Ltd., a limited liability company incorporated under the laws of the PRC, for the purchase price of $62,716, which consistedof $45,000 cash paid and $17,716 common stock issued (400,000 shares of USANA common stock at$44.29).
BabyCare is a direct selling company in China that is principally engaged in developing,manufacturing and selling nutritional products for the entire family, with an emphasis on infantnutrition, through both a distributor sales force and a chain of retail centers. This acquisition wasaccomplished in the following simultaneous transactions. The Company acquired Pet Lane, Inc., aDelaware corporation ("Pet Lane"), which is the record owner of BabyCare in China, for a purchaseprice of $700. Simultaneously, the Company entered into and closed a share purchase agreement (the"Purchase Agreement") by and among the Company and the following parties: Pet Lane; Yaolan Ltd.,an exempted company organized under the laws of the Cayman Islands ("Yaolan"); and BabyCareHoldings, Ltd., an exempted company organized under the laws of the Cayman Islands ("BabyCareHoldings"). Pursuant to the Purchase Agreement, the Company, through its acquisition entity PetLane, acquired all of the issued and outstanding shares of BabyCare Holdings (the "Shares") from Yaolan. Goodwill of $700 was recognized in connection with the acquisition of Pet Lane. BabyCareHoldings is the beneficial owner of BabyCare. As a result of its acquisition of Pet Lane and BabyCareHoldings, the Company, indirectly, has acquired both record and beneficial ownership of BabyCare.
The acquisition was accounted for as a business combination and, as such, the results of operations for BabyCare have been included in the consolidated financial statements since theeffective date of acquisition. This acquisition contributed $7,384 in net sales and a net loss of $1,154for the year ended January 1, 2011. Unaudited supplemental pro forma information had theacquisition occurred at the beginning of each period is as follows:
2009 2010
Net sales....................................................................... 451,353$ 527,266$
Net earnings................................................................ 28,326 43,173
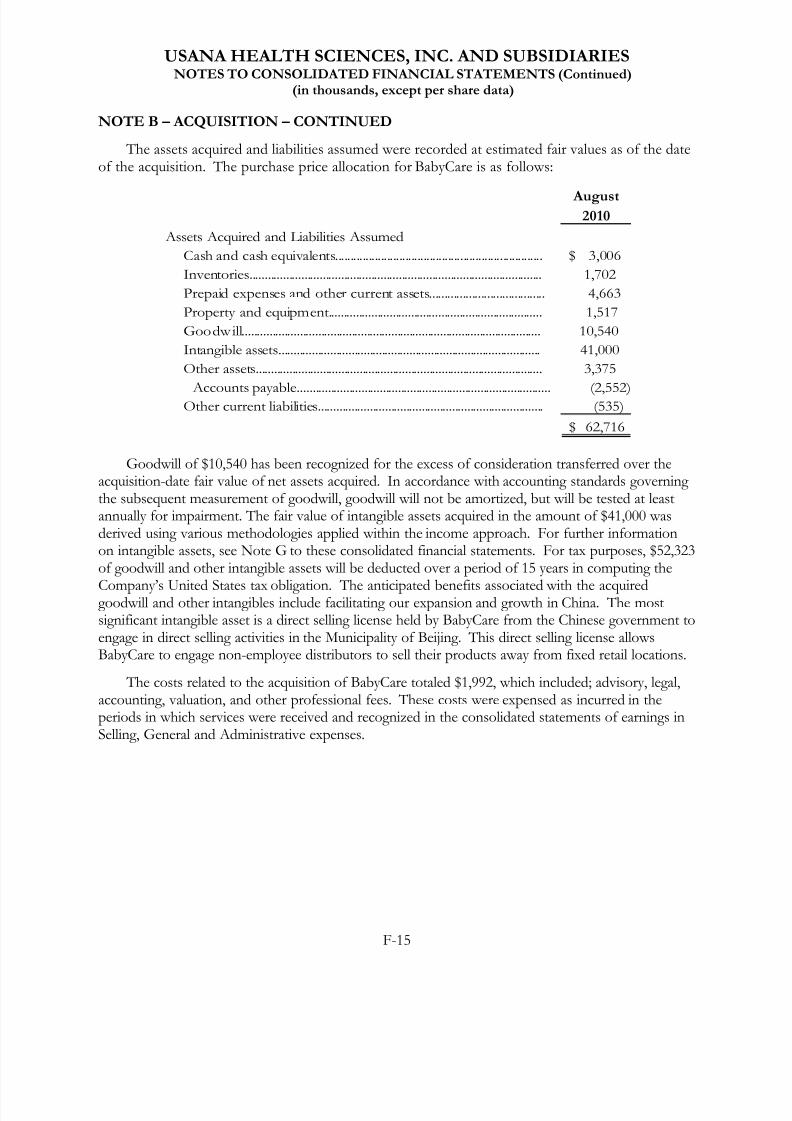
8/3/2019 USANA 2010 Annual Report
http://slidepdf.com/reader/full/usana-2010-annual-report 86/104
USANA HEALTH SCIENCES, INC. AND SUBSIDIARIESNOTES TO CONSOLIDATED FINANCIAL STATEMENTS (Continued)
(in thousands, except per share data)
F-15
NOTE B – ACQUISITION – CONTINUED
The assets acquired and liabilities assumed were recorded at estimated fair values as of the dateof the acquisition. The purchase price allocation for BabyCare is as follows:
August2010
Assets Acquired and Liabilities Assumed
Cash and cash equivalents.................................................................... 3,006$
Inventories................................................................................................ 1,702
Prepaid expenses and other current assets...................................... 4,663
Property and equipment...................................................................... 1,517
Goodwill.................................................................................................. 10,540
Intangible assets...................................................................................... 41,000
Other assets.............................................................................................. 3,375
Accounts payable................................................................................... (2,552)Other current liabilities.......................................................................... (535)
62,716$
Goodwill of $10,540 has been recognized for the excess of consideration transferred over theacquisition-date fair value of net assets acquired. In accordance with accounting standards governing the subsequent measurement of goodwill, goodwill will not be amortized, but will be tested at leastannually for impairment. The fair value of intangible assets acquired in the amount of $41,000 wasderived using various methodologies applied within the income approach. For further informationon intangible assets, see Note G to these consolidated financial statements. For tax purposes, $52,323of goodwill and other intangible assets will be deducted over a period of 15 years in computing the
Company’s United States tax obligation. The anticipated benefits associated with the acquiredgoodwill and other intangibles include facilitating our expansion and growth in China. The mostsignificant intangible asset is a direct selling license held by BabyCare from the Chinese government toengage in direct selling activities in the Municipality of Beijing. This direct selling license allowsBabyCare to engage non-employee distributors to sell their products away from fixed retail locations.
The costs related to the acquisition of BabyCare totaled $1,992, which included; advisory, legal,accounting, valuation, and other professional fees. These costs were expensed as incurred in theperiods in which services were received and recognized in the consolidated statements of earnings inSelling, General and Administrative expenses.

8/3/2019 USANA 2010 Annual Report
http://slidepdf.com/reader/full/usana-2010-annual-report 87/104
USANA HEALTH SCIENCES, INC. AND SUBSIDIARIESNOTES TO CONSOLIDATED FINANCIAL STATEMENTS (Continued)
(in thousands, except per share data)
F-16
NOTE C – INVENTORIES
Inventories consist of the following:
January 2, January 1,
2010 2011
Raw materials............................................................................. 6,785$ 9,372$
Work in progress....................................................................... 5,003 5,791
Finished goods........................................................................... 13,973 18,915
25,761$ 34,078$
NOTE D – PREPAID EXPENSES AND OTHER CURRENT ASSETS
Prepaid expenses and other current assets consist of the following:
January 2, January 1,
2010 2011Prepaid insurance.......................................................................... 1,165$ 1,175$
Other prepaid expenses............................................................... 2,263 2,583
Federal income taxes receivable................................................. 505 3,108
Miscellaneous receivables, net.................................................... 2,775 3,735
Deferred commissions................................................................. 2,738 4,867
Term deposits................................................................................ - 3,034 Other current assets..................................................................... 945 1,759
10,391$ 20,261$
NOTE E – INCOME TAXES
Income tax expense (benefit) consists of the following:
2008 2009 2010
Current
Federal................................................................................................. 16,793$ 15,116$ 18,026$
State..................................................................................................... 2,006 1,091 1,502
Foreign................................................................................................ 1,041 1,800 2,956
19,840 18,007 22,484
DeferredFederal................................................................................................. (3,268) (326) 1,578
State..................................................................................................... (117) (18) 86
Foreign................................................................................................ (79) (241) (935)
16,376$ 17,422$ 23,213$
Year Ended

8/3/2019 USANA 2010 Annual Report
http://slidepdf.com/reader/full/usana-2010-annual-report 88/104
USANA HEALTH SCIENCES, INC. AND SUBSIDIARIESNOTES TO CONSOLIDATED FINANCIAL STATEMENTS (Continued)
(in thousands, except per share data)
F-17
NOTE E – INCOME TAXES – CONTINUED
The income tax provision, as reconciled to the tax computed at the federal statutory rate of 35%
for 2008, 2009, and 2010, is as follows:
2008 2009 2010
Federal income taxes at statutory rate................................................... 16,212$ 17,842$ 24,102$
State income taxes, net of federal tax benefit...................................... 959 1,032 1,192
Difference between U.S. statutory rate and foreign rate................... 20 (108) (21)
Qualified production activities deduction............................................ (695) (979) (1,320)
R&D tax credit......................................................................................... - (438) (285)
Equity-based compensation - incentive stock options...................... 57 64 (145)
All other, net............................................................................................. (177) 9 (310)
16,376$ 17,422$ 23,213$
Year Ended
Deferred tax assets and liabilities consist of the following:
January 2, January 1,
2010 2011
Current deferred tax assets (liabilities)
Inventory capitalization..................................................... 802$ 1,040$
Intercompany sales............................................................ 440 397
Prepaid expenses................................................................ (1,439) (2,197)
Vacation accrual.................................................................. 541 645
Provision for inventory valuation.................................... 770 850
Allowance for bad debts................................................... 158 62
Sales returns and allowances............................................. 413 348
Distributor accruals............................................................ 128 105
All other, net....................................................................... 303 461
2,116$ 1,711$
Long-term deferred tax assets (liabilities), included in
other assets
Accumulated depreciation/amortization........................ (1,373)$ (1,174)$
Accumulated other comprehensive income.................. (981) (2,038)
Equity-based compensation............................................. 8,421 5,740
All other, net....................................................................... 197 62
6,264$ 2,590$

8/3/2019 USANA 2010 Annual Report
http://slidepdf.com/reader/full/usana-2010-annual-report 89/104
USANA HEALTH SCIENCES, INC. AND SUBSIDIARIESNOTES TO CONSOLIDATED FINANCIAL STATEMENTS (Continued)
(in thousands, except per share data)
F-18
NOTE E – INCOME TAXES – CONTINUED
The Company files income tax returns in the U.S. federal jurisdiction and in various states andforeign jurisdictions. With few exceptions, the Company is no longer subject to U.S. federal, state,local, or non-U.S. income tax examinations by tax authorities for years before 2006. A
reconciliation of the beginning and ending amount of unrecognized tax benefits included in otherlong-term liabilities is as follows:
2008 2009 2010
Beginning balance 1,678$ 425$ 545$
Additions based on tax positions related to the current year........... 39 111 -
Additions for tax positions of prior years............................................ - 144 9
Settlements................................................................................................ (889) - -
Lapse of statute......................................................................................... (403) (135) (304)
Ending balance............................................................................................. 425$ 545$ 250$
The Company anticipates that it is reasonably possible that unrecognized tax benefits,including interest and penalties, of up to $59 could be recognized within the next twelve monthsdue to the lapse of the applicable statute of limitations. Recognition of these uncertain taxpositions or any uncertain tax position that is included in the January 1, 2011 balance would resultin an adjustment to the Company’s effective tax rate.
The Company records interest and penalties accrued related to unrecognized tax benefits inincome taxes. In 2010, the Company recognized $9 in interest and penalties, compared to $3 in2009 and $27 in 2008. The Company has accrued $51 and $84 for the payment of interest andpenalties at the end of 2010 and 2009, respectively.

8/3/2019 USANA 2010 Annual Report
http://slidepdf.com/reader/full/usana-2010-annual-report 90/104
USANA HEALTH SCIENCES, INC. AND SUBSIDIARIESNOTES TO CONSOLIDATED FINANCIAL STATEMENTS (Continued)
(in thousands, except per share data)
F-19
NOTE F – PROPERTY AND EQUIPMENT
Cost of property and equipment and their estimated useful lives is as follows:
January 2, January 1,
Years 2010 2011Buildings...................................................................... 40 37,346$ 38,732$
Laboratory and production equipment................... 5-7 16,242 17,723
Sound and video library............................................. 5 600 600
Computer equipment and software......................... 3-5 27,419 27,788
Furniture and fixtures................................................ 3-5 4,561 4,953
Automobiles................................................................ 3-5 256 290
Leasehold improvements.......................................... 3-5 4,478 5,404
Land improvements................................................... 15 2,025 2,051
92,927 97,541
Less accumulated depreciation and amortization. 43,714 48,298
49,213 49,243
Land.............................................................................. 7,352 8,107
Deposits and projects in process............................. 676 218
57,241$ 57,568$
NOTE G – INTANGIBLE ASSETS
Goodwill and intangible assets that have indefinite useful lives are tested annually for
impairment, or more frequently if impairment indicators are present. Such indicators of impairment include, but are not limited to, changes in business climate, and operating or cash flow losses related to such assets. Goodwill and indefinite lived intangible assets are not amortized.Definite lived intangibles are amortized over their related useful lives.
All goodwill and intangible assets acquired in 2010 relate to the acquisition of BabyCare that isfurther discussed in Note B. No events have occurred subsequent to any of our acquisitions thathave resulted in an impairment of the original goodwill or intangible asset amounts that wereinitially recorded from the transactions. Goodwill is as follows:
January 2, Goodwill Impairment January 1,
2010 acquired adjustments 2011
North America.................................... 5,690$ 700$ -$ 6,390$
Asia Pacific........................................... - 10,540 - 10,540
5,690$ 11,240$ -$ 16,930$

8/3/2019 USANA 2010 Annual Report
http://slidepdf.com/reader/full/usana-2010-annual-report 91/104
USANA HEALTH SCIENCES, INC. AND SUBSIDIARIESNOTES TO CONSOLIDATED FINANCIAL STATEMENTS (Continued)
(in thousands, except per share data)
F-20
NOTE G – INTANGIBLE ASSETS – CONTINUED
Intangible assets are as follows:
Weighted-
Gross average
Car rying Accumul ated Net Car ryi ng amor tizati on
Amount Amortization Amount period (years)
Amortized intangible assets
Trade Name & Trademarks........ 3,900$ (146)$ 3,754$ 10
Customer Relationships................. 1,900 (238) 1,662 3
5,800 (384) 5,416
Unamortized intangible assets
Product Formulas........................... 8,600 8,600
Direct Sales License........................ 26,600 26,600 35,200 35,200
41,000$ 40,616$
Aggregate Amortization Expense:
For the year ended
January 1, 2011................................. 384$
Estimated Amortization Expense:
2011........................................................ 1,024$
2012........................................................ 1,024 2013........................................................ 786
2014........................................................ 390
Thereafter............................................. 2,192
5,416$
As of January 1, 2011

8/3/2019 USANA 2010 Annual Report
http://slidepdf.com/reader/full/usana-2010-annual-report 92/104
USANA HEALTH SCIENCES, INC. AND SUBSIDIARIESNOTES TO CONSOLIDATED FINANCIAL STATEMENTS (Continued)
(in thousands, except per share data)
F-21
NOTE H – OTHER CURRENT LIABILITIES
Other current liabilities consist of the following:
January 2, January 1,
2010 2011
Associate incentives.................................................................. 8,008$ 11,379$
Accrued employee compensation........................................... 8,508 14,395
Income taxes.............................................................................. 284 1,571
Sales taxes................................................................................... 3,683 4,671
Associate promotions............................................................... 1,026 1,491
Deferred revenue...................................................................... 7,387 11,772
Provision for returns and allowances.................................... 1,115 929
All other...................................................................................... 4,657 4,971
34,668$ 51,179$
NOTE I – LONG-TERM DEBT AND LINE OF CREDIT
The Company has a $40,000 line of credit. At the year ended 2009, there was an outstanding balance of $7,000 on this line of credit, with a weighted-average interest rate of 1.23%. The interestrate is computed at the bank's Prime Rate or LIBOR, adjusted by features specified in the Credit Agreement. The collateral for this line of credit is the pledge of the capital stock of certainsubsidiaries of the Company, as set forth in a separate pledge agreement with the bank. The Credit Agreement contains restrictive covenants based on adjusted EBITDA and a debt coverage ratio.
At January 1, 2011, there was no outstanding debt on this line of credit. The Company will berequired to pay any balance on this line of credit in full at the time of maturity in May 2011 unless
the line of credit is replaced or terms are renegotiated.
NOTE J – COMMITMENTS AND CONTINGENCIES
1. Operating leases
With the exception of the Company’s headquarters, its Australian facility, and its Tianjin facility,facilities are generally leased. Each of the facility lease agreements is a non-cancelable operating leasegenerally structured with renewal options and expires prior to or during 2019. The Company utilizesequipment under non-cancelable operating leases, expiring through 2014. The minimum rentalcommitments under operating leases at January 1, 2011 are as follows:
2011................................................................................................................ 4,963$
2012................................................................................................................ 3,296
2013................................................................................................................ 1,746
2014................................................................................................................ 842
Thereafter...................................................................................................... 1,159
12,006$
Year ending

8/3/2019 USANA 2010 Annual Report
http://slidepdf.com/reader/full/usana-2010-annual-report 93/104
USANA HEALTH SCIENCES, INC. AND SUBSIDIARIESNOTES TO CONSOLIDATED FINANCIAL STATEMENTS (Continued)
(in thousands, except per share data)
F-22
NOTE J – COMMITMENTS AND CONTINGENCIES – CONTINUED
These leases generally provide that property taxes, insurance, and maintenance expenses arethe responsibility of the Company. Such expenses are not included in the operating lease amountsoutlined in the table above or in the rent expense amounts that follow. The total rent expense for
the years ended 2008, 2009, and 2010 was approximately $4,283, $4,109, and $4,442 respectively.
2. Contingencies
The Company is occasionally involved in various lawsuits and disputes arising in the normalcourse of business. In the opinion of management, based upon advice of counsel, the likelihood of an adverse outcome against the Company is remote. As such, management believes that the ultimateoutcome of these lawsuits will not have a material impact on the Company’s financial position orresults of operations.
3. Employee Benefit Plan
The Company sponsors an employee benefit plan under Section 401(k) of the Internal RevenueCode. This plan covers employees who are at least 18 years of age and have met a one-month servicerequirement. The Company makes a matching contribution equal to 100 percent of the first onepercent of a participant’s compensation that is contributed by the participant, and 50 percent of thatdeferral that exceeds one percent of the participant’s compensation, not to exceed six percent of theparticipant’s compensation, subject to the limits of ERISA. In addition, the Company may make adiscretionary contribution based on earnings. The Company’s matching contributions cliff vest attwo years of service. Contributions made by the Company to the plan in the United States for theyears ended 2008, 2009, and 2010 were $966, $879, and $900, respectively. The 401(k) matchbalances for 2008, 2009, and 2010 were decreased by $23, $0, and $30, respectively, due to theapplication of prior year forfeitures of the unvested balances of terminated employees.
NOTE K – EQUITY-BASED COMPENSATION
Equity-based compensation expense for fiscal years 2008, 2009, and 2010 was $7,688, $8,925,and $10,406, respectively. The related tax benefit for these periods was $2,777, $3,255, and $3,992,respectively.
The following table shows the remaining unrecognized compensation expense on a pre-taxbasis for all types of unvested equity awards outstanding as of January 1, 2011. This table does notinclude an estimate for future grants that may be issued.
2011................................................................................................................ 12,636$
2012................................................................................................................ 10,545
2013................................................................................................................ 6,498
2014................................................................................................................ 3,995
2015................................................................................................................ 1,723
35,397$
The cost above is expected to be recognized over a weighted-average
period of 2.3 years.

8/3/2019 USANA 2010 Annual Report
http://slidepdf.com/reader/full/usana-2010-annual-report 94/104
USANA HEALTH SCIENCES, INC. AND SUBSIDIARIESNOTES TO CONSOLIDATED FINANCIAL STATEMENTS (Continued)
(in thousands, except per share data)
F-23
NOTE K – EQUITY-BASED COMPENSATION – CONTINUED
The Company’s 2006 Equity Incentive Award Plan (the “2006 Plan”) is currently the only planunder which equity awards are issued. This plan allows for the grant of various equity awards,including stock-settled stock appreciation rights, stock options, deferred stock units, and other
types of equity-based awards, to the Company’s officers, key employees, and non-employeedirectors. The 2006 Plan authorized 5,000 new shares of common stock for issuance upon exerciseof equity awards issued under the plan. As of January 1, 2011, 4,946 awards had been grantedunder the 2006 Plan, of which 4,824 were stock-settled stock appreciation rights, 8 were stock options, and 114 were deferred stock units. The Company’s Compensation Committee has initially determined that awards to be granted to officers and key employees under the 2006 Plan willgenerally vest 20% each year on the anniversary of the grant date and expire five to five and one-half years from the date of grant.
Awards of stock options and stock-settled stock appreciation rights to be granted to non-employee directors will generally vest 25% each quarter, commencing on the last day of the fiscal
quarter in which the awards are granted, and will expire five years to five and one-half years fromthe date of grant. Awards of deferred stock units are full-value shares at the date of grant, vesting over the periods of service, and do not have expiration dates.
The Company uses the Black-Scholes option pricing model to estimate the fair value of itsequity awards. The weighted-average fair value of stock options and stock-settled stock appreciation rights that were granted in 2008, 2009, and 2010 was $8.93, $10.30, and $17.09,respectively. Following is a table that includes the weighted-average assumptions that the Company used to calculate fair value of equity awards that were granted during the periods indicated.Deferred stock units are full-value shares at the date of grant and have been excluded from thetable below.
Year Ended
2008 2009 2010
Expected volatility (1)................................................................................. 37.3% 43.5% 54.9%
Risk-free interest rate (2).......... ................. ........ ................. ......... ............... 3.2% 1.8% 1.7%
Expected life (3)........................................................................................... 4.0 yrs. 4.0 yrs. 4.2 yrs.
Expected dividend yield (4)..... ......... ................. ......................... ......... ....... 0.0% 0.0% 0.0%
Weighted-average grant price (5)............................................................... $26.74 $28.09 $38.28
(1) Expected volatility is a weighted-average of historical volatility and implied volatility of
the Company.
(2) Risk-free interest rate is based on the U.S. Treasury yield curve with respect to the expected
life of the award.(3) Expected life is a weighted-average that includes historical settlement data of the Company's
equity awards and a hypothetical holding period for outstanding awards.
(4) The Company historically has not paid dividends.
(5) Grant price is the closing price of the Company's common stock on the date of grant.

8/3/2019 USANA 2010 Annual Report
http://slidepdf.com/reader/full/usana-2010-annual-report 95/104
USANA HEALTH SCIENCES, INC. AND SUBSIDIARIESNOTES TO CONSOLIDATED FINANCIAL STATEMENTS (Continued)
(in thousands, except per share data)
F-24
NOTE K – EQUITY-BASED COMPENSATION – CONTINUED
A summary of the Company’s stock option and stock-settled stock appreciation right activity is asfollows:
Shares
Weighted-
average
grant price
Weighted-average
remaining
contractual
Aggregate
intrinsic
value*
Outstanding at January 2, 2010......... 4,267 30.26$ 3.8 17,173$
Granted.............................................. 1,123 38.28
Exercised........................................... (1,254) 30.14
Canceled or expired......................... (89) 32.98
Outstanding at January 1, 2011......... 4,047 32.46$ 3.5 45,263$
Exercisable at January 1, 2011........... 1,023 33.58$ 3.2 10,369$
* Aggregate intrinsic value is defined as the difference between the current market valueat the reportingdate (the closing price of the Company's common stock on the last trading
day of the period) and the exercise price of the awards that were in-the-money.
The total intrinsic value of stock options and stock-settled stock appreciation rights that wereexercised during 2008, 2009, and 2010 was $8,781, $222, and $16,977, respectively.
A summary of the Company’s deferred stock unit activity for is as follows:
Shares
Weighted-
average
fair value
Nonvested at January 2, 2010..................................................... - -$Granted....................................................................................... 100 44.29
Vested.......................................................................................... - -
Canceled or expired.................................................................. - -
Nonvested at January 1, 2011..................................................... 100 44.29$
The total fair value of equity awards that vested during fiscal years 2008, 2009, and 2010 was$5,984, $10,386, and $7,835, respectively. This total fair value includes equity-based awards issuedin the form of stock options, stock-settled stock appreciation rights, and deferred stock units.

8/3/2019 USANA 2010 Annual Report
http://slidepdf.com/reader/full/usana-2010-annual-report 96/104
USANA HEALTH SCIENCES, INC. AND SUBSIDIARIESNOTES TO CONSOLIDATED FINANCIAL STATEMENTS (Continued)
(in thousands, except per share data)
F-25
NOTE L – COMPREHENSIVE INCOME
Total comprehensive income consisted of the following:
Year Ended
2008 2009 2010
Net earnings.................................................................................................. 29,945$ 33,556$ 45,651$
Foreign currency translation adjustment................................................. (1,364) 1,898 2,198
Comprehensive income.............................................................................. 28,581$ 35,454$ 47,849$
NOTE M – SEGMENT INFORMATION
USANA operates in a single operating segment as a direct selling company that develops,manufactures, and distributes high-quality nutritional and personal care products that are soldthrough a global network marketing system of independent distributors (“Associates”). As such,management has determined that the Company operates in one reportable business segment.Performance for a region or market is primarily evaluated based on sales. The Company does not
use profitability reports on a regional or market basis for making business decisions. No single Associate accounted for 10% or more of net sales for the periods presented. The table below summarizes the approximate percentage of total product revenue that has been contributed by theCompany’s nutritional and personal care products for the periods indicated.
Product Line 2008 2009 2010
USANA® Nutritionals............................................................................... 75% 76% 77%
USANA Foods............................................................................................. 12% 12% 12%
Sensé – beautiful science®......................................................................... 10% 9% 8%
Year Ended
Selected financial information for the Company is presented for two geographic regions: North
America and Asia Pacific, with three sub-regions under Asia Pacific. Individual markets are
categorized into these regions as follows:
• North America –
• United States (including direct sales from the United States to the United Kingdom andthe Netherlands)
• Canada
• Mexico
• Asia Pacific –
• Southeast Asia/Pacific – Australia, New Zealand, Singapore, Malaysia, and thePhilippines
• Greater China(1) – Hong Kong, Taiwan and China(2)
• North Asia – Japan and South Korea
(1) Formerly referred to as East Asia.(2) Our business in China is that of BabyCare, which was indirectly acquired on August 16,2010.
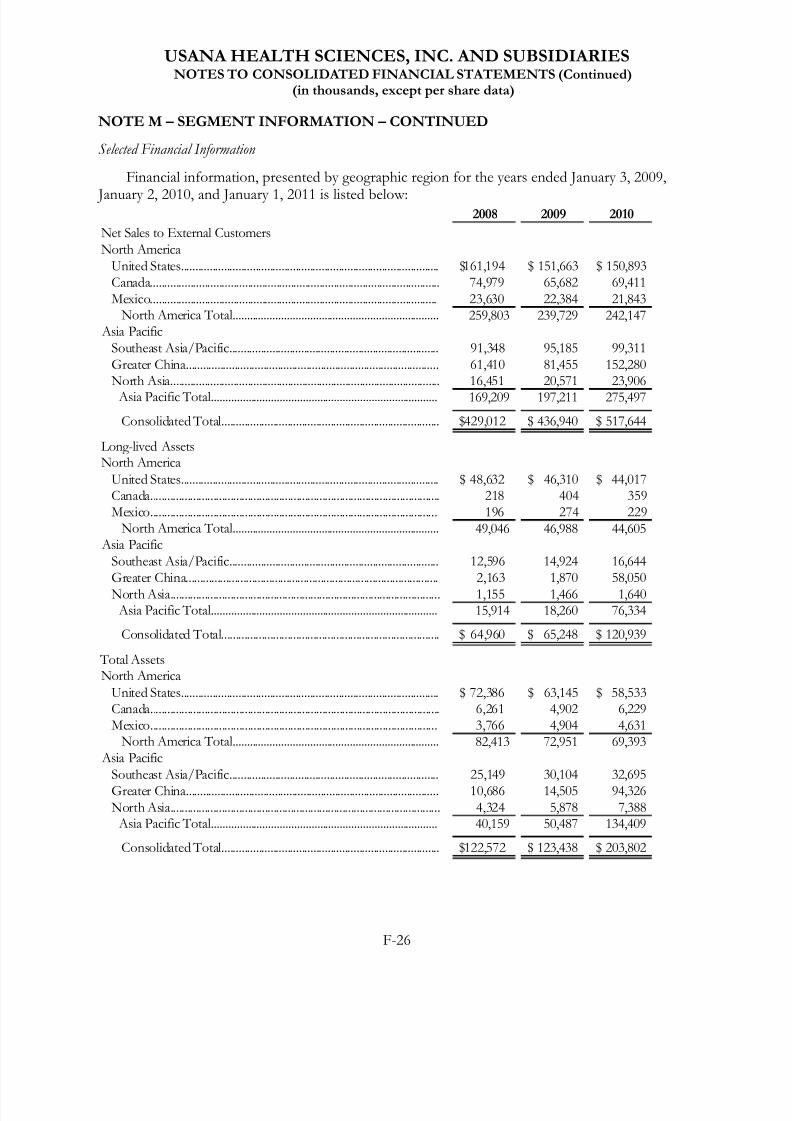
8/3/2019 USANA 2010 Annual Report
http://slidepdf.com/reader/full/usana-2010-annual-report 97/104
USANA HEALTH SCIENCES, INC. AND SUBSIDIARIESNOTES TO CONSOLIDATED FINANCIAL STATEMENTS (Continued)
(in thousands, except per share data)
F-26
NOTE M – SEGMENT INFORMATION – CONTINUED
Selected Financial Information
Financial information, presented by geographic region for the years ended January 3, 2009,
January 2, 2010, and January 1, 2011 is listed below:2008 2009 2010
Net Sales to External CustomersNorth America
United States.......................................................................................... 161,194$ 151,663$ 150,893$Canada..................................................................................................... 74,979 65,682 69,411 Mexico.................................................................................................... 23,630 22,384 21,843
North America Total........................................................................ 259,803 239,729 242,147 Asia Pacific
Southeast Asia/Pacific......................................................................... 91,348 95,185 99,311 Greater China........................................................................................ 61,410 81,455 152,280 North Asia.............................................................................................. 16,451 20,571 23,906
Asia Pacific Total............................................................................... 169,209 197,211 275,497
Consolidated Total............................................................................ 429,012$ 436,940$ 517,644$
Long-lived AssetsNorth America
United States.......................................................................................... 48,632$ 46,310$ 44,017$Canada..................................................................................................... 218 404 359 Mexico.................................................................................................... 196 274 229
North America Total........................................................................ 49,046 46,988 44,605 Asia Pacific
Southeast Asia/Pacific......................................................................... 12,596 14,924 16,644 Greater China........................................................................................ 2,163 1,870 58,050
North Asia.............................................................................................. 1,155 1,466 1,640 Asia Pacific Total............................................................................... 15,914 18,260 76,334
Consolidated Total............................................................................ 64,960$ 65,248$ 120,939$
Total AssetsNorth America
United States.......................................................................................... 72,386$ 63,145$ 58,533$Canada..................................................................................................... 6,261 4,902 6,229 Mexico.................................................................................................... 3,766 4,904 4,631
North America Total........................................................................ 82,413 72,951 69,393 Asia Pacific
Southeast Asia/Pacific......................................................................... 25,149 30,104 32,695 Greater China........................................................................................ 10,686 14,505 94,326 North Asia.............................................................................................. 4,324 5,878 7,388 Asia Pacific Total............................................................................... 40,159 50,487 134,409
Consolidated Total............................................................................ 122,572$ 123,438$ 203,802$

8/3/2019 USANA 2010 Annual Report
http://slidepdf.com/reader/full/usana-2010-annual-report 98/104
USANA HEALTH SCIENCES, INC. AND SUBSIDIARIESNOTES TO CONSOLIDATED FINANCIAL STATEMENTS (Continued)
(in thousands, except per share data)
F-27
NOTE M – SEGMENT INFORMATION – CONTINUED
The following table provides further information on markets representing ten percent or moreof consolidated net sales and long-lived assets, respectively:
Year Ended2008 2009 2010
Net sales:United States.......................................................................................... 161,194$ 151,663$ 150,893$Canada..................................................................................................... 74,979 65,682 69,411 Hong Kong............................................................................................ 38,992 59,956 121,435
Long-lived AssetsUnited States.......................................................................................... 48,632$ 46,310$ 44,017$
Australia.................................................................................................. 11,462 14,116 15,779 China*..................................................................................................... - - 56,182
*Long-lived assets in China represent recently acquired tangible long-term assets, goodwill, and
intangible assets.
NOTE N – QUARTERLY FINANCIAL RESULTS (Unaudited)
The following table summarizes quarterly financial information for fiscal years 2009 and 2010.
2009 First Second Third Fourth
Net sales................................................ 97,299$ 112,093$ 110,764$ 116,784$
Gross profit.......................................... 77,453$ 88,340$ 88,127$ 93,217$
Net earnings......................................... 6,646$ 8,791$ 7,912$ 10,207$
Earnings per share:
Basic................................................... 0.43$ 0.57$ 0.52$ 0.67$
Diluted............................................... 0.43$ 0.57$ 0.51$ 0.66$
2010 First Second Third Fourth
Net sales................................................ 119,087$ 126,011$ 135,006$ 137,540$
Gross profit.......................................... 96,067$ 103,276$ 109,849$ 112,970$
Net earnings......................................... 9,641$ 10,770$ 12,849$ 12,391$
Earnings per share:
Basic................................................... 0.63$ 0.70$ 0.83$ 0.78$
Diluted............................................... 0.62$ 0.69$ 0.79$ 0.75$

8/3/2019 USANA 2010 Annual Report
http://slidepdf.com/reader/full/usana-2010-annual-report 99/104
USANA HEALTH SCIENCES, INC. AND SUBSIDIARIESNOTES TO CONSOLIDATED FINANCIAL STATEMENTS (Continued)
(in thousands, except per share data)
F-28
NOTE O – EARNINGS PER SHARE
Basic earnings per share are based on the weighted-average number of shares outstanding foreach period. Shares that have been repurchased and retired during the periods specified below havebeen included in the calculation of the number of weighted-average shares that are outstanding for
the calculation of basic earnings per share. Diluted earnings per common share are based on sharesthat are outstanding (computed under basic EPS) and on potentially dilutive shares. Shares that areincluded in the diluted earnings per share calculations under the treasury stock method includeequity awards that are in-the-money but have not yet been exercised.
2008 2009 2010
Net earnings available to common shareholders............................... 29,945$ 33,556$ 45,651$
Basic EPS
Shares
Common shares outstanding entire period...................................... 16,198 15,350 15,309
Weighted average common shares:
Issued during period............................................................................ 213 4 311
Canceled during period....................................................................... (363) (14) (92)
Weighted average common shares outstanding during
period...................................................................................................... 16,048 15,340 15,528
Earnings per common share from net earnings - basic................... 1.87$ 2.19$ 2.94$
Diluted EPS
Shares
Weighted average common shares outstanding during
period - basic....................................................................................... 16,048 15,340 15,528
Dilutive effect of in-the-money equity awards................................ 115 92 414
Weighted average common shares outstanding during
period - diluted................................................................................... 16,163 15,432 15,942
Earnings per common share from net earnings - diluted............... 1.85$ 2.17$ 2.86$
Year Ended
NOTE O – EARNINGS PER SHARE – CONTINUED
Equity awards for 1,334, 1,541, and 1,289 shares of stock were not included in thecomputation of EPS for the years ended 2008, 2009, and 2010, respectively, due to their exerciseprices being greater than the average market price of the shares.
During the years ended January 3, 2009, January 2, 2010, and January 1, 2011, the Company expended $39,873, $1,654, and $17,031 to purchase 1,116, 54, and 387 shares, respectively, underthe Company’s share repurchase plan. The purchase of shares under this plan reduces the numberof shares outstanding in the above calculations.

8/3/2019 USANA 2010 Annual Report
http://slidepdf.com/reader/full/usana-2010-annual-report 100/104
USANA HEALTH SCIENCES, INC. AND SUBSIDIARIESNOTES TO CONSOLIDATED FINANCIAL STATEMENTS (Continued)
(in thousands, except per share data)
F-29
NOTE P – RELATED-PARTY TRANSACTIONS
The Company’s Founder and Chairman of the Board, Myron W. Wentz, PhD is the solebeneficial owner of the largest shareholder of the Company, Gull Holdings, Ltd. Gull Holdings,Ltd. owned 50.3% of the Company’s issued and outstanding shares as of January 1, 2011. Dr.
Wentz devotes much of his personal time, expertise, and resources to a number of business andprofessional activities outside of USANA. The most significant of these is the Sanoviv MedicalInstitute, which is a unique, fully integrated health and wellness center located near Rosarito,Mexico that Dr. Wentz founded in 1998. Dr. Wentz’s private entity, Sanoviv S.A. DE C.V.(“Sanoviv”), contracts with Medicis, S.C. (“Medicis”), an entity that is owned and operatedindependently of Dr. Wentz, to conduct the operations of the Sanoviv Medical Institute. Sanoviv leases the medical building to Medicis and Medicis carries out all of the operations of the medicalinstitute, which include employing all of the medical and healthcare professionals who provideservices at the medical institute. The Medicis medical and healthcare professionals possess expertisein the fields of human health, digestive health, nutritional medicine, lifestyle medicine and othermedical fields that are important to USANA.
In 2010, Medicis performed a variety of contract research services on behalf of USANA, whichincluded (i) short-and long-term clinical testing of nutritional products and dietary ingredients, (ii)research and development of novel product formulations for future development and productionby USANA; and (iii) research and development of improvements in existing USANA productformulations. In consideration for these services, USANA paid Medicis approximately $500 during 2010.
In 2011, USANA will continue its collaboration with Medicis for a similar research anddevelopment program. In addition to contract research services, Medicis will provide physiciansand other medical staff to speak at USANA Associate events and will agree to endorse USANA andits products. It is anticipated that USANA will pay Medicis approximately $500 for these services in
2011. USANA’s collaboration with Medicis is terminable at will by USANA at anytime, without any continuing commitment by USANA.

8/3/2019 USANA 2010 Annual Report
http://slidepdf.com/reader/full/usana-2010-annual-report 101/104
USANA HEALTH SCIENCES, INC. AND SUBSIDIARIESSCHEDULE II – VALUATION AND QUALIFYING ACCOUNTS
(in thousands)
Balance at Charged Charged to
beginning of to costs other Balance at
Description period and expenses accounts Deductions end of period
January 3, 2009
Deducted from related asset account:
Allowance for sales returns............. 931 188 - 18 1,101
Allowance for doubtful
accounts........................................... 2,130 6 - 438 1,698
January 2, 2010
Deducted from related asset account:
Allowance for sales returns............. 1,101 66 - 52 1,115
Allowance for doubtful
accounts........................................... 1,698 236 - 4 1,930
` January 1, 2011
Deducted from related asset account:
Allowance for sales returns............. 1,115 94 - 280 929
Allowance for doubtful
accounts........................................... 1,930 121 - 278 1,773

8/3/2019 USANA 2010 Annual Report
http://slidepdf.com/reader/full/usana-2010-annual-report 102/104
(This page has been left blank intentionally)

8/3/2019 USANA 2010 Annual Report
http://slidepdf.com/reader/full/usana-2010-annual-report 103/104
STOCK PERFORMANCE GRAPH DISCLOSURE
The ollowing graph compares the yearly cumulative totalreturns on our common stock, the Total Return Index orthe Nasdaq Stock Market, and nine companies selected ingood aith by USANA rom its industry (the “Peer Group”)or the last ve years. Each o the companies included in thePeer Group markets or manuactures products similar toUSANA’s products or markets its products through a similarmarketing channel. The Peer Group includes the ollowingcompanies: Avon Products, Inc. (NYSE: AVP), NuSkinEnterprises, Inc. (NYSE: NUS), Herbalie Ltd. (NYSE: HLF),Natural Alternatives International, Inc. (NASDAQ: NAII),Perrigo Company (NASDAQ: PRGO), Reliv International,Inc. (NASDAQ: RELV), Hain Celestial Group (NASDAQ:HAIN), and Lieway Foods, Inc. (NASDAQ: LWAY).USANA’s shares commenced trading in May 1993. The graphassumes an investment on December 31, 2005, o $100 andreinvestment o all dividends into additional shares o thesame class o equity, i applicable to the stock or index. Thisgraph is included in accordance with SEC requirements. You are cautioned not to draw any conclusions rom thisinormation, as past results are not necessarily indicative o uture perormance. This graph in no way refects a orecast o uture nancial perormance o value.
BOARD OF DIRECTORS
Myron W. Wentz, Ph.D.Chairman
Robert Anciaux Managing DirectorS.E.I. s.a.
Gilbert A. FullerDirector
Jerry G. McClain Independent Director
Ronald S. PoelmanLaw Partner Jones, Waldo, Holbrook &McDonough
EXECUTIVE OFFICERS
David A. WentzChie Executive Ocer
Fred W. Cooper, Ph.D.President and Chie Operating Ocer
Jeffrey A. YatesChie Financial Ocer
Kevin G. GuestChie Marketing Ocer
Roy W. TruettChie Inormation Ocer
Mark H. WilsonExecutive Vice President o Sales
Deborah WooExecutive Vice President o Sales
Timothy E. WoodExecutive Vice President o Researchand Development
James H. BrambleGeneral Counsel and CorporateSecretary
INDEPENDENT REGISTERED
PUBLIC ACCOUNTING FIRM
PricewaterhouseCoopers LLPSalt Lake City, Utah
LEGAL COUNSEL
Durham Jones & PinegarSalt Lake City, Utah
ANNUAL MEETING
Please reer to the Proxy Statementor inormation regarding the Annual Meeting.
MARKET INFORMATION
Our common stock previously tradedon The NASDAQ National MarketSystem. On January 3, 2011, USANA transerred the listing o its commonstock to the New York Stock Exchangeunder the symbol “USNA”. Theollowing table contains the reportedhigh and low sale prices or ourcommon stock as reported on TheNASDAQ National Market System or
the periods indicated:
2009 2010
High Low High Low
1st Quarter $ 33.95 $17.72 $32.84 $24.34
2nd Quarter $ 30.22 $ 22.41 $39.20 $30.11
3rd Quarter $ 36.93 $ 23.58 $45.00 $36.71
4th Quarter $ 37.19 $ 27.87 $45.50 $39.00
SHAREHOLDERS
The approximate number o record and
benecial holders o the Company’scommon stock was 410 and 7,642respectively, as o March 4, 2011.
TRANSFER AGENT & REGISTRAR
American Stock Transer and TrustCompany 56 Maiden LanePlaza Level, NY 10038(800) 937-5449 or (718) 921-8124 www.amstock.com
C u m u l a t i v e V a l u
e o f $ 1 0 0 I n i t i a l I n v e s t m e n t
20
40
60
80
100
120
140
160
180
200
D e c - 0 5
A p r - 0
6
A u g - 0 6
D e c - 0 6
A p r - 0
7
A u g - 0 7
D e c - 0 7
A p r - 0
8
A u g - 0 8
D e c - 0 8
A p r - 0
9
A u g - 0 9
A p r - 1
0
D e c - 0 9
A u g - 1 0
D e c - 1 0
USNA NASDAQ Peer Group

8/3/2019 USANA 2010 Annual Report
http://slidepdf.com/reader/full/usana-2010-annual-report 104/104
USANA Health Sciences, Inc.
3838 West Parkway Blvd.Salt Lake City, Utah 84120
Tel: (801) 954-7100Fax: (801) 956-9486
www.usanahealthsciences.com
NYSE: USNA [email protected]