Embed Size (px)
Citation preview
217217217
200200200
255255255
000
163163163
131132122
2396553
110135120
1129256
62102130
1025648
130120111
237237237
8011927
252174.59
“The views, opinions and findings contained in this report are
those of the authors(s) and should not be construed as an
official Department of the Army position, policy or decision,
unless so designated by other official documentation.”
Prepared by Eddie Wiggins
For Harbors & Navigation Committee and QPI Meeting
15 November 2017
USACE NAVIGATION R&D
UPDATE
1
File Name
OVERVIEW
• Channel and Dredging Decision Support Tools
• Marine Transportation System Analysis Tools
• Condition Assessment Tools
• Planning Tools
• Engineering With Nature
File Name
2

USACE NAVIGATION PORTAL3
USACE Navigation Portal
Maintenance of inland,
intracoastal, and coastal
waterways, channels,
ports, and harbors
Hydrographic
Surveying, National
Channel Framework
(NCF), and Inland
Electronic Navigational
Charts (IENC)
Performance measures,
including economic
benefits, safety &
security, environmental
stewardship, and
resilience.
Harmonized navigation
information resources for
US inland, intracoastal,
and coastal waterways
and channels
Regional Sediment
Management &
Engineering with
Nature
Engineering, design,
operation, monitoring,
maintenance, and repair
of coastal and inland
structures
DredgingSurvey &
Mapping
Marine
Transportation
System
eNavigationSediment &
Ecosystem
Restoration
Infrastructure
& Asset
Management
Provides other agencies & public access
to approved data and tools

SEDIMENT ANALYSIS WITH THE SAGA DATABASE
Visualize distribution of detected chemicals.
Symbolize sites based on average grain size.
Isolate sites based on a physical characteristic.
Determine volume of material at specified depths.
Run computations to generate input values for models.
The SAGA database schema
supports the storage and
retrieval of all data related to
sediment analysis.
Each characteristic tied back
to an XY location and noted
depth.
Sediment Analysis GeoApp (SAGA)
4
EHYDRO
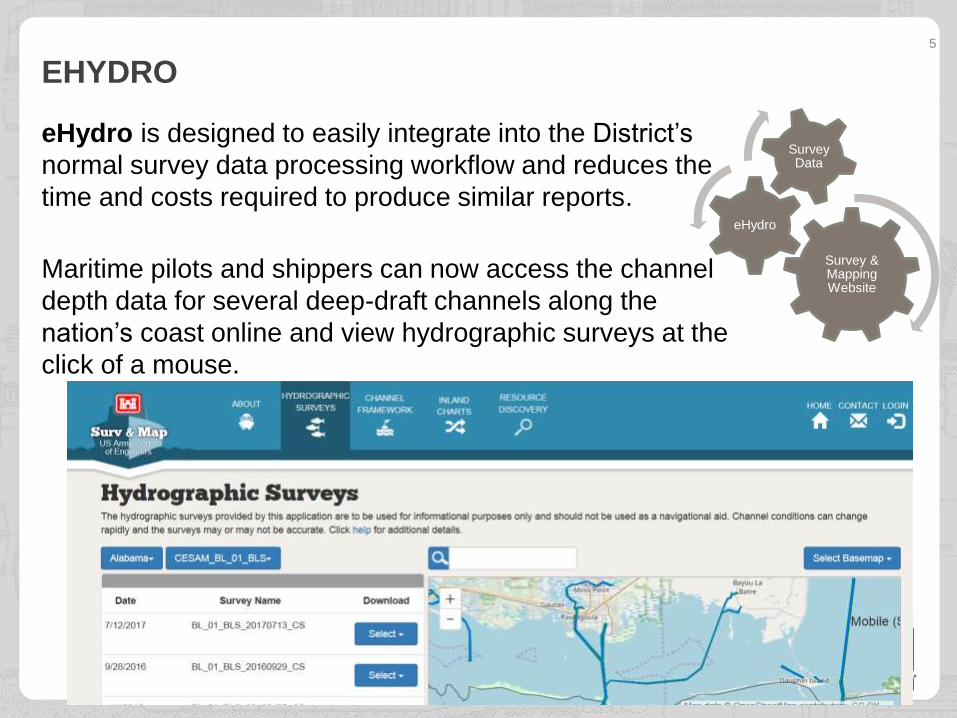
Survey & Mapping Website
eHydro
Survey Data
eHydro is designed to easily integrate into the District’s
normal survey data processing workflow and reduces the
time and costs required to produce similar reports.
Maritime pilots and shippers can now access the channel
depth data for several deep-draft channels along the
nation’s coast online and view hydrographic surveys at the
click of a mouse.
5
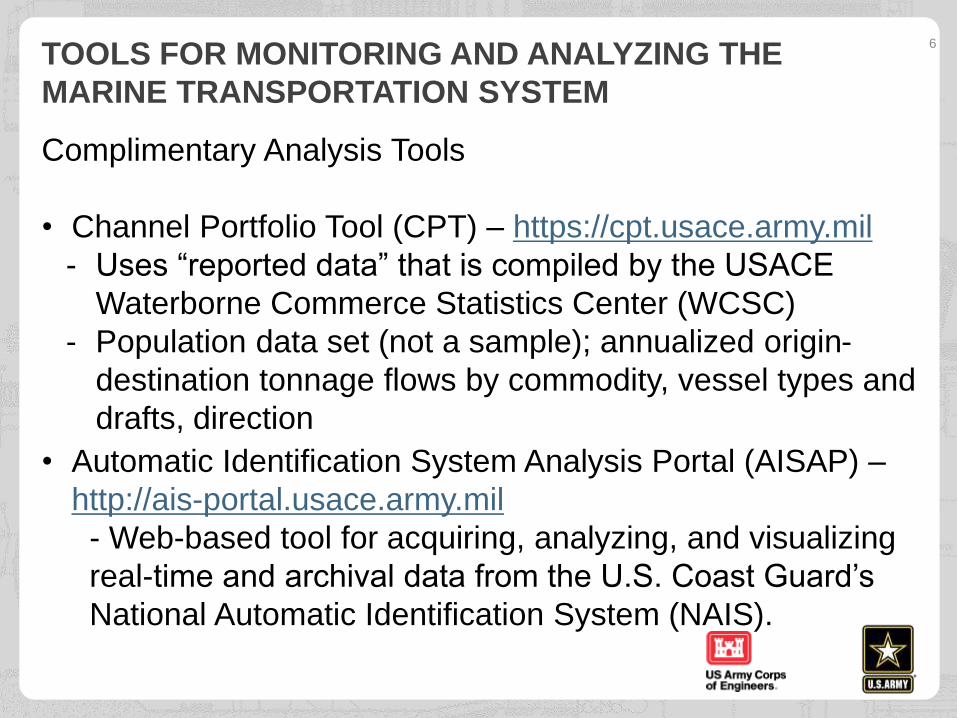
Complimentary Analysis Tools
• Channel Portfolio Tool (CPT) – https://cpt.usace.army.mil
- Uses “reported data” that is compiled by the USACE
Waterborne Commerce Statistics Center (WCSC)
- Population data set (not a sample); annualized origin-
destination tonnage flows by commodity, vessel types and
drafts, direction
• Automatic Identification System Analysis Portal (AISAP) –
http://ais-portal.usace.army.mil
- Web-based tool for acquiring, analyzing, and visualizing
real-time and archival data from the U.S. Coast Guard’s
National Automatic Identification System (NAIS).
TOOLS FOR MONITORING AND ANALYZING THE
MARINE TRANSPORTATION SYSTEM
6

TOOLS FOR MONITORING AND ANALYZING THE
MARINE TRANSPORTATION SYSTEM
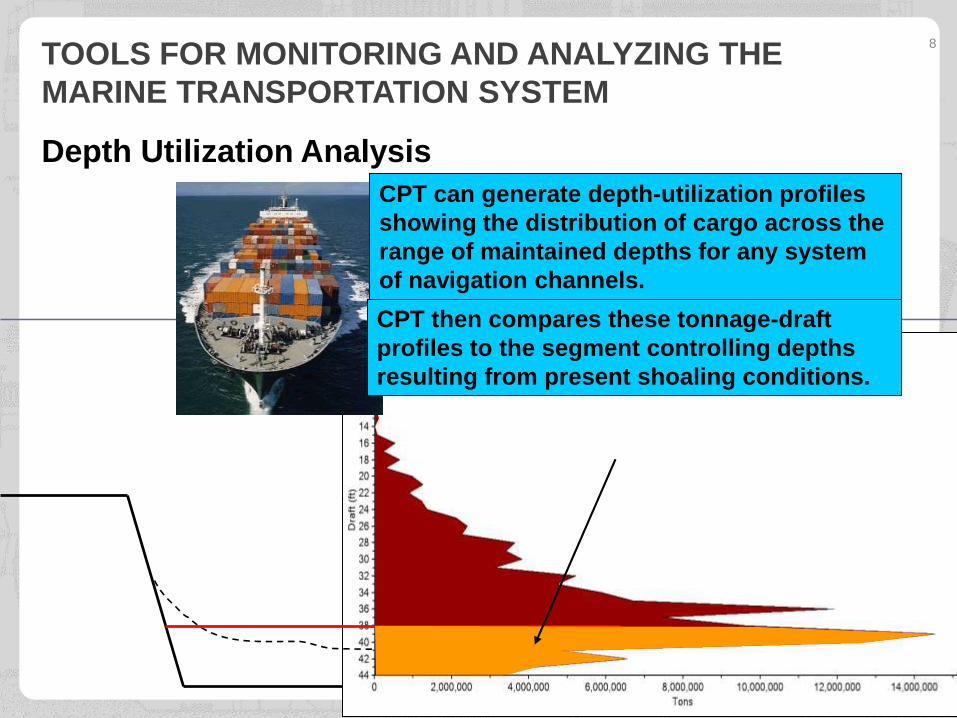
CPT then compares these tonnage-draft
profiles to the segment controlling depths
resulting from present shoaling conditions.
CPT can generate depth-utilization profiles
showing the distribution of cargo across the
range of maintained depths for any system
of navigation channels.
TOOLS FOR MONITORING AND ANALYZING THE
MARINE TRANSPORTATION SYSTEM
Depth Utilization Analysis
8
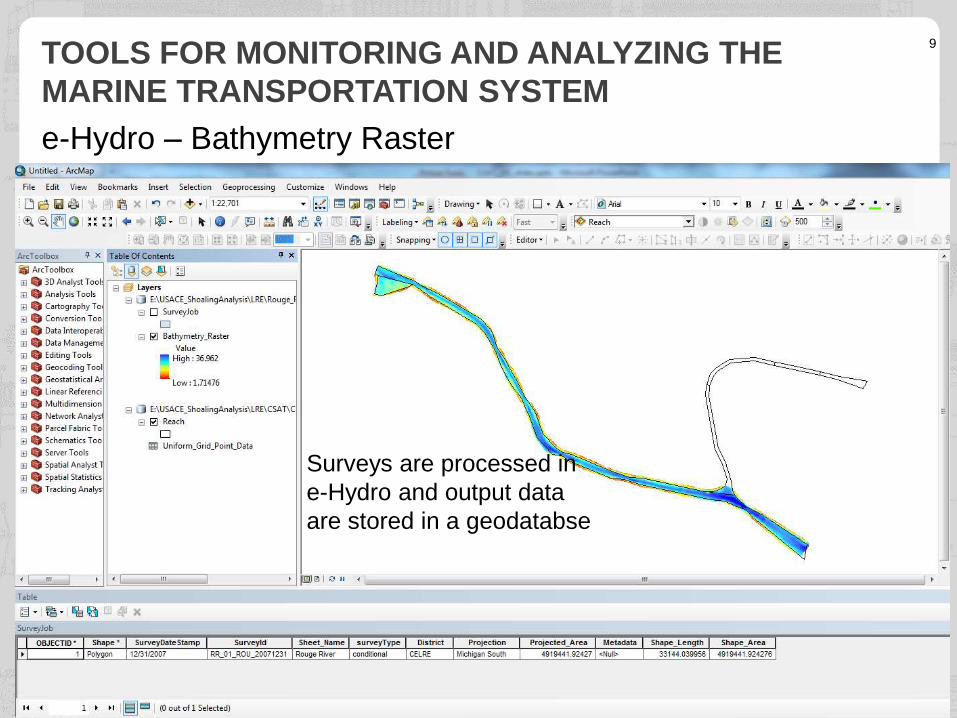
Surveys are processed in
e-Hydro and output data
are stored in a geodatabse
e-Hydro – Bathymetry Raster
TOOLS FOR MONITORING AND ANALYZING THE
MARINE TRANSPORTATION SYSTEM
9
BUILDING STRONG®
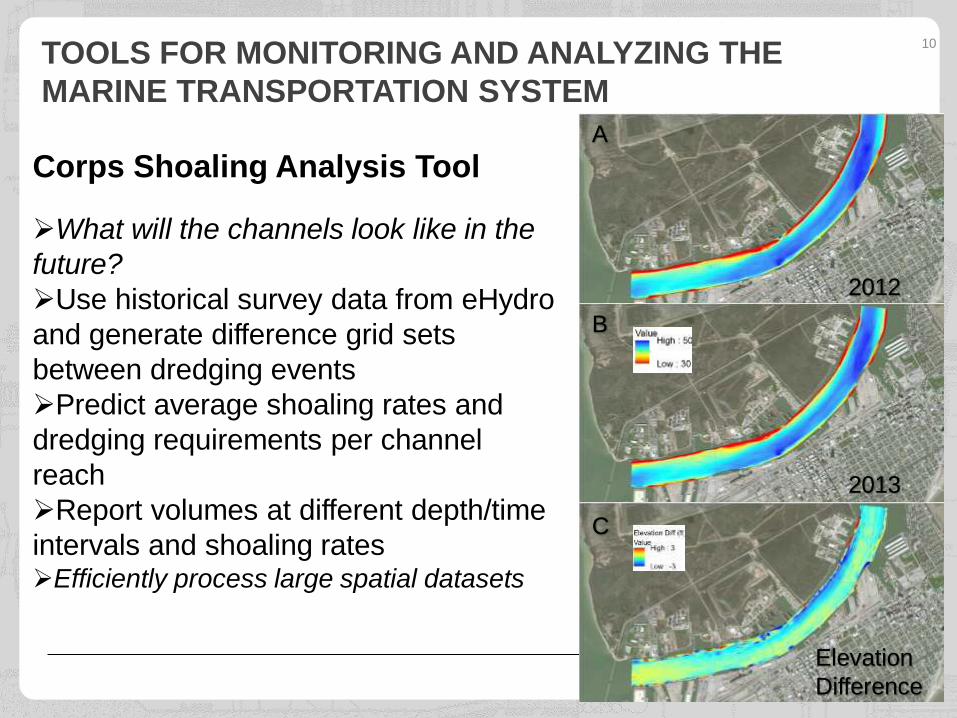
Corps Shoaling Analysis Tool
➢What will the channels look like in the
future?
➢Use historical survey data from eHydro
and generate difference grid sets
between dredging events
➢Predict average shoaling rates and
dredging requirements per channel
reach
➢Report volumes at different depth/time
intervals and shoaling rates➢Efficiently process large spatial datasets
A
B
C
2012
2013
Elevation
Difference
TOOLS FOR MONITORING AND ANALYZING THE
MARINE TRANSPORTATION SYSTEM
10
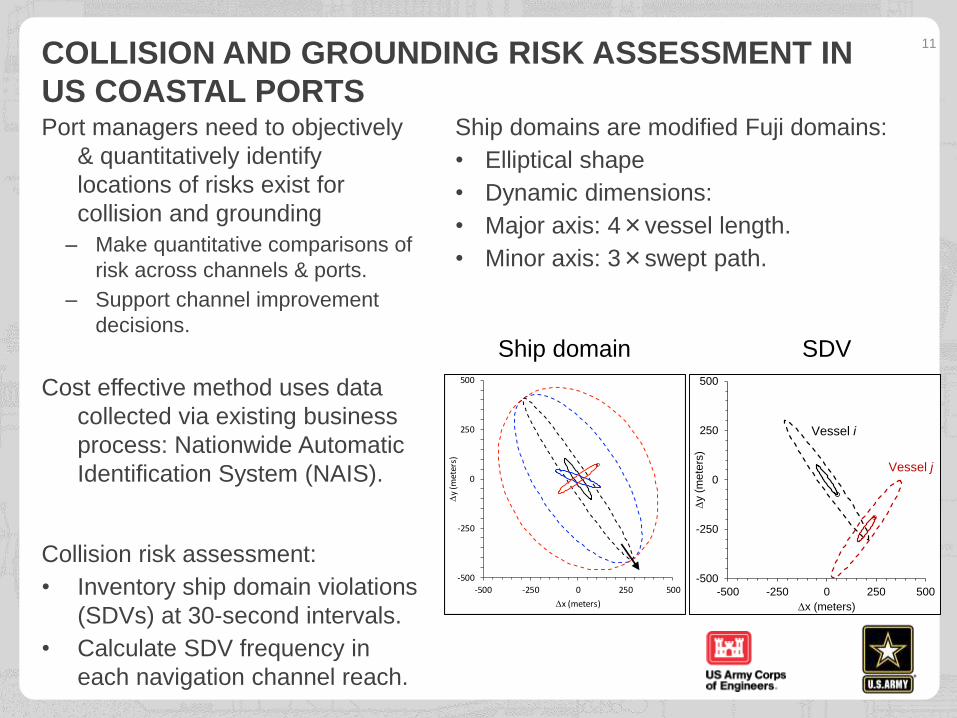
Port managers need to objectively
& quantitatively identify
locations of risks exist for
collision and grounding
– Make quantitative comparisons of
risk across channels & ports.
– Support channel improvement
decisions.
Ship domains are modified Fuji domains:
• Elliptical shape
• Dynamic dimensions:
• Major axis: 4×vessel length.
• Minor axis: 3×swept path.
Cost effective method uses data
collected via existing business
process: Nationwide Automatic
Identification System (NAIS).
Collision risk assessment:
• Inventory ship domain violations
(SDVs) at 30-second intervals.
• Calculate SDV frequency in
each navigation channel reach.
-500
-250
0
250
500
-500 -250 0 250 500
Dy
(met
ers)
Dx (meters)
-500
-250
0
250
500
-500 -250 0 250 500
Dy (
mete
rs)
Dx (meters)
Vessel i
Vessel j
Ship domain SDV
COLLISION AND GROUNDING RISK ASSESSMENT IN
US COASTAL PORTS
11
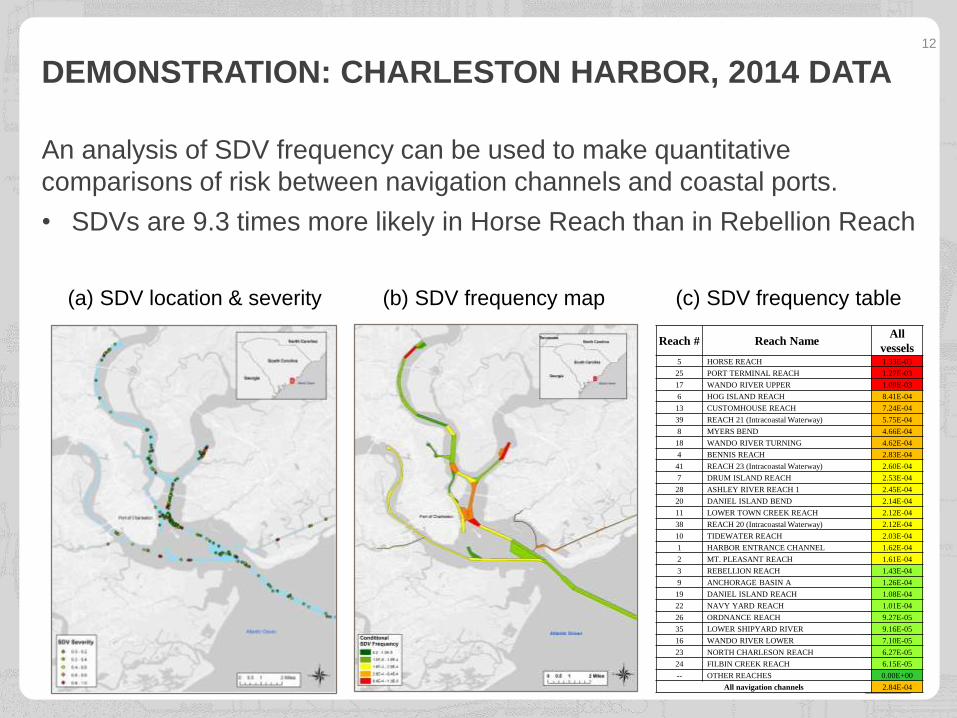
(b) SDV frequency map(a) SDV location & severity
An analysis of SDV frequency can be used to make quantitative
comparisons of risk between navigation channels and coastal ports.
• SDVs are 9.3 times more likely in Horse Reach than in Rebellion Reach
Reach # Reach NameAll
vessels5 HORSE REACH 1.33E-03
25 PORT TERMINAL REACH 1.27E-03
17 WANDO RIVER UPPER 1.09E-03
6 HOG ISLAND REACH 8.41E-04
13 CUSTOMHOUSE REACH 7.24E-04
39 REACH 21 (Intracoastal Waterway) 5.75E-04
8 MYERS BEND 4.66E-04
18 WANDO RIVER TURNING 4.62E-04
4 BENNIS REACH 2.83E-04
41 REACH 23 (Intracoastal Waterway) 2.60E-04
7 DRUM ISLAND REACH 2.53E-04
28 ASHLEY RIVER REACH 1 2.45E-04
20 DANIEL ISLAND BEND 2.14E-04
11 LOWER TOWN CREEK REACH 2.12E-04
38 REACH 20 (Intracoastal Waterway) 2.12E-04
10 TIDEWATER REACH 2.03E-04
1 HARBOR ENTRANCE CHANNEL 1.62E-04
2 MT. PLEASANT REACH 1.61E-04
3 REBELLION REACH 1.43E-04
9 ANCHORAGE BASIN A 1.26E-04
19 DANIEL ISLAND REACH 1.08E-04
22 NAVY YARD REACH 1.01E-04
26 ORDNANCE REACH 9.27E-05
35 LOWER SHIPYARD RIVER 9.16E-05
16 WANDO RIVER LOWER 7.10E-05
23 NORTH CHARLESON REACH 6.27E-05
24 FILBIN CREEK REACH 6.15E-05
-- OTHER REACHES 0.00E+00
All navigation channels 2.84E-04
(c) SDV frequency table
DEMONSTRATION: CHARLESTON HARBOR, 2014 DATA12
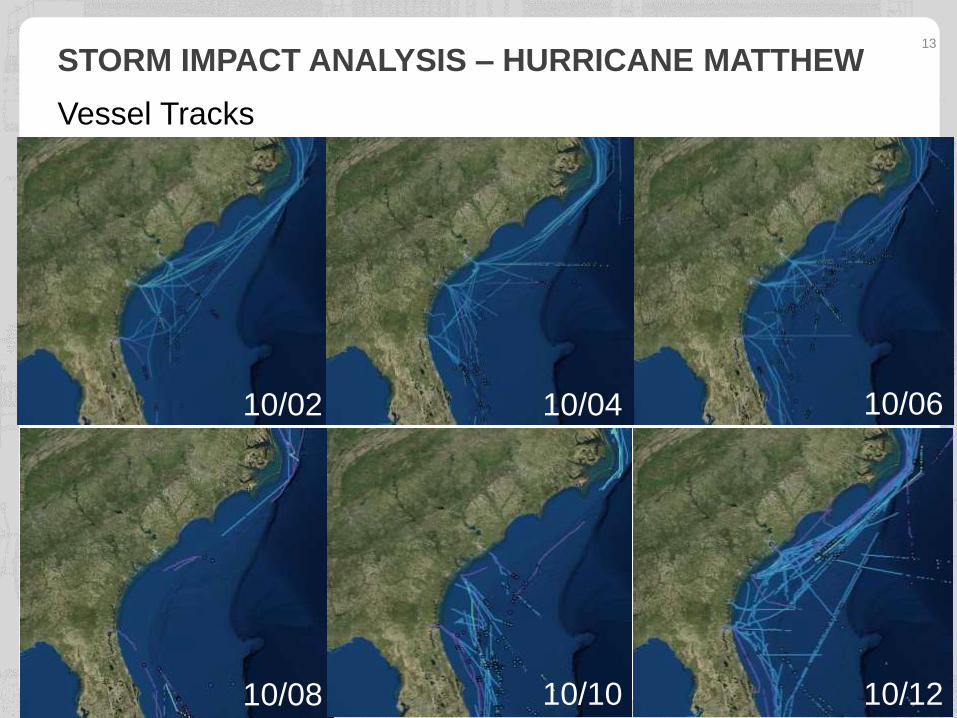
STORM IMPACT ANALYSIS – HURRICANE MATTHEW
10/02 10/04 10/06
10/08 10/1210/10
13
Vessel Tracks
0
10
20
30
40
50
60
70
80
90
100
9/13/2016 0:00 9/18/2016 0:00 9/23/2016 0:00 9/28/2016 0:00 10/3/2016 0:00 10/8/2016 0:0010/13/2016 0:0010/18/2016 0:0010/23/2016 0:0010/28/2016 0:00
Net
vessels
in p
ort
Time
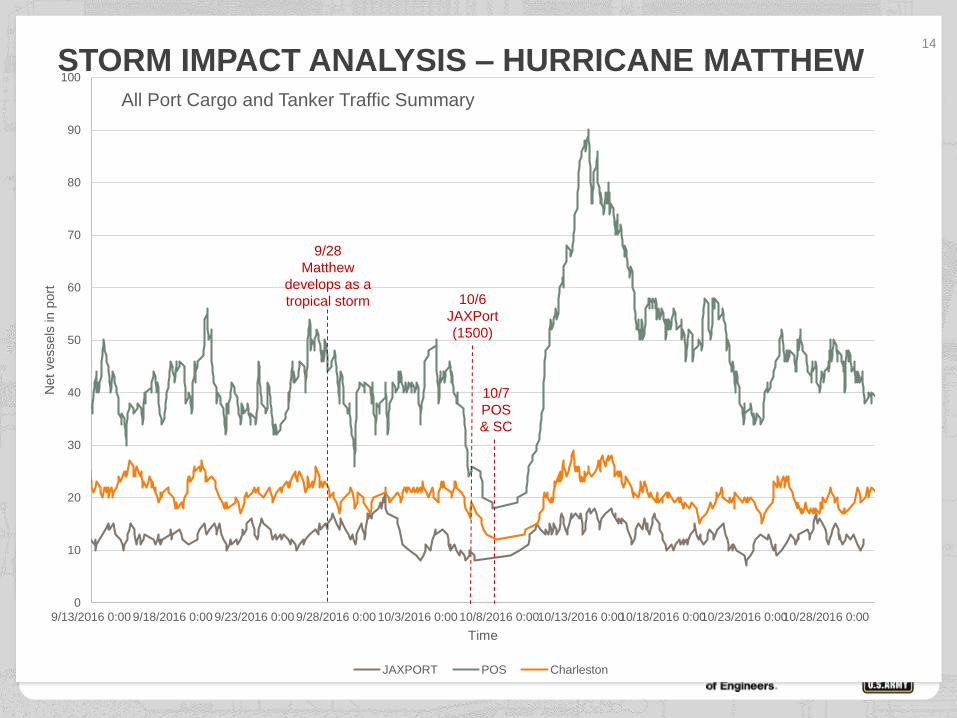
All Port Cargo and Tanker Traffic Summary
JAXPORT POS Charleston
9/28
Matthew
develops as a
tropical storm 10/6
JAXPort
(1500)
10/7
POS
& SC
14
STORM IMPACT ANALYSIS – HURRICANE MATTHEW
File Name
15
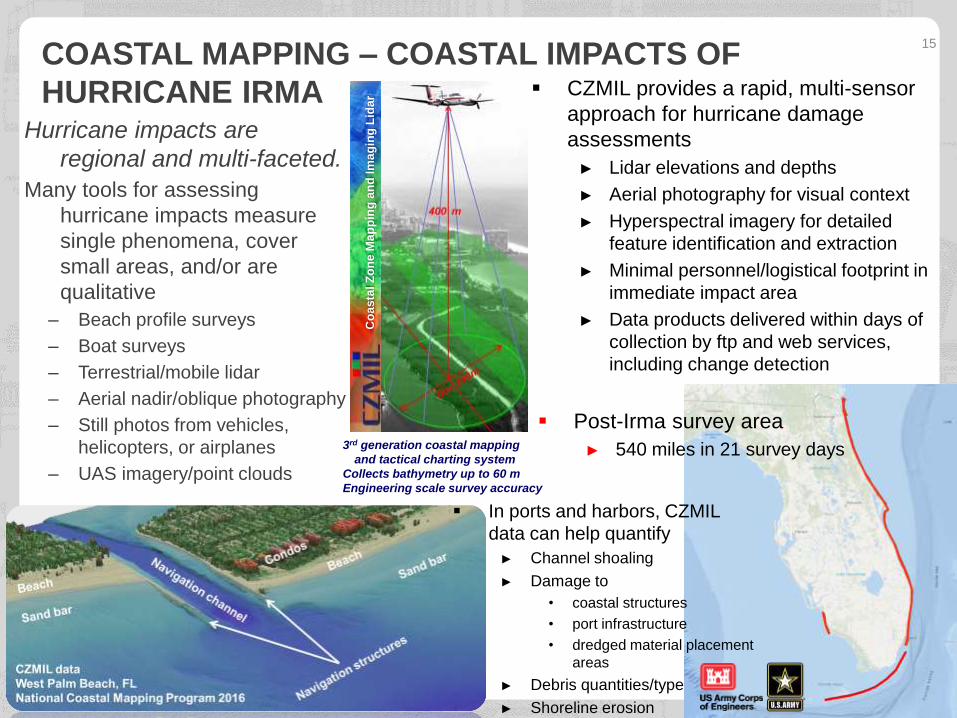
Hurricane impacts are
regional and multi-faceted.
Many tools for assessing
hurricane impacts measure
single phenomena, cover
small areas, and/or are
qualitative
– Beach profile surveys
– Boat surveys
– Terrestrial/mobile lidar
– Aerial nadir/oblique photography
– Still photos from vehicles,
helicopters, or airplanes
– UAS imagery/point clouds
▪ CZMIL provides a rapid, multi-sensor
approach for hurricane damage
assessments
► Lidar elevations and depths
► Aerial photography for visual context
► Hyperspectral imagery for detailed
feature identification and extraction
► Minimal personnel/logistical footprint in
immediate impact area
► Data products delivered within days of
collection by ftp and web services,
including change detection
3rd generation coastal mapping
and tactical charting system
Collects bathymetry up to 60 m
Engineering scale survey accuracy
Co
as
tal Z
on
e M
ap
pin
g a
nd
Im
ag
ing
Lid
ar
▪ In ports and harbors, CZMIL
data can help quantify
► Channel shoaling
► Damage to
• coastal structures
• port infrastructure
• dredged material placement
areas
► Debris quantities/type
► Shoreline erosion
▪ Post-Irma survey area
► 540 miles in 21 survey days
COASTAL MAPPING – COASTAL IMPACTS OF
HURRICANE IRMA
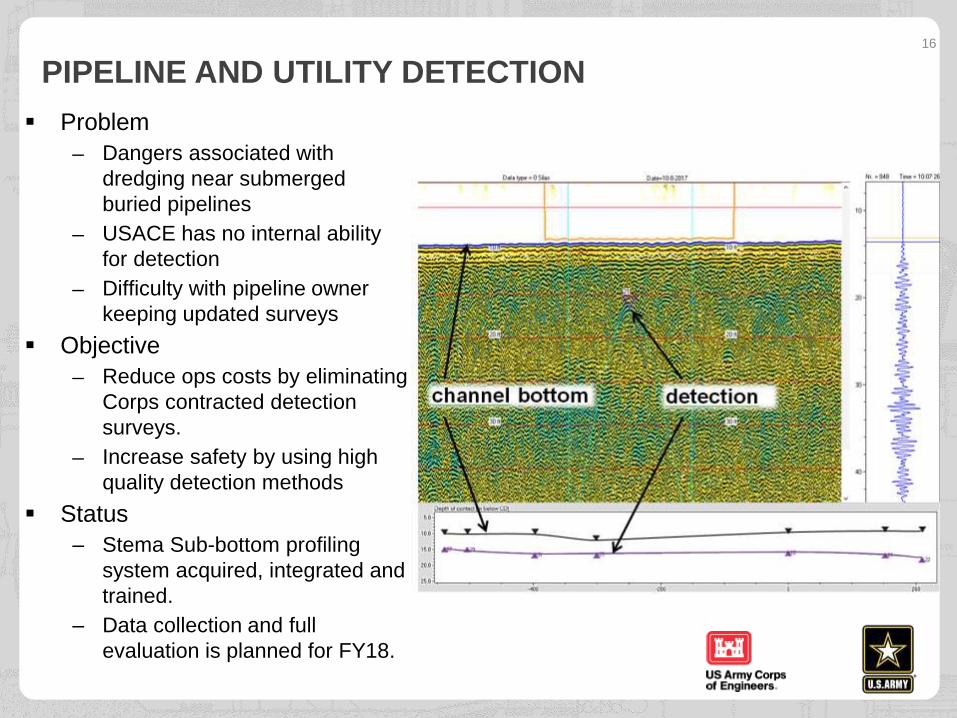
▪ Problem
─ Dangers associated with
dredging near submerged
buried pipelines
─ USACE has no internal ability
for detection
─ Difficulty with pipeline owner
keeping updated surveys
▪ Objective
─ Reduce ops costs by eliminating
Corps contracted detection
surveys.
─ Increase safety by using high
quality detection methods
▪ Status
– Stema Sub-bottom profiling
system acquired, integrated and
trained.
– Data collection and full
evaluation is planned for FY18.
PIPELINE AND UTILITY DETECTION16
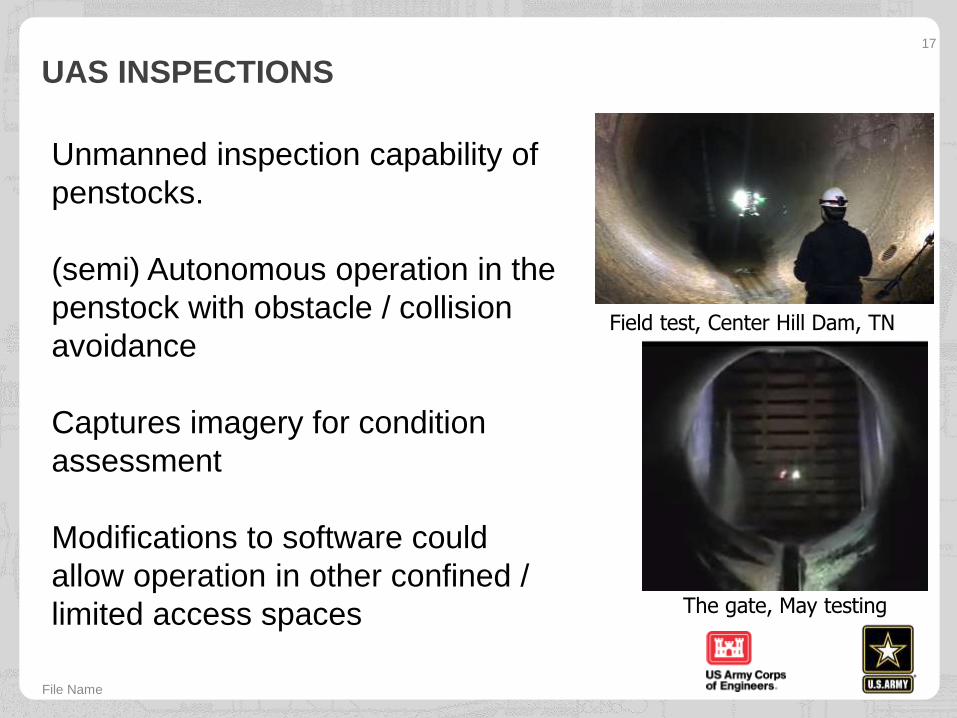
UAS INSPECTIONS
File Name
17
Field test, Center Hill Dam, TN
The gate, May testing
Unmanned inspection capability of
penstocks.
(semi) Autonomous operation in the
penstock with obstacle / collision
avoidance
Captures imagery for condition
assessment
Modifications to software could
allow operation in other confined /
limited access spaces
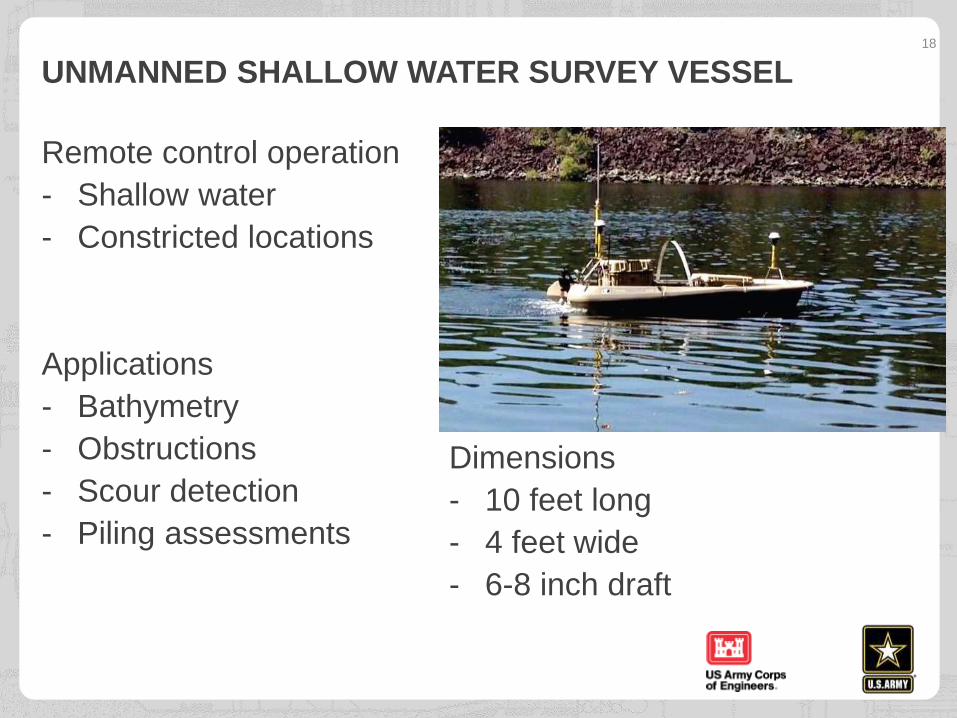
UNMANNED SHALLOW WATER SURVEY VESSEL
Remote control operation
- Shallow water
- Constricted locations
Applications
- Bathymetry
- Obstructions
- Scour detection
- Piling assessments
18
Dimensions
- 10 feet long
- 4 feet wide
- 6-8 inch draft
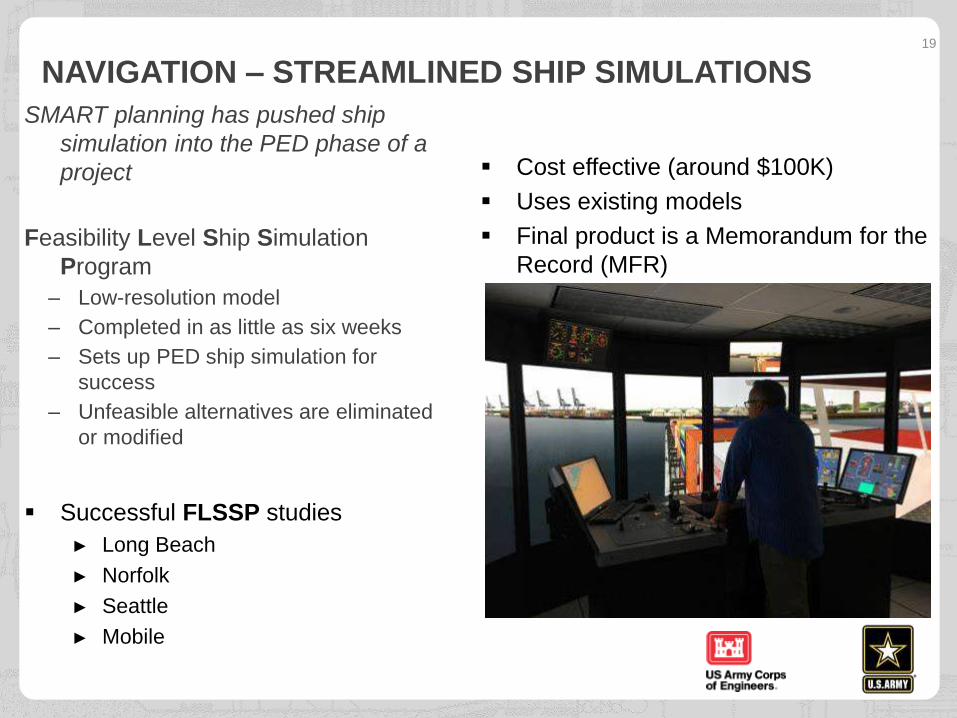
SMART planning has pushed ship
simulation into the PED phase of a
project
Feasibility Level Ship Simulation
Program
– Low-resolution model
– Completed in as little as six weeks
– Sets up PED ship simulation for
success
– Unfeasible alternatives are eliminated
or modified
▪ Successful FLSSP studies
► Long Beach
► Norfolk
► Seattle
► Mobile
▪ Cost effective (around $100K)
▪ Uses existing models
▪ Final product is a Memorandum for the
Record (MFR)
NAVIGATION – STREAMLINED SHIP SIMULATIONS19
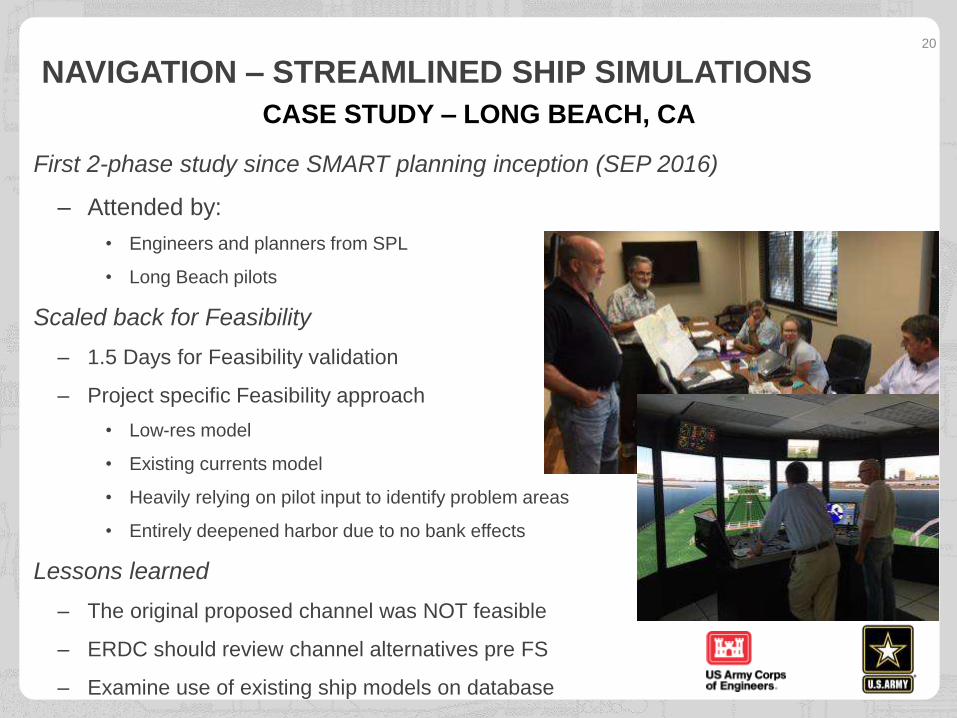
First 2-phase study since SMART planning inception (SEP 2016)
– Attended by:
• Engineers and planners from SPL
• Long Beach pilots
Scaled back for Feasibility
– 1.5 Days for Feasibility validation
– Project specific Feasibility approach
• Low-res model
• Existing currents model
• Heavily relying on pilot input to identify problem areas
• Entirely deepened harbor due to no bank effects
Lessons learned
– The original proposed channel was NOT feasible
– ERDC should review channel alternatives pre FS
– Examine use of existing ship models on database
CASE STUDY – LONG BEACH, CA
NAVIGATION – STREAMLINED SHIP SIMULATIONS20
File Name
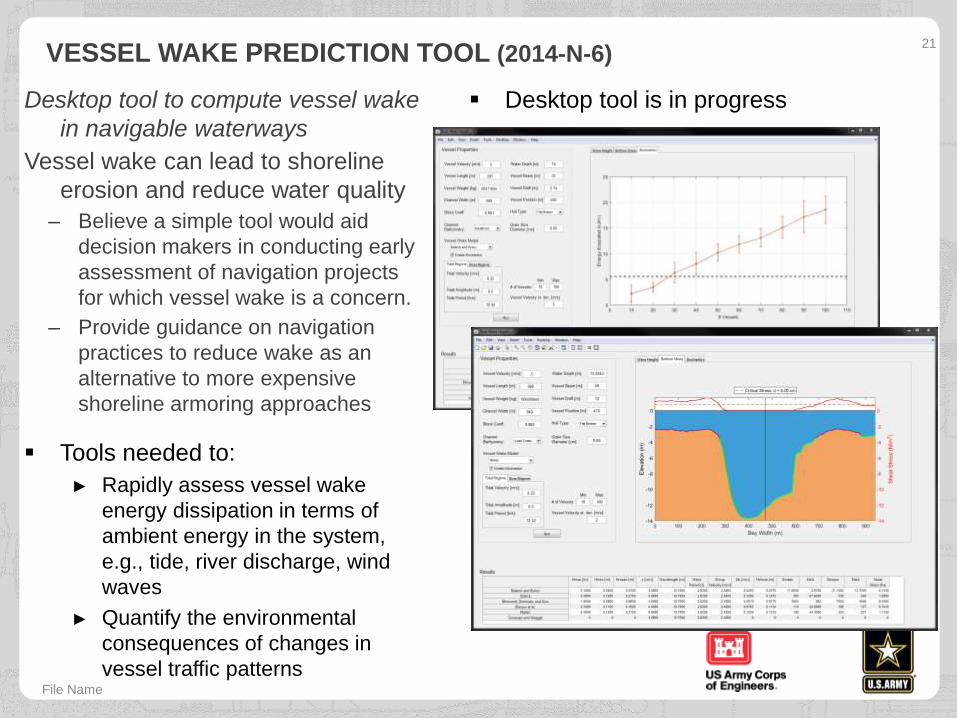
21VESSEL WAKE PREDICTION TOOL (2014-N-6)
Desktop tool to compute vessel wake
in navigable waterways
Vessel wake can lead to shoreline
erosion and reduce water quality
– Believe a simple tool would aid
decision makers in conducting early
assessment of navigation projects
for which vessel wake is a concern.
– Provide guidance on navigation
practices to reduce wake as an
alternative to more expensive
shoreline armoring approaches
▪ Tools needed to:
► Rapidly assess vessel wake
energy dissipation in terms of
ambient energy in the system,
e.g., tide, river discharge, wind
waves
► Quantify the environmental
consequences of changes in
vessel traffic patterns
▪ Desktop tool is in progress
HOUSTON SHIP CHANNEL – MULTIPLE VESSELS22
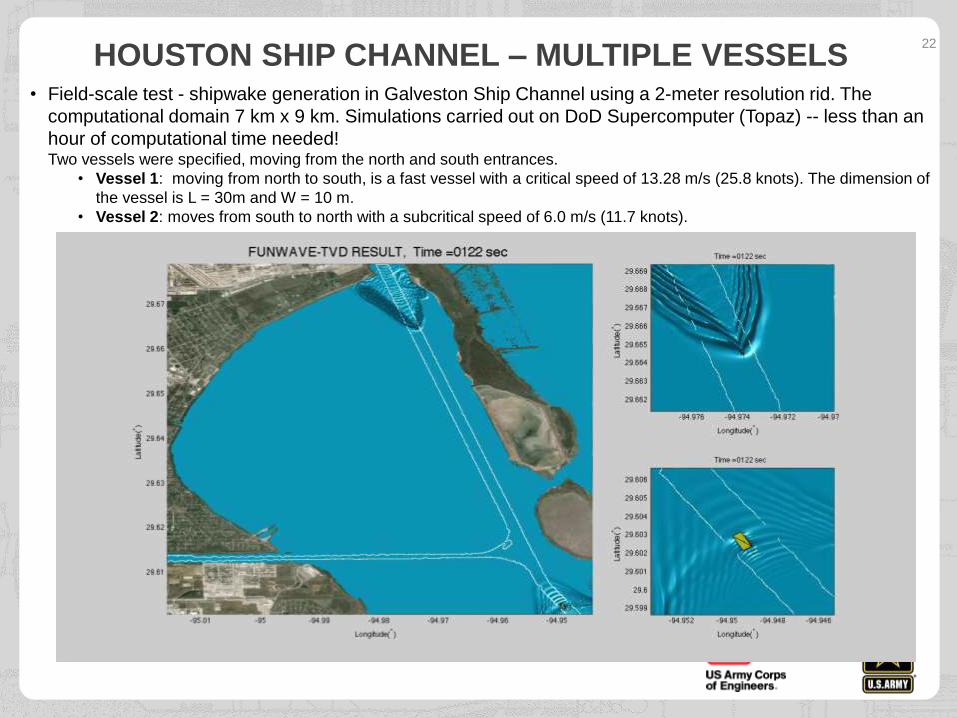
• Field-scale test - shipwake generation in Galveston Ship Channel using a 2-meter resolution rid. The
computational domain 7 km x 9 km. Simulations carried out on DoD Supercomputer (Topaz) -- less than an
hour of computational time needed!Two vessels were specified, moving from the north and south entrances.
• Vessel 1: moving from north to south, is a fast vessel with a critical speed of 13.28 m/s (25.8 knots). The dimension of
the vessel is L = 30m and W = 10 m.
• Vessel 2: moves from south to north with a subcritical speed of 6.0 m/s (11.7 knots).
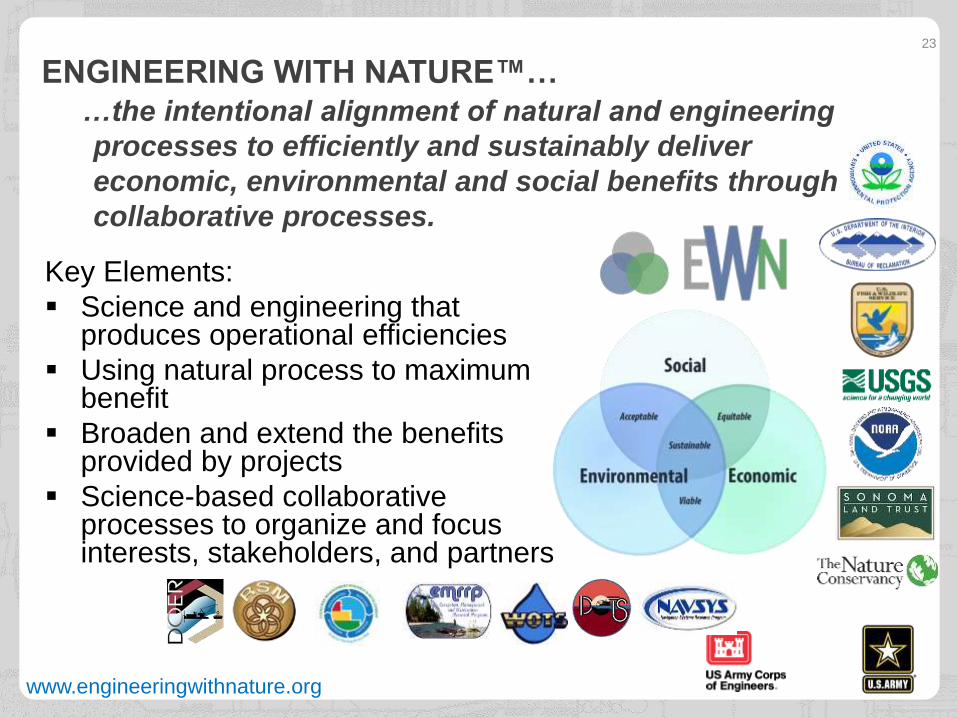
…the intentional alignment of natural and engineering
processes to efficiently and sustainably deliver
economic, environmental and social benefits through
collaborative processes.
Key Elements:
▪ Science and engineering that produces operational efficiencies
▪ Using natural process to maximum benefit
▪ Broaden and extend the benefits provided by projects
▪ Science-based collaborative processes to organize and focus interests, stakeholders, and partners
www.engineeringwithnature.org
ENGINEERING WITH NATURE™…23
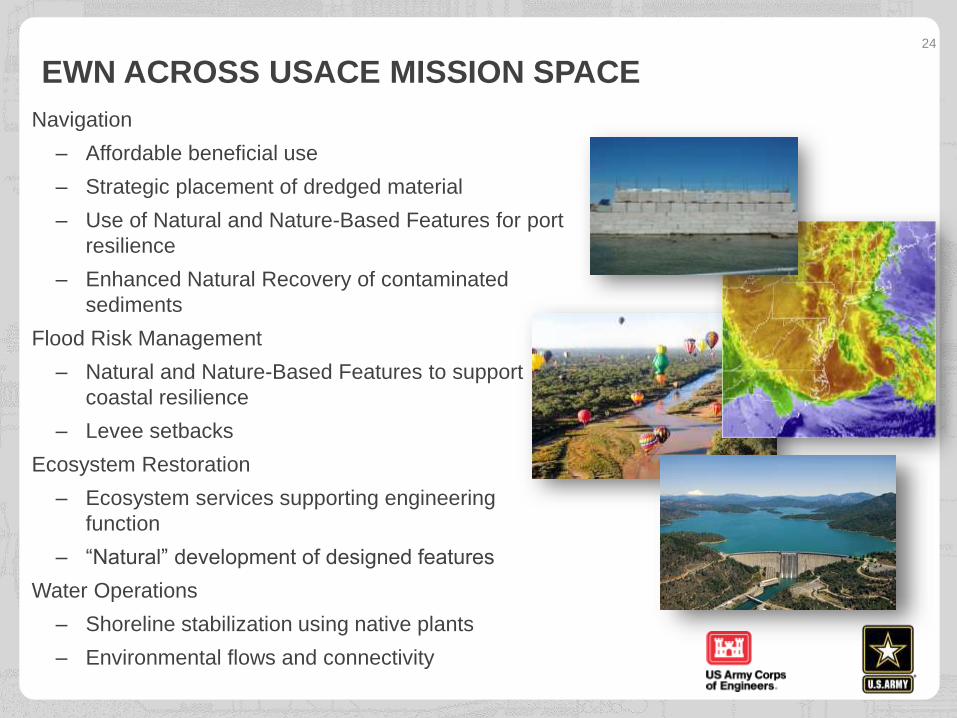
Navigation
– Affordable beneficial use
– Strategic placement of dredged material
– Use of Natural and Nature-Based Features for port
resilience
– Enhanced Natural Recovery of contaminated
sediments
Flood Risk Management
– Natural and Nature-Based Features to support
coastal resilience
– Levee setbacks
Ecosystem Restoration
– Ecosystem services supporting engineering
function
– “Natural” development of designed features
Water Operations
– Shoreline stabilization using native plants
– Environmental flows and connectivity
EWN ACROSS USACE MISSION SPACE24
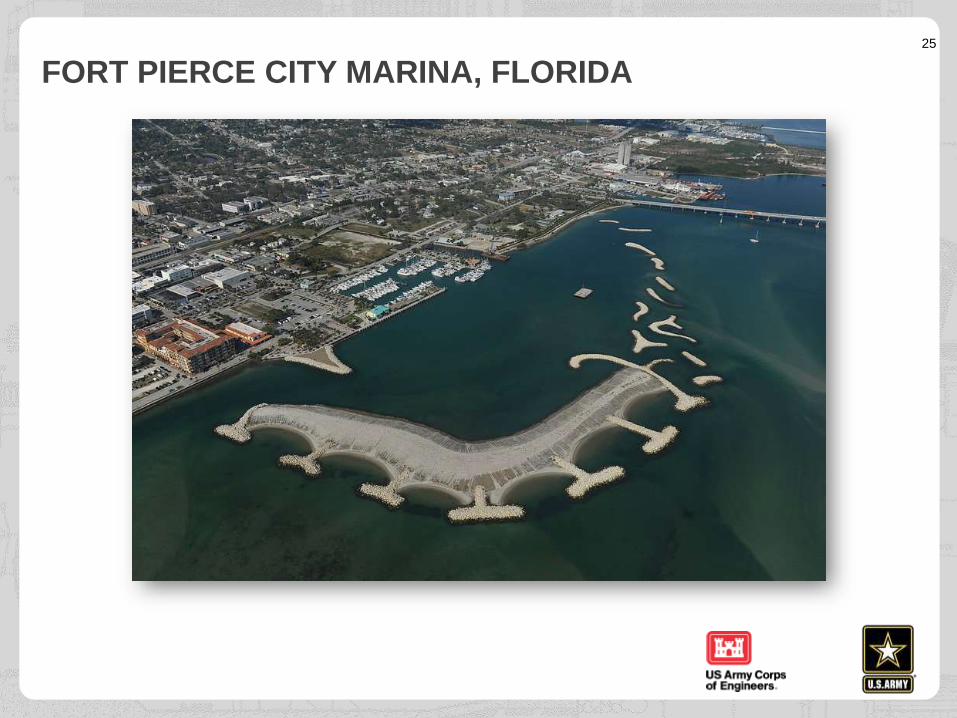
FORT PIERCE CITY MARINA, FLORIDA25
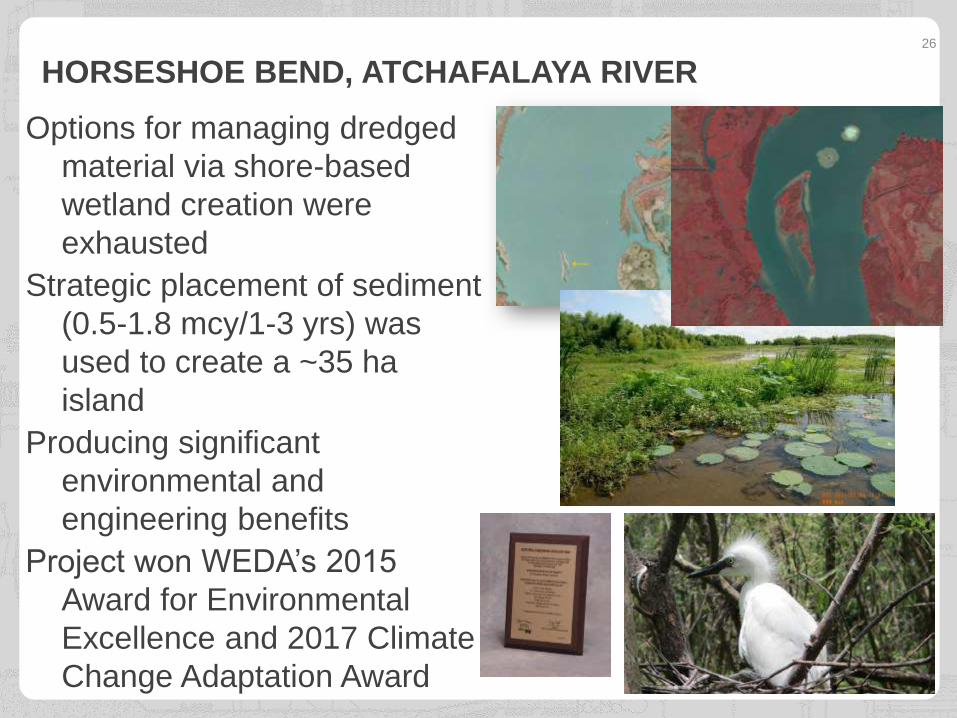
Options for managing dredged
material via shore-based
wetland creation were
exhausted
Strategic placement of sediment
(0.5-1.8 mcy/1-3 yrs) was
used to create a ~35 ha
island
Producing significant
environmental and
engineering benefits
Project won WEDA’s 2015
Award for Environmental
Excellence and 2017 Climate
Change Adaptation Award
HORSESHOE BEND, ATCHAFALAYA RIVER26
CONCLUSION
USACE R&D is working to address specific problems with
an underlying strategy for systems approaches and
harmonization of information.
Advancements are helping USACE deliver its navigation
mission.
Continued partnerships are essential to delivering and
advancing the marine transportation system in a viable
manner for the sustainment and growth of the Nation.
27