Embed Size (px)
Citation preview

OFFERING MEMORANDUM CONFIDENTIAL
US$1,000,000,000
ICICI Bank Limited, acting through its Hong Kong branch5.75% Notes due 2020Issue Price: 99.542%
We, ICICI Bank Limited, acting through our Hong Kong branch, are issuing US$1,000,000,000 of 5.75%notes due 2020, or the notes. The notes will mature on November 16, 2020. We may, at our option, redeem someor all of the notes at any time at the redemption prices described in this offering memorandum. We may alsoredeem the notes at any time in the event of certain changes in withholding taxes. The notes will bear interestfrom November 16, 2010 at a fixed rate of 5.75% per annum, payable semi-annually in arrears on May 16 andNovember 16 of each year, beginning May 16, 2011.
We have received approval in-principle for the listing of the notes on the Singapore Exchange SecuritiesTrading Limited, or the Singapore Exchange. The Singapore Exchange assumes no responsibility for thecorrectness of any statements made, opinions expressed or reports contained in this offering memorandum.Approval in-principle from, and admission of the notes to the Official List of, the Singapore Exchange are notto be taken as an indication of the merits of ICICI Bank Limited or the notes.
Investing in the notes involves risks. See “Risk Factors” beginning on page 16 for a discussion of risksrelevant to an investment in the notes.
The notes have been assigned a rating of “Baa2” by Moody’s Investors Service, Inc., or Moody’s, and arating of “BBB-” by Standard & Poor’s Rating Services, a division of The McGraw-Hill Companies, Inc., orS&P. The ratings address our ability to perform our obligations under the terms of the notes. A rating is not arecommendation to buy, sell or hold the notes and may be subject to suspension, reduction or withdrawal at anytime by Moody’s or S&P. A suspension, reduction or withdrawal of the rating assigned to the notes mayadversely affect the market price of the notes.
The notes have not been and will not be registered under the United States Securities Act of 1933, asamended, or the Securities Act, or the securities laws of any other jurisdiction and may not be offered orsold within the United States (as defined in Regulation S under the Securities Act) except pursuant to anexemption from, or in a transaction not subject to, the registration requirements of the Securities Act.Accordingly, the notes are being offered and sold only (i) in the United States to qualified institutionalbuyers in reliance on the exemption from the registration requirements of the Securities Act provided byRule 144A and (ii) outside the United States to non-US persons in compliance with Regulation S under theSecurities Act. For a description of certain restrictions on resales and transfers, see “TransferRestrictions”.
It is expected that the notes will be ready for delivery in book-entry form only through The Depository TrustCompany, or DTC, Euroclear Bank S.A./N.V., as operator of the Euroclear System, or Euroclear, andClearstream Banking, société anonyme, Luxembourg, or Clearstream, Luxembourg, and their respectiveparticipants, on or about November 16, 2010.
Joint Lead Managers and Bookrunners
Barclays Capital Citi Deutsche Bank
The date of this offering memorandum is November 8, 2010.

TABLE OF CONTENTS
Page
Notice to New Hampshire Residents . . . . . . . . . . . . . . . . . . . . . . . . . . . . . . . . . . . . . . . . . . . . . . iii
Available Information; Incorporation by Reference . . . . . . . . . . . . . . . . . . . . . . . . . . . . . . . . . . . . iv
Enforceability of Civil Liabilities . . . . . . . . . . . . . . . . . . . . . . . . . . . . . . . . . . . . . . . . . . . . . . . . iv
Forward-Looking Statements . . . . . . . . . . . . . . . . . . . . . . . . . . . . . . . . . . . . . . . . . . . . . . . . . . . v
Summary . . . . . . . . . . . . . . . . . . . . . . . . . . . . . . . . . . . . . . . . . . . . . . . . . . . . . . . . . . . . . . . . . 1
Risk Factors . . . . . . . . . . . . . . . . . . . . . . . . . . . . . . . . . . . . . . . . . . . . . . . . . . . . . . . . . . . . . . . 16
Use of Proceeds . . . . . . . . . . . . . . . . . . . . . . . . . . . . . . . . . . . . . . . . . . . . . . . . . . . . . . . . . . . . 35
Capitalization . . . . . . . . . . . . . . . . . . . . . . . . . . . . . . . . . . . . . . . . . . . . . . . . . . . . . . . . . . . . . . 36
Exchange Rates . . . . . . . . . . . . . . . . . . . . . . . . . . . . . . . . . . . . . . . . . . . . . . . . . . . . . . . . . . . . 37
Operating and Financial Review and Prospects . . . . . . . . . . . . . . . . . . . . . . . . . . . . . . . . . . . . . . 39
Business . . . . . . . . . . . . . . . . . . . . . . . . . . . . . . . . . . . . . . . . . . . . . . . . . . . . . . . . . . . . . . . . . 88
Overview . . . . . . . . . . . . . . . . . . . . . . . . . . . . . . . . . . . . . . . . . . . . . . . . . . . . . . . . . . . . . 88
History . . . . . . . . . . . . . . . . . . . . . . . . . . . . . . . . . . . . . . . . . . . . . . . . . . . . . . . . . . . . . . 89
Shareholding Structure and Relationship with the Government of India . . . . . . . . . . . . . . . . . 90
Strategy . . . . . . . . . . . . . . . . . . . . . . . . . . . . . . . . . . . . . . . . . . . . . . . . . . . . . . . . . . . . . . 91
Overview of Our Products and Services . . . . . . . . . . . . . . . . . . . . . . . . . . . . . . . . . . . . . . . 92
Treasury . . . . . . . . . . . . . . . . . . . . . . . . . . . . . . . . . . . . . . . . . . . . . . . . . . . . . . . . . . . . . 97
Principal Non-Banking Subsidiaries . . . . . . . . . . . . . . . . . . . . . . . . . . . . . . . . . . . . . . . . . . 99
Funding . . . . . . . . . . . . . . . . . . . . . . . . . . . . . . . . . . . . . . . . . . . . . . . . . . . . . . . . . . . . . . 101
Risk Management . . . . . . . . . . . . . . . . . . . . . . . . . . . . . . . . . . . . . . . . . . . . . . . . . . . . . . . 103
Loan Portfolio . . . . . . . . . . . . . . . . . . . . . . . . . . . . . . . . . . . . . . . . . . . . . . . . . . . . . . . . . 119
Classification of Loans . . . . . . . . . . . . . . . . . . . . . . . . . . . . . . . . . . . . . . . . . . . . . . . . . . . 122
Technology . . . . . . . . . . . . . . . . . . . . . . . . . . . . . . . . . . . . . . . . . . . . . . . . . . . . . . . . . . . 129
Competition . . . . . . . . . . . . . . . . . . . . . . . . . . . . . . . . . . . . . . . . . . . . . . . . . . . . . . . . . . . 131
Employees . . . . . . . . . . . . . . . . . . . . . . . . . . . . . . . . . . . . . . . . . . . . . . . . . . . . . . . . . . . . 132
Properties . . . . . . . . . . . . . . . . . . . . . . . . . . . . . . . . . . . . . . . . . . . . . . . . . . . . . . . . . . . . 133
Legal and Regulatory Proceedings . . . . . . . . . . . . . . . . . . . . . . . . . . . . . . . . . . . . . . . . . . . 133
Description of ICICI Bank’s Hong Kong Branch . . . . . . . . . . . . . . . . . . . . . . . . . . . . . . . . . . . . . 138
Management . . . . . . . . . . . . . . . . . . . . . . . . . . . . . . . . . . . . . . . . . . . . . . . . . . . . . . . . . . . . . . . 140
Overview of the Indian Financial Sector . . . . . . . . . . . . . . . . . . . . . . . . . . . . . . . . . . . . . . . . . . . 152
Supervision and Regulation . . . . . . . . . . . . . . . . . . . . . . . . . . . . . . . . . . . . . . . . . . . . . . . . . . . . 165
Description of the Notes . . . . . . . . . . . . . . . . . . . . . . . . . . . . . . . . . . . . . . . . . . . . . . . . . . . . . . 194
Form, Denomination and Transfer . . . . . . . . . . . . . . . . . . . . . . . . . . . . . . . . . . . . . . . . . . . . . . . . 208
Taxation . . . . . . . . . . . . . . . . . . . . . . . . . . . . . . . . . . . . . . . . . . . . . . . . . . . . . . . . . . . . . . . . . 213
United States Benefit Plan Investor Considerations . . . . . . . . . . . . . . . . . . . . . . . . . . . . . . . . . . . . 218
Plan of Distribution . . . . . . . . . . . . . . . . . . . . . . . . . . . . . . . . . . . . . . . . . . . . . . . . . . . . . . . . . 220
Transfer Restrictions . . . . . . . . . . . . . . . . . . . . . . . . . . . . . . . . . . . . . . . . . . . . . . . . . . . . . . . . . 224
Legal Matters . . . . . . . . . . . . . . . . . . . . . . . . . . . . . . . . . . . . . . . . . . . . . . . . . . . . . . . . . . . . . . 227
Independent Accountants . . . . . . . . . . . . . . . . . . . . . . . . . . . . . . . . . . . . . . . . . . . . . . . . . . . . . . 228
Description of Certain Differences Between Indian GAAP and US GAAP . . . . . . . . . . . . . . . . . . . 229
Important Information Relating To The Financial Information Presented . . . . . . . . . . . . . . . . . . . . . 235
Index to Financial Statements . . . . . . . . . . . . . . . . . . . . . . . . . . . . . . . . . . . . . . . . . . . . . . . . . . . F-1
i

In this offering memorandum, (i) references to “we”, “our” or to “us” mean, as the context requires,ICICI Bank Limited on an unconsolidated basis, or to ICICI Bank Limited and its subsidiaries on aconsolidated basis, and references to “ICICI Bank” or “the Bank” are to ICICI Bank Limited on anunconsolidated basis, (ii) references to “our Hong Kong branch” or the “Issuer” mean ICICI Bank Limited,acting through its Hong Kong branch, and (iii) references to “ICICI” are to ICICI Limited prior to itsamalgamation with ICICI Bank Limited. Reference to “the Scheme of Amalgamation” are to the Scheme ofAmalgamation of ICICI, ICICI Personal Financial Services and ICICI Capital Services with ICICI Banksanctioned by the High Court of Gujarat at Ahmedabad on March 7, 2002 and by the High Court of Judicatureat Bombay on April 11, 2002 and approved by the Reserve Bank of India on April 26, 2002. Reference to“Sangli Bank” are to the Sangli Bank Limited prior to its amalgamation with ICICI Bank, effective April 19,2007. References to “Bank of Rajasthan” are to the Bank of Rajasthan Limited, prior to its amalgamation withICICI Bank, effective as of the close of business on August 12, 2010.
In this offering memorandum, unless otherwise specified, all financial statements and financial data arefor ICICI Bank on an unconsolidated basis. In this offering memorandum, unless otherwise specified or thecontext otherwise requires, references to “$”, “US$”, “US dollars” and “dollars” are to United States dollarsand references to “ ”, “Rs.”, “rupee”, “rupees” or “Indian rupees” are to the legal currency of India.References to a particular “fiscal” year are to our fiscal year ended March 31 of such year. In this offeringmemorandum, references to “US” or “United States” are to the United States of America, its territories andits possessions. References to “India” are to the Republic of India.
Except as otherwise stated in this offering memorandum, all translations from Indian rupees to USdollars are based on exchange rate as set forth in the H.10 statistical release of the Federal Reserve Board atSeptember 30, 2010. The Federal Reserve Bank of New York certifies this rate for customs purposes in aweekly version of the H.10 release. The exchange rate as set forth in the H.10 statistical release of the FederalReserve Board at September 30, 2010 was Rs. 44.56 per $1.00. No representation is made that the Indian rupeeamounts have been, could have been or could be converted into US dollars at such a rate or any other rate.Any discrepancies in any table between totals and sums of the amounts listed are due to rounding.
This offering memorandum has been prepared by us solely for use in connection with the proposedplacement of the notes. Both we, as well as Barclays Bank PLC, Citigroup Global Markets Limited, andDeutsche Bank AG, Singapore Branch, being the Initial Purchasers, reserve the right to withdraw the offeringof the notes at any time or to reject any offer to purchase, in whole or in part, for any reason, or to sell lessthan all of the notes offered hereby. This offering memorandum is personal to the prospective investor towhom it has been delivered by the Initial Purchasers and does not constitute an offer to any other person orto the public in general to subscribe for or otherwise acquire the notes. Except as set forth in the paragraphbelow, distribution of this offering memorandum to any person other than the prospective investor and thosepersons, if any, retained to advise that prospective investor with respect thereto is unauthorized, and anydisclosure of its contents without our prior written consent is prohibited. Except as set forth in the paragraphbelow, the prospective investor, by accepting delivery of this offering memorandum, agrees to the foregoingand agrees not to make any photocopies of this offering memorandum.
This offering memorandum is intended solely for the purpose of soliciting indications of interest in thenotes from qualified investors and does not purport to summarize all of the terms, conditions, covenants andother provisions contained in the Indenture and other transaction documents described herein. The informationprovided is not all-inclusive. The market information in this offering memorandum has been obtained by usfrom publicly available sources deemed by us to be reliable. Notwithstanding any investigation that the InitialPurchasers may have conducted with respect to the information contained herein, the Initial Purchasers do notaccept any liability in relation to the information contained in this offering memorandum or its distribution orwith regard to any other information supplied by or on our behalf.
We confirm that, after having made all reasonable inquiries, this offering memorandum contains allinformation with regard to us and the notes which is material to the offering and sale of the notes, that theinformation contained in this offering memorandum is true and accurate in all material respects and is notmisleading in any material respect and that there are no omissions of any other facts from this offeringmemorandum which, by their absence herefrom, make this offering memorandum misleading in any materialrespect. We accept responsibility accordingly. The information presented in the section entitled “Overview ofthe Indian Financial Sector” has been accurately extracted from publicly available documents from varioussources, including officially prepared materials from the government of India and its various ministries andthe Reserve Bank of India, and has not been independently verified by us.
ii

This offering memorandum contains summaries intended to be accurate with respect to certain terms ofcertain documents, but reference is made to the actual documents, all of which will be made available toprospective investors upon request to us or the trustee for complete information with respect thereto, and allsuch summaries are qualified in their entirety by such reference.
We and the Initial Purchasers have not authorized anyone to provide any information to prospectiveinvestors in the notes, other than that contained or incorporated by reference in this offering memorandum. Weand the Initial Purchasers take no responsibility for, and can provide no assurance as to the reliability of, anyother information that others may give prospective investors in the notes. The information contained in thisoffering memorandum is accurate in all material respects only as of the date of this offering memorandum,regardless of the time of delivery of this offering memorandum or of any sale of the notes. Neither the deliveryof this offering memorandum nor any sale made hereunder shall under any circumstances imply that there hasbeen no change in our affairs and those of each of our respective subsidiaries or that the information set forthherein is correct in all material respects as of any date subsequent to the date hereof.
Prospective investors hereby acknowledge that (i) they have been afforded an opportunity to requestfrom us and to review, and have received, all additional information considered by them to be necessary toverify the accuracy of, or to supplement, the information contained herein, (ii) they have had the opportunityto review all of the documents described herein, (iii) they have not relied on the Initial Purchasers or anyperson affiliated with the Initial Purchasers in connection with any investigation of the accuracy of suchinformation or their investment decision, and (iv) no person has been authorized to give any information orto make any representation concerning us or the notes (other than as contained herein and information givenby our duly authorized officers and employees, as applicable, in connection with investors’ examination of usand the terms of this offering) and, if given or made, any such other information or representation should notbe relied upon as having been authorized by us or the Initial Purchasers.
In making an investment decision, prospective investors must rely on their examination of us andthe terms of this offering, including the merits and risks involved. The notes have not been approved orrecommended by any United States federal or state securities commission or any other United States,Hong Kong, Singapore or other regulatory authority. Furthermore, the foregoing authorities have notpassed upon or endorsed the merits of the offering or confirmed the accuracy or determined theadequacy of this offering memorandum. Any representation to the contrary is a criminal offense in theUnited States.
NOTICE TO NEW HAMPSHIRE RESIDENTS
Neither the fact that a registration statement or an application for a license has been filed underchapter 421-B of the New Hampshire revised statutes, or RSA 421-B, with the State of New Hampshirenor the fact that a note is effectively registered or a person is licensed in the State of New Hampshireconstitutes a finding by the Secretary of State of New Hampshire that any document filed under RSA421-B is true, complete and not misleading. Neither any such fact nor the fact that an exemption orexception is available for a note or a transaction means that the Secretary of State has passed in any wayupon the merits or qualifications of, or recommended or given approval to, any person, note ortransaction. It is unlawful to make, or cause to be made, to any prospective purchaser, customer orclient, any representation inconsistent with the provisions of this paragraph.
This offering memorandum does not constitute an offer to sell, or a solicitation of an offer to buy, anynotes offered hereby by any person in any jurisdiction in which it is unlawful for such person to make an offeror solicitation.
In connection with this issue, Deutsche Bank AG, Singapore Branch, or any of its affiliates (or anyperson acting on behalf of any of them) may, to the extent permitted by applicable laws and regulations,over-allot or effect transactions with a view to supporting the market price of the notes at a level higher thanthat which might otherwise prevail for a limited period after the issue date. However, there is no obligationon Deutsche Bank AG, Singapore Branch, or any of its affiliates (or any person acting on behalf of any ofthem), to do this. Such stabilization, if commenced, may be discontinued at any time, and must be brought toan end after a limited period.
iii

None of us, the Initial Purchasers, or any of our or their respective affiliates or representatives ismaking any representation to any offeree or purchaser of the notes offered hereby regarding the legalityof any investment by such offeree or purchaser under applicable legal investment or similar laws. Eachprospective investor should consult with its own advisors as to legal, tax, business, financial and relatedaspects of a purchase of the notes.
For this offering, we and the Initial Purchasers are relying upon exemptions from registration under theSecurities Act for offers and sales of securities which do not involve a public offering, including Rule 144Aunder the Securities Act. Prospective investors are hereby notified that sellers of the notes may be relyingon the exemption from the provision of Section 5 of the Securities Act provided by Rule 144A. The notesare subject to restrictions on transferability and resale. Purchasers of the notes may not transfer or resell thenotes except as permitted under the Securities Act and applicable state securities laws. See “TransferRestrictions”. Prospective investors should thus be aware that they may be required to bear the financial risksof this investment for an indefinite period of time.
The distribution of this offering memorandum and the offer and sale of the notes may, in certainjurisdictions, be restricted by law. Each purchaser of the notes must comply with all applicable laws andregulations in force in each jurisdiction in which it purchases, offers or sells the notes or possesses ordistributes this offering memorandum, and must obtain any consent, approval or permission required for thepurchase, offer or sale by it of the notes under the laws and regulations in force in any jurisdiction to whichit is subject or in which it makes purchases, offers or sales. There are restrictions on the offer and sale of thenotes, and the circulation of documents relating thereto, in certain jurisdictions including the United States,the United Kingdom, Hong Kong and Singapore, and to persons connected therewith. See “Plan ofDistribution—Selling Restrictions”.
Investors should contact the Initial Purchasers with any questions about this offering or if they requireadditional information to verify the information contained in this offering memorandum.
Neither the United States Securities and Exchange Commission, or the SEC, nor any state securitiescommission has approved or disapproved of these notes or determined if this offering memorandum is truthfulor complete. Any representation to the contrary is a criminal offense.
AVAILABLE INFORMATION; INCORPORATION BY REFERENCE
While any notes remain outstanding, we shall, during any period in which we are not subject to Section13 or 15(d) of the Securities Exchange Act of 1934, as amended, or the Exchange Act, or exempt fromreporting pursuant to Rule 12g3-2(b) under the Exchange Act, make available to any qualified institutionalbuyer (as defined in Rule 144A under the Securities Act) who is a holder and any prospective purchaser ofnotes who is a qualified institutional buyer (as so defined) designated by such holder, upon the request of suchholder or prospective purchaser, the information concerning us required to be provided to such holder orprospective purchaser by Rule 144A(d)(4) under the Securities Act.
Our audited consolidated financial statements at and for the year ended March 31, 2009 prepared inaccordance with generally accepted accounting principles in India, or Indian GAAP, as included in our 15thannual report to shareholders, which has previously been published, and which can be accessed athttp://www.icicibank.com/aboutus/zip/ICICI_Bank_Annual_Report_FY2009.zip, are incorporated byreference into this offering memorandum (but not any other parts of such annual report). Our auditedconsolidated financial statements at and for the year ended March 31, 2010 prepared in accordance with IndianGAAP, as included in our 16th annual report to shareholders, which has previously been published, and whichcan be accessed at http://www.icicibank.com/aboutus/zip/ICICI_Bank_Annual_Report_FY2010.zip, areincorporated by reference into this offering memorandum (but not any other parts of such annual report). Theinformation incorporated by reference is part of this offering memorandum. You should read the informationincorporated by reference together with other information in this offering memorandum.
ENFORCEABILITY OF CIVIL LIABILITIES
ICICI Bank is a limited liability company under the laws of India. Substantially all of our directors andexecutive officers and certain experts named herein reside outside the United States, and a substantial portionof our assets and the assets of such persons are located outside the United States. As a result, it may be difficult
iv

for investors to effect service of process upon such persons within the United States or to enforce against usor such persons in US courts judgments obtained in US courts, including judgments predicated upon the civilliability provisions of the federal securities laws of the United States.
India is not a party to any international treaty in relation to the recognition or enforcement of foreignjudgments. We understand that in India the statutory basis for recognition of foreign judgments is found inSection 13 of the Indian Code of Civil Procedure 1908, or the Civil Code, which provides that a foreignjudgment shall be conclusive as to any matter directly adjudicated upon except: (i) where the judgment hasnot been pronounced by a court of competent jurisdiction; (ii) where the judgment has not been given on themerits of the case; (iii) where the judgment appears on the face of the proceedings to be founded on anincorrect view of international law or a refusal to recognize the law of India in cases where such law isapplicable; (iv) where the proceedings in which the judgment was obtained were opposed to natural justice;(v) where the judgment has been obtained by fraud; or (vi) where the judgment sustains a claim founded ona breach of any law in force in India. Section 44A of the Civil Code provides that where a foreign judgmenthas been rendered by a court in any country or territory outside India which the government of India has bynotification declared to be a reciprocating territory, it may be enforced in India by proceedings in executionas if the judgment had been rendered by the relevant court in India. The United States has not been declaredby the government of India to be a reciprocating territory for purposes of Section 44A. Accordingly, ajudgment of a court in the United States may be enforced in India only by a suit upon the judgment, not byproceedings in execution. The suit must be brought in India within three years from the date of the judgmentin the same manner as any other suit filed to enforce a civil liability in India. It is unlikely that a court in Indiawould award damages on the same basis as a foreign court if an action is brought in India. Furthermore, it isunlikely that an Indian court would enforce foreign judgments if it viewed the amount of damages awardedas excessive or inconsistent with Indian practice. A party seeking to enforce a foreign judgment in India isrequired to obtain approval from the Reserve Bank of India under the Foreign Exchange Management Act,1999 to execute such a judgment or to repatriate any amount recovered. Also, a party may file suit in Indiaagainst us, our directors or our executive officers as an original action predicated upon the provisions of thefederal securities laws of the United States.
FORWARD-LOOKING STATEMENTS
We have included statements in this offering memorandum which contain words or phrases such as“will”, “would”, “aim”, “aimed”, “will likely result”, “is likely”, “are likely”, “believe”, “expect”, “expectedto”, “will continue”, “will achieve”, “anticipate”, “estimate”, “estimating”, “intend”, “plan”, “contemplate”,“seek to”, “seeking to”, “trying to”, “target”, “propose to”, “future”, “objective”, “goal”, “project”, “should”,“can”, “could”, “may”, “will pursue” and similar expressions or variations of such expressions that mayconstitute “forward-looking statements”. These forward-looking statements involve a number of risks,uncertainties and other factors that could cause actual results, opportunities and growth potential to differmaterially from those suggested by the forward-looking statements. These risks and uncertainties include, butare not limited to, the actual growth in demand for banking and other financial products and services in thecountries that we operate in or where a material number of our customers reside, our ability to successfullyimplement our strategy, including our retail deposit growth strategy, our use of the internet and othertechnology, our rural expansion, our exploration of merger and acquisition opportunities, our ability tointegrate recent or future mergers or acquisitions into our operations and manage the risks associated with suchacquisitions to achieve our strategic and financial objectives, our ability to manage the increased complexityof the risks we face following our rapid international growth, future levels of non-performing and restructuredloans, our growth and expansion in domestic and overseas markets, the adequacy of our allowance for creditand investment losses, technological changes, investment income, our ability to market new products, cashflow projections, the outcome of any legal, tax or regulatory proceedings in India and in other jurisdictionswe are or become a party to, the future impact of new accounting standards, our ability to implement ourdividend policy, the impact of changes in banking regulations and other regulatory changes in India and otherjurisdictions on us, including on the assets and liabilities of ICICI, a former financial institution not subjectto Indian banking regulations, the state of the global financial system and systemic risks, the bond and loanmarket conditions and availability of liquidity amongst the investor community in these markets, the natureof credit spreads and interest spreads from time to time, including the possibility of increasing credit spreadsor interest rates, our ability to roll over our short-term funding sources and our exposure to credit, market andliquidity risks. Neither we nor the Initial Purchasers undertake no obligation to update forward-lookingstatements to reflect events or circumstances after the date thereof.
v

In addition, other factors that could cause actual results to differ materially from those estimated by theforward-looking statements contained in this offering memorandum include, but are not limited to, themonetary and interest rate policies of India and the other markets in which we operate, natural calamities andenvironmental issues, general economic and political conditions in India, southeast Asia, and the othercountries which have an impact on our business activities or investments, political or financial instability inIndia or any other country caused by any factor including any terrorist attacks in India, the United States orelsewhere or any other acts of terrorism world-wide, any anti-terrorist or other attacks by the United States,a United States-led coalition or any other country, the monetary and interest rate policies of India, tensionsbetween India and Pakistan related to the Kashmir region or military armament or social unrest in any part ofIndia, inflation, deflation, unanticipated turbulence in interest rates, changes or volatility in the value of therupee, foreign exchange rates, equity prices or other rates or prices, the performance of the financial marketsin general, changes in domestic and foreign laws, regulations and taxes, changes in competition and the pricingenvironment in India and regional or general changes in asset valuations. For a further discussion of the factorsthat could cause actual results to differ, see the discussion under “Risk Factors” contained in this offeringmemorandum.
vi

SUMMARY
You should read the following summary together with the risk factors and the more detailed informationabout us and our financial results included elsewhere in this offering memorandum.
Overview
We are a diversified financial services group offering a wide range of banking and financial services tocorporate and retail customers through a variety of delivery channels. We are the largest private sector bankin India and the second largest bank in India, in terms of total assets. Apart from banking products andservices, we offer life and general insurance, asset management, securities brokering and private equityproducts and services through specialized subsidiaries.
Our primary business consists of commercial banking operations for corporate and retail customers. Weprovide a range of commercial banking and project finance products and services, including loan products, feeand commission-based products and services, deposit products and foreign exchange and derivatives productsto India’s leading corporations, middle market companies and small and medium enterprises. Our commercialbanking operations for retail customers consist of retail lending and deposit taking and distribution of thirdparty investment products. We deliver our products and services through a variety of channels, including bankbranches, ATMs, call centers and the internet. We had a network of 2,501 branches and 5,722 ATMs in Indiaat September 30, 2010. This includes 457 deposit taking branches and 131 ATMs of the Bank of Rajasthan,an old private sector bank that merged with us with effect from the close of business on August 12, 2010. Wealso offer agricultural and rural banking products.
In our international banking operations, our primary focus is on persons of Indian origin and Indianbusinesses. Our international branches and banking subsidiaries take deposits, raise borrowings and makeloans primarily to Indian companies for their overseas operations. They also engage in advisory andsyndication activities for fund-raising by Indian companies and their overseas operations. We currently havesubsidiaries in the United Kingdom, Canada and Russia, branches in Singapore, Dubai, Sri Lanka, Hong Kong,Qatar, the United States and Bahrain and representative offices in China, the United Arab Emirates,Bangladesh, South Africa, Malaysia, Thailand and Indonesia. Our subsidiary in the United Kingdom hasestablished a branch in Antwerp, Belgium and a branch in Frankfurt, Germany. Our subsidiaries in the UnitedKingdom and Canada and our branches in Bahrain, Singapore and Hong Kong have the largest share of ourinternational assets and liabilities.
Our treasury operations include maintenance and management of regulatory reserves, proprietary tradingin equity and fixed income and a range of foreign exchange and derivatives products and services for corporatecustomers, such as forward contracts, swaps and options. We take advantage of movement in markets to earntreasury income. Our international branches and subsidiaries also have investments in credit derivatives andin bonds of non-India financial institutions and asset backed securities.
We are also engaged in insurance, asset management, securities business and private equity fundmanagement through specialized subsidiaries. Our subsidiaries ICICI Prudential Life Insurance Company,ICICI Lombard General Insurance Company and ICICI Prudential Asset Management Company provide awide range of life and general insurance and asset management products and services to retail and corporatecustomers. ICICI Prudential Life Insurance Company was the largest private sector life insurance companywith a market share of about 9.9% in new business written (on retail weighted received premium basis) duringthe six months ended September 30, 2010. ICICI Lombard General Insurance Company was the largest privatesector general insurance company in India, with a market share of about 10.3% in gross written premiumduring the six months ended September 30, 2010. ICICI Prudential Asset Management Company manages theICICI Prudential Mutual Fund Limited, which was among the top three mutual funds in India in terms ofaverage funds under management in September 2010, with a market share of about 9.8%. We cross-sell theproducts of our insurance and asset management subsidiaries to our corporate and retail customers. ICICISecurities Limited and ICICI Securities Primary Dealership Limited are engaged in equity underwriting andbrokerage and primary dealership in government securities, respectively. ICICI Securities ownsicicidirect.com, a leading online brokerage platform. ICICI Securities Limited has a subsidiary in the UnitedStates, ICICI Securities Holdings Inc., which has a subsidiary in the United States, ICICI Securities Inc.,which is engaged in brokerage services. Our private equity fund management subsidiary ICICI Venture FundsManagement Company manages funds that undertake private equity investments.
1
Strategy
The key elements of our business strategy are to:
• focus on quality growth opportunities by:
• enhancing our retail and corporate franchise in both domestic and international markets;
• increasing the proportion of current and savings account and retail term deposits in ourdomestic deposit base;
• building a rural banking franchise; and
• strengthening our insurance, asset management and securities businesses
• emphasize conservative risk management practices and enhance asset quality;
• use technology for competitive advantage; and
• attract and retain talented professionals.
Our principal executive offices are located at ICICI Bank Towers, Bandra-Kurla Complex, Mumbai400051, India; our telephone number is (91) 22-2653-1414; and our website address is www.icicibank.com.The information on our website is not a part of this offering memorandum.
2

THE OFFERING
Issuer ................................................. ICICI Bank Limited, acting through its Hong Kong branch.
The Notes .......................................... US$1,000,000,000 of 5.75% notes due 2020.
Issue Price ......................................... 99.542% of the principal amount.
Maturity Date ................................... November 16, 2020.
Issue Date .......................................... November 16, 2010.
Indenture ........................................... The notes will be issued under an indenture to be dated on or aboutNovember 16, 2010, between us and The Bank of New York Mellon,as trustee.
Rating ................................................ The notes have been assigned a rating of “Baa2” by Moody’s and arating of “BBB-” by S&P.
The rating addresses our ability to perform our obligations under theterms of the notes. A rating is not a recommendation to buy, sell orhold the notes and may be subject to suspension, reduction orwithdrawal at any time by Moody’s or S&P. A suspension, reductionor withdrawal of the rating assigned to the notes may adverselyaffect the market price of the notes.
Interest .............................................. The notes will bear interest from November 16, 2010 at a fixed rateof 5.75% per annum, payable semi-annually in arrears.
Interest Payment Dates .................... Interest on the notes will be paid on May 16 and November 16 ofeach year, commencing on May 16, 2011.
Redemption at Maturity .................. Unless previously redeemed, or purchased and cancelled, the notesshall be redeemed at 100% of their principal amount in US dollars,plus any accrued and unpaid interest, on the maturity date.
Ranking ............................................. The notes will be our general unsecured and unsubordinatedobligations, and will rank pari passu amongst themselves and equalin right of payment with all of our existing and future unsecured andunsubordinated obligations that are not either (i) required to bepreferred by applicable law or (ii) by their terms expresslysubordinated in right of payment to the notes.
Use of Proceeds ................................. We intend to use the net proceeds of the issuance of the notes forgeneral corporate purposes in accordance with any applicable rulesor regulations.
Covenants .......................................... The terms of the indenture impose certain covenants on us that will,among other things, restrict our ability, subject to certain exceptions,to create or permit to be outstanding any security interest upon anyof our properties, assets or revenues to secure certain obligations asdescribed under the “Description of the Notes—CertainCovenants—Negative Pledge”.
In addition, the terms of the indenture will require us to meet certainconditions before we consolidate, merge or transfer substantially allour assets to another person without the consent of the holders of atleast 66 2/3% of the outstanding notes.
Further, the terms of the indenture will require us, among otherthings, to give notice to the trustee of any event of default under theindenture.
These covenants are subject to a number of important qualifications.See “Description of the Notes—Certain Covenants”.
3
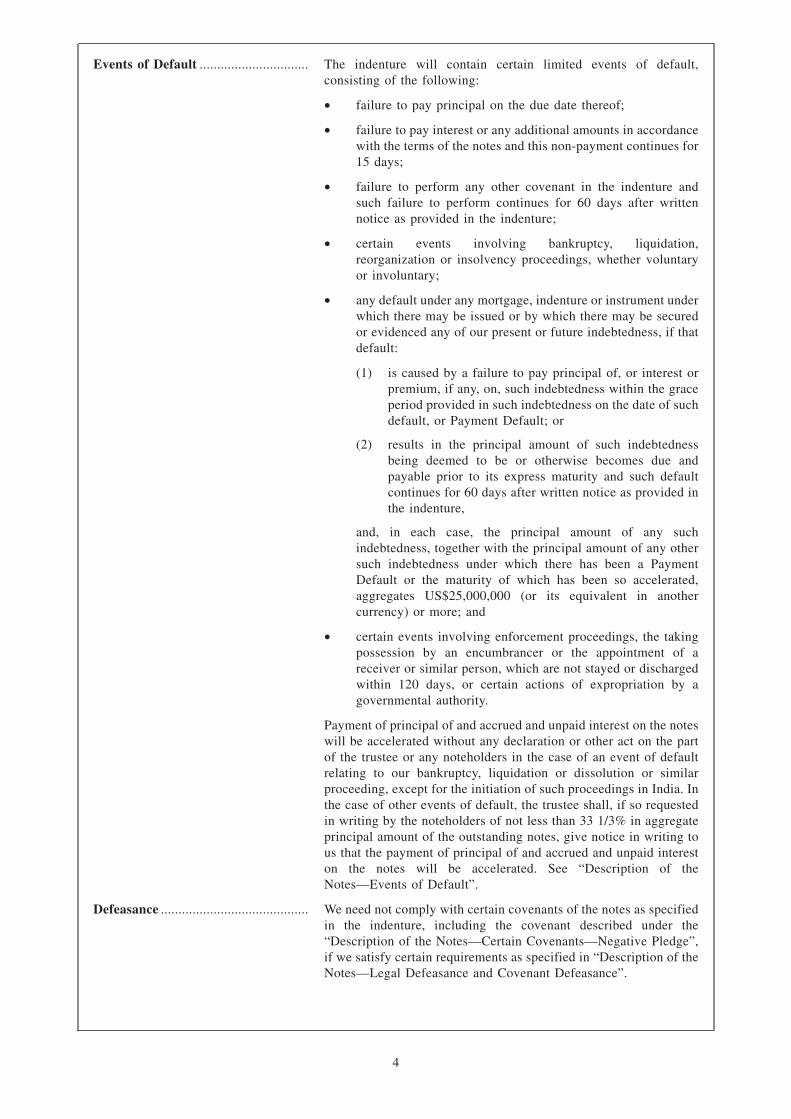
Events of Default ............................... The indenture will contain certain limited events of default,consisting of the following:
• failure to pay principal on the due date thereof;
• failure to pay interest or any additional amounts in accordancewith the terms of the notes and this non-payment continues for15 days;
• failure to perform any other covenant in the indenture andsuch failure to perform continues for 60 days after writtennotice as provided in the indenture;
• certain events involving bankruptcy, liquidation,reorganization or insolvency proceedings, whether voluntaryor involuntary;
• any default under any mortgage, indenture or instrument underwhich there may be issued or by which there may be securedor evidenced any of our present or future indebtedness, if thatdefault:
(1) is caused by a failure to pay principal of, or interest orpremium, if any, on, such indebtedness within the graceperiod provided in such indebtedness on the date of suchdefault, or Payment Default; or
(2) results in the principal amount of such indebtednessbeing deemed to be or otherwise becomes due andpayable prior to its express maturity and such defaultcontinues for 60 days after written notice as provided inthe indenture,
and, in each case, the principal amount of any suchindebtedness, together with the principal amount of any othersuch indebtedness under which there has been a PaymentDefault or the maturity of which has been so accelerated,aggregates US$25,000,000 (or its equivalent in anothercurrency) or more; and
• certain events involving enforcement proceedings, the takingpossession by an encumbrancer or the appointment of areceiver or similar person, which are not stayed or dischargedwithin 120 days, or certain actions of expropriation by agovernmental authority.
Payment of principal of and accrued and unpaid interest on the noteswill be accelerated without any declaration or other act on the partof the trustee or any noteholders in the case of an event of defaultrelating to our bankruptcy, liquidation or dissolution or similarproceeding, except for the initiation of such proceedings in India. Inthe case of other events of default, the trustee shall, if so requestedin writing by the noteholders of not less than 33 1/3% in aggregateprincipal amount of the outstanding notes, give notice in writing tous that the payment of principal of and accrued and unpaid intereston the notes will be accelerated. See “Description of theNotes—Events of Default”.
Defeasance .......................................... We need not comply with certain covenants of the notes as specifiedin the indenture, including the covenant described under the“Description of the Notes—Certain Covenants—Negative Pledge”,if we satisfy certain requirements as specified in “Description of theNotes—Legal Defeasance and Covenant Defeasance”.
4

Withholding Taxes; AdditionalAmounts ......................................... All payments of principal and interest in respect of the notes will be
made without withholding or deduction for any taxes or othergovernmental charges imposed by Hong Kong or India, or anypolitical subdivision or taxing authority thereof or therein, each ataxing jurisdiction, unless such withholding or deduction is requiredby law. In the event we are required to withhold or deduct amountsfor any such taxes or other governmental charges, we will pay suchadditional amounts so that the noteholders will receive the sameamounts as they would have received without such withholding ordeduction, subject to certain exceptions. We will pay any stamp,administrative, court, documentary, excise or property taxesimposed on the initial issuance and delivery of the notes in a taxingjurisdiction mentioned above and will indemnify the noteholders forany such taxes paid by the noteholders, excluding any such duties ortaxes which may relate to any transfer or transmission of the notesfollowing their initial issuance and delivery by us. See “Descriptionof the Notes—Additional Amounts”.
Optional Redemption ....................... We may, at our election and having given not less than 30 nor morethan 60 days’ notice to the holders in accordance with the termsdescribed under “Description of the Notes—Notices” (which noticeshall be irrevocable), redeem from time to time all or a portion of theoutstanding Notes at a “make whole” redemption price determinedin the manner set forth in this offering memorandum. See“Description of the Notes—Optional Redemption”.
Optional Tax Redemption ................ In the event that we determine that, (i) as a result of certain changesin or amendments to the laws or regulations of a taxing jurisdictionas described under “Description of theNotes—Redemption—Optional Tax Redemption”, we have been orwill be required to pay additional amounts as described under“Description of the Notes—Additional Amounts” and (ii) suchpayment of additional amounts cannot be avoided by our takingreasonable measures available to us, which may include changingthe jurisdiction from which or through which payments are made,we may, at our option, redeem the Notes at any time, in whole (andnot in part), at a redemption price equal to 100% of the principalamount of the notes then outstanding plus accrued and unpaidinterest on the principal amount being redeemed to (but excluding)the redemption date. See “Description of theNotes—Redemption—Optional Tax Redemption”.
Listing ................................................ We have received approval in-principle for the listing of the notes onthe Singapore Exchange. Approval in-principle from, and admissionto the Official List of, the Singapore Exchange are not to be takenas an indication of our merits or the merits of the notes. The noteswill be traded on the Singapore Exchange in a minimum board lotsize of S$200,000 (or its equivalent in foreign currencies) for solong as the notes are listed on the Singapore Exchange and the rulesof that exchange so require.
Transfer Restrictions ........................ The notes have not been registered under the Securities Act and maybe transferred only as described under “Transfer Restrictions”.
Governing Law ................................. The indenture, the notes, the related purchase agreement and otherrelated documents will be governed by the laws of the State of NewYork.
5

Clearance and Settlement ................ The notes will be issued in book-entry form through the facilities ofDTC, on the one hand, and Euroclear and Clearstream,Luxembourg, on the other, each with respect to their respectiveparticipants. Beneficial interests in notes held in book-entry formwill be entitled to receive physical delivery of certificated notesonly under certain circumstances. For a description of certainfactors relating to clearance and settlement, see “Form,Denomination and Transfer”.
Form and Denomination .................. The notes will be in fully registered form without interest couponsattached. The notes sold in reliance on Rule 144A under theSecurities Act, or Rule 144A, will be issued in the form of arestricted global note, or the Restricted Global Note, and the notessold in reliance on Regulation S under the Securities Act, orRegulation S, will be issued in the form of a Regulation S globalnote, or the Regulation S Global Note. The Restricted Global Notewill be registered in the name of Cede & Co. as nominee for, anddeposited with The Bank of New York Mellon as custodian for,DTC. The Regulation S Global Note will be registered in the nameof Cede & Co. as nominee for, and deposited with The Bank of NewYork Mellon as custodian for, DTC. The notes offered and sold inreliance on Rule 144A will be issued in minimum denominations ofUS$100,000 and integral multiples of US$1,000 in excess thereof.Notes offered and sold in reliance on Regulation S will be issued inminimum denominations of US$100,000 and integral multiples ofUS$1,000 in excess thereof. See “Form, Denomination andTransfer”.
Security Codes
Rule 144A Regulation S
CUSIP ............................................................................................ 44927J AC0 Y3860X AC7ISIN ................................................................................................ US44927JAC09 USY3860XAC75
6

SELECTED FINANCIAL AND OPERATING DATA
Our financial and other data for fiscal 2006 through fiscal 2010 included in this offering memorandumhave been derived from our audited unconsolidated financial statements prepared in accordance with generallyaccepted accounting principles in India, or Indian GAAP, guidelines issued by the Reserve Bank of India fromtime to time and practices generally prevailing in the banking industry in India. Our financial and other datafor the six months ended September 30, 2009 and September 30, 2010 have been derived from our auditedunconsolidated condensed financial statements. These financial statements do not include the results ofoperations of our subsidiaries and other consolidating entities. The principal subsidiaries whose results are notincluded are: ICICI Bank Canada, ICICI Bank Eurasia Limited Liability Company, ICICI Bank UK PLC,ICICI Home Finance Company Limited, ICICI Lombard General Insurance Company Limited, ICICIPrudential Asset Management Company Limited, ICICI Prudential Life Insurance Company Limited, ICICISecurities Limited, ICICI Securities Primary Dealership Limited and ICICI Venture Funds ManagementCompany Limited, certain consolidated funds managed by ICICI Venture Funds Management CompanyLimited.
Additionally, certain financial data for fiscal 2010 in this offering memorandum have been derived fromour consolidated financial statements which are prepared in accordance with Indian GAAP, guidelines issuedby the Reserve Bank of India from time to time and practices generally prevailing in the banking industry inIndia.
The unconsolidated financial statements for fiscal 2006 and for the six months ended September 30,2010 were audited by S.R. Batliboi & Co., Chartered Accountants. The unconsolidated financial statementsfor fiscal 2007, 2008, 2009 and 2010 and for the six months ended September 30, 2009 were audited by B SR & Co., Chartered Accountants. You should read the following discussion and analysis of our selectedfinancial and operating data with the more detailed information contained in our audited unconsolidatedfinancial statements.
Unless otherwise indicated, the financial information contained in this offering memorandum isunconsolidated and prepared in accordance with Indian GAAP, while the financial information in our annualreports on Form 20-F for the fiscal years 2006, 2007, 2008, 2009 and 2010 is based on our auditedconsolidated financial statements and accompanying notes prepared in accordance with Indian GAAP with thenet income and stockholders’ equity reconciled to US GAAP. For discussion of certain significant differencesbetween Indian GAAP and US GAAP, see “Description of Certain Differences between Indian GAAP and USGAAP”.
Operating Results Data
The operating results data for fiscal 2006, 2007, 2008, 2009 and 2010 and the six months endedSeptember 30, 2009 and September 30, 2010 are given below. The operating results data for the six monthsended September 30, 2010 includes the results of the Bank of Rajasthan for 49 days.
7

Year ended March 31, Six months ended September 30,
2006 2007 2008 2009 2010 2009 2010 2010
(Rupees in billions, except per share data) (US$ inmillions,
except pershare data)
Interest incomeInterest on advances(1) ............. Rs. 102.07 Rs. 160.96 Rs. 226.01 Rs. 223.24 Rs. 173.73 Rs. 95.79 Rs. 77.28 US$ 1,734
Income on investments(2) ......... 28.91 49.90 74.66 74.03 64.66 32.04 35.75 802
Interest on balances with theReserve Bank of India andother inter-bank funds andothers(3) ............................... 4.06 9.09 7.21 13.66 18.68 10.07 8.19 184
Total interest income .............. Rs. 135.04 Rs. 219.95 Rs. 307.88 Rs. 310.93 Rs. 257.07 Rs. 137.90 Rs. 121.22 US$ 2,720Interest expenseInterest on deposits .................. Rs. (58.37) Rs. (116.48) Rs. (171.10) Rs. (157.85) Rs. 115.13) Rs. (66.35) Rs. (47.29) (1061)
Interest on the Reserve Bankof India/inter-bankborrowings........................... (9.25) (13.00) (18.27) (20.05) (11.95) (6.95) (5.48) (123)
Others (including interest onborrowings of the erstwhileICICI Limited)(4) ................. (28.35) (34.10) (45.47) (49.36) (48.85) (24.39) (26.49) (594)
Total interest expense............. Rs. (95.97) Rs. (163.58) Rs. (234.84) Rs. (227.26) Rs. (175.93) Rs. (97.69) Rs. (79.26) US$ (1,778)
Net interest income ................ Rs. 39.07 Rs. 56.37 Rs. 73.04 Rs. 83.67 Rs. 81.14 Rs. 40.21 Rs. 41.96 US$ 942Non-interest incomeCommission, exchange and
brokerage(5) ......................... Rs. 30.02 Rs. 43.31 Rs. 56.05 Rs. 56.26 Rs. 48.31 Rs. 23.17 Rs. 26.04 US$ 584
Profit/(loss) on sale ofinvestments (net) ................. 7.50 11.15 18.80 18.00 5.47 3.56 1.09 24
Profit/(loss) on foreignexchange transactions (net) . 4.73 6.44 1.10 0.08 11.06 6.44 3.89 87
Profit/(loss) on revaluation ofinvestments (net) ................. (0.54) (0.35) (0.68) (5.14) 1.85 2.63 (1.46) (33)
Lease income............................ 3.61 2.38 2.17 2.33 1.57 1.07 0.62 14
Miscellaneous income(6)........... 4.51 6.35 10.67 4.50 6.52 2.27 2.40 54
Total non-interest income ...... Rs. 49.83 Rs. 69.28 Rs. 88.11 Rs. 76.03 Rs. 74.78 Rs. 39.14 Rs. 32.58 US$ 730
Total income............................ Rs. 88.90 Rs. 125.65 Rs. 161.15 Rs. 159.70 Rs. 155.92 Rs. 79.35 Rs. 74.54 US$ 1,672Non-interest expenseOperating expenses(7) ............... (35.48) (49.79) (64.29) (63.06) (55.93) (28.25) (29.27) (657)
Direct marketing agencyexpenses(8) ........................... (11.77) (15.24) (15.43) (5.29) (1.25) (0.48) (0.71) (16)
Depreciation on leased assets .. (2.77) (1.88) (1.82) (2.10) (1.42) (0.98) (0.56) (13)
Total non-interest expense ..... Rs. (50.02) Rs. (66.91) Rs. (81.54) Rs.(70.45) Rs. (58.60) Rs. (29.71) Rs. (30.54) US$ (686)
Operating profit beforeprovisions ........................... Rs. 38.88 Rs. 58.74 Rs. 79.61 Rs. 89.25 Rs. 97.32 Rs. 49.64 Rs. 44.00 US$ 986
Provisions and contingencies ... (7.92) (22.26) (29.05) (38.08) (43.87) (23.95) (14.39) (323)
Profit before tax ..................... Rs. 30.96 Rs. 36.48 Rs. 50.56 Rs. 51.17 Rs. 53.45 Rs. 25.69 Rs. 29.61 US$ 663Tax(9) ........................................ (5.56) (5.38) (8.98) (13.59) (13.20) (6.51) (6.99) (157)
Profit after tax ........................ Rs. 25.40 Rs. 31.10 Rs. 41.58 Rs. 37.58 Rs. 40.25 Rs. 19.18 Rs. 22.62 US$ 506
Dividend per share ................. Rs. 8.50 Rs. 10.00 Rs. 11.00 Rs. 11.00 Rs. 12.00 — — —Dividend tax per share ............. 1.19 1.70 1.34 1.36 1.47 — — —
Earnings per share(basic)(10) .... 32.49 34.84 39.39 33.76 36.14 17.23 20.11
Earnings per share(diluted)(10) .......................... 32.15 34.64 39.15 33.70 35.99 17.17 20.03
8

(1) Interest on advances represents interest on rupee and foreign currency loans and advances (including bills) and hire purchasereceivables and gains/losses on sell-down of loans.
(2) Income on investments represents primarily interest earned on government and other approved securities held for statutoryliquidity ratio (SLR) compliance, debentures, bonds and dividend income from equity and other investments in mutualfunds/companies other than subsidiaries and fully owned consolidated entities. As per general clarification from Reserve Bank ofIndia dated July 11, 2007 on circular DBOD.BP.BC.87/21.04.141/2006-07 dated April 20, 2007, the Bank has deducted theamortization of premium on government securities from “income from investments” included in interest income, which was earlierdeducted from “profit/loss on revaluation of investments (net)” in non-interest income.
(3) Includes interest on income tax refund of Rs. 0.84 billion for six months ended September 30, 2010 (Six months ended September30, 2009: Rs. 0.72 billion).
(4) Interest expense - others primarily includes interest expense on refinance from financial institutions, borrowings taken over fromICICI, commercial paper, bonds and debentures, subordinated debt, bills rediscounted and borrowings outside India frommultilateral and bilateral credit agencies, banks, institutions and consortiums.
(5) Commission, exchange and brokerage primarily includes income from commissions on guarantees, letters of credit, cashmanagement services, loan processing fees, project advisory and structuring and syndication fees, commission for distribution ofproducts and fees from credit and debit card and demat accounts. It also includes commission on bills for collection and billspurchased/discounted. It does not include merchant foreign exchange income and margin on customer derivative transactions,which are included in profit/(loss) on exchange transactions.
(6) Miscellaneous income primarily includes dividend income from subsidiaries and affiliates and profit/(loss) on sale of properties.
(7) Operating expenses primarily include employee expenses, establishment expenses, depreciation on fixed assets, amortization ofexpenses related to early retirement option scheme (up to fiscal 2009) and other general office expenses.
(8) Direct marketing agency expense includes commissions paid to direct marketing agents or associates in connection with sourcingour retail assets. These commissions are expensed up front and not amortized over the life of the loan. Commission paid to directmarketing agents/dealers for origination of retail automobile loans which was being reduced from “Interest on advances” up tofiscal 2006 has now been reclassified to “Direct marketing agency expenses”. Prior period figures have been reclassified toconform to the current classification.
(9) Tax includes income tax (net of deferred tax), wealth tax and fringe benefit tax (up to fiscal 2009). The levy of fringe benefit taxis not applicable as Finance (No.2) Act, 2009 has abolished fringe benefit tax with effect from fiscal 2010.
(10) Earnings per share is computed based on weighted average number of shares.
(11) Figures of the previous years have been reclassified to conform to the current period presentation.
For other notes to accounts, please refer to the audited unconsolidated financial statements for fiscal2008, 2009 and 2010 and the audited unconsolidated condensed financial statements for the six months endedSeptember 30, 2009 and 2010 included elsewhere in this offering memorandum.
9

Balance Sheet DataThe balance sheet data at March 31, 2006, 2007, 2008, 2009 and 2010 and at September 30, 2009 and
2010 is given below. Balance sheet data at September 30, 2010 includes the results of the Bank of Rajasthan.
At March 31, At September 30,
2006 2007 2008 2009 2010 2009 2010 2010
(Rupees in billions, except per share data) (US$ inmillions,
except pershare data)
Assets:Cash in hand and balance with
the Reserve Bank of India .... Rs. 89.34 Rs. 187.07 Rs. 293.78 Rs. 175.36 Rs. 275.14 Rs. 200.39 Rs. 228.67 US$ 5132Balance with banks and money
at call and short notice ......... 81.06 184.14 86.64 124.30 113.59 92.28 119.81 2689Investments (net of provisions)Government and other approved
securities, in India ................ 510.75 673.68 753.88 633.87 684.04 778.44 696.99 15642Debentures and bonds, in India . 18.04 24.63 18.87 26.00 36.35 16.58 96.89 2174Others(1) ..................................... 186.68 214.27 341.79 370.71 488.54 404.63 568.87 12766
Total investments ...................... Rs. 715.47 Rs. 912.58 Rs. 1,114.54 Rs. 1,030.58 Rs. 1,208.93 1,199.65 Rs. 1,362.75 US$ 30,582Advances (net of provision)(2) ... 1,461.63 1,958.66 2,256.16 2,183.11 1,812.06 1,908.60 1,942.01 43,582Fixed assets (including leased
assets) ................................... 39.81 39.23 41.08 38.02 32.13 35.51 47.81 1,073Others assets(3) ........................... 126.58 164.90 205.75 241.64 192.15 227.31 198.93 4,465
Total assets ................................ Rs. 2,513.89 Rs. 3,446.58 Rs. 3,997.95 Rs. 3,793.01 Rs. 3,634.00 Rs. 3,663.74 Rs. 3,899.98 US$ 87,523
Liabilities and capital:Saving deposits .......................... Rs. 209.37 Rs. 288.39 Rs. 390.89 Rs. 410.36 Rs. 532.18 Rs. 493.18 Rs. 632.48 US$ 14194Other demand deposits............... 165.73 213.76 246.91 216.32 309.98 236.12 348.57 7822Term deposits ............................. 1,275.73 1,802.95 1,806.51 1,556.80 1,178.01 1,249.02 1249.89 28,050
Total deposits ............................ Rs. 1,650.83 Rs. 2,305.10 Rs. 2,444.31 Rs. 2,183.48 Rs. 2,020.17 1,978.32 Rs. 2,230.94 US$ 50,066Borrowings(4) ............................. 385.22 512.56 656.48 673.24 609.47 722.24 621.28 13,943Subordinated unsecured
redeemable debenture/bonds(5) ................................. 101.44 194.05 207.50 254.82 329.67 275.49 345.32 7,749
Preference share capital ............. 3.50 3.50 3.50 3.50 3.50 3.50 3.50 79Other liabilities and
provisions(6) .......................... 150.84 188.24 221.45 182.64 155.01 171.61 159.19 3573Equity capital ............................. 8.90 8.99 11.13 11.13 11.15 11.14 11.51 258Reserves and surplus: .............Statutory reserves ....................... 20.99 28.79 39.39 48.79 58.86 48.79 60.87 1366Special reserve ........................... 14.69 19.19 20.94 23.44 26.44 23.44 26.44 593Capital reserves .......................... 5.53 6.74 8.01 16.19 20.63 16.19 20.63 463Securities premium..................... 118.18 120.15 312.47 312.92 313.51 313.03 312.18 7,006Investment reserve account ........ — — — — 1.16 — 1.16 26Foreign currency translation
reserve................................... — (0.50) (1.39) 4.97 (0.02) 2.91 (0.09) (2)Revenue & other reserves(7) ..... 50.84 49.79 49.79 49.79 49.81 49.80 49.81 1,118Balance in profit & loss
account.................................. 2.93 9.98 24.37 28.10 34.64 47.28 57.24 1,285
Total reserves and surplus....... 213.16 234.14 453.58 484.20 505.03 501.44 528.24 11,855
Total liabilities and capital ..... Rs. 2,513.89 Rs. 3,446.58 Rs. 3,997.95 Rs. 3,793.01 Rs. 3,634.00 Rs. 3,663.74 Rs. 3,899.98 US$ 87,523
Contingent liabilities: .............Claims against bank not
acknowledged as debts ......... Rs. 29.78 Rs. 39.12 Rs. 40.31 Rs. 32.82 Rs. 33.57 Rs. 32.42 Rs. 31.57 708Liability for partly paid
investments ........................... 0.17 0.17 0.13 0.13 0.13 0.13 0.13 3Liability on account of
outstanding forwardexchange contracts(8) ............ 918.31 1,331.56 3,071.71 2,583.67 1,660.69 1,875.35 2,175.48 48,821
Guarantees given on behalf ofconstituents ........................... 191.03 292.12 412.82 580.88 618.36 587.38 705.10 15,824
Acceptances, endorsements &other obligations ................... 106.87 186.71 250.99 306.78 321.22 310.23 332.50 7,462
Currency swaps(8) ...................... 172.42 325.26 477.04 569.65 524.79 601.49 491.52 11,030Interest rate swaps & currency
options(8),(9) .......................... 2,471.92 3,791.14 7,665.29 4,146.35 4,012.14 3,861.42 4,656.32 10,4496Other items for which ICICI
Bank is contingently liable ... 59.84 107.74 192.54 126.55 99.94 126.63 75.84 1702
Total ........................................... Rs. 3,950.34 Rs. 6,073.82 Rs. 12,110.83 Rs. 8,346.83 Rs. 7,270.84 Rs. 7,395.05 Rs. 8,468.46 US$ 190,046
Bills for collection .................... 43.38 40.47 42.78 60.00 64.75 61.74 75.34 1,691
10

(1) Includes investment in government securities issued outside India.
(2) Advances include rupee/foreign currency loans, assistance by way of securitization, loans under retail finance operations andreceivables under finance leases.
(3) Other assets primarily include interest accrued but not due at period end, advances paid for capital assets, advance taxes paid,deposits for utilities, outstanding fee and other income, inter office adjustments (net debit), non-banking assets acquired insatisfaction of claims and deferred tax assets.
(4) Borrowings include call borrowings and refinance from the Reserve Bank of India, banks and other financial institutions,borrowings taken over from ICICI, bonds and debentures, commercial paper and borrowings outside India from multilateral andbilateral credit agencies, banks, institutions and consortiums.
(5) Unsecured redeemable debenture/bonds include unsecured borrowings eligible for inclusion in upper tier II, lower tier II and lowertier I capital for capital adequacy purposes included in Schedule 4 — “Borrowings”. At year-end fiscal 2010, it includes applicationmoney subsequently allotted.
(6) Other liabilities and provisions include bills payable, interest accrued but not due, creditors for expenses, unclaimed refunds,brokerage and interest, proposed dividend, dividend tax thereon, inter office adjustments (net credit), general provision on standardassets as per the Reserve Bank of India norms and security deposits from clients.
(7) Revenue and other reserves at year-end fiscal 2007 is net of transition adjustment of Rs. 1.06 billion on account of first timeadoption of Accounting Standard 15 (revised) on “Employee Benefits” issued by the Institute of Chartered Accountants of India.
(8) Represents notional principal amounts.
(9) Figures for fiscal 2006 do not include amount of options sold.
(10) Figures for the previous years have been reclassified to conform to the current period presentation.
11

Average Balance Sheet
The following table sets forth, for the periods indicated, the average balances of the assets and liabilitiesoutstanding, along with the related interest income (including dividend income) and interest expense. Theaverage balances are the average of daily balances except averages of foreign branches which are calculatedon a monthly basis.
Year ended March 31,
2008 2009 2010
Averagebalance
Interestincome/expense
Averageyield/cost
Averagebalance
Interestincome/expense
Averageyield/cost
Averagebalance
Interestincome/expense
Averageyield/cost
(Rupees in billions, except percentages)Advances .......................Rs. 2,037.71 Rs. 226.01 11.1% Rs. 2,192.80 Rs. 223.24 10.2% Rs. 1,915.39 Rs. 173.73 9.1%
Investments(1)................. 971.32 74.66 7.7 971.00 74.03 7.6 1,046.05 64.66 6.2
Others ............................ 279.31 7.21 2.6 272.40 13.66 5.0 298.22 18.68 6.3
Total averageinterest-earningassets ........................ 3,288.34 307.88 9.4% 3,436.20 310.93 9.1% 3,259.66 257.07 7.9%
Fixed assets ................... 38.91 — — 39.70 — — 35.46 — —
Other assets ................... 387.14 — — 454.66 — — 436.17 — —
Less: Adjustments ........ (38.86) — — (94.72) — — (158.30) — —
Total average assets .....Rs. 3,675.53 Rs. 307.88 Rs. 3,835.84 Rs. 310.93 Rs. 3,572.99 Rs. 257.07
Deposits ......................... 2,268.13 171.10 7.5% 2,180.14 157.85 7.2% 1,970.60 115.13 5.8%
Saving deposits .............. 335.48 8.81 2.6 391.75 10.64 2.7 452.49 12.60 2.8
Other demand deposits .. 226.78 — — 188.76 — — 188.09 — —
Term deposits................. 1,705.87 162.29 9.5 1,599.63 147.21 9.2 1,330.02 102.53 7.7
Borrowings(1) ................. 851.15 63.74 7.5 1,069.03 69.41 6.5 1,084.27 60.80 5.6
Total averageinterest-bearingliabilities .................. 3,119.28 234.84 7.5% 3,249.16 227.26 7.0% 3,054.87 175.93 5.8%
Capital and reserves(2) ... 398.07 — 496.19 — 513.76 —
Other liabilities .............. 197.04 — 185.21 — 162.66 —
Less: Repurchasetransactions ............... (38.86) — (94.72) — (158.30) —
Total averageliabilities ..................Rs. 3,675.53 Rs. 234.84 Rs. 3,835.84 Rs. 227.26 Rs. 3,572.99 Rs. 175.93
(1) Average investments and average borrowings are grossed up for average short-term repurchase transactions on Government ofIndia securities, which are accounted for as sale and repurchase arrangements for financial reporting. Accordingly, average otherassets and average other liabilities are adjusted to that extent.
(2) Excludes preference share capital.
(3) The average balances are the averages of daily balances, except averages of foreign branches which are calculated on a monthlybasis.
12

Six months ended September 30,
2009 2010
Averagebalance
Interestincome/expense
Averageyield/cost(3)
Averagebalance
Interestincome/expense
Averageyield/cost(3)
(Rupees in billions, except percentages)Advances............................................... Rs. 2,007.84 Rs. 95.79 9.5% Rs. 1,837.33 Rs. 77.28 8.4%
Investments(1)........................................ 991.86 32.04 6.4 1,176.34 35.75 6.1
Others ................................................... 334.68 10.07 6.0 246.39 8.19 6.6
Total interest-earning assets............... 3,334.38 137.90 8.3% 3,260.06 121.22 7.4%
Fixed assets........................................... 36.78 37.56
Other assets(1) ....................................... 475.29 419.60
Less: Adjustments................................. (174.85) (16.51)
Total assets .......................................... Rs. 3,671.60 Rs. 137.90 Rs. 3,700.71 Rs. 121.22
Deposits ................................................ 2,050.64 66.35 6.5% 1,964.74 47.29 4.8%
Saving deposits ..................................... 426.20 5.86 2.7 542.69 9.40 3.5
Other demand deposits ......................... 185.90 — — 210.42 — —
Term deposits........................................ 1,438.54 60.49 8.4 1,211.63 37.89 6.2
Borrowings(1) ........................................ 1,101.48 31.34 5.7 1,068.73 31.97 6.0
Total interest-bearing liabilities ......... 3,152.12 97.69 6.2% 3,033.47 79.26 5.2%Capital and reserves(2) .......................... 511.30 — 529.80 — —
Other liabilities(1).................................. 183.03 — 153.95 — —
Less: Adjustments................................. (174.85) (16.51)
Total liabilities..................................... Rs. 3,671.60 Rs. 97.69 Rs. 3,700.71 Rs. 79.26
(1) Average investments and average borrowings of the six months ended September 30, 2009 are grossed up for average short-termrepurchase transactions on Government of India securities, which are accounted for as sale and repurchase arrangements forfinancial reporting. Effective April 1, 2010, market repurchase transactions with banks and financial institutions are beingaccounted as borrowing and lending transactions.
(2) Excludes preference share capital.
(3) Average yield and average costs for the six months ended September 30, 2009 and September 30, 2010 are annualized.
(4) The average balances are the averages of daily balances, except averages of foreign branches which are calculated on a monthlybasis and averages of the erstwhile Bank of Rajasthan which are calculated as two point averages.
13
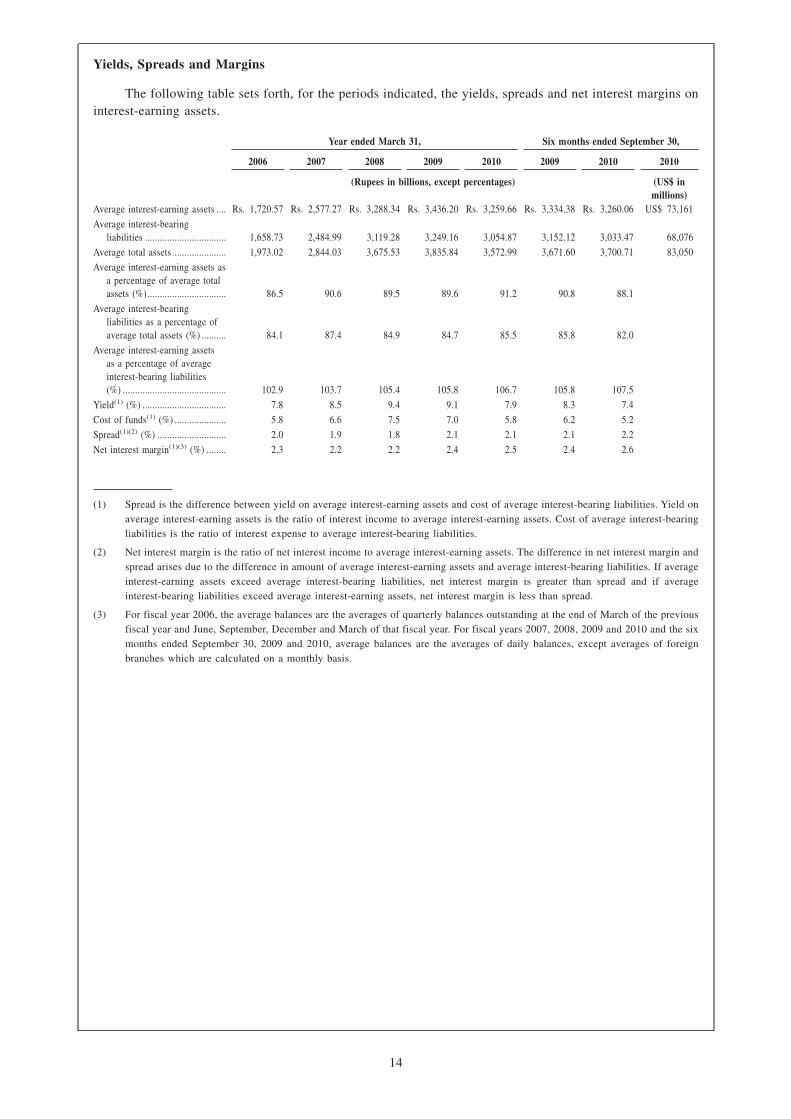
Yields, Spreads and Margins
The following table sets forth, for the periods indicated, the yields, spreads and net interest margins oninterest-earning assets.
Year ended March 31, Six months ended September 30,
2006 2007 2008 2009 2010 2009 2010 2010
(Rupees in billions, except percentages) (US$ inmillions)
Average interest-earning assets .... Rs. 1,720.57 Rs. 2,577.27 Rs. 3,288.34 Rs. 3,436.20 Rs. 3,259.66 Rs. 3,334.38 Rs. 3,260.06 US$ 73,161
Average interest-bearingliabilities ................................. 1,658.73 2,484.99 3,119.28 3,249.16 3,054.87 3,152.12 3,033.47 68,076
Average total assets ...................... 1,973.02 2,844.03 3,675.53 3,835.84 3,572.99 3,671.60 3,700.71 83,050
Average interest-earning assets asa percentage of average totalassets (%)................................ 86.5 90.6 89.5 89.6 91.2 90.8 88.1
Average interest-bearingliabilities as a percentage ofaverage total assets (%) .......... 84.1 87.4 84.9 84.7 85.5 85.8 82.0
Average interest-earning assetsas a percentage of averageinterest-bearing liabilities(%) .......................................... 102.9 103.7 105.4 105.8 106.7 105.8 107.5
Yield(1) (%) .................................. 7.8 8.5 9.4 9.1 7.9 8.3 7.4
Cost of funds(1) (%) ..................... 5.8 6.6 7.5 7.0 5.8 6.2 5.2
Spread(1)(2) (%) ............................ 2.0 1.9 1.8 2.1 2.1 2.1 2.2
Net interest margin(1)(3) (%) ........ 2.3 2.2 2.2 2.4 2.5 2.4 2.6
(1) Spread is the difference between yield on average interest-earning assets and cost of average interest-bearing liabilities. Yield onaverage interest-earning assets is the ratio of interest income to average interest-earning assets. Cost of average interest-bearingliabilities is the ratio of interest expense to average interest-bearing liabilities.
(2) Net interest margin is the ratio of net interest income to average interest-earning assets. The difference in net interest margin andspread arises due to the difference in amount of average interest-earning assets and average interest-bearing liabilities. If averageinterest-earning assets exceed average interest-bearing liabilities, net interest margin is greater than spread and if averageinterest-bearing liabilities exceed average interest-earning assets, net interest margin is less than spread.
(3) For fiscal year 2006, the average balances are the averages of quarterly balances outstanding at the end of March of the previousfiscal year and June, September, December and March of that fiscal year. For fiscal years 2007, 2008, 2009 and 2010 and the sixmonths ended September 30, 2009 and 2010, average balances are the averages of daily balances, except averages of foreignbranches which are calculated on a monthly basis.
14

Financial Ratios
Year ended March 31,Six months ended
September 30,
2006 2007 2008 2009 2010 2009 2010
(in percentages)Return on average equity(1) ............................. 16.4% 13.4% 11.1% 7.7% 7.9% 7.5% 8.5%
Return on average assets(2).............................. 1.3 1.1 1.1 1.0 1.1 1.0 1.2
Dividend payout ratio(3) .................................. 29.8 28.9 29.4 32.6 33.2 — —
Cost to average assets(4) .................................. 2.4 2.3 2.2 1.8 1.6 1.6 1.6
Tier I capital adequacy ratio(5)(5) ................... 9.2 7.4 11.8 11.8 14.0 13.3 13.8
Tier II capital adequacy ratio(5)....................... 4.2 4.3 2.2 3.7 5.5 4.4 6.4
Total capital adequacy ratio(5) ......................... 13.4 11.7 14.0 15.5 19.4 17.7 20.2
Net non-performing assets ratio(6)................... 0.71 0.98 1.49 1.96 1.87 2.19 1.37
Allowance as a percentage of grossnon-performing assets(7) ............................. 63.7 58.4 57.3 53.5 59.5 51.7 69.0
Average net worth to total average assets(8) ... 7.8 8.2 10.2 12.7 14.3 13.8 14.3
(1) Return on average equity is the ratio of the net profit after tax to the quarterly average equity capital and reserves.
(2) Return on average assets is the ratio of the net profit after tax to the daily average assets.
(3) Dividend payout ratio is the ratio of total dividend payouts (excluding dividend distribution tax) to profit after tax.
(4) Cost to average assets is the ratio of the non-interest expense excluding lease depreciation to the average assets.
(5) At March 31, 2006 and 2007, capital adequacy ratio is based on Basel I guidelines and at March 31, 2008, 2009 and 2010 andSeptember 30, 2009 and 2010 capital adequacy ratio is based on revised Basel II guidelines. Due to revised Basel II guidelines,previous period figures are not comparable.
(6) Net non-performing assets ratio is the ratio of net non-performing assets to the net customer assets.
(7) Allowance as a percentage of gross non-performing assets is the ratio of provisions made to the gross non-performing assets.
(8) Average net worth is quarterly average equity capital and reserves.
(9) For fiscal year 2006, the average balances are the averages of quarterly balances outstanding at the end of March of the previousfiscal year and June, September, December and March of that fiscal year and for fiscal years 2007, 2008, 2009 and 2010 and sixmonths ended September 30, 2009 and 2010, the average balances are the averages of daily balances, except averages of foreignbranches which are calculated on a monthly basis.
15

RISK FACTORS
Prospective investors should carefully consider the risks described below, together with the risksdescribed in the other sections of this offering memorandum, before making any investment decision relatingto our notes. The occurrence of any of the following events could have a material adverse effect on ourbusiness including our ability to grow our asset portfolio, the quality of our assets, our liquidity, our financialperformance, our stockholders’ equity, our ability to implement our strategy and our ability to repay theinterest or principal on the note in a timely fashion or at all.
Before making an investment decision, prospective investors should carefully consider all of theinformation contained in this offering memorandum, including the financial statements included orincorporated by reference in this offering memorandum.
Risks Relating to India and Other Economic and Market Risks
A prolonged slowdown in economic growth or rise in interest rates in India could cause our business tosuffer.
A slowdown in the Indian economy could adversely affect our business and our borrowers andcontractual counterparties, especially if such a slowdown were to be continued and prolonged. The growth rateof India’s gross domestic product, or GDP, which was 9.0% or higher in each of fiscal years 2006, 2007 and2008, moderated to 6.7% during fiscal 2009. GDP growth recovered subsequently, reaching 7.4% during fiscal2010, and 8.8% in the first quarter of fiscal 2011. From 2005, interest rates in the Indian economy increasedsignificantly following monetary measures to control rising inflation, and we experienced a slowdown indisbursements of housing, automobile and other retail loans in fiscal 2007, 2008 and 2009. From October2008, the Reserve Bank of India significantly reduced policy rates and reserve ratios in response to the globalfinancial crisis. This also led to a decline in deposit and lending rates in the banking system. However, marketinterest rates remained volatile in fiscal 2010 due to the government’s fiscal deficit and borrowing program.Further, inflation as measured by the Wholesale Price Index, after falling to -1.0% in June 2009, increased to10.0% in July 2010. In response to the rising inflationary pressures and the economic recovery, the ReserveBank of India began an exit from its accommodative monetary policy, withdrawing special liquidity measuresintroduced during the financial crisis and raising the repo rate by an aggregate of 150 basis points, the reverserepo rate by an aggregate of 200 basis points and the cash reserve ratio by an aggregate of 100 basis pointssince February 2010. Any further increase in inflation in the future, due to increases in prices of commoditiessuch as crude oil or otherwise, may result in a further tightening of monetary policy. On June 25, 2010, thegovernment of India announced an increase in fuel prices, including a complete deregulation of petrol prices,which may lead to an increase in inflationary pressures. The uncertainty regarding liquidity and interest ratesand any increase in interest rates or reduction in liquidity could adversely impact our business. The Indianeconomy in general and the agriculture sector in particular may be impacted by the level and timing ofmonsoon rainfall, which was below average in fiscal 2010.
Further, in light of the increasing linkage of the Indian economy to other economies, the Indian economyis increasingly influenced by economic and market conditions in other countries. As a result, a recession inthe United States and other countries in the developed world and a slowdown in economic growth in majoremerging markets like China could have an adverse impact on economic growth in India. A slowdown in therate of growth in the Indian economy could result in lower demand for credit and other financial products andservices and higher defaults among corporate, retail and rural borrowers, which could adversely impact ourbusiness, our financial performance, our stockholders’ equity, our ability to implement our strategy and theprice of our notes.
Financial instability in other countries, particularly emerging market countries and countries where wehave established operations, could adversely affect our business and the price of our notes.
Since August 2007, the global financial system experienced difficult credit and liquidity conditions anddisruptions leading to less liquidity, greater volatility, general widening of spreads and, in some cases, lack ofprice transparency on inter-bank lending rates. These adverse trends accelerated sharply following thebankruptcy filing by Lehman Brothers in September 2008, leading to a global financial and economic crisis.In the US (where this particular crisis originated), the government has been forced to bail out leading financialinstitutions and inject additional capital into other banks. Likewise, in several European countries, thegovernments have injected capital into banks and have guaranteed deposits or increased the level of deposit
16

guarantees. More recently, several European governments have struggled to meet their sovereign debtobligations, as reflected in rating agencies’ downgrades of the bonds issued by these governments. Althoughthe proximate cause of this particular financial crisis, which is deeper than other recent financial crises, wasthe US residential mortgage market, investors should be aware that there is a recent history of financial crisesand boom-bust cycles in multiple markets in both the emerging and developed economies which leads to risksfor all financial institutions, including us. A loss of investor confidence in the financial systems of India orother markets and countries or any financial instability in India or any other market may cause increasedvolatility in the Indian financial markets and, directly or indirectly, adversely affect the Indian economy andfinancial sector, our business and our future financial performance. See also “—Risks Relating to OurBusiness—We have experienced rapid international growth in earlier years which has increased thecomplexity of the risks that we face”. The recent financial crisis has had a limited direct impact on us and wehave not experienced the same degree of write-downs as banks that were exposed to, or invested in, the USresidential mortgage market. However, the widening of credit spreads resulted in mark-to-market and realizedlosses on our investment and derivative portfolios, constrained our international debt capital marketborrowings and adversely impacted our profitability. We remain subject, moreover, to the risks posed by theindirect impact of the global credit crisis on the economy, some of which cannot be anticipated and the vastmajority of which are not under our control. We also remain subject to counterparty risk to financialinstitutions that fail or are otherwise unable to meet their obligations to us.
Any downgrading of India’s debt rating by an international rating agency could adversely affect ourbusiness, our liquidity and the price of our notes.
Following expansionary fiscal policies and the increase in India’s fiscal deficit, Standard & Poor’s, aninternational rating agency, had revised its outlook for India’s debt rating from ‘Stable’ to ‘Negative’ inFebruary 2009 before subsequently revising it back to ‘Stable’ in March 2010. Any adverse revisions to India’scredit ratings for domestic and international debt by international rating agencies may adversely impact ourbusiness and limit our access to capital markets and adversely impact our liquidity position. See also “—Ourinability to effectively manage credit, market and liquidity risk and inaccuracy of our valuation models andaccounting estimates may have an adverse effect on our earnings, capitalization, credit ratings and cost offunds”.
A significant increase in the price of crude oil could adversely affect the Indian economy, which couldadversely affect our business.
India imports over 75.0% of its requirements for crude oil, which comprised over 30% of total importsin fiscal 2010. While oil prices have declined sharply from their peak levels, any sharp increases or volatilityin oil prices and the pass-through of such increases to Indian consumers could have a material negative impacton the Indian economy and the Indian banking and financial system in particular, including through a rise ininflation and market interest rates and a higher trade deficit. On June 25, 2010, the government of Indiaannounced an increase in fuel prices, including a complete deregulation of petrol prices, which may to leadto an increase in inflationary pressures. This could adversely affect our business including our liquidity, thequality of our assets, our financial performance, our stockholders’ equity, our ability to implement our strategyand the price of our notes.
Current account deficits, including trade deficits could adversely affect our business and the price of ournotes.
India’s trade relationships with other countries and its trade deficit, driven to a major extent by globalcrude oil prices, may adversely affect Indian economic conditions. If current account and trade deficitsincrease, or are no longer manageable because of the rise in global crude oil prices or otherwise, the Indianeconomy, and therefore our business, our financial performance, our stockholders’ equity and the price of ournotes could be adversely affected.
Any volatility in the exchange rate and increased intervention by the Reserve Bank of India in theforeign exchange market may lead to a decline in India’s foreign exchange reserves and may affectliquidity and interest rates in the Indian economy, which could adversely impact us.
The direct adverse impact of the global financial crisis on India was felt in the form of reversal of capitalinflows and decline in exports, leading to pressures on the balance of payments and a sharp depreciation ofthe Indian rupee compared to the US dollar. Any increased intervention by the Reserve Bank of India in theforeign exchange market to control the volatility of the exchange rate may result in a decline in India’s foreignexchange reserves and reduced liquidity and higher interest rates in the Indian economy, which couldadversely affect our business, our future financial performance and the price of our notes.
17
Further, increased volatility in capital flows may also complicate monetary policy, leading to volatilityin inflation and interest rates in India, which could adversely impact our business.
Natural calamities, climate change and health epidemics could adversely affect the Indian economy, orthe economy of other countries where we operate, our business and the price of our notes.
India has experienced natural calamities such as earthquakes, floods and droughts in the past few years.The extent and severity of these natural disasters determine their impact on the Indian economy. In particular,climatic and weather conditions, such as the level and timing of monsoon rainfall, impact the agriculturalsector which constitutes approximately 17% of India’s GDP. For example, in fiscal 2003, many parts of Indiareceived significantly less than normal rainfall. As a result, the agricultural sector recorded a decline of 7.2%.While the growth rate of the agricultural sector was 10.0% in fiscal 2004, it was negligible in fiscal 2005 dueto the erratic progress of the monsoon which adversely affected sowing operations for certain crops. Duringthe third quarter of fiscal 2009, the agricultural sector recorded a decline of 0.8%. In fiscal 2010, the rainfallwas below the trend level in several parts of India. Consequently, the agricultural sector recorded an increaseof 0.2% during fiscal 2010. Prolonged spells of below or above normal rainfall or other natural calamities, orglobal or regional climate change, could adversely affect the Indian economy and our business, especially ourrural portfolio. Similarly, global or regional climate change or natural calamities in other countries where weoperate could affect the economies of those countries and our operations in those countries.
Health epidemics could also disrupt our business. From April 2009, there have been outbreaks of swineflu, caused by the H1N1 virus, in certain regions of the world, including India and several countries in whichwe operate. Any future outbreak of health epidemics may restrict the level of business activity in affectedareas, which may in turn adversely affect our business.
Financial difficulty and other problems in certain financial institutions in India could adversely affectour business and the price of our notes.
As an Indian bank, we are exposed to the risks of the Indian financial system which may be affected bythe financial difficulties faced by certain Indian financial institutions because the commercial soundness ofmany financial institutions may be closely related as a result of credit, trading, clearing or other relationships.This risk, which is sometimes referred to as “systemic risk”, may adversely affect financial intermediaries,such as clearing agencies, banks, securities firms and exchanges with which we interact on a daily basis. Anysuch difficulties or instability of the Indian financial system in general could create an adverse marketperception about Indian financial institutions and banks and adversely affect our business. Our transactionswith these financial institutions expose us to credit risk in the event of default by the counterparty, which canbe exacerbated during periods of market illiquidity. See also “Overview of the Indian Financial Sector”. Asthe Indian financial system operates within an emerging market, we face risks of a nature and extent nottypically faced in more developed economies, including the risk of deposit runs notwithstanding the existenceof a national deposit insurance scheme. For example, in April 2003, unsubstantiated rumors, believed to haveoriginated in Gujarat, a state in India, alleged that we were facing liquidity problems. Although our liquidityposition was sound, we witnessed higher than normal deposit withdrawals on account of these unsubstantiatedrumors for several days in April 2003. During September-October 2008, following the disclosure of ourexposure to Lehman Brothers and other US and European financial institutions, rumors were circulated aboutour financial position which resulted in concerns being expressed by depositors and higher than normaltransaction levels on a few days. We controlled the situation in these instances, but any failure to control suchsituations in the future could result in high volumes of deposit withdrawals, which would adversely impact ourliquidity position, disrupt our business and, in times of market stress, undermine our financial strength.
A significant change in the Indian government’s policies could adversely affect our business and theprice of our notes.
Our business and customers are predominantly located in India or are related to and influenced by theIndian economy. The Indian government has traditionally exercised, and continues to exercise, a dominantinfluence over many aspects of the economy. Government policies could adversely affect business andeconomic conditions in India, our ability to implement our strategy, and our future financial performance.Since 1991, successive Indian governments have pursued policies of economic liberalization, includingsignificantly relaxing restrictions on the private sector and encouraging the development of the Indianfinancial sector. India has been governed by coalition governments for the past several years. The leadershipof India and the composition of the coalition in power are subject to change, and election results are sometimes
18

not along expected lines. It is therefore difficult to predict the economic policies that will be pursued bygovernments in the future. The pace of economic liberalization could change, and specific laws and policiesaffecting banking and finance companies, foreign investment, currency exchange and other matters affectinginvestment in our securities could change as well. For instance, the government of India has proposed a newdirect tax code that could impact our taxation in the future, as well as the investment decisions of individuals,thereby impacting our business. The government of India has also proposed shifting to a uniform goods andservice tax structure in India, which may also have an impact on the way in which we are taxed in the future.Any significant change in India’s economic policies or any market volatility as a result of uncertaintysurrounding India’s macroeconomic policies or the future elections of its government could adversely affectbusiness and economic conditions in India generally and our business in particular.
If regional hostilities, terrorist attacks or social unrest in some parts of the country increase, ourbusiness and the price of our notes could be adversely affected.
India has from time to time experienced social and civil unrest and hostilities both internally and withneighboring countries. In the past, there have been military confrontations between India and Pakistan. Indiahas also experienced terrorist attacks in some parts of the country, including in Mumbai, where ourheadquarters are located, in November 2008. These hostilities and tensions could lead to political or economicinstability in India and adversely affect our business, our future financial performance, our stockholders’equity and the price of our notes.
Uncertain enforcement of civil liabilities.
We are incorporated under the laws of India and most of our directors and executive officers resideoutside the United States. In addition, a substantial portion of our assets are located outside the United States.As a result, you may be unable to:
• effect service of process within the United States upon us and other persons or entities; or
• enforce in the US courts judgments obtained in the US courts against us and other persons orentities, including judgments predicated upon the civil liability provision of the federal securitieslaws of the United States.
The United States and India do not currently have a treaty providing for reciprocal recognition andenforcement of judgments (other than arbitration awards) in civil and commercial matters. Therefore, a finaljudgment for the payment of money rendered by any federal or state court in the United States for civilliability, whether or not predicated solely upon the general securities laws of the United States, would not beenforceable in India.
However, the party in whose favor such final judgment is rendered may bring a new suit in a competentcourt in India based on a final judgment that has been obtained in the United States within three years ofobtaining such final judgment. If and to the extent that Indian courts were of the opinion that fairness and goodfaith so required, they would, under current practice, give binding effect to the final judgment which had beenrendered in the United States, unless such a judgment contravened principles of public policy of India. It isunlikely that an Indian court would award damages on the same basis as a foreign court if an action is broughtin India. Moreover, it is unlikely that an Indian court would award damages to the extent awarded in a finaljudgment rendered in the United States if it believed that the amount of damages awarded were excessive orinconsistent with Indian practice. In addition, any person seeking to enforce a foreign judgment in India isrequired to obtain prior approval of the Reserve Bank of India to execute such a judgment or to repatriate anyamount recovered. For more information, see “Enforceability of Civil Liabilities” in this offeringmemorandum.
Risks Relating to Our Business
Our banking and trading activities are particularly vulnerable to interest rate risk and volatility ininterest rates could adversely affect our net interest margin, the value of our fixed income portfolio, ourincome from treasury operations, the quality of our loan portfolio and our financial performance.
As a result of certain reserve requirements of the Reserve Bank of India, we are more structurallyexposed to interest rate risk than banks in many other countries. See “Supervision and Regulation—LegalReserve Requirements”. These requirements result in our maintaining a large portfolio of fixed incomegovernment of India securities, and we could be materially adversely impacted by a rise in interest rates,
19

especially if the rise were sudden or sharp. Profit on the sale of investments in fixed income securities,including government of India securities, is an important element of our profitability and is impacted bymovements in market yields. A rise in yields on government securities, as has taken place since fiscal 2010,reduces our profits from this activity and the value of our fixed income portfolio. We are also exposed tointerest rate risk through our treasury operations and our subsidiary, ICICI Securities Primary Dealership,which is a primary dealer in government of India securities. In our asset management business, we managemoney market mutual funds whose performance is impacted by a rise in interest rates, which could adverselyimpact our revenues and profits from this business. These requirements also have a negative impact on our netinterest income and net interest margin because we earn interest on a portion of our assets at rates that aregenerally less favorable than those typically received on our other interest-earning assets.
If the yield on our interest-earning assets does not increase at the same time or to the same extent as ourcost of funds, or if our cost of funds does not decline at the same time or to the same extent as the decreasein yield on our interest-earning assets, our net interest income and net interest margin may be adverselyimpacted. During fiscal 2006, 2007, 2008 and the first nine months of fiscal 2009, we experienced an increasein our term deposit costs. The tightening of liquidity and volatility in international markets following theconcerns over sub-prime debt in the United States limited our access to international bond markets from thesecond half of fiscal 2008 and resulted in an increase in our cost of funding for our international business.Continued volatility in international markets could further constrain and increase the cost of our internationalmarket borrowings and our ability to replace maturing borrowings and fund new assets. Our subsidiaries inthe United Kingdom and Canada are also exposed to similar risks. For instance, the net interest income ofthese subsidiaries was negatively impacted in fiscal 2009 by the faster decline in the yields on their loanportfolios, which are linked to LIBOR, relative to the cost of their funding, which comprises mainly fixed ratedeposits and borrowings. Limitations on our ability to borrow from international markets affect our fundingcosts and our ability to grow our business. In April 2010, the Reserve Bank of India issued final guidelineson the base rate system that replaced the benchmark prime lending rate system effective July 1, 2010. The baserate system is a new system for loan pricing and its impact on future loan pricing and the alignment of rateson floating rate loans to changes in the cost of funds remains unclear.
High and increasing interest rates or greater interest rate volatility would adversely affect our ability togrow, our net interest margins, our net interest income, our income from treasury operations and the value ofour fixed income securities portfolio.
If we are not able to control the level of non-performing assets in our portfolio, our business will suffer.
Until fiscal 2008, we experienced rapid growth in our retail loan portfolio, including non-collateralizedretail loans such as unsecured personal loans and credit card receivables. See “Business—Overview of OurProducts and Services—Commercial Banking for Retail Customers”. The seasoning of the loan portfolio, anadverse macroeconomic environment and challenges in recovery led to an increase in non-performing loans,especially in the non-collateralized retail loan portfolio. Following higher than anticipated credit losses anddifficulties in collections, we discontinued our urban micro-banking unsecured loan product during fiscal2008, and have, since fiscal 2009, substantially reduced the origination of unsecured personal loans, creditcards and two wheeler loans. Various factors, including a rise in unemployment, prolonged recessionaryconditions, our regulators’ assessment and review of our loan portfolio, a sharp and sustained rise in interestrates, developments in the Indian economy, movements in global commodity markets and exchange rates andglobal competition could cause further increase in the level of non-performing assets on account of these retailand other loans and have a material adverse impact on the quality of our loan portfolio. The Reserve Bank ofIndia has issued guidelines relating to the use of recovery agents by banks. Any limitation on our ability torecover outstanding receivables from customers as a result of these guidelines or otherwise may affect ourcollections and ability to foreclose on existing non-performing assets.
Under the directed lending norms of the Reserve Bank of India, we are required to extend 50.0% of ourresidual adjusted net bank credit to certain eligible sectors, which are categorized as “priority sectors”. Inaddition to the regulations requiring us to lend a portion of our advances to the priority sectors, the ReserveBank of India has regulations requiring us to lend a portion of our advances to weaker sections of society. See“Business—Loan Portfolio—Directed Lending”. We may experience a significant increase in non-performingassets in our directed lending portfolio, particularly loans to the agricultural sector and small enterprises,where we are less able to control the portfolio quality and where economic difficulties are likely to affect ourborrowers more severely. The government in its budget for fiscal 2009 announced a debt waiver for small and
20

marginal farmers. While the government has borne the cost of the scheme, such schemes may have an adverseimpact on future debt servicing on farm loans and may lead to an increase in non-performing loans in theagricultural sector. Any change by the Reserve Bank of India in the directed lending norms may result in ourinability to meet the priority sector lending requirements as well as require us to increase our lending torelatively riskier segments and may result in an increase in non-performing assets in the directed lendingportfolio. See also “Entry into new businesses or expansions of existing businesses may expose us to increasedrisks that may adversely affect our business.” and “Business—Loan Portfolio—Directed Lending”.
Following the recent global and Indian economic slowdown, we saw an increase in the volume ofrestructured corporate loans. Further economic challenges could result in some of our borrowers not being ableto meet their restructured debt obligations, resulting in loans to such borrowers being classified asnon-performing. See also “—The level of restructured loans in our portfolio may increase and the failure ofour restructured loans to perform as expected could affect our business”. The loan portfolio of our internationalbranches and subsidiaries includes foreign currency loans to Indian companies for their Indian operations (aspermitted by regulation) as well as for their overseas ventures, including cross-border acquisitions. Thisexposes us to specific additional risks including the failure of the acquired entities to perform as expected, andour inexperience in various aspects of the economic and legal framework in overseas markets. See also “—Weexperienced rapid international growth in earlier years which has increased the complexity of the risks that weface”. Further, we expect long-term project finance to be a significant area of growth in our business goingforward, and the quality of this portfolio could be adversely impacted by several factors. See “—Our loanportfolio includes long-term project finance loans, which are particularly vulnerable to completion and otherrisks”. We may not be able to control or reduce the level of non-performing assets in our project and corporatefinance portfolio.
We also securitize our loan receivables through independent special purpose vehicles from time to time.The loan pools securitized by us are generally rated by independent credit rating agencies. With respect tothese transactions, we provide credit enhancements generally in the form of cashcollaterals/guarantees/interest spreads. There is no guarantee that these pools will perform as per expectations.In the event that the ratings on these pools are downgraded and/or we are required to increase the creditenhancement, our profitability, reputation and our business could be adversely affected. We also haveinvestments in security receipts arising out of the sale of non-performing assets by us to Asset ReconstructionCompany (India) Limited, a reconstruction company registered with the Reserve Bank of India and otherreconstruction companies. See “Business—Classification of Loans”. There can be no assurance that AssetReconstruction Company (India) Limited and other reconstruction companies will be able to recover theseassets and redeem our investments in security receipts and that there will be no reduction in the value of theseinvestments.
If we are not able to control or reduce the level of non-performing assets, the overall quality of our loanportfolio may deteriorate, we may become subject to enhanced regulatory oversight and scrutiny, ourreputation may be adversely impacted and our profitability and the price of our notes could be adverselyaffected.
The level of restructured loans in our portfolio may increase and the failure of our restructured loansto perform as expected could affect our business.
Our standard assets include restructured standard loans. See “Business—Classification ofLoans—Restructured Loans”. The recent global and Indian economic slowdown and its impact on equity anddebt markets have adversely impacted the capacity utilization, profitability and cash accruals of some of ourborrowers and their ability to access equity and debt financing. We have seen an increase in the level ofrestructured assets in fiscal 2009 and fiscal 2010, offset, in part, by upgrades of existing restructured loansbased on satisfactory payment performance. A substantial increase in the level of restructured assets and thefailure of these borrowers to perform as expected could adversely affect our business, our future financialperformance, our stockholders’ equity and the price of our notes.
Further deterioration of our non-performing asset portfolio combined with recent Reserve Bank of Indiarequirements that all Indian banks increase their provisioning coverage as a percentage of grossnon-performing assets could adversely affect our business.
There can be no assurance that the percentage of non-performing assets that we will be able to recoverwill be similar to our and ICICI’s past experience of recoveries of non-performing assets. Our retail loanportfolio experienced rapid growth between fiscal 2002 and fiscal 2007, and there is limited data on historical
21

loss ratios in retail loans, especially in the event of an economic downturn. During the last two years we haveseen an increase in non-performing assets, mainly in our non-collateralized retail loan portfolio. Further, theeconomic slowdown and the impact of global and Indian economic conditions on equity and debt markets havealso led to an increase in the volume of restructured corporate loans, and the failure of these borrowers toperform as per the restructured terms would lead to their classification as non-performing loans. See also “—Ifwe are not able to control the level of non-performing assets in our portfolio, our business will suffer”.
At the same time, Indian banks have been required by a new Reserve Bank of India policy to increasetheir total provisioning coverage ratio, including floating provisions and prudential/technical write-offs, to70% by September 30, 2010. ICICI Bank has been permitted by the Reserve Bank of India to achieve thestipulated level of provisioning coverage of 70% in a phased manner by March 31, 2011. The combination ofthe mandated increase in provisions, regulators’ assessment of our provisions and any further deterioration orincrease in our non-performing asset portfolio could lead to an adverse impact on our business, our futurefinancial performance and the price of our notes.
We face greater risks than banks in developed economies.
Our credit risk is higher because most of our borrowers are based in India. Unlike several developedeconomies, a nation-wide credit bureau has only recently become operational in India. This may affect thequality of information available to us about the credit history of our borrowers, especially individuals andsmall businesses. In addition, the credit risk of our borrowers, particularly small and middle marketcompanies, is higher than borrowers in more developed economies due to the greater uncertainty in the Indianregulatory, political, economic and industrial environment and the difficulties of many of our corporateborrowers to adapt to global technological advances. The directed lending norms of the Reserve Bank of Indiarequire us to lend a certain proportion of our loans to “priority sectors”, including agriculture and smallenterprises, where we are less able to control the portfolio quality and where economic difficulties are likelyto affect our borrowers more severely. Any shortfall may be required to be allocated to investments yieldingsub-market returns. See “Business—Loan Portfolio—Directed Lending”. Also, several of our corporateborrowers in the past suffered from low profitability because of increased competition from economicliberalization, a sharp decline in commodity prices, a high debt burden and high interest rates in the Indianeconomy at the time of their financing, and other factors. An economic slowdown and a general decline inbusiness activity in India could impose further stress on these borrowers’ financial soundness and profitabilityand thus expose us to increased credit risk. This may lead to an increase in the level of our non-performingassets and there could be an adverse impact on our business, our future financial performance, ourstockholders’ equity and the price of our notes.
In addition to credit risks, we also face additional risks as compared with banks in developed economies.We pursue our banking, insurance and other activities in India in an economy that is a developing economywith all of the risks that come with such an economy. Our activities in India are spread across a large anddiverse terrain and involve employees, contractors, counterparties and customers with widely varying levelsof education, financial sophistication and wealth. Although we seek to implement policies and procedures toreduce and manage marketplace risks as well as risks within our own organization, some risks remain inherentin doing business in a large, developing country. We cannot eliminate these marketplace and operational risks,which may lead to legal or regulatory actions, negative publicity or other developments that could reduce ourprofitability. In the aftermath of the financial crisis, regulatory scrutiny of these risks is increasing.
The increased supervisory and compliance environment in the financial sector leads to increased risksof regulatory action, whether formal or informal. In the aftermath of the financial crisis, regulators areincreasingly viewing us, as well as other financial institutions, as presenting a higher risk profile thanin the past, in a range of areas.
We are subject to a wide variety of banking, insurance and financial services laws, regulations andregulatory policies and a large number of regulatory and enforcement authorities in each of the jurisdictionsin which we operate. Since the onset of the global financial crisis in 2007, regulators in India and in the otherjurisdictions in which we operate have intensified their review and scrutiny of many financial institutions,including us. In the aftermath of the financial crisis, regulators are increasingly viewing us, as well as otherfinancial institutions, as presenting a higher risk profile than in the past, in a range of areas. This increasedreview and scrutiny increases the possibility that we will face adverse legal or regulatory actions. The ReserveBank of India and other regulators regularly review our operations, and there can be no guarantee that anyregulator will agree with our internal assessments of asset quality, provisions, risk management, capitaladequacy, management functioning, other measures of the safety and soundness of our operations orcompliance with applicable laws, regulations or regulatory policies. Regulators may find that we are not in
22

compliance with applicable laws, regulations or regulatory policies, or with the regulators’ revisedinterpretations of such laws, regulations or regulatory policies, and may take formal or informal actionsagainst us. If taken, such formal or informal actions might force us to make additional provision for ournon-performing assets divest our assets, adopt new compliance programs or policies, remove personnel,reduce dividend or executive compensation or undertake other changes to our business operations. Any ofthese changes, if required, could reduce our profitability by restricting our operations, imposing new costs orharming our reputation. See also “—The regulatory environment for financial institutions is facingunprecedented change in the post-financial crisis environment” and “Supervision and Regulation”.
In addition to oversight by the Reserve Bank of India, our insurance subsidiaries are also subject toextensive regulation and supervision by India’s insurance regulators. The Insurance Regulatory andDevelopment Authority has the authority to modify and interpret regulations regarding the insurance industry,including regulations governing products, selling commissions, solvency margins and reserving, which canalso lead to additional costs or restrictions on the insurance subsidiaries’ activities. Similarly, our assetmanagement subsidiary is subject to supervision and regulation by the Securities and Exchange Board of India.
Failure to comply with applicable regulations in various jurisdictions, including unauthorized actions byemployees, representatives, agents and third parties, suspected or perceived failures and media reports, andensuing inquiries or investigations by regulatory and enforcement authorities, has resulted, and may result inregulatory action including financial penalties and restrictions on or suspension of the related businessoperations.
In addition, a failure to comply with the applicable regulations in various jurisdictions by our employees,representatives, agents and third-party service providers either in or outside the course of their services, orsuspected or perceived failures by them, may result in inquiries or investigations by regulatory andenforcement authorities, in regulatory or enforcement action against either us, or such employees,representatives, agents and third-party service providers. Such actions may impact our reputation, result inadverse media reports, lead to increased or enhanced regulatory or supervisory concerns, additional costs,penalties, claims and expenses being incurred by us or impact adversely our ability to conduct business.
If we fail to manage our legal and regulatory risk in the many jurisdictions in which we operate, ourbusiness could suffer, our reputation could be harmed and we would be subject to additional legal andregulatory risks. This could, in turn, increase the size and number of claims and damages asserted against usor subject us to regulatory investigations, enforcement actions or other proceedings, or lead to increasedregulatory or supervisory concerns. We may also be required to spend additional time and resources on anyremedial measures which could have an adverse effect on our business.
Despite our best efforts to comply with all applicable regulations, there are a number of risks that cannotbe completely controlled. Our international expansion has led to increased legal and regulatory risks.Regulators in every jurisdiction in which we operate or have listed our securities have the power to bringadministrative or judicial proceedings against us (or our employees, representatives, agents and third-partyservice providers), which could result, among other things, in suspension or revocation of one or more of ourlicenses, cease and desist orders, fines, civil penalties, criminal penalties or other disciplinary action whichcould materially harm our reputation, results of operations and financial condition.
We cannot predict the timing or form of any current or future regulatory or law enforcement initiatives,which we note are increasingly common for international banks and financial institutions, but we would expectto cooperate with any such regulatory investigation or proceeding.
The value of our collateral may decrease or we may experience delays in enforcing our collateral whenborrowers default on their obligations to us which may result in failure to recover the expected value ofcollateral security exposing us to a potential loss.
A substantial portion of our loans to corporate and retail customers is secured by collateral. See“Business—Classification of Loans—Non-Performing Asset Strategy”. Changes in asset prices may cause thevalue of our collateral to decline and we may not be able to realize the full value of our collateral as a resultof delays in bankruptcy and foreclosure proceedings, delays in the creation of security interests, defects ordeficiencies in the perfection of collateral (including due to inability to obtain approvals that may be requiredfrom various persons, agencies or authorities), fraudulent transfers by borrowers and other factors, includingdepreciation in the value of the collateral and illiquid market for disposal of and volatility in the market pricesfor the collateral, current legislative provisions or changes thereto and past or future judicial pronouncements.Failure to recover the expected value of collateral could expose us to potential losses, which could adverselyaffect our future financial performance, our stockholders’ equity and the price of our notes.
23

Our loan portfolio includes long-term project finance loans, which are particularly vulnerable tocompletion and other risks.
We expect significant opportunities in project finance in India and it is our strategy to grow thisportfolio. The viability of these projects depends upon a number of factors, including market demand,government policies and the overall economic environment in India and the international markets. Theseprojects are particularly vulnerable to a variety of risks, including risks of delays in regulatory approvals,environmental and social issues, completion risk and counterparty risk, which could adversely impact theirability to generate revenues. We cannot be sure that these projects will perform as anticipated. In the past,ICICI and we experienced a high level of default and restructuring in our project finance loan portfolio as aresult of the downturn in certain global commodity markets and increased competition in India. A slowdownin the Indian and global economy may exacerbate the risks for the projects that we have financed. Futureproject finance losses or high levels of loan restructuring could have a materially adverse effect on ourprofitability and the quality of our loan portfolio and the price of our notes.
We have a high concentration of loans to certain customers and sectors and if a substantial portion ofthese loans become non-performing, the overall quality of our loan portfolio, our business and the priceof our notes could be adversely affected.
Our loan portfolio and non-performing asset portfolio have a high concentration in certain customers.See “Business—Loan Portfolio—Loan Concentration”. In the past, certain of our borrowers have beenadversely affected by economic conditions to varying degrees. Economic conditions in India and othercountries may impose strains on these borrowers’ ability to repay loans to us. Credit losses due to financialdifficulties of these borrowers and borrower groups in the future could adversely affect our business, ourfinancial performance, our stockholders’ equity and the price of our notes.
We depend on the accuracy and completeness of information about customers and counterparties.
In deciding whether to extend credit or enter into other transactions with customers and counterparties,we may rely on information furnished to us by or on behalf of customers and counterparties, includingfinancial statements and other financial information. We may also rely on certain representations as to theaccuracy and completeness of that information and, with respect to financial statements, on reports ofindependent auditors. For example, in deciding whether to extend credit, we may assume that a customer’saudited financial statements conform to generally accepted accounting principles and present fairly, in allmaterial respects, the financial condition, results of operations and cash flows of the customer. Our financialcondition and results of operations could be negatively affected by relying on financial statements that do notcomply with generally accepted accounting principles or other information that is materially misleading. Inaddition, unlike several developed economies, a nationwide credit bureau has only recently becomeoperational in India. This may affect the quality of information available to us about the credit history of ourborrowers, especially individuals and small businesses. As a result, our ability to effectively manage our creditrisk may be adversely affected.
Commission, exchange and brokerage income and profit on foreign exchange transactions have becomeimportant elements of our profitability and market conditions could cause these income streams todecline and adversely impact our financial performance.
We earn commission, exchange and brokerage income from a variety of activities, including syndicationand advisory services for corporate clients with respect to their acquisition and project financing, distributionof retail investment and insurance products, transaction banking and retail credit products. Our commission,exchange and brokerage income is therefore impacted by the level of corporate activity, the demand for retailfinancial products and the overall level of economic and trade activity. We also earn commission from thedistribution of mutual fund and insurance products. Recent regulatory changes capping the charges fordistribution of such products, and any similar regulations going forward, would impact our commission,exchange and brokerage income. Similarly, the profit on foreign exchange transactions is dependent on foreignexchange market conditions and the risk management strategies of corporate clients. Volatile marketconditions may also have an adverse impact on mergers and acquisitions activity by Indian companies,affecting our fee and other incomes related to such activity. We experienced a decline in these income streamsin the second half of fiscal 2009 as a result of the general decline in business activity during the globalfinancial crisis and economic turmoil. The above factors could cause these income streams to decline in thefuture and adversely impact our financial performance.
24
We have experienced rapid international growth in earlier years which has increased the complexity ofthe risks that we face.
Beginning in fiscal 2004, we began a rapid international expansion, opening banking subsidiaries in theUnited Kingdom, Canada and Russia and branches and representative offices in several countries. We offerretail banking products and services including remittance services across these markets primarily tonon-resident Indians. We deliver products and services, including foreign currency financing and cross-borderacquisition financing, to our corporate clients through our international subsidiaries and branches. We alsoinvest in fixed income securities and derivative products with underlying Indian and international creditexposures. In Canada and the United Kingdom, we offer direct banking offerings using the Internet as theaccess channel. This rapid international expansion into banking in multiple jurisdictions exposes us to avariety of regulatory and business challenges and risks, including cross-cultural risk and has increased thecomplexity of our risks in a number of areas including price risks, currency risks, interest rate risks,compliance risk, regulatory and reputational risk and operational risk. In the aftermath of the financial crisisand in light of enhanced regulations in many countries, we expect to face additional pressures and scrutiny inall of these areas and in the management of our international operations. We also face risks arising from ourability to manage inconsistent legal and regulatory requirements in the multiple jurisdictions in which weoperate.
Our international banking subsidiaries are subject to regulations imposed by their respective overseasregulators, including regulations on capital and liquidity, country exposure and type of business. The loanportfolio of our international branches and subsidiaries includes foreign currency loans to Indian companiesfor their Indian operations (as permitted by regulation) as well as for their overseas ventures, includingcross-border acquisitions. This exposes us to specific additional risks including the failure of the acquiredentities to perform as expected, and our inexperience in various aspects of the economic and legal frameworkin overseas markets. Regulatory changes globally and in specific markets, including increased regulatoryoversight following the global financial crisis, may impact our ability to execute our strategy and deliverreturns on capital invested in our international subsidiaries. See also “—We are subject to legal and regulatoryrisk which may adversely affect our business and the price of our notes”. Our overseas branches and bankingsubsidiaries have made investments in bonds, certificates of deposits, mortgage backed securities, treasurybills, credit derivatives and asset backed commercial paper. The global financial and economic crisis hasresulted in mark-to-market and realized losses on our overseas and other subsidiaries’ investment andderivative portfolios, increased the regulatory scrutiny of our international operations, constrained ourinternational debt capital market borrowings and increased our cost of funding. If we are unable to managethese risks, our business could be adversely affected.
Our funding is primarily short-term and if depositors do not roll over deposited funds upon maturity, ourbusiness could be adversely affected.
Most of our incremental funding requirements are met through short-term funding sources, primarily inthe form of deposits including deposits from corporate customers and inter-bank deposits. Our customerdeposits generally have a maturity of less than one year. However, a large portion of our assets have medium-or long-term maturities, creating the potential for funding mismatches. Our ability to raise fresh deposits andgrow our deposit base depends in part on our ability to expand our network of branches, which requires theapproval of the Reserve Bank of India. While we have recently significantly expanded our branch networkpursuant to the Reserve Bank of India’s authorizations for establishing new branches, there can be noassurance that these authorizations or future authorizations granted by the Reserve Bank of India will meet ourrequirements for branch expansion to achieve the desired growth in our deposit base. DuringSeptember�October 2008, following the disclosure of our exposure to Lehman Brothers and other US andEuropean financial institutions, rumors were circulated about our financial position which resulted in concernsbeing expressed by depositors and higher than normal transaction levels on a few days. High volumes ofdeposit withdrawals or failure of a substantial number of our depositors to roll over deposited funds uponmaturity or to replace deposited funds with fresh deposits as well as our inability to grow our deposit base,could have an adverse effect on our liquidity position, our business, our future financial performance, ourstockholders’ equity and the price of our notes.
Furthermore, a part of our loan and investment portfolio, comprising primarily the loan and investmentportfolios of our international branches and subsidiaries, is denominated in foreign currencies, including theUS dollar. Our international branches are primarily funded by debt capital market issuances andsyndicated/bilateral loans, while our international subsidiaries generally raise deposits in their local markets.
25

Certain deposits in our Singapore and Hong Kong branches are guaranteed by the government of Singaporeand the Hong Kong S.A.R. government’s Exchange Fund respectively until the end of 2010. There can be noassurance that the deposits will be rolled over after this period. Volatility in the international debt marketsfollowing the concerns over sub-prime debt in the United States has constrained our international capitalmarket borrowings. There can be no assurance that the deposit bases of our international subsidiaries willcontinue to grow at the current rates or that our international branches and subsidiaries will be able to obtainalternative funding from the international debt markets or other sources in a timely manner on termsacceptable to them or at all. This may adversely impact our ability to replace maturing borrowings and fundnew assets. See also “— Risks Relating to India and Other Economic and Market Risks—Financial instabilityin other countries, particularly emerging market countries and countries where we have established operations,could adversely affect our business and the price of our notes”, “— Risks Relating to India and OtherEconomic and Market Risks—Financial difficulty and other problems in certain financial institutions in Indiacould adversely affect our business and the price of our notes” and “—We have experienced rapid internationalgrowth in earlier years, which has increased the complexity of the risks that we face”.
The regulatory environment for financial institutions is facing unprecedented change in thepost-financial crisis environment
The global financial crisis has led to significant and unprecedented changes in the laws, regulations andregulatory policies of India and the other jurisdictions in which we operate. Changes in laws, regulations orregulatory policies, including changes in the interpretation or application of such laws, regulations andregulatory policies, may adversely affect the products and services we offer, the value of our assets or thecollateral available for our loans or our business in general. Such changes may include changes with respectto capital requirement, leverage and liquidity ratios, cross-border capital flows, local lending obligations,management compensation, consumer protection and risk management, among other areas. Changes in laws,regulations and regulatory policies, or the interpretation or application thereof, have and we expect willcontinue to lead to enhanced regulatory oversight and scrutiny and increased compliance costs. Our ability topredict future legal or regulatory changes is limited and we may face greatly enhanced legal or regulatoryburdens without advanced notice. Any such changes may result in increased expenses, operational restrictionsor revisions to our business operations, which may reduce our profitability or force us to forgo potentiallyprofitable business opportunities. See also “—The increased supervisory and compliance environment in thefinancial sector leads to increased risks of regulatory action, whether formal or informal. In the aftermath ofthe financial crisis, regulators are increasingly viewing us, as well as other financial institutions, as presentinga higher risk profile than in the past, in a range of areas”.
Our inability to effectively manage credit, market and liquidity risk and inaccuracy of our valuationmodels and accounting estimates may have an adverse effect on our earnings, capitalization, creditratings and cost of funds.
Our risk management strategies may not be effective because in a difficult or less liquid marketenvironment other market participants may be attempting to use the same or similar strategies to deal with thedifficult market conditions. In such circumstances, it may be difficult for us to reduce our risk positions dueto the activity of such other market participants. Our derivatives businesses may expose us to unexpectedmarket, credit and operational risks that could cause us to suffer unexpected losses or enhanced regulatoryscrutiny. Severe declines in asset values, unanticipated credit events, or unforeseen circumstances that maycause previously uncorrelated factors to become correlated may create losses resulting from risks notappropriately taken into account in the development, structuring or pricing of a derivative instrument. Inaddition, many derivative transactions are not cleared and settled through a central clearing house or exchange,and they may not always be confirmed or settled by counterparties on a timely basis. In these situations, weare subject to heightened credit and operational risk, and in the event of a default, we may find the contractmore difficult to enforce. Further, as new and more complex derivative products are created, disputesregarding the terms or the settlement procedures of the contracts could arise, which could force us to incurunexpected costs, including transaction and legal costs, and impair our ability to effectively manage our riskexposure to these products. Many of our hedging strategies and other risk management techniques have a basisin historic market behavior, and all such strategies and techniques are based to some degree on management’ssubjective judgment. To the extent any of the instruments and strategies we use to hedge or otherwise manageour exposure to market or credit risk are not effective, we may not be able to mitigate effectively our riskexposures in particular market environments or against particular types of risk. Our balance sheet growth isdependent upon economic conditions, as well as upon our ability to securitize, sell, purchase or syndicateparticular loans or loan portfolios. Our trading revenues and interest rate risk are dependent upon our ability
26

to properly identify, and mark-to-market, changes in the value of financial instruments caused by changes inmarket prices or rates. Our earnings are dependent upon the effectiveness of our management of migrationsin credit quality and risk concentrations, the accuracy of our valuation models and our critical accountingestimates and the adequacy of our allowances for loan losses.
To the extent our assessments, assumptions or estimates prove inaccurate or not predictive of actualresults, we could suffer higher than anticipated losses and enhanced regulatory scrutiny. See also “—Furtherdeterioration of our non-performing asset portfolio combined with recent Reserve Bank of India requirementsthat all Indian banks increase their provisioning coverage as a percentage of gross non-performing assets couldadversely affect our business”. The successful management of credit, market and operational risk is animportant consideration in managing our liquidity risk because it affects the evaluation of our credit ratingsby rating agencies. Rating agencies may reduce or indicate their intention to reduce the ratings at any time.See also “Risks Relating to India and Other Economic and Market Risks—Any downgrading of India’s debtrating by an international rating agency could adversely affect our business, our liquidity and the price of ournotes”. The rating agencies can also decide to withdraw their ratings altogether, which may have the sameeffect as a reduction in our ratings. Any reduction in our ratings (or withdrawal of ratings) may increase ourborrowing costs, limit our access to capital markets and adversely affect our ability to sell or market ourproducts, engage in business transactions particularly longer-term, and derivatives transactions, or retain ourcustomers. Conditions in the international and Indian debt markets may adversely impact our access tofinancing and liquidity. This, in turn, could reduce our liquidity and negatively impact our operating resultsand financial condition. For more information relating to our ratings, see “Business—RiskManagement—Quantitative and Qualitative Disclosures about Market Risk—Liquidity Risk”.
We may seek opportunities for growth through acquisitions or be required to undertake mergers by theReserve Bank of India and could face integration and other acquisition risks.
We may seek opportunities for growth through acquisitions or be required to undertake mergersmandated by the Reserve Bank of India under its statutory powers. In the past, the Reserve Bank of India hasordered mergers of weak banks with other banks primarily in the interest of depositors of the weak banks.While we do not currently expect to expand our international business, other than continuing to focus ongrowing our international deposit base and seeking India-linked business opportunities, we may in the futureexamine and seek opportunities for acquisitions in countries where we currently operate and in other countries.
The Bank of Rajasthan, a private sector bank, merged with us effective from the close of business onAugust 12, 2010. This acquisition and any future acquisitions or mergers, both Indian or international, mayinvolve a number of risks, including the possibility of a deterioration of asset quality, financial impact ofemployee related liabilities, diversion of our management’s attention required to integrate the acquiredbusiness and the failure to retain key acquired personnel and clients, leverage synergies or rationalizeoperations, or develop the skills required for new businesses and markets, or unknown and known liabilitiesincluding any ongoing litigation, claims or disputes concerning such acquisition, merger, its shareholders,share capital or its legal and regulatory compliance obligations or practices, some or all of which could havean adverse effect on our business.
We and our customers are exposed to fluctuations in foreign exchange rates.
As a financial intermediary, we are exposed to exchange rate risk. See “Business—Risk Management—Quantitative and Qualitative Disclosures about Market Risk—Exchange Rate Risk”. Several of our borrowersenter into derivative contracts to manage their foreign exchange risk exposures. During fiscal 2009, due tohigh exchange rate volatility as a result of the financial crisis, a number of clients experienced significantmark-to-market losses in derivative transactions. On a maturity or premature termination of the derivativecontracts, these mark-to market losses became receivables owed to us. Some clients did not pay theirderivative contract obligations to us in a timely manner, and in some cases have initiated legal proceedingschallenging the validity of these contracts and their obligations to us. Any increase in such instances and anydecision against us in these proceedings may have an adverse impact on our profitability and business. Thefailure of our borrowers to manage their exposures to foreign exchange, derivative risk, adverse movementsand volatility in foreign exchange rates may adversely affect our borrowers and the quality of our exposureto our borrowers and our business volumes and profitability. In October 2008, the Reserve Bank of Indiaissued guidelines requiring banks to classify receivables representing crystallized positive mark-to-marketvalue of a derivative contract overdue for 90 days or more as a non-performing asset. Defaults by our clientson their derivative contracts and their subsequent classification as non-performing assets may have an adverseimpact on our profitability, business and the price of our notes.
27

Entry into new businesses or expansions of existing businesses may expose us to increased risks that mayadversely affect our business.
We experienced rapid growth in our retail loan portfolio between fiscal 2002 and fiscal 2007. See“Business—Loan Portfolio”. In addition, we undertook a rural initiative designed to bring our products andservices into many rural areas. This rapid growth of the retail loan business and the rural initiative exposedus to increased risks within India including higher levels of non-performing loans in our unsecured retail creditportfolio, increased operational risk, increased fraud risk and increased regulatory and legal risk. For example,during fiscal 2007, we made a provision of Rs. 0.93 billion for losses from frauds pertaining to the warehousereceipt-based financing product for agricultural credit. See also “—We are subject to legal and regulatory riskwhich may adversely affect our business and the price of our notes” and “—We may face greater risks thanbanks in developed economies”.
Our business is very competitive and our strategy depends on our ability to compete effectively.
Within the Indian market, we face intense competition from other commercial banks, investment banks,insurance companies and non-bank finance companies. Some Indian public and private sector banks haverecently experienced higher growth, achieved better profitability and increased their market shares relative tous. Further liberalization of the Indian financial sector could lead to a greater presence or new entries of Indianand foreign banks offering a wider range of products and services, which could adversely impact ourcompetitive environment. The government of India’s budget for fiscal 2011 stated that the Reserve Bank ofIndia is considering issuing additional banking licenses to private sector players, including to non-bankfinance companies, if they meet the Reserve Bank of India’s eligibility criteria. In August 2010, the ReserveBank of India issued a discussion paper for public comment on the entry of new banks in the private sector.In addition, the Indian financial sector may experience further consolidation, resulting in fewer banks andfinancial institutions, some of which may have greater resources than us. See “Business—Competition” and“Overview of the Indian Financial Sector—Commercial Banks—Foreign Banks”. Due to competitivepressures, we may be unable to successfully execute our growth strategy and offer products and services atreasonable returns and this may adversely impact our business.
In our international operations we also face intense competition from the full range of competitors in thefinancial services industry, both banks and non-banks and both Indian and foreign banks. We remain a smallto mid-size player in the international markets and many of our competitors have resources much greater thanour own.
Changes in the regulation and structure of the financial markets in India may adversely impact ourbusiness.
The Indian financial markets have in recent years experienced, and continue to experience, changes anddevelopments aimed at reducing the cost and improving the quality of service delivery to users of financialservices. In 2005, the Reserve Bank of India introduced the Real Time Gross Settlement System, an inter-banksettlement system which facilitates real time settlements primarily between banks. Recent examples of suchchanges include free access for a customer of any bank to ATMs of all other banks with restrictions on theamount and number of transactions. Such developments impact the profitability of banks, by reduction in floatbalances and fee incomes, and an increase in costs. See also “—The regulatory environment for financialinstitutions is facing unprecedented change in the post-financial crisis environment”.
The additional capital required by our insurance subsidiaries may adversely impact our business and theprice of our notes.
While our life insurance business recorded accounting profits in fiscal 2010 and the growth of our lifeand general insurance subsidiaries has moderated, additional capital may be required to support the insurancebusiness. Our ability to invest additional capital in these businesses is subject to the Reserve Bank of India’sregulations on capital adequacy and its para-banking guidelines that prescribe limits for our aggregateinvestment in financial sector enterprises. All such investments require prior approval of the Reserve Bank ofIndia. See “Business—Insurance” and “Supervision and Regulation—Reserve Bank of IndiaRegulation—Holding Companies”. The capital requirements of our insurance subsidiaries and restrictions onour ability to capitalize them could adversely impact their growth, our future capital adequacy, our financialperformance and the price of our notes.
28

While our insurance businesses are becoming an increasingly important part of our business, there canbe no assurance of their future rates of growth or level of profitability.
Our life insurance and general insurance joint ventures are becoming an increasingly important part ofour business. See “Business—Overview of Our Products and Services—Insurance”. These businesses haveseen sharp moderation in growth since fiscal 2009. There can be no assurance of their future rates of growth.Our life insurance business primarily comprises unit-linked life insurance and pension products. Reduction incapital market valuations and volatility in capital markets have had an adverse impact on the demand for theseproducts. Our life insurance subsidiary is also expected to be impacted by the substantial changes inregulations specified by the Insurance Regulatory and Development Authority, effective September 1, 2010.The changes include a cap on surrender charges, a cap on charges applicable from the sixth year of policy, anincrease in minimum premium paying term and the introduction of minimum guaranteed returns on pensionproducts. The growth of our general insurance business has been adversely impacted by the deregulation ofpricing on certain products, which has resulted in a reduction in premiums for those products. See also“Supervision and Regulation—Regulations Governing Insurance Companies”. A slowdown in the Indianeconomy, further regulatory changes or customer dissatisfaction with our insurance products could adverselyimpact the future growth of these businesses. See also “—The regulatory environment for financial institutionsis facing unprecedented change in the post-financial crisis environment”. Any slowdown in these businessesand in particular in the life insurance business could have an adverse impact on our business and the price ofour notes.
Our life insurance business has reported statutory losses since inception until fiscal 2009.
We and our joint venture partner have made significant investments in our life insurance joint venture,ICICI Prudential Life Insurance Company. See “Business—Overview of Our Products andServices—Insurance”. As is normal in the start-up phase of any life insurance business, this business reportedstatutory losses from inception until fiscal 2009. Although the company achieved statutory profits during fiscal2010, there can be no assurance that the ultimate actual profitability of the life insurance business will be inline with current assumptions and expectations. The substantial changes in regulations introduced by theInsurance Regulatory and Development Authority are likely to impact growth in business and the profitabilityof our life insurance business.
Actuarial experience and other factors could differ from assumptions made in the calculation of lifeactuarial reserves.
The assumptions our life insurance subsidiary makes in assessing its life insurance reserves may differfrom what it experiences in the future. Our life insurance subsidiary derives its life insurance reserves using“best estimate” actuarial policies and assumptions. These assumptions include the assessment of the long-termdevelopment of interest rates, investment returns, the allocation of investments between equity, fixed incomeand other categories, mortality and morbidity rates, policyholder lapses and future expense levels. Our lifeinsurance subsidiary monitors its actual experience of these assumptions and to the extent that it considers thatthis experience will continue in the longer term, it refines its long-term assumptions. Changes in any suchassumptions may lead to changes in the estimates of life and health insurance reserves.
Loss reserves for our general insurance business are based on estimates as to future claims liabilities andadverse developments relating to claims could lead to further reserve additions and materially adverselyaffect the operation of our general insurance subsidiary.
In accordance with the general insurance industry practice and accounting and regulatory requirements,our general insurance subsidiary establishes reserves for loss and loss adjustment expenses related to itsgeneral insurance business. Reserves are based on estimates of future payments that will be made in respectof claims, including expenses relating to such claims. Such estimates are made on both a case-by-case basis,based on the facts and circumstances available at the time the reserves are established, as well as in respectof losses that have been incurred but not reported. These reserves represent the estimated ultimate costnecessary to bring all pending claims to final settlement.
Reserves are subject to change due to a number of variables which affect the ultimate cost of claims,such as changes in the legal environment, results of litigation, costs of repairs and other factors such asinflation and exchange rates and our general insurance subsidiary’s reserves for environmental and other latent
29
claims are particularly subject to such variables. The results of operations of our general insurance subsidiarydepend significantly upon the extent to which its actual claims experience is consistent with the assumptionsit uses in setting the prices for products and establishing the liabilities for obligations for technical provisionsand claims. To the extent that its actual claims experience is less favorable than the underlying assumptionsused in establishing such liabilities, it may be required to increase its reserves, which may materially adverselyaffect its results of operations.
Established loss reserves estimates are periodically adjusted in the ordinary course of settlement, usingthe most current information available to management, and any adjustments resulting from changes in reserveestimates are reflected in current results of operations. Our general insurance subsidiary also conducts reviewsof various lines of business to consider the adequacy of reserve levels. Based on current information availableand on the basis of internal procedures, the management of our general insurance subsidiary considers thatthese reserves are adequate. However, because the establishment of reserves for loss and loss adjustmentexpenses is an inherently uncertain process, there can be no assurance that ultimate losses will not materiallyexceed the established reserves for loss and loss adjustment expenses and have a material adverse effect onthe results of operations of our general insurance subsidiary.
The financial results of our general insurance business could be materially adversely affected by theoccurrence of catastrophe.
Portions of our general insurance subsidiary’s business may cover losses from unpredictable events suchas hurricanes, windstorms, monsoons, earthquakes, fires, industrial explosions, floods, riots and otherman-made or natural disasters, including acts of terrorism. The incidence and severity of these catastrophesin any given period are inherently unpredictable.
Although the subsidiary monitors its overall exposure to catastrophes and other unpredictable events ineach geographic region and determines its underwriting limits related to insurance coverage for losses fromcatastrophic events, the subsidiary generally seeks to reduce its exposure through the purchase of reinsurance,selective underwriting practices and by monitoring risk accumulation. Claims relating to catastrophes mayresult in unusually high levels of losses and may require additional capital to maintain solvency margins andcould have a material adverse effect on our financial position or results of operations.
There is operational risk associated with the financial industry which, when realized, may have anadverse impact on our business.
We, like all financial institutions, are exposed to many types of operational risk, including the risk offraud or other misconduct by employees or outsiders, unauthorized transactions by employees and third parties(including violation of regulations for prevention of corrupt practices, and other regulations governing ourbusiness activities), misreporting or non-reporting with respect to statutory, legal or regulatory reporting anddisclosure obligations, or operational errors, including clerical or record keeping errors or errors resulting fromfaulty computer or telecommunications systems. We have experienced significant growth in a fast changingenvironment, and management, as well as our regulators, are aware that this may pose significant challengesto the control framework. As a result of our internal evaluations, we and our regulators have noted certain areaswhere our processes and controls could be improved. Our growth, particularly in the rural initiative,international arena and insurance businesses exposes us to additional operational and control risks. Regulatoryscrutiny of areas related to operational risk, including internal audit information, systems and data processingis increasing. The increasing size of our treasury operations, which use automated control and recordingsystems as well as manual checks and record keeping, exposes us to the risk of errors in control and recordkeeping. The increasing size of our insurance business and the complexities of the products expose us to therisk that the models set up on actuarial software to compute the actuarial liabilities and deferred acquisitioncost may contain errors or may be continuously improved over a period of time. We also outsource somefunctions, like collections, to other agencies. Given our high volume of transactions, certain errors may berepeated or compounded before they are discovered and successfully rectified. In addition, our dependenceupon automated systems to record and process transactions may further increase the risk that technical systemflaws or employee tampering or manipulation of those systems will result in losses that are difficult to detect.We may also be subject to disruptions of our operating systems, arising from events that are wholly or partiallybeyond our control (including, for example, computer viruses or electrical or telecommunication outages),which may give rise to deterioration in customer service and to loss or liability to us. We are further exposedto the risk that external vendors may be unable to fulfill their contractual obligations to us (or will be subjectto the same risk of fraud or operational errors by their respective employees as we are), and to the risk thatour (or our vendors’) business continuity and data security systems prove not to be sufficiently adequate. Wealso face the risk that the design of our controls and procedures prove inadequate, or are circumvented, thereby
30
causing delays in detection or errors in information. Although we maintain a system of controls designed tokeep operational risk at appropriate levels, like all banks and insurance companies we have suffered lossesfrom operational risk and there can be no assurance that we will not suffer losses from operational risks in thefuture that may be material in amount, and our reputation could be adversely affected by the occurrence of anysuch events involving our employees, customers or third parties. There are inherent limitations to theeffectiveness of any system especially of controls and procedures, including the possibility of human error,circumvention or overriding of the controls and procedures, in a fast changing environment or when enteringnew areas of business or expanding geographic reach. Accordingly, even effective disclosure controls andprocedures can only provide reasonable assurance of achieving their control objectives. We are committed tocontinuing to implement and improve internal controls and our risk management processes, and this remainsa key priority for us. If, however, we are unable to manage operational risk in India and in the otherjurisdictions in which we operate, or if we are perceived as being unable to manage such risk, we may besubject to enhanced regulatory oversight and scrutiny. For a discussion of how operational risk is managed,see “Business—Risk Management—Operational Risk”.
Fraud and significant security breaches in our computer system and network infrastructure couldadversely impact our business.
Our business operations are based on a high volume of transactions. Although we take adequatemeasures to safeguard against system-related and other fraud, there can be no assurance that we would be ableto prevent fraud. Our reputation could be adversely affected by fraud committed by employees, customers oroutsiders, or by our perceived inability to properly manage fraud-related risks. Our inability or perceivedinability to manage these risks could lead to enhanced regulatory oversight and scrutiny. Our rural initiative,our international growth and our expansion to new product lines such as insurance may create additionalchallenges with respect to managing the risk of frauds due to the increased geographical dispersion and useof intermediaries. For example, during fiscal 2007, we made a provision of Rs. 0.9 billion for losses fromfrauds pertaining to the warehouse receipt-based financing product for agricultural credit. See “Operating andFinancial Review and Prospects—Provisions for Non-performing Assets and Restructured Loans” and“Business—Risk Management—Operational Risk”. Physical or electronic break-ins, security breaches, otherdisruptive problems caused by our increased use of the internet or power disruptions could also affect thesecurity of information stored in and transmitted through our computer systems and network infrastructure.Although we have implemented security technology and operational procedures to prevent such occurrences,there can be no assurance that these security measures will be successful. A significant failure in securitymeasures could have a material adverse effect on our business, our future financial performance, ourstockholders’ equity and the price of our notes.
System failures could adversely impact our business.
Given the large share of retail products and services and transaction banking services in our totalbusiness, the importance of systems technology to our business has increased significantly. We have recentlylaunched delivery of banking services through mobile telephones. Our principal delivery channels includeATMs, call centers and the Internet. While we have procedures to monitor for and prevent system failures, andto recover from system failures in the event they occur, there is no guarantee that these procedures willsuccessfully prevent a system failure or allow us to recover quickly from a system failure. Any failure in oursystems, particularly for retail products and services and transaction banking, could significantly affect ouroperations and the quality of our customer service and could result in enhanced regulatory scrutiny andbusiness and financial losses that would adversely affect the price of our notes. Regulatory scrutiny in this areais increasing.
A determination against us in respect of disputed tax assessments may adversely impact our financialperformance.
We have been assessed a significant amount in additional taxes by the government of India’s taxauthorities in excess of our provisions. See “Business—Legal and Regulatory Proceedings”. We have appealedall of these demands. While we expect that no additional liability will arise out of these disputed demands,there can be no assurance that these matters will be settled in our favor or that no further liability will ariseout of these demands. Any additional tax liability may adversely impact our financial performance and theprice of our notes.
31

We are involved in various litigations. Any final judgment awarding material damages against us couldhave a material adverse impact on our future financial performance, our stockholders’ equity and theprice of our notes.
We and our group companies, or our or their directors or officers, are often involved in litigations(including civil or criminal) in India and in the other jurisdictions in which we operate for a variety of reasons,which generally arise because we seek to recover our dues from borrowers or because customers seek claimsagainst us. The majority of these cases arise in the normal course of business and we believe, based on thefacts of the cases and consultation with counsel, that these cases generally do not involve the risk of a materialadverse impact on our financial performance or stockholders’ equity. We estimate the probability of losses thatmay be incurred in connection with legal and regulatory proceedings as of the date on which our consolidatedfinancial statements are prepared. We recognize a provision when we have a present obligation as a result ofa past event, it is probable that an outflow of resources will be required to settle the obligation and a reliableestimate of the amount of the obligation can be made. We determine the amount of provision based on ourestimate of the amount required to settle the obligation at the balance sheet date, supplemented by ourexperience in similar situations. We review provisions at each balance sheet date and adjust them to reflectcurrent estimates. In cases where the available information indicates that a loss is reasonably possible but theamount of such loss cannot be reasonably estimated, we make a disclosure to this effect in the consolidatedfinancial statements. In certain instances, present and former employees have instituted legal and otherproceedings against us alleging irregularities. When there is only a remote risk of loss, we do not recognizea provision nor do we include a disclosure in the consolidated financial statements. See “Business—Legal andRegulatory Proceedings”. We cannot guarantee that the judgments in any of the litigation in which we areinvolved would be favorable to us and if our assessment of the risk changes, our view on provisions will alsochange.
Any inability to attract and retain talented professionals may adversely impact our business.
Our business is growing more complex with both product line expansion into the insurance area andgeographic expansion internationally and via the rural initiatives. Our continued success depends in part onthe continued service of key members of our management team and our ability to continue to attract, train,motivate and retain highly qualified professionals is a key element of our strategy and we believe it to be asignificant source of competitive advantage. The successful implementation of our strategy depends on theavailability of skilled management, both at our head office and at each of our business units and internationallocations and on our ability to attract and train young professionals. In fiscal 2009, our compensation levelsdecreased as we did not award performance bonuses to employees. While a substantial portion of ourcompensation structure for middle and senior management has for several years been in the form of employeestock options, the market price of our equity shares declined significantly during the year. Depending onmarket and business conditions, we may decide to reduce our employee strength in certain of our businesses.The combination of these factors could adversely affect our ability to hire and retain qualified employees. Ifwe or one of our business units or other functions fail to staff operations appropriately, or lose one or morekey senior executives or qualified young professionals and fail to replace them in a satisfactory and timelymanner, our business, financial condition and results of operations, including our control and operational risks,may be adversely affected. Likewise, if we fail to attract and appropriately train, motivate and retain youngprofessionals or other talent, our business may likewise be affected. See “Business—Employees”.
Risks Relating to the Notes
A public market may not develop for the notes.
Prior to this offering there has been no trading market in the notes. We have received approvalin-principle for the listing of the notes on the Singapore Exchange. One or more of the Initial Purchasers’affiliates may make a market in the notes. However, the Initial Purchasers’ affiliates are not obligated to makemarkets in the notes and may discontinue this market-making activity at any time without notice. In addition,market-making activity by the Initial Purchasers’ affiliates may be subject to limits imposed by applicable law.As a result, we cannot assure you that any market in the notes will develop or, if it does develop, it will bemaintained. If an active market in the notes fails to develop or be sustained, you may not be able to sell thenotes or may have to sell them at a lower price.
32

Your right to receive payments on the notes is junior to certain tax and other liabilities preferred by law.
The notes will be subordinated to certain liabilities preferred by law such as claims of the governmentof India on account of taxes, and certain liabilities incurred in the ordinary course of our trading or bankingtransactions.
In particular, in the event of bankruptcy, liquidation or winding up, our assets will be available to payobligations on the notes only after all of those of our liabilities that rank senior to these notes have been paid.In the event of bankruptcy, liquidation or winding up, there may not be sufficient assets remaining, afterpaying amounts relating to these proceedings, to pay amounts due on the notes.
The notes do not restrict our ability to incur additional debt, repurchase our notes or to take other actionsthat could negatively impact holders of the notes.
We are not restricted under the terms of the notes from incurring additional debt, including secured debt,or from repurchasing our notes except as described under “Description of the Notes—CertainCovenants—Negative Pledge”. In addition, the covenants applicable to the notes do not require us to achieveor maintain any minimum financial results relating to our financial position or results of operations. Our abilityto recapitalize, incur additional debt and take other actions that are not limited by the terms of the notes couldhave the effect of diminishing our ability to make payments on the notes and amortizing bonds when due.
If we do not satisfy our obligations under the notes, your remedies will be limited.
Payment of principal of the notes may be accelerated only in the event of certain events involving ourbankruptcy, winding up or dissolution or similar events or otherwise if certain conditions have been satisfied.See “Description of the Notes—Events of Default”.
If we are unable to make payments on the notes from Hong Kong and must make payments from India,including any additional amounts, we may experience delays in obtaining or be unable to obtain thenecessary approvals from the Reserve Bank of India.
We are under no legal obligation to maintain liquidity at our Hong Kong branch at levels sufficient tomake payments on the notes. If payment under the notes is requested directly from us in India (whether byreason of a lack of liquidity of our Hong Kong branch, acceleration, enforcement of a judgment or impositionof any restriction under the laws of Hong Kong), and payment thereunder, including any additional amounts,is to be made from India, approval from the Reserve Bank of India will be required for the remittance of fundsoutside India. Any such approval is within the discretion of the Reserve Bank of India and we can provide noassurance that we would in fact be able to obtain such approval upon our request. In addition, there could besignificant delays in obtaining Reserve Bank of India approval.
In the event that no approvals are obtained or obtainable for the payment by us of amounts owed andpayable by our Hong Kong branch through remittances from India, we may have to seek other mechanismspermitted by applicable law to effect payment of amounts due under the notes. However, we cannot assure youthat other remittance mechanics permitted by applicable law will be available in the future, and even if theyare available in the future, we cannot assure you that the payments due under the notes would be possiblethrough such mechanisms.
The book-entry registration system of the notes may reduce the liquidity of any secondary market for thenotes and may limit the receipt of payments by the beneficial owners of the notes.
Because transfers of interests in the global notes to be issued in the offering can be effected only throughbook entries at DTC with respect to the global notes to be issued in reliance on Rule 144A and only throughbook entries at Clearstream, Luxembourg and Euroclear in the case of the global notes to be issued in relianceon Regulation S, for the accounts of their respective participants, the liquidity of any secondary market forglobal notes may be reduced to the extent that some investors are unwilling to hold notes in book-entry formin the name of a DTC, Clearstream, Luxembourg, or Euroclear participant. The ability to pledge interests inthe global notes may be limited due to the lack of a physical certificate. Beneficial owners of global notes may,in certain cases, experience delay in the receipt of payments of principal and interest since such payments willbe forwarded by the paying agent to DTC, Clearstream, Luxembourg, or Euroclear, as applicable, who willthen forward payment to their respective participants, who (if not themselves the beneficial owners) will
33

thereafter forward payments to the beneficial owners of the interests in the global notes. In the event of theinsolvency of DTC, Clearstream, Luxembourg, Euroclear or any of their respective participants in whose nameinterests in the global notes are recorded, the ability of beneficial owners to obtain timely or ultimate paymentof principal and interest on global notes may be impaired.
The rating of the notes may be lowered or withdrawn depending on some factors, including the ratingagency’s assessment of our financial strength and Indian sovereign risk.
It is a condition to the issuance of the notes that the notes be rated at least “Baa2” by Moody’s or “BBB-”by S&P. The rating addresses the likelihood of payment of principal on the relevant maturity dates of the notes.The rating also addresses the timely payment of interest on each payment date. The rating of the notes is nota recommendation to purchase, hold or sell the notes, and the rating does not comment on market price orsuitability for a particular investor. We cannot assure you that the rating of the notes will remain for any givenperiod of time or that the rating will not be lowered or withdrawn. A downgrade in the rating of the notes willnot be an event of default under the indenture. The assigned rating may be raised or lowered depending, amongother factors, on the rating agency’s assessment of our financial strength as well as its assessment of Indiansovereign risk generally.
34

USE OF PROCEEDS
The net proceeds from the sale of the notes is approximately US$993,420,000 (after deductingcommissions), which we intend to use for general corporate purposes in accordance with any applicable rulesor regulations.
35
CAPITALIZATION
The following table sets out our capitalization at September 30, 2010, derived from our auditedunconsolidated condensed financial statements prepared in accordance with Indian GAAP. For additionalinformation, see our financial statements and accompanying schedules included elsewhere in this OfferingMemorandum.
At September 30, 2010
(Rupees in
billions)
(US$ in
millions)
Borrowings: (1)
Short-term debt(2) ............................................................................................. 263.38 5,911Long-term debt(3).............................................................................................. 706.72 15,860Total borrowings (A) ........................................................................................ 970.10 21,771Shareholders’ funds:Equity share capital .......................................................................................... 11.51 258Reserves............................................................................................................ 528.24 11,855Total equity share capital, reserves and surplus (B) ........................................ 539.75 12,113Total capitalization (A) + (B)........................................................................... 1,446.85 32,470Capital adequacy: (4)
Tier I (%).......................................................................................................... 13.79Tier II (%) ........................................................................................................ 6.44Total (%)........................................................................................................... 20.23
(1) Borrowings do not include deposits. Preference share capital of Rs. 3.50 billion is included in “Borrowings” and excluded from“Share capital” as per Reserve Bank of India guidelines.
(2) Short-term debt is debt maturing within the next one year from September 30, 2010, which includes bonds in the nature ofsubordinated debt (excluded from tier II capital) of Rs. 8.47 billion.
(3) Includes Rs. 336.85 billion of unsecured redeemable debentures and bonds in the nature of subordinated debt eligible for inclusionin tier I/tier II capital.
(4) Computed as per the Basel II norms as prescribed by the Reserve Bank of India.
36

EXCHANGE RATES
Fluctuations in the exchange rate between the Indian rupee and the US dollar will affect the US dollarequivalent of the Indian rupee price of our equity shares on the Indian stock exchanges and, as a result, willaffect the market price of our notes.
In early July 1991, the government adjusted the Indian rupee downward by an aggregate ofapproximately 20.0% against the US dollar. The adjustment was effected as part of an economic packagedesigned to overcome economic and foreign exchange problems. After the Indian rupee was made convertibleon the current account in March 1993, it depreciated on an average annual basis at a rate of approximately5-6% until fiscal 2003, before appreciating slightly in fiscals 2004 and 2005. The rupee depreciated againstthe US dollar by 2.0% during fiscal 2006. During fiscal 2007, the rupee appreciated against the US dollar by3.1%, moving from Rs. 44.48 per US$1.00 at March 31, 2006 to Rs. 43.10 per US$1.00 at March 30, 2007.During fiscal 2008, the rupee appreciated against the US dollar by 7.1%, moving from Rs. 43.10 per US$1.00at March 30, 2007 to Rs. 40.02 per US$1.00 at March 31, 2008, led largely by increased capital flowsfollowing strong economic growth. During fiscal 2009, following the onset of the global financial crises anddecline in capital flows, the rupee depreciated against the US dollar by 27.1%, moving from Rs. 40.02 perUS$1.00 at March 31, 2008 to Rs. 50.87 per US$1.00 at March 31, 2009. Given improved domestic economicconditions, during fiscal 2010, the rupee appreciated against the US dollar by 11.6% moving from Rs. 50.87per US$1.00 at March 31, 2009 to Rs. 44.95 at March 31, 2010. During fiscal 2011 (through October 22,2010), the rupee appreciated against the US dollar by 0.8%, moving from Rs. 44.95 per US$1.00 at March 31,2010 to Rs. 44.59 at October 22, 2010.
The following table sets forth, for the periods indicated, certain information concerning the exchangerates between Indian rupees and US dollars. For periods prior to January 1, 2009, the exchange rates reflectthe noon buying rates as reported by the Federal Reserve Bank of New York. For periods after January 1, 2009,the exchange rates reflect the exchange rates as set forth in the H.10 statistical release of the Federal ReserveBoard.
Fiscal Year Period End(1) Average(1)(2)
2006 .................................................................................................................. 44.48 44.202007 .................................................................................................................. 43.10 45.062008 .................................................................................................................. 40.02 40.132009 .................................................................................................................. 50.87 46.322010 .................................................................................................................. 44.95 47.182011 (through October 22, 2010) ..................................................................... 44.59 45.63
Month High Low
March 2009....................................................................................................... 51.96 50.21April 2009 ........................................................................................................ 50.48 49.55May 2009.......................................................................................................... 49.75 46.95June 2009.......................................................................................................... 48.50 46.78July 2009 .......................................................................................................... 49.16 47.75August 2009 ..................................................................................................... 48.90 47.27September 2009 ................................................................................................ 49.05 47.75October 2009 .................................................................................................... 47.72 46.00November 2009 ................................................................................................ 47.37 46.06December 2009................................................................................................. 46.85 46.00January 2010..................................................................................................... 46.35 45.35February 2010................................................................................................... 46.79 45.97March 2010....................................................................................................... 46.01 44.94April 2010 ........................................................................................................ 44.79 44.10May 2010.......................................................................................................... 47.49 44.46June 2010.......................................................................................................... 47.08 45.64July 2010 .......................................................................................................... 47.23 46.25August 2010 ..................................................................................................... 47.02 45.70September 2010 ................................................................................................ 46.82 44.56October 2010 (through October 22, 2010) ...................................................... 44.59 44.05
37

(1) The exchange rate at each period end and the average rate for each period differed from the exchange rates used in the preparationof our financial statements.
(2) Represents the average of the exchange rate on the last day of each month during the period.
Although certain rupee amounts in this offering memorandum have been translated into US dollars forconvenience, this does not mean that the rupee amounts referred to could have been, or could be, convertedinto US dollars at any particular rate, the rates stated below or at all. Except as otherwise stated in this offeringmemorandum, all translations from rupees to US dollars are based on the exchange rate as set forth in the H.10statistical release of the Federal Reserve Board at September 30, 2010. The Federal Reserve Bank of New Yorkcertifies this rate for customs purposes in a weekly version of the H.10 release. The exchange rate as set forthin the H.10 statistical release of the Federal Reserve Board at September 30, 2010 was Rs. 44.56 per US$1.00and at October 22, 2010 was Rs. 44.59 per US$1.00.
38

OPERATING AND FINANCIAL REVIEW AND PROSPECTS
You should read the following discussion and analysis of our financial condition and results ofoperations together with our audited unconsolidated financial statements and audited unconsolidatedcondensed financial statements. The following discussion is based on our audited unconsolidated financialstatements and accompanying notes, which have been prepared in accordance with the Generally AcceptedAccounting Principles in India (Indian GAAP) as applicable to banks.
Executive Summary
Introduction
We are a diversified financial services group offering a wide range of banking and financial services tocorporate and retail customers through a variety of delivery channels. We are the largest private sector bankin India and the second largest bank in India, in terms of total assets. Apart from banking products andservices, we offer life and general insurance, asset management, securities brokering and private equityproducts and services through specialized subsidiaries. Our total assets at September 30, 2010 were Rs.3,899.98 billion. Our net worth (equity share capital and reserves excluding revaluation reserve and net ofintangible assets) at September 30, 2010 was Rs. 515.14 billion. During the six months ended September 30,2010, our unconsolidated net profit was Rs. 22.62 billion compared to Rs. 19.18 billion during the six monthsended September 30, 2009.
Our primary business consists of commercial banking operations for retail and corporate customers. Ourcommercial banking operations for retail customers consist of retail lending and deposit taking anddistribution of third party investment products. We deliver our products and services through a variety ofchannels, including bank branches, ATMs, call centers, internet and mobile phones. We had a network of 2,501branches and 5,722 ATMs in India at September 30, 2010. These figures include 457 deposit taking branchesand 131 ATMs of the Bank of Rajasthan, an old private sector bank that merged with us with effect from theclose of business on August 12, 2010. We provide a range of commercial banking and project finance productsand services, including loan products, fee and commission-based products and services, deposit products andforeign exchange and derivatives products to India’s leading corporations, middle market companies and smalland medium enterprises. We also offer agricultural and rural banking products. We earn interest and feeincome from our commercial banking operations.
In our international banking operations, our primary focus is on persons of Indian origin and Indianbusinesses. Our international branches and banking subsidiaries take deposits, raise borrowings and makeloans primarily to Indian companies for their overseas operations as well as for their foreign currencyrequirements in India. They also engage in advisory and syndication activities for fund-raising by Indiancompanies and their overseas operations. We currently have banking subsidiaries in the United Kingdom,Canada and Russia, branches in Singapore, Dubai, Sri Lanka, Hong Kong, Qatar, the United States andBahrain and representative offices in China, the United Arab Emirates, Bangladesh, South Africa, Malaysia,Thailand and Indonesia. Our subsidiary in the United Kingdom has established a branch in Antwerp, Belgiumand a branch in Frankfurt, Germany.
Our treasury operations include maintenance and management of regulatory reserves, proprietary tradingin equity and fixed income and a range of foreign exchange and derivatives products and services for corporatecustomers, such as forward contracts, swaps and options. We take advantage of movements in markets to earntreasury income. We also earn fees from treasury products that we offer to our customers. Our internationalbranches and subsidiaries also have investments in credit derivatives, in bonds of non-India financialinstitutions and in asset backed securities.
We are also engaged in insurance, asset management, securities business and private equity fundmanagement through specialized subsidiaries. Our subsidiaries ICICI Prudential Life Insurance Company,ICICI Lombard General Insurance Company and ICICI Prudential Asset Management Company provide awide range of life and general insurance and asset management products and services to retail and corporatecustomers. ICICI Prudential Life Insurance Company was the largest private sector life insurance company inIndia during the six months ended September 30, 2010, with a market share of 9.9% based on new businesswritten (on retail weighted received premium basis). ICICI Lombard General Insurance Company was thelargest private sector general insurance company in India during the six months ended September 30, 2010,with a market share of 10.3% in gross written premium. ICICI Prudential Asset Management Company
39
manages the ICICI Prudential Mutual Fund Limited, which was among the top three mutual funds in India interms of average funds under management in September 2010 with a market share of 9.8%. We cross-sell theproducts of our insurance and asset management subsidiaries and other asset management companies to ourretail and corporate customers. Our subsidiaries ICICI Securities Limited and ICICI Securities PrimaryDealership Limited are engaged in equity underwriting and brokerage and primary dealership in governmentsecurities respectively. ICICI Securities owns icicidirect.com, a leading online brokerage platform. ICICISecurities Limited has a subsidiary in the United States, ICICI Securities Holdings Inc., which in turn has anoperating subsidiary in the United States, ICICI Securities Inc., engaged in brokerage services. Our privateequity fund management subsidiary ICICI Venture Funds Management Company manages funds that makeprivate equity investments.
Business environment
The financial information contained in this offering memorandum is unconsolidated and prepared inaccordance with Indian GAAP, while the financial information in our annual reports on Form 20-F for thefiscal years 2006, 2007, 2008, 2009 and 2010 is based on our audited consolidated financial statements andaccompanying notes prepared in accordance with Indian GAAP. The net income and stockholders’ equity arereconciled to US GAAP. For discussion of certain significant differences between Indian GAAP and USGAAP, see “Description of Certain Differences between Indian GAAP and US GAAP”.
Our loan portfolio, financial condition and results of operations have been and, in the future, areexpected to be influenced by economic conditions in India, global economic developments affecting thebusiness activities of our corporate customers, such as changes in commodity prices, and conditions in globalfinancial markets and economic conditions in the United States and in foreign countries where we have asignificant presence. For ease of understanding the following discussion of our results of operations, youshould consider these macroeconomic factors and other key factors.
Trends in fiscal 2010
During fiscal 2010, India witnessed a significant revival in economic activity following the moderationin fiscal 2009. The economic recovery was evident across a wide range of sectors with the momentumincreasing in the second half of fiscal 2010. Industrial activity, as reflected by the Index of IndustrialProduction, increased by 10.4% during fiscal 2010 as against 2.7% in fiscal 2009. The growth in the Index ofIndustrial Production was largely driven by the manufacturing sector, which recorded a growth of 10.9% infiscal 2010 compared to 3.1% in fiscal 2009.
India’s gross domestic product grew by 7.4% during fiscal 2010, compared to 6.7% in fiscal 2009, ledby a 10.4% growth in industry and an 8.3% growth in the services sector. However, the agricultural sectorrecorded a growth of only 0.2% primarily due to below normal monsoon rainfall.
Liquidity in the Indian financial system remained comfortable throughout fiscal 2010, with averageliquidity adjustment facility balances (short-term lending by banks to the Reserve Bank of India) in excess ofRs. 1.00 trillion for most of the year. During the second half of fiscal 2010, inflationary pressures increaseddriven largely by food price inflation. Inflation as measured by the wholesale price index increased from a lowof —1.0% in June 2009 to 11.0% in March 2010. In view of increasing inflationary pressures and initial signsof economic recovery, the Reserve Bank of India in its quarterly review of monetary policy in October 2009increased the statutory liquidity ratio by 100 basis points to 25.0% and withdrew certain special liquidityfacilities instituted in response to the global financial crisis. In the third quarter review of monetary policy inJanuary 2010, the Reserve Bank of India increased the cash reserve ratio by 75 basis points from 5.0% to5.75% in a phased manner starting in February 2010. On March 19, 2010, the Reserve Bank of India increasedthe benchmark repo and reverse repo rates by 25 basis points with immediate effect. The yield on thebenchmark ten-year government of India securities increased from 7.01% at year-end fiscal 2009 to 7.82% atyear-end fiscal 2010. The fiscal deficit (excluding oil and fertilizer bonds) has increased from 3.1% in fiscal2008 to 6.0% in fiscal 2009 and to 6.7% in fiscal 2010 mainly due to the impact of the global financial andeconomic crisis, including fiscal stimulus measures in response to the financial crisis, expenditure on variousgovernment schemes and lower than targeted tax revenues.
In response to ample systemic liquidity and a low interest rate environment, scheduled commercial banksreduced their deposit rates for various maturities by 25-250 basis points during March-December 2009. Theimpact of the lower cost of funds for banks was also transmitted to interest rates on loans, with the benchmarkprime lending rates of banks declining by 25-100 basis points during the same period. Deposit rates, however,
40

increased by about 25 basis points in the fourth quarter of fiscal 2010 reflecting a reversal of theaccommodative monetary policy stance. Despite the decrease in interest rates, credit growth remained subduedduring fiscal 2010. Non-food credit growth moderated to a low of 10.1% at October 30, 2009 on a year-on-yearbasis, compared to 28.3% at October 31, 2008. Lower loan growth and high liquidity led to increased pricecompetition in the banking sector and introduction of products such as home loans with lower rates in theinitial years. However, credit growth gained momentum from November 2009 onwards, with year-on-yeargrowth of 16.9% at March 26, 2010 compared to year-on-year growth of 17.5% at March 27, 2009. Bankingdeposits increased by 17.2% on a year-on-year basis at March 26, 2010 compared to 19.9% at March 27, 2009.Demand deposits increased by 23.4% on a year-on-year basis at March 26, 2010 compared to a decline of 0.2%at March 27, 2009.
Equity markets appreciated significantly during fiscal 2010 with the benchmark equity index, the BSESENSEX, increasing by 80.5% to 17,528 at year-end fiscal 2010. Foreign institutional investments revivedwith net inflows of US$ 32.4 billion during fiscal 2010 compared to net outflows of US$ 14.0 billion in fiscal2009. Net foreign direct investments at US$ 19.7 billion during fiscal 2010 were also higher compared to US$17.5 billion in net foreign direct investments during fiscal 2009. The revival in trade combined with strongcapital inflows improved India’s balance of payments, which recorded a surplus of US$ 13.4 billion in fiscal2010 as compared to a deficit of US$ 20.1 billion in fiscal 2009. As a result, the rupee appreciated by 11.4%against the US dollar from Rs. 51.0 per US dollar at year-end fiscal 2009 to Rs. 44.9 per US dollar at year-endfiscal 2010 after a depreciation of 27.1% during fiscal 2009.
The recovery in economic activity and improvement in financial markets during fiscal 2010 led to arecovery in the demand for financial savings and investment products, resulting in a recovery in the lifeinsurance and mutual fund sectors. First year retail underwritten premium in the life insurance sector increasedby 16.7% (on weighted received premium basis) to Rs. 550.24 billion in fiscal 2010 compared to a decreaseof 10.4% in fiscal 2009. Total assets under management (on average assets basis) of mutual funds increasedby 51.5% from Rs. 4,932.85 billion in March 2009 to Rs. 7,475.25 billion in March 2010 compared to adecrease of 8.4% in March 2009 over March 2008. Until January 1, 2007, almost 70.0% of the generalinsurance market was subject to price controls under a tariff regime. The general insurance industry wasde-tariffed with effect from January 1, 2007 resulting in reductions in premium rates and in the rate of growthof the industry. Gross premiums in the non-life insurance sector (excluding specialized insurance institutions)grew by 13.4% to Rs. 347.55 billion in fiscal 2010 compared to 9.2% growth in fiscal 2009 and 12.3% growthin fiscal 2008 with the private sector’s market share at 40.9% in fiscal 2010.
Trends during the six months ended September 30, 2010
The Index of Industrial Production continued to reflect a strong revival in economic activity with agrowth of 10.6% during April-August 2010 compared to a growth of 5.8% during the same period last year.However, the growth in the Index of Industrial Production has been volatile in recent months, decreasing to5.6% in the month of August 2010, after growth of 15.2% in July 2010. During the three months ended June30, 2010, India’s gross domestic product grew by 8.8%, primarily due to an 11.4% growth in industry and a9.4% growth in the services sector. The agricultural sector grew by 2.8% in this period. Inflation remainedhigh, with inflation as measured by the wholesale price index reaching 8.6% in September 2010, comparedto 11.0% in March 2010. Normal monsoon rains are expected to support agricultural growth.
In response to increasing inflation and a recovery in economic growth, the Reserve Bank of Indiacontinued to exit from easy monetary policy by increasing the repo rate by 100 basis points, the reverse-reporate by 150 basis points and the cash reserve ratio by 25 basis points during the six months ended September30, 2010. The Reserve bank of India increased the repo and reverse repo rates by an additional 25 basis pointson November 2, 2010. While the yield on the benchmark 10 year government of India securities remained atthe same level at the end of the six months ended September 30, 2010 compared to the year-ended March 31,2010, it was volatile during this period, decreasing from 7.83% at March 31, 2010 to 7.55% at June 30, 2010and increasing back to 7.84% at September 30, 2010. However, the yield on short-term government of Indiasecurities, such as two year securities, increased by 74 basis points during the six months ended September30, 2010.
The year-on-year non-food credit growth increased to 20.1% at October 8, 2010 from 17.1% at March26, 2010. However, deposit growth was subdued, with total deposits of the banking system increasing by15.0% on a year-on-year basis at October 8, 2010, compared to 17.2% at March 26, 2010. Year-on-year growth
41

in demand deposit decelerated to 15.8% at October 8, 2010 from 23.4% at March 26, 2010, while term depositgrowth decreased to 14.9% at October 8, 2010, from 16.2% at March 26, 2010. With the increase in loangrowth, lower growth in deposits and increase in cash reserve ratio, the liquidity in the banking system, afterremaining in surplus mode for almost 18 months, became negative in June 2010 and remained tight during thelatter part of the six months ended September 30, 2010. In response to an increase in repo and reverse ratesand tight systemic liquidity, banks increased both deposit and lending rates during the latter part of the sixmonths ended September 30, 2010.
Equity markets increased sharply towards the latter part of the six months ended September 30, 2010with the BSE SENSEX increasing by 13.4%, from 17,692 at April 1, 2010 to 20,069 at September 30, 2010,after remaining at approximately at the same level between April 1, 2010 and June 30, 2010. The rupeeappreciated against the US dollar by 7.4% from Rs. 48.11 per US dollar at September 30, 2009 and by 0.9%from Rs. 44.95 per US dollar at March 31, 2010 to Rs. 44.56 per US dollar at September 30, 2010 due to strongforeign capital inflows during the latter part of the six months ended September 30, 2010.
There were a number of key regulatory developments in the Indian financial sector during fiscal 2010and the six months ended September 30, 2010:
• Banks were allowed to open offsite ATMs without prior approval of the Reserve Bank of India.Banks were allowed to open branches in tier 3 to 6 cities (cities with a population of up to 49,999)as defined on the basis of population size in the 2001 census, without the prior approval of theReserve Bank of India.
• The Reserve Bank of India issued guidelines relating to the issuance and operation of mobile phonebased payment instruments.
• The Reserve Bank of India issued a schedule for the introduction of advanced approaches for themeasurement of risks (credit, market and operational) under the Basel II framework. Under thisschedule, banks are permitted to apply to the Reserve Bank of India for migration to an internalmodels approach for market risk and the standardized approach for operational risk from April 1,2010 and for advanced measurement approach for operational risk and internal ratings basedapproaches for credit risk from April 1, 2012. The Reserve Bank of India increased the capitalrequirements relating to securitization exposures and provided enhanced guidance on valuationadjustments for illiquid investments and derivatives. The guidelines also increased disclosurerequirements for the mitigation of credit risk and securitized exposures.
• The Reserve Bank of India issued guidelines revising the method of payment of interest on savingsaccounts to a daily average basis effective April 1, 2010 which resulted in an increase in cost ofsavings deposits for banks from fiscal 2011.
• On March 30, 2010, the Reserve Bank of India issued guidelines on the classification of capitalinstruments on the balance sheet of banks. Banks are required to classify innovative perpetual debtinstruments, hybrid debt capital instruments issued as bonds/debentures, perpetual cumulativepreference shares, redeemable noncumulative preference shares, redeemable cumulativepreference shares, subordinated debt as borrowings and perpetual non-cumulative preferenceshares as capital.
• The Reserve Bank of India issued guidelines on accounting for repo and reverse repo transactions,effective April 1, 2010 under which repo and reverse repo transactions in government securitiesand corporate debt securities (excluding transactions conducted under liquidity adjustment facilitywith the Reserve Bank of India) are reflected as borrowing and lending transactions, respectively.These transactions were earlier recorded under investments as sales and purchases, respectively.
• In December 2009, the Reserve Bank of India directed banks to achieve a total provisioningcoverage ratio of 70% on non-performing advances by September 30, 2010. The provisioningrequirement for advances to commercial real estate classified as standard assets was increasedfrom 0.4% to 1.0%.
• With effect from July 1, 2010, as part of the overall reform of the banking system, the ReserveBank of India implemented a new base rate mechanism requiring banks in India to set and publiclydisclose their minimum rate or base rate for all new loans and existing loans which come up forrenewal, subject to certain limited exceptions.
42

• In June 2009, the Securities and Exchange Board of India issued guidelines stating that mutualfunds could not charge any entry charges to investors investing in mutual funds.
• In June 2010, the Insurance Regulatory and Development Authority introduced revisions to theregulations governing unit-linked insurance products such as an increase in the lock-in period fromthree years to five years, minimum mortality cover, cap on surrender and other charges andminimum guaranteed return of 4% on pension annuity products. These changes have been effectiveas of September 1, 2010.
• On September 28, 2010, the Reserve Bank of India allowed banks to engage for-profit companiesregistered under the Indian Companies Act, 1956, excluding non-banking financial companies, asbusiness correspondents in addition to those individuals/entities permitted earlier.
Business Overview
While assessing our performance, we monitor key financial variables such as movement in yield onassets, cost of funds and net interest margin, movement in fee income, cost ratios, loan loss provisions andreturn on assets and equity. We also monitor key business indicators such as deposit growth, funding mix, loandisbursements and loan delinquency trends. We also analyze changes in economic indicators such as interestrates, liquidity and exchange rates. In addition to these financial indicators, we monitor other non-financialindicators such as quality of customer service and the extent and nature of customer complaints and estimatesof market share in key product lines.
Following the merger of ICICI with ICICI Bank in 2002, we experienced rapid growth in our business.The growth of our rupee loan portfolio was driven primarily by retail loans, including home loans, vehicleloans and unsecured personal loans and credit card receivables. We also commenced our strategy ofinternational expansion and established subsidiaries and branches in several foreign countries. The growth ofour international loan portfolio was driven primarily by foreign currency financing to Indian companies andtheir international operations, including financing for their overseas acquisitions. We also experienced robustgrowth in our insurance subsidiaries. These activities led to a rapid growth in our fee incomes from both retailand corporate customers. During this period, our branch network in India continued to be limited relative tothe size of our balance sheet, and while deposits were our primary source of domestic funding, we had a highshare of term deposits in our total deposits, including term deposits from companies and financialintermediaries. Our international branches were funded primarily by international bond issuances and otherwholesale funding sources. Our principal international subsidiaries in the United Kingdom and Canada werefunded primarily by deposits. Our subsidiary in the United Kingdom had a sizeable proportion of demanddeposits in its deposit base, and made investments in bonds of US and European banks and investment banksas a liquidity management strategy. During this period, we raised capital to support our growth. In fiscal 2008,we issued equity shares in India and American Depository Shares in the United States, aggregatingapproximately Rs. 200.00 billion.
Following the onset of the global financial crisis, although we did not have any material direct exposureto US sub-prime assets, we were adversely impacted by mark-to-market and realized losses on ourinternational investments and credit derivatives portfolios on account of the widening of credit spreads ingeneral. More generally, the global financial crisis impacted the Indian markets and led to reduced demand forretail savings and investment products and lower levels of corporate investment and merger and acquisitionactivity during the second half of fiscal 2009. This had a negative impact on our fee and other non-interestincome (including dividends from subsidiaries). While we capitalized on opportunities in the fixed incomemarkets due to a reduction in interest rates during the third quarter of fiscal 2009, our equity, fixed incomeand credit derivatives portfolios were negatively impacted due to weaker equity markets, volatile interest ratesand a widening of credit spreads during fiscal 2009. The global and Indian economic slowdown and its impacton equity and debt markets also adversely impacted the profitability of some of our borrowers and their abilityto access equity and debt financing. We experienced an increase in the level of restructured loans in fiscal 2009and fiscal 2010. We experienced an increase in the non-performing loans in our retail portfolio in fiscal 2009and fiscal 2010 due to the seasoning of the portfolio and a higher level of defaults in unsecured personal loansand credit card receivables due to challenges in collections and the impact of the adverse macroeconomicenvironment in fiscal 2009.
43

Given the volatile economic environment in fiscal 2009, we had focused on capital conservation,liquidity management and risk containment. We tightened our lending norms, especially in the unsecured retailsegment and moderated our credit growth. We expanded our branch network with a focus on increasing ourlow cost and retail deposit base. At the same time, we maintained a rigorous control on operating expenses.In fiscal 2010, we focused on repositioning our balance sheet for the next phase of growth. We increased theproportion of low cost current and savings account deposits; reduced the level of net non-performing loans;continued to keep a rigorous control on operating expenses; reduced the level of unsecured retail loans andmaintained a high level of capital adequacy. Our non-banking subsidiaries engaged in asset management,securities brokering and life insurance have benefited from the stabilization and improvement in economicconditions and the revival of the equity markets in India. Stabilization in markets also led to a reduction ofmark-to-market losses on our fixed income and credit derivatives portfolios.
During the six months ended September 30, 2010, we further increased the proportion of low cost currentand savings account deposits; reduced the level of net non-performing loans; continued to keep a rigorouscontrol on operating expenses and maintained a high level of capital adequacy. We also resumed the growthin our loan book during the six months ended September 30, 2010. The Reserve Bank of India approved thescheme of amalgamation of the Bank of Rajasthan, a private sector bank, with us with effect from the closeof business on August 12, 2010. Our results for the six months ended September 30, 2010 include the resultsof the Bank of Rajasthan for the period from August 13, 2010 to September 30, 2010. See also “Amalgamationof the Bank of Rajasthan Limited”.
Our net profit increased by 17.9% from Rs. 19.18 billion in the six months ended September 30, 2009to Rs. 22.62 billion in the six months ended September 30, 2010.
The increase in net profit was mainly due to a 39.9% decrease in provisions and contingencies(excluding provision for tax) from Rs. 23.95 billion in the six months ended September 30, 2009 to Rs. 14.39billion in the six months ended September 30, 2010. The decrease in provisions and contingencies (excludingprovision for tax) was primarily due to a reduction in provisions for retail non-performing loans. The decreasein provision for retail non-performing loans was primarily due to a sharp decrease in accretion to retailnon-performing loans during fiscal 2010 and the six months ended September 30, 2010. Net interest incomeincreased by 4.3% from Rs. 40.21 billion in the six months ended September 30, 2009 to Rs. 41.95 billion inthe six months ended September 30, 2010.
The decrease in provisions and contingencies and increase in net interest income was partly offset by a16.7% decrease in non-interest income from Rs. 39.14 billion in the six months ended September 30, 2009 toRs. 32.58 billion in the six months ended September 30, 2010. The decrease in non-interest income wasprimarily due to a decrease in income from treasury-related activities by 72.1% from Rs. 12.63 billion in thesix months ended September 30, 2009 to Rs. 3.52 billion in the six months ended September 30, 2010. Thedecrease in income from treasury-related activities in the six months ended September 30, 2010 was primarilydue to an increase in yields on short-term government securities resulting in mark-to-market and realizedlosses on our government and other domestic fixed income securities portfolio. Commission, exchange andbrokerage income increased by 12.4% from Rs. 23.17 billion in the six months ended September 30, 2009 toRs. 26.04 billion in the six months ended September 30, 2010.
Total deposits increased by 12.8% from Rs. 1,978.32 billion at September 30, 2009 to Rs. 2,230.94billion at September 30, 2010. Current and savings account deposits increased by 34.5% from Rs. 729.30billion at September 30, 2009 to Rs. 981.05 billion at September 30, 2010 while term deposits increasedmarginally from Rs. 1,249.02 billion at September 30, 2009 to Rs. 1,249.89 billion at September 30, 2010. Theratio of current and savings account deposits to total deposits increased from 36.9% at September 30, 2009to 44.0% at September 30, 2010. Total advances increased by 1.8% from Rs. 1,908.60 billion at September30, 2009 to Rs. 1,942.01 billion at September 30, 2010. Net non-performing assets decreased by 30.0% fromRs. 45.58 billion at September 30, 2009 to Rs. 31.92 billion at September 30, 2010 and the net non-performingasset ratio decreased from 2.2% at September 30, 2009 to 1.4% at September 30, 2010.
We continued to expand our branch network in India. Our branch network in India increased from 1,509branches and extension counters at September 30, 2009 to 2,501 branches and extension counters at September30, 2010. We also increased our ATM network from 4,883 ATMs at September 30, 2009 to 5,722 ATMs atSeptember 30, 2010. These include 457 deposit taking branches and 131 ATMs of the Bank of Rajasthan. Inaddition to the deposit taking branches, the Bank of Rajasthan has six service branches.
44

The total capital adequacy ratio of ICICI Bank on a stand-alone basis at September 30, 2010 inaccordance with the Reserve Bank of India guidelines on Basel II increased to 20.2% with a tier I capitaladequacy ratio of 13.8% from a total capital adequacy of 17.7% and tier I capital adequacy of 13.3% atSeptember 30, 2009.
Business Outlook
The outlook for GDP growth in fiscal 2011 has improved significantly, given the broad-based and robustrecovery seen since the last quarter of fiscal 2010. The prospects of growth momentum appear strong, drivenby buoyant performance of the industrial sector, increased monsoon rains, and the sustained resilience of theservices sector. However, the index of industrial production has been volatile in the recent months decreasingto 5.6% for the month of August 2010 after a growth of 15.2% in July 2010. Notwithstanding the volatilityin the index, growth is expected to remain steady and the Reserve Bank of India has placed its GDP growthprojection for fiscal 2011 at 8.5%.
While the growth outlook for fiscal 2011 remains robust, inflation has emerged as an area of concern.Headline inflation has remained close to double digits in fiscal 2011. The fiscal deficit continues to remainhigh which, while not a concern in the short term, may lead to macroeconomic risks ranging from higherinflation to lower savings and the crowding out of private investment. In the banking system, growth in lowcost savings and current account deposits is likely to be lower in fiscal 2011 compared to fiscal 2010 givena deceleration in demand deposit growth to 15.8% at October 8, 2010 from 23.4% at March 26, 2010.
We see favorable prospects for the Indian economy over the long-term. India’s strong domesticconsumption and investment drivers are expected to continue to support healthy rates of growth. Against thisbackdrop, we expect increasing household incomes and consumption to lead to opportunities in retail savings,investment and loan products; significant industrial and infrastructure investment potentially leading toopportunities in project and corporate finance; and increasing globalization of India leading to opportunitiesin international banking for Indian corporates and non-resident Indians.
Over the last two years, we have rebalanced our deposit profile, reduced costs, reduced netnon-performing loans and maintained high levels of capital adequacy. Our successful execution of this phaseof our strategy has coincided with the strengthening of the economic growth momentum in India, whichcreates an environment with opportunities for growth. Our objective going forward is to leverage our capitalbase for profitable growth, while sustaining the improvements in the ratio of current and savings accountdeposits, cost ratios and credit quality that we have achieved since fiscal 2010. As we grow our businesses,meeting customer expectations on service quality will be a critical element of our strategy.
We believe that as a diversified financial services group we are well positioned to capitalize on theseopportunities. However, the success of our strategy depends on several factors, including our ability to growour low cost deposit base; grow our loan book profitably; contain non-performing loans; maintain regulatorycompliance in an evolving regulatory environment and address regulators’ assessments of and observations onour operations; and compete effectively in the Indian corporate and retail financial services market. Thesuccess of our strategy is also subject to the overall regulatory and policy environment in which we operateincluding the direction of monetary policy. In fiscal 2011, between April and November 2010 (up to November2, 2010), the Reserve Bank of India announced a 25 basis point increase in the cash reserve ratio to 6.0%, a125 basis point increase in the repo rate to 6.25% and a 175 basis point increase in the reverse repo rate to5.25%. Profit on the sale of investments in fixed income securities, including government of India securities,is an important element of our profitability and is impacted by movement in market yields. With the increasein loan growth and an increase in the cash reserve ratio and repo and reverse repo rates, liquidity is expectedto remain tight, and deposit and lending rates are expected to continue to increase during the second half offiscal 2011. Our insurance business may also be affected by changes in insurance regulations in India.Recently the Insurance Regulatory and Development Authority introduced revisions to the regulationsgoverning unit-linked insurance products such as an increase in the lock-in period from three years to fiveyears, increase in minimum mortality cover, cap on surrender and other charges and minimum guaranteedreturn of 4% on pension annuity products. These changes may impact the growth and profitability of our lifeinsurance business.
For a detailed discussion of risks that we face in our business please refer to “Risk Factors”.
45

Effect of Other Acquisitions
During fiscal 2007, we entered into an all-stock merger with Sangli Bank at a share exchange ratio of100 shares of ICICI Bank for 925 shares of Sangli Bank. Our financial statements for fiscal 2008 include theresults of the operations of Sangli Bank from April 19, 2007. The value of this transaction was not materialto our overall operations.
Amalgamation of the Bank of Rajasthan Limited
On May 23, 2010, the Board of Directors of ICICI Bank and the Board of Directors of the Bank ofRajasthan, a private sector Indian bank, at their respective meetings approved an all-stock amalgamation ofthe Bank of Rajasthan with ICICI Bank at a share exchange ratio of 25 shares of ICICI Bank for 118 sharesof the Bank of Rajasthan. The shareholders of ICICI Bank and the Bank of Rajasthan approved the schemeof amalgamation at their respective extra-ordinary general meetings on June 21, 2010. The Reserve Bank ofIndia approved the scheme of amalgamation with effect from close of business on August 12, 2010.
The amalgamation has substantially enhanced our branch network and especially strengthened ourpresence in northern and western India. It combines the Bank of Rajasthan’s branch franchise with ICICIBank’s strong capital base, to enhance the ability of the combined entity to capitalize on the growthopportunities in the Indian economy. We have issued 31.3 million shares representing 2.8% of our shares toshareholders of the Bank of Rajasthan in August 2010. 2.9 million equity shares have been kept in abeyancepending civil appeal and regulatory direction, which have been included in our paid-up capital. The total assetsof the Bank of Rajasthan represented 4.0% of total assets of ICICI Bank at August 12, 2010. At August 12,2010, the Bank of Rajasthan had total assets of Rs. 155.96 billion, deposits of Rs. 134.83 billion, current andsavings deposits of 46.80 billion, loans of Rs. 65.28 billion and investments of Rs. 70.96 billion. This isreflected in our results for September 30, 2010 as discussed below. During fiscal 2010, the Bank of Rajasthanhad incurred a loss of Rs. 1.02 billion. See also “Financial statements of ICICI Bank Limited (Unconsolidated)for the six months ended September 30, 2010”.
Introduction of the Base Rate System
Historically, interest rates on loans were linked to a prime lending rate of banks. With effect from July1, 2010, as part of the overall reform of the banking system, the Reserve Bank of India implemented a newbase rate system requiring banks in India to set and publicly disclose their minimum rate or base rate for allnew loans and existing loans which come up for renewal, subject to certain limited exceptions. While existingloans based on the benchmark prime lending rate system will continue to be linked to the benchmark primelending rate until their maturity, existing borrowers would be given an option to migrate to the base rate systembefore the expiry of existing contracts on mutually agreed terms. Except for certain categories of loans asspecified by the Reserve Bank of India, banks are not allowed to lend below the base rate. Banks are requiredto review and, if necessary, revise their base rates at least once every quarter.
The Asset Liability Management Committee of the Bank, at its meeting on June 30, 2010, set the baserate of ICICI Bank, called “I-Base”, at 7.50% with effect from July 1, 2010. The base rate was revised to7.75% with effect from October 6, 2010.
Change in Methodology for Computing Interest Payable on Savings Deposits
The Reserve Bank of India has prescribed an interest rate of 3.50% on savings deposits. Until March 31,2010, banks were required to pay this interest on the minimum outstanding balance in a savings depositaccount between the tenth day and last day of the month. Effective April 1, 2010, the Reserve Bank of Indiahas changed the methodology of computation of the interest payable on savings deposits. Banks are nowrequired to pay interest on the daily average balance maintained in a savings deposit account. This change inmethodology has resulted in an increased effective interest rate on savings account deposits for Indian banksand has adversely impacted our and other Indian banks’ net interest margin.
46

The Six Months Ended September 30, 2010 Compared to the Six Months Ended September 30, 2009
Net Interest Income
The following table sets forth, for the periods indicated, the principal components of net interest income.
Six months ended September 30,
2009 2010 2010
2010/2009
% change
(in millions, except percentages)
Interest income ............................................... Rs. 137,903.8 Rs. 121,216.4 US$ 2,720 (12.1)%Interest expense .............................................. (97,690.5) (79,262.1) (1,778) (18.9)%
Net interest income......................................... Rs. 40,213.3 Rs. 41,954.3 US$ 942 4.3%
Net interest income increased by 4.3% from Rs. 40.21 billion in the six months ended September 30,2009 to Rs. 41.95 billion in the six months ended September 30, 2010 reflecting a 16 basis point increase innet interest margin from 2.41% in the six months ended September 30, 2009 to 2.57% in the six months endedSeptember 30, 2010, partly offset by a 2.2% decrease in the average volume of interest-earning assets.
Net interest margin
Net interest margin increased by 16 basis points from 2.41% in the six months ended September 30, 2009to 2.57% in the six months ended September 30, 2010.
The yield on interest-earning assets decreased by 83 basis points from 8.25% in the six months endedSeptember 30, 2009 to 7.42% in the six months ended September 30, 2010. The key factors impacting the yieldon interest-earning assets were:
Yield on advances decreased from 9.52% in the six months ended September 30, 2009 to 8.39% in thesix months ended September 30, 2010, primarily due to a reduction in our prime lending rate by 100 basispoints, from 16.75% to 15.75%, and a reduction in the floating reference rate applicable to our floating ratehome loans by 100 basis points from 13.75% to 12.75%, effective June 5, 2009, which was only partlyreflected in the six months ended September 30, 2009 and fully reflected in the six months ended September30, 2010. The reduction in rates was in response to abundant systemic liquidity and a low interest rateenvironment due to which banks reduced their deposit and lending during March-December 2009. Lower loangrowth and high liquidity also led to increased price competition for new business and introduction of productssuch as home loans with lower rates in the initial years of such loans.
The proportion of high yielding unsecured retail loans in our loan portfolio declined as a result of ourconscious strategy of reducing our exposure to this asset class.
Yield on average interest-earning investments decreased by 38 basis points from 6.44% in the six monthsended September 30, 2009 compared to 6.06% in the six months ended September 30, 2010, primarily due toa decrease in yield on investments in government. This was offset, in part, by an increase in yield on otherinterest-earning investments. The yield on average interest-earning investments, other than investments ingovernment securities, increased from 5.80% in the six months ended September 30, 2009 to 6.10% in the sixmonths ended September 30, 2010, primarily due to an increase in investment in credit substitutes likecorporate bonds and debentures, certificate of deposits and commercial paper. We continue to invest in liquidmutual funds to deploy excess liquidity.
The Reserve Bank of India increased the cash reserve ratio by 75 basis points to 5.75% during fiscal2010 and further by 25 basis points to 6.00% in the six months ended September 30, 2010. As cash reserveratio balances do not earn any interest income, the increase in requirement resulted in a negative impact onyield on interest-earning assets.
We earn interest on income tax refunds which amounted to Rs. 0.84 billion in the six months endedSeptember 30, 2010 compared to Rs. 0.72 billion in the six months ended September 30, 2009. The receipt,amount and timing of such income depends on the nature and timing of determinations by tax authorities andis not consistent or predictable.
47

We deduct losses related to the securitization of assets (including credit losses on existing securitizedpools) from our interest income. The amount of such losses was Rs. 2.21 billion in the six months endedSeptember 30, 2010 compared to Rs. 2.29 billion in the six months ended September 30, 2009. See also“Critical Accounting PoliciesTransfer and Servicing of Assets”.
The cost of funds decreased by 97 basis points from 6.18% in the six months ended september 30, 2009to 5.21% in the six months ended September 30, 2010. The decrease in the cost of funds was due to a declinein interest rates in the Indian economy, a higher proportion of low cost current and savings deposits and areduction in our wholesale term deposits. The proportion of current and savings accounts deposits to the totaldeposits increased from 36.9% at September 30, 2009 to 44.0% at September 30, 2010. As a result of theabove, the cost of deposits decreased to 4.80% in the six months ended September 30, 2010 compared to6.45% in the six months ended September 30, 2009.
The six month LIBOR, which is generally the benchmark for our foreign currency loans and borrowings,also decreased in the six months ended September 30, 2010 compared to the six months ended September 30,2009, which led to a decrease in both the yield on and cost of funds of the foreign currency portfolio.
The Reserve Bank of India prescribes a rate of 3.5% on savings deposits and the methodology ofcomputing the interest. Until March 31, 2010, banks were required to pay interest on the minimum outstandingbalance in a savings account between the tenth and last day of the month. Accordingly, the effective cost ofsavings deposits for banks was much less than the prescribed rate of 3.5%. Effective April 1, 2010, the interestis paid on the average balance in a savings account which will adversely impact the net interest margin ofIndian banks including us. Our cost of savings account deposits for fiscal 2010 was 2.8% which has increasedto 3.5% from April 1, 2010.
Interest-earning assets
The average volume of interest-earning assets decreased by 2.2% from Rs. 3,334.38 billion in the sixmonths ended September 30, 2009 to Rs. 3,260.67 billion in the six months ended September 30, 2010. Thedecrease in average interest-earning assets was primarily on account of a decrease in average advances by Rs.170.50 billion and decrease in call and term money lent by Rs. 105.37 billion, offset, in part, by an increasein average interest-earning investments.
Average advances decreased by 8.5% from Rs. 2,007.84 billion in the six months ended September 30,2009 to Rs. 1,837.04 billion in the six months ended September 30, 2010, mainly due to a decrease in retailadvances. Retail advances (excluding net retail portfolio of the Bank of Rajasthan and dealer financing anddeveloper financing) decreased by 17.2% from Rs. 836.70 billion at September 30, 2009 to Rs. 692.81 billionat September 30, 2010. The decrease in retail advances was due to a moderation in new retail loandisbursements and contractual repayments and prepayments on the existing portfolio. In US dollar terms, thenet advances of overseas branches increased marginally by 1.9% from US$ 10.6 billion at September 30, 2009to US$ 10.8 billion at September 30, 2010. In rupee terms, the net advances of overseas branches decreasedby 4.2% from Rs. 507.80 billion at September 30, 2009 to Rs. 486.66 billion at September 30, 2010, mainlydue to the impact of rupee appreciation.
Average interest-earning investments increased by 18.6% from Rs. 991.86 billion in the six monthsended September 30, 2009 to Rs. 1,176.34 billion in the six months ended September 30, 2010. Averageinterest-earning investments in government and other approved securities increased from Rs. 708.60 billion inthe six months ended September 30, 2009 to Rs. 769.02 billion in the six months ended September 30, 2010.Average investments in government and other approved securities increased due to a increase of 100 basispoints in the statutory liquidity ratio requirement from 24.0% to 25.0% in October 2009 and an increase indomestic net demand and time liabilities from Rs. 2,257.62 billion at end-September 2009 to Rs. 2,434.05billion at end-September 2010. Average interest-earning investments, other than investments in governmentand other approved securities, increased by 43.8% from Rs. 283.26 billion in the six months ended September30, 2009 to Rs. 407.32 billion in the six months ended September 30, 2010. Average interest-earninginvestments, other than government securities and other approved securities primarily include the investmentsin corporate bonds, certificates of deposits, commercial paper, Rural Infrastructure Development Funddeposits and investments in liquid mutual funds to deploy excess liquidity.
See also “Risk Factors—Risks Relating to Our Business—Our banking and trading activities areparticularly vulnerable to interest rate risk and volatility in interest rates could adversely affect our net interestmargin, the value of our fixed income portfolio, our income from treasury operations, the quality of our loanportfolio and our financial performance”.
48

Non-Interest Income
The following table sets forth, for the periods indicated, the principal components of non-interestincome.
Six months ended September 30,
2009 2010 2010
2010/2009
% change
(in millions, except percentages)
Commission, exchange and brokerage............ Rs. 23,170.0 Rs. 26,040.9 US$ 584 12.4%Profit/(loss) on treasury-related activities
(net)(1) ......................................................... 12,631.0 3,517.8 79 (72.1)%Profit/(loss) on sale of land, buildings and
other assets (net) ......................................... 525.0 445.0 10 (15.2)%Miscellaneous income (including lease
income) ....................................................... 2,810.7 2,580.7 58 (8.2)%
Total non-interest income ............................... Rs. 39,136.7 Rs. 32,584.4 US$ 731 (16.7)%
(1) Includes profit/(loss) on the sale/revaluation of investments and foreign exchange transactions.
Non-interest income primarily includes fee and commission income, income from treasury-relatedactivities and other miscellaneous income (including lease income). This analysis of non-interest incomeshould be read against the backdrop of global and Indian economic developments, financial market activities,the competitive environment, client activity levels and our strategy, as detailed in earlier sections.
Non-interest income decreased by 16.7% from Rs. 39.14 billion in the six months ended September 30,2009 to Rs. 32.58 billion in the six months ended September 30, 2010. The decrease in non-interest incomewas primarily due to a decrease in income from treasury-related activities and miscellaneous income(including lease income) partly offset by an increase in commission, exchange and brokerage income.
Commission, exchange and brokerage
Commission, exchange and brokerage income mainly includes loan processing and transaction bankingfees from corporate and retail clients, credit card fees, appraisal and syndication fees from corporate clientsand fees from the distribution of third-party retail products. Commission, exchange and brokerage incomeincreased by 12.4% from Rs. 23.17 billion in the six months ended September 30, 2009 to Rs. 26.04 billionin the six months ended September 30, 2010. Credit demand from the corporate sector increased due toeconomic recovery resulting in an increase in loan processing fees and transaction banking-related fees fromcorporate clients. The increase in corporate fee income was partly offset by lower retail loan origination andcredit card business volumes resulting in lower fee income from these products. The fee income from thecredit card portfolio decreased from Rs. 3.89 billion in the six months ended September 30, 2009 to Rs. 2.66billion in the six months ended September 30, 2010.
Profit/(loss) on treasury-related activities (net)
Income from treasury-related activities includes income from sale of investments and the revaluation ofinvestments on account of changes in unrealized profit/(loss) in the fixed income, equity and preference shareportfolio, units of venture capital and private equity funds, and security receipts issued by asset reconstructioncompanies. It also includes income from foreign exchange transactions, consisting of various foreign exchangeand derivatives transactions, including options and swaps with clients for hedging purposes and on creditderivative instruments including credit default swaps, credit-linked notes and collateralized debt obligations.Profit from treasury-related activities decreased by 72.1% from Rs. 12.63 billion in the six months endedSeptember 30, 2009 to Rs. 3.52 billion in the six months ended September 30, 2010. The decrease intreasury-related income in the six months ended September 30, 2010 was primarily due to mark-to-market andrealized losses on our government and other domestic fixed income securities portfolio and an absence ofreversal of mark-to-market provisions on our credit derivatives portfolio. This was partly offset by higherprofits from our equity portfolio and lower provisions on our investment in security receipts issued by assetreconstruction companies.
49

Our fixed income portfolio generally benefits from declining interest rates. We took advantage of thedecline in yields on government securities in the initial months of fiscal 2010 to realize gains from our fixedincome portfolio. However, concerns over the fiscal deficit together with the Reserve Bank of India’s gradualexit from expansionary monetary policy and inflationary pressures led to the tightening of interest rates duringfiscal 2010. The yield on ten-year government of India securities, after declining in the initial months of fiscal2010, increased by 82 basis points from 7.01% at March 31, 2009 to 7.83% at March 31, 2010. The yieldsremained at elevated levels during the six months ended September 30, 2010, ending at 7.84% at September31, 2010. The yield on short-term government of India securities, such as two year securities increased by 74basis points during the six months ended September 30, 2010. This resulted in mark-to-market and realizedlosses of Rs. 1.68 billion in the six months ended September 30, 2010 on our domestic government and otherfixed income portfolio compared to a gain of Rs. 6.43 billion in the six months ended September 30, 2009.
Our income from foreign exchange transactions and from margins on derivatives transactions withclients decreased marginally from Rs. 3.69 billion in the six months ended September 30, 2009 to Rs. 3.43billion in the six months ended September 30, 2010.
The BSE SENSEX increased by 13.4% during the six months ended September 30, 2010. As a result,we made a profit of Rs. 1.89 billion from our equity portfolio during the six months ended September 30, 2010compared to Rs. 0.21 billion in the six months ended September 30, 2009.
We deal in credit derivatives instruments including credit default swaps, credit-linked notes andcollateralized debt obligations. These include both funded and non-funded instruments. The notional principalamount of funded instruments at September 30, 2010 was Rs. 12.71 billion compared to Rs. 17.46 billion atSeptember 30, 2009. The notional principal amount of non-funded instruments at September 30, 2010 was Rs.32.35 billion compared to Rs. 36.62 billion at September 30, 2009. During the six months ended September30, 2009, the decrease in credit spreads due to improved global market conditions had resulted in reversal ofmark-to-market provisions and realized gains of Rs. 3.89 billion. There was a marginal mark-to-market lossof Rs. 0.06 billion on this portfolio in the six months ended September 30, 2010 due to an increase in spreads.
At September 30, 2010, we had an outstanding net investment of Rs. 30.95 billion in security receiptsissued by asset reconstruction companies in relation to the sale of non-performing assets. In accordance withthe Reserve Bank of India guidelines on “Prudential norms for classification, valuation and operation ofinvestment portfolio by banks”, all instruments received by banks, whether as consideration for transferrednon-performing assets or otherwise, are classified securities. The Reserve Bank of India guidelines on thevaluation and classification of securities apply to these security receipts as well. At the end of each reportingperiod, security receipts issued by asset reconstruction companies are valued in accordance with the guidelinesapplicable to such instruments, as prescribed by the Reserve Bank of India from time to time. Accordingly,in cases where the cash flows from security receipts issued by asset reconstruction companies are limited tothe actual realization of the financial assets assigned to the instruments in the concerned scheme, we considerthe net asset value obtained from the asset reconstruction company from time to time, for the valuation of suchinvestments at each reporting period end and record the mark-to-market adjustment on this basis as part of ourincome from treasury activities. During the six months ended September 30, 2010, the mark-to-market loss onthis account decreased to Rs. 0.57 billion from Rs. 1.74 billion in the six months ended September 30, 2009.
We offer various derivatives products, including options and swaps, to our clients primarily for their riskmanagement purposes. We generally do not carry market risk on client derivatives positions as we coverourselves in the inter-bank market. Profits or losses on account of currency movements on these transactionsare borne by the clients. During fiscal 2009, due to high exchange rate volatility as a result of the financialcrisis, a number of clients experienced significant mark-to-market losses in derivatives transactions. Onmaturity or premature termination of the derivatives contracts, these mark-to-market losses becamereceivables owed to us. Some clients did not pay their derivatives contract obligations to us in a timely mannerand, in some instances, clients filed lawsuits to avoid payment of derivatives contract obligations entirely. Inother instances, at the request of clients, we converted overdue amounts owed to us into loans and advances.In October 2008, the Reserve Bank of India issued guidelines requiring banks to classify derivatives contractreceivables overdue for 90 days or more as non-performing assets. Pursuant to these guidelines, we reversederivatives contract receivables in our income statement when they are overdue for 90 days or more. Afterreversal, any recovery is accounted for only on actual receipt of payment. We pursue a variety of recoverystrategies to collect receivables owed in connection with derivatives contracts. These strategies include, amongother approaches, set-offs against any other payables to the same client, negotiated settlements, rescheduling
50

of obligations, the exercise of rights against collateral (if available) and legal redress. In the six months endedSeptember 30, 2010, we reversed an amount equal to Rs. 0.06 billion relating to receivables under derivativescontracts that were overdue for more than 90 days, compared to Rs. 0.09 billion in the six months endedSeptember 30, 2009.
Miscellaneous income (including lease income and dividend income from subsidiaries)
Miscellaneous income decreased from Rs. 2.81 billion in the six months ended September 30, 2009 toRs. 2.58 billion in the six months ended September 30, 2010. Lease income decreased by 42.1% from Rs. 1.07billion in the six months ended September 30 2009 to Rs. 0.62 billion in the six months ended September 30,2010, primarily due to a reduction in leased assets. Dividend income from subsidiaries increased by 32.3%from Rs. 1.55 billion in the six months ended September 30, 2009 to Rs. 2.05 billion in the six months endedSeptember 30, 2010.
Non-Interest Expense
The following table sets forth, for the periods indicated, the principal components of non-interestexpense.
Six months ended September 30,
2009 2010 2010
2010/2009
% change
(in millions, except percentages)
Payments to and provisions for employees .... Rs. 9,160.7 Rs. 11,998.5 US$ 269 31.0%Depreciation on own property ........................ 2,547.4 2,344.4 53 (8.0)%Other administrative expenses ........................ 16,532.5 14,918.8 335 (9.8)%
Operating expenses ......................................... 28,240.6 29,261.7 657 3.6%Direct marketing agency expenses ................. 484.0 712.9 16 47.3%Depreciation on leased assets ......................... 980.9 564.0 13 (42.5)%
Total non-interest expenses............................. Rs. 29,705.5 Rs. 30,538.6 US$ 686 2.8%
Non-interest expenses primarily include payment to and provision for employees, direct marketingagency expenses and other administrative expenses. In the six months ended September 30, 2010, non-interestexpenses increased by 2.8% from Rs. 29.71 billion in the six months ended September 30, 2009 to Rs. 30.54billion in the six months ended September 30, 2010 primarily due to an increase in payments to and provisionsfor employees partly offset by a decrease in other administrative expenses and a decrease in depreciation onleased assets.
Payments to and provisions for employees
Employee expenses increased by 31.0% from Rs. 9.16 billion in the six months ended September 30,2009 to Rs. 12.00 billion in the six months ended September 30, 2010. Employee expenses increased primarilydue to an annual increase in salaries and provision for payment of performance-linked bonus and retention payduring the period and increase in the employee base from 47,138 employees at September 30, 2009 to 53,697employees at September 30, 2010 (including 3,936 employees of the Bank of Rajasthan at August 12, 2010).
Depreciation
Depreciation on owned property decreased by 8.0% from Rs. 2.55 billion in six months ended September30, 2009 to Rs. 2.34 billion in six months ended September 30, 2010 primarily due to sale of assets ofmerchant acquiring business and other properties. Depreciation on leased assets decreased from Rs. 0.98billion in the six months ended September 30, 2009 to Rs. 0.56 billion in the six months ended September 30,2010 due to a reduction in leased assets.
51

Other administrative expenses
Other administrative expenses primarily include rent, taxes and lighting, advertisement and publicity,repairs and maintenance and other expenditure. Other operating expenses decreased by 9.8% from Rs. 16.53billion in the six months ended September 30, 2009 to Rs. 14.92 billion in the six months ended September30, 2010. The decrease in other operating expenses was primarily due to our overall cost reduction initiatives.There was a reduction in retail business expenses and expenses on account of postage and communicationexpenses in the six months ended September 30, 2010 which was partly offset by an increase in rent, taxesand lighting and repairs and maintenance expenses due to an increase in our branch and ATM network. Thenumber of branches (excluding foreign branches and offshore banking units) increased from 1,509 branchesat September 30, 2009 to 2,501 branches and extension counters at September 30, 2010. We also increased ourATM network from 4,883 ATMs at September 30, 2009 to 5,722 ATMs at September 30, 2010. These figuresinclude 457 deposit taking branches and 131 ATMs of the Bank of Rajasthan.
Direct marketing agency expenses
Direct marketing agency expenses increased from Rs. 0.48 billion in the six months ended September30, 2009 to Rs. 0.71 billion in the six months ended September 30, 2010. The decrease in direct marketingexpenses was primarily due to higher retail loan disbursements. We use marketing agents, called directmarketing agents or associates, for sourcing our retail assets. We include commissions paid to these directmarketing agents in non-interest expense. In line with the Reserve Bank of India guidelines, thesecommissions are expensed up front and not amortized over the life of the loan.
Provisions for Restructured Loans and Non-performing Assets
We classify our loans and credit substitutes in accordance with the Reserve Bank of India guidelines intoperforming and non-performing assets. Further, non-performing assets are classified into substandard,doubtful and loss assets based on the criteria stipulated by the Reserve Bank of India. The Reserve Bank ofIndia has separate guidelines for restructured loans. A fully secured standard loan can be restructured byrescheduling principal repayments and/or the interest element, but must be separately disclosed as arestructured loan in the year of restructuring. Similar guidelines apply to restructuring of sub-standard anddoubtful loans. See also “Business—Classification of loans”.
The following table sets forth, at the dates indicated, certain information regarding restructured loans.
At September 30,
2009 2010 2010
2010/2009
% change
(in millions, except percentages)
Gross restructured loans............................. Rs. 50,960.5 Rs. 27,208.7 US$ 611 (46.6)%Provisions for restructured loans................ (2,390.5) (1,433.1) (32) —
Net restructured loans ................................ Rs. 48,570.0 Rs. 25,775.6 US$ 579 (46.9)%
Gross customer assets ................................ Rs. 2,129,533.2 Rs. 2,411,303.3 US$ 54,114 13.2%Net customer assets .................................... 2,077,067.1 2,335,046.5 US$ 52,402 12.4%Gross restructured loans as a percentage
of gross customer assets ......................... 2.4% 1.1%Net restructured loans as a percentage of
net customer assets ................................. 2.3% 1.1%
Gross restructured loans decreased by 46.6% from Rs. 50.96 billion at September 30, 2009 to Rs. 27.21billion at September 30, 2010. Certain borrowers amounting to Rs. 1.03 billion were added to the grossrestructured loans as a result of the amalgamation of the Bank of Rajasthan. After restructuring, based on thesatisfactory performance of the borrower over a specified period of time (a minimum of twelve months), arestructured account is upgraded and removed from this category. During the six months ended September 30,2010, we upgraded certain corporate borrower accounts amounting to Rs. 30.67 billion. As a result, netrestructured loans as a percentage of net customer assets decreased from 2.3% at September 30, 2009 to 1.1%at September 30, 2010.
52

All standard restructured loans must be fully secured by tangible assets. In December 2008, the ReserveBank of India permitted banks to undertake one-time restructuring of loans classified as real estate exposuresand to undertake a second restructuring for accounts that were previously restructured, without downgradingsuch accounts to the non-performing category, up to June 30, 2009. The Reserve Bank of India also permittedbanks to classify all eligible accounts that met the basic criteria for restructuring and which were classifiedas standard at September 1, 2008, as standard accounts irrespective of their subsequent asset classification.This treatment was subject to banks receiving an application from the borrower for restructuring the loan ator before year-end fiscal 2009 and to the implementation of the restructuring package within 120 days fromthe date of receipt of the application. During fiscal 2010, we had restructured loans aggregating Rs. 53.08billion, including eight borrower accounts restructured for a second time up to June 30, 2009 aggregating Rs.24.28 billion.
The following table sets forth, at the dates indicated, certain information regarding non-performingassets.
At September 30,
2009 2010 2010
2010/2009
% change
(in millions, except percentages)
Gross non-performing assets ...................... Rs. 93,453.6 Rs102,329.2 US$ 2,296 9.5%Provisions for non-performing assets......... (47,873.5) (70,412.5) US$ (1,580) 47.1%
Net non-performing assets ......................... Rs. 45,580.1 Rs. 31,916.7 US$ 716 (30.0)%
Gross customer assets ................................ Rs. 2,129,533.2 Rs. 2,411,303.3 US$ 54,114 13.2%Net customer assets .................................... 2,077,067.1 2,335,046.5 52,402 12.4%Gross non-performing assets as a
percentage of gross customer assets....... 4.4% 4.2%Net non-performing assets as a percentage
of net customer assets ............................ 2.2% 1.4%
Gross non-performing assets increased by 9.5% from Rs. 93.45 billion at September 30, 2009 to Rs.102.33 billion at September 30, 2010. The increase in gross non-performing assets outstanding at September30, 2010 is after taking into consideration additions to gross non-performing assets of Rs. 3.92 billion arisingout of the amalgamation of the Bank of Rajasthan. While there was an increase in gross non-performing assets,the net non-performing assets decreased from Rs. 45.58 billion at September 30, 2009 to Rs. 31.92 billion atSeptember 30, 2010. The decrease in accretion to retail non-performing assets combined with the increasedprovision on the existing non-performing assets contributed to the decline in the net non-performing assetsratio during this period. As a percentage of net customer assets, net non-performing assets decreased from2.2% at September 30, 2009 to 1.4% at September 30, 2010. The net non-performing loans in the retailportfolio decreased from 3.5% of net retail loans at September 30, 2009 to 2.1% of net retail loans atSeptember 30, 2010.
We sold Rs. 7.6 billion of net non performing assets, including Rs. 7.5 billion of mortgage loans, to assetreconstruction companies in fiscal 2010. We also sold net non-performing assets of Rs. 479 million tocompanies, other than asset reconstruction companies in fiscal 2010. We have not sold non performing assetsto asset reconstruction companies during the six months ended September 30, 2010. See also“Business—Classification of Loans—Non-Performing Asset Strategy”.
53

The following table sets forth, for the periods indicated, the composition of provisions andcontingencies, excluding provisions for tax.
Six months ended September 30,
2009 2010 2010
2010/2009
% change
(in millions, except percentages)
Provision for investments (including creditsubstitutes) (net).......................................... Rs. (388.4) Rs. 359.7 US$ 8 —
Provision for non-performing assets............... 24,075.4 13,605.9 305 (43.5)%Provision for standard assets .......................... — — — —Others.............................................................. 262.5 424.0 10 61.5%
Total provisions and contingencies(excluding tax) ............................................ Rs. 23,949.5 Rs. 14,389.6 US$ 323 (39.9)%
We make provisions on standard, substandard and doubtful assets at rates prescribed by the ReserveBank of India. Loss assets and unsecured portions of doubtful assets are provided/written off to the extentrequired by Reserve Bank of India guidelines. Subject to the minimum provisioning levels prescribed by theReserve Bank of India, provisions on retail non-performing loans are made at the borrower level in accordancewith our provisioning policy. The specific provisions on retail loans held by us are higher than the minimumregulatory requirement. See also “Business—Loan portfolio—Classification of loans”.
Provisions and contingencies (excluding provisions for tax) decreased by 39.9% from Rs. 23.95 billionin the six months ended September 30, 2009 to Rs. 14.39 billion in the six months ended September 30, 2010,primarily due to a lower level of specific provisioning for retail non-performing loans. The decrease in specificprovisioning for retail non-performing loans primarily reflects the sharp reduction in accretion to retailnon-performing loans during the six months ended September 30, 2010.
In the second quarter review of monetary policy for fiscal 2010, the Reserve Bank of India directedbanks to ensure that their total provisioning coverage ratio against non-performing loans is not less than 70.0%by end-September 2010. On December 1, 2009, the Reserve Bank of India issued detailed guidelines onprovisioning coverage for advances by banks. In March 2010, the Reserve Bank of India permitted us to reachthe stipulated provisioning coverage ratio of 70.0% in a phased manner by March 31, 2011. ICICI Bank’sprovisioning coverage ratio at September 30, 2010 computed as per the Reserve Bank of India guidelines was69.0%.
During the six months ended September 30, 2010, we did not make additional general provisions onstandard assets. In November 2009, the Reserve Bank of India issued guidelines reducing the generalprovision requirement. However, these guidelines did not permit a write-back of excess provisions alreadymade and we therefore held a cumulative general provision of Rs. 14.80 billion (including cumulative generalprovision of Rs. 0.44 billion held by the Bank of Rajasthan) at September 30, 2010 compared to the generalprovision requirement as per the revised guidelines of Rs. 8.55 billion.
Tax Expense
The income tax expense (including wealth tax) increased by 7.4% from Rs. 6.51 billion in the six monthsended September 30, 2009 to Rs. 6.99 billion in the six months ended September 30, 2010. The effective taxrate of 23.6% in the six months ended September 30, 2010 was lower compared to the effective tax rate of25.3% in the six months ended September 30, 2009. The decrease in the effective tax rate was due to thechange in mix of estimated income and tax benefits resulting from the amalgamation of the Bank of Rajasthan.
54

Financial Condition
Assets
The following table sets forth, at the dates indicated, the principal components of assets.
At September 30,
2009 2010 2010
2010/2009
% change
(in millions, except percentages)
Cash and cash equivalents ..................... Rs. 292,666.4 Rs. 348,478.1 US$ 7,821 19.1%Investments ............................................ 1,199,648.2 1,362,755.1 30,582 13.6%Advances (net of provisions)................. 1,908,601.8 1,942,007.2 43,582 1.8%Fixed assets............................................ 35,515.7 47,808.3 1,073 34.6%Other assets............................................ 227,309.3 198,931.3 4,464 (12.5)%
Total assets............................................ Rs. 3,663,741.4 Rs. 3,899,980.0 US$ 87,523 6.4%
Our total assets increased by 6.4% from Rs. 3,663.74 billion at September 30, 2009 to Rs. 3,899.98billion at September 30, 2010 (including Rs. 155.96 billion of total assets of the Bank of Rajasthan at August12, 2010), primarily due to an increase in investments and cash and cash equivalents.
Cash and cash equivalents
Cash and cash equivalents include cash in hand, balances with the Reserve Bank of India and otherbanks, including money at call and on short notice. Cash and cash equivalents increased by 19.1% from Rs.292.67 billion at September 30, 2009 to Rs. 348.48 billion at September 30, 2010. Balances with the ReserveBank of India increased from Rs. 173.06 billion at September 30, 2009 to Rs. 197.97 billion at September 30,2010 on account of the 100 basis points increase in the cash reserve ratio.
Investments
Total investments increased by 13.6% from Rs. 1,199.65 billion at September 30, 2009 to Rs. 1,362.76billion at September 30, 2010 primarily due to an increase in investments in commercial paper and certificatesof deposit by Rs. 84.75 billion, corporate bonds and debentures by Rs. 80.32 billion and Rural InfrastructureDevelopment Fund deposits to compensate for directed lending requirements by Rs. 68.01 billion. Investmentsinclude Rs. 70.96 billion of investments of the Bank of Rajasthan at August 12, 2010. The investment inpass-through certificates decreased by Rs. 9.29 billion at September 30, 2010 compared to September 30,2009. At September 30, 2010, we had an outstanding net investment of Rs. 30.95 billion in security receiptsissued by asset reconstruction companies in relation to sales of non-performing assets compared to Rs. 37.26billion at September 30, 2009.
Advances
Net advances increased by 1.8% from Rs. 1,908.60 billion at September 30, 2009 to Rs. 1,942.01 billionat September 30, 2010, primarily due to an increase in domestic corporate advances and inclusion of Rs. 65.28billion of advances of the Bank of Rajasthan at August 12, 2010. Net retail advances (excluding net retailadvances of the Bank of Rajasthan and including dealer financing and developer financing) decreased by10.7% from Rs. 864.11 billion at September 30, 2009 to Rs. 771.41 billion at September 30, 2010. Advancesof our overseas branches decreased primarily due to the impact of rupee appreciation on foreign currencydenominated advances. Net advances of overseas branches (including our offshore banking unit) increased inUS dollar terms by 1.9% from US$ 10.6 billion at September 30, 2009 to US$ 10.8 billion at September 30,2010. In rupee terms, net advances of overseas branches (including our offshore banking unit) decreased by4.2% from Rs. 507.80 billion at September 30, 2009 to Rs. 486.66 billion at September 30, 2010.
Fixed and other assets
Fixed assets increased by 34.6% from Rs. 35.52 billion at September 30, 2009 to Rs. 47.81 billion atSeptember 30, 2010. Fixed assets include Rs. 5.15 billion of fixed assets of the Bank of Rajasthan at August12, 2010. The increase in fixed assets was primarily due to an increase in our branch network and other offices.Other assets decreased by 12.5% from Rs. 227.30 billion at September 30, 2009 to Rs. 198.93 billion atSeptember 30, 2010.
55
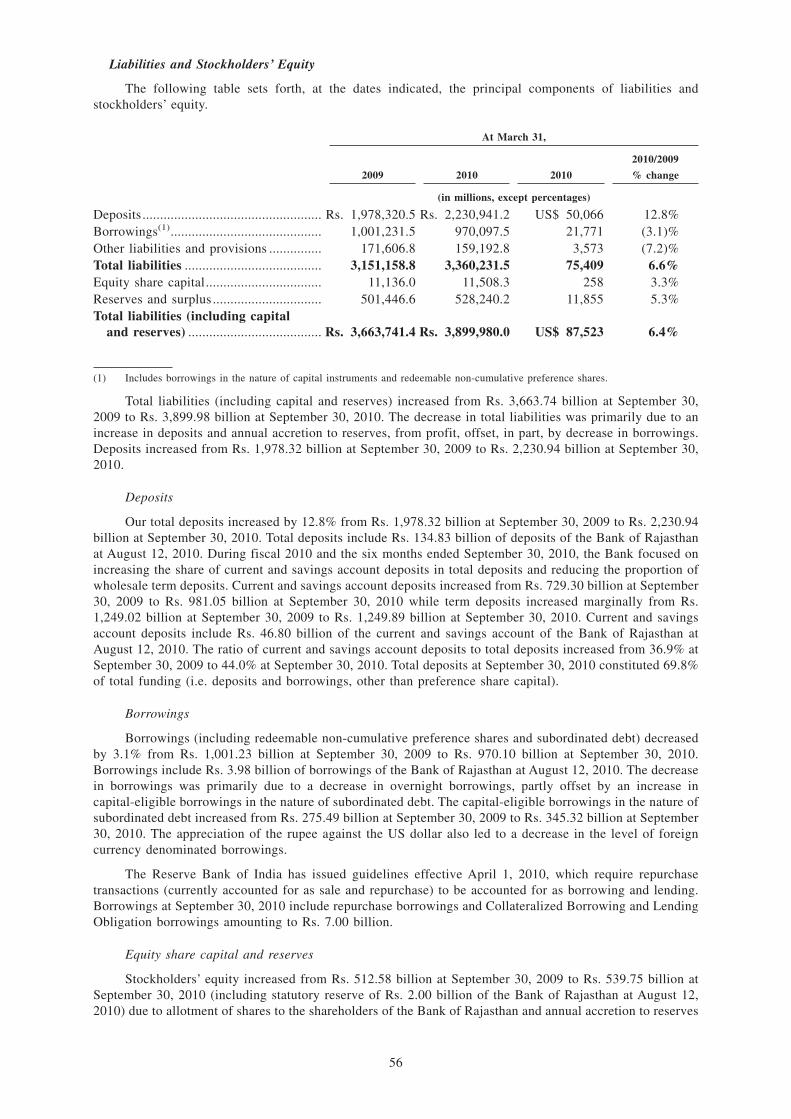
Liabilities and Stockholders’ Equity
The following table sets forth, at the dates indicated, the principal components of liabilities andstockholders’ equity.
At March 31,
2009 2010 2010
2010/2009
% change
(in millions, except percentages)
Deposits ................................................... Rs. 1,978,320.5 Rs. 2,230,941.2 US$ 50,066 12.8%Borrowings(1)........................................... 1,001,231.5 970,097.5 21,771 (3.1)%Other liabilities and provisions ............... 171,606.8 159,192.8 3,573 (7.2)%Total liabilities ....................................... 3,151,158.8 3,360,231.5 75,409 6.6%Equity share capital................................. 11,136.0 11,508.3 258 3.3%Reserves and surplus ............................... 501,446.6 528,240.2 11,855 5.3%Total liabilities (including capital
and reserves) ...................................... Rs. 3,663,741.4 Rs. 3,899,980.0 US$ 87,523 6.4%
(1) Includes borrowings in the nature of capital instruments and redeemable non-cumulative preference shares.
Total liabilities (including capital and reserves) increased from Rs. 3,663.74 billion at September 30,2009 to Rs. 3,899.98 billion at September 30, 2010. The decrease in total liabilities was primarily due to anincrease in deposits and annual accretion to reserves, from profit, offset, in part, by decrease in borrowings.Deposits increased from Rs. 1,978.32 billion at September 30, 2009 to Rs. 2,230.94 billion at September 30,2010.
Deposits
Our total deposits increased by 12.8% from Rs. 1,978.32 billion at September 30, 2009 to Rs. 2,230.94billion at September 30, 2010. Total deposits include Rs. 134.83 billion of deposits of the Bank of Rajasthanat August 12, 2010. During fiscal 2010 and the six months ended September 30, 2010, the Bank focused onincreasing the share of current and savings account deposits in total deposits and reducing the proportion ofwholesale term deposits. Current and savings account deposits increased from Rs. 729.30 billion at September30, 2009 to Rs. 981.05 billion at September 30, 2010 while term deposits increased marginally from Rs.1,249.02 billion at September 30, 2009 to Rs. 1,249.89 billion at September 30, 2010. Current and savingsaccount deposits include Rs. 46.80 billion of the current and savings account of the Bank of Rajasthan atAugust 12, 2010. The ratio of current and savings account deposits to total deposits increased from 36.9% atSeptember 30, 2009 to 44.0% at September 30, 2010. Total deposits at September 30, 2010 constituted 69.8%of total funding (i.e. deposits and borrowings, other than preference share capital).
Borrowings
Borrowings (including redeemable non-cumulative preference shares and subordinated debt) decreasedby 3.1% from Rs. 1,001.23 billion at September 30, 2009 to Rs. 970.10 billion at September 30, 2010.Borrowings include Rs. 3.98 billion of borrowings of the Bank of Rajasthan at August 12, 2010. The decreasein borrowings was primarily due to a decrease in overnight borrowings, partly offset by an increase incapital-eligible borrowings in the nature of subordinated debt. The capital-eligible borrowings in the nature ofsubordinated debt increased from Rs. 275.49 billion at September 30, 2009 to Rs. 345.32 billion at September30, 2010. The appreciation of the rupee against the US dollar also led to a decrease in the level of foreigncurrency denominated borrowings.
The Reserve Bank of India has issued guidelines effective April 1, 2010, which require repurchasetransactions (currently accounted for as sale and repurchase) to be accounted for as borrowing and lending.Borrowings at September 30, 2010 include repurchase borrowings and Collateralized Borrowing and LendingObligation borrowings amounting to Rs. 7.00 billion.
Equity share capital and reserves
Stockholders’ equity increased from Rs. 512.58 billion at September 30, 2009 to Rs. 539.75 billion atSeptember 30, 2010 (including statutory reserve of Rs. 2.00 billion of the Bank of Rajasthan at August 12,2010) due to allotment of shares to the shareholders of the Bank of Rajasthan and annual accretion to reserves
56

from profit. Shareholders’ equity includes statutory reserves of Rs. 2.00 billion of the Bank of Rajasthan atAugust 12, 2010. Excess of paid-up value of equity shares issued over the fair value of the net assets acquiredand amalgamation expenses amounting to Rs. 2.18 billion have been adjusted against share premium.
Off Balance Sheet Items, Commitments and Contingencies
The table below sets forth, for the periods indicated, the principal components of our contingentliabilities.
At March 31, At September 30,
2006 2007 2008 2009 2010 2009 2010 2010
(Rupees in billions) (US$ inmillions,
except pershare data)
Contingent liabilities:Claims against the Bank not
acknowledged as debts ........... Rs. 29.78 Rs39.12 Rs. 40.31 Rs. 32.82 Rs. 33.57 Rs. 32.42 Rs. 31.57 708
Liability for partly paidinvestments ............................ 0.17 0.17 0.13 0.13 0.13 0.13 0.13 3
Liability on account ofoutstanding forward exchangecontracts(1) .............................. 918.31 1,331.56 3,071.71 2,583.67 1,660.69 1,875.35 2,175.48 48,821
Guarantees given on behalf ofconstituents ............................. 191.03 292.12 412.81 580.88 618.36 587.38 705.10 15,824
Acceptances, endorsements &other obligations ..................... 106.87 186.71 250.99 306.78 321.22 310.23 332.50 7,462
Currency swaps(1)......................... 172.42 325.26 477.04 569.65 524.79 601.49 491.52 11,031
Interest rate swaps and currencyoptions(1) ................................. 2,471.92 3,791.14 7,665.29 4,146.35 4,012.14 3,861.42 4,656.32 104,496
Other items for which bank iscontingently liable .................. 59.84 107.74 192.54 126.55 99.94 126.63 75.84 1,702
Total ............................................. Rs. 3,950.34 Rs. 6,073.82 Rs. 12,110.82 Rs. 8,346.83 Rs. 7,270.84 Rs. 7,395.05 Rs. 8,468.46 US$ 190,046
(1) Represents notional principal amount.
Contingent liabilities increased by 14.5% from Rs. 7,395.05 billion at September 30, 2009 to Rs.8,468.46 billion at September 30, 2010, primarily due to an increase in notional amount of interest rate swapsand currency options by 20.6% from Rs. 3,861.42 billion at September 30, 2009 to Rs. 4,656.32 billion atSeptember 30, 2010, an increase in notional principal amount of outstanding forward exchange contracts by16.0% from Rs. 1,875.35 billion at September 30, 2009 to Rs. 2,175.48 billion at September 30, 2010 partlyoffset by a decrease in notional principal amount of currency swaps by 18.3% from Rs. 601.49 billion atSeptember 30, 2009 to Rs. 491.52 billion at September 30, 2010.
We enter into foreign exchange forwards, options, swaps and other derivatives products to enablecustomers to transfer, modify or reduce their foreign exchange and interest rate risks and to manage our owninterest rate and foreign exchange positions. We manage our foreign exchange and interest rate risk withreference to limits set by the Reserve Bank of India and our internal limits. With respect to the transactionsentered into with customers, we generally enter into off-setting transactions in the inter-bank market. Thisresults in the generation of a higher number of outstanding transactions, and hence a large value of grossnotional principal of the portfolio, while the net market risk is low. The significant decrease in volumes ofinterest rate swaps was primarily due to pre-termination of derivative contracts with clients during fiscal 2009on account of volatility in the currency markets. This involved pre-termination of inter-bank swap deals. Therewas also a significant decline in trading volumes of interest rate swaps and currency options on account of thegeneral slowdown in corporate business in the second half of fiscal 2009.
We undertake forex and derivative transactions with our subsidiaries, associates, joint ventures and otherrelated entities. We manage our foreign exchange and interest rate risks arising from these transactionsgenerally by covering the same in the market. During the six months ended September 30, 2010, the net gain
57

on derivative transactions entered into with subsidiaries was Rs. 1,557.1 million compared to a loss of Rs.17,346.2 million during fiscal 2010 and a loss of Rs. 15,424.5 million during the six months ended September30, 2009. There was no net gain/loss on derivative transactions entered into with associates/jointventures/other related entities during the six months ended September 30, 2010 compared to a loss of Rs. 220.9million during fiscal 2010 and no gain/loss during the six months ended September 30, 2009. The materialtransactions for the six months ended September 30, 2010 were gain of Rs. 1,530.7 million (March 31, 2010:loss of Rs. 17,913.1 million, September 30, 2009: loss of Rs. 14,893.4 million) with ICICI Bank Canada, gainof Rs. 312.7 million (March 31, 2010: gain of Rs. 495.2 million, September 30, 2009: loss of Rs. 373.4million) with ICICI Bank UK PLC, loss of Rs. 56.2 million (March 31, 2010: gain of Rs. 215.8 million,September 30, 2009: gain of Rs. 77.1 million) with ICICI Home Finance Company Limited, gain of Rs. 14.9million (March 31, 2010: loss of Rs. 50.7 million, September 30, 2009: loss of Rs. 18.6 million) with ICICISecurities Primary Dealership Limited and loss of Rs. 245.0 million (March 31, 2010: loss of Rs. 93.4 million,September 30, 2009: loss of Rs. 216.3 million) with ICICI Bank Eurasia Limited Liability Company.
The above amounts of net gain/loss on derivative transactions with subsidiaries, associates, jointventures and other related entities do not include the revaluation impact of the related matured transactions,i.e., the nostro revaluation gains/losses during the period of the near leg of foreign currency swaps, whichmatured in the earlier period of the financial year/s. The gain/loss on forex and derivative transactionsincluding the revaluation impact of the related matured transactions for the half year ended September 30,2010 is reported in the disclosures of related party transactions in the notes to accounts to the financialstatements, under the heading “Other Income”.
An interest rate swap does not entail the exchange of notional principal and the cash flow arises becauseof the difference between the interest rate pay and receive portions of the swap, which is generally much lowerthan the notional principal of the swap. A large proportion of interest rate swaps, currency swaps and forwardexchange contracts are on account of market making, which involves providing regular two-way prices tocustomers or inter-bank counter-parties. This results in the generation of a higher number of outstandingtransactions, and hence large value of gross notional principal of the portfolio. For example, if a transactionentered into with a customer is covered by an exactly opposite transaction entered into with anothercounterparty, the net market risk of the two transactions will be zero whereas, the notional principal amountof the portfolio will be the sum of both transactions. We also deal in credit derivatives instruments includingcredit default swaps, credit linked notes, collateralized debt obligations and principal protected structures.
Claims against us not acknowledged as debts represent demands made by the government of India’s taxauthorities in excess of the provisions made in our accounts, in respect of income tax, interest tax, wealth taxand sales tax matters. Other items for which we are contingently liable include primarily the securitization,credit derivatives and repurchase obligations.
Capital Commitments
We are obligated under a number of capital contracts, which have been committed. The estimatedamounts of contracts remaining to be executed on capital projects in domestic operations aggregated to Rs.4.38 billion at September 30, 2010 compared to Rs. 5.03 billion at September 30, 2009. The contractsremaining to be executed were primarily with regard to new branches and office premises.
Guarantees
As a part of our project financing and commercial banking activities, we have issued guarantees toenhance the credit standing of our customers. These generally represent irrevocable assurances that we willmake payments in the event that the customer fails to fulfill its financial or performance obligations. Financialguarantees are obligations to pay a third party beneficiary where a customer fails to make payment towardsa specified financial obligation. Performance guarantees are obligations to pay a third party beneficiary wherea customer fails to perform a non-financial contractual obligation. The guarantees are generally for a periodnot exceeding ten years. The credit risks associated with these products, as well as the operating risks, aresimilar to those relating to other types of financial instruments. In majority of the cases, we have collateralavailable to reimburse potential losses on the guarantees. Margins available to reimburse losses realized underguarantees amounted to Rs. 17.50 billion at September 30, 2010 compared to Rs. 12.39 billion at September30, 2009. Other property or security may also be available to us to cover losses under guarantees.
58

The table below sets forth, for the periods indicated, the principal components of our guarantees.
At September 30,
2009 2010 2010
(Rupees in billions) (US$ in billions)
Financial guarantees ................................................................ Rs. 145.05 Rs. 168.17 US$ 3.8Performance guarantees ........................................................... 414.84 536.94 12.0
Total guarantees ..................................................................... Rs. 559.89 Rs. 705.11 US$ 15.8
At September 30, 2010, total guarantees amounted to Rs. 705.11 billion comprising Rs. 168.17 billionof financial guarantees and Rs. 536.94 billion of performance guarantees.
Capital Resources
We actively manage our capital to meet regulatory norms and current and future business needsconsidering the risks in its businesses, expectations of rating agencies, shareholders and investors, and theavailable options of raising capital. Our capital management framework is administered by the Finance Groupand the Global Risk Management Group under the supervision of the Board and the Risk Committee. Thecapital adequacy position and assessment is reported to the Board and the Risk Committee periodically.
Regulatory capital
We are subject to the capital adequacy norms stipulated by the Reserve Bank of India guidelines on BaselII, effective from year-end fiscal 2008. Prior to year-end fiscal 2008, we were subject to the capital adequacynorms as stipulated by the Reserve Bank of India guidelines on Basel I. The Reserve Bank of India guidelineson Basel II require us to maintain a minimum ratio of total capital to risk weighted assets of 9.0%, with aminimum tier I capital adequacy ratio of 6.0%. The total capital adequacy ratio of the Bank at the stand-alonelevel at September 30, 2010 as per the Reserve Bank of India guidelines on Basel II was 20.2% with a tierI capital adequacy ratio of 13.8%.
Under Pillar 1 of the Reserve Bank of India guidelines on Basel II, the Bank follows the standardizedapproach for measurement of credit and market risks and basic indicator approach for measurement ofoperational risk.
At September 30, 2010, we were required to maintain capital adequacy based on the higher of theminimum capital required under Basel II or at 80.0% of the minimum capital required under Basel I. Thecomputation under Basel II guidelines results in a higher minimum capital requirement as compared to BaselI, and hence the capital adequacy at September 30, 2010 has been maintained and reported by the Bank as perBasel II guidelines.
The following table sets forth, at the dates indicated, risk-based capital, risk-weighted assets andrisk-based capital adequacy ratios computed in accordance with the Reserve Bank of India guidelines on BaselI and Basel II and based on ICICI Bank’s unconsolidated financial statements prepared in accordance withIndian GAAP.
As per the Reserve Bank of India guidelines on Basel I
September 30,
2009
September 30,
2010
September 30,
2010
(Rs. in millions, except percentages) (US$ in millions)
Tier-I capital........................................................................ 437,821.1 454,518.3 10,200Tier-II capital ...................................................................... 148,076.2 221,023.5 4,960
Total capital ....................................................................... 585,897.3 675,541.8 15,160
Credit Risk — Risk Weighted Assets (RWA) ..................... 2,924,133.4 3,060,849.2 68,690Market Risk — RWA.......................................................... 330,622.9 454,862.1 10,208Operational Risk — RWA................................................... — — —
Total RWA.......................................................................... 3,254,756.3 3,515,711.3 78,898
Tier-I capital adequacy ratio ............................................... 13.45% 12.93%Tier-II capital adequacy ratio .............................................. 4.55% 6.28%Total capital adequacy ratio ................................................ 18.00% 19.21%
59

As per the Reserve Bank of India guidelines on Basel II
September 30,
2009
September 30,
2010
September 30,
2010
(Rs. in millions, except percentages) (US$ in millions)
Tier-I capital........................................................................ 431,416.9 436,547.1 9,797Tier-II capital ...................................................................... 141,672.0 204,021.2 4,578
Total capital ....................................................................... 573,088.9 640,568.3 14,375
Credit Risk — Risk Weighted Assets (RWA) ..................... 2,744,621.7 2,651,690.9 59,508Market Risk — RWA.......................................................... 260,540.1 265,443.7 5,957Operational Risk — RWA................................................... 235,160.1 249,669.1 5,603
Total RWA.......................................................................... 3,240,321.9 3,166,803.7 71,068
Tier-I capital adequacy ratio ............................................... 13.32% 13.79%Tier-II capital adequacy ratio .............................................. 4.37% 6.44%Total capital adequacy ratio ................................................ 17.69% 20.23%
The following key changes were introduced by the Reserve Bank of India under Pillar 1 of the Basel IIguidelines during fiscal 2010 and the six months ended September 30, 2010:
• The Reserve Bank of India issued a clarification on July 1, 2009 that the special reserve (createdby banks under Section 36(1) (viii) of the Income Tax Act, 1961) should be included, net of taxpayable, in the tier I capital.
• The Reserve Bank of India in its revised Basel II guidelines issued on February 8, 2010 stipulatedthat banks are not permitted to use any external credit assessment for risk weighting securitizationexposures where the assessment is at least partly based on unfunded support provided by the bank.
• The Reserve Bank of India in its revised Basel II guidelines issued on February 8, 2010, also issuedguidance on the assessment of valuation adjustments on account of illiquidity for lessliquid/illiquid positions that is subject to market risk capital requirements. The Reserve Bank ofIndia also stipulated that these valuation adjustments are to be deducted from tier I capital. ICICIBank applied this guidance in its computation of its capital adequacy position at year-end fiscal2010. In May 2010, Reserve Bank of India issued a clarification deferring of the application of thisguidance to a future date, pending the finalization of a standardized methodology for computingthe valuation adjustments for less liquid/illiquid positions, to be formulated by a working group ofthe Reserve Bank of India.
Movement in ICICI Bank’s capital funds and risk weighted assets from March 31, 2010 to September 30,2010 (as per the Reserve Bank of India guidelines on Basel II)
During the six months ended September 30, 2010, capital funds increased by Rs. 69.54 billion primarilydue to profit after tax earned for the period of Rs. 22.62 billion, the issuance of lower Tier II debt capital ofRs. 39.79 billion, reduction in deduction on account of securitization exposures of Rs. 12.84 billion offset, inpart, by an increase in deduction on account of deferred tax assets of Rs. 3.94 billion.
Credit risk risk-weighted assets increased by Rs. 166.11 billion from Rs. 2,485.58 billion at March 31,2010 to Rs. 2,651.69 billion at September 30, 2010 primarily due to an increase of Rs. 84.76 billion in riskweighted assets on loans and advances, increase of Rs. 42.96 billion in risk-weighted assets for non-fund basedtrade finance facilities and an increase of Rs. 14.10 billion in risk-weighted assets for undrawn commitments.
Market risk risk-weighted assets increased by Rs. 44.38 billion from Rs. 221.06 billion at March 31,2010 to Rs. 265.44 billion at September 30, 2010. The general market risk risk-weighted assets for interest ratepositions increased by Rs. 36.63 billion (a capital charge of Rs. 3.30 billion).
60

Risk weighted assets on account of operational risk increased by Rs. 14.51 billion due to the increasein the average of previous three years’ gross income which is the basis for computation as per the basicindicator approach.
Internal assessment of capital
Our capital management framework includes a comprehensive internal capital adequacy assessmentprocess conducted annually, which determines the adequate level of capitalization necessary to meetregulatory norms and current and future business needs, including under stress scenarios. The internal capitaladequacy assessment process is formulated at both the stand-alone bank level and the consolidated group level.The process encompasses capital planning for a certain time horizon, identification and measurement ofmaterial risks and the relationship between risk and capital.
The capital management framework is complemented by its risk management framework, whichincludes a comprehensive assessment of all material risks. Stress testing, which is a key aspect of the capitalassessment process and the risk management framework, provides an insight into the impact of extreme butplausible scenarios on the risk profile and capital position. Based on our Board-approved stress testingframework, we conduct stress tests on our various portfolios and assess the impact on our capital ratios andthe adequacy of our capital buffers for current and future periods. We periodically assess and refine our stresstests in an effort to ensure that the stress scenarios capture material risks as well as reflect possible extrememarket moves that could arise as a result of market conditions. Internal capital adequacy assessment processat the consolidated level integrates the business and capital plans, and the stress testing results of the groupentities.
Based on the internal capital adequacy assessment process, we determine our capital needs and theoptimum level of capital by considering the following in an integrated manner:
• strategic focus, business plan and growth objectives;
• regulatory capital requirements as per Reserve Bank of India guidelines;
• assessment of material risks and impact of stress testing;
• perception of credit rating agencies, shareholders and investors;
• future strategy with regard to investments or divestments in subsidiaries; and
• evaluation of options to raise capital from domestic and overseas markets, as permitted by ReserveBank of India from time to time.
We formulate our internal capital level targets based on the internal capital adequacy assessment processand endeavor to maintain the capital adequacy level in accordance with the targeted levels at all times.
Impending regulatory developments associated with capital adequacy
Basel III proposals
In order to strengthen the resilience of the banking sector to potential future shocks, together withensuring adequate liquidity in the banking system, the Basel Committee on Banking Supervision issuedconsultative documents on capital and liquidity (popularly known as “Basel III” proposals) on December 17,2009. Subsequent amendments to and guidance regarding these proposals were issued in July 2010, August2010 and September 2010. The Basel III proposals seek to increase capital requirements for the bankingsystem and introduce internationally harmonized global liquidity standards. Some aspects of the proposalscontinue to be at the stage of consultation. The complete form of the Basel III framework is expected to befinalized by end of calendar year 2010. Implementation is expected to begin at the start of calendar year 2013with substantial transition arrangements to be put in place.
The Basel III proposals on capital consist of proposals on improving the quality, consistency andtransparency of capital, enhancing risk coverage, introducing a supplementary leverage ratio, reducingprocyclicality and promoting counter-cyclical buffers, and addressing systemic risk and interconnectedness. InSeptember 2010, the Basel Committee announced the strengthening of capital requirements, which comprisedan increase in minimum common equity from 2.0% to 4.5% with an additional capital conservation bufferrequirement of 2.5%, thereby bringing the total common equity requirement to 7.0%. The capital conservation
61

buffer is a buffer established above the regulatory minimum capital requirement and capital distributionconstraints will be imposed on the bank when capital levels fall below the buffer limit. Further, the minimumtier I capital requirement has been increased from 4.0% to 6.0% and with the above-mentioned capitalconservation buffer; the total tier I capital requirement would be 8.5%. The total capital adequacy requirement(tier I and tier II) remains at the existing 8.0% level and with the above-mentioned capital conservation buffer,the total capital adequacy requirement would be 10.5%. The Basel III proposals on liquidity consist of aproposal on short-term liquidity coverage ratio aimed at building liquidity buffers to meet stress situations, anda proposal on long-term net stable funding ratio aimed at promoting longer term structural funding. Theseproposals are scheduled to be implemented in a phased manner over the next several years.
Some of the proposed measures of Basel III such as the predominance of equity in tier I capital, anincreased tier I capital requirement, capital conservation, a counter-cyclical buffer and deduction of deferredtax asset over a certain threshold, already exist in some form in the Reserve Bank of India’s current prudentialregulatory regime on capital adequacy for the Indian banking system. Further, the Reserve Bank of Indiacurrently stipulates a capital adequacy requirement of 9.0% compared to 8.0% stipulated by the BaselCommittee. The Reserve Bank of India’s current stipulation for banks in India on maintaining a minimumstatutory liquid ratio through mandatory holdings of government of India securities already reflects theemphasis of Basel III on building adequate liquidity buffers through the holding of high quality liquid assets.
We continue to monitor developments regarding these proposals. While the Basel III proposals mayincrease capital requirements and impose additional costs on the Bank in the future, we believe that our currentrobust capital adequacy position, adequate headroom currently available to raise hybrid/debt capital,demonstrated track record of access to domestic and overseas markets for capital raising and adequateflexibility in its balance sheet structure and business model will enable us to adapt to the Basel III frameworkalong with any amendments by the Reserve Bank of India, as and when they are implemented.
Significant Changes in Accounting Policies
There has been no significant change in the accounting policies in the last year. We follow guidelineson accounting issued by the Reserve Bank of India from time to time.
Liquidity Risk
Liquidity risk arises in the funding of lending, trading and investment activities and in the managementof trading positions. It includes both the risk of unexpected increases in the cost of funding an asset portfolioat appropriate maturities and the risk of being unable to liquidate a position in a timely manner at a reasonableprice. The goal of liquidity management is to be able, even under adverse conditions, to meet all liabilityrepayments on time and fund all investment opportunities.
Most of our incremental funding requirements are met through short-term funding sources, primarily inthe form of deposits including inter-bank deposits. However, a large portion of our assets, primarily ourcorporate and project finance and home loan portfolio, have medium or long-term maturities, creating apotential for funding mismatches. We actively monitor our liquidity position and attempt to maintain adequateliquidity at all times to meet all the requirements of our depositors and bondholders, while also meeting thecredit demand of our customers.
We seek to establish a continuous information flow and an active dialogue between the funding andborrowing divisions of the organization to enable optimal liquidity management. A separate group isresponsible for liquidity management. We are required to submit gap analysis on a monthly basis to theReserve Bank of India. Pursuant to the Reserve Bank of India guidelines, the liquidity gap (if negative) mustnot exceed 20.0% of outflows in the 1 to 14 day and the 15 to 28 day time category. We prepare a fortnightlymaturity gap analysis to review our liquidity position. Our static gap analysis is also supplemented by ashort-term dynamic analysis, in order to provide the liability raising units with a fair estimate of our short-termfunding requirements. In addition, we also monitor certain liquidity ratios on a fortnightly basis. We have inplace a liquidity contingency plan through which we monitor key indicators that could signal potentialliquidity challenges, to enable us to take necessary measures to ensure sufficient liquidity.
We maintain diverse sources of liquidity to facilitate flexibility in meeting funding requirements.Incremental operations are principally funded by accepting deposits from retail and corporate depositors. Thedeposits are augmented by borrowings in the short-term inter-bank market and through the issuance of bonds.We also have recourse to the liquidity adjustment facility and the refinance window, which are short-term
62

funding arrangements provided by the Reserve Bank of India. We generally maintain a substantial portfolioof liquid high quality securities that may be sold on an immediate basis to meet our liquidity needs. We alsohave the option of managing liquidity by borrowing in the inter-bank market on a short-term basis. Theovernight market, which is a significant part of the inter-bank market, is susceptible to volatile interest rates.These interest rates on certain occasions have touched highs of 100.0% and above. To curtail reliance on suchvolatile funding, our liquidity management policy has stipulated daily limits for borrowing and lending in thismarket. Our limit on daily borrowing is more conservative than the limit set by the Reserve Bank of India.ICICI Securities Primary Dealership like us relies for a certain proportion of its funding on the inter-bankmarket for overnight money and is therefore also exposed to similar risk of volatile interest rates.
Our liquid assets consist of nostro balances, overnight and other money market placements maturingwithin 90 days, government bonds and treasury bills that are held in excess of regulatory requirements, othermoney market investments such as commercial paper, certificate of deposits, banker’s acceptance and bearerdepository notes, bills rediscounting, inter-bank participations, mutual fund investments and unutilizedrepurchase/refinance lines. We deduct our short-term borrowings (borrowings with maturity up to one month)from the aggregate of these assets to determine our net liquid assets.
Our domestic operations in India and our overseas banking subsidiaries are funded primarily by deposits.Our international branches are funded primarily by bond issuances, syndicated loans, inter-bank funding andcommercial paper, in addition to deposit taking subject to local regulations and have longer maturity assetsrelative to liabilities. While conditions in the international markets have improved, prolonged uncertaintyregarding growth partly due to sovereign downgrades, together with new liquidity regimes being imposed byregulators, have resulted in continued challenges in the funding market. We have, therefore, moderated newloan disbursements from our international branches and increased the focus on the deposit rollover,prepayments and inter-bank borrowings for managing liquidity, while accessing institutional markets throughbond issuances and bilateral loans at appropriate times.
Additionally, we have continued to successfully raise funds through banker’s acceptance and accessrefinance from export credit agencies. We have the ability to use our rupee liquidity in India to meetrefinancing needs at our overseas branches, though this may be at a relatively high cost based on swap andexchange rates prevailing at the time of such refinancing. We have raised US$ 1.3 billion through bondsdenominated in US dollars through two issuances in November 2009 and July 2010. These bonds have anoriginal maturity exceeding five years.
The terms of our bond issuances and loans from other financial institutions and export credit agenciescontain cross-default clauses, restrictions on our ability to merge or amalgamate with another entity andrestrictions on our ability to prematurely redeem or repay such bonds or loans. The terms of our subordinateddebt issuances eligible for inclusion in tier I or tier II capital include the suspension of interest payments inthe event of losses or capital deficiencies, and a prohibition on redemption, even at maturity or on specifiedcall option dates, without the prior approval of the Reserve Bank of India. We are currently not, and do notexpect to be, in breach of any material covenants of our borrowings that would be construed as events ofdefault under the terms of such borrowings.
There are restrictions on the use of liquidity maintained by our UK and Canada subsidiaries to meet ouroverall liquidity needs. The Office of the Superintendent of Financial Institutions has prescribed a limit of100% on tier I and tier II capital, on the exposure to any single entity. ICICI Bank Canada, our Canadiansubsidiary has internally capped this exposure at 50% of the limit specified by the Office of the Superintendentof Financial Institutions. The Financial Services Authority of the United Kingdom has prescribed a limit of25% of the large exposure capital base, on the exposure to an individual counterparty (or a group of connectedcounterparties). The large exposure capital base is calculated as the sum of allowable tier I and tier II capitalless any deductions required by the Financial Services Authority. ICICI Bank UK PLC has a capital base ofUS$ 1.0 billion at year-end fiscal 2010, resulting in a limit of US$ 254 million.
The successful management of credit, market and operational risk is an important consideration inmanaging our liquidity because it affects the evaluation of our credit ratings by rating agencies. Ratingagencies may reduce or indicate their intention to reduce the ratings at any time.
63

Capital Expenditure
The following tables set forth, for the periods indicated, certain information related to capitalexpenditure by category of fixed assets.
Cost at
April 1, 2010 Additions Deletions
Accumulated
depreciation
Net assets at
September 30, 2010
(Rupees in billions) (US$ in millions)
Premises ................................... Rs. 23.12 Rs. 14.58 Rs. 0.52 Rs. 5.24 Rs. 31.94 US$ 717Other fixed assets..................... 30.47 4.44 0.50 21.49 12.92 290Assets on lease ......................... 17.55 0.00 0.00 14.60 2.95 66
Total ......................................... Rs. 71.14 Rs. 19.02 Rs. 1.02 Rs. 41.33 Rs. 47.81 US$ 1,073
Cost at
April 1, 2009 Additions Deletions
Accumulated
depreciation
Net assets at
March 31, 2010
(Rupees in billions) (US$ in millions)
Premises ................................... Rs. 24.11 Rs. 0.78 Rs. 1.77 Rs. 4.78 Rs. 18.34 US$ 408Other fixed assets..................... 32.58 1.60 3.70 20.22 10.26 228Assets on lease ......................... 17.75 0.00 0.20 14.02 3.53 79
Total ......................................... Rs. 74.44 Rs. 2.38 Rs. 5.67 Rs. 39.02 Rs. 32.13 US$ 715
Cost at
April 1, 2008 Additions Deletions
Accumulated
depreciation
Net assets at
March 31, 2009
(Rupees in billions) (US$ in millions)
Premises ................................... Rs. 22.94 Rs. 1.70 Rs. 0.53 Rs. 4.14 Rs. 19.97 US$ 444Other fixed assets..................... 29.34 3.83 0.59 19.15 13.43 299Assets on lease ......................... 18.08 0.00 0.33 13.13 4.62 103
Total ......................................... Rs. 70.36 Rs. 5.53 Rs. 1.45 Rs. 36.42 Rs. 38.02 US$ 846
During the six months ended September 30, 2010, we partly capitalized our Hyderabad office amountingto Rs. 13.03 billion in the books of account which led to an increase in gross block of premises. The increasein fixed assets was also due to fixed assets taken over from the Bank of Rajasthan upon amalgamation,amounting to Rs. 5.15 billion at August 12, 2010.
Segment Information
The Reserve Bank of India in its guidelines on “segmental reporting” has stipulated specified businesssegments and their definitions, for the purposes of public disclosures on business information for banks inIndia.
The consolidated segmental report for the six months ended September 30, 2010, based on the segmentsidentified and defined by the Reserve Bank of India, has been presented as follows:
• Retail Banking includes exposures of the Bank, which satisfy the four qualifying criteria of‘regulatory retail portfolio’ as stipulated by the Reserve Bank of India guidelines on the Basel IIframework. These criteria are as follows:
(i) Orientation criterion: Exposures is to an individual person or persons (not to be restrictedto an individual, Hindu Undivided Family, trust, partnership firm, private limited companies,public limited companies, co-operative societies, etc.) or to a small business are classified as retail.A small business is defined as one where the three year average annual turnover is less than Rs.500 million.
64

(ii) Product criterion: All exposure should take the form of any of the following:
• revolving credits and lines of credit (including overdrafts);
• term loans and leases (e.g., installment loans and leases, student and educationalloans); and
• small business facilities and commitments.
(iii) Low value of individual exposures: The maximum aggregate retail exposure to onecounterparty should not exceed the absolute threshold limit of Rs. 50 million.
(iv) Granularity criterion: The Regulatory retail portfolio should be sufficiently diversifiedto a degree that reduces the risks in the portfolio. The aggregate exposure to one counterpartyshould not exceed 0.2% of overall retail portfolio.
• Wholesale Banking includes all advances to trusts, partnership firms, companies and statutorybodies, by the Bank which are not included in the Retail Banking segment, as per the Reserve Bankof India guidelines for the Bank.
• Treasury includes the entire investment portfolio of the Bank.
• Other Banking includes hire purchase and leasing operations and other items not attributable toany particular business segment of the Bank.
Framework for Transfer Pricing
All liabilities are transfer priced to a central treasury unit, which pools all funds and lends to the businessunits at appropriate rates based on the relevant maturity of assets being funded after adjusting for regulatoryreserve requirements and specific charge on account of directed lending to certain sectors categorized aspriority sectors. Current and savings account deposits are transfer priced at a fixed rate. For term deposits andborrowings the transfer pricing is based on the categories specified in the Transfer Pricing Policy. Transferpricing to our asset creation units is based on the incremental cost of deposits (blended for current and savingsaccount deposits) and borrowings adjusted for the maturity of the asset (term premium), regulatory reserverequirements, liquidity maintenance costs and specific charges due to priority sector lending. The allocatedcapital is also considered as a source of funding for this purpose.
The following table sets forth the profit before tax of various segments in the six months endedSeptember 30, 2010 compared to the six months ended September 30, 2009.
Six months ended September 30,
2009 2010
2010/2009 %
change
in millions, except percentages
Retail Banking..................................................................... Rs. (7,592.2) Rs. (3,340.7) —Wholesale Banking ............................................................. 15,256.3 21,405.2 40.3%Treasury............................................................................... 16,977.1 10,871.2 (35.9)%Other Banking ..................................................................... 1,053.8 674.8 (36.0)%Profit before tax ................................................................ Rs. 25,695.0 Rs. 29,610.5 15.2%
65

Retail Banking Segment
The following table sets forth, for the periods indicated, the principal components of profit before tax.
Six months ended September 30,
2009 2010
2010/2009 %
change
in millions, except percentages
Net interest income ............................................................. Rs. 19,067.8 Rs. 17,338.9 (9.1)%Non-interest income ............................................................ 12,533.8 10,661.4 (14.9)%Total income....................................................................... 31,601.7 28,002.3 (11.4)%Non-interest expenses ......................................................... 21,307.1 21,511.6 1.0%Profit before provision ...................................................... 10,294.5 6,488.7 (37.0)%Provisions ............................................................................ 17,886.7 9,829.4 (44.9)%Profit before tax ................................................................ Rs. (7,592.2) Rs. (3,340.7) —
The following table sets forth, for the periods indicated, the outstanding balances of key assets andliabilities.
Sep 30, 2009 Mar 31, 2010 Sep 30, 2010
2010/2009 %
change
in millions, except percentages
Advances ........................................... Rs. 710,448.0 Rs. 665,364.3 Rs. 605,783.6 (14.7)%Deposits .............................................. 1,110,452.4 1,129,894.2 1,330,279.5 19.8%
The loans in the retail banking segment declined by 14.7% from Rs. 710.44 billion at September 30,2009 to Rs. 605.78 billion at September 30, 2010 mainly because the repayments and prepayments from ourexisting retail portfolio continue to be higher than incremental disbursements.
The retail banking segment maintained its focus on strengthening its deposit franchise, especially by wayof increasing the retail deposit base. The retail savings account deposits increased by 31.8% from Rs. 479.14billion at September 30, 2009 to Rs. 631.28 billion at September 30, 2010. Retail current account depositsincreased by 27.4% from Rs. 92.59 billion at September 30, 2009 to Rs. 118.00 billion at September 30, 2010.
The loss in the retail banking segment decreased from Rs. 7.59 billion in the six months endedSeptember 30, 2009 to a loss of Rs. 3.34 billion in the six months ended September 30, 2010, primarily dueto a decline in provisions for loan losses in the unsecured portfolio.
Net interest income decreased by 9.1% from Rs. 19.07 billion in the six months ended September 30,2009 to Rs. 17.34 billion in the six months ended September 30, 2010. The increase in net interest income wasprimarily due to a reduction in the retail loan portfolio and the impact of the increased cost of savings accountdeposits with effect from April 1, 2010.
Non-interest income decreased by 14.9% from Rs. 12.53 billion in the six months ended September 30,2009 to Rs. 10.66 billion in the six months ended September 30, 2010. The decrease in non-interest incomewas primarily due to lower retail loan origination and reduction in credit card related fees following the Bank’sconscious strategy of reducing the credit card portfolio. The fee income from the credit card portfoliodecreased from Rs. 3.89 billion in the six months ended September 30, 2009 to Rs. 2.66 billion in the sixmonths ended September 30, 2010.
Non-interest expenses marginally increased from Rs. 21.31 billion in the six months ended September30, 2009 to Rs. 21.51 billion in the six months ended September 30, 2010.
Provisions and contingencies decreased by 44.9% from Rs. 17.86 billion in the six months endedSeptember 30, 2009 to Rs. 9.82 billion the six months ended September 30, 2010, primarily due to a declinein provisions for loan losses in the unsecured retail portfolio. The incremental addition to retailnon-performing loans has been declining sequentially every quarter since the three months ended September30, 2009 which has reflected in a sequential decline in retail provisions with some lag.
66

Wholesale Banking Segment
The following table sets forth, for the periods indicated, the principal components of profit before tax.
Six months ended September 30,
2009 2010
2010/2009 %
change
in millions, except percentages
Net interest income ............................................................. Rs. 15,418.5 Rs. 14,861.0 (3.6)%Non-interest income ............................................................ 12,839.1 17,957.3 39.9%Total income....................................................................... 28,257.6 32,818.3 16.1%Non-interest expenses ......................................................... 6,651.6 7,746.5 16.5%Profit before provisions .................................................... 21,606.0 25,071.8 16.0%Provisions ............................................................................ 6,349.7 3,666.5 (42.3)%
Profit before tax ................................................................ Rs. 15,256.3 Rs. 21,405.3 40.3%
The following table sets forth, for the periods indicated, the outstanding balances of key assets andliabilities.
Sep 30, 2009 Mar 31, 2010 Sep 30, 2010
2010/2009 %
change
in millions, except percentages
Advances............................................. Rs. 1,195,406.4 Rs. 1,144,171.9 Rs. 1,330,901.1 11.3%Deposits .............................................. 869,736.4 888,941.7 892,400.4 2.6%
The wholesale banking loan book increased by 11.3% from Rs. 1,195.41 billion at September 30, 2009to Rs. 1,330.90 billion at September 30, 2010. In line with the Bank’s strategy of reducing its dependence onwholesale deposits, the term deposits in the segment decreased by 8.5% from Rs. 688.21 billion at September30, 2009 to Rs. 629.52 billion at September 30, 2010.
Profit before tax of the wholesale banking segment increased from Rs. 15.26 billion in the six monthsended September 30, 2009 to Rs. 21.41 billion in the six months ended September 30, 2010. The increase wasprimarily due to a decline in provisions and an increase in fee income.
Net interest income decreased by 3.6% from Rs. 15.42 billion in the six months ended September 30,2009 to Rs. 14.86 billion in the six months ended September 30, 2010. The decrease was primarily due tocompetitive pricing in the segment.
Non-interest income increased by 39.9% from Rs. 12.84 billion in the six months ended September 30,2009 to Rs. 17.96 billion in the six months ended September 30, 2010. Fee income increased due the Bank’sincreased participation in financing to corporates for their working capital and project financing requirements.
Non-interest expenses increased by 16.5% from Rs. 6.65 billion in the six months ended September 30,2009 to Rs. 7.75 billion in the six months ended September 30, 2010. The increase was primarily due to anannual increase in salaries and provision for performance-linked bonus during the period.
Provisions and contingencies decreased by 42.3% from Rs. 6.35 billion in the six months endedSeptember 30, 2009, to Rs. 3.67 billion in the six months ended September 30, 2010. Provisions were higherfor the six months ended September 30, 2009 on account of the significantly higher restructuring of corporateloans done during the period.
67

Treasury Banking Segment
The following table sets forth, for the periods indicated, the principal components of profit before tax.
Six months ended September 30,
2009 2010
2010/2009 %
change
in millions, except percentages
Net interest income ............................................................. Rs. 5,086.8 Rs. 8,892.3 74.8%Non-interest income ............................................................ 12,229.2 3,027.5 (75.2)%Total income....................................................................... 17,316.0 11,919.8 (31.2)%Non-interest expenses ......................................................... 733.2 666.7 (9.1)%Profit before provisions .................................................... 16,582.8 11,253.1 (32.1)%Provisions ............................................................................ (394.2) 381.9 (196.9)%Profit before tax ................................................................ Rs. 16,977.1 Rs. 10,871.2 (35.9)%
The following table sets forth, for the periods indicated, the outstanding balances of key assets andliabilities.
Sep 30, 2009 Mar 31, 2010 Sep 30, 2010
2010/2009 %
change
in millions, except percentages
Investment........................................... Rs. 1,199,648.1 Rs. 1,208,928.0 Rs. 1,362,770.2 13.6%Borrowing ........................................... 722,239.1 942,635.7 970,097.5 34.3%
Profit before tax of the treasury segment decreased from Rs. 16.98 billion in the six months endedSeptember 30, 2009 to Rs. 10.87 billion in the six months ended September 30, 2010. The decrease wasprimarily due to realized/unrealized losses on government securities and domestic fixed income positions.
Net interest income increased by 74.8% from Rs. 5.09 billion in the six months ended September 30,2009 to Rs. 8.89 billion in the six months ended September 30, 2010, primarily due to a reduction in theaverage cost of term deposits from 8.39% in the six months ended September 30, 2009 to 6.24% in the sixmonths ended September 30, 2010 and also due to an increase in the average current and saving accountdeposits in the overall deposit from Rs. 612.10 billion at September 30, 2009 to Rs. 753.11 billion atSeptember 30, 2010. This resulted in higher net positive income derived from transfer pricing of assets andliabilities.
Non-interest income decreased from Rs. 12.23 billion in the six months ended September 30, 2009 toRs. 3.03 billion in the six months ended September 30, 2010. The decrease was primarily due tomark-to-market and realized losses on our government and other domestic fixed income securities portfolioand an absence of reversal of mark-to-market provisions on our credit derivatives portfolio. This was partlyoffset by higher profits from our equity portfolio. During the six months ended September 30, 2010, due totightening of systemic liquidity, higher inflation and new issuance of government securities, there was increasein yield on short-term government securities. The increase in the yield on short term government securitiesrates in the latter part of the six months ended September 30, 2010, resulted in mark-to-market losses on thegovernment securities portfolio. The higher income in the six months ended September 30, 2009 included areversal of mark-to-market provisions on the credit derivatives portfolio due to a contraction in credit spreadsand higher realized profit on government securities and other fixed income securities.
68

Other Banking Segment
The following table sets forth, for the periods indicated, the principal components of profit before tax.
Six months ended September 30,
2009 2010
2010/2009 %
change
in millions, except percentages
Net interest income ............................................................. Rs. 640.2 Rs. 861.9 34.6%Non-interest income ............................................................ 1,534.5 934.4 (39.1)%Total income....................................................................... 2,174.7 1,796.3 (17.4)%Non-interest expenses ......................................................... 1,013.8 614.3 (39.4)%Profit before provision ...................................................... 1,161.0 1,182.0 1.8%Provisions ............................................................................ 107.1 507.3 373.7%Profit before tax ................................................................ Rs. 1,053.8 Rs. 674.7 (36.0)%
Profit before tax of other banking segment decreased from a profit of Rs. 1.05 billion in the six monthsended September 30, 2009 to a profit of Rs. 0.67 billion in the six months ended September 30, 2010.
Consolidated Financials as per Indian GAAP
The consolidated profit after tax, including the results of operations of our subsidiaries and otherconsolidating entities, increased by 14.0% from Rs. 21.80 billion in the six months ended September 30, 2009to Rs. 24.86 billion in the six months ended September 30, 2010 due to improved financial performance bythe Bank and its insurance subsidiaries. The consolidated return on average equity increased from 9.1% in thesix months ended September 30, 2009 to 9.7% in the six months ended September 30, 2010.
Profit after tax of ICICI Bank UK PLC decreased from Rs. 0.85 billion in the six months endedSeptember 30, 2009 to Rs. 0.80 billion in fiscal 2010 due to a decrease in fee income partly offset by anincrease in net interest income and decrease in operating expenses.
Profit after tax of ICICI Bank Canada decreased from Rs. 0.97 billion in the six months ended September30, 2009 to Rs. 0.63 billion in the six months ended September 30, 2010 primarily due to lower fee and otherincome partly offset by an increase in net interest income and decrease in operating expenses.
ICICI Prudential Life Insurance Company Limited recorded a net loss of Rs. 1.01 billion in the sixmonths ended September 30, 2010 compared to a loss of Rs. 1.05 billion in the six months ended September30, 2009. In the non-participating policyholders’ funds, there was a surplus of Rs. 4.89 billion, net of deferredtax, for the six months ended September 30, 2010. The surplus in the non-participating policyholders’ fundswould be transferred at the end of the financial year based on the appointed actuary’s recommendation. If thissurplus were transferred, the net profit after tax for the six months ended September 30, 2010 would have beenRs. 3.88 billion.
Profit after tax of ICICI Lombard General Insurance Company Limited increased from Rs. 0.89 billionin the six months ended September 30, 2009 to Rs. 1.37 billion in the six months ended September 30, 2010primarily due to an increase in premium and commission income.
Profit after tax of ICICI Securities Limited (including ICICI Securities Holdings Inc. and ICICISecurities Inc.) increased from Rs. 0.46 billion in the six months ended September 30, 2009 to Rs. 0.52 billionin the six months ended September 30, 2010 on account of improved capital market conditions.
Profit after tax of ICICI Prudential Asset Management Company decreased from Rs. 0.67 billion in thesix months ended September 30, 2009 to Rs. 0.45 billion in the six months ended September 30, 2010primarily due to the decrease in management fees on account of lower funds under management.
69

The following table sets forth, for the periods indicated, the profit/(loss) of our principal subsidiaries.
Six months ended September 30,
2009 2010
(in billions) (in billions)ICICI Bank UK PLC ....................................................................................... Rs. 0.85 Rs. 0.80ICICI Bank Canada .......................................................................................... 0.97 0.63ICICI Bank Eurasia Limited Liability Company ............................................. 0.27 0.05ICICI Prudential Life Insurance Company Limited ........................................ (1.05) (1.01)ICICI Lombard General Insurance Company Limited ..................................... 0.89 1.37ICICI Securities Limited (consolidated)........................................................... 0.46 0.52ICICI Securities Primary Dealership Limited .................................................. 0.67 0.32ICICI Prudential Asset Management Company Limited .................................. 0.67 0.45ICICI Home Finance Company Limited .......................................................... 0.54 1.11ICICI Venture Funds Management Company Limited ..................................... 0.30 0.33
Summary Fiscal 2010 compared to Fiscal 2009
Profit before provisions and tax increased by 9.0% from Rs. 89.25 billion in fiscal 2009 to Rs. 97.32billion in fiscal 2010. This increase was primarily due to an increase in income from treasury-related activitiesby 42.0% from Rs. 12.94 billion in fiscal 2009 to Rs. 18.38 billion in fiscal 2010 and a decrease in non-interestexpenses by 16.8% from Rs. 70.45 billion in fiscal 2009 to Rs. 58.60 billion in fiscal 2010, offset, in part, bya decrease in commission, exchange and brokerage income by 14.1% from Rs. 56.26 billion in fiscal 2009 toRs. 48.31 billion in fiscal 2010 and a decrease in net interest income by 3.0% from Rs. 83.67 billion in fiscal2009 to Rs. 81.14 billion in fiscal 2010.
Provisions and contingencies (excluding provision for tax) increased by 15.2% from Rs. 38.08 billionin fiscal 2009 to Rs. 43.87 billion in fiscal 2010 primarily due to a higher level of provisioning for retailnon-performing loans and restructured corporate loans. Profit before tax increased by 4.5% from Rs. 51.17billion in fiscal 2009 to Rs. 53.45 billion in fiscal 2010. Tax provision decreased by 2.9% from Rs. 13.59billion in fiscal 2009 to Rs. 13.20 billion in fiscal 2010, reflecting an effective tax rate of 24.7% in fiscal 2010as compared to 26.6% in fiscal 2009 primarily due to a change in the mix of taxable profits with a highercomponent of tax exempt income and the abolition of fringe benefit tax, offset, in part, by a negative impactof a revaluation of deferred tax asset due to a reduction in surcharge from 10.0% to 7.5% vide Finance Act,2010. Profit after tax increased by 7.1% from Rs. 37.58 billion in fiscal 2009 to Rs. 40.25 billion in fiscal2010.
• Net interest income decreased by 3.0% from Rs. 83.67 billion in fiscal 2009 to Rs. 81.14 billionin fiscal 2010 reflecting primarily a decline of 5.1% in average interest-earning assets during fiscal2010, offset, in part, by an increase in net interest margin from 2.4% in fiscal 2009 to 2.5% in fiscal2010.
• Non-interest income decreased by 1.6% from Rs. 76.03 billion in fiscal 2009 to Rs. 74.78 billionin fiscal 2010 primarily due to a decrease in commission, exchange and brokerage income, offset,in part, by an increase in income from treasury-related activities.
• Non-interest expense decreased by 16.8% from Rs. 70.45 billion in fiscal 2009 to Rs. 58.60 billionin fiscal 2010 primarily due to a decrease in direct marketing agency expenses from Rs. 5.29billion in fiscal 2009 to Rs. 1.25 billion in fiscal 2010 and our overall cost reduction initiatives.
• Provisions and contingencies (excluding provision for tax) increased by 15.2% from Rs. 38.08billion in fiscal 2009 to Rs. 43.87 billion in fiscal 2010 primarily due to a higher level ofprovisioning for retail non-performing loans and restructured corporate loans. Provisions for retailnon-performing loans increased due to seasoning of the secured loan portfolio, losses on theunsecured loan portfolio, challenges in collections and the impact of the adverse macro-economicenvironment experienced in fiscal 2009.
• Total assets decreased by 4.2% from Rs. 3,793.01 billion at March 31, 2009 to Rs. 3,634.00 billionat March 31, 2010 primarily due to a decrease in advances by Rs. 371.05 billion, offset, in part,by an increase in investments by Rs. 178.35 billion.
70

Net Interest Income
Net interest income decreased by 3.0% from Rs. 83.67 billion in fiscal 2009 to Rs. 81.14 billion in fiscal2010 primarily due to a 5.1% decline in average interest-earning assets during fiscal 2010, offset, in part byan increase in net interest margin from 2.4% in fiscal 2009 to 2.5% in fiscal 2010.
Interest income decreased by 17.3% from Rs. 310.93 billion in fiscal 2009 to Rs. 257.07 billion in fiscal2010 due to a decrease in average interest-earning assets by 5.1% from Rs. 3,436.20 billion in fiscal 2009 toRs. 3,259.66 billion in fiscal 2010 and a decrease in yield on average interest-earning assets by 116 basispoints from 9.1% in fiscal 2009 to 7.9% in fiscal 2010.
The average volume of interest-earning assets decreased in fiscal 2010 primarily on account of adecrease in average advances and average balances with the Reserve Bank of India, offset, in part, by anincrease in average repo lending and average interest-earning investments. Average advances decreased by12.7% from Rs. 2,192.80 billion in fiscal 2009 to Rs. 1,915.39 billion in fiscal 2010 primarily on account ofa decrease in retail advances and advances of overseas branches. Retail advances (including dealer financingand developer financing portfolios) decreased by 25.6% from Rs. 1,062.03 billion at March 31, 2009 to Rs.790.45 billion at March 31, 2010 primarily due to contractual repayments and prepayments from our existingportfolio as well as moderation in new retail lending. Net advances of overseas branches, in rupee terms,decreased by 16.9% from Rs. 542.91 billion at March 31, 2009 to Rs. 451.37 billion at March 31, 2010primarily due to limited demand for new foreign currency financing from Indian companies and rupeeappreciation.
Average balances with the Reserve Bank of India decreased by 36.3% from Rs. 189.57 billion in fiscal2009 to Rs. 120.74 billion in fiscal 2010 primarily due to a reduction in net demand and time liabilities.Average other interest-earning assets increased by Rs. 94.64 billion from Rs. 82.84 billion in fiscal 2009 toRs. 177.48 billion in fiscal 2010 primarily due to deployment of surplus liquidity in the reverse repurchaseagreement under Reserve Bank of India’s liquidity adjustment facility and call money lending.
Average interest-earning investments increased by 7.7% from Rs. 971.00 billion in fiscal 2009 to Rs.1,046.05 billion in fiscal 2010 primarily due to an increase in credit substitutes, offset, in part, by a decreasein average government and other approved securities. The reduction in average government and otherapproved securities was primarily on account of a reduction in net demand and time liabilities resulting fromoverall reduction in total assets. Further, the statutory liquidity ratio was 24.0% from November 8, 2008 toNovember 6, 2009 compared to 25.0% prior to November 8, 2008 and after November 7, 2009.
Yield on average interest-earning assets decreased by 116 basis points from 9.1% in fiscal 2009 to 7.9%in fiscal 2010 primarily due to a decrease in the yield on average advances by 111 basis points from 10.2%in fiscal 2009 to 9.1% in fiscal 2010 and a decrease in yield on interest-earning investments by 144 basispoints from 7.6% in fiscal 2009 to 6.2% in fiscal 2010. During fiscal 2010, the cash reserve ratio requirementwas increased by 75 basis points to 5.75% at year-end fiscal 2010. As cash reserve ratio balances do not earnany interest income, the increase in requirement resulted in a negative impact on yield on interest earningassets.
Yield on average advances decreased by 111 basis points from 10.2% in fiscal 2009 to 9.1% in fiscal2010 primarily on account of a reduction in interest rates resulting in a reduction of prime lending rate andfloating reference rates for our domestic loan book, a reduction in benchmark rates (LIBOR) on the advancesof our overseas branches and a decrease in the proportion of high yielding unsecured retail loans in total loans.Effective June 5, 2009, we reduced the prime lending rate and the floating reference rate for domesticadvances by 100 basis points each. The decline in proportion of retail loans in total loans was primarily dueto contractual repayments and prepayments on the existing portfolio and an industry-wide moderation in freshretail loans. Interest on income tax refunds included in interest income decreased from Rs. 3.33 billion in fiscal2009 to Rs. 1.21 billion in fiscal 2010 and loss on securitization pools (including credit losses on existingpools) increased from Rs. 3.21 billion in fiscal 2009 to Rs. 5.09 billion in fiscal 2010. This impact wasreflected over all quarters of fiscal 2010.
71

Total interest expense decreased by 22.6% from Rs. 227.26 billion in fiscal 2009 to Rs. 175.93 billionin fiscal 2010 due to a decrease in both average interest-bearing liabilities and average cost of funds. Averageinterest-bearing liabilities decreased by 6.0% from Rs. 3,249.16 billion in fiscal 2009 to Rs. 3,054.87 billionin fiscal 2010 primarily due to a decrease in volume of average deposits. Average cost of funds decreased by123 basis points from 7.0% in fiscal 2009 to 5.8% in fiscal 2010.
Average volume of deposits decreased by 9.6% from Rs. 2,180.14 billion in fiscal 2009 to Rs. 1,970.60billion in fiscal 2010. Total deposits decreased by 7.5% from Rs. 2,183.48 billion at March 31, 2009 to Rs.2,020.17 billion at March 31, 2010 primarily due to a reduction in term deposits in line with our consciousstrategy of focusing on current and savings account deposits and reducing the wholesale term deposit base.The proportion of current and savings account deposits in total deposits increased from 28.7% at March 31,2009 to 41.7% at March 31, 2010. The proportion of average current and savings account deposits to averagetotal deposits increased from 26.6% in fiscal 2009 to 32.5% in fiscal 2010.
Average volume of borrowings (including subordinated debt) increased by 1.4% from Rs. 1,069.03billion in fiscal 2009 to Rs. 1,084.27 billion in fiscal 2010 primarily on account of an increase in overnightborrowing under repurchase agreement for money market operations based on arbitrage opportunitiesavailable in the market and new capital eligible borrowings, in the nature of subordinated debt, offset, in part,by a decrease in other borrowings.
Average cost of funds decreased by 123 basis points from 7.0% in fiscal 2009 to 5.8% in fiscal 2010.Average cost of deposits decreased by 140 basis points from 7.2% in fiscal 2009 to 5.8% in fiscal 2010 dueto a decline in average cost of term deposits by 149 basis points from 9.2% in fiscal 2009 to 7.7% in fiscal2010 and an increase in the proportion of current and savings account deposits in total deposits. The averagecost of borrowings decreased by 88 basis points from 6.5% in fiscal 2009 to 5.6% in fiscal 2010 due to adecrease in cost of foreign currency borrowings and cost of call money borrowings and borrowings underrepurchase agreements. Cost of foreign currency borrowings decreased due to a reduction in benchmark rate(LIBOR).
The Reserve Bank of India had prescribed a rate of 3.5% on savings deposits and banks were requiredto pay this interest on the minimum outstanding balance in a savings account between the 10th day and theend of the month. Effective April 1, 2010, the Reserve Bank of India changed the methodology of computationof the interest payable and banks will be required to pay interest on the average daily balance maintained ina savings account. The change in methodology will result in an increased effective interest rate on savingsaccount deposits and will adversely impact the net interest margin of banks. Our cost of savings accountdeposits for the quarter ended March 31, 2010 was 2.9% and in line with the change mentioned above, hasincreased to 3.5% from April 1, 2010. Based on average balances for the quarter ended March 31, 2010, thischange is estimated to have an adverse impact of about 10 basis points on our net interest margin.
While the funding cost for us has reduced over the last one year, it may increase going forward. It cannotbe assured that we will be able to pass through all the increases in our funding costs to our borrowers. Anyfailure to pass such higher funding costs completely to our customers would adversely impact our net interestmargin. See “Risk Factors—Risks Relating to Our Business—Our banking and trading activities areparticularly vulnerable to interest rate risk and volatility in interest rates could adversely affect our net interestmargin, the value of our fixed income portfolio, our income from treasury operations, the quality of our loanportfolio and our financial performance”.
Our net interest margin is expected to continue to be lower than other banks in India until we increasethe proportion of retail deposits in our total funding. Our net interest margin is also impacted by the relativelylower margins on our international book.
72

Non-Interest Income
The following table sets forth, for the periods indicated, the principal components of our non-interestincome.
Year ended March 31,
2009 2010 2010
2010/2009
% change
(in millions, except percentages)
Commission, exchange and brokerage............ Rs. 56,258.9 Rs. 48,308.1 US1,084 (14.1)%Income from treasury-related activities .......... 12,948.6 18,376.9 412 42.0Lease income .................................................. 2,334.3 1,570.9 35 (32.7)Other income .................................................. 4,495.5 6,520.6 146 45.0
Total non-interest income ............................... Rs. 76,037.3 Rs. 74,776.5 US$ 1,678 (1.7)%
Non-interest income decreased by 1.6% from Rs. 76.03 billion in the year ended March 31, 2009 to Rs.74.78 billion in the year ended March 31, 2010 primarily due to a 14.1% decrease in commission, exchangeand brokerage income from Rs. 56.26 billion in the year ended March 31, 2009 to Rs. 48.31 billion in fiscal2010, offset, in part, by an increase in income from treasury-related activities by 42.0% from Rs. 12.94 billionin the year ended March 31, 2009 to Rs. 18.38 billion in fiscal 2010.
Commission, exchange and brokerage income decreased by 14.1% from Rs. 56.26 billion in fiscal 2009to Rs. 48.31 billion in the year ended March 31, 2010 primarily due to subdued credit demand from thecorporate sector in fiscal 2010, which resulted in lower loan processing fees. Moderation in retaildisbursements resulted in lower retail asset (including credit cards) related fees in fiscal 2010. Retail liabilitiesrelated fees increased marginally in fiscal 2010 as compared to fiscal 2009.
The total income from treasury-related activities increased by 42.0% from Rs. 12.94 billion in fiscal2009 to Rs. 18.38 billion in fiscal 2010. Income from treasury-related activities for fiscal 2010 primarilyincludes realized/unrealized profit on government securities and other fixed income instruments, positiveimpact on the valuation of the credit derivatives portfolio due to the softening of credit spreads andrealized/unrealized profit on equity investments, offset, in part by mark-to-market losses on investments insecurity receipts issued by asset reconstruction companies and a diminution in the value of venture fundinvestments. Income from treasury-related activity includes income from derivatives reflecting primarily thetransactions undertaken with customers by us and hedged by us in the inter-bank market, and income frommerchant foreign exchange transactions.
During fiscal 2010, a recovery in equity markets and softening of credit spreads led to a positive impacton our trading fixed income portfolio and equity portfolio. Liquidity in the banking system continued toimprove. As a result, there was a significant moderation in money market and wholesale deposit rates.However, the yield on 10-year government securities, after declining initially, increased during fiscal 2010 inview of the large government borrowing program and a high fiscal deficit estimated for fiscal 2010. Wecapitalized on certain market opportunities in fiscal 2010 resulting in realized/unrealized gains on governmentsecurities and other fixed income securities. Income from treasury-related activities is necessarily volatile anddepends upon the nature of our portfolio as well as interest rate trends and may not be sustainable.
Lease income, net of lease depreciation, decreased by 34.8% from Rs. 0.23 billion in fiscal 2009 to Rs.0.15 billion in fiscal 2010 primarily due to a decrease in leased assets from Rs. 4.62 billion at March 31, 2009to Rs. 3.53 billion at March 31, 2010.
Other income increased by 45.0% from Rs. 4.50 billion in fiscal 2009 to Rs. 6.52 billion in fiscal 2010.Other income primarily includes dividend from subsidiaries and profit on sale of fixed assets. During fiscal2010, we and First Data, a global leader in electronic commerce and payment services, formed a merchantacquiring alliance entity, 19% owned by us and 81% owned by First Data, which has acquired our merchantacquiring operations through a transfer of assets, primarily comprising fixed assets and receivables, andassumption of liabilities, for a total consideration of Rs. 3.74 billion. We realized a profit of Rs. 2.03 billionfrom this transaction, which is included in “Other income”.
73

Non-Interest Expense
The following table sets forth, for the periods indicated, the principal components of non-interestexpense.
Year ended March 31,
2009 2010 2010
2010/2009
% change
(in millions, except percentages)
Employee expenses ......................................... Rs. 19,717.0 Rs. 19,257.9 US$ 432 (2.3)%Depreciation on owned property (including
non banking assets)..................................... 4,684.9 4,778.5 107 2.0Auditors’ fees and expenses ........................... 22.7 22.5 1 (0.9)Other administrative expenses ........................ 38,636.2 31,868.1 715 (17.5)Total non-interest expense (excluding lease
depreciation and direct marketing agencyexpenses) ..................................................... 63,060.8 55,927.0 1,255 (11.3)
Depreciation (including lease equalization)on leased assets ........................................... 2,101.1 1,416.5 32 (32.6)
Direct marketing agency expenses ................. 5,289.2 1,254.8 28 (76.3)
Total non-interest expense .............................. Rs. 70,451.1 Rs. 58,598.3 US$ 1,315 (16.8)%
Total non-interest expense decreased by 16.8% from Rs. 70.45 billion in fiscal 2009 to Rs. 58.60 billionin fiscal 2010 primarily due to a 76.3% decrease in direct marketing agency expenses and a 17.5% decreasein other administrative expenses.
We use marketing agents, called direct marketing agents or associates, for sourcing our retail assets. Weinclude commissions paid to these direct marketing agents of our retail assets in non-interest expense. Thesecommissions are expensed up front and are not amortized over the life of the loan. Due to lower retaildisbursements and lower issuance of new credit cards, direct marketing agency expenses decreased by 76.3%from Rs. 5.29 billion in fiscal 2009 to Rs. 1.25 billion in fiscal 2010.
Employee expenses decreased by 2.3% from Rs. 19.72 billion in fiscal 2009 to Rs. 19.26 billion in fiscal2010 despite the provision of performance bonus and performance-linked retention pay primarily on accountof a decrease in the average employee base and a decrease in provision requirement for retirement benefitobligations due to an increase in discount rate on account of an increase in yield on government securities.Though the average employee base was lower in fiscal 2010, the employee base at year-end fiscal 2010 wasmarginally higher at 35,256 as compared to 34,596 at year-end fiscal 2009. We expect employee expenses toincrease from this level as we grow our business and in light of the competitive market for talent in India.
Depreciation on owned property increased by 2.0% from Rs. 4.68 billion in fiscal 2009 to Rs. 4.78billion in fiscal 2010, reflecting the addition of new branches and ATMs and office equipments. The numberof our branches in India increased from 1,419 at March 31, 2009 to 1,707 at March 31, 2010. The number ofATMs increased from 4,713 at March 31, 2009 to 5,219 at March 31, 2010. Depreciation on leased assetsdecreased by 32.4% from Rs. 2.10 billion in fiscal 2009 to Rs. 1.42 billion in fiscal 2010.
Other administrative expenses decreased by 17.5% from Rs. 38.64 billion in fiscal 2009 to Rs. 31.87billion in fiscal 2010 primarily due to overall cost reduction initiatives undertaken by us. Expenses on accountof retail business expenses, professional fees, traveling conveyance, postage and telegrams and insurancedeclined in fiscal 2010 as compared to fiscal 2009.
74

Provisions and Contingencies (excluding Tax Provisions)
The following table sets forth, for the periods indicated, the components of provisions and contingencies.
Year ended March 31,
2009 2010 2010
2010/2009 %
change
(Rupees in millions, except percentages)
Provision for investments (includingcredit substitutes) (net) ............................... Rs. 977.3 Rs. (26.5) US$ (1) —
Provision for non-performing assets(including provision for standard assets) .... 37,500.3 43,621.6 979 16.3%
Others.............................................................. (395.0) 273.5 6 —
Total provisions .............................................. Rs. 38,082.6 Rs. 43,868.6 US$ 984 15.2%
We classify our loans in accordance with the Reserve Bank of India guidelines. Provisions andcontingencies (excluding provision for tax) increased by 15.2% from Rs. 38.08 billion in fiscal 2009 to Rs.43.87 billion in fiscal 2010 primarily due to a higher level of provisioning for retail non-performing loans andan increase in provisions for restructured corporate assets. Provisions for retail non-performing loans increasedon account of seasoning of the secured loan portfolio, losses on the unsecured loan portfolio, challenges incollections and the impact of adverse macro-economic environment experienced in fiscal 2009.
During fiscal 2010, we made provisions of Rs. 2.52 billion on corporate loans as required by ReserveBank of India guidelines on restructured advances. The deterioration in the global economic environmentduring fiscal 2009, in particular following the bankruptcy of Lehman Brothers in September 2008, adverselyimpacted the operations of several Indian companies. Indian businesses were impacted by the lack of accessto financing/refinancing from global debt capital markets, losses on existing inventories due to the sharpdecline in commodity prices, reduction in demand for and prices of output and reduction in cash accruals andprofitability. There was some stress experienced by certain borrowers in sectors such as real estate, autoancillaries and textiles. This led to additional restructuring of loans in the Indian banking system, includingus.
We held a cumulative standard assets provision of Rs. 14.36 billion at March 31, 2010 against therequirement of Rs. 7.30 billion at March 31, 2010 as per the category-wise general provision requirementcurrently applicable to various categories of loans under the Reserve Bank of India guidelines. The excessprovision has not been reversed in accordance with the Reserve Bank of India guidelines.
Our provisioning coverage ratio (i.e., total provisions made against non-performing assets as apercentage of gross non-performing assets) was 59.5% of March 31, 2010. Reserve Bank of India guidelinesrequire banks to achieve a provisioning coverage ratio of 70% by September 30, 2010. We have been permittedby the Reserve Bank of India to achieve the stipulated level of provision coverage ratio of 70% in a phasedmanner by March 31, 2011. See also “Risk Factors—Risks Relating to Our Business—Further deteriorationof our non-performing asset portfolio combined with recent Reserve Bank of India requirements that all Indianbanks increase their provisioning coverage as a percentage of gross non-performing assets could adverselyaffect our business”.
75

Tax Expense
The following table sets forth, for the periods indicated, details of tax expense computation.
Year ended March 31,
2009 2010 2010
(in millions, except percentages)
Tax at marginal rate on income ................................................. Rs. 17,392.6 Rs. 18,168.7 US$ 408Adjustments ..............................................................................Difference in book and tax depreciation ................................... 2,260.2 2,652.5 60Bad debts written off ................................................................. 11,532.4 7,498.1 168Special reserve under section 36(1)(viii) ................................... (2,090.0) (2,715.6) (61)Surplus on sale of property/assets ............................................. (175.1) (1,345.2) (30)Dividend, exempt interest and other exempt income ................ (11,154.6) (9,499.7) (213)Capital gains on sale of capital assets ....................................... (696.0) (2,989.1) (67)Other adjustments ...................................................................... 1,758.9 138.7 3
Net adjustments.......................................................................... 1,435.8 (6,260.3) (140)
Tax (savings)/outgo thereon — other than capital gains ........... 488.0 (2,127.9) (48)Tax on capital gains on sale of capital assets ........................... 52.5 119.1 3Tax (savings)/outgo.................................................................... 540.5 (2,008.7) (45)Deferred taxes and other tax provisions .................................... (4,716.7) (2,986.6) (67)
Total income tax ........................................................................ 13,216.4 13,173.4 296
Wealth tax .................................................................................. 30.0 30.0 1Fringe benefit tax....................................................................... 342.0 0.0 0
Total taxation ............................................................................. Rs. 13,588.4 Rs. 13,203.4 US$ 296
NotesProfit before taxation ................................................................. Rs. 51,169.7 Rs. 53,453.2 US$ 1,200Marginal rates of tax ................................................................— Other than long-term capital gains ....................................... 33.99% 33.99%— Long-term capital gains (Listed Securities Transaction
Tax) ....................................................................................... 0% 0%— Long-term capital gains (Non Securities Transaction Tax
with indexation) .................................................................... 22.66% 22.66%— Long-term capital gains (Listed Non Securities
Transaction Tax without indexation) .................................... 11.33% 11.33%— Short-term capital gains (Listed Securities Transaction
Tax) ....................................................................................... 17.00% 17.00%— Short-term capital gains (Non Securities Transaction Tax) .. 33.99% 33.99%
The income tax expense (including wealth tax) decreased by 2.9% from Rs. 13.59 billion in fiscal 2009to Rs. 13.20 billion in fiscal 2010. The effective tax rate of 24.7% in fiscal 2010 was lower compared to theeffective tax rate of 26.6% in fiscal 2009 primarily due to a change in the mix of taxable profits with a highercomponent of exempt income and abolition of fringe benefit tax, offset, in part, by a negative impact ofrevaluation of deferred tax asset due to reduction in surcharge from 10.0% to 7.5% vide Finance Act, 2010.
Financial Condition
Our total assets decreased by 4.2% from Rs. 3,793.01 billion at March 31, 2009 to Rs. 3,634.00 billionat March 31, 2010. Net advances decreased by 17.0% from Rs. 2,183.11 billion at March 31, 2009 to Rs.1,812.06 billion at March 31, 2010 primarily due to a decrease in retail advances. Net retail advances(including dealer financing and developer financing portfolios) decreased by 25.6% from Rs. 1,062.03 billionat March 31, 2009 to Rs. 790.45 billion at March 31, 2010. Retail advances constituted 43.6% of our total netadvances at March 31, 2010. Net advances of overseas branches (including offshore banking unit) decreasedin rupee terms by 16.9% from Rs. 542.91 billion at March 31, 2009 to Rs. 451.37 billion at March 31, 2010.Total investments increased by 17.3% from Rs. 1,030.58 billion at March 31, 2009 to Rs. 1,208.93 billion at
76

March 31, 2010 primarily due to an increase in statutory liquidity ratio investments by 7.9% from Rs. 633.87billion at March 31, 2009 to Rs. 684.04 billion at March 31, 2010 and an increase in credit substitutes anddeployment of liquidity in short-dated securities by 26.5% from Rs. 396.71 billion at March 31, 2009 to Rs.524.89 billion at March 31, 2010.
We have a trading portfolio in various credit derivatives instruments including credit default swaps(CDSs), credit linked notes (CLNs) and collateralized debt obligations (CDOs). At March 31, 2010, we hada gross portfolio of funded credit derivatives of Rs. 15.40 billion and non-funded credit derivatives of Rs.32.88 billion, including Rs. 0.22 billion as protection bought by us at March 31, 2010 as compared to fundedcredit derivatives of Rs. 18.41 billion and non-funded credit derivatives of Rs. 38.71 billion, including Rs. 0.25billion as protection bought by us at March 31, 2009. Our banking subsidiaries had a gross portfolio of fundedcredit derivatives of Rs. 12.59 billion and non-funded credit derivatives of Rs. Nil (US$ Nil) at March 31,2010 as compared to funded credit derivatives of Rs. 15.29 billion and non-funded credit derivatives of Rs.Nil (US$ Nil) at March 31, 2009. Our entire exposure in these credit derivatives at March 31, 2010 is tounderlying entities which are India-linked.
Our equity share capital and reserves increased by 4.2% from Rs. 495.33 billion at March 31, 2009 toRs. 516.18 billion at March 31, 2010 primarily due to accretion to reserves out of profits, net of dividend anddividend tax paid. Total deposits decreased by 7.5% from Rs. 2,183.48 billion at March 31, 2009 to Rs.2,020.17 billion at March 31, 2010 primarily due to our conscious strategy of reducing wholesale termdeposits. Term deposits decreased by 24.3% from Rs. 1,556.80 billion at March 31, 2009 to Rs. 1,178.01billion at March 31, 2010. Our savings account deposits increased by 29.7% from Rs. 410.36 billion at March31, 2009 to Rs. 532.18 billion at March 31, 2010 and current account deposits increased by 43.3% from Rs.216.32 billion at March 31, 2009 to Rs. 309.98 billion at March 31, 2010. Borrowings (including subordinateddebt) increased by 1.2% from Rs. 931.56 billion at March 31, 2009 to Rs. 942.64 billion at March 31, 2010primarily on account of a decrease in borrowings, offset, in part by new capital eligible borrowings, in thenature of subordinated debt as a result of which subordinated debt (including application money towardssubordinated debt) increased from Rs. 254.82 billion at March 31, 2009 to Rs. 329.67 billion at March 31,2010.
Segmental Information
The Reserve Bank of India issued revised guidelines on segment reporting applicable from fiscal 2008.As per the guidelines, our business operations have the following segments:
• Retail Banking includes exposures which satisfy the four criteria-orientation, product, granularityand low value of individual exposures for retail exposures-laid down in the Basel Committee onBanking Supervision document, “International Convergence of Capital Measurement and CapitalStandards: A Revised Framework”.
• Wholesale Banking includes all advances to trusts, partnership firms, companies and statutorybodies which are not included under the Retail Banking.
• Treasury includes the entire investment portfolio of the Bank.
• Other Banking includes hire purchase and leasing operations and other items not attributable to anyparticular business segment.
• All liabilities are transfer priced to a central treasury unit, which pools all funds and lends to thebusiness units at appropriate rates based on the relevant maturity of assets being funded afteradjusting for regulatory reserve requirements.
Retail Banking
The retail banking segment reported a loss of Rs. 13.34 billion in fiscal 2010 as compared to profit ofRs. 0.58 billion in fiscal 2009. This was primarily due to a decrease in net interest income and non-interestincome and an increase in provisions, offset, in part, by a decrease in non-interest expenses.
Net interest income decreased by 22.4% from Rs. 48.47 billion in fiscal 2009 to Rs. 37.59 billion infiscal 2010, primarily due to reductions in loans due to higher prepayments/repayments and lower level ofincremental lending, which resulted in a lower level of interest income.
Non-interest income decreased by 11.0% from Rs. 29.41 billion in fiscal 2009 to Rs. 26.19 billion infiscal 2010, primarily due to a lower level of incremental lending, which resulted in a lower level of loanrelated fees.
77

Provisions and contingencies increased by 14.2% from Rs. 29.37 billion in fiscal 2009 to Rs. 33.56billion in fiscal 2010, primarily due to continuing credit losses in the unsecured retail asset portfolio.
Non-interest expenses decreased by 9.1% from Rs. 47.93 billion in fiscal 2009 to Rs. 43.56 billion infiscal 2010, primarily due to lower issuance of new credit cards and overall cost reduction initiativesundertaken.
Wholesale Banking
Profit before tax of wholesale banking segment increased from Rs. 34.13 billion in fiscal 2009 to Rs.36.45 billion in fiscal 2010. The increase was mainly due to an increase in net interest income, a decrease innon-interest expenses offset, in part, by an increase in provisions and a decrease in non-interest income.
Net interest income increased by 17.2% from Rs. 26.50 billion in fiscal 2009 to Rs. 31.07 billion in fiscal2010. This was primarily due to a decrease in the interest rates in the banking system which resulted in a lowerlevel of inter-segment interest expense to the wholesale banking floating rate portfolio.
Non-interest income decreased by 19.1% from Rs. 34.70 billion in fiscal 2009 to Rs. 28.08 billion infiscal 2010. The fee income was impacted due to lower business confidence in the early part of the year andmuted credit demand throughout the year.
Non-interest expenses decreased by 35.5% from Rs. 19.15 billion in fiscal 2009 to Rs. 12.35 billion infiscal 2010, primarily due to continuous focus on cost containment.
Provisions and contingencies increased by 30.6% from Rs. 7.92 billion in fiscal 2009 to Rs. 10.34 billionin fiscal 2010, primarily due to restructuring of corporate loans.
Treasury
Profit before tax of the treasury segment increased from Rs. 12.84 billion in fiscal 2009 to Rs. 27.89billion in fiscal 2010 primarily due to an increase in net interest income, an increase in non-interest incomeand decrease in provision.
Net interest income increased by 101.1% from Rs. 5.65 billion in fiscal 2009 to an income of Rs. 11.37billion in fiscal 2010, primarily due to net positive income derived from the transfer pricing of assets andliabilities.
Non-interest income increased by 87.8% from Rs. 9.42 billion in fiscal 2009 to an income of Rs. 17.69billion in fiscal 2010, primarily due to the significant recovery in equity market resulting in realized profit andreversal of mark to market provision held on equity investments. Further, the contraction in credit spreads dueto improved global market conditions resulted in the reversal of mark-to-market provisions on the India linkedcredit derivatives portfolio.
Non-interest expense remained constant at Rs. 1.21 billion in fiscal 2010 as compared to fiscal 2009.
Other Banking
Profit before tax of other banking segment decreased from Rs. 3.61 billion in fiscal 2009 to Rs. 2.45billion in fiscal 2010.
Consolidated Financials as per Indian GAAP
The consolidated profit after tax, including the results of operations of our subsidiaries and otherconsolidating entities increased by 30.6% from Rs. 35.77 billion in fiscal 2009 to Rs. 46.70 billion in fiscal2010 due to improved financial performance by most of the subsidiaries. The consolidated return on averageequity increased from 7.83% in fiscal 2009 to 9.59% in fiscal 2010.
Profit after tax of ICICI Bank UK PLC increased from Rs. 0.31 billion in fiscal 2009 to Rs. 1.76 billionin fiscal 2010 due to an increase in fee income, lower operating expenses and lower impairment losses in fiscal2010, offset, in part, by lower net interest income following a decline in net interest margin and lower gainson buyback of bonds.
Profit after tax of ICICI Bank Canada increased from Rs. 1.39 billion in fiscal 2009 to Rs. 1.54 billionin fiscal 2010 primarily due to increased realization of gains on the sale of insured mortgages andmark-to-market gains on investments, as well as reduced provisions on loans, offset, in part, by a reductionin net interest income and a decrease in fee income during fiscal 2010.
78

ICICI Prudential Life Insurance Company Limited recorded a profit after tax of Rs. 2.58 billion in fiscal2010 compared to a loss of Rs. 7.80 billion in fiscal 2009 due to an increase in net premium earned, fundmanagement fees, risk charges, policy fees and other charges and due to lower operating and commissionexpenses.
Profit after tax of ICICI Lombard General Insurance Company Limited increased from Rs. 0.24 billionin fiscal 2009 to Rs. 1.44 billion in fiscal 2010 primarily due to an increase in operational efficiency and highergains on the sale of investments following improved market conditions in fiscal 2010.
Profit after tax of ICICI Securities Limited increased from Rs. 0.04 billion in fiscal 2009 to Rs. 1.23billion in fiscal 2010 on account of improved capital market conditions.
Profit after tax of ICICI Prudential Asset Management Company increased from Rs. 0.01 billion (US$0million) in fiscal 2009 to Rs. 1.28 billion in fiscal 2010 primarily due to the increase in management fees onaccount of higher funds under management and due to scheme support expenses of Rs. 0.92 billion incurredin fiscal 2009.
Consolidated assets of the Bank and its subsidiaries and other consolidating entities increased from Rs.4,826.91 billion at year-end fiscal 2009 to Rs. 4,893.47 billion at year-end fiscal 2010. Consolidated advancesof the Bank and its subsidiaries decreased from Rs. 2,661.30 billion at year-end fiscal 2009 to Rs. 2,257.78billion at year-end fiscal 2010.
The following table sets forth, for the periods indicated, the profit/(loss) of our principal subsidiaries.
Year ended March 31,
2009 2010
(in billions) (in billions)
ICICI Bank UK PLC ........................................................................................ Rs. 0.31 Rs. 1.76ICICI Bank Canada .......................................................................................... 1.39 1.54ICICI Bank Eurasia Limited Liability Company ............................................. (0.07) 0.53ICICI Prudential Life Insurance Company Limited ......................................... (7.80) 2.58ICICI Lombard General Insurance Company Limited ..................................... 0.24 1.44ICICI Prudential Asset Management Company Limited .................................. 0.01 1.28ICICI Securities Limited .................................................................................. 0.04 1.23ICICI Securities Primary Dealership Limited .................................................. 2.72 0.85ICICI Home Finance Company Limited .......................................................... 1.43 1.61ICICI Venture Funds Management Company Limited ..................................... Rs. 1.48 Rs. 0.51
Summary Fiscal 2009 compared to Fiscal 2008
Profit before provisions and tax increased by 12.1% from Rs. 79.61 billion in fiscal 2008 to Rs. 89.25billion in fiscal 2009 primarily due to an increase in net interest income by 14.6% from Rs. 73.04 billion infiscal 2008 to Rs. 83.67 billion in fiscal 2009 and a decrease in non-interest expenses by 13.6% from Rs. 81.54billion in fiscal 2008 to Rs. 70.45 billion in fiscal 2009, offset, in part, by a decrease in non-interest incomeby 13.7% from Rs. 88.11 billion in fiscal 2008 to Rs. 76.03 billion in fiscal 2009. Provisions and contingencies(excluding provision for tax) increased by 31.1% during fiscal 2009 due to a higher level of specificprovisioning on non-performing loans, offset, in part, by lower general provisioning as the advances portfoliodid not increase. Profit before tax increased by 1.2% from Rs. 50.56 billion in fiscal 2008 to Rs. 51.17 billionin fiscal 2009. Tax provision was Rs. 13.59 billion in fiscal 2009 compared to Rs. 8.98 billion in fiscal 2008,due to higher effective tax rate consequent to a change in the mix of taxable profits, which had a lowercomponent of income from dividend and capital gains. Profit after tax was lower by 9.6% in fiscal 2009 atRs. 37.58 billion as compared to Rs. 41.58 billion in fiscal 2008.
• Net interest income increased by 14.6% from Rs. 73.04 billion in fiscal 2008 to Rs. 83.67 billionin fiscal 2009 reflecting primarily an increase in net interest margin by 21 basis points from 2.2%in fiscal 2008 to 2.4% in fiscal 2009 and an increase in average interest-earning assets from Rs.3,288.34 billion in fiscal 2008 to Rs. 3,436.20 billion in fiscal 2009.
• Non-interest income decreased by 13.7% from Rs. 88.11 billion in fiscal 2008 to Rs. 76.03 billionin fiscal 2009 primarily due to a 57.8% decrease in other income (including dividend fromsubsidiaries) and a decrease of 32.6% in income from treasury-related activities.
79
• Non-interest expense decreased by 13.6% from Rs. 81.54 billion in fiscal 2008 to Rs. 70.45 billionin fiscal 2009 primarily due to a decrease in direct marketing agency expenses from Rs. 15.43billion in fiscal 2008 to Rs. 5.29 billion in fiscal 2009 and due to overall cost reduction initiativesundertaken by us.
• Provisions and contingencies (excluding provision for tax) increased from Rs. 29.05 billion infiscal 2008 to Rs. 38.08 billion in fiscal 2009 primarily due to higher level of specific provisioningon non-performing retail loans. Increase in non-performing retail assets was primarily on accountof seasoning of the secured loan portfolio, relatively higher losses on unsecured portfolio and theadverse macro-economic environment.
• Total assets decreased by 5.1% from Rs. 3,997.95 billion at year-end fiscal 2008 to Rs. 3,793.01billion at year-end fiscal 2009 primarily due to a decrease in cash and balances with the ReserveBank of India by Rs. 118.41 billion attributable to a reduction in cash reserve ratio requirement,decrease in investments by Rs. 83.96 billion and a decrease in advances by Rs. 73.05 billion.
Net Interest Income
Net interest income increased by 14.6% from Rs. 73.04 billion in fiscal 2008 to Rs. 83.67 billion in fiscal2009, reflecting primarily the following:
• an increase of Rs. 147.86 billion or 4.5% in average interest-earning assets; and
• an increase in net interest margin by 21 basis points from 2.2% in fiscal 2008 to 2.4% in fiscal2009.
Interest income increased by 1.0% from Rs. 307.88 billion in fiscal 2008 to Rs. 310.93 billion in fiscal2009 primarily due to an increase in average interest-earning assets by Rs. 147.86 billion, offset, in part, bya decrease of 31 basis points in yield on average interest-earning assets.
Average interest-earning assets increased marginally in rupee terms by Rs. 147.86 billion or 4.5% fromRs. 3,288.34 billion in fiscal 2008 to Rs. 3,436.20 billion in fiscal 2009. This increase is after considering theimpact of rupee depreciation on foreign currency denominated assets.
Increase in average interest-earning assets was primarily on account of an increase in average advancesby Rs. 155.09 billion. This increase in average advances was primarily on account of an increase in non-retailadvances, offset, in part, by a decrease in retail advances. While net advances of overseas branches (includingoffshore banking unit) decreased by 10.1% from US$11.9 billion at year-end fiscal 2008 to US$10.7 billionat year-end fiscal 2009, the net advances of overseas branches, in rupee terms, increased due to the impact ofrupee depreciation during fiscal 2009. Net retail advances decreased from Rs. 1,316.63 billion at year-endfiscal 2008 to Rs. 1,062.03 billion at year-end fiscal 2009 (including dealer financing and developer financingportfolio of Rs. 8.75 billion and Rs. 24.08 billion, respectively). Average interest-earning investments in fiscal2009 remained at about the same level as fiscal 2008. Increase in average interest-earning non-statutoryliquidity ratio investments was offset by a decrease in average statutory liquidity ratio investments. Averagestatutory liquidity ratio investments decreased by Rs. 23.51 billion primarily on account of a reduction indomestic net demand and time liabilities and a reduction of 100 basis points in statutory liquidity ratiorequirement from 25.0% to 24.0% during fiscal 2009.
Yield on average interest-earning assets decreased by 31 basis points from 9.4% in fiscal 2008 to 9.1%in fiscal 2009 primarily due to a decrease in the yield on advances by 91 basis points from 11.1% in fiscal 2008to 10.2% in fiscal 2009, offset, in part, by a reduction in cash reserve ratio requirement. Cash reserve ratio wasat 5.0% at year-end fiscal 2009 compared to 7.5% at year-end fiscal 2008. As cash reserve ratio balances donot earn any interest income, the reduction in requirement resulted in a positive impact on yield oninterest-earning assets. Our overall yield on advances decreased primarily on account of a decrease inbenchmark rate (LIBOR) and the impact of rupee depreciation on advances denominated in foreign currency.Yield on average interest-earning investments remained nearly at the same level as fiscal 2008 (i.e., 7.7% forfiscal 2008 and 7.6% for fiscal 2009).
Interest income was also impacted by receipt of interest on income tax refund which was Rs. 0.87 billionin fiscal 2008 compared to Rs. 3.33 billion in fiscal 2009 and loss on securitization (including credit losseson existing pools) of Rs. 3.21 billion in fiscal 2009.
80

Interest expense decreased by 3.2% from Rs. 234.84 billion in fiscal 2008 to Rs. 227.26 billion in fiscal2009 primarily due to a 3.9% decrease in average deposits from Rs. 2,268.13 billion in fiscal 2008 to Rs.2,180.14 billion in fiscal 2009 and a decrease in cost of funds by 54 basis points from 7.5% in fiscal 2008 to7.0% in fiscal 2009, offset, in part, by an increase in average borrowings from Rs. 851.15 billion in fiscal 2008to Rs. 1,069.03 billion in fiscal 2009.
Total deposits decreased by 10.7% from Rs. 2,444.31 billion at year-end fiscal 2008 to Rs. 2,183.48billion at year-end fiscal 2009 primarily due to our conscious strategy of paying off wholesale deposits. Termdeposits decreased from Rs. 1,806.51 billion at year-end fiscal 2008 to Rs. 1,556.80 billion at year-end fiscal2009. The proportion of current and savings account deposits in total deposits increased from 26.1% atyear-end fiscal 2008 to 28.7% at year-end fiscal 2009. Borrowings in rupee terms have increased primarily dueto new capital-eligible borrowings, in the nature of subordinated debt and an impact of rupee depreciation onforeign currency denominated borrowings. Borrowings (including subordinated debt) of foreign branchesdecreased from US$12.7 billion at year-end fiscal 2008 to US$10.9 billion at year-end fiscal 2009.
Cost of funds decreased from 7.5% in fiscal 2008 to 7.0% in fiscal 2009. Cost of deposits decreased by30 basis points from 7.5% in fiscal 2008 to 7.2% in fiscal 2009. The cost of borrowings decreased by 100 basispoints from 7.5% in fiscal 2008 to 6.5% in fiscal 2009. Cost of borrowings decreased primarily due to adecrease in cost of foreign currency borrowings as the benchmark rate (LIBOR) reduced.
Non-Interest Income
The following table sets forth, for the periods indicated, the principal components of our non-interestincome.
Year ended March 31,
2008 2009 2009
2009/2008
% change
(in millions, except percentages)
Commission, exchange and brokerage............ Rs. 56,053.1 Rs. 56,258.9 US$ 1,263 0.4%Income from treasury-related activities .......... 19,223.1 12,948.6 291 (32.6)Lease income .................................................. 2,168.1 2,334.3 52 7.7Other income .................................................. 10,663.3 4,495.5 101 (57.8)
Total non-interest income ............................... Rs. 88,107.6 Rs. 76,037.3 US$ 1,706 (13.7)%
Non-interest income decreased by 13.7% from Rs. 88.11 billion in fiscal 2008 to Rs. 76.03 billion infiscal 2009 primarily due to a decrease of 32.6% in income from treasury-related activities, offset, in part, byan increase in commission, exchange and brokerage income.
Commission, exchange and brokerage marginally increased by 0.4% from Rs. 56.05 billion in fiscal2008 to Rs. 56.26 billion in fiscal 2009 primarily due to robust growth in fee income in first half of fiscal 2009attributable to growth in fee income from structuring and advisory fees, third party product distribution fees,income from foreign exchange transactions and processing fees in both domestic and international operations,offset, in part, by the impact of the slowdown in domestic economy and continued turmoil in internationalmarkets in the second half of fiscal 2009. Domestic corporate activity slowed down considerably. Thisimpacted the fee income from corporate and small and medium enterprises. The high interest rates prevalentfor a large part of the year combined with our strategy to moderate balance sheet growth also impacteddomestic lending activity with retail disbursements slowing down considerably. This resulted in low retailasset related fees in fiscal 2009. Sales of third party products such as insurance and mutual funds slowed downconsiderably in the second half of fiscal 2009 resulting in lower third party distribution fees.
The total income from treasury-related activities decreased from Rs. 19.22 billion in fiscal 2008 to Rs.12.95 billion in fiscal 2009 primarily due to loss on proprietary equity trading and equity oriented mutual fundportfolio, reversal of derivative income, mark-to-market provisioning on security receipts and mark-to-marketand realized losses on credit derivatives, offset, in part, by realized profit on sale of fixed income investmentsand gains from buy-back of bonds. Income from treasury-related activity includes income from derivativesreflecting primarily the transactions undertaken with customers by us and hedged by us in the inter-bankmarket, and income from merchant foreign exchange transactions.
81

Sharp reduction in the year-on-year inflation, uncertain global growth outlook with downside risk alongwith the significant correction in the international commodity and the crude oil prices raised the expectationsof the significant monetary policy easing by the Reserve Bank of India and consequent softening of the interestrates in the economy in the second half of fiscal 2009. In view of the above, we increased the duration of ourfixed income portfolio significantly during the three months ended March 31, 2009. The yields on 10-yeargovernment of India securities came down significantly in the three months ended March 31, 2009. Due tosignificant easing of monetary policy by the Reserve Bank of India and consequent softening of the interestrates in the economy, we positioned ourselves to take advantage of the change in the interest rate scenario byincreasing the duration of the statutory liquidity ratio investment portfolio as well as taking trading positionsto benefit from the drop in yields.
We offer various derivative products to our clients for their risk management purposes including optionsand swaps. We do not carry market risk on these client derivative positions as we cover ourselves in theinter-bank market. Profits or losses on account of currency movements on these transactions are borne by theclients. In some cases, clients have filed suits against us disputing the transactions and the amounts to be paid.There had been delays in payment to us in respect of some of these clients. We had fully reversed the incomerecognized in cases where receivables were overdue for more than 90 days.
Lease income, net of lease depreciation, decreased by 34.3% from Rs. 0.35 billion in fiscal 2008 to Rs.0.23 billion in fiscal 2009 primarily because of a decrease in leased assets from Rs. 7.97 billion at March 31,2008 to Rs. 4.62 billion at March 31, 2009.
Other income decreased by 57.8% from Rs. 10.66 billion in fiscal 2008 to Rs. 4.50 billion in fiscal 2009primarily due to the absence of any distribution of income by venture capital funds where we haveinvestments, compared to income distribution of Rs. 7.88 billion in fiscal 2008.
Non-Interest Expense
The following table sets forth, for the periods indicated, the principal components of non-interestexpense.
Year ended March 31,
2008 2009 2009
2009/2008
% change
(in millions, except percentages)
Employee expenses ......................................... Rs. 20,789.0 Rs. 19,717.0 US$ 442 (5.1)%Depreciation on own property (including
non-banking assets)..................................... 3,962.8 4,684.9 105 18.2Auditors’ fees and expenses ........................... 23.0 22.7 1 (1.3)Other administrative expenditure.................... 39,518.9 38,636.2 867 (2.2)Total non-interest expense (excluding lease
depreciation and direct marketing agencyexpenses) ..................................................... 64,293.7 63,060.8 1,415 (1.9)
Depreciation (including lease equalization)on leased assets ........................................... 1,820.7 2,101.1 47 15.4
Direct marketing agency expenses ................. 15,427.4 5,289.2 119 (65.7)
Total non-interest expense .............................. Rs. 81,541.8 Rs. 70,451.1 US$ 1,581 (13.6)%
Total non-interest expense decreased by 13.6% from Rs. 81.54 billion in fiscal 2008 to Rs. 70.45 billionin fiscal 2009 primarily due to a 65.7% decrease in direct marketing agency expenses and a 2.2% decrease inother administrative expenses.
We use marketing agents, direct marketing agents or associates, for sourcing our retail assets. We includecommissions paid to these direct marketing agents of our retail assets in non-interest expense. Thesecommissions are expensed up front and not amortized over the life of the loan. Due to lower retaildisbursements, lower issuance of new credit cards and a reduction in rate of commission, direct marketingagency expenses decreased by 65.7% from Rs. 15.43 billion in fiscal 2008 to Rs. 5.29 billion in fiscal 2009.
82

Employee expenses decreased by 5.1% from Rs. 20.79 billion in fiscal 2008 to Rs. 19.72 billion in fiscal2009 primarily due to a 15.0% decrease in the employee base from 40,686 at year-end fiscal 2008 to 34,596at year-end fiscal 2009, offset, in part, by annual increase in salaries.
Depreciation on own property increased by 18.2% from Rs. 3.96 billion in fiscal 2008 to Rs. 4.68 billionin fiscal 2009, reflecting the addition of new branches. Depreciation on leased assets increased from Rs. 1.82billion in fiscal 2008 to Rs. 2.10 billion in fiscal 2009.
Other administrative expenses decreased by 2.2% from Rs. 39.52 billion in fiscal 2008 to Rs. 38.64billion in fiscal 2009 primarily due to overall cost reduction initiatives undertaken by us, offsetting theincrease in expenses related to retail business (primarily related to collections) and the increase in our branchand ATM network. The number of our branches and extension counters in India increased from 1,262 atyear-end fiscal 2008 to 1,419 at year-end fiscal 2009. The number of ATMs increased from 3,881 at year-endfiscal 2008 to 4,713 at year-end fiscal 2009. There was a reduction in expenses on account of printing andstationary, advertisement and publicity and postage, telegrams and telephone expenses in fiscal 2009 ascompared to fiscal 2008.
Provisions and Contingencies (excluding Tax Provisions)
The following table sets forth, for the periods indicated, the components of provisions and contingencies.
Year ended March 31,
2008 2009 2009
2009/2008 %
change
(in millions, except percentages)
Provision for investments (including creditsubstitutes) (net).......................................... Rs. 622.6 Rs. 977.3 US$ 22 57.0%
Provision for non-performing assets(1)(including provision for standard assets) .... 27,009.9 37,500.3 842 38.8
Others.............................................................. 1,413.4 (395.0) (9) —
Total provisions .............................................. Rs. 29,045.9 Rs. 38,082.6 US$ 855 31.1%
(1) We do not distinguish between provisions and write-offs while assessing the adequacy of our loan loss coverage, as both provisionsand write-offs represent a reduction of the principal amount of a non-performing asset. In compliance with regulations governingthe presentation of financial information by banks, gross non-performing assets are reported gross of provisions net of cumulativewrite-offs in our financial statements.
We classify our loans in accordance with the Reserve Bank of India guidelines. Provisions andcontingencies (excluding provision for tax) increased from Rs. 29.05 billion in fiscal 2008 to Rs. 38.08 billionin fiscal 2009 primarily due to higher level of specific provisioning on non-performing loans, offset, in part,by lower general provisioning as the advances portfolio did not increase. Specific provisioning onnon-performing assets increased in fiscal 2009 compared to fiscal 2008 primarily due to an increase in retailnon-performing loans. The increase in retail non-performing loans primarily reflects the seasoning of thesecured loan portfolio, relatively higher losses on unsecured portfolio and the adverse macro-economicenvironment.
The deterioration in the global economic environment during fiscal 2009, in particular following thebankruptcy of Lehman Brothers in September 2008, adversely impacted the operations of several Indiancompanies. Indian businesses were impacted by the lack of access to financing/refinancing from global debtcapital markets, losses on existing inventories due to the sharp decline in commodity prices, reduction indemand for and prices of output and reduction in cash accruals and profitability. There was some stressexperienced by certain borrowers in real estate and developer financing, auto ancillaries, textiles and retailmortgages. This led to additional restructuring of loans in the Indian banking system, including us.
The Ministry of Finance, Government of India, issued guidelines for the implementation of theagriculture debt waiver and relief scheme for farmers on May 23, 2008 which have been duly implementedby us. Pursuant to the scheme, an aggregate amount of Rs. 2.7 billion has been waived which was recoverablefrom government of India. Of the above, an amount of Rs. 773 million has been received by March 31, 2009.Correspondingly amounts of Rs. 145 million and Rs. 57 million have been written back from excessnon-performing assets provision and interest suspense account, respectively.
83

There was a reduction in general provision requirement in certain categories of standard advances as perthe Reserve Bank of India guidelines issued on November 15, 2008 as a counter-cyclical measure. While thecumulative provision requirement as per the revised rates of general provision requirement was Rs. 8.38billion at year-end fiscal 2009, we continue to hold a cumulative general provision of Rs. 14.36 billion inaccordance with the Reserve Bank of India guidelines, which does not allow reversal of excess cumulativegeneral provision held as of September 30, 2008. General provision on standard assets made in fiscal 2008 wasRs. 1.59 billion.
Tax Expense
The following table sets forth, for the periods indicated, details of tax expense computation.
Year ended March 31,
2008 2009 2009
(in millions, except percentages)
Tax at marginal rate on income ................................................... Rs. 17,185.7 Rs. 17,392.6 US$ 390AdjustmentsDifference in book and tax depreciation...................................... 1,397.1 2,260.2 51Bad debts written off ................................................................... 18,490.1 11,532.4 259Special reserve under section 36(1)(viii) ..................................... (1,680.0) (2,090.0) (47)Surplus on sale of property/assets................................................ (656.1) (175.1) (4)Dividend, exempt interest and other exempt income .................. (21,653.3) (11,154.6) (250)Capital gains on sale of capital assets ......................................... (12,659.8) (696.0) (16)Other adjustments......................................................................... 2,610.3 1,758.9 39
Net adjustments ............................................................................ (14,151.6) 1,435.8 32
Tax (savings)/outgo thereon — other than capital gains ............. (4,810.0) 488.0 11Tax on capital gains on sale of capital assets.............................. 3,319.6 52.5 1Tax (savings)/outgo ...................................................................... (1,490.4) 540.5 12Deferred taxes and other tax provisions ...................................... (7,133.6) (4,716.7) (106)Total income tax........................................................................... 8,561.7 13,216.4 297Wealth tax .................................................................................... 30.0 30.0 1Fringe benefit tax ......................................................................... 392.0 342.0 8
Total taxation................................................................................ Rs. 8,983.7 Rs. 13,588.4 US$ 305
NotesProfit before taxation ................................................................... Rs. 50,561.0 Rs. 51,169.7 US$ 1,148Marginal rates of taxz .................................................................— Other than long-term capital gains ......................................... 33.99% 33.99%— Long-term capital gains (Listed Securities Transaction Tax) . 0% 0%— Long-term capital gains (Non Securities Transaction Tax
with indexation) ...................................................................... 22.66% 22.66%— Long-term capital gains (Listed Non Securities Transaction
Tax without indexation) .......................................................... 11.33% 11.33%— Short-term capital gains (Listed Securities Transaction Tax) . 11.33% 17.00%— Short-term capital gains (Non Securities Transaction Tax) .... 33.99% 33.99%
Income tax expense (including wealth tax) increased from Rs. 8.98 billion in fiscal 2008 to Rs. 13.59billion in fiscal 2009. The effective tax expense rate increased from 17.77% in fiscal 2008 to 26.56% in fiscal2009. The effective tax expense rate increased primarily on account of change in mix of taxable profits dueto a decrease in the proportion of exempt income such as dividend and capital gains.
Financial Condition
Our total assets (including the impact of rupee depreciation on foreign currency denominated assets)decreased by 5.1% from Rs. 3,997.95 billion at year-end fiscal 2008 to Rs. 3,793.01 billion at year-end fiscal2009. Net advances decreased by 3.2% from Rs. 2,256.16 billion at year-end fiscal 2008 to Rs. 2,183.11 billion
84

at year-end fiscal 2009 primarily due to a decrease in retail advances. Net retail advances decreased by 19.3%from Rs. 1,316.63 billion at year-end fiscal 2008 to Rs. 1,062.03 billion at year-end fiscal 2009 (includingdealer financing and developer financing portfolio of Rs. 8.75 billion and Rs. 24.08 billion, respectively).Retail advances constituted 48.6% of our total net advances at year-end fiscal 2009. Net advances of overseasbranches (including offshore banking unit) decreased in US$ terms by 10.1% from US$11.9 billion at year-endfiscal 2008 to US$10.7 billion at year-end fiscal 2009. Net advances of overseas branches increased in rupeeterms on account of depreciation of the rupee relative to the US dollar. Total investments decreased by 7.5%from Rs. 1,114.54 billion at year-end fiscal 2008 to Rs. 1,030.58 billion at year-end fiscal 2009 primarily dueto a 15.5% decrease in statutory liquidity ratio investments from Rs. 750.31 billion at year-end fiscal 2008 toRs. 633.87 billion at year-end fiscal 2009, offset, in part, by an increase in other investments by 8.9% fromRs. 364.23 billion at year-end fiscal 2008 to Rs. 396.71 billion at year-end fiscal 2009 which primarilyincluded investment in international banking subsidiaries. Statutory liquidity ratio investments decreasedprimarily on account of reduction in domestic net demand and time liabilities and a reduction of 100 basispoints in statutory liquidity ratio requirement from 25.0% to 24.0% during fiscal 2009. Non-statutory liquidityratio investments included investment in security receipts in asset reconstruction companies of Rs. 32.18billion at year-end fiscal 2009. At year-end fiscal 2009, we had a gross portfolio of funded credit derivativesof Rs. 18.41 billion and non-funded credit derivatives of Rs. 38.71 billion as compared to funded creditderivatives of Rs. 12.23 billion and non-funded credit derivatives of Rs. 50.57 billion at year-end fiscal 2008.At year-end fiscal 2009, our banking subsidiaries had a gross portfolio of funded credit derivatives of Rs.15.29 billion and non-funded credit derivatives of Rs. Nil as compared to funded credit derivatives of Rs.14.84 billion and non-funded credit derivatives of Rs. 8.03 billion at year-end fiscal 2008.
Our equity share capital and reserves at year-end fiscal 2009 increased from Rs. 464.71 billion atyear-end fiscal 2008 to Rs. 495.33 billion primarily due to annual accretion to reserves out of profits. Totaldeposits decreased by 10.7% from Rs. 2,444.31 billion at year-end fiscal 2008 to Rs. 2,183.48 billion atyear-end fiscal 2009 primarily due to our conscious strategy of paying off wholesale deposits. Term depositsdecreased from Rs. 1,806.51 billion at year-end fiscal 2008 to Rs. 1,556.80 billion at year-end fiscal 2009. Oursavings account deposits increased from Rs. 390.89 billion at year-end fiscal 2008 to Rs. 410.36 billion atyear-end fiscal 2009 while current account deposits decreased from Rs. 246.91 billion at year-end fiscal 2008to Rs. 216.32 billion at year-end fiscal 2009. Borrowings (including subordinated debt) increased from Rs.867.49 billion at year-end fiscal 2008 to Rs. 931.56 billion at year-end fiscal 2009 primarily due tocapital-eligible borrowings, in the nature of subordinated debt and the impact of rupee depreciation on foreigncurrency denominated borrowings.
Critical Accounting Policies
In order to understand our financial condition and the results of operations, it is important to understandour significant accounting policies and the extent to which we use judgments and estimates in applying thosepolicies. Our accounting and reporting policies are in accordance with Indian GAAP and conform to standardaccounting practices relevant to our products and services and the businesses in which we operate. IndianGAAP requires us to make estimates and assumptions that affect the reported amounts of assets and liabilitiesas of the date of the financial statements and the reported income and expenses during the reported period.Accordingly, we use a significant amount of judgment and estimates based on assumptions for which theactual results are uncertain when we make the estimation.
We have identified three critical accounting policies: accounting for investments, provisions/write offson loans and other credit facilities and transfer and servicing of assets.
Accounting for Investments
We account for investments in accordance with the guidelines on investment classification and valuationissued by the Reserve Bank of India. We classify all our investments into categories of investments: (a) heldto maturity, (b) available for sale and (c) held for trading. Under each classification, we further categorizeinvestments into (a) government securities, (b) other approved securities, (c) shares, (d) bonds and debentures,(e) subsidiaries and joint ventures and (f) others.
Held to maturity securities are carried at their acquisition cost or at the amortized cost, if acquired at apremium over the face value. Any premium over the face value of the fixed rate and floating rate securitiesacquired is amortized over its remaining period to maturity on a constant effective yield basis and straight linebasis respectively. We also evaluate our investments for any other than temporary diminution in its value.
85

We compute the market value of our securities classified as available for sale and held for trading inaccordance with the guidelines issued by the Reserve Bank of India. We amortize the premium, if any, overthe face value of our investments in government securities classified as available for sale over the remainingperiod to maturity on a constant effective yield basis. We compute the market value of our quoted investmentsbased on the trades/quotes on recognized stock exchanges, securities general ledger account transactions, andprice list of the Reserve Bank of India or prices declared by the Primary Dealers Association of India jointlywith Fixed Income Money Market and Derivatives Association, periodically.
We compute the market value of our unquoted government securities included in the available for saleand held for trading categories in accordance with rates published by the Fixed Income Money Market andDerivatives Association.
We compute the market value of non-government securities, under the available other than those quotedon the stock exchanges, wherever linked to the yield-to-maturity rates, with a mark-up (reflecting associatedcredit risk) over the yield to maturity rates for government securities published by the Fixed Income MoneyMarket and Derivatives Association.
We mark-to-market our funded credit derivatives based on counter-party valuation quotes, or internalmodels using inputs from market sources such as Bloomberg/Reuters, counter-parties and the Fixed IncomeMoney Market and Derivatives Association
We compute the market value of our unquoted equity shares at the break up value, if the latest balancesheet is available. If such a balance sheet is not available, the unquoted equity shares are valued at Rupee 1in accordance with Reserve Bank of India guidelines.
We compute the market value of our securities, under the available for sale and held for tradingcategories, scrip-wise (that is, by individual securities) and the depreciation/appreciation is aggregated foreach category. Net appreciation in each category, if any, is ignored, as it is unrealized while net depreciationis provided for.
We account for repurchase and reverse repurchase transactions with banks and financial institutions asborrowing and lending transactions in accordance with the extant guidelines of the Reserve Bank of India. Weaccount for transactions with the Reserve Bank of India under liquidity adjustment facility as sale andpurchase transactions.
Provisions/Write-offs on Loans and Other Credit Facilities
We classify our loans into standard, substandard and doubtful assets based on the number of days anaccount is overdue. We classify non-performing loans as loss assets when we believe that the loans are nolonger collectible or the security available is below 10% of the balance outstanding. We create specificprovisions on our secured and unsecured corporate loans classified as substandard and doubtful assets at ratesprescribed by the Reserve Bank of India. Loans in the retail asset portfolio classified as substandard anddoubtful are provided for at rates prescribed by our internal policy subject to minimum provisioningrequirements set by the Reserve Bank of India. Loss assets are fully provided for. We hold specific provisionsfor retail loans that are higher than the minimum regulatory requirements. We hold specific provisions againstnon-performing loans and a general provision against standard loans.
We determine provisions for our restructured/rescheduled loans based on the diminution in the fair valueof the loan under the methodology prescribed by the Reserve Bank of India. For loans classified as substandardand doubtful assets that are restructured, we compute the diminution in fair value of the loan in addition tothe loan loss provisions.
We upgrade a restructured non-performing loan to a standard account if there has been satisfactorypayment performance for one year following the date on which the first payment of principal, or interest isdue. We upgrade all other non-performing loans to a standard account if arrears of interest and principal arefully paid by the borrower.
The Reserve Bank of India has issued separate guidelines governing the off-balance sheet exposures ofbanks. The guidelines require banks to treat only unpaid amounts due for more than 90 days under derivativescontracts as non-performing assets. Further, provisioning requirements applicable to the loan assets in thestandard asset category are applicable to banks’ derivative and gold exposures. The guidelines also requirebanks to determine their credit exposures arising from interest rate and foreign exchange derivativestransactions and gold, using the current exposure method according to the guidelines of the Reserve Bank ofIndia.
86

We also create general provisions on our standard loans based on the guidelines issued by the ReserveBank of India.
Additionally, we create provisions on individual country exposures (other than for home countryexposures). The countries are categorized into seven risk categories: insignificant, low, moderate, high, veryhigh, restricted and off-credit, and provisioning is made for those exposures exceeding 180 days on a gradedscale ranging from 0.25% to 100%. For exposures with a contractual maturity of less than 180 days, 25% ofthe provisions are required to be held. If the country exposure (net) of the Bank within respect to each countrydoes not exceed 1% of the total funded assets, no provision is required for such country exposure.
Transfer and Servicing of Assets
We transfer commercial and consumer loans through securitization transactions. The transferred loansare de-recognized and gains/losses, net of provisions, are accounted for only if we surrender the rights tobenefits specified in the loan contract. Recourse and servicing obligations are accounted for net of provisions.We measure the retained beneficial interests in the loans by allocating the carrying value of the loans betweenthe assets sold and the retained interest, based on the relative fair value at the date of the securitization.
Effective February 1, 2006, we account for any loss arising on sale immediately at the time of sale andthe profit/premium arising on account of sale is amortized which is in accordance with the Reserve Bank ofIndia guidelines.
87

BUSINESS
Overview
We are a diversified financial services group offering a wide range of banking and financial services tocorporate and retail customers through a variety of delivery channels. We are the largest private sector bankin India and the second largest bank in India, in terms of total assets. Apart from banking products andservices, we offer life and general insurance, asset management, securities brokering and private equityproducts and services through our specialized subsidiaries.
Our primary business consists of commercial banking operations for corporate and retail customers. Weprovide a range of commercial banking and project finance products and services, including loan products, feeand commission-based products and services, deposit products and foreign exchange and derivatives productsto India’s leading corporations, middle market companies and small and medium enterprises. Our commercialbanking operations for retail customers consist of retail lending and deposit taking and distribution of thirdparty investment products. We deliver our products and services through a variety of channels, including bankbranches, ATMs, call centers and the internet and mobile phones. We had a network of 2,501 branches and5,722 ATMs in India at September 30, 2010. This includes 457 branches and 131 ATMs of the Bank ofRajasthan, a private sector bank that merged with us with effect from the close of business on August 12, 2010.We also offer agricultural and rural banking products.
In our international banking operations our primary focus is on persons of Indian origin and Indianbusinesses. Our international branches and banking subsidiaries take deposits, raise borrowings and makeloans primarily to Indian companies for their overseas operations as well as for their foreign currencyrequirements in India. They also engage in advisory and syndication activities for fund-raising by Indiancompanies and their overseas operations. We currently have banking subsidiaries in the United Kingdom,Canada and Russia, branches in Singapore, Dubai, Sri Lanka, Hong Kong, Qatar, United States and Bahrainand representative offices in China, the United Arab Emirates, Bangladesh, South Africa, Malaysia, Thailandand Indonesia. Our subsidiary in the United Kingdom has established a branch in Antwerp, Belgium and abranch in Frankfurt, Germany. Our subsidiaries in the United Kingdom and Canada and our branches inBahrain, Singapore and Hong Kong have the largest share of our international assets and liabilities.
Our treasury operations include the maintenance and management of regulatory reserves, proprietarytrading in equity and fixed income and a range of foreign exchange and derivatives products and services forcorporate customers, such as forward contracts and interest rate and currency swaps. We take advantage ofmovement in markets to earn treasury income. Our international branches and subsidiaries also haveinvestments in credit derivatives, bonds of non-India financial institutions and asset backed securities.
We are also engaged in insurance, asset management, securities business and private equity fundmanagement through specialized subsidiaries. Our subsidiaries ICICI Prudential Life Insurance Company,ICICI Lombard General Insurance Company and ICICI Prudential Asset Management Company provide awide range of life and general insurance and asset management products and services to retail and corporatecustomers. ICICI Prudential Life Insurance Company was the largest private sector life insurance company inIndia during the six months ended September 30, 2010, with a market share of 9.9% based on new businesswritten (on a retail weighted received premium basis). ICICI Lombard General Insurance Company was thelargest private sector general insurance company in India during the six months ended September 30, 2010,with a market share of 10.3% in gross written premium. ICICI Prudential Asset Management Companymanages the ICICI Prudential Mutual Fund Limited, which was among the top three mutual funds in India interms of average funds under management in September 2010 with a market share of 9.8%. We cross-sell theproducts of our insurance and asset management subsidiaries and of other asset management companies to ourretail and corporate customers. Our subsidiaries ICICI Securities Limited and ICICI Securities PrimaryDealership Limited are engaged in equity underwriting and brokerage and primary dealership in governmentsecurities respectively. ICICI Securities owns icicidirect.com, a leading online brokerage platform. ICICISecurities Limited has a subsidiary in the United States, ICICI Securities Holdings Inc. which in turn has anoperating subsidiary in the United States, ICICI Securities Inc., which is engaged in brokerage services. Ourprivate equity fund management subsidiary ICICI Venture Funds Management Company manages funds thatmake private equity investments.
The Pension Fund Regulatory and Development Authority had selected ICICI Prudential Life InsuranceCompany as one of the six entities to manage the pension assets of Indian citizens (other than mandatedpension funds of government employees) under the New Pension System. The Pension Fund Regulatory and
88
Development Authority required the sponsor, ICICI Prudential Life Insurance Company, to set up a separateentity for managing such pension funds and maintain a minimum net worth of Rs. 100 million. ICICIPrudential Pension Funds Management Company Limited was thus incorporated on April 22, 2009 as a 100%subsidiary of ICICI Prudential Life Insurance Company, which in turn is our subsidiary.
Our legal name is ICICI Bank Limited but we are known commercially as ICICI Bank. We wereincorporated on January 5, 1994 under the laws of India as a limited liability corporation. The duration ofICICI Bank is unlimited. Our principal corporate office is located at ICICI Bank Towers, Bandra-KurlaComplex, Mumbai 400 051, India, our telephone number is +91 22 2653 1414 and our web site address iswww.icicibank.com. None of the contents of our and our subsidiaries’ websites are incorporated in thisoffering memorandum. Our agent for service of process in the United States is Mr. G.V.S Ramesh, JointGeneral Manager, ICICI Bank Limited, New York Branch, 500 Fifth Avenue, Suite 2830, New York, New York10110.
History
ICICI was formed in 1955 at the initiative of the World Bank, the government of India and Indianindustry representatives. The principal objective was to create a development financial institution forproviding medium-term and long-term project financing to Indian businesses. Until the late 1980s, ICICIprimarily focused its activities on project finance, providing long-term funds to a variety of industrial projects.With the liberalization of the financial sector in India in the 1990s, ICICI transformed its business from adevelopment financial institution offering only project finance to a diversified financial services provider that,along with its subsidiaries and other group companies, offered a wide variety of products and services. AsIndia’s economy became more market-oriented and integrated with the world economy, ICICI capitalized onthe new opportunities to provide a wider range of financial products and services to a broader spectrum ofclients.
ICICI Bank was incorporated in 1994 as a part of the ICICI group. ICICI Bank’s initial equity capitalwas contributed 75.0% by ICICI and 25.0% by SCICI Limited, a diversified finance and shipping financelender of which ICICI owned 19.9% at December 1996. Pursuant to the merger of SCICI into ICICI, ICICIBank became a wholly-owned subsidiary of ICICI. Effective March 10, 2001, ICICI Bank acquired Bank ofMadura, a private sector bank, in an all-stock merger.
The issue of universal banking, which in the Indian context means conversion of long-term lendinginstitutions such as ICICI into commercial banks, had been discussed at length in the late 1990s. Conversioninto a bank offered ICICI the ability to accept low-cost demand deposits and offer a wider range of productsand services, and greater opportunities for earning non-fund based income in the form of banking fees andcommissions. ICICI Bank also considered various strategic alternatives in the context of the emergingcompetitive scenario in the Indian banking industry. ICICI Bank identified a large capital base and size andscale of operations as key success factors in the Indian banking industry. In view of the benefits oftransformation into a bank and the Reserve Bank of India’s pronouncements on universal banking, ICICI andICICI Bank decided to merge.
At the time of the merger, both ICICI Bank and ICICI were publicly listed in India and on the New YorkStock Exchange. The amalgamation was approved by each of the boards of directors of ICICI, ICICI PersonalFinancial Services, ICICI Capital Services and ICICI Bank at their respective board meetings held on October25, 2001. The amalgamation was approved by ICICI Bank’s and ICICI’s shareholders at their extraordinarygeneral meetings held on January 25, 2002 and January 30, 2002, respectively. The amalgamation wasapproved by the High Court of Gujarat at Ahmedabad on March 7, 2002 and by the High Court of Judicatureat Bombay on April 11, 2002. The amalgamation was approved by the Reserve Bank of India on April 26,2002. The amalgamation became effective on May 3, 2002. The date of the amalgamation for accountingpurposes under Indian GAAP was March 30, 2002.
The Sangli Bank Limited, an unlisted private sector bank, merged with ICICI Bank with effect fromApril 19, 2007. On the date of acquisition, the Sangli Bank had over 190 branches and extension counters, totalassets of Rs. 17.60 billion, total deposits of Rs. 13.20 billion and total loans of Rs. 2.0 billion.
The Bank of Rajasthan, a listed Indian private sector bank merged with us with effect from the close ofbusiness on August 12, 2010 and we are in the process of integrating its operations with ours. At August 12,2010, the Bank of Rajasthan had total assets of Rs. 155.96 billion, deposits of Rs. 134.83 billion, loans of Rs.65.27 billion and investments of Rs. 70.96 billion. During fiscal 2010, it incurred a loss of Rs. 1.02 billion.
89

The Bank of Rajasthan was also a sponsoring entity of a regional rural bank called the Mewar AnchalikGramin Bank, with a holding of 35%. The Mewar Anchalik Gramin Bank had 58 branches with total depositsof Rs. 3.80 billion and total assets of Rs. 4.11 billion at year-end fiscal 2010. It made a profit of Rs. 17.8million in fiscal 2009 but had accumulated losses of Rs. 0.12 billion at year-end fiscal 2010.
Shareholding Structure and Relationship with the Government of India
The following table sets forth, at October 15, 2010, certain information regarding the ownership of ourequity shares.
Percentage of
total equity shares
outstanding(4)
Number of equity
shares held(4)
Government-controlled shareholders:Life Insurance Corporation of India........................................................ 9.8% 112,335,976General Insurance Corporation of India and government-owned
general insurance companies ............................................................... 2.5 28,478,689SUUTI and UTI Mutual Fund................................................................. 0.8 9,214,013Other government-controlled institutions, mutual funds, corporations
and banks ............................................................................................. 0.1 849,366Total government-controlled shareholders............................................... 13.1 150,878,044Other Indian investors:Individual domestic investors(1)(2) ........................................................... 5.6 64,091,041Mutual funds and banks (other than government-controlled mutual
funds and banks).................................................................................. 5.4 62,128,531Indian corporates and others ................................................................... 7.9 91,007,873Total other Indian investors..................................................................... 18.9 217,227,445Total Indian investors .............................................................................. 32.1 368,105,489Foreign investors:Deutsche Bank Trust Company Americas, as depositary for American
Depositary Share holders ..................................................................... 27.2 312,433,672Allamanda Investments Pvt. Limited(3) ................................................... 5.1 58,613,201Other foreign institutional investors, foreign banks, overseas corporate
bodies, foreign companies, foreign nationals, foreign institutionalinvestors and non-resident Indians(1)(2) ............................................... 35.6 408,923,388
Total foreign investors............................................................................. 67.9 779,970,261
Total ........................................................................................................ 100.0 1,148,075,750
(1) Executive officers and directors as a group held approximately 0.1% of the equity shares as of this date.
(2) No single shareholder in this group owned 5.0% or more of ICICI Bank’s equity shares as of this date.
(3) A subsidiary of Temasek Holdings Private Limited, Singapore.
(4) Shareholding as on October 15, 2010 includes shares allotted to shareholders of the erstwhile Bank of Rajasthan.
In fiscal 2006, we concluded a capital raising exercise, issuing 148,204,556 equity shares, raising a totalof Rs. 80.0 billion through a simultaneous public offering in India and American Depositary Shares offeringin the United States, with a Public Offering Without Listing of American Depositary Shares in Japan. Theoffering was priced at Rs. 498.75 per share for retail investors in India, Rs. 525 per share for other investorsin the Indian offering and US$ 26.75 per American Depositary Share. In June 2007, we undertook a capitalraising exercise through a simultaneous public offering in India and American Depositary Shares offering inthe United States resulting in aggregate the issuance of 208,497,102 equity shares (including partly paid equityshares), raising a total of Rs. 199.7 billion. The offering was priced at Rs. 890 per share for retail investorsin India, Rs. 940 per share for other investors in the Indian offering and US$ 49.25 per American DepositaryShare.
The holding of government-controlled shareholders was 13.1% at October 15, 2010 against 14.3% atOctober 16, 2009 and 12.4% at October 17, 2008. The holding of Life Insurance Corporation of India was9.8% at October 15, 2010 against 10.3% at October 16, 2009, and 8.5% at October 17, 2008.
90

We operate as an autonomous and commercial enterprise and the Indian government has never directlyheld any of our shares. We are not aware of or a party to any shareholders’ agreement or voting trust relatingto the ownership of the shares held by the government-controlled shareholders. We do not have any agreementwith our government-controlled shareholders regarding management control, voting rights, anti-dilution orany other matter. Our Articles of Association provide that the government of India is entitled, pursuant to theprovisions of guarantee agreements between the government of India and ICICI, to appoint a representativeto our board. The government of India has appointed one representative to our board. We have traditionallyinvited a representative of each of the government-controlled insurance companies that are among ourprincipal institutional shareholders, the Life Insurance Corporation of India Limited and the General InsuranceCorporation of India Limited to join our board. There is currently no representative of the Life InsuranceCorporation of India and the General Insurance Corporation of India on our board. See“Management—Directors and Executive Officers” for a discussion of the composition of our board ofdirectors.
The holding of other Indian investors was 18.9% at October 15, 2010 against 19.1% at October 16, 2009and 22.2% at October 17, 2008. The total holding of Indian investors was 32.1% at October 15, 2010 against33.4% at October 16, 2009 and 34.6% at October 17, 2008. The holding of foreign investors was 67.9% atOctober 15, 2010 against 66.6% at October 16, 2009 and 65.4% at October 17, 2008. See “Supervision andRegulation—Reserve Bank of India Regulations—Ownership Restrictions”.
Deutsche Bank Trust Company Americas holds the equity shares represented by 156 million AmericanDepositary Shares outstanding as depositary on behalf of the holders of the American Depositary Shares. TheAmerican Depositary Shares are listed on the New York Stock Exchange. Under the Indian BankingRegulation Act, no person holding shares in a banking company can exercise more than 10.0% of the totalvoting power. This means that Deutsche Bank Trust Company Americas (as depositary), which heldapproximately 27.2% of our equity shares at October 15, 2010 against 30.0% at October 16, 2009 and 28.6%at October 17, 2008 could only vote 10.0% of our equity shares, in accordance with the directions of our boardof directors. See “Overview of the Indian Financial Sector—Recent Structural Reforms—ProposedAmendments to the Banking Regulation Act”. Except as stated above, no shareholder has differential votingrights.
Strategy
The key elements of our business strategy are to:
• focus on quality growth opportunities by:
• enhancing our retail and corporate franchise in both domestic and international markets;
• increasing the proportion of current and savings account and retail term deposits in ourdomestic deposit base;
• building a rural banking franchise; and
• strengthening our insurance, asset management and securities businesses
• emphasize conservative risk management practices and enhance asset quality;
• use technology for competitive advantage; and
• attract and retain talented professionals.
Given the volatile economic environment in fiscal 2009, we focused on capital conservation, liquiditymanagement and risk containment. We tightened our lending norms, especially in the unsecured retail segmentand moderated our credit growth. We expanded our branch network with a focus on increasing our low costand retail deposit base. At the same time, we maintained a strict control on operating expenses.
In fiscal 2010, we focused on repositioning our balance sheet for the next phase of growth. We increasedthe proportion of current and savings account deposits; reduced the rate of growth of non-performing loans;continued to keep stringent control on operating expenses; and maintained a high level of capital adequacy,relative to the regulatory requirement. Our non-banking subsidiaries engaged in asset management, securitiesbrokering and life insurance have benefited from the recent stabilization and improvement in economicconditions and revival of the equity markets in India. In the near term we expect to grow our loan book bycapitalizing on selected credit segments including home loans, other secured retail loans and project financeand growing our commercial banking activities.
91

Over the last two years we have rebalanced our deposit profile, reduced costs, reduced netnon-performing loans and maintained high levels of capital adequacy. Our objective going forward will be toleverage our capital base for profitable growth, while sustaining the improvements in our deposit profile, costratios and credit quality. As we grow our businesses, meeting customer expectation on service quality will bea critical element of our strategy.
Overview of Our Products and Services
We offer products and services in the commercial banking area to corporate and retail customers, bothdomestic and international. We also undertake treasury operations and offer treasury-related products andservices to our customers. We are also engaged in insurance, asset management, securities business venturecapital and private equity fund management through specialized subsidiaries.
Commercial Banking for Retail Customers
Our commercial banking operations for retail customers consist of retail lending and deposits, creditcards, depositary share accounts, distribution of third-party investment and insurance products, other fee-basedproducts and services and the issuance of unsecured redeemable bonds.
Retail Lending Activities
Given the favorable demographics of the country and the under-penetration of retail credit, we identifiedretail credit as a key opportunity in early 2000. We capitalized on the retail opportunity offering home loans,automobile loans, commercial business loans (including primarily commercial vehicle loans), personal loans,credit cards, loans against time deposits and loans against securities. We also funded dealers who sellautomobiles, consumer durables and commercial vehicles. Our retail portfolio was Rs. 1,347.54 billionconstituting 58.6% of gross loans at year-end fiscal 2008. Due to the increase in interest rates, the tighteningof liquidity, the increase in asset prices and challenges in collections, we reduced our disbursements of retailloans, especially unsecured loans, from fiscal 2008. As a result, the retail portfolio (including developer anddealer financing) declined to Rs. 831.74 billion constituting 41.2% of gross loans at September 30, 2010.However, we continue to believe that retail credit has a robust long-term potential due to rising income levelsand expansion of the middle class. We will continue to focus on secured retail products like home loans, carloans and commercial vehicle loans. We will selectively offer unsecured products such as personal loans andcredit cards to our existing customers.
Our retail asset products are generally fixed rate products repayable in equated monthly installmentsother than our floating rate home loan portfolio, where any change in the benchmark rate to which the rate ofinterest on the loan is referenced is passed on to the borrower on the first day of the succeeding quarter orsucceeding month, as applicable. Any decrease in the rate of interest payable on floating rate home loans isgenerally effected by an acceleration of the repayment schedule, keeping the monthly installment amountunchanged. Any increase in the rate of interest payable on floating rate home loans is generally effected in thefirst instance by an extension of the repayment schedule, keeping the monthly installment amount unchanged,and based on certain criteria, by changing the monthly installment amount. See also “Risk Factors—RisksRelating to Our Business—Our banking and trading activities are particularly vulnerable to interest rate riskand volatility in interest rates could adversely affect our net interest margin, the value of our fixed incomeportfolio, our income from treasury operations, the quality of our loan portfolio and our financialperformance”.
92

The following table sets forth, at the dates indicated, breakdown of our gross (net of write-offs) retailfinance portfolio.
At March 31, At September 30,
2008 2009 2010 2010 2010
(Rupees in billions) (US$ in millions)
Home loans(1)......................................... Rs. 664.39 Rs. 575.88 Rs. 474.72 Rs. 505.90 US$ 11,353Automobile loans................................... 174.66 133.05 85.13 78.47 1,761Commercial business ............................. 203.71 164.40 136.75 125.01 2,806Two-wheeler loans ................................. 29.81 16.91 4.65 2.87 64Personal loans ........................................ 144.13 108.66 57.14 47.57 1,068Credit card receivables .......................... 96.45 90.02 59.33 53.91 1,210Loans against securities and others(2).... 34.39 13.28 13.47 18.01 404
Total retail finance portfolio ............... Rs. 1,347.54 Rs. 1,102.20 Rs. 831.19 Rs. 831.74 US$ 18,666
(1) Includes developer financing of Rs. 69.9 billion at September 30, 2010, Rs. 32.8 billion at year-end fiscal 2010 and Rs. 24.1 billionat year-end fiscal 2009.
(2) Includes dealer financing of Rs. 12.0 billion at September 30, 2010, Rs. 7.7 billion at year-end fiscal 2010 and Rs. 8.8 billion atyear-end fiscal 2009.
The proportion of personal loans and credit card receivables in the total retail portfolio was 17.9% atyear-end 2008, 18.0% at year-end 2009 and 14.0% at year-end 2010, which decreased to 12.2% at September30, 2010.
We offer retail lending products primarily in India through ICICI Bank and our wholly owned subsidiary,ICICI Home Finance Company Limited. Our home loan portfolio includes both loans for the purchase andconstruction of homes as well as loans against property. Our policies for such loans are based on certainstipulated ratios such as the loan-to-value ratio and the ratio of fixed debt obligations to a borrower’s income.The initial repayment term of such loans is 15-20 years with payments in the form of equated monthlyinstallments. We conduct a part of our housing loan business through ICICI Home Finance Company.
We also undertake retail lending activities to a very limited extent in certain of our international branchesand subsidiaries.
Lending to Small and Medium Enterprises
We have segmented offerings for the small and medium enterprises sector while adopting a cluster basedfinancing approach to fund small enterprises that have a homogeneous profile such as engineering, informationtechnology, transportation and logistics and pharmaceuticals. We also offer supply chain financing solutionsto the channel partners of corporate clients and business loans (in the form of cash credit/overdraft/term loans)to meet the working capital needs of small businesses. We are also proactively reaching out to small andmedium enterprises through various initiatives such as the small and medium enterprises CEO KnowledgeSeries—a platform to mentor and assist entrepreneurs; small and medium enterprises toolkit—an onlinebusiness and advisory resource for small and medium enterprises; and the “Emerging India Awards”—a smalland medium enterprises recognition platform.
Retail Deposits
Our retail deposit products include time deposits and savings accounts. We also offer targeted productsto specific customer segments such as high net worth individuals, defense personnel, trusts and businessmen,and have corporate salary account products. We offer current account (i.e., checking accounts for businesses)products to our small enterprises customers, who maintain balances with us. Further, we offer an internationaldebit card in association with VISA International. At September 30, 2010, we had a debit card base of over16.1 million cards, which includes 0.4 million debit cards issued by the Bank of Rajasthan.
We are currently placing enhanced emphasis on increasing our current and savings account deposit baseand improving the proportion of current and savings accounts in our total deposits. Expansion of our branchnetwork in India is a critical element of this strategy.
93

For a description of Reserve Bank of India’s regulations applicable to deposits in India and requireddeposit insurance, see “Supervision and Regulation—Reserve Bank of India’s Regulations—RegulationsRelating to Deposits” and “Supervision and Regulation—Deposit Insurance”. For more information on thetype, cost and maturity profile of our deposits, see “—Funding”.
Fee-Based Products and Services
Through our distribution network, we offer government of India savings bonds, insurance policies fromICICI Prudential Life Insurance Company and ICICI Lombard General Insurance Company and distributepublic offerings of equity shares by Indian companies. We offer several card-based products such as creditcards, debit cards, prepaid cards, travel cards and commercial cards. We also offer a variety of mutual fundproducts from ICICI Prudential Asset Management Company and other select mutual funds. We also levyservices charges on deposit accounts.
We also offer fee-based products and services including transaction banking services, documentarycredits and guarantees to small and medium enterprises.
As a depositary participant of the National Securities Depository Limited and Central DepositoryServices (India) Limited, we offer depositary share accounts to settle securities transactions in adematerialized mode. Further, we are one of the banks designated by the Reserve Bank of India for issuingapprovals to non-resident Indians and overseas corporate bodies to trade in shares and convertible debentureson the Indian stock exchanges.
Commercial Banking for Corporate Customers
We provide a range of commercial and investment banking products and services to India’s leadingcorporations and middle market companies. Our product suite includes working capital and term loanproducts, fee and commission-based products and services, deposits and foreign exchange and derivativesproducts. The Corporate Banking Group focuses on origination and coverage of all corporate clients. TheCorporate Banking Group comprises relationship and credit teams. The Investment Banking Group focuses onexecution of investment banking mandates. The Commercial Banking Group is responsible for growing thetrade services and transaction banking business through identified branches, while working closely with thecorporate relationship teams. The Global Markets Group provides foreign exchange and other treasuryproducts to corporates. The Project Finance Group focuses on origination of large project finance mandates.We seek to syndicate corporate and project financing among domestic and international banks and institutions.
Corporate Loan Portfolio
Our corporate loan portfolio consists of project and corporate finance (including structured finance andcross-border acquisition financing) and working capital financing. For further details on our loan portfolio, see“—Loan Portfolio—Loan Concentration”. For a description of our credit rating and approval system, see“—Risk Management—Credit Risk”.
Our project finance business consists principally of extending medium-term and long-term rupee andforeign currency loans to the manufacturing and infrastructure sectors. We also provide financing by way ofinvestment in marketable instruments such as fixed rate and floating rate debentures. We generally have asecurity interest and first charge on the fixed assets of the borrower.
Our working capital financing consists mainly of cash credit facilities and non-fund based facilitiesincluding letters of credit and guarantees. For more details on our credit risk procedures, see “—RiskManagement—Credit Risk”.
Fee and Commission-Based Activities
We generate fee income from our syndication, structured financing and project financing activities. Weseek to leverage our project financing and structuring skills and our relationships with companies and financialinstitutions and banks to earn fee incomes from structuring and syndication.
We offer our corporate customers a wide variety of fee and commission-based products and servicesincluding documentary credits and standby letters of credit (called guarantees in India).
94

We also offer commercial banking services such as cash management services (such as collection,payment and remittance services), escrow, trust and retention account facilities, online payment facilities,custodial services and tax collection services on behalf of the government of India and the governments ofIndian states. At September 30, 2010, total assets held in custody on behalf of our clients (mainly foreigninstitutional investors, offshore funds, overseas corporate bodies and depositary banks for GDR investors)were Rs. 1,307.70 billion. As a registered depositary participant of National Securities Depository Limited andCentral Depository Services (India) Limited, the two securities depositaries operating in India, we also provideelectronic depositary facilities to investors.
Corporate Deposits
We offer a variety of deposit products to our corporate customers including current accounts, timedeposits and certificates of deposits. For more information on the type, cost and maturity profile of ourdeposits, see “—Funding”.
Foreign Exchange and Derivatives
We provide customer specific products and services, which cater to risk hedging needs of corporates atdomestic and international locations, arising out of currency and interest rate fluctuations. The products andservices include:
Foreign Exchange Products
Products include cash, spot and forwards transactions. We offer customized hedging and tradingsolutions to clients, on the basis of their business needs. These products are offered in India and across ourinternational locations covering a number of time zones.
Retail Foreign Exchange Products
Products for retail customers include sale of currency notes, traveler’s checks and travel cards. Thesemainly cater to the segments of outbound tourism and education. We also facilitate retail inward remittancesfrom foreign geographies.
Derivatives
Products include interest rate swaps, currency swaps, options and currency futures. We run one of thelargest US dollar/Indian rupee option books in India and provide market making in interest rate and currencyderivatives in all G7 currencies.
Commercial Banking for Rural and Agricultural Customers
We believe that rural India is key to sustaining India’s current growth momentum and our rural bankingstrategy seeks to match the growing demand for financial services in rural areas. The Reserve Bank of India’sdirected lending norms also require us to lend a portion of advances to the rural and agricultural sector. See“—Loan Portfolio—Directed Lending”. We provide corporate banking products and services to corporateclients engaged in agriculture-linked businesses. We finance suppliers and vendors of corporates and mediumenterprises engaged in agriculture linked businesses. We have also strengthened our relationships withco-operatives that are constituted by farmers. We offer financial solutions to farmers, commodity traders andprocessors and to micro-finance institutions. Rural banking presents significant challenges in terms ofgeographical coverage and high unit transaction costs. See also “Risk Factors—Risks Relating to OurBusiness—Entry into new businesses or expansions of existing businesses may expose us to increased risksthat adversely affect our businesses”.
Commercial Banking for International Customers
Our strategy for growth in international markets is based on leveraging home country links, technologyand infrastructure for international expansion by capturing market share in selected international markets. Ourinternational strategy is focused on building a retail deposit franchise in geographies where we have suchlicenses, meeting the foreign currency needs of our Indian corporate clients, taking select non-India tradefinance exposures linked to imports to India, carrying out select local lending as required by regulations, andachieving the status of the preferred non-resident Indian community bank in key markets. We also seek to buildstable wholesale funding sources and strong syndication capabilities to support our corporate and investmentbanking business, and to expand private banking operations for India-centric asset classes.
95

We currently have subsidiaries in the United Kingdom, Canada and Russia, branches in the UnitedStates, Singapore, Dubai International Finance Center, Sri Lanka, Hong Kong, Qatar and Bahrain andrepresentative offices in China, United Arab Emirates, Bangladesh, South Africa, Thailand, Indonesia andMalaysia. Our subsidiary in United Kingdom has established a branch in Antwerp, Belgium and a branch inFrankfurt, Germany.
Many of the commercial banking products that we offer through our international branches andsubsidiaries, as well as to international customers from our domestic network, such as debt financing, tradefinance and letters of credit, are similar to the products offered to our customers in India. Some of the productsand services that are unique to international customers are:
• Money2India remittance services: Remittances into India increased during this decade, fromUS$14 billion in fiscal 2001 to US$ 497 billion in fiscal 2009. We recognized the remittanceopportunity early on in the decade and started offering a host of remittance services tailored tomeet the needs of diverse customer segments. Over the years we have garnered a market share ofover 15% of the migrant remittances into India. To facilitate easy transfer of funds to India, weoffer a suite of online as well as offline money transfer products as featured on our websitewww.money2India.com. These innovative, cost effective and convenient products enablenon-resident Indians to send money to any beneficiary in India with a wide choice of deliverychannels like electronic transfers to accounts with over 60,000 bank branches. The information onthe website www.money2India.com is not a part of this offering memorandum.
• TradeWay: an internet-based document collection product to provide correspondent banks accessto real-time online information on the status of their export bills collections routed through us.
• Remittance Tracker: an internet-based application that allows a correspondent bank to check on thestatus of its payment instructions and to get various information reports online.
• Offshore banking deposits: multi-currency deposit products in US dollar, pound sterling and euro.
• Foreign currency non-resident deposits: foreign currency deposits offered in six maincurrencies—US dollar, pound sterling, euro, yen, Canadian dollar and Australian dollar.
• Non-resident external fixed deposits: deposits maintained in Indian rupees.
• Non-resident external savings account: savings accounts maintained in Indian rupees.
• Non-resident ordinary savings accounts and non-resident ordinary fixed deposits.
Our international branches had total assets of Rs. 628.89 billion (net of inter-office assets) and totaladvances of Rs. 486.66 billion at September 30, 2010. Our international branches are primarily funded by debtcapital market borrowings and syndicated/bilateral loans and the volatility in the international debt capitalmarkets has constrained our debt capital market borrowings and increased our cost of funding. Given thehigher cost of borrowings in the debt capital markets, we have relied on bank/multilateral lines, deposits fromhigh net worth customers and money market borrowings to meet our re-financing requirements. There arehigher liability maturities than asset maturities in the near term in our international branches and volatility andliquidity constraints in the international markets may adversely impact our liquidity position.
Our subsidiaries in the United Kingdom and Canada are full service banks offering retail and corporatebanking services. In Canada and United Kingdom, our subsidiaries offer direct banking using the internet asthe access channel.
At September 30, 2010, ICICI Bank UK PLC had 13 branches, including one in Belgium and one inGermany and assets including cash and liquid securities, loans and advances, bonds and notes of financialinstitutions, India-linked investments and asset backed securities. Until fiscal 2008, ICICI Bank UK’s retaildeposits were primarily in the nature of demand deposits through the internet channel. As a prudent assetliability management strategy, ICICI Bank UK invested these deposits mainly into the bonds of financialinstitutions with generally strong credit ratings. Since fiscal 2009, ICICI Bank UK has focused on re-balancingits deposit base towards retail term deposits and the proportion of retail term deposits in total deposits hasincreased significantly, from 16% at March 31, 2008 to 75% at September 30, 2010. ICICI Bank UK madea net profit of US$ 17.4 million during the six months ended September 30, 2010, compared to US$ 17.5million during the six months ended September 30, 2009.
96

At September 30, 2010, ICICI Bank Canada had nine branches and assets including cash and liquidsecurities, loans and advances, federally insured mortgages, India-linked investments and asset backedsecurities. ICICI Bank Canada made a net profit of CAD 14.1 million during the six months ended September30, 2010 compared to CAD 22.7 million during the six months ended September 30, 2009.
At September 30, 2010, ICICI Bank Eurasia had one branch and total assets of US$ 274 million. ICICIBank Eurasia made a net profit of US$ 1.2 million during the six months ended September 30, 2010 comparedto a net profit of US$ 5.6 million during the six months ended September 30, 2009.
See “Risk Factors—Risks Relating to India and Other Economic and Market Risks—Financialinstability in other countries, particularly emerging market countries and countries where we have establishedoperations, could adversely affect our business and the price of our notes” and “Risk Factors—Risks Relatingto Our Business—We have experienced rapid international growth in the earlier years which has increased thecomplexity of the risks that we face”.
Delivery Channels
We deliver our products and services through a variety of channels, ranging from traditional bankbranches to ATMs, call centers and the internet.
As a part of its branch licensing conditions, the Reserve Bank of India has stipulated that at least 25.0%of our branches must be located in semi-urban and rural areas. The following table sets forth the number ofbranches broken down by area at September 30, 2010.
At September 30, 2010
Number of branches
and extension counters % of total
Metropolitan/urban .................................................................................. 1,426 57.0%Semi-urban/rural ...................................................................................... 1,075 43.0%
Total branches and extension counters ................................................ 2,501 100.0%
At September 30, 2010, we had a network of 2,501 branches and 5,722 ATMs, which includes 457deposit taking branches and 131 ATMs of the Bank of Rajasthan, which merged with us with effect from theclose of business on August 12, 2010. In addition to the deposit taking branches, the Bank of Rajasthan hassix service branches. Further, the Bank of Rajasthan was the sponsoring entity of the regional rural bankMewar Anchalik Gramin Bank, which had 58 branches at March 31, 2010.
We expect our branch network to become key points of customer acquisition and service. Accordingly,during fiscal 2011, we have changed our organization structure to provide greater empowerment to ourbranches. The branch network is expected to serve as an integrated channel for deposit mobilization andselected retail asset origination Through our website, www.icicibank.com, we offer our customers onlineaccess to account information, payment and fund transfer facilities and internet banking business for ourcorporate clients. We provide telephone banking services through our call center. At September 30, 2010, ourcall centers in India had over 3,300 workstations. We offer mobile phone banking services to our customersusing any cellular telephone service operator in India.
Investment Banking
Our investment banking operations principally consist of ICICI Bank’s treasury operations and theoperations of ICICI Securities Primary Dealership Limited and ICICI Securities Limited.
Treasury
Through our treasury operations, we seek to manage our balance sheet, including the maintenance ofrequired regulatory reserves, and to optimize profits from our trading portfolio by taking advantage of marketopportunities. Our domestic trading and securities portfolio includes our regulatory reserve portfolio, as thereis no restriction on active management of our regulatory reserve portfolio. Our treasury operations include arange of products and services for corporate and small enterprise customers, such as forward contracts andinterest rate and currency swaps, and foreign exchange products and services. See “—Commercial Bankingfor Corporate Customers—Foreign Exchange and Derivatives”.
97

Our treasury undertakes liquidity management by seeking to maintain an optimum level of liquidity andcomplying with the cash reserve ratio requirement and ensuring the smooth functioning of all our branches.We maintain a balance between interest-earning liquid assets and cash to optimize earnings and undertakereserve management by maintaining statutory reserves, including the cash reserve ratio and the statutoryliquidity ratio. Under Reserve Bank of India’s statutory liquidity ratio requirement, we are required to maintaina minimum of 25.0% of our net demand and time liabilities by way of approved securities such as governmentof India securities and state government securities. We maintain the statutory liquidity ratio through a portfolioof government of India securities that we actively manage to optimize the yield and benefit from pricemovements. Further, as a prudent liquidity management strategy, we generally maintain excess investments insecurities eligible for classification under the statutory liquidity ratio requirement. See “Supervision andRegulation—Legal Reserve Requirements”.
Further, we engage in domestic investments and foreign exchange operations from a centralized tradingfloor in Mumbai. As part of our treasury activities, we also maintain proprietary trading portfolios in domesticdebt and equity securities and in foreign currency assets. Our treasury manages our foreign currency exposuresand the foreign exchange and risk hedging derivative products offered to our customers and engages inproprietary trading in currencies. Our investment and market risk policies are approved by the board ofdirectors.
Our domestic investment portfolio is classified into three categories—held to maturity, available for saleand held for trading. Investments are classified as held to maturity subject to the current regulation issued bythe Reserve Bank of India. Investments acquired by us with the intention to trade by taking advantage of theshort-term price/interest rate movements are classified as held for trading. The investments which do not fallin the above two categories are classified as available for sale. Investments under the held for trading categoryshould be sold within 90 days; in the event of inability to sell due to adverse factors including tight liquidity,extreme volatility or a unidirectional movement in the market, the unsold securities should be shifted to theavailable for sale category. Under each category the investments are classified under (a) government securities(b) other approved securities (c) shares (d) bonds and debentures (e) subsidiaries and joint ventures and (f)others. Investments classified under the held to maturity category are not marked to market and are carried atacquisition cost, unless the acquisition cost is more than the face value, in which case the premium isamortized over the period until maturity of such securities. At September 30, 2010, 70.0% of our domesticgovernment securities and other approved securities portfolio (net of provisions) was in the held to maturitycategory. The individual securities in the available for sale category are marked to market. Investments underthis category are valued security-wise and depreciation/appreciation is aggregated for each classification. Netdepreciation, if any, is provided for. Net appreciation, if any, is ignored. The individual securities in the heldfor trading category are marked to market as in the case of those in the available for sale category. Thefollowing table sets forth, for the periods indicated, the composition of our investment portfolio.
At March 31, At September 30,
2006 2007 2008 2009 2010 2010 2010
(Rupees in billions)
(US$ in
millions)
Government andother approvedsecurities ............. Rs. 510.74 Rs. 673.68 Rs. 753.88 Rs. 633.87 Rs. 684.04 Rs. 696.99 US$ 15,642
Debentures andbonds................... 18.04 24.63 18.87 26.00 36.35 96.90 2,174
Shares ...................... 20.58 19.37 29.20 17.03 27.56 31.98 718
Others(1) .................. 166.11 194.90 312.59 353.68 460.98 536.89 12,048
Total........................ Rs. 715.47 Rs. 912.58 Rs. 1,114.54 Rs. 1,030.58 Rs. 1,208.93 Rs. 1,362.76 US$ 30,582
(1) Others include investments in subsidiaries and joint ventures, commercial paper, mutual fund units, pass through certificates,security receipts and investments outside India.
98

We have a limited gross equity portfolio of Rs. 23.54 billion at September 30, 2010. The Reserve Bankof India restricts investments by a bank in equity securities. See also “Supervision and Regulation—ReserveBank of India Regulations—Regulations relating to Investments and Capital Market Exposure Limits”.
In general, we pursue a strategy of active management of our long-term equity portfolio to maximizereturn on investment. To ensure compliance with the Securities and Exchange Board of India’s insider tradingregulations, all dealings in our equity investments in listed companies are undertaken by the equity andcorporate bonds dealing desks of our treasury, which are segregated from our other business groups as wellas the other groups and desks in the treasury, and which do not have access to unpublished price sensitiveinformation about these companies that may be available to us as a lender.
We deal in several major foreign currencies and take deposits from non-resident Indians in four majorforeign currencies. We also manage onshore accounts in foreign currencies. The foreign exchange treasurymanages our portfolio through money market and foreign exchange instruments to optimize yield andliquidity.
We provide a variety of risk management products to our corporate and small and medium enterpriseclients, including foreign currency forward contracts and currency and interest rate swaps. We control marketrisk and credit risk on our foreign exchange trading portfolio through an internal model which setscounterparty limits, stop-loss limits and limits on the loss of the entire foreign exchange trading operations andexception reporting. See also “Risk Management—Quantitative and Qualitative Disclosures About MarketRisk—Exchange Rate Risk”.
Principal Non-Banking Subsidiaries
ICICI Securities Limited
ICICI Securities Limited is engaged in equity underwriting and brokerage. ICICI Securities Limited hasan online share trading portal called icicidirect.com. The primary objective of icicidirect.com is to enableindividuals to make investments and offer a wide range of investment options by providing a seamlessstructure that integrates a customer’s bank account, demat account and trading account. The portal offersseamless access to the United States markets by tying up with a leading United States based broker. ICICISecurities Limited has a subsidiary in the US. ICICI Securities Holdings Inc., which has a subsidiary in theUS, ICICI Securities Inc., which is engaged in brokerage services. During fiscal 2009, ICICI SecuritiesHoldings Inc. completed the purchase of assets (by way of merger) of Global Investment Management, Inc.,a registered investment adviser and a New Jersey corporation with offices in Princeton, New Jersey, engagedin investment advisory activities. The business has subsequently been sold. ICICI Securities Limited made anet profit of Rs. 0.54 billion during the six months ended September 30, 2010 compared to Rs. 0.53 billionduring the six months ended September 30, 2009.
ICICI Securities Primary Dealership
ICICI Securities Primary Dealership is engaged in the primary dealership of Indian governmentsecurities. It also deals in other fixed income securities. In addition to this, it has underwriting, portfoliomanagement services, placement of debt and money market operations. ICICI Securities Primary Dealershipmade a net loss of Rs. 0.32 billion during the six months ended September 30, 2010 compared to a net profitof Rs. 0.67 billion during the six months ended September 30, 2009. The revenues of the business are directlylinked to conditions in the fixed income market.
Venture Capital and Private Equity
Our subsidiary ICICI Venture Funds Management Company Limited manages funds that provide venturecapital funding to start-up companies and private equity to a range of companies. At September 30, 2010,ICICI Venture managed or advised funds of approximately Rs. 113.72 billion. ICICI Venture made a net profitof Rs. 0.33 billion during the six months ended September 30, 2010 compared to Rs. 0.30 billion during thesix months ended September 30, 2009.
99

Asset Management
We provide asset management services through our subsidiary, ICICI Prudential Asset Management.ICICI Prudential Asset Management is a joint venture with Prudential PLC of UK. We have approximately51.0% interest in the entity. ICICI Prudential Asset Management also provides portfolio management servicesand advisory services to clients. ICICI Prudential Asset Management has also been selected for offeringinvestment management services to the Employee Provident Fund Organization. ICICI Prudential AssetManagement had average mutual fund assets under management of Rs. 697.54 billion during the month ofSeptember 2010. ICICI Prudential Asset Management made a net profit of Rs. 0.45 billion during the sixmonths ended September 30, 2010 compared to Rs. 0.67 billion during the six months ended September 30,2009.
Insurance
We provide a wide range of insurance products and services through our subsidiaries ICICI PrudentialLife Insurance Company and ICICI Lombard General Insurance Company. ICICI Prudential Life InsuranceCompany and ICICI Lombard General Insurance Company are joint ventures with Prudential PLC of UK andFairfax Financial Holdings Limited of Canada, respectively. We have approximately 74.0% interest in both ofthese entities. Subject to the amendment of foreign ownership regulations, Prudential PLC has the right toincrease its shareholding in ICICI Prudential Life Insurance Company to 49% at the market value of the sharesto be determined as mutually agreed. Laws and regulations governing insurance companies currently providethat each promoter should eventually reduce its stake to 26% following the completion of ten years from thecommencement of business by the concerned insurance company. We and Prudential PLC have agreed that ifa higher level of promoter shareholding is permitted, then this would be in the proportion of 51% being heldby us and 49% being held by Prudential PLC. See “Supervision and Regulation—Regulations GoverningInsurance Companies”. Further, we and each of our joint venture partners have a right of first refusal in casethe other partner proposes to sell its shareholding in the joint venture (other than transfer to a permittedaffiliate of the transferor).
ICICI Prudential Life Insurance Company recorded its first year of accounting profits during fiscal 2010with a net profit of Rs. 2.58 billion. ICICI Prudential Life Insurance Company made a net loss of Rs. 1.01billion during the six months ended September 30, 2010, compared to a net loss of Rs. 1.05 billion during thesix months ended September 30, 2009. After rapid growth in previous years, the life insurance market in Indiasaw a slowdown in new business in fiscal 2009 and fiscal 2010. The new business annualized premiumequivalent of ICICI Prudential Life Insurance Company increased marginally by 0.8% to Rs. 53.45 billionduring fiscal 2010 while total premium increased by 7.7% to Rs. 165.32 billion. Renewal premium increasedby 19.4% to Rs. 101.98 billion during fiscal 2010. During the six months ended September 30, 2010, the newbusiness annualized premium equivalent increased by 37.7% to Rs 25.26 billion from Rs. 18.34 billion duringthe six months ended September 30, 2009. The renewal premium during the six months ended September 30,2010 was Rs. 42.52 billion. ICICI Prudential Life Insurance Company maintained its market leadership in theprivate sector with an overall market share of about 9.9% based on retail weighted new business receivedpremium during the six months ended September 30, 2010.
ICICI Lombard General Insurance Company made a net profit of Rs. 1.44 billion during fiscal 2010 anda net profit of Rs. 1.37 billion during the six months ended September 30, 2010, compared to Rs. 0.89 billionduring the six months ended September 30, 2009. The general insurance industry continued to witness aslowdown in growth because of the de-tariffication of the general insurance industry whereby insurancepremiums were freed from price controls, resulting in a significant decline in premium rates. ICICI LombardGeneral Insurance Company recorded a total gross written premium (excluding its share of the third partyinsurance pool) of Rs. 34.32 billion in fiscal 2010 compared to Rs. 34.57 billion in fiscal 2009. During thesix months ended September 30, 2010, gross written premium (excluding its share of the third party insurancepool) was Rs. 22.09 billion compared to Rs. 16.79 billion during the six months ended September 30, 2009.ICICI Lombard General Insurance Company was the largest private general insurer with a market share ofabout 10.3% in gross written premium among all general insurance companies during the six months endedSeptember 30, 2010.
We earn commissions and fees from these subsidiaries as their distributor for sales of life and generalinsurance products.
100

Funding
Our funding operations are designed to ensure stability of funding, minimize funding costs andeffectively manage liquidity. Since the amalgamation of ICICI with ICICI Bank, the primary source ofdomestic funding has been deposits raised from both retail and corporate customers. We also raise fundsthrough short-term rupee borrowings and domestic or overseas bond offerings pursuant to specific regulatoryapprovals. Because ICICI was not allowed to raise banking deposits as a financial institution, its primarysources of funding prior to the amalgamation were retail bonds and rupee borrowings from a wide range ofinstitutional investors. ICICI also raised funds through foreign currency borrowings from commercial banksand other multilateral institutions like the Asian Development Bank and the World Bank, which wereguaranteed by the government of India. With regard to these guarantees by the government of India forpurposes of obtaining foreign currency borrowings, the government of India has, in its letter dated May 31,2007, instructed us to take steps to either repay or prepay such foreign currency borrowings for which aguarantee has been provided by the government of India or to substitute the guarantees provided by thegovernment of India with other acceptable guarantees. At September 30, 2010, our total outstandingloans/bonds that are guaranteed by the government of India were Rs. 23.96 billion, constituting 2.5% of ourtotal borrowings (including subordinated debt and preference share capital) at that date. We are evaluatingvarious options in this regard.
Our international branches fund themselves primarily from wholesale funding sources including bonds,syndicated loans, bilateral loans and inter-bank borrowings. In fiscal 2009, we bought back some of our bondsin the secondary market to capitalize on the increase in credit spreads and diminution in value of these bonds.Our subsidiaries in the United Kingdom and Canada fund themselves primarily through retail deposits.
Our deposits were Rs. 2,230.94 billion at September 30, 2010 compared to Rs. 2,020.17 billion atyear-end fiscal 2010 and Rs. 2,183.48 billion at year-end fiscal 2009. Our deposits were 57.2%, 55.6% and57.6% of our total liabilities (including capital and reserves) at September 30, 2010, at year-end fiscal 2010and at year-end fiscal 2009, respectively. Our borrowings (including subordinated debt and preference sharecapital) were 24.9%, 25.9% and 24.6% of our total liabilities (including capital and reserves) at September 30,2010, at year-end fiscal 2010 and at year-end fiscal 2009 respectively.
The following table sets forth, at the dates indicated, our outstanding deposits and the percentagecomposition for each category of deposit.
At March 31, At September 30,
2009 2010 2010
Amount % to total Amount % of total Amount % of total Amount
(Rupees in billions, except percentages)
(US$ in
billions)
Savings deposits ........ Rs. 410.36 18.8% Rs. 532.18 26.3% Rs. 632.48 28.4% US$ 14.19Other demand
deposits(1) .............. 216.32 9.9 309.98 15.4 348.57 15.6 7.82Time deposits ............ 1,556.80 71.3 1,178.01 58.3 1,249.89 56.0 28.05
Total deposits ...........Rs. 2,183.48 100.0% Rs. 2,020.17 100.0% Rs. 2,230.94 100.0% US$ 50.06
(1) Includes current account deposits.
Total deposits increased 12.8% from Rs. 1,978.32 billion at September 30, 2009 to Rs. 2,230.94 billionat September 30, 2010 (including Rs. 134.83 billion of deposits of the Bank of Rajasthan at August 12, 2010).Our savings account deposits increased by 28.2% from Rs. 493.18 billion at September 30, 2009 to Rs. 632.48billion at September 30, 2010, while other demand deposits increased by 47.6% from Rs. 236.12 billion atSeptember 30, 2009 to Rs. 348.57 billion at September 30, 2010. Time deposits increased marginally by 0.1%from Rs. 1,249.02 billion at September 30, 2009 to Rs. 1,249.89 billion at September 30, 2010.
101

The following table sets forth, for the periods indicated, the average volume (i.e., the average dailybalance) and average cost of deposits by type of deposit.
Year ended March 31, Six months ended September 30,
2009 2010 2010
Amount Cost Amount Cost Amount Cost Amount
(Rupees in billions, except percentages)
(US$ in
billions)
Interest-bearingdeposits: ...............
Savings deposits ........ Rs. 391.75 2.7% Rs. 452.49 2.8% Rs. 542.69 3.5% US$ 12.18Time deposits ............ 1,599.63 9.2 1,330.02 7.7 1,211.63 6.2% 27.19Non-interest-bearing
deposits:Other demand
deposits(2) .............. 188.76 — 188.09 — 210.42 — 4.72
Total deposits ...........Rs. 2,180.14 7.2% Rs. 1,970.60 5.8% Rs. 1,964.74 4.8% US$ 44.09
(1) Represents annualized interest expense divided by the average balances.
(2) Includes current account deposits.
Our average deposits for the six months ended September 30, 2010 were Rs. 1,964.74 billion at anaverage cost of 4.8% compared to average deposits of Rs. 1,970.60 billion at an average cost of 5.8% for fiscal2010. Our average time deposits for the six months ended September 30, 2010 were Rs. 1,211.63 billion atan average cost of 6.2% compared to average time deposits of Rs. 1,330.02 billion at an average cost of 7.7%for fiscal 2010.
The following table sets forth the maturity profile of time deposits at September 30, 2010. Non-interestbearing deposits and savings deposits can be withdrawn on demand.
Up to one year
After one year
and within
three years
After three
years Total Total
(Rupees in billions)
(US$ in
billions)
Time deposits(1) ................................. Rs. 943.09 Rs. 260.66 Rs. 46.14 Rs. 1,249.89 US$ 28.05
(1) Excludes savings deposits and non-interest bearing deposits.
The following table sets forth, for the periods indicated, average outstanding borrowings. The averagecost of borrowing is provided in the footnotes.
For the year ended March 31,
For the six months ended
September 30,
2009 2010 2010 2010
Amount Amount Amount Amount
(in billions)
Rupee borrowing(1),(2),(3)................................. Rs. 343.54 Rs. 492.40 Rs. 483.08 US$ 10.84Foreign currency borrowing(1),(4).................... Rs. 653.04 Rs. 591.88 Rs. 585.65 US$ 13.14
Total ............................................................... Rs. 996.58 Rs. 1,084.28 Rs. 1,068.73 US$ 23.98
102

(1) Averages are averages of quarterly balances at the end of March of the previous fiscal year and June, September, December andMarch of that fiscal year for fiscal 2009. For fiscal 2010 and for the six months ended September 30, 2010, the average balancesare the averages of daily balances, except averages of foreign branches which are calculated on a monthly basis.
(2) Includes publicly and privately placed bonds, borrowings from institutions and wholesale deposits such as certificate of deposits,call borrowings and repo borrowings. Does not include fixed deposits.
(3) Average cost of rupee borrowing was 10.41% for fiscal 2009, 7.07% for fiscal 2010 and 8.4% for the six months ended September30, 2010.
(4) Average cost of foreign currency borrowing was 5.01% for fiscal 2009, 4.39% for fiscal 2010 and 3.9% for the six months endedSeptember 30, 2010.
Our average borrowings were Rs. 1,068.73 billion for the six months ended September 30, 2010compared to Rs. 1,084.28 billion for fiscal 2010 and Rs. 996.58 billion for fiscal 2009.
At September 30, 2010, our outstanding capital instruments were Rs. 345.32 billion of which Rs. 28.23billion was perpetual debt included in tier I capital and Rs. 317.09 billion was included in tier II capital (ofwhich upper tier II capital was Rs. 138.55 billion). See “Supervision and Regulation—Reserve Bank of IndiaRegulations”.
Risk Management
As a financial intermediary, we are exposed to risks that are particular to our lending, transactionbanking and trading businesses and the environment within which we operate. Our goal in risk managementis to ensure that we understand, measure, monitor and manage the various risks that arise and that theorganization adheres strictly to the policies and procedures, which are established to address these risks.
The key principles underlying the risk management framework at ICICI Bank are as follows:
• The board of directors has oversight of all the risks assumed by the Bank.
• Specific committees of the board have been constituted to facilitate focused oversight of variousrisks.
• The Risk Committee reviews risk management policies in relation to various risks (includingportfolio, liquidity, interest rate, operational, investment policies and strategy and regulatoryand compliance issues in relation thereto), key risk indicators and risk profile templates(covering areas including credit risk, interest rate risk, liquidity risk, foreign exchange riskand operational risk) and the limits framework, including stress test limits for various risks.The Risk Committee also assesses our capital adequacy position, based on the risk profile ofour balance sheet and reviews the implementation status of Basel II norms.
• The Credit Committee reviews the credit quality of the major portfolios on a periodic basis,reviews developments in key industrial sectors and exposure to these sectors as well asexposure to large borrower accounts in addition to approving certain exposures as per thecredit approval authorization policy approved by the Board of Directors.
• The Audit Committee provides direction to and monitors the quality of the compliance andinternal audit function.
• The Fraud Monitoring Committee reviews frauds above certain values, suggests correctivemeasures to mitigate fraud risks and monitors the efficacy of remedial actions.
For a discussion of these and other committees, see “—Management”.
• Policies approved from time to time by the board of directors form the governing framework foreach type of risk. The business activities are undertaken within this policy framework.
• Independent groups and sub-groups have been constituted across the Bank to facilitate independentevaluation, monitoring and reporting of various risks. These groups function independently of thebusiness groups/sub-groups.
The risk management framework forms the basis for developing consistent risk principles across theBank, overseas branches and overseas banking subsidiaries.
We are primarily exposed to credit risk, market risk, liquidity risk, operational risk and reputational risk.ICICI Bank has centralized groups, the Global Risk Management Group, the Compliance Group, the CorporateLegal Group, the Financial Crime Prevention and Reputation Risk Management Group and the Internal Audit
103

Group with a mandate to identify, assess and monitor all of our principal risks in accordance with well-definedpolicies and procedures. In addition, the Credit and Treasury Middle Office Groups and the Global OperationsGroup monitor operational adherence to regulations, policies and internal approvals. The Global RiskManagement Group is further organized into the Global Credit Risk Management Group, Global Market RiskManagement Group and the Global Operational Risk Management Group. The Global Risk ManagementGroup reports to the Executive Director and Chief Financial Officer. The Credit and Treasury Middle OfficeGroups and Global Operations Group report to an Executive Director. The Compliance Group and the InternalAudit Group report to the Audit Committee of the board of directors and the Managing Director and CEO. TheCompliance and Internal Audit groups have administrative reporting to the Executive Director and ChiefFinancial Officer. These groups are independent of the business units and coordinate with representatives ofthe business units to implement our risk management methodologies.
Credit Risk
Credit risk is the risk of loss that may occur from the failure of any party to abide by the terms andconditions of any financial contract, principally the failure to make required payments of loans due to us. Inits lending operations, ICICI Bank is principally exposed to credit risk.
All credit risk related aspects are governed by the Credit and Recovery Policy (Credit Policy) approvedby the board of directors. The Credit Policy outlines the type of products that can be offered, customercategories, the targeted customer profile and the credit approval process and limits. ICICI Bank measures,monitors and manages credit risk for each borrower and at the portfolio level for non-retail borrowers. It hasa structured and standardized credit approval process, which includes a well-established procedure ofcomprehensive credit appraisal. The Country Risk Management Policy addresses the recognition,measurement, monitoring and reporting of country risk.
Corporate Approval Authorities
The Board of Directors of ICICI Bank has delegated credit approval authority to various committees,forums and individual officers under the credit approval authorization policy. The credit approvalauthorization policy is based on the level of risk and the quantum of exposure, and is designed to ensure thattransactions with higher exposure and higher levels of risk are sent to a correspondingly higherforum/committee for approval.
The Bank has established several levels of credit approval authorities for its corporate bankingactivities—the Credit Committee, the Committee of Executive Directors, the Committee of Executives and theRegional Committee. Retail credit forums and the Small and Medium Enterprises and Corporate Agriculturegroup forums have been created for the approval of retail loans and credit facilities to small and mediumenterprises and agri-based enterprises.
Corporate Credit Risk
All credit proposals (other than retail products, program lending, score-card based lending to smallenterprises and certain other specified products) are rated internally by the Global Credit Risk ManagementGroup, prior to approval by the appropriate forum. The Global Credit Risk Management Group ratesproposals, carries out industry analysis, tracks the quality of the credit portfolio and reports periodically to theCredit Committee and the Risk Committee. For non-retail exposures, the Credit Middle Office Group verifiesadherence to the terms of the approval prior to the commitment and disbursement of credit facilities. The Bankalso manages credit risk through various limit structures, which are in line with the Reserve Bank of India’sprudential guidelines. The Bank has set up various exposure limits, including the single borrower exposurelimit, the group borrower exposure limit, the industry exposure limit, the unsecured exposure limit, the longtenor exposure limit and limits on exposure to sensitive sectors such as capital markets, non-banking financialcompanies and real estate.
Risk Monitoring
ICICI Bank has put in place a risk based asset review framework and a post-approval authorizationstructure to monitor credit facilities. The frequency of asset reviews is higher for cases with higher outstandingand/or lower credit rating. Asset review is submitted to the appropriate approval authority as per theauthorization structure. For lending to corporates, small enterprises and rural and agricultural borrowers, theCredit Middle Office Group verifies adherence to the terms of the approval prior to commitment anddisbursement of credit facilities.
104

Retail Credit Risk
Independent groups and sub-groups have been constituted across ICICI Bank to facilitate theindependent evaluation, monitoring and reporting of risks. These control groups function independently of thebusiness groups. The sourcing and approval of retail credit exposures are segregated to achieve independence.The Global Credit Risk Management Group, Retail Strategy and Policy Group and credit teams are assignedcomplementary roles for effective credit risk management.
The Global Credit Risk Management Group oversees the credit risk issues for retail assets includingvetting of all credit policies/operating notes proposed for approval by the Board or forums authorized by theBoard. The group is involved in portfolio monitoring for all retail assets and suggesting and implementingpolicy changes. The Retail Strategy and Policy Group, an independent unit within retail banking, focuses oncustomer-segment specific strategies, policy formulation, portfolio tracking and monitoring, analytics, scorecard development and database management. The credit team, which is independent from the business unit,oversees the underwriting function and is organized geographically to support the retail sales and servicestructure.
ICICI Bank’s credit officers evaluate credit proposals on the basis of the operating notes approved bythe Committee of Executive Directors and the risk assessment criteria defined by the Global Credit RiskManagement Group.
Credit Risk Assessment Procedures for Corporate Loans
ICICI Bank currently has an established credit analysis procedure leading to appropriate identificationof credit risk both at the individual borrower and the portfolio level. Appropriate appraisal and credit ratingmethodologies have been established for various types of products and businesses. Internal credit ratingpractices have been internalized in the Bank and are actively used for decision making over the entire creditprocess in the corporate portfolio. The rating methodology includes a detailed analysis of the industry,business position, financials, management and projects where applicable. The credit rating process has beencertified as being compliant with ISO 9001:2008 quality management system requirements.
In order to assess the credit risk associated with any financing proposal, we assess a variety of risksrelating to the borrower and the relevant industry.
Borrower risk is evaluated by considering:
• the risks and prospects associated with the industry in which the borrower is operating (industryrisk);
• the financial position of the borrower by analyzing the quality of its financial statements, its pastfinancial performance, its financial flexibility in terms of ability to raise capital and its cash flowadequacy (financial risk);
• the borrower’s relative market position and operating efficiency (business risk); and
• the quality of management by analyzing their track record, payment record and financialconservatism (management risk).
After conducting an analysis of a specific borrower’s risk, the Global Credit Risk Management Groupassigns a credit rating to the borrower. ICICI Bank has a scale of ten ratings ranging from AAA to B, anadditional default rating of D and short-term ratings from S1 to S8. A borrower’s credit rating is a critical inputfor the credit approval process. The Bank determines the desired credit risk spread over its cost of funds byconsidering the borrower’s credit rating and the default pattern corresponding to that credit rating. Everyproposal for a financing facility is prepared by the relevant business unit and reviewed by the Global CreditRisk Management Group before being submitted for approval to the appropriate approval authority. Theapproval process for non-fund facilities is similar to that for fund-based facilities. The credit rating for everyborrower is reviewed at least annually. The Bank also reviews the ratings of all its borrowers in a particularindustry upon the occurrence of any significant event impacting that industry.
Working capital loans are generally approved for a period of 12 months. At the end of the 12 monthvalidity period, ICICI Bank reviews the loan arrangement and the credit rating of the borrower and makes adecision on whether to continue the arrangement and changes in the loan covenants as necessary.
105

Project Finance Procedures
ICICI Bank has a strong framework for the appraisal and execution of project finance transactions. ICICIBank believes that this framework creates optimal risk identification, allocation and mitigation and helpsminimize residual risk.
The project finance approval process begins with a detailed evaluation of technical, commercial,financial, marketing and management factors and the sponsor’s financial strength and experience. Once thisreview is completed, an appraisal memorandum is prepared for credit approval purposes. As part of theappraisal process, a risk matrix is generated, which identifies each of the project risks, mitigating factors andresidual risks associated with the project. The appraisal memorandum analyzes the risk matrix and establishesthe viability of the project. Typical risk mitigating factors include the commitment of stand-by funds from thesponsors to meet any cost over-runs and a conservative collateral position. After credit approval, a letter ofintent is issued to the borrower, which outlines the principal financial terms of the proposed facility, sponsorobligations, conditions precedent to disbursement, undertakings from and covenants on the borrower. Aftercompletion of all formalities by the borrower, a loan agreement is entered into with the borrower.
In addition to the above, in the case of structured project finance in areas such as infrastructure, oil, gasand petrochemicals, as a part of the due diligence process, ICICI Bank appoints consultants, whereverconsidered necessary, to advise the lenders, including technical advisors, business analysts, legal counsel andinsurance consultants. These consultants are typically internationally recognized and experienced in theirrespective fields. Risk mitigating factors in these financings include creation of debt service reserves andchanneling project revenues through a trust and retention account.
ICICI Bank’s project finance loans are generally fully secured and have full recourse to the borrower.In most cases, ICICI Bank has a security interest and first lien on all the fixed assets. Security intereststypically include property, plant and equipment as well as other tangible assets of the borrower, both presentand future. ICICI Bank’s borrowers are required to maintain comprehensive insurance on their assets wherewe are recognized as payee in the event of loss. In some cases, ICICI Bank also takes additional creditcomforts such as corporate or personal guarantees from one or more sponsors of the project or a pledge of thesponsors’ equity holding in the project company. In certain industry segments, ICICI Bank also takes a securityinterest in relevant project contracts such as concession agreements, off-take agreements and constructioncontracts as part of the security package. In limited cases, loans are also guaranteed by commercial banks.
It is ICICI Bank’s current practice to normally disburse funds after the entire project funding iscommitted and all necessary contractual arrangements have been entered into. Funds are disbursed in tranchesto pay for approved project costs as the project progresses. When ICICI Bank appoints technical and marketconsultants, they are required to monitor the project’s progress and certify all disbursements. ICICI Bank alsorequires the borrower to submit periodic reports on project implementation, including orders for machineryand equipment as well as expenses incurred. Project completion is contingent upon satisfactory operation ofthe project for a certain minimum period and, in certain cases, the establishment of debt service reserves.ICICI Bank continues to monitor the credit exposure until its loans are fully repaid.
Corporate Finance Procedures
As part of the corporate loan approval procedures, ICICI Bank carries out a detailed analysis of fundingrequirements, including normal capital expenses, long-term working capital requirements and temporaryimbalances in liquidity. ICICI Bank’s funding of long-term core working capital requirements is assessed onthe basis, among other things, of the borrower’s present and proposed level of inventory and receivables. Incase of corporate loans for other funding requirements, ICICI Bank undertakes a detailed review of thoserequirements and an analysis of cash flows. A substantial portion of ICICI Bank’s corporate finance loans aresecured by a lien over appropriate assets of the borrower.
The focus of ICICI Bank’s structured corporate finance products is on cash flow based financing. Wehave a set of distinct approval procedures to evaluate and mitigate the risks associated with such products.These procedures include:
• carrying out a detailed analysis of cash flows to forecast the amounts that will be paid and thetiming of the payments based on an exhaustive analysis of historical data;
• conducting due diligence on the underlying business systems, including a detailed evaluation of theservicing and collection procedures and the underlying contractual arrangements; and
• paying particular attention to the legal, accounting and tax issues that may impact the structure.
106

ICICI Bank’s analysis enables it to identify risks in these transactions. To mitigate risks, ICICI Bank usesvarious credit enhancement techniques, such as over-collateralization, cash collateralization, creation ofescrow accounts and debt service reserves. ICICI Bank also has a monitoring framework to enable continuousreview of the performance of such transactions.
With respect to financing for corporate mergers and acquisitions, ICICI Bank carries out detailed duediligence on the acquirer as well as the target’s business profile. The key areas covered in the appraisal processinclude:
• assessment of the industry structure in the target’s host country and the complexity of the businessoperations of the target;
• financial, legal, tax, technical due diligence (as applicable) of the target;
• appraisal of potential synergies and likelihood of their being achieved;
• assessment of the target company’s valuation by comparison with its peer group and othertransactions in the industry;
• analysis of regulatory and legal framework of the overseas geographies with regard to securitycreation, enforcement and other aspects;
• assessment of country risk aspects and the need for political insurance; and
• the proposed management structure of the target post takeover and the ability and past experienceof the acquirer in completing post merger integration.
Working Capital Finance Procedures
ICICI Bank carries out a detailed analysis of borrowers’ working capital requirements. Credit limits areestablished in accordance with the approval authorization approved by the Bank’s Board of Directors. Oncecredit limits are approved, ICICI Bank calculates the amounts that can be lent on the basis of monthlystatements provided by the borrower and the margins stipulated. Quarterly information statements are alsoobtained from borrowers to monitor the performance on a regular basis. Monthly cash flow statements areobtained where considered necessary. Any irregularity in the conduct of the account is reported to theappropriate authority on a monthly basis. Credit limits are reviewed on a periodic basis.
Working capital facilities are primarily secured by inventories, receivables and other current assets.Additionally, in certain cases, these credit facilities are secured by personal guarantees of directors, orsubordinated security interests in the tangible assets of the borrower including plant and machinery andcovered by personal guarantees of the promoters.
Credit Monitoring Procedures for Corporate Loans
Credit Middle Office Group monitors compliance with the terms and conditions for credit facilities priorto disbursement. It also reviews the completeness of documentation, creation of security and insurance policiesfor assets financed.
All borrower accounts are reviewed at least once a year.
Retail Loan Procedures
ICICI Bank’s customers for retail loans are typically middle and high-income, salaried or self-employedindividuals, and, in some cases, partnerships and corporations. Except for personal loans and credit cards,ICICI Bank requires a contribution from the borrower and its loans are secured by the asset financed.
In respect of retail loans, the Bank’s credit officers evaluate credit proposals on the basis of the operatingnotes approved by the Committee of Executive Directors and the risk assessment criteria defined by the GlobalCredit Risk Management Group. These criteria vary across product segments but typically include factors suchas the borrower’s income, the loan-to-value ratio and demographic parameters. External agencies such as fieldinvestigation agencies facilitate a comprehensive due diligence process including visits to offices and homesin the case of loans made to individual borrowers. In making its credit decisions, ICICI Bank draws uponcentralized delinquent database and reports from the Credit Information Bureau (India) Limited to review theborrower’s profile. For mortgage loans, a valuation agency or an in-house technical team carries out the
107

technical valuations. In the case of credit cards, in order to limit the scope of individual discretion, ICICI Bankhas implemented a credit-scoring program that is an automated credit approval system that assigns a creditscore to each applicant based on certain demographic attributes like income, educational background and age.The credit score then forms one of the criteria for loan evaluation.
ICICI Bank has established centralized operations to manage operating risk in the various back officeprocesses of its retail loan business except for a few operations, which are decentralized to improve turnaroundtime for customers. A separate team under the Retail Strategy and Policy Group undertakes review and auditsof credit quality and processes across different products. The Bank also has a debt services management groupstructured along various product lines and geographical locations, to manage debt recovery. The groupoperates under the guidelines of a standardized recovery process. A fraud prevention and control group hasbeen set up to manage fraud-related risks, through fraud prevention and through recovery of fraud losses. Thefraud control group evaluates various external agencies involved in the retail finance operations, includingdirect marketing associates, external verification associates and collection agencies.
Small Enterprises Loan Procedures
ICICI Bank finances small enterprises, which are defined generally as enterprises with tangible net worthless than Rs. 500 million. It includes financing dealers and vendors of companies by implementing structuresto enhance the base credit quality of the vendor/dealer. The process involves an analysis of the base creditquality of the vendor/dealer pool and an analysis of the linkages that exist between the vendor/dealer and thecompany.
We are also involved in financing based on a cluster-based approach, financing small enterprises thathave a homogeneous profile such as apparel manufacturers and manufacturers of pharmaceuticals. The riskassessment of such a cluster involves the identification of appropriate credit norms for target market, the useof scoring models for enterprises that satisfy these norms and a comprehensive appraisal of those enterpriseswhich are awarded a minimum required score in the scoring model. A detailed appraisal is performed basedon the financial as well as non-financial parameters to identify the funding needs of the enterprise. There areappropriate credit structures built in based on the assessment of each case. The group also finances smallbusinesses based on analysis of the business and financials. The assessment includes a scoring model withminimum score requirement before appraisal of these enterprises are conducted.
The risk management policy herein also involves setting up of portfolio control norms, continuousmonitoring, renewal norms as well as stringent review and exit triggers to be followed while financing suchclusters or communities.
Rural and Agricultural Loan Procedures
The rural and agricultural loan portfolio is composed of corporates in the rural sector, small and mediumenterprises, dealers and vendors linked to these entities and farmers. ICICI Bank seeks to adopt appropriaterisk assessment methodologies for each of the segments. For corporates, borrower risk is evaluated byanalyzing the industry risk, the borrower’s market position, financial performance, cash flow adequacy and thequality of management. The credit risk of dealers, vendors and farmers is evaluated by analyzing the basecredit quality of the borrowers or the pool and also the linkages between the borrowers and the companies towhich the dealers, vendors or farmers are supplying their produce. We attempt to enhance the credit qualityof the pool of dealers, vendors and farmers by strengthening the structure of the transaction.
For some segments, ICICI Bank uses a cluster-based approach wherein a lending program isimplemented for a homogeneous group of individuals or business entities that comply with certain laid downparameterized norms. To be eligible for funding under the programs, the borrowers need to meet the stipulatedcredit norms and obtain a minimum score on the scoring model. ICICI Bank has incorporated control norms,borrower approval norms and review triggers in all the programs.
ICICI Bank’s rural initiative may create additional challenges with respect to managing the risk of fraudsand credit monitoring due to the increased geographical dispersion and use of intermediaries. ICICI Bank hasput in place control structure and risk management framework to mitigate the related risk. See “RiskFactors—Risks Relating to Our Business—Entry into new businesses or expansions of existing businessesmay expose us to increased risks that may adversely affect our business”.
108

Portfolio Review
An analysis of our portfolio composition based on our internal rating is carried out and is submitted tothe Risk Committee of the Board on a quarterly basis. This facilitates the identification and analysis of trendsin the portfolio credit risk.
The Credit Committee of the Bank, apart from approving proposals, regularly reviews the credit qualityof the portfolio and various sub-portfolios, specific cases that need special attention and movement in thenon-performing assets portfolio. A detailed calendar of reviews is formulated by the Credit Committee. Thereview calendar is comprehensive covering ICICI Bank’s exposure to particular industries and the outlook forthose industries, analysis of non-performing loans, accounts under watch, overdues, incremental approvals andspecific review of each portfolio. A summary of the reviews carried out by the Credit Committee is submittedto the Board for its information.
Quantitative and Qualitative Disclosures About Market Risk
Market risk is the possibility of loss arising from changes in the value of a financial instrument as a resultof changes in market variables such as interest rates, exchange rates, credit spreads and other asset prices. Ourexposure to market risk is a function of our trading and asset-liability management activities and our role asa financial intermediary in customer-related transactions. These risks are mitigated by the limits stipulated inthe Investment Policy and Asset Liability Management Policy, which are approved and reviewed by the boardof directors.
Market Risk Management Procedures
Market risk policies include the Investment Policy and the Asset-Liability Management Policy. Thepolicies are approved by the board of directors. The Asset-Liability Management Committee stipulatesliquidity and interest rate risk limits, monitors adherence to limits, articulates the organization’s interest rateview and determines the strategy in light of the current and expected environment. The policies and processes,which provide the framework for implementing strategy, are articulated in the Asset Liability ManagementPolicy. The Investment Policy addresses issues related to investment products. The policies are designed toensure that operations in the securities, foreign exchange and derivatives areas are conducted in accordancewith sound and acceptable business practices and are as per the current regulatory guidelines, laws governingtransactions in financial securities and the financial environment. The policies contain the limit structures thatgovern transactions in financial instruments.
With regard to our treasury activities, the Board has authorized the Asset-Liability ManagementCommittee and Committee of Executive Directors (Borrowing, Treasury and Investment Operations), to actwithin the broad parameters laid down by policies approved by the Board. The Asset-Liability ManagementCommittee meets periodically and reviews the positions in domestic trading groups, international branches andbanking subsidiaries, interest rate and liquidity gap positions on the banking book, formulates a view oninterest rates, sets deposit, benchmark lending and base rates, reviews the business profile and its impact onasset liability management and determines the asset liability management strategy, as deemed fit, in light ofthe current and expected business environment.
The Global Market Risk Management Group is responsible for the identification, assessment andmitigation of risk. Risk limits including position limits and stop loss limits are monitored on a daily basis bythe Treasury Middle Office Group and reviewed periodically. Foreign exchange risk is monitored through thenet overnight open foreign exchange limit. Interest rate risk is measured through the use of repricing gapanalysis and duration analysis. ICICI Bank prepares interest rate risk reports on a fortnightly basis. Thesereports are submitted to the Reserve Bank of India on a monthly basis. Interest rate risk is further monitoredthrough interest rate risk limits approved by the Asset Liability Management Committee.
Interest Rate Risk
Our core business is deposit taking and borrowing, and lending in both Indian rupees and foreigncurrencies, as permitted by the Reserve Bank of India. These activities expose us to interest rate risk.
Our balance sheet consists of Indian rupee and foreign currency assets and liabilities, with apredominantly higher proportion of rupee-denominated assets and liabilities. Thus, movements in domesticinterest rates constitute the main source of interest rate risk. Exposure to fluctuations in interest rates ismeasured primarily by way of gap analysis, providing a static view of the maturity and repricing
109

characteristics of balance sheet positions. An interest rate gap report is prepared by classifying all assets andliabilities into various time period categories according to contracted maturities or anticipated repricing date.The difference in the amount of assets and liabilities maturing or being repriced in any time period category,gives an indication of the extent of exposure to the risk of potential changes in the margins on new or repricedassets and liabilities. ICICI Bank prepares interest rate risk reports on a fortnightly basis. These reports aresubmitted to the Reserve Bank of India on a monthly basis. Interest rate risk is further monitored throughinterest rate risk limits approved by the Asset Liability Management Committee.
Our primary source of funding is deposits and, to a smaller extent, borrowings. In the rupee market, mostof our deposit taking is at fixed rates of interest for fixed periods, except for savings account deposits andcurrent account deposits, which do not have any specified maturity and can be withdrawn on demand. Weusually borrow for a fixed period with a one-time repayment on maturity, with some borrowings havingEuropean call/put options, exercisable only on specified dates, attached to them. However, we have a mix offloating and fixed interest rate assets. Our loans are generally repaid gradually, with principal repaymentsbeing made over the life of the loan. Our housing loans at year-end fiscal 2010 were primarily floating rateloans where any change in the benchmark rate with reference to which these loans are priced, is generallypassed on to the borrower on the first day of the succeeding quarter or succeeding month, as applicable. SinceJanuary 1, 2004, we have used a single benchmark prime lending rate structure for all loans other than specificcategories of loans advised by the Indian Banks’ Association. Effective July 1, 2010, as required by theReserve Bank of India, our new loans are priced with reference to a base rate, called the ICICI Bank Base Rate.The Asset Liability Management Committee sets the ICICI Bank Base Rate based on the cost of funds, costof operations and credit charge. Pricing for all fresh approvals and renewal of facilities is linked to the ICICIBank Base Rate. The lending rates comprise ICICI Bank Base Rate, term premium and transaction-specificcredit and other charges. As specified by the Reserve Bank of India, the lending rates for loans and advancesare not permitted to be lower than the ICICI Bank Base Rate with the exception of categories loans specifiedby the Reserve Bank of India from time to time. As prescribed in the guidelines an option has been given tothe existing borrowers for migration to the base rate mechanism. Existing loans, other than cases where theborrower migrates to base rate, would continue to be linked to a benchmark as stipulated in the existing loanagreements. We generally seek to eliminate interest rate risk on undisbursed commitments by fixing interestrates on rupee loans at the time of loan disbursement. Pursuant to regulatory reserve requirements, we maintaina large part of our assets in government of India securities and in interest-free balances with the Reserve Bankof India, which are funded mainly by wholesale deposits and borrowings. This exposes us to the risk ofdifferential movement in the yield earned on statutory reserves and the related funding cost.
Almost all our foreign currency loans are floating rate loans. These loans are generally funded withfloating rate foreign currency funds in the case of our overseas branches. We generally convert all our foreigncurrency borrowings into floating rate dollar liabilities through the use of interest rate and currency swaps withleading international banks. Our overseas subsidiaries in the UK and Canada have fixed rate retail termdeposits as their prime funding sources, which reprice slowly, compared to their assets.
We use the duration of our government securities portfolio as a key variable for interest rate riskmanagement. We increase or decrease the duration of our government securities portfolio to increase ordecrease our interest rate risk exposure. In addition, we also use interest rate derivatives to manage asset andliability positions. We are an active participant in the interest rate swap market and are one of the largestcounterparties in India.
Please also see “Risk Factors—Risks Relating to Our Business—Our banking and trading activities areparticularly vulnerable to interest rate risk and volatility in interest rates could adversely affect our net interestmargin, the value of our fixed income portfolio, our income from treasury operations, the quality of our loanportfolio and our financial performance” and “Risk Factors—Risks Relating to Our Business—Our inabilityto effectively manage credit, market and liquidity risk and inaccuracy of our valuation models and accountingestimates may have an adverse effect on our earnings, capitalization, credit ratings and our cost of funds”.
110
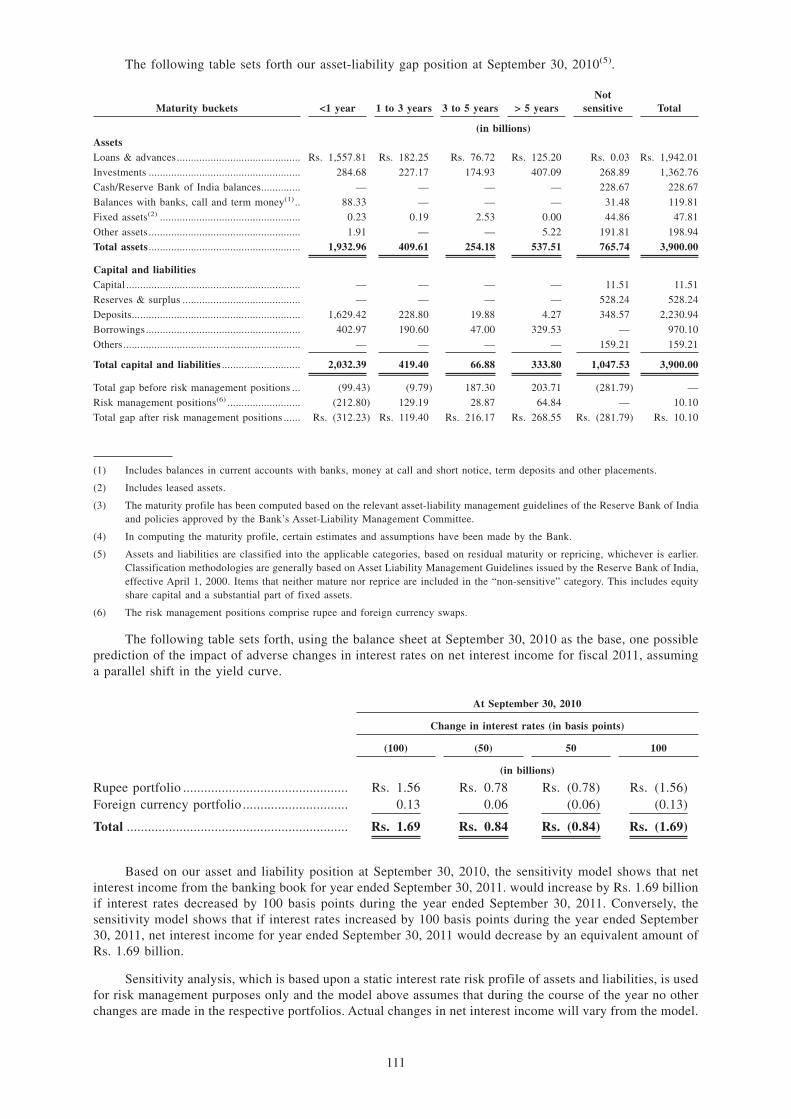
The following table sets forth our asset-liability gap position at September 30, 2010(5).
Maturity buckets <1 year 1 to 3 years 3 to 5 years > 5 yearsNot
sensitive Total
(in billions)AssetsLoans & advances............................................ Rs. 1,557.81 Rs. 182.25 Rs. 76.72 Rs. 125.20 Rs. 0.03 Rs. 1,942.01
Investments ...................................................... 284.68 227.17 174.93 407.09 268.89 1,362.76
Cash/Reserve Bank of India balances.............. — — — — 228.67 228.67
Balances with banks, call and term money(1).. 88.33 — — — 31.48 119.81
Fixed assets(2) .................................................. 0.23 0.19 2.53 0.00 44.86 47.81
Other assets ...................................................... 1.91 — — 5.22 191.81 198.94
Total assets ...................................................... 1,932.96 409.61 254.18 537.51 765.74 3,900.00
Capital and liabilitiesCapital .............................................................. — — — — 11.51 11.51
Reserves & surplus .......................................... — — — — 528.24 528.24
Deposits............................................................ 1,629.42 228.80 19.88 4.27 348.57 2,230.94
Borrowings....................................................... 402.97 190.60 47.00 329.53 — 970.10
Others............................................................... — — — — 159.21 159.21
Total capital and liabilities ............................ 2,032.39 419.40 66.88 333.80 1,047.53 3,900.00
Total gap before risk management positions ... (99.43) (9.79) 187.30 203.71 (281.79) —
Risk management positions(6) .......................... (212.80) 129.19 28.87 64.84 — 10.10
Total gap after risk management positions ...... Rs. (312.23) Rs. 119.40 Rs. 216.17 Rs. 268.55 Rs. (281.79) Rs. 10.10
(1) Includes balances in current accounts with banks, money at call and short notice, term deposits and other placements.
(2) Includes leased assets.
(3) The maturity profile has been computed based on the relevant asset-liability management guidelines of the Reserve Bank of Indiaand policies approved by the Bank’s Asset-Liability Management Committee.
(4) In computing the maturity profile, certain estimates and assumptions have been made by the Bank.
(5) Assets and liabilities are classified into the applicable categories, based on residual maturity or repricing, whichever is earlier.Classification methodologies are generally based on Asset Liability Management Guidelines issued by the Reserve Bank of India,effective April 1, 2000. Items that neither mature nor reprice are included in the “non-sensitive” category. This includes equityshare capital and a substantial part of fixed assets.
(6) The risk management positions comprise rupee and foreign currency swaps.
The following table sets forth, using the balance sheet at September 30, 2010 as the base, one possibleprediction of the impact of adverse changes in interest rates on net interest income for fiscal 2011, assuminga parallel shift in the yield curve.
At September 30, 2010
Change in interest rates (in basis points)
(100) (50) 50 100
(in billions)
Rupee portfolio ............................................... Rs. 1.56 Rs. 0.78 Rs. (0.78) Rs. (1.56)Foreign currency portfolio .............................. 0.13 0.06 (0.06) (0.13)
Total ............................................................... Rs. 1.69 Rs. 0.84 Rs. (0.84) Rs. (1.69)
Based on our asset and liability position at September 30, 2010, the sensitivity model shows that netinterest income from the banking book for year ended September 30, 2011. would increase by Rs. 1.69 billionif interest rates decreased by 100 basis points during the year ended September 30, 2011. Conversely, thesensitivity model shows that if interest rates increased by 100 basis points during the year ended September30, 2011, net interest income for year ended September 30, 2011 would decrease by an equivalent amount ofRs. 1.69 billion.
Sensitivity analysis, which is based upon a static interest rate risk profile of assets and liabilities, is usedfor risk management purposes only and the model above assumes that during the course of the year no otherchanges are made in the respective portfolios. Actual changes in net interest income will vary from the model.
111

Price Risk (Trading book)
We undertake trading activities to enhance earnings through profitable trading for our own account. Thefollowing table sets forth, using the fixed income portfolio at September 30, 2010 as the base, one possibleprediction of the impact of changes in interest rates on the value of our rupee fixed income trading portfoliofor fiscal 2011, assuming a parallel shift in yield curve.
At September 30, 2010
Change in interest rates (in basis points)
Portfolio Size (100) (50) 50 100
(in billions)
Government of India securities ......... Rs. 27.03 Rs. 1.39 Rs. 0.69 Rs. (0.69) Rs. (1.39)Corporate debt securities................... 70.00 0.29 0.14 (0.14) (0.29)
Total .................................................. Rs. 97.03 Rs. 1.68 Rs. 0.83 Rs. (0.83) Rs. (1.68)
At September 30, 2010, the total market value of our rupee fixed income trading portfolio was Rs. 97.03billion. The sensitivity model shows that if interest rates increase by 100 basis points during fiscal 2011, thevalue of this portfolio would fall by Rs. 1.68 billion. Conversely, if interest rates fell by 100 basis points duringfiscal 2011, the value of this portfolio would rise by Rs. 1.68 billion.
At September 30, 2010, the total outstanding notional principal amount of our trading interest ratederivatives portfolio was Rs. 3,694.24 billion. The sensitivity model shows that if interest rates increase by100 basis points, the value of this portfolio would rise by Rs. 2.27 billion. At September 30, 2010, the totaloutstanding notional principal amount of our trading currency derivatives (options and cross currency interestrate swaps) portfolio was Rs. 1,195.21 billion. The sensitivity model shows that if interest rates increase by100 basis points, the value of this cross currency interest rate swaps portfolio would fall by Rs. 0.98 billion.
Equity Risk
We assume equity risk both as part of our investment book and our trading book. At September 30, 2010,we had a total equity investment portfolio of Rs. 23.54 billion. In the investment book, investments in equityshares and preference shares are essentially long-term in nature. For further information on our trading andavailable for sale investments, see “—Overview of Our Products and Services—InvestmentBanking—Treasury”.
We also invest in the corpus of equity capital/venture funds, primarily those managed by our subsidiaryICICI Venture Funds Management Company. These funds invest in equity/equity linked instruments. Ourinvestments through these funds are similar in nature to other equity investments and are subject to the samerisks. In addition, they are also subject to risks in the form of changes in regulation and taxation policiesapplicable to such equity funds.
Equity risk in the trading portfolio is monitored through Value at Risk and stop loss limits as stipulatedin the Investment Policy.
Exchange Rate Risk
We offer foreign currency hedge instruments like swaps, forwards, and currency options to clients, whichare primarily banks and corporate customers. We actively use cross currency swaps, forwards, and options tohedge against exchange risks arising out of these transactions as well as against foreign currency loans thatmay be made in currencies different from the currencies of the borrowings supporting them. Some of thesetransactions, however, may not meet the hedge accounting requirements and are subject to mark to market.Trading activities in the foreign currency markets expose us to exchange rate risks. This risk is mitigated bysetting counterparty limits, stipulating daily and cumulative stop-loss limits, and engaging in exceptionreporting.
112

The Reserve Bank of India has authorized the dealing of foreign currency-rupee options by banks forhedging foreign currency exposures including hedging of balance sheet exposures. We have been offering suchproducts primarily to corporate clients and other inter-bank counterparties and are one of the largestparticipants in the currency options market accounting for a significant share of daily trading volume. All theoptions are maintained within the limits specified in the Investment Policy. The foreign exchange rate risk ismonitored through the net overnight open position limit approved by the Reserve Bank of India.
In addition, foreign currency loans are made on terms that are similar to foreign currency borrowings,thereby transferring the foreign exchange risk to the borrower.
Derivative Instruments Risk
We enter into interest rate and currency derivative transactions primarily for the purpose of hedginginterest rate and foreign exchange mismatches and also engage in trading of derivative instruments on our ownaccount. We offer various derivative products, including options and swaps, to our clients for their riskmanagement purposes. We generally do not carry market risk on client derivative positions as we coverourselves in the inter-bank market. Profits or losses on account of currency movements on these transactionsare borne by the clients. During fiscal 2009, due to high exchange rate volatility as a result of the financialcrisis, a number of clients experienced significant mark-to-market losses in derivative transactions. Onmaturity or premature termination of the derivative contracts, these mark-to-market losses became receivablesowed to us. Some clients did not pay their derivatives contract obligations to us in a timely manner and, insome instances, clients filed lawsuits to avoid payment of derivatives contract obligations entirely. See also“Risk Factors—Risks Relating to Our Business—We and our customers are exposed to fluctuations in foreignexchange rates”. In other instances, at the request of clients, we converted overdue amounts owed to us intoloans and advances.
In October 2008, the Reserve Bank of India issued guidelines requiring banks to classify derivativecontract receivables overdue for 90 days or more as non-performing assets. Pursuant to these guidelines, wereverse derivative contracts receivables in our income statement when they are overdue for 90 days or more.After reversal, any expected recovery is accounted for only on actual receipt of payment.
We pursue a variety of recovery strategies to collect receivables owed in connection with derivativecontracts. These strategies include, among other approaches, set-offs against any other payables to the sameclient, negotiated settlements, rescheduling of obligations, the exercise of rights against collateral (ifavailable) and legal redress. We select collection strategies and make assessments of collectability based onall available financial information about a client account as well as economic and legal factors that may affectour recovery efforts.
We also invest in credit derivatives through our overseas branches and banking subsidiaries. Ourderivative transactions are subject to risk of default on the underlying exposure and counterparty risk to theextent particular obligors are unable to make payments on contracts when due.
Credit Spread Risk
Credit spread risk arises out of our investments in fixed income securities and credit derivatives. Hence,volatility in the level of credit spreads would impact the value of these portfolios held by us. The portfolio ismonitored closely and risk is monitored by setting reference entity exposure limits, value-at-risk limits,counterparty limits and stipulating daily and cumulative stop-loss limits.
Liquidity Risk
Liquidity risk is the current and prospective risk arising out of an inability to meet financialcommitments as they fall due, through available cash flows or through the sale of assets at fair market value.It includes both the risk of unexpected increases in the cost of funding an asset portfolio at appropriatematurities and the risk of being unable to liquidate a position in a timely manner at a reasonable price.
The goal of liquidity risk management is to be able, even under adverse conditions, to meet all liabilityrepayments on time and to fund all investment opportunities by raising sufficient funds either by increasingliabilities or by converting assets into cash expeditiously and at reasonable cost.
113

The Bank manages liquidity risk in accordance with its asset liability management policy. This policyis framed as per the current regulatory guidelines and is approved by the board of directors. The asset liabilitypolicy is reviewed periodically to incorporate changes as required by regulatory stipulation or to realign thepolicy with changes in the economic landscape. The Asset-Liability Management Committee of the Bankformulates and reviews strategies and provides guidance for management of liquidity risk within theframework laid out in the asset liability management policy. The Asset-Liability Management Committeecomprises whole-time directors, Senior General Managers in charge of Risk, Treasury and Deputy ChiefFinancial Officer and heads of business groups. The Risk Committee of the Board oversees the Asset-LiabilityManagement Committee.
The Bank uses various tools for the measurement of liquidity risk including the statement of structuralliquidity, dynamic liquidity gap statements, liquidity ratios and stress testing through scenario analysis. Thestatement of structural liquidity is used as a standard tool for measuring and managing net fundingrequirements and the assessment of a surplus or shortfall of funds in various maturity buckets in the future.The cash flows pertaining to various assets, liabilities and off-balance sheet items are placed in different timebuckets based on their contractual or behavioral maturity. The statement of structural liquidity is preparedperiodically for the domestic and international operations of the Bank and the utilization against gap limits forvarious time buckets laid down for each bucket are reviewed by the Asset-Liability Management Committee.
The Bank also prepares dynamic liquidity statements, which in addition to scheduled cash flows, alsoconsiders the liquidity requirements pertaining to incremental business and the funding thereof. The dynamicliquidity statements are prepared in close coordination with the business groups, and cash flow projectionsbased on the statements are periodically presented to the Asset-Liability Management Committee. As a partof the stock and flow approach, the Bank also monitors various liquidity ratios, and limits are laid down forthese ratios under the asset liability management policy.
The Bank has diverse sources of liquidity to allow for flexibility in meeting funding requirements. Forthe domestic operations, current accounts and savings deposits payable on demand form a significant part ofthe Bank’s funding and the Bank is implementing its strategy to sustain and grow this segment of depositsalong with retail term deposits. These deposits are augmented by wholesale deposits, borrowings and throughthe issuance of bonds and subordinated debt from time to time. Loan maturities and sale of investments alsoprovide liquidity. The Bank holds unencumbered, high quality liquid assets to protect against stress conditions.
For domestic operations, the Bank also has the option of managing liquidity by borrowing in theinter-bank market on a short-term basis. The overnight market, which is a significant part of the inter-bankmarket, is susceptible to volatile interest rates. To limit the reliance on such volatile funding, the asset liabilitymanagement policy stipulates stringent limits for borrowing and lending in the inter-bank market. The Bankalso has access to refinancing facilities extended by the Reserve Bank of India against refinance eligible assets.
For its overseas operations, the Bank also has a well-defined borrowing program. The US dollar is thebase currency for the overseas branches of the Bank, apart from the branches where the local currency is notfreely convertible. In order to maximize the borrowings at reasonable cost, liquidity in different markets andcurrencies is targeted. The wholesale borrowings are in the form of bond issuances, syndicated loans frombanks, money market borrowings, inter-bank bilateral loans and deposits, including structured deposits. TheBank also raises refinance from banks against the buyers credit and other forms of trade assets. Those loansthat meet the Export Credit Agencies’ criteria are refinanced as per the agreements entered into with theseagencies. The Bank is also focused on increasing its share of retail deposit liabilities, in accordance with theregulatory framework in place in the host country.
We maintain prudential levels of liquid assets in the form of cash, balances with the central bank andgovernment securities. Currently, as stipulated by the regulator, banks in India are required to maintain theirstatutory liquidity ratio at a level of 25% of net demand and time liabilities and their cash reserve ratio at alevel of 6% of net demand and time liabilities. The Bank generally holds additional statutory liquidity ratioeligible securities as a proportion of net demand and time liabilities.
Further, the Bank has a board-approved liquidity stress testing framework, under which the Bankestimates its liquidity position under a range of stress scenarios. These scenarios cover bank specific andmarket-wide stress situations and have been separately designed for the domestic and international operationsof the Bank. The potential impact on profit of meeting the stress outflows under these scenarios is measuredand is subject to a stress tolerance limit specified by the board of directors. The results of liquidity stresstesting are reported to the Asset- Liability Management Committee on a monthly basis.
114

The Risk Committee of the board further approved a Liquidity Contingency Plan which lays down aframework for ongoing monitoring of potential liquidity contingencies and an action plan to meet suchcontingencies. The Liquidity Contingency Plan lays down several triggers, which are monitored on a weeklybasis and defines the protocol and responsibilities of various teams in the event of a liquidity contingency.
Similar frameworks to manage liquidity risk have been established at each of the overseas bankingsubsidiaries of the Bank addressing the risks they run and host country regulatory requirements, as applicable.
Our subsidiaries continue to be funded primarily out of term deposits, which are of tenors of one yearand above, raised from their respective local markets. Our subsidiary in the United Kingdom offers aninternet-based online savings deposit product to depositors. The total amount of such deposits at year-endfiscal 2010 was US$ 1.3 billion. These deposits are payable on demand. At present, these deposits areclassified as outflow in the less than eight days liquidity bucket as required by the Financial Services Authorityof the United Kingdom under current regulations. We deploy these funds in a portfolio of short-term moneymarket placements and marketable securities. We may face liquidity risk in case of high volumes of depositwithdrawals.
Operational Risk
Operational risk is the risk of loss resulting from inadequate or failed internal processes, people andsystems or from external events. Our rapid growth over the last few years both internationally anddomestically exposes us to a greater operational risk than banks in developed countries. Operational riskincludes legal risk but excludes strategic and reputational risks. Legal risk includes, but is not limited to,exposure to fines, penalties or punitive damages resulting from supervisory actions, as well as privatesettlements. For a discussion on our vulnerability to operational risk, see “Risk Factors—Risks Relating to OurBusiness—There is operational risk associated with financial industries which, when realized, may have anadverse impact on our business”.
The management of operational risk in the organization is governed by the Operational RiskManagement Policy approved by the board of directors. The policy is applicable across the Bank includingoverseas branches, ensuring that there is clear accountability and responsibility for management andmitigation of operational risk, developing a common understanding of operational risk, helping the businessand operation groups units to improve internal controls, thereby reducing the probability and potential impactof losses from operational risks while meeting regulatory requirements. Operational risk can result from avariety of factors, including failure to obtain proper internal authorizations, improperly documentedtransactions, failure of operational and information security procedures, computer systems, software orequipment, fraud, inadequate training and employee errors. Operational risk is sought to be mitigated bymaintaining a comprehensive system of internal controls, establishing systems and procedures to monitortransactions, maintaining key back-up procedures and undertaking regular contingency planning.
In each of the banking subsidiaries, local management is responsible for implementing operational riskmanagement framework through the operational risk management policy approved by their respective boards.
Operational Controls and Procedures in Branches
The Bank has put in place comprehensive operating manuals detailing procedures for the processing ofvarious banking transactions and the operation of the application software. Amendments to these manuals areimplemented through circulars, which are accessible to our branch employees on the company intranet. Inaddition, our branches are supported by audit and compliance, product and marketing teams. Our core bankingapplication software has multiple security features to protect the integrity of applications and data.
Transactions relating to customer accounts are processed based on built-in system checks andauthorization procedures. Cash transactions over a specified limit are subjected to enhanced scrutiny to avoidpotential money laundering.
Operational Controls and Procedures for Internet Banking
The Bank has put in place controls for transactions through internet banking including two levels ofpasswords. In addition to this, grid level authentication (a grid is a unique set of numbers printed on the debitcard) is also required. Internet transactions using credit cards require password-based authentication. Toprevent phishing and internet related fraud, the Bank regularly communicates with customers. The internet
115

banking infrastructure is secured through the multi layer information security controls, including firewalls,intrusion prevention systems and network level access controls. These are supplemented by periodicpenetration tests, vulnerability assessments and continuous security incident monitoring of internet bankingservers.
Operational Controls and Procedures in Regional Processing Centers and Central Processing Center
The Bank has centralized operations at regional processing centers located at various cities across thecountry. These regional processing centers process clearing checks and inter-branch transactions, makeinter-city check collections, and engage in back-office activities for account opening, standing instructions andauto-renewal of deposits. There are currency chests located at 32 locations in various cities across India, whichcater to replenishment of ATMs and the cash requirements of branches.
In Mumbai, centralized transaction processing is carried out on a nation-wide basis for transactionsincluding the issuance of ATM cards and personal identification number mailers, reconciliation of ATMtransactions, issue of passwords to internet banking customers, internet banking bill payments, and processingof credit card transactions. Centralized processing has also been extended to activities like the issuance ofpersonalized check books and activation of new account opening.
Operational Controls and Procedures in Treasury
The Bank has put in place a comprehensive internal control structure with respect to its treasuryoperations. The control measures include the segregation of duties between treasury front-office and treasurymiddle office, elaborate automated control procedures, continuous monitoring procedures through detailedreporting statements, and well defined code of conduct for dealers. The Bank has also set up limits in respectof treasury operations including deal-wise limits and product-wise limits. In order to mitigate the potentialmis-selling risks, if any, a labeling policy has been implemented. Similarly in order to mitigate potentialcontractual risks, if any, negotiations for deals are recorded on a voice recording system. All key processes intreasury operations are documented and approved by the Bank’s Product and Process Approval Committee.Some of the control measures include deal validation, independent confirmation, documentation, limitsmonitoring, treasury accounting, settlement, reconciliation and regulatory compliance. Middle office groupreviews the unconfirmed, unsettled deals if any, on a regular basis and follows up for timely confirmation orsettlement. There is a mechanism of escalation to senior management in case of delays in settlement orconfirmation beyond a time period. In addition to the above, concurrent and internal audits are also there inrespect of treasury operations. The control structure in our treasury operations is designed to minimize errors,prevent potential frauds, and provide early-warning signals.
Operational Controls and Procedures in Retail Asset Operations
Retail asset operations comprise, decentralized retail asset operations and central asset operations.Activities of decentralized operations include disbursement and regular banking activities. Decentralized retailasset operations support operations relating to retail asset products across the country. Disbursements are donethrough automated processes like fund transfers through the National Electronic Funds Transfer system, RealTime Gross Settlement system with sufficient internal checks. No single team has the full authority tocomplete a transaction and carry out financial reconciliation. An independent team conducts regular bankingactivity, reconciliation and publishes management reports to the senior management.
The central asset operations unit is located in Mumbai while regional operations units are located atDelhi and Chennai. These central and regional units support operations relating to retail asset products acrossthe country. The central asset operations unit carries out activities like loan accounts maintenance, accountingand reconciliation, payouts, and repayment management activities for all retail asset products.
Operational Controls and Procedures for Corporate Banking
Corporate Banking is organized into a zonal structure. The front office is responsible for sourcing clientsand performing a credit analysis of the proposal. The credit risk is independently evaluated by the RiskManagement Group. Operations regarding corporate banking products and services are supported by middleoffice and back office with well defined process ownership. The key processes and their ownership aredocumented through process notes which are reviewed periodically. The middle office conducts verificationand scrutiny of the documents and memos to ensure mitigation of post-approval risks. It also monitors
116

adherence to the terms of approval by periodically publishing compliance monitoring reports. The back officein corporate operations units is comprised of units responsible for the execution of trade finance, cashmanagement and general banking transactions based on the requests and instructions initiated throughchannels including branches.
Operational Controls and Procedures in Rural Loan Operations
Operational controls and procedures for corporate customers in rural and agricultural banking are similarto those for our other corporate customers. For other loans, duly approved disbursement requests are submittedto local operations teams where they are checked for completeness and tallied with the terms of approval,before loans are disbursed. Account reconciliation and other monitoring activities are conducted centrally byan independent team.
Anti-Money Laundering Controls
We have taken several initiatives to implement the Know Your Customer/Anti-money Laundering/Combating of Financing of Terrorism guidelines issued by the Reserve Bank of India and the rules notifiedunder Prevention of Money Laundering Act, 2002.
These initiatives include formulation of a Group Anti Money Laundering Policy with the approval of theboard of directors of the Bank which also covers our overseas branches/subsidiaries, oversight by the AuditCommittee of the board of directors on the implementation of the anti-money laundering framework,appointment of a senior level officer as Money Laundering Reporting Officer who has the day-to-dayresponsibility for implementation of the anti-money laundering framework, implementation of adequate KnowYour Customer procedures based on risk categorization of customer segments, screening of names ofcustomers with negative lists issued by the regulators and customer risk categorization for classifying thecustomers into high, medium and low risk segments. The Know Your Customer procedures are based on basicdue diligence for low risk customers, enhanced due diligence for high risk customers and simplified duediligence for small deposit accounts in terms of Reserve Bank of India guidelines.
We also adhere to the anti-money laundering reporting requirements as specified by the regulators ofrespective geographies. A dedicated anti-money laundering software has been implemented for the domesticas well as overseas operations of the Bank to facilitate the process of risk based transaction monitoring. Theanti-money laundering framework is subject to audit by the Internal Audit Department and their observationsare periodically updated to the Audit Committee. We have also taken appropriate steps to train our employeeson Know Your Customer and anti-money laundering and to create customer awareness on this subject.
Audit
The Internal Audit Group undertakes a comprehensive audit of all business groups and other functions,in accordance with a risk-based audit plan. This plan allocates audit resources based on an assessment of theoperational risks in the various businesses. The audit plan for every fiscal year is approved by the AuditCommittee.
The Internal Audit Group also has a dedicated team responsible for information technology securityaudits. The annual audit plan covers various components of information technology including applications,databases, networks and operating systems.
The Reserve Bank of India requires banks to have a process of concurrent audits at branches handlinglarge volumes, to cover a minimum of 50.0% of assets, liabilities and other exposure. We have a well definedprocess of concurrent audits, whereby external accounting firms are engaged to carry out the concurrent audits.Concurrent audits are also carried out at centralized and regional processing centers and at centralizedoperations to ensure existence of and adherence to internal controls.
The audit of overseas banking subsidiaries is carried out by a dedicated team of resident auditorsattached to the respective subsidiaries. The resident audit team functionally reports to Internal Audit Group.The audit of overseas branches and representative offices are carried out by audit teams consisting of auditorsfrom India as well as a resident auditor based at the Singapore branch. International operations outsourced toIndia are audited by a team of auditors in India.
117

Legal and Regulatory Risk
We are involved in various litigations and are subject to a wide variety of banking and financial serviceslaws and regulations in each of the jurisdictions in which we operate. We are also subject to a large numberof regulatory and enforcement authorities in each of these jurisdictions. The uncertainty of the enforceabilityof the obligations of our customers and counter-parties, including the foreclosure on collateral, creates legalrisk. Changes in laws and regulations could adversely affect us. Legal risk is higher in new areas of businesswhere the law is often untested by the courts. We seek to minimize legal risk by using stringent legaldocumentation, employing procedures designed to ensure that transactions are properly authorized andconsulting internal and external legal advisors. See “Risk Factors—Risks Relating to Our Business—We areinvolved in various litigations. Any final judgment awarding material damages against us could have amaterial adverse impact on our future financial performance, our stockholders’ equity and the price of thenotes” and “Risk Factors—Risks Relating to Our Business—Regulatory changes in India or other jurisdictionsin which we operate could adversely affect our business”.
Global Risk Management Framework
We have adopted a global risk management framework for our international banking operations,including overseas branches, offshore banking units and subsidiaries. Under this framework, our credit,investment, asset liability management and anti-money laundering policies apply to all our overseas branchesand offshore banking units, with modifications to meet local regulatory or business requirements. Thesemodifications may be made only with the approval of our board of directors. All overseas banking subsidiariesare required to adopt risk management policy frameworks to be approved by their board of directors or anappropriate committee of their board of directors, based on applicable laws and regulations as well as ourcorporate governance and risk management framework. Policies at the overseas banking subsidiaries areframed in consultation with the related groups in ICICI Bank.
The Compliance Group plays an oversight role in respect of regulatory compliance at the overseasbranches and offshore banking units. Compliance risk assessment along with the key risk indicators pertainingto our domestic and international banking operations are presented to the Risk Committee of our board ofdirectors on a quarterly basis. Management of regulatory compliance risk is considered as an integralcomponent of the governance framework at the Bank and its subsidiaries along with the internal control andenterprise-wide risk management frameworks. The Bank has therefore adopted an appropriate framework forcompliance, by formulating the Group Compliance Policy, which is approved by the board of directors and isreviewed from time to time. The Group Compliance Policy outlines a framework for identification andevaluation of the significant compliance risks, on a consolidated or Group-wide basis, in order to assess howthese risks might affect our safety and soundness.
Risk Management in Key Subsidiaries
ICICI Securities Primary Dealership is a primary dealer and has government of India securities as asignificant proportion of its portfolio. The Corporate Risk Management Group at ICICI Securities PrimaryDealership has developed comprehensive risk management policies which seek to minimize risks generatedby the activities of the organization. The Corporate Risk Management Group develops and maintains modelsto assess market risks which are constantly updated to capture the dynamic nature of the markets and in thiscapacity, participates in the evaluation and introduction of new products and business activities.
ICICI Securities Primary Dealership has constituted an internal Risk Management Committeecomprising the Managing Director and CEO and senior executives from cross-functional areas. TheCommittee debates various aspects of risk management and among other things decides risk and investmentpolicies for its various businesses and ensures compliance with regulatory guidelines on risk management aswell as with all the prudential and exposure limits set by the board of directors.
ICICI Prudential Life Insurance Company is exposed to business risks arising out of the nature ofproducts and underwriting, and market risk arising out of the investments made out of the corpus of premiumscollected and the returns guaranteed to policyholders. The risk governance structure consists of the Board,Board Risk Committee, Executive Risk Committee and its sub-committees. The risk management model of theorganization is comprised of a four stage continuous cycle: identification and assessment, measurement,monitoring and control of risks. The company has in place a risk management policy which details the strategyand procedure adopted to identify, measure, monitor and control risk at the enterprise level. To manage
118

investment risk, the company has a prudent investment strategy to optimize risk-adjusted returns. ICICIPrudential Life Insurance Company’s asset-liability management framework is designed to cushion andmitigate the investment related risks of assets. The assets under management for the unit-linked insuranceproduct portfolio, amount to over 90% of policyholders’ funds. There is minimal asset-liability mismatch riskto the linked portfolio. As part of asset-liability management for the non-linked portfolio, ICICI PrudentialLife Insurance Company manages the risk due to guaranteed returns by investing only in fixed incomeinstruments and manages the interest rate risk through monthly rebalancing of the portfolio, to manage theduration gap between assets and liabilities. In addition, for certain products, a cash flow matching strategy isalso used. For the participating portfolio, the asset allocation strategy, which includes investments in equities,is designed to achieve the twin objectives of managing base guarantees and maximizing returns. The equityportfolio is benchmarked against a market index. In addition, there are exposure limits to companies, groupsand industries. ICICI Prudential Life Insurance Company’s Insurance Risk Committee assists the ExecutiveRisk Committee in identification, measurement, monitoring and control of insurance risks like demographicand expense risks. The Operational Risk Committee assists the Executive Risk Committee in theidentification, measurement, monitoring and control of operational risks. The company categorizes operationalrisk using the Basel II framework. For mitigating operational risks, the management assesses and rates the keyrisk indicators and prepares a mitigation plan. A risk report summarizing the key risks faced by the enterpriseis placed before the Board Risk Committee on a periodic basis.
ICICI Lombard General Insurance Company is principally exposed to risks arising out of the nature ofbusiness underwritten and credit risk on its investment portfolio as well as the credit risk it carries on itsreinsurers. In respect of business risk, ICICI Lombard General Insurance always seeks to diversify itsinsurance portfolio across industry sectors and geographical regions. The company focuses on achieving abalance between the corporate and retail portfolio mix to achieve favorable claim ratio and risk diversification.The company also has the ability to limit its risk exposure by way of re-insurance arrangements. Investmentsof the company are governed by the investment policy approved by its board of directors within the normsstipulated by the Insurance Regulatory and Development Authority. The Investment Committee oversees theimplementation of this policy and reviews it periodically. Exposure to any single entity is normally restrictedto 5.0% of the portfolio and to any industry to 10.0% of the portfolio. Investments in debt instruments aregenerally restricted to instruments with a domestic credit rating of AA or higher.
Loan Portfolio
Loan Concentration
We follow a policy of portfolio diversification and evaluate our total financing exposure to a particularindustry in light of our forecasts of growth and profitability for that industry. Our Global Credit RiskManagement Group monitors all major sectors of the economy and specifically tracks industries in which wehave credit exposures. We seek to respond to any economic weakness in an industrial segment by restrictingnew credits to that industry segment and any growth in an industrial segment by increasing new credits to thatindustry segment, resulting in active portfolio management. Our policy is to limit our portfolio to anyparticular industry (other than retail loans) to 15.0% of our total exposure. Between 2003 and 2006, thebanking system as a whole saw significant expansion of retail credit, with retail loans accounting for a majorpart of overall systemic credit growth. Accordingly, during these years, we increased our financing to the retailfinance segment. Given the uncertain economic environment, we accorded priority to risk containment,liquidity management and capital conservation. In view of high asset prices and the increase in interest ratessince the second half of fiscal 2008, we followed a conscious strategy of moderation of retail disbursements,especially in the unsecured retail loans segment. At the same time, there has been an increase in demand forcredit from the corporate sector. Following this trend, our loans and advances to the retail finance segmentconstituted 41.2% of our gross loans and advances at September 30, 2010 compared to 44.4% at year-endfiscal 2010 and 49.3% at year-end fiscal 2009.
Pursuant to the guidelines of the Reserve Bank of India, our credit exposure to an individual borrowergenerally must not exceed 15.0% of our capital funds, unless the exposure is in respect of an infrastructureproject. Capital funds comprise tier I and tier II capital calculated pursuant to the guidelines of the ReserveBank of India under Indian GAAP. Credit exposure to individual borrowers may exceed the exposure normof 15.0% of our capital funds by an additional 5.0% (i.e., the aggregate exposure can be up to 20.0%) providedthe additional credit exposure is on account of infrastructure financing. Our exposure to a group of companies
119

under the same management control generally must not exceed 40.0% of our capital funds unless the exposureis in respect of an infrastructure project. The exposure to a group of companies under the same managementcontrol, including exposure to infrastructure projects, may be up to 50.0% of our capital funds. Banks may,in exceptional circumstances, with the prior approval of their boards, enhance the exposure by 5.0% of capitalfunds (i.e., the aggregate exposure can be up to 20.0% of capital funds for an individual borrower and 45.0%of capital funds for a group of companies under the same management), making appropriate disclosures intheir annual reports. Exposure for funded and non-funded credit facilities is calculated as the total committedamount or the outstanding amount whichever is higher (for term loans, as the sum of undisbursedcommitments and the outstanding amounts). Investment exposure is considered at book value. At September30, 2010, we were in compliance with these guidelines. During the six months ended September 30, 2010, ourexposure to Reliance Industries Limited exceeded the stipulated ceiling of 15.0% of capital funds. This excessexposure was duly approved by the majority of directors, with exposure remaining within 20.0% of the capitalfunds in accordance with the guidelines issued by the Reserve Bank of India.
At September 30, 2010, our largest borrower accounted for approximately 14.1% of our capital funds.The largest group of companies under the same management control accounted for approximately 30.0% ofour capital funds.
The following table sets forth, at the dates indicated, the composition of our gross loans (net ofwrite-offs).
At March 31, 2009 At March 31, 2010 At September 30, 2010
Total % of total Total % of total Total % of total Total
(in billions, except percentages)
(US$ in
millions)
Retail finance(1) .....................Rs. 1,102.20 49.3% Rs. 831.19 44.4% Rs. 831.74 41.2% US$ 18,666
Services — non-finance......... 168.05 7.5 135.21 7.2 173.45 8.6 3,893
Crude petroleum/refining andpetrochemicals ................... 142.04 6.4 132.86 7.1 146.48 7.3 3,287
Road, ports, telecom, urbandevelopment and otherinfrastructure...................... 94.62 4.2 103.94 5.5 139.12 6.9 3,122
Services — finance................ 77.68 3.5 64.56 3.4 95.70 4.7 2,148
Iron/steel and products .......... 99.14 4.4 86.26 4.6 90.41 4.5 2,029
Power ..................................... 54.19 2.4 56.49 3.0 90.33 4.5 2,027
Food and beverages ............... 53.57 2.4 61.54 3.3 50.13 2.5 1,125
Wholesale/retail trade ............ 26.29 1.2 44.47 2.4 37.56 1.9 843
Electronics and engineering... 36.17 1.6 31.54 1.7 34.95 1.7 784
Construction........................... 23.86 1.1 17.91 1.0 30.31 1.5 680
Chemical and fertilizers......... 51.83 2.3 46.27 2.5 20.29 1.0 455
Textiles................................... 17.38 0.8 19.16 1.0 20.28 1.0 455
Other industries(2) .................. 289.19 12.9 241.74 12.9 255.74 12.7 5,739
Total ......................................Rs. 2,236.21 100.0% Rs. 1,873.14 100.0% Rs. 2,016.49 100% US$ 45,253
(1) Includes home loans, automobile loans, commercial business loans, two wheeler loans, personal loans, credit cards, dealer fundingand developer financing portfolio.
(2) Other industries primarily includes automobiles, cement, drugs and pharmaceuticals, fast-moving consumer goods, gems andjewelry, manufacturing products excluding metal, metal and products (excluding iron and steel), mining and shipping etc
Our retail advances were 41.2% of our total advances at September 30, 2010 compared to 44.4% atyear-end fiscal 2010 and 49.3% at year-end fiscal 2009. Our advances to the services (non-finance sector) were8.6% of our total advances at September 30, 2010 compared to 7.2% at year-end fiscal 2010 and 7.5% atyear-end fiscal 2009. Our advances to the crude petroleum/refining and petrochemicals sector were 7.3% ofour total advances at September 30, 2010 compared to 7.1% at year-end fiscal 2010 and 6.4% at year-end fiscal2009. Our advances to the road, ports, telecom, urban development and other infrastructure sectors were 6.9%of our total advances at September 30, 2010, compared to 5.5% at year-end fiscal 2010 and 4.2% at year-endfiscal 2009.
120

Directed Lending
The Reserve Bank of India requires banks to lend to certain sectors of the economy. Such directedlending comprises priority sector lending and export credit.
Priority Sector Lending
The Reserve Bank of India guidelines require banks to lend 40.0% of their adjusted net bank credit, orthe credit equivalent amount of off balance sheet exposure, whichever is higher, to certain specified sectorscalled priority sectors. The definition of adjusted net bank credit does not include certain exemptions andincludes certain investments and is computed with reference to the outstanding amount at March 31 of theprevious year. Priority sectors include the agricultural sector, food and agri-based industries, small and microenterprises and small businesses and housing finance up to certain limits. Out of the 40.0%, banks are requiredto lend a minimum of 18.0% of their adjusted net bank credit to the agriculture sector (of which 13.5% isrequired towards direct agriculture) and the balance to certain specified sectors, including small enterprises(defined as enterprises engaged in manufacturing/production, processing and services businesses with acertain limit on investment in plant and machinery), small road and water transport operators, smallbusinesses, professional and self-employed persons, and all other service enterprises, micro credit, educationand housing loans up to Rs. 2.0 million to individuals for purchase/construction of a dwelling unit per family.
In its letter dated April 26, 2002, which granted its approval for the amalgamation, the Reserve Bank ofIndia stipulated that since the loans of the erstwhile ICICI Limited (ICICI) transferred to us were not subjectto the priority sector lending requirement, we are required to maintain priority sector lending of 50.0% of ouradjusted net bank credit on the residual portion of our advances (i.e., the portion of total advances excludingadvances of ICICI at year-end fiscal 2002, referred to as “residual adjusted net bank credit”). This additional10.0% priority sector lending requirement will apply until such time as our aggregate priority sector advancesreach a level of 40.0% of our total adjusted net bank credit. The Reserve Bank of India’s existing instructionson sub-targets under priority sector lending and eligibility of certain types of investments/funds forqualification as priority sector advances apply to us.
Any shortfall in the amount required to be lent to the priority sectors may be required to be depositedwith government sponsored Indian development banks like the National Bank for Agriculture and RuralDevelopment, the Small Industries Development Bank of India and the National Housing Bank. These depositshave a maturity of up to seven years and carry interest rates lower than market rates. At year-end fiscal 2010,total investments in such bonds were Rs. 101.10 billion. See “Supervision and Regulation—DirectedLending—Priority Sector Lending”.
As per the Reserve Bank of India guidelines, banks are also required to lend to the weaker sections10.0% of adjusted net bank credit or credit equivalent amount of off-balance sheet exposures, whichever ishigher. In order to ensure that the sub-target of lending to the weaker sections is achieved, with effect fromyear-end fiscal 2009, the Reserve Bank of India has decided to take into account the shortfall in lending toweaker sections also, as on the last reporting Friday of March of each year, for the purpose of allocatingamounts to the domestic scheduled commercial banks for contribution to the Rural Infrastructure DevelopmentFund maintained with the National Bank for Agriculture and Rural Development or funds with other financialinstitutions, as specified by the Reserve Bank of India.
ICICI Bank is required to comply with the priority sector lending requirements on the last “reportingFriday” of each fiscal year. At March 26, 2010, which was the last reporting Friday for fiscal 2010, our prioritysector loans were Rs. 626.98 billion, constituting 51.3% of our residual adjusted net bank credit against therequirement of 50.0%. At that date, qualifying agricultural loans were 18.7% of our residual adjusted net bankcredit as against the requirement of 18.0%, out of which advances to direct agriculture amounted to Rs. 173.29billion constituting 14.2% of our residual adjusted net bank credit against the requirement of 13.5%. Ouradvances to weaker sections were Rs. 56.30 billion constituting 4.6% of our residual adjusted net bank creditagainst the requirement of 10.0%.
121

The following table sets forth our priority sector loans, classified by the type of borrower, at the lastreporting Friday of fiscal 2010.
At March 26, 2010
Amount
% of total
priority sector
lending
% of residual
adjusted net
bank credit
(in billions, except percentages)
Agricultural sector(1) ....................................... Rs. 228.31 US$ 5.12 36.4% 18.7%Small enterprises(2) ......................................... 78.08 1.75 12.5% 6.4%Others including residential mortgages less
than Rs.2.0 million...................................... 320.59 7.20 51.1% 26.2%
Total ............................................................... Rs. 626.98 US$ 14.07 100.0% 51.3%
(1) Includes direct agriculture lending of Rs. 173.29 billion constituting 14.2% of our residual adjusted net bank credit against therequirement of 13.5%.
(2) Small enterprises include enterprises engaged in manufacturing/processing and whose investment in plant and machinery does notexceed Rs. 50 million and enterprises engaged in providing/rendering of services and whose investment in equipment does notexceed Rs. 20 million.
Export Credit
As part of directed lending, the Reserve Bank of India also requires banks to make loans to exportersat concessional rates of interest. Export credit is provided for pre-shipment and post-shipment requirementsof exporter borrowers in rupees and foreign currencies. At least 12.0% of a bank’s adjusted net bank credit isrequired to be in the form of export credit. This requirement is in addition to the priority sector lendingrequirement but credits extended to exporters that are small scale industries or small businesses may also meetpart of the priority sector lending requirement. The Reserve Bank of India provides export refinancing for aneligible portion of total outstanding export loans in rupee in line with the prevalent Reserve Bank of Indiaguidelines in India as amended from time to time. The interest income earned on export credits issupplemented through fees and commissions earned from these exporter customers from other fee-basedproducts and services taken by them from us, such as foreign exchange products and bill handling. AtSeptember 24, 2010 (last reporting Friday of September 2010), our export credit was Rs. 12.27 billion.
Loan Pricing
As required by the Reserve Bank of India guidelines effective July 1, 2010, ICICI Bank prices its loanswith reference to a base rate, called the ICICI Bank Base Rate. The Asset Liability Management Committeefixes the base rate based on the Bank’s current cost of funds, likely changes in the Bank’s cost of funds, marketrates, interest rate outlook and other systemic factors. Pricing for all fresh approvals and renewal of facilitiesare linked to the base rate and comprise the base rate, term premium and transaction-specific credit and othercharges. The Reserve Bank of India has also stipulated that a bank’s lending rates cannot be lower than its baserate, except for certain categories of loans as may be specified by the Reserve Bank of India from time to time.The Bank has set its base rate at 7.50% per annum payable monthly, effective July 1, 2010. As prescribed bythe Reserve Bank of India guidelines, the Bank provides an option to its existing borrowers for migrating tothe base rate linked pricing mechanism. All loans approved before July 1, 2010, and where the borrowerschoose not to migrate to the base rate mechanism, would continue to be based on earlier benchmark rateregime.
Classification of Loans
We classify our assets as performing and non-performing in accordance with the Reserve Bank of India’sguidelines. Under the Reserve Bank of India guidelines, an asset is classified as non-performing if any amountof interest or principal remains overdue for more than 90 days, in respect of term loans. In respect of overdraftor cash credit, an asset is classified as non-performing if the account remains out of order for a period of 90days and in respect of bills, if the account remains overdue for more than 90 days. Further, non-performingassets are classified into sub-standard, doubtful and loss assets based on the criteria stipulated by the ReserveBank of India. The Reserve Bank of India has separate guidelines for restructured loans. See below“—Restructured Loans”.
122

The classification of assets as per the Reserve Bank of India guidelines is detailed below.
Standard assets .................. Assets that do not disclose any problems or which do not carry more than normalrisk attached to the business are classified as standard assets.
Sub-standard assets............ Sub-standard assets comprise assets that are non-performing for a period notexceeding 12 months.
Doubtful assets .................. Doubtful assets comprise assets that are non-performing for more than 12months.
Loss assets......................... Loss assets comprise assets (i) the losses on which are identified or (ii) that areconsidered uncollectible.
Our non-performing assets include loans and advances as well as credit substitutes, which are fundedcredit exposures. In compliance with regulations governing the presentation of financial information by banks,we report only non-performing loans and advances in our financial statements.
See also “Supervision and Regulation—Reserve Bank of India Regulations—Loan Loss Provisions andNon-performing Assets—Asset Classification”.
Restructured Loans
The Reserve Bank of India has separate guidelines for restructured loans. A fully secured standard loancan be restructured by the rescheduling of principal repayments and/or the interest element, but must beseparately disclosed as a restructured loan in the year of restructuring. The diminution in the fair value of theloan, if any, measured in present value terms, is either written off or provision is made to the extent of thediminution involved. For restructured loans, provisions are made in accordance with the guidelines issued bythe Reserve Bank of India, which require that the difference between the fair value of the loan before and afterrestructuring be provided at the time of restructuring. There are certain conditions stipulated by the ReserveBank of India in order to continue to classify a restructured standard loan as a standard asset. Similarguidelines apply to sub-standard and doubtful loans. The sub-standard and doubtful loans which have beensubjected to restructuring, whether in respect of principal installment or interest amount are eligible to beupgraded to the standard category only after the specified period, i.e., a period of one year after the date whenfirst payment of interest or of principal, whichever is earlier, falls due, subject to satisfactory performanceduring the period. The restructured loans continue to be classified as such until they complete one year ofpayment in accordance with the restructured terms.
From December 2008, the Reserve Bank of India permitted banks to restructure loans classified as realestate exposures, up to June 30, 2009 while maintaining these loans as standard loans. Similarly, banks werealso permitted to undertake, for loans that were previously restructured, a second restructuring withoutdowngrading the loan to the non-performing category, up to June 30, 2009. The Reserve Bank of India alsopermitted banks to restructure as standard loans all eligible loans which met the basic criteria for restructuring,and which were classified as standard as at September 1, 2008 irrespective of their subsequent assetclassification. This was subject to the receipt by banks of an application from the borrower for restructuringthe advance on or before March 31, 2009 and implementing the restructuring package within 120 days fromthe date of receipt of the application. We classify loans as restructured in line with these guidelines.
123

Provisioning and Write-Offs
We make provisions and write-offs in accordance with the Reserve Bank of India’s guidelines; see“Supervision and Regulation—Reserve Bank of India Regulations—Loan Loss Provisions andNon-Performing Assets—Provisioning and Write-Offs”. The Reserve Bank of India guidelines on provisioningand write-offs are as described below.
Standard assets .................................... As per the Reserve Bank of India guidelines issued in September2005, banks were required to make general provision at 0.40% onstandard loans (excluding loans to the agriculture sector and to smalland medium enterprises, for which the required general provisioningrate is 0.25%). As per the Reserve Bank of India guidelines issuedin May 2006, the general provisions for personal loans, loans andadvances qualifying as capital market exposure, residential housingloans beyond Rs. 2.0 million and commercial real estate loans wasincreased to 1.00% from 0.40%.
In January 2007, the Reserve Bank of India increased theprovisioning requirement in respect of the loans to the real estatesector (excluding residential housing loans), outstanding credit cardreceivables, loans and advances qualifying as capital marketexposure, personal loans and exposures to systemically importantnon-deposit taking non-banking finance companies to 2.00%.
In November 2008, the Reserve Bank of India reinstated theprovisioning for standard assets to a uniform rate of 0.40% for alltypes of standard assets except in the case of direct advances to theagricultural and small and medium enterprise sectors, whichcontinue to attract a provisioning of 0.25% as was previously thecase. The revised norms were effective prospectively but theprovisions held by banks could not be reversed.
In November 2009, the Reserve Bank of India increased theprovisioning rate on standard assets in the commercial real estatesector to 1.0%.
Sub-standard assets.............................. A provision of 10% is required for all sub-standard assets. Anadditional provision of 10% is required for accounts that are abinitio unsecured. In April 2010, an exception was given to unsecuredinfrastructure loan accounts classified as sub-standard, which attracta provisioning of 15%.
Doubtful assets .................................... A 100% provision/write-off is required in respect of the unsecuredportion of the doubtful asset. A 100% provision is required to bemade for the secured portion of assets classified as doubtful formore than three years in a phased manner.
Loss assets ........................................... The entire asset is required to be written off or provided for.
Restructured loans ............................... Until August 27, 2008, a provision equal to the difference betweenthe present value of the future interest as per the original loanagreement and the present value of future interest on the basis ofrescheduled terms at the time of restructuring, was required to bemade.
124

For loans restructured after August 27, 2008, a provision equal tothe difference between the fair value of the loan before and afterrestructuring is required to be made. The fair value of the loanbefore restructuring is computed as the present value of cash flowsrepresenting the interest at the existing rate charged on the loanbefore restructuring and the principal. The fair value of the loanafter restructuring is computed as the present value of cash flowsrepresenting the interest at the rate charged on the loan onrestructuring and the principal. Prior to June 30, 2010, both sets ofcash flows were discounted by the Bank’s Benchmark PrimeLending Rate as on the date of restructuring plus the appropriateterm premium and credit risk premium for the borrower category onthe date of restructuring. From June 30, 2010, the discount rate iscomputed as the sum of the ICICI Base Rate, the appropriate termpremium and the credit risk premium for the borrower category
In its mid-term review of policy statement for fiscal 2009, the Reserve Bank of India has required banksto increase the total provisioning coverage ratio, including floating provisions, to 70% by September 30, 2010.In its clarification on the same, the Reserve Bank of India allowed the banks’ prudential/technical write-offto be added to both the gross non-performing assets and the provisions held in the calculation of provisioningcoverage ratio. Our provision coverage ratio at September 30, 2010 computed in accordance with the ReserveBank of India guidelines was 69.0%. The Reserve Bank of India has permitted us to achieve the stipulatedlevel of 70% provisioning coverage ratio in a phased manner by March 31, 2011.
Our Policy
ICICI Bank provides for corporate non-performing assets in line with the Reserve Bank of Indiaguidelines. ICICI Bank provides for retail non-performing assets on a bucketing basis based on days past due,subject to minimum provision requirements set by the Reserve Bank of India. Loss assets and the unsecuredportion of doubtful assets are fully provided for or written off. We hold specific provisions againstnon-performing loans and general provision against performing loans.
For restructured loans, provisions are made in accordance with the guidelines issued by the ReserveBank of India, which require that the difference between the fair value of the loan before and afterrestructuring be provided at the time of restructuring. The fair value of the loan before restructuring iscomputed as the present value of cash flows representing the interest at the existing rate charged on the loanbefore restructuring and the principal. The fair value of the loan after restructuring is computed as the presentvalue of cash flows representing the interest at the rate charged on the loan on restructuring and the principal.From June 30, 2010 the discount rate is computed as the sum of the ICICI Base Rate, the appropriate termpremium and the credit risk premium for the borrower category on the date of restructuring. For loansrestructured prior to August 27, 2008, a provision equal to the difference between the present value of thefuture interest as per the original loan agreement and the present value of future interest on the basis ofrescheduled terms at the time of restructuring, was required to be made.
Impact of Economic Environment on Commercial and Consumer Loan Borrowers
In the late 1990s, increased domestic competition due to the opening up of the Indian economy, highlevels of debt relative to equity and a downturn in the commodities markets globally led to stress on theoperating performance of Indian businesses, impairment of a significant amount of assets in the financialsystem and approval of restructuring programs for a large number of companies. This led to an increase in thelevel of restructured and non-performing loans in the Indian financial system, including us, from fiscal 2001to fiscal 2004. While restructured and non-performing loans subsequently declined, the deterioration in theglobal economic environment during fiscal 2009, in particular following the bankruptcy of Lehman Brothersin September 2008, adversely impacted the operations of several Indian companies. Indian businesses wereimpacted by the lack of access to financing/refinancing from global debt capital markets, losses on existinginventories due to the sharp decline in commodity prices, reduction in demand for and prices of output andreduction in cash accruals and profitability. This led to additional restructuring of loans in the Indian bankingsystem, including ours.
From fiscal 2002, we rapidly grew our retail loan portfolio based on the untapped potential in residentialmortgages and other retail credit products in the Indian market. These included credit cards and unsecuredpersonal loans. The Indian retail credit market expanded rapidly from fiscal 2002 to fiscal 2007 driven by
125
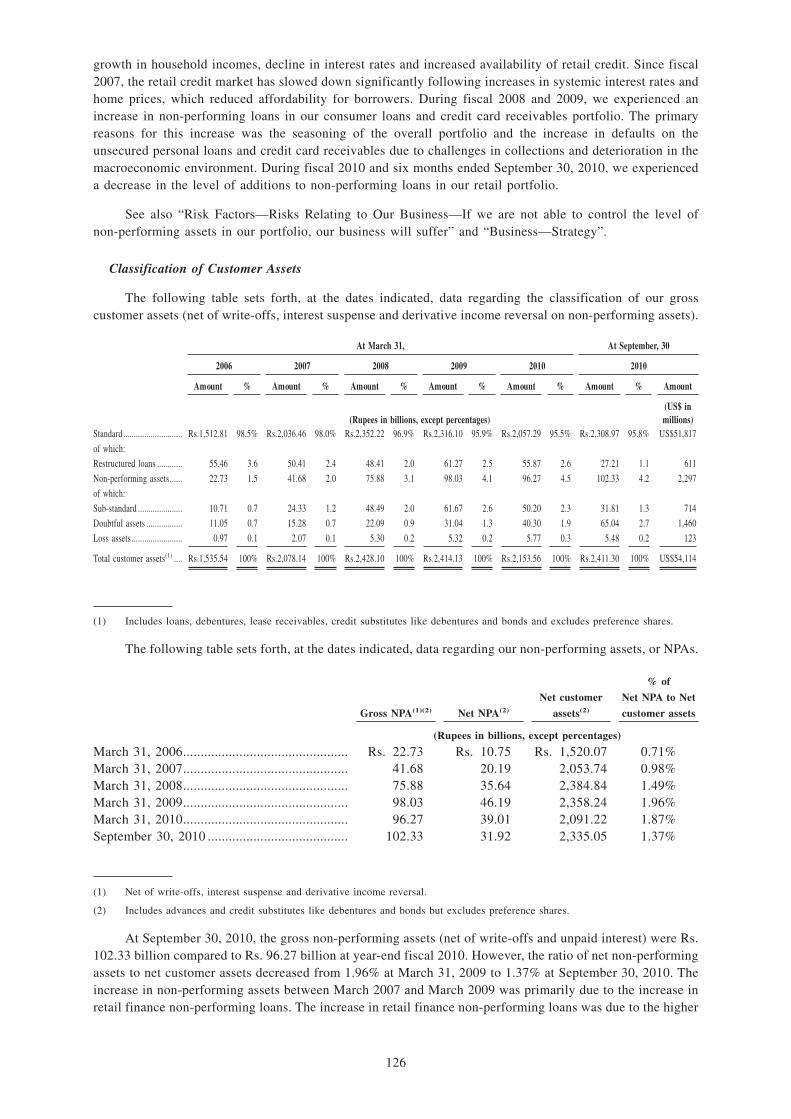
growth in household incomes, decline in interest rates and increased availability of retail credit. Since fiscal2007, the retail credit market has slowed down significantly following increases in systemic interest rates andhome prices, which reduced affordability for borrowers. During fiscal 2008 and 2009, we experienced anincrease in non-performing loans in our consumer loans and credit card receivables portfolio. The primaryreasons for this increase was the seasoning of the overall portfolio and the increase in defaults on theunsecured personal loans and credit card receivables due to challenges in collections and deterioration in themacroeconomic environment. During fiscal 2010 and six months ended September 30, 2010, we experienceda decrease in the level of additions to non-performing loans in our retail portfolio.
See also “Risk Factors—Risks Relating to Our Business—If we are not able to control the level ofnon-performing assets in our portfolio, our business will suffer” and “Business—Strategy”.
Classification of Customer Assets
The following table sets forth, at the dates indicated, data regarding the classification of our grosscustomer assets (net of write-offs, interest suspense and derivative income reversal on non-performing assets).
At March 31, At September, 30
2006 2007 2008 2009 2010 2010
Amount % Amount % Amount % Amount % Amount % Amount % Amount
(Rupees in billions, except percentages)(US$ inmillions)
Standard............................ Rs.1,512.81 98.5% Rs.2,036.46 98.0% Rs.2,352.22 96.9% Rs.2,316.10 95.9% Rs.2,057.29 95.5% Rs.2,308.97 95.8% US$51,817
of which:
Restructured loans ............ 55.46 3.6 50.41 2.4 48.41 2.0 61.27 2.5 55.87 2.6 27.21 1.1 611
Non-performing assets...... 22.73 1.5 41.68 2.0 75.88 3.1 98.03 4.1 96.27 4.5 102.33 4.2 2,297
of which:
Sub-standard ..................... 10.71 0.7 24.33 1.2 48.49 2.0 61.67 2.6 50.20 2.3 31.81 1.3 714
Doubtful assets ................. 11.05 0.7 15.28 0.7 22.09 0.9 31.04 1.3 40.30 1.9 65.04 2.7 1,460
Loss assets ........................ 0.97 0.1 2.07 0.1 5.30 0.2 5.32 0.2 5.77 0.3 5.48 0.2 123
Total customer assets(1) .... Rs.1,535.54 100% Rs.2,078.14 100% Rs.2,428.10 100% Rs.2,414.13 100% Rs.2,153.56 100% Rs.2,411.30 100% US$54,114
(1) Includes loans, debentures, lease receivables, credit substitutes like debentures and bonds and excludes preference shares.
The following table sets forth, at the dates indicated, data regarding our non-performing assets, or NPAs.
Gross NPA(1)(2) Net NPA(2)
Net customer
assets(2)
% of
Net NPA to Net
customer assets
(Rupees in billions, except percentages)
March 31, 2006............................................... Rs. 22.73 Rs. 10.75 Rs. 1,520.07 0.71%March 31, 2007............................................... 41.68 20.19 2,053.74 0.98%March 31, 2008............................................... 75.88 35.64 2,384.84 1.49%March 31, 2009............................................... 98.03 46.19 2,358.24 1.96%March 31, 2010............................................... 96.27 39.01 2,091.22 1.87%September 30, 2010 ........................................ 102.33 31.92 2,335.05 1.37%
(1) Net of write-offs, interest suspense and derivative income reversal.
(2) Includes advances and credit substitutes like debentures and bonds but excludes preference shares.
At September 30, 2010, the gross non-performing assets (net of write-offs and unpaid interest) were Rs.102.33 billion compared to Rs. 96.27 billion at year-end fiscal 2010. However, the ratio of net non-performingassets to net customer assets decreased from 1.96% at March 31, 2009 to 1.37% at September 30, 2010. Theincrease in non-performing assets between March 2007 and March 2009 was primarily due to the increase inretail finance non-performing loans. The increase in retail finance non-performing loans was due to the higher
126
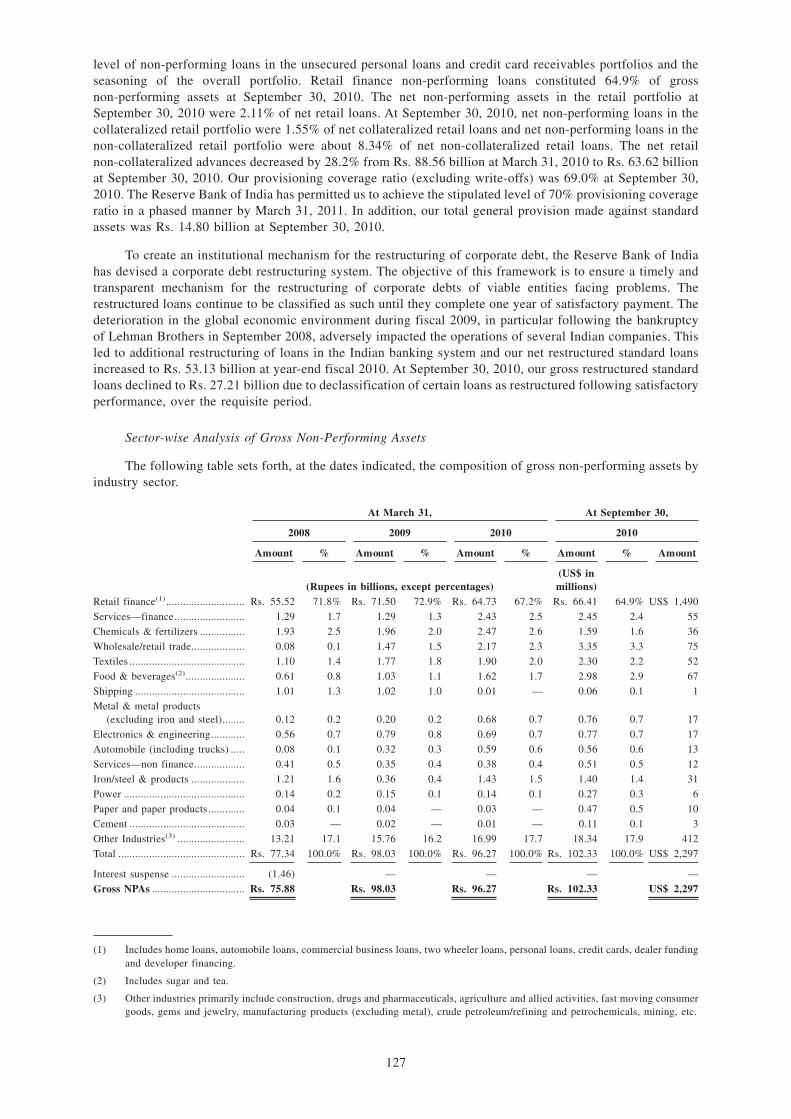
level of non-performing loans in the unsecured personal loans and credit card receivables portfolios and theseasoning of the overall portfolio. Retail finance non-performing loans constituted 64.9% of grossnon-performing assets at September 30, 2010. The net non-performing assets in the retail portfolio atSeptember 30, 2010 were 2.11% of net retail loans. At September 30, 2010, net non-performing loans in thecollateralized retail portfolio were 1.55% of net collateralized retail loans and net non-performing loans in thenon-collateralized retail portfolio were about 8.34% of net non-collateralized retail loans. The net retailnon-collateralized advances decreased by 28.2% from Rs. 88.56 billion at March 31, 2010 to Rs. 63.62 billionat September 30, 2010. Our provisioning coverage ratio (excluding write-offs) was 69.0% at September 30,2010. The Reserve Bank of India has permitted us to achieve the stipulated level of 70% provisioning coverageratio in a phased manner by March 31, 2011. In addition, our total general provision made against standardassets was Rs. 14.80 billion at September 30, 2010.
To create an institutional mechanism for the restructuring of corporate debt, the Reserve Bank of Indiahas devised a corporate debt restructuring system. The objective of this framework is to ensure a timely andtransparent mechanism for the restructuring of corporate debts of viable entities facing problems. Therestructured loans continue to be classified as such until they complete one year of satisfactory payment. Thedeterioration in the global economic environment during fiscal 2009, in particular following the bankruptcyof Lehman Brothers in September 2008, adversely impacted the operations of several Indian companies. Thisled to additional restructuring of loans in the Indian banking system and our net restructured standard loansincreased to Rs. 53.13 billion at year-end fiscal 2010. At September 30, 2010, our gross restructured standardloans declined to Rs. 27.21 billion due to declassification of certain loans as restructured following satisfactoryperformance, over the requisite period.
Sector-wise Analysis of Gross Non-Performing Assets
The following table sets forth, at the dates indicated, the composition of gross non-performing assets byindustry sector.
At March 31, At September 30,
2008 2009 2010 2010
Amount % Amount % Amount % Amount % Amount
(Rupees in billions, except percentages)(US$ inmillions)
Retail finance(1)............................ Rs. 55.52 71.8% Rs. 71.50 72.9% Rs. 64.73 67.2% Rs. 66.41 64.9% US$ 1,490
Services—finance......................... 1.29 1.7 1.29 1.3 2.43 2.5 2.45 2.4 55
Chemicals & fertilizers ................ 1.93 2.5 1.96 2.0 2.47 2.6 1.59 1.6 36
Wholesale/retail trade................... 0.08 0.1 1.47 1.5 2.17 2.3 3.35 3.3 75
Textiles ......................................... 1.10 1.4 1.77 1.8 1.90 2.0 2.30 2.2 52
Food & beverages(2)..................... 0.61 0.8 1.03 1.1 1.62 1.7 2.98 2.9 67
Shipping ....................................... 1.01 1.3 1.02 1.0 0.01 — 0.06 0.1 1
Metal & metal products(excluding iron and steel)........ 0.12 0.2 0.20 0.2 0.68 0.7 0.76 0.7 17
Electronics & engineering............ 0.56 0.7 0.79 0.8 0.69 0.7 0.77 0.7 17
Automobile (including trucks) ..... 0.08 0.1 0.32 0.3 0.59 0.6 0.56 0.6 13
Services—non finance.................. 0.41 0.5 0.35 0.4 0.38 0.4 0.51 0.5 12
Iron/steel & products ................... 1.21 1.6 0.36 0.4 1.43 1.5 1.40 1.4 31
Power ........................................... 0.14 0.2 0.15 0.1 0.14 0.1 0.27 0.3 6
Paper and paper products ............. 0.04 0.1 0.04 — 0.03 — 0.47 0.5 10
Cement ......................................... 0.03 — 0.02 — 0.01 — 0.11 0.1 3
Other Industries(3) ........................ 13.21 17.1 15.76 16.2 16.99 17.7 18.34 17.9 412
Total ............................................. Rs. 77.34 100.0% Rs. 98.03 100.0% Rs. 96.27 100.0% Rs. 102.33 100.0% US$ 2,297
Interest suspense .......................... (1.46) — — — —
Gross NPAs ................................. Rs. 75.88 Rs. 98.03 Rs. 96.27 Rs. 102.33 US$ 2,297
(1) Includes home loans, automobile loans, commercial business loans, two wheeler loans, personal loans, credit cards, dealer fundingand developer financing.
(2) Includes sugar and tea.
(3) Other industries primarily include construction, drugs and pharmaceuticals, agriculture and allied activities, fast moving consumergoods, gems and jewelry, manufacturing products (excluding metal), crude petroleum/refining and petrochemicals, mining, etc.
127

Non-Performing Asset Strategy
In respect of unviable non-performing assets, where companies have lost financial viability, we adopt anaggressive approach aimed at out-of-court settlements, enforcing collateral and driving consolidation. Ourfocus is on time value of recovery and a pragmatic approach towards settlements. The strong collateral againstour loan assets is the critical factor towards the success of our recovery efforts. In addition, we continuallyfocus on proactive management of accounts under supervision. Our strategy constitutes a proactive approachtowards identification, aimed at early stage solutions to incipient problems.
Our strategy for resolution of non-performing assets includes sales of financial assets to assetreconstruction companies in exchange for receipt of securities in the form of pass-through instruments issuedby asset reconstruction companies, wherein payments to holders of the securities are based on the actualrealized cash flows from the transferred assets. Under Indian GAAP, these instruments are valued at the netasset values as declared by the asset reconstruction companies in accordance with the Reserve Bank of Indiaguidelines. Under US GAAP, the assets we sell in exchange for security receipts are not accounted for as salesin terms of FASB ASC Topic 860, “Transfers and Servicing” either because we retain beneficial interests inthe transferred assets in the form of security receipts, or due to consolidation of certain funds or trusts, whichare variable interest entities within the definition provided in ASC Subtopic 810-10, to which these loans havebeen transferred. These assets are considered under US GAAP as restructured assets. See “Supervision andRegulation—Reserve Bank of India Regulations—Regulations relating to Sale of Assets to AssetReconstruction Companies”. We sold Rs. 9.34 billion of our net non-performing assets during fiscal 2008, Rs.6.81 billion of our net non-performing assets during fiscal 2009 and Rs. 7.62 billion of our net non-performingassets during fiscal 2010 to asset reconstruction companies registered with the Reserve Bank of India. Duringthe six months ended September 30, 2010, we did not sell non-performing assets to asset reconstructioncompanies. At September 30, 2010, we had an outstanding net investment of Rs. 30.95 billion in securityreceipts issued by asset reconstruction companies in relation to sales of our non-performing assets. See “RiskFactors—Risks Relating to Our Business—If we are not able to control the level of non-performing assets inour portfolio, our business will suffer”.
We monitor migration of the credit ratings of our borrowers to enable us to take proactive remedialmeasures to prevent loans from becoming non-performing. We review the industry outlook and analyze theimpact of changes in the regulatory and fiscal environment. Our periodic review system helps us to monitorthe health of accounts and to take prompt remedial measures.
A substantial portion of our loans to retail customers is also secured by a first and exclusive lien on theassets financed (predominantly property and vehicles). We are entitled in terms of our security documents torepossess security comprising assets such as plant, equipment and vehicles without reference to the courts ortribunals unless a client makes a reference to such courts or tribunals to stay our actions. In respect of our retailloans, we adopt a standardized collection process to ensure prompt action for follow-up on overdues andrecovery of defaulted amounts.
Our loans, primarily corporate loans and mortgages, have historically been sufficientlyover-collateralized so that once collateral is realized we recover a substantial amount of our loan outstanding.However, recoveries may be subject to delays of up to several years, due to the long legal process in India.This leads to delay in enforcement and realization of collateral. We maintain the non-performing assets on ourbooks for as long as the enforcement process is ongoing. Accordingly, a non-performing asset may continuefor a long time in our portfolio until the settlement of loan account or realization of collateral, which may belonger than that for US banks under similar circumstances.
128

Provision for Loan Losses
The following table sets forth, at the dates indicated, movement in our provisions for loan losses fornon-performing assets.
Year ended March 31,Six months ended
September 30,
2006 2007 2008 2009 2010 2010
(Rupees in billions)(US$ inmillions)
Aggregate provisions for loan lossesat the beginning of the year .......... Rs. 14.49 Rs. 11.93 Rs. 21.50 Rs. 40.24 Rs. 51.84 Rs. 57.26 US$ 1,285
Add: Provisions for loan losses
Retail finance ..................................... 1.92(1) 8.68 15.13 30.52 33.92 9.53 214
Commercial, financial, agricultural &others(2) .......................................... 0.90 1.25 1.25 1.65 3.30 (0.19) (4)
Working capital finance ..................... 0.61 1.18 2.68 2.59 2.37 4.71 106
Leasing and related activities............. (0.02) 0.05 0.09 0.05 (0.09) 0.19 4
Total provisions for loan losses, netof releases of provisions as aresult of cash collections ............... 17.90 23.09 40.65 75.05 91.34 71.50 1,605
Loans charged-off............................... (5.97) (1.59) (0.41) (23.21) (34.08) (1.09) (25)
Aggregate provisions for loan lossesat the end of the year .................... Rs. 11.93 Rs. 21.50 Rs. 40.24 Rs. 51.84 Rs. 57.26 Rs. 70.41 US$ 1,580
(1) Net of Rs. 1.69 billion on re-assessment of provisioning requirement on performing loans and non-performing loans on a portfoliobasis.
(2) Includes project finance, corporate finance and receivables financing, excluding leasing and related activities.
Technology
We continue to endeavor to be at the forefront of usage of technology in the financial services sector.We strive to use information technology as a strategic tool for our business operations, to gain a competitiveadvantage and to improve our overall productivity and efficiency. Our technology initiatives are aimed atenhancing value, offering customers enhanced convenience and improved service while optimizing costs. Ourfocus on technology emphasizes:
• Electronic and online channels to:
• offer easy access to our products and services;
• reduce distribution and transaction costs;
• reach new target customers;
• enhance existing customer relationships; and
• reduce time to market.
• The application of information systems to:
• manage our large scale of operations efficiently;
• effectively market to our target customers;
• monitor and control risks;
• identify, assess and capitalize on market opportunities; and
• assist in offering improved products to customers.
We also seek to leverage our domestic technology capabilities in our international operations.
129

Technology Organization
We have dedicated technology groups for our products and services for retail, corporate, internationaland rural customers. Our Technology Management Group coordinates our enterprise-wide technologyinitiatives. Our Shared Technology Infrastructure Group provides the technology infrastructure platformacross all business technology groups to gain synergies in operation. The business technology groups reviewthe individual requirements of the various business groups and of the Information Security Group.
Banking Application Software
We use banking applications like a core banking system, loan management system, and credit cardmanagement system all of which are flexible and scalable and allow us to serve our growing customer base.A central stand-in server ensures services all days of the week, throughout the year, to the various deliverychannels. While we currently have a data center in Mumbai for centralized data base management, data storageand retrieval, a new data center is slated to become operational in the next quarter.
Electronic and Online Channels
We use a combination of physical and electronic delivery channels to maximize customer choice andconvenience, which has helped to differentiate our products in the marketplace. Our branch banking softwareis flexible and scalable and integrates well with our electronic delivery channels. Our ATMs are sourced fromsome of the world’s leading vendors. At September 30, 2010, we had 5,722 ATMs across India. We offer anumber of online banking services to our customers for both corporate and retail products and services. Ourcall centers across locations at Mumbai, Thane and Hyderabad are operational around the clock and areequipped with multiple systems such as interactive voice response systems, automatic call distribution,computer telephony integration and voice recorders. We seek to use the latest technology in these call centersto provide an integrated customer database that allows the call agents to get a complete overview of thecustomer’s relationship with us. The database enables customer segmentation and assists the call agent inidentifying cross-selling opportunities.
We offer mobile banking services in India in line with our strategy to offer multi-channel access to ourcustomers. This service has now been extended to all mobile telephone service providers across India andnon-resident Indian customers in certain other countries where we have a presence.
High-Speed Electronic Communications Infrastructure
We have a nationwide data communications network linking all our channels and offices. The networkis designed to provide for reach and redundancy, which are imperative in a vast country like India. Thecommunications network is monitored 24 hours a day using advanced network management software.
Operations Relating to Commercial Banking for Corporate Customers
Our corporate banking back office operations are centralized and we have a business processmanagement solution to automate our activities in the areas of trade services and general banking operations.Through integration of the workflow system with the imaging and document management system, we haveachieved substantial savings and practically eliminated the use of paper for these processes.
We have centralized the systems of the treasuries of all our international branches and subsidiaries. Asa result, the processing of transactions as well as the applications used for deal entry are now centrally locatedand maintained out of India.
Customer Relationship Management
We have implemented a customer relationship management solution for the automation of customerhandling in all key retail products. The solution helps in tracking and timely resolution of various customerqueries and issues. The solution has been deployed at the telephone banking call centers as well as at a largenumber of branches.
Data Warehousing and Data Mining
We have a data warehouse for customer data aggregation. This data warehouse also provides a platformfor data mining initiatives. We have implemented an enterprise application integration initiative across ourretail and corporate products and services, to link various products, delivery and channel systems. This
130

initiative follows from our multi-channel customer service strategy and seeks to deliver customer relatedinformation consistently across access points. It also aims to provide us with valuable information to compilea unified customer view and creates various opportunities associated with cross-selling other financialproducts.
Data Center and Disaster Recovery System
While our primary data center is located in Mumbai, a separate disaster recovery data center has beenset up in another city and is connected to the main data center in Mumbai. The disaster recovery data centercan host all critical banking applications in the event of a disaster at the primary site.
We have developed a business continuity plan, which would help facilitate continuity of criticalbusinesses in the event of a disaster. These plans are tested periodically under live or simulated scenarios.These plans have been prepared in line with the guidelines issued by Reserve Bank of India and have beenapproved by our board of directors.
Competition
We face competition in all our principal areas of business from Indian and foreign commercial banks,housing finance companies, mutual funds and investment banks. We are the largest private sector bank in Indiaand the second largest bank among all banks in the country, in terms of total assets. We seek to gaincompetitive advantage over our competitors by offering innovative products and services, using technology,building customer relationships and developing a team of highly motivated and skilled employees. Weevaluate our competitive position separately in respect of our products and services for retail and corporatecustomers.
Commercial Banking Products and Services for Retail Customers
In the retail markets, competition is primarily from foreign and Indian commercial banks and housingfinance companies. Foreign banks have product and delivery capabilities but are likely to focus on limitedcustomer segments and geographical locations since they have a smaller branch network than Indiancommercial banks. Foreign banks in aggregate had only 287 branches in India at December 31, 2009. Indianpublic sector banks have wide distribution networks but generally relatively less strong technology andmarketing capabilities while private sector banks have a relatively smaller branch network but strongertechnology capabilities. With the implementation of technology-based core banking solutions, public sectorbanks have become more competitive in selling products and services to retail customers. In addition somespecialized non-bank finance companies have increased market share in certain segments of retail bankingproducts. We seek to compete in this market through a full product portfolio and effective distributionchannels, which include branches, agents, robust credit processes and collection mechanisms, experiencedprofessionals and superior technology.
Commercial banks attract the majority of retail bank deposits, historically the preferred retail savingsproduct in India. We have sought to capitalize on our corporate relationships to gain individual customeraccounts through payroll management products and will continue to pursue a multi-channel distributionstrategy utilizing physical branches, ATMs, telephone banking call centers and the internet to reach customers.Further, following a strategy focused on customer profiles and product segmentation, we offer differentiatedliability products to customers of various ages and income profiles. Mutual funds are another source ofcompetition to us. Mutual funds offer tax advantages and have the capacity to earn competitive returns andhence present a competitive alternative to bank deposits.
Commercial Banking Products and Services for Corporate Customers
In products and services for corporate customers, we face strong competition primarily from publicsector banks, foreign banks and other new private sector banks. Our principal competition in these productsand services comes from public sector banks, which have built extensive branch networks that have enabledthem to raise low-cost deposits and, as a result, price their loans and fee-based services very competitively.Their wide geographical reach facilitates the delivery of banking products to their corporate customers locatedin most parts of the country. We seek to compete based on our service and prompt turnaround times that webelieve are significantly faster than public sector banks. We seek to compete with the large branch networksof the public sector banks through our multi-channel distribution approach and technology-driven deliverycapabilities.
131

Traditionally, foreign banks have been active in providing treasury-related products and services, tradefinance, fee-based services and other short-term financing products to top tier Indian corporates. We competewith foreign banks in cross-border trade finance based on our wider geographical reach relative to foreignbanks and our customized trade financing solutions. We have established strong fee-based cash managementservices and leverage our balance sheet size, wider branch network, technology and our international presenceto compete in treasury-related products and services.
Other new private sector banks also compete in the corporate banking market on the basis of efficiency,service delivery and technology. However, we believe that our size, capital base, strong corporaterelationships, wider geographical reach and ability to use technology to provide innovative, value-addedproducts and services provide us with a competitive edge.
In project finance, ICICI’s primary competitors were established long-term lending institutions. In recentyears, Indian and foreign commercial banks have sought to expand their presence in this market. We believethat we have a competitive advantage due to our strong market reputation and expertise in risk evaluation andmitigation. We believe that our in-depth sector specific knowledge and capabilities in understanding risks andpolicy related issues as well as our advisory, structuring and syndication services have allowed us to gaincredibility with project sponsors, overseas lenders and policy makers.
Commercial Banking Products and Services for International Customers
Our international strategy focused on India-linked opportunities in the initial stages. In our internationaloperations, we face competition from Indian public sector banks with overseas operations, foreign banks withproducts and services targeted at non-resident Indians and Indian businesses and other service providers suchas remittance services. Foreign banks have become more competitive in providing financing to Indianbusinesses leveraging their strength of access to lower cost foreign currency funds. We are seeking to positionourselves as an Indian bank offering globally-benchmarked products and services with an extensivedistribution network in India to gain competitive advantage. We seek to leverage our technology capabilitiesdeveloped in our domestic businesses to offer convenience and efficient services to our internationalcustomers. We also seek to leverage our strong relationships with Indian corporates in our internationalbusiness.
Commercial Banking Products and Services for Agricultural and Rural Customers
In our commercial banking operations for agricultural and rural customers, we face competition frompublic sector banks that have large branch networks in rural India. Other private sector banks and non-bankingfinance companies also provide products and services in rural India. We also face competition from specializedplayers such as rural finance institutions and gold loan companies. We seek to compete in this business basedon our product strategy and multiple channels.
Insurance and Asset Management
Our insurance and asset management joint ventures face competition from existing dominant publicsector players as well as new private sector players. We believe that the key competitive strength of ourinsurance joint ventures is the combination of our experience in the Indian financial services industry with theglobal experience and skills of our joint venture partners. We believe that ICICI Prudential Life InsuranceCompany, ICICI Lombard General Insurance Company and ICICI Prudential Asset Management Companyhave built strong product, distribution and risk management capabilities, achieving market leadershippositions in their respective businesses. According to data published by the Insurance Regulatory andDevelopment Authority of India, ICICI Prudential Life Insurance Company had a retail market share of about9.9% in new business written (on retail weighted received premium basis) during the six months endedSeptember 30, 2010. ICICI Lombard General Insurance Company had a market share of about 10.3% in grosswritten premiums during the six months ended September 30, 2010. See also “Business—Insurance”. ICICIPrudential Asset Management Company manages the ICICI Prudential Mutual Fund, which was among the topthree mutual funds in India in terms of average funds under management in September 2010 with a marketshare of about 9.8%.
Employees
At September 30, 2010, we had 53,700 employees (including permanent employees, interns, salesexecutives and fixed term employees and employees on probation), of whom 22,339 employees wereprofessionals with degrees in business management, accountancy, engineering, law, computer science oreconomics.
132

We dedicate a significant amount of senior management time to ensuring that employees remain highlymotivated. Employee compensation is tied to performance, and we encourage the involvement of ouremployees in our overall performance and profitability through profit sharing incentive schemes based on ourfinancial results. A performance appraisal system has been implemented to assist management in careerdevelopment and succession planning.
We have an employee stock option scheme to encourage and retain high performing employees. Pursuantto the employee stock option scheme as amended by the Scheme of Amalgamation and further amended inSeptember 2004, up to 5.0% of the aggregate of our issued equity shares at the time of grant of the stockoptions can be allocated under the employee stock option scheme. The stock option entitles eligible employeesto apply for equity shares. The grant of stock options is approved by our board of directors on therecommendations of the Board Governance, Remuneration and Nomination Committee. The eligibility of eachemployee is determined based on an evaluation of the employee including the employee’s work performance,technical knowledge and leadership qualities. See also “Management—Compensation and Benefits toDirectors and Officers—Employee Stock Option Scheme”.
We have training centers, where various training programs designed to meet the changing skillrequirements of our employees are conducted. These training programs include orientation sessions for newemployees and management development programs for mid-level and senior executives. The training centersregularly offer courses conducted by faculty, both national and international, drawn from industry, academiaand our own organization. Training programs are also conducted for developing functional as well asmanagerial skills. Products and operations training are also conducted through web-based training modules.
In addition to basic compensation, our employees are eligible to receive loans from us at subsidized ratesand to participate in our provident fund and other employee benefit plans. The provident fund, to which bothwe and our employees contribute a defined amount, is a savings scheme, required by government regulation,under which we at present are required to pay to employees a minimum annual return as specified from timeto time which is currently 9.5%. If such return is not generated internally by the fund, we are liable for thedifference. Our provident fund has generated sufficient funds internally to meet the minimum annual returnrequirement since inception of the funds. We have also set up a superannuation fund to which we contributedefined amounts. Employees have been given an option to opt out of the superannuation fund and in such casesthe defined amounts are paid as part of monthly salary. In addition, we contribute specified amounts to agratuity fund set up pursuant to Indian statutory requirements.
Properties
Our registered office is located at Landmark, Race Course Circle, Vadodara 390 007, Gujarat, India. Ourcorporate headquarters is located at ICICI Bank Towers, Bandra-Kurla Complex, Mumbai 400 051,Maharashtra, India.
We had a principal network consisting of 2,501 branches and 5,722 ATMs at September 30, 2010. Thisincludes 457 deposit taking branches and 131 ATMs of the Bank of Rajasthan, which merged with us witheffect from the close of business on August 12, 2010. These facilities are located throughout India. In additionto the branches, extension counters and ATMs, we have 38 controlling/administrative offices including theregistered office at Vadodara and the corporate headquarters at Mumbai, 57 regional processing centers invarious cities and one central processing center at Mumbai. This includes 14 controlling/administrative officesand six service branches of the Bank of Rajasthan. We have a branch in each of Bahrain, Dubai, Hong Kong,Qatar, Singapore, Sri Lanka and the United States and one representative office each in Bangladesh, China,Indonesia, Malaysia, South Africa, Thailand and the United Arab Emirates. We also provide residential andholiday home facilities to employees at subsidized rates. At September 30, 2010, we had 864 apartments forour employees. This includes 116 apartments of the Bank of Rajasthan.
Legal and Regulatory Proceedings
We are involved in various litigations and are subject to a wide variety of banking and financial serviceslaws and regulations in each of the jurisdictions in which we operate. We are also subject to a large numberof regulatory and enforcement authorities in each of these jurisdictions. We are involved in a number of legalproceedings and regulatory relationships in the ordinary course of our business. However, excluding the legalproceedings discussed below, we are not a party to any proceedings and no proceedings are known by us tobe contemplated by governmental authorities or third parties, which, if adversely determined, may have amaterial adverse effect on our financial condition or results of operations.
133

The following penalties were imposed and paid by us in the past:
• In fiscal 2006, the Reserve Bank of India imposed a penalty of Rs. 0.5 million on us in connectionwith our role as collecting bankers in certain public equity offerings by companies in India.
• The Reserve Bank of India levied a penalty of Rs. 0.5 million on us pertaining to Know YourCustomer guidelines.
• The Securities and Futures Commission, Hong Kong charged us with carrying on the business ofdealing in securities in Hong Kong between June 15, 2004 and March 8, 2006, without having therequisite license. The Eastern Magistrate’s Court, Hong Kong, on April 10, 2007, fined us a sumof HK$ 40,000 and ordered us to reimburse prosecution costs of HK$ 54,860.
See also “Risk Factors—Risks Relating to Our Business—We have experienced rapid internationalgrowth in earlier years which has increased the complexity of the risks that we face”, “—There is operationalrisk associated with our industry which, when realized, may have an adverse impact on our business”, “—Weare involved in various litigations and any final judgment awarding material damages against us could havea material adverse impact on our future financial performance and our stockholders’ equity” and“—Regulatory changes or enforcement initiatives in India or other jurisdictions in which we operate couldadversely affect our business”.
At September 30, 2010, we had been assessed an aggregate of Rs. 31.31 billion in excess of the provisionmade in the accounts mainly pertaining to income tax, and sales tax/value added tax demands by thegovernment’s tax authorities for past years. We have appealed each of these tax demands which are pendingfinal resolution. Based on consultation with counsel and favorable judicial or appellate authority decisions inour own, or other, cases as set out below, management believes that the tax authorities are not likely to be ableto substantiate their tax assessments and accordingly we have not provided for these tax demands at September30, 2010.
• Rs. 6.92 billion relates to appeals filed by the tax authorities against decisions in favor of the Bankto higher appellate authorities. The matters are currently pending adjudication.
• Rs. 1.28 billion relates to our appeal of the assessment of sales tax/value added tax assessment. Weare relying on a favorable decision in our own/other cases and opinions from counsels.
• Rs. 23.12 billion relates to our appeal of assessments mainly pertaining to income tax. We arerelying on favorable precedent decisions of the appellate court and expert opinions.
• Of the Rs. 23.12 billion, Rs. 10.63 billion relates to bad debts written off. Bad debts written offas irrecoverable by the Bank have been disallowed by the tax authorities on the ground that wehave not established that the debts written off during the year are irrecoverable. In recentjudgments in the Bank’s own case for some years, the appellate authorities have allowed the claimof bad debts on the ground that after an amendment to the Income Tax Act, 1961 with effect fromApril 1, 1989, it is not obligatory for the assessee to prove that the debts written-off are bad andit shall suffice if the assessee writes off its bad debts as irrecoverable in the accounts during thesaid year. In a recent Supreme Court ruling in another matter, it was held that after the amendmentof the Income Tax Act, it is not necessary for the taxpayer to establish that the debt has actuallybecome irrecoverable to claim a deduction for bad debts.
• Rs. 4.11 billion relates to the disallowance of depreciation claims on leased assets, which is anindustry-wide issue involving multiple litigations across the country. In respect of depreciationclaimed by us for fiscal 1993 and fiscal 1994 on two sale and leaseback transactions, the IncomeTax Appellate Tribunal, Mumbai held that these transactions were tax planning tools and nodepreciation was allowable. As the Income Tax Appellate Tribunal’s decision is based on the factsof two specific transactions, we believe that the Income Tax Appellate Tribunal’s decision will nothave an adverse tax impact on other sale and leaseback transactions entered into by us. Insubsequent judgments in our own case, the appellate authorities have held that the leasetransactions are genuine and have allowed depreciation on finance leases including sale andleaseback transactions.
• A penalty amounting to Rs. 3.94 billion has been levied on us by the tax authorities on contentiousissues involving judicial interpretation. In recent judgments in our own and other cases, theappellate authorities have ruled that penalties are not leviable on debatable issues which cannot besaid to be in the nature of concealment of income.
134

• Rs. 2.26 billion relates to whether interest expenses can be attributed to earning tax-exemptdividend income. We believe that no interest can be allocated thereto as there are no earmarkedborrowings earmarked for investment in shares and our interest free funds are sufficient to coverinvestments in the underlying shares. In a recent judgment in another matter, the Bombay HighCourt has laid down the principle that if there are sufficient interest free funds available to anassessee to meet its investments, it can be presumed that the investments were made from theinterest free funds available.
• Rs. 1.97 billion relates to taxability of amounts withdrawn from the Special Reserve. ICICI hadmaintained two special reserve accounts, “Special Reserve created up to Assessment Year1997-98” and “Special Reserve created and maintained from Assessment Year 1998-99”.Withdrawal made from the “Special Reserve created up to Assessment Year 1997-98” was assessedas taxable by the tax authorities. The Bank has disputed the levy of tax as the special reservecreated through this account was not required to be maintained. In a recent judgment in our owncase, the appellate authority has granted relief in respect of withdrawal of special reserve createdup to Assessment Year 1997-98.
Accordingly, we have not provided for these tax demands but have disclosed them as a contingentliability in the financial statements.
A number of litigation and claims against ICICI Bank and its directors are pending in various forums.The claims on ICICI Bank mainly arise in connection with civil cases involving allegations of servicedeficiencies, property or labor disputes, fraudulent transactions, economic offences and other cases filed in thenormal course of business. The Bank is also subject to counterclaims arising in connection with itsenforcement of contracts and loans. In accordance with FASB ASC 450, a provision is created where anunfavorable outcome is deemed probable and in respect of which a reliable estimate can be made. In view ofinherent unpredictability of litigation and cases where claims sought are substantially high, actual cost ofresolving litigations may be substantially different than the provision held.
We held a total provision of Rs. 398.0 million at September 30, 2010 for 606 cases with claims totalingapproximately Rs. 1.05 billion (including claims made against the Bank of Rajasthan), where an unfavorableoutcome was deemed probable and in respect of which a reliable estimate could be made. Out of the aforesaidprovision made, Rs. 374.7 million is provision for 602 cases with claims of Rs. 973.0 million and Rs. 23.30million is provision for four cases with an amount of Rs. 81.00 million, which is the amount of sale proceedsreceived from the court against an undertaking. Since the amount of these provisions remained insignificantcompared to our net income, we have not included detailed disclosures in our filing about the litigation mattersrelated to these provisions.
For cases where an unfavorable outcome is deemed to be reasonably possible but not probable, we haveincluded the amount of claims against us in our contingent liabilities. At September 30, 2010, such claimsamounted to a total of Rs. 1.25 billion in connection with 55 separate cases. Since the amount of claims underthese cases is 0.3% of our profit after tax for fiscal 2010, we have not included detailed disclosures in ourfiling about the nature of litigation matters related to these claims. Further, as explained above, it is notpossible to make an estimate of the possible loss or range of possible losses for these cases due to the natureof the cases.
For cases where an unfavorable outcome is deemed to be remote, we have not made a provision, nor havewe included the amount of the claims in these cases in our contingent liabilities.
In some instances, civil litigants name our directors as co-defendants in lawsuits against ICICI Bank.There were 324 such cases at September 30, 2010.
Management believes, based on consultation with counsel, that the claims and counterclaims filedagainst us in the above legal proceedings are frivolous and untenable and their ultimate resolution will nothave a material adverse effect on our results of operations, financial condition or our liquidity. Based on areview of other litigations with legal counsel, management also believes that the outcome of such other matterswill also not have a material adverse effect on our financial position, results of operations or cash flows.
135

At September 30, 2010, there were 50 litigations each involving a claim of Rs. 10.00 million and moreagainst us, in the aggregate amount of approximately Rs. 14.12 billion (to the extent quantifiable and includingamounts claimed jointly and severally from us and other parties). The following are the litigations whereamounts claimed from us are Rs. 1.0 billion or higher:
• In 2002, we filed a suit before the Debt Recovery Tribunal, Ahmedabad against Gujarat TelephoneCables Limited for the recovery of term loans, debentures and working capital finance providedby us. We sold our exposure to the Asset Reconstruction Company (India) Limited in 2004. Theborrower filed a suit in the Civil Court claiming damages of Rs. 10.0 billion jointly and severallyfrom the State Bank of India, Bank of Baroda, United Western Bank, UTI Bank, Bank of India,Asset Reconstruction Company (India) Limited and us. We have filed an application for rejectionof the suit to which Gujarat Telephone Cables Limited has filed its reply. We have filed ourrejoinder. The company in the meanwhile has gone into liquidation and the notice has been servedto the official liquidator. The matter is adjourned to December 1, 2010.
• In 1999, we filed a suit in the Debt Recovery Tribunal, Delhi against Esslon Synthetics Limitedand its Managing Director (in his capacity as guarantor) for recovery of amounts totalling Rs. 169million due from Esslon Synthetics Ltd. In May 2001, the guarantor filed a counterclaim for anamount of Rs. 1.00 billion against us and other lenders who had extended financial assistance toEsslon Synthetics on the grounds that he had been coerced by officers of the lenders into signingan agreement between LML Limited, Esslon Synthetics and the lenders on account of which hesuffered, among other things, loss of business. Esslon Synthetics Limited filed an application toamend the counterclaim in January 2004. We have filed our reply to the application foramendment. The guarantor has also filed an interim application on the ground that certaindocuments have not been exhibited, to which we have filed our reply stating that the requireddocuments are neither relevant nor necessary for adjudicating the dispute between the parties. Inthe meantime, Industrial Development Bank of India has challenged the order of the DebtRecovery Tribunal, Delhi, whereby the Debt Recovery Tribunal allowed LML Limited to beincluded in the list of parties. The Debt Recovery Appellate Tribunal, Delhi has passed an interimstay order against the Debt Recovery Tribunal proceedings. The Debt Recovery Tribunal will nexthear the matter on November 23, 2010. In the liquidation proceeding before the High Court atAllahabad, the official liquidator attached to the Allahabad High Court has sold the assets of EsslonSynthetics for Rs. 61 million in November 2002. We have filed the claim with the officialliquidator attached to the Allahabad High Court for our dues. The official liquidator has informedus that the claim of the Bank has been allowed for Rs. 88 million and that the pari-passu amountpayable to the Bank is Rs. 12 million. We will be filing an affidavit before the official liquidatorfor disbursement of the amount.
In addition, we have experienced rapid international expansion into banking in multiple jurisdictions,which exposes us to a new variety of regulatory and business challenges and risks, including cross-culturalrisk, and which increased the complexity of our risks in a number of areas including currency risks, interestrate risks, compliance risk, regulatory risk, reputational risk and operational risk. As a result of this rapidgrowth and increased complexity, we or our employees may be subject to regulatory investigations orenforcement proceedings in multiple jurisdictions in a variety of contexts. Despite our best efforts atregulatory compliance and internal controls, we, or our employees, may from time to time, and as is commonin the financial services industry, be the subject of confidential examinations or investigations that might, ormight not, lead to proceedings against the Bank or its employees. In any such situation it would be our policyto conduct an internal investigation, co-operate with the regulatory authorities and, where appropriate, suspendor discipline employees, including the termination of their services.
In fiscal 2010, two individuals filed a whistleblower retaliation complaint against us with theOccupational Safety and Health Administration, US Department of Labor (“OSHA”) pursuant to proceduresset forth under 29 CFR 1980 covered by Section 806 of the Sarbanes Oxley Act, 2002. The complaint allegesthat in our annual report on Form 20-F for fiscal 2008, as filed with the Securities and Exchange Commission,we misrepresented that we have anti-money laundering processes in place, and/or we failed to follow suchprocesses. The individuals demanded (i) immediate reinstatement at ICICI Bank, payment of back pay,payment of special damages and payment of attorney’s fees; and (ii) that their visa status be protected so thatthey may remain within the United States.
136

Upon receipt of the complaint, we commenced an internal investigation of our operations at the NewYork branch, including an investigation of our compliance with the US PATRIOT Act. It was determined thatthe New York branch complied with all applicable banking regulations and has appropriate internal controlsin place. The New York branch and its processes are also subject to ongoing supervision and examination bythe Office of the Comptroller of the Currency (the “OCC”), and the branch has informed the OCC of thismatter. We filed our response to the complaint with OSHA. OSHA has completed the initial phase of itsinvestigation and had issued an initial response letter dated January 4, 2010 finding, based on informationgathered thus far, reasonable cause to believe that a violation under Section 806 has occurred. We submitteda rebuttal, along with supporting documents, to OSHA on February 8, 2010. Pending receipt of the finaldetermination of the investigation by OSHA and on its suggestion, the parties have pursued informal resolutionof the complaint to reach a mutually acceptable resolution. OSHA has reserved its decision on the matterpending the outcome of the informal resolution process.
We cannot predict the timing or form of any future regulatory or law enforcement initiatives, which wenote are increasingly common for international banks, but we would expect to co-operate with any suchregulatory investigation or proceeding.
137

DESCRIPTION OF ICICI BANK’S HONG KONG BRANCH
ICICI Bank’s Hong Kong branch obtained its license for conducting full banking operations in HongKong on October 10, 2005 and started the branch operations from November 14, 2005.
Background
Hong Kong is a premier financial center where many of the world’s leading commercial banks andmulti-national corporations have established operations. ICICI Bank believes that Hong Kong’s location,excellent infrastructure, investor-friendly regulatory environment and robust financial sector make it an ideallocation for a regional hub for business in the North Asia region.
Given the strong Indian linkages of a growing and prosperous global Indian community in Hong Kongand increasing business prospects for Indian companies in the North Asia region, ICICI Bank envisages theHong Kong branch as the regional hub of its business presence and activities in the North Asia region.
Key Objectives of the Hong Kong Branch
In line with our stated objective of continually exploring possibilities for diversification of our businessin terms of geographies as well as products and services, we obtained a license for setting up a Licensed bankin Hong Kong. We envisage the Hong Kong branch as a ‘hub’ for our business in North Asia.
The key objectives of the branch in Hong Kong are as summarized below:
• to assist in fulfilling the global banking requirements of our domestic corporate customers (e.g.foreign currency borrowing requirements);
• to assist in securing a share of the business arising from India’s trade flows with the North Asiaregion;
• to leverage on Hong Kong’s status as a leading international financial center and our enhancedvalue proposition to meet the requirements of the Indian community in Hong Kong; and
• to build treasury operations in Hong Kong that will complement and support our internationaloperations.
Hong Kong Branch
The Hong Kong branch was granted authorization from the Hong Kong Monetary Authority underSection 16(1)(a) of the Banking Ordinance to carry on banking business in Hong Kong on October 10, 2005.The branch commenced its business activities on November 14, 2005.
The Hong Kong branch is a licensed bank in Hong Kong. In Hong Kong, only licensed banks mayoperate current and savings accounts, and accept deposits of any size and maturity from the public and payor collect checks drawn by or paid in by customers.
The Hong Kong branch is also subject to the regulations and directives of the Reserve Bank of India asapplicable to overseas branches of Indian banks.
Business Activities
The key business activities on which ICICI Bank’s Hong Kong Branch focuses are summarized below:
Corporate Banking
The Hong Kong branch seeks to fulfill the global banking requirements of its Indian corporatecustomers.
138

Trade Finance
Hong Kong is an important trade partner of India. Hong Kong is also a conduit for the rapidly increasingbilateral trade between India and its largest trading partner, China. Further, Hong Kong is a major hub fordoing business in Asia and many Indian corporations and India-based businessmen are establishing operationsin Hong Kong for facilitating their business activities in the region. The Hong Kong branch endeavors toachieve a share of the business arising from India’s commercial linkages with Hong Kong, China and othercountries in the North Asia region.
Treasury Activities
ICICI Bank believes that, given Hong Kong’s status as one of the major international financial markets,it is an ideal place for ICICI Bank to establish a treasury operation to complement and support its globaloperations through comprehensive foreign exchange, interest rate and liquidity management operations. ICICIBank’s Hong Kong branch offers foreign exchange and derivative products and services to its Indian and HongKong-based corporate clients in Hong Kong. The treasury operation in Hong Kong also mobilizes resourcesfor supporting its operations and is responsible for ensuring adequacy of resources for its business activitiesand managing the Hong Kong branch’s asset-liability position.
Retail Banking Business
The Hong Kong branch provides retail banking products and services to customers in Hong Kong. Thestrategy of the branch is to build a strong liability franchise by reaching out to customers for savings andcurrent accounts and mobilizing foreign currency deposits.
139

MANAGEMENT
Directors and Executive Officers
Our Board of Directors, consisting of 13 members at October 20, 2010, is responsible for themanagement of our business. Our organizational documents provide for a minimum of three directors and amaximum of 21 directors, excluding the government director and the debenture director (defined below), ifany. We may, subject to the provisions of our organizational documents and the Companies Act, change theminimum or maximum number of directors by a resolution which is passed at a general meeting by a majorityof the present and voting shareholders. In addition, under the Banking Regulation Act 1949, the Reserve Bankof India may require us to convene a meeting of our shareholders for the purposes of appointing new directorsto our Board of Directors.
The Banking Regulation Act 1949, requires that at least 51% of our directors should have specialknowledge or practical experience in banking and areas relevant to banking including accounting, finance,agriculture and small scale industry. All of our directors are professionals with special knowledge of one ormore of the above areas. Of the 13 directors, four are directors who are in our wholetime employment, orexecutive directors. The appointment of the chairman and executive directors requires the approval of theReserve Bank of India and the shareholders. The government of India has appointed one representative, Dr.Anup K. Pujari, to our board effective January 27, 2009. Of the remaining eight non-executive directors, Mr.K. V. Kamath is the non-executive chairman of our board, one is from a financial holding company which hasinvestments in insurance and investment management companies, and the others are, retired companyexecutives, advisors and chartered accountants. Of the nine non-executive directors, three have specializedknowledge in respect of agriculture and rural economy or small scale industry. The Reserve Bank of India hasalso prescribed ‘fit and proper’ criteria to be considered while appointing persons as directors of bankingcompanies. Our directors (other than the government director) are required to make declarations confirmingtheir ongoing compliance of the ‘fit and proper’ criteria. Our Board of Directors has reviewed the declarationsreceived from the directors in this regard and determined that all our directors satisfy the ‘fit and proper’criteria.
Pursuant to the provisions of the Companies Act, at least two-thirds of the total number of directors aresubject to retirement by rotation. The government director and the debenture director are not subject toretirement by rotation as per our organizational documents. One-third of the directors must retire from officeat each annual meeting of shareholders. A retiring director is eligible for re-election. Pursuant to the provisionsof the Banking Regulation Act, none of the directors other than Executive Directors may hold officecontinuously for a period exceeding eight years. Pursuant to the Reserve Bank of India guidelines, a personwould be eligible for appointment as director if he or she is between 35 and 70 years of age.
Our organizational documents also provide that we may execute trust deeds in respect of our debenturesunder which the trustee or trustees may appoint a director, known as the debenture director. The debenturedirector is not subject to retirement by rotation and may only be removed as provided in the relevant trust deed.Currently, there is no debenture director on our Board of Directors.
Mr. K.V. Kamath was the Managing Director and CEO of ICICI Bank from May 3, 2002 until April 30,2009. Our board of directors at its meeting held on December 19, 2008, appointed Mr. K. V. Kamath asnon-executive Chairman for a period of five years effective May 1, 2009. While our shareholders haveapproved the appointment of Mr. K. V. Kamath as Chairman for a period of five years effective May 1, 2009,the Reserve Bank of India has approved his appointment for a period of three years effective May 1, 2009.
Ms. Chanda D. Kochhar was appointed as Executive Director effective April 1, 2001, and designated asDeputy Managing Director effective April 29, 2006 and Joint Managing Director and Chief Financial Officereffective October 19, 2007. Our Board of Directors at its meeting held on December 19, 2008, appointed Ms.Chanda Kochhar as Managing Director and CEO for a period of five years effective May 1, 2009. While ourshareholders have approved appointment of Ms. Chanda Kochhar as Managing Director and CEO effectiveMay 1, 2009 up to March 31, 2014, the Reserve Bank of India has approved her appointment for a period ofthree years effective May 1, 2009.
Mr. K. Ramkumar was appointed as Executive Director, for a period of five years, effective February 1,2009. Mr. N. S. Kannan was appointed as Executive Director and Chief Financial Officer, for a period of fiveyears, effective May 1, 2009. While our shareholders have approved the above, the Reserve Bank of India hasapproved the appointment of Mr. Ramkumar and Mr. Kannan for a period of three years with effect fromFebruary 1, 2009 and May 1, 2009 respectively.
140

Mr. Rajiv Sabharwal was appointed as Executive Director for a period of five years effective June 24,2010. While our shareholders have approved the above, the Reserve Bank of India has approved theappointment of Mr. Rajiv Sabharwal for a period of three years effective June 24, 2010.
Our board of directors at its meeting held on April 25, 2009, appointed Mr. M. S. Ramachandran, formerChairman, Indian Oil Corporation, as an additional director effective April 25, 2009. His appointment wasapproved by our shareholders at their meeting held on June 29, 2009.
Our board at its meeting held on January 21, 2010 appointed Mr. Homi Khusrokhan and Mr. V. Sridaras additional directors effective January 21, 2010 and at its meeting held on April 30, 2010 appointed Dr.Tushaar Shah as additional director effective May 3, 2010. Their appointments have been approved by theshareholders at their meeting held on June 28, 2010.
Mr. V. Vaidyanathan, Executive Director ceased to be a member of our board effective May 1, 2009. Mr.Sonjoy Chatterjee, Executive Director, resigned from our board effective April 30, 2010. Mr. SandeepBakhshi, who was appointed as an Executive Director designated as Deputy Managing Director effective May1, 2009 ceased to be a member of our board effective July 31, 2010 on his appointment as Managing Directorand CEO of ICICI Prudential Life Insurance Company Limited.
In order to comply with the provisions of the Companies Act and our organizational documents, Mr. N.S. Kannan, Mr. K. Ramkumar, and Mr. Rajiv Sabharwal will be subject to retirement by rotation if at any timethe number of non-rotational directors exceeds one-third of the total number of directors. If they arere-appointed as directors immediately upon retirement by rotation, they will continue to hold their offices asExecutive Directors and the retirement by rotation and re-appointment shall not be deemed to constitute abreak in their appointment. Our other executive officers may hold office until they retire, unless they aredischarged earlier by us.
Our Board of Directors had the following members at October 20, 2010:
Name, designation and profession Age
Date of
first Appointment Particulars of other Directorship(s) at October 20, 2010
Mr. Kundapur Vaman KamathNon-executive Chairman
62 April 17, 1996 DirectorInfosys Technologies LimitedLupin LimitedThe Great Eastern Shipping Co. LimitedSchlumberger LimitedMember of BoardInstitute of International Finance, Inc.
Mr. Sridar IyengarNon-Executive DirectorProfession: Business Advisor
63 April 30, 2005 DirectorAmerican Indian FoundationAver Q Inc.Career Launcher India LimitedCleartrip Travel Services Private LimitedICICI Prudential Life Insurance Company LimitedInfosys BPO LimitedInfosys Technologies LimitedKovair Software Inc.Mahindra Holidays & Resorts India LimitedOnmobile Global LimitedRediff.com India LimitedRediff Holdings Inc.
141

Name, designation and profession Age
Date of
first Appointment Particulars of other Directorship(s) at October 20, 2010
Mr. Homi KhusrokhanNon-Executive DirectorProfession: Advisor
66 January 21, 2010 ChairmanKhet-se Agri Produce (India) Private LimitedDirectorAdvinus Therapeutics Private LimitedFulford (India) LimitedRallis India LimitedSamson Maritime LimitedTata AIG Life Insurance Company Limited
Dr. Anup K. PujariNominee DirectorProfession: GovernmentService
54 January 27, 2009 None
Mr. M. S. RamachandranNon-Executive DirectorProfession: Advisor
65 April 25, 2009 ChairmanCals Refineries LimitedConcord Energy (India) Pte LimitedDirectorBharat Electronics Limited (BEL)Ester Industries LimitedGulf Oil Corporation LimitedSupreme Petrochem Limited
Dr. Tushaar ShahNon Executive DirectorProfession: Senior Fellow
59 May 3, 2010 None
Mr. Mahendra Kumar SharmaNon-Executive DirectorProfession: Retired CompanyExecutive
63 January 31, 2003 DirectorBirla Corporation LimitedICICI Lombard General Insurance Company
LimitedThomas Cook (India) LimitedSchrader Duncan limitedFulford (India) Limited
Mr. V. SridarNon-Executive DirectorProfession: Advisor
63 January 21, 2010 DirectorAadhar Housing Finance Private LimitedAban Power Company LimitedLanco Vidarbha Thermal Power LimitedMorpheus Capital Advisors Private LimitedPonni Sugars (Erode) LimitedSarda Metals and Alloys LimitedSecurities Trading Corporation of India LimitedSeshasayee Paper & Boards LimitedSTCI Primary Dealer LimitedMember — Governing CouncilUnited Stock Exchange Limited
142

Name, designation and profession Age
Date of
first Appointment Particulars of other Directorship(s) at October 20, 2010
Mr. V. Prem WatsaNon-Executive DirectorProfession: CompanyExecutive
60 January 29, 2004 Chairman and CEOFairfax Financial Holdings LimitedChairmanCrum & Forster Holdings Corp.Northbridge Financial CorporationOdyssey Re Holdings Corp.TIG Holdings, Inc.Chairman and PresidentFairfax Investments USA Corp.President1109519 Ontario Limited810679 Ontario Limited2771489 Canada LimitedFFHL Share Option 1 Corp.The Sixty Two Investment Company LimitedPresident and CEOFFHL Group LimitedVice President and SecretaryHamblin Watsa Investment Councel LimitedDirectorThe Sixty Four FoundationThe Sixty Three FoundationCunningham Lindsey Group LimitedCunningham Lindsey Group Inc.
Ms. Chanda D. KochharManaging Director and CEOProfession: CompanyExecutive
48 April 1, 2001 ChairpersonICICI Bank Eurasia Limited Liability CompanyICICI Bank UK PLCICICI Bank CanadaICICI Prudential Asset Management Company
LimitedICICI Prudential Life Insurance Company LimitedICICI Securities LimitedICICI Lombard General Insurance Company
Limited
Mr. N. S. KannanExecutive Director and CFOProfession: CompanyExecutive
45 May 1, 2009 ChairmanICICI Securities Primary Dealership LimitedDirectorICICI Lombard General Insurance Company
LimitedICICI Prudential Asset Management Company
LimitedICICI Prudential Life Insurance Company LimitedICICI Eurasia Limited Liability CompanyICICI Bank UK PLC
Mr. K. RamkumarExecutive DirectorProfession: CompanyExecutive
49 February 1, 2009 DirectorICICI Prudential Life Insurance Company LimitedICICI Venture Funds Management Company
Limited
Mr. Rajiv SabharwalExecutive DirectorProfession: CompanyExecutive
45 June 24, 2010 ChairmanICICI Home Finance Company LimitedICICI Prudential Life Insurance Company Limited
143
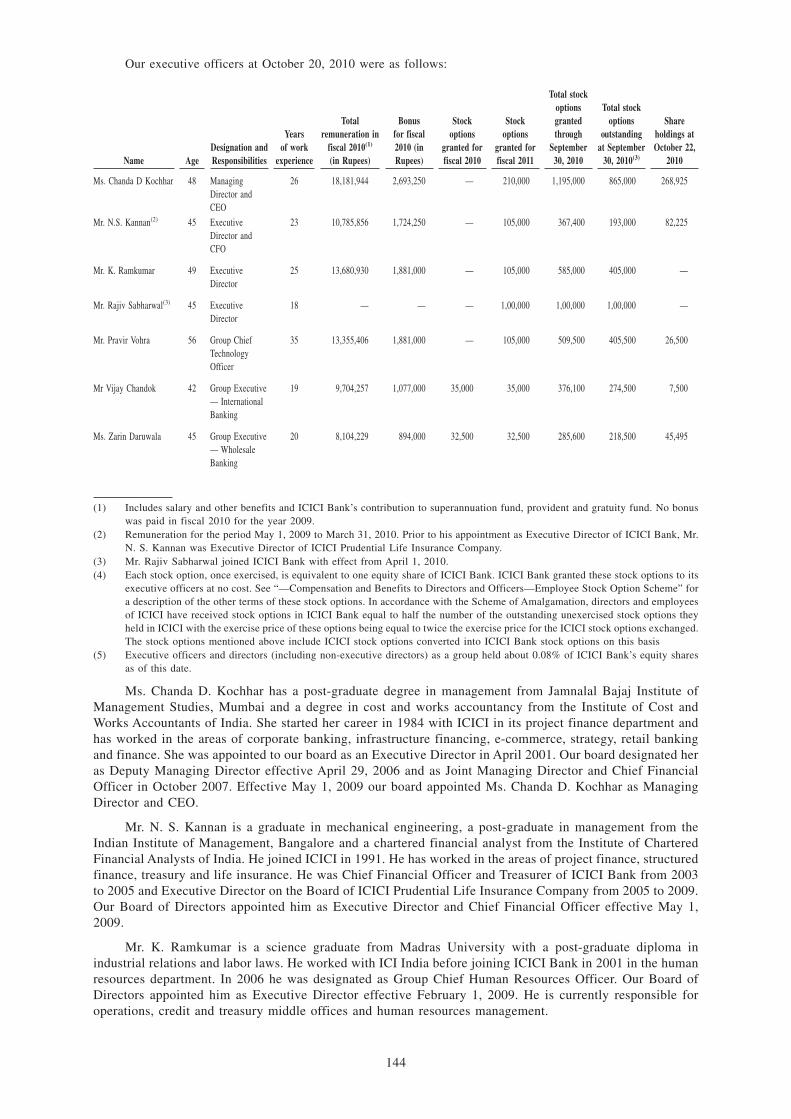
Our executive officers at October 20, 2010 were as follows:
Name AgeDesignation andResponsibilities
Yearsof work
experience
Totalremuneration in
fiscal 2010(1)
(in Rupees)
Bonusfor fiscal2010 (inRupees)
Stockoptions
granted forfiscal 2010
Stockoptions
granted forfiscal 2011
Total stockoptionsgrantedthrough
September30, 2010
Total stockoptions
outstandingat September
30, 2010(3)
Shareholdings atOctober 22,
2010
Ms. Chanda D Kochhar 48 ManagingDirector andCEO
26 18,181,944 2,693,250 — 210,000 1,195,000 865,000 268,925
Mr. N.S. Kannan(2) 45 ExecutiveDirector andCFO
23 10,785,856 1,724,250 — 105,000 367,400 193,000 82,225
Mr. K. Ramkumar 49 ExecutiveDirector
25 13,680,930 1,881,000 — 105,000 585,000 405,000 —
Mr. Rajiv Sabharwal(3) 45 ExecutiveDirector
18 — — — 1,00,000 1,00,000 1,00,000 —
Mr. Pravir Vohra 56 Group ChiefTechnologyOfficer
35 13,355,406 1,881,000 — 105,000 509,500 405,500 26,500
Mr Vijay Chandok 42 Group Executive— InternationalBanking
19 9,704,257 1,077,000 35,000 35,000 376,100 274,500 7,500
Ms. Zarin Daruwala 45 Group Executive— WholesaleBanking
20 8,104,229 894,000 32,500 32,500 285,600 218,500 45,495
(1) Includes salary and other benefits and ICICI Bank’s contribution to superannuation fund, provident and gratuity fund. No bonuswas paid in fiscal 2010 for the year 2009.
(2) Remuneration for the period May 1, 2009 to March 31, 2010. Prior to his appointment as Executive Director of ICICI Bank, Mr.N. S. Kannan was Executive Director of ICICI Prudential Life Insurance Company.
(3) Mr. Rajiv Sabharwal joined ICICI Bank with effect from April 1, 2010.(4) Each stock option, once exercised, is equivalent to one equity share of ICICI Bank. ICICI Bank granted these stock options to its
executive officers at no cost. See “—Compensation and Benefits to Directors and Officers—Employee Stock Option Scheme” fora description of the other terms of these stock options. In accordance with the Scheme of Amalgamation, directors and employeesof ICICI have received stock options in ICICI Bank equal to half the number of the outstanding unexercised stock options theyheld in ICICI with the exercise price of these options being equal to twice the exercise price for the ICICI stock options exchanged.The stock options mentioned above include ICICI stock options converted into ICICI Bank stock options on this basis
(5) Executive officers and directors (including non-executive directors) as a group held about 0.08% of ICICI Bank’s equity sharesas of this date.
Ms. Chanda D. Kochhar has a post-graduate degree in management from Jamnalal Bajaj Institute ofManagement Studies, Mumbai and a degree in cost and works accountancy from the Institute of Cost andWorks Accountants of India. She started her career in 1984 with ICICI in its project finance department andhas worked in the areas of corporate banking, infrastructure financing, e-commerce, strategy, retail bankingand finance. She was appointed to our board as an Executive Director in April 2001. Our board designated heras Deputy Managing Director effective April 29, 2006 and as Joint Managing Director and Chief FinancialOfficer in October 2007. Effective May 1, 2009 our board appointed Ms. Chanda D. Kochhar as ManagingDirector and CEO.
Mr. N. S. Kannan is a graduate in mechanical engineering, a post-graduate in management from theIndian Institute of Management, Bangalore and a chartered financial analyst from the Institute of CharteredFinancial Analysts of India. He joined ICICI in 1991. He has worked in the areas of project finance, structuredfinance, treasury and life insurance. He was Chief Financial Officer and Treasurer of ICICI Bank from 2003to 2005 and Executive Director on the Board of ICICI Prudential Life Insurance Company from 2005 to 2009.Our Board of Directors appointed him as Executive Director and Chief Financial Officer effective May 1,2009.
Mr. K. Ramkumar is a science graduate from Madras University with a post-graduate diploma inindustrial relations and labor laws. He worked with ICI India before joining ICICI Bank in 2001 in the humanresources department. In 2006 he was designated as Group Chief Human Resources Officer. Our Board ofDirectors appointed him as Executive Director effective February 1, 2009. He is currently responsible foroperations, credit and treasury middle offices and human resources management.
144

Mr. Rajiv Sabharwal is a graduate in mechanical engineering and a post-graduate in management fromthe Indian Institute of Management, Lucknow. He joined ICICI in 1998 and has worked in the areas of creditpolicy, collections, mortgage finance, consumer loans, rural banking, microfinance and financial inclusion. Heleft the services of the Bank in December 2008 and rejoined effective April 1, 2010, as Senior GeneralManager in charge of retail banking. Our Board of Directors appointed him as an Executive Director effectiveJune 24, 2010. He is currently responsible for retail banking, rural banking and the small and mediumenterprises and mid-corporate business.
Mr. Pravir Vohra is a post-graduate in economics from Delhi University. He was Joint President of 3iInfotech Limited (formerly ICICI Infotech Limited) before he joined ICICI Bank in 2002. He was designatedas Group Chief Technology Officer in 2006. He is currently responsible for technology, infrastructuremanagement and administration.
Mr. Vijay Chandok is a graduate in mechanical engineering and a post-graduate in management fromNarsee Monjee Institute of Management Studies, Mumbai. He joined ICICI in 1993 and has worked in theareas of project finance, corporate banking, small enterprises and retail banking. He was designated as GroupExecutive- International Banking Group in April 2010.
Ms. Zarin Daruwala is a chartered accountant. She joined ICICI in 1989 and has worked in the areas ofproject finance, corporate banking and agri-business. She was designated as Group Executive — WholesaleBanking in July 2010.
Corporate Governance
Our corporate governance policies recognize the accountability of the board and the importance ofmaking the board transparent to all our constituents, including employees, customers, investors and theregulatory authorities, and for demonstrating that the shareholders are the ultimate beneficiaries of oureconomic activities.
Our corporate governance framework is based on an effective independent board, the separation of theboard’s supervisory role from the executive management and the constitution of board committees, generallycomprising a majority of independent directors and chaired by an independent director, to oversee criticalareas and functions of executive management.
Our corporate governance philosophy encompasses not only regulatory and legal requirements, such asthe terms of listing agreements with stock exchanges, but also several voluntary practices aimed at a high levelof business ethics, effective supervision and enhancement of value for all stakeholders.
Our board’s role, functions, responsibility and accountability are clearly defined. In addition to itsprimary role of monitoring corporate performance, the functions of our board include:
• approving corporate philosophy and mission;
• participating in the formulation of strategic and business plans;
• reviewing and approving financial plans and budgets;
• monitoring corporate performance against strategic and business plans, including overseeingoperations;
• ensuring ethical behavior and compliance with laws and regulations;
• reviewing and approving borrowing limits;
• formulating exposure limits; and
• keeping shareholders informed regarding plans, strategies and performance.
To enable our board of directors to discharge these responsibilities effectively, executive managementprovides detailed reports on its performance to the board on a quarterly basis.
Our board functions either as a full board or through various committees constituted to oversee specificoperational areas. These board committees meet regularly. The constitution and main functions of the variouscommittees are given below.
145

Audit Committee
As of the date of the filing of this offering memorandum, the Audit Committee comprises fourindependent directors—Mr. Sridar Iyengar, Mr. M. K. Sharma, Mr. Homi Khusrokhan and Mr. V. Sridar. Mr.Sridar Iyengar is the Chairman of the Committee and Mr. M. K. Sharma is the Alternate Chairman. Mr. SridarIyengar, Mr. Homi Khusrokhan and Mr. V. Sridar are Chartered Accountants.
Our board of directors has also determined that Mr. Sridar Iyengar qualifies as an Audit Committeefinancial expert.
The Audit Committee provides direction to the audit function and monitors the quality of internal andstatutory audit. The responsibilities of the Audit Committee include overseeing the financial reporting processto ensure fairness, sufficiency and credibility of financial statements, recommendation of appointment andremoval of central and branch statutory auditors and chief internal auditor and the setting of theirremuneration, approval of payment to statutory auditors for other permitted services rendered by them, reviewof functioning of Whistle Blower Policy, review of the quarterly and annual financial statements beforesubmission to the board, review of the adequacy of internal control systems and the internal audit function,review of compliance with inspection and audit reports and reports of statutory auditors, review of the findingsof internal investigations, review of statement of significant related party transactions, review of managementletters/letters on internal control weaknesses issued by statutory auditors, reviewing with the management, thestatement of uses/application of funds raised through an issue (public issue, rights issue, preferential issue),the statement of funds utilized for the purposes other than those stated in the offer document/prospectus/noticeand the report submitted by the monitoring agency, monitoring the utilization of proceeds of a public or rightsissue and making appropriate recommendations to the board to take steps in this matter, discussion on thescope of audit with external auditors and examination of reasons for substantial defaults, if any, in paymentto stakeholders. The Audit Committee is also authorized to appoint/oversee the work of any registered publicaccounting firm, establish procedures for receipt and treatment of complaints received regarding accountingand auditing matters and engage independent counsel as also provide for appropriate funding for compensationto be paid to any firm/advisors. In addition, the Audit Committee also exercises oversight of the regulatorycompliance function. The Audit Committee is also authorized to approve the appointment of the ChiefFinancial Officer (i.e. the wholetime finance Director or any other person heading the finance function ordischarging that function) after assessing the qualifications, experience and background of the candidate.
All significant audit and non-audit services to be provided by our principal accountants are pre-approvedby the Audit Committee before such services are provided to us.
Board Governance and Remuneration Committee
As of the date of the filing of this offering memorandum, the Board Governance, Remuneration andNomination Committee comprises four non-executive directors—Mr. M. K. Sharma, Mr. K. V. Kamath, Mr.Sridar Iyengar and Mr. V. Prem Watsa. Mr. M. K. Sharma, an independent Director, is the Chairman of theCommittee.
The functions of the Committee include the recommendation of appointments to the board, evaluationof the performance of the Managing Director & CEO and other Executive Directors on pre-determinedparameters, recommendation to our board for the remuneration (including performance bonus and perquisites)to executive directors, approval of the policy for and quantum of bonus payable to the members of the staff,framing of guidelines for the Employees Stock Option Scheme and recommendation of grant of ICICI Bankstock options to the employees and the executive directors of ICICI Bank and its subsidiary companies.
Corporate Social Responsibility Committee
As of the date of this offering memorandum, the Corporate Social Responsibility Committee comprisesfour directors—Mr. M. K. Sharma, Dr. Anup K. Pujari, Dr. Tushaar Shah and Ms. Chanda D. Kochhar. Mr.M. K. Sharma, an independent director, is the Chairman of the Committee.
The functions of the Committee include the review of our corporate social responsibility initiatives,policies and practices and makes recommendations to our board with respect to such initiatives, policies andpractices and the review and implementation of other matters related to corporate social responsibilityinitiatives as recommended by the Reserve Bank of India or any other body.
146

Credit Committee
As of the date of the filing of this offering memorandum, the Credit Committee comprises fourdirectors—Mr. K. V. Kamath, Mr. M. S. Ramachandran, Mr. M. K. Sharma and Ms. Chanda D. Kochhar. Mr.K. V. Kamath is the Chairman of the Committee.
The functions of the Committee include review of developments in key industrial sectors and approvalof credit proposals in accordance with the authorization approved by the board.
Customer Service Committee
As of the date of the filing of this offering memorandum, the Customer Service Committee comprisesfour directors—Mr. K. V. Kamath, Mr. M. S. Ramachandran, Mr. M. K. Sharma, and Ms. Chanda D. Kochhar.Mr. K. V. Kamath is the Chairman of the Committee.
The functions of the Committee include review of customer service initiatives, overseeing thefunctioning of the Customer Service Council and evolving innovative measures for enhancing the quality ofcustomer service and improvement in the overall satisfaction level of customers.
Fraud Monitoring Committee
As of the date of the filing of this offering memorandum, the Fraud Monitoring Committee comprisessix directors—Mr. M. K. Sharma, Mr. K.V. Kamath, Mr. V. Sridar, Dr. Anup K. Pujari, Ms. Chanda D. Kochharand Mr. Rajiv Sabharwal. Mr. M. K. Sharma is the Chairman of the Committee.
The functions of the Committee include monitoring and review of all instances of fraud involving anamount of Rs.10 million and above.
Risk Committee
As of the date of the filing of this offering memorandum, the Risk Committee comprises sixdirectors—Mr. K. V. Kamath, Mr. Sridar Iyengar, Dr. Anup K. Pujari, Mr. V. Sridar, Mr. V. Prem Watsa andMs. Chanda D. Kochhar. The majority of the members of the Committee are independent directors. Mr. K. V.Kamath is the Chairman of the Committee.
The Committee reviews ICICI Bank’s risk management policies in relation to various risks (credit,market, liquidity, operational and reputation risks), investment policies and strategy and regulatory andcompliance issues in relation thereto. The Committee also reviews the risk return profile of the Bank, capitaladequacy based on risk profile of our balance sheet, Basel-II implementation, business continuity plan anddisaster recovery plan, key risk indicators and significant risk exposures.
Share Transfer and Shareholders’/Investors’ Grievance Committee
As of the date of the filing of this offering memorandum, the Share Transfer andShareholders’/Investors’ Grievance Committee comprises three directors—Mr. M. K. Sharma, Mr. HomiKhusrokhan and Mr. N. S. Kannan. Mr. M. K. Sharma, an independent director, is the Chairman of theCommittee.
The functions of the Committee include approval and rejection of transfer or transmission of equity andpreference shares, bonds, debentures and securities, issue of duplicate certificates, allotment of shares andsecurities issued from time to time, including those under stock options, review and redressal of shareholders’and investors’ complaints, delegation of authority for opening and operation of bank accounts for payment ofinterest, dividend and redemption of securities and the listing of securities on stock exchanges.
Committee of Executive Directors
As of the date of the filing of this offering memorandum, the Committee of Directors comprises all fourexecutive directors and Ms. Chanda D. Kochhar, Managing Director and CEO is the Chairperson of theCommittee. The other members are Mr. N. S. Kannan, Mr. K. Ramkumar and Mr. Rajiv Sabharwal.
The powers of the Committee include approval of credit proposals as per authorization approved by theboard, approvals in respect of borrowing and treasury operations and premises and property related matters.
147

Code of Ethics
We have adopted a Code of Business Conduct and Ethics for our directors and all our employees. Infiscal 2010, we have not amended any provision of the code that is applicable to our executive officers, norhave we granted a waiver from any provision of the code to any of our executive officers.
Compensation and Benefits to Directors and Officers
Remuneration
Under our organizational documents, each non-executive director, except the government director, isentitled to receive remuneration for attending each meeting of our board or of a board committee. The amountof remuneration payable to non-executive directors is set by our board from time to time in accordance withlimits prescribed by the Companies Act or the government. The remuneration for attending each board orcommittee meeting is currently fixed at Rs. 20,000. In addition, we reimburse directors for travel and relatedexpenses in connection with board and committee meetings and related matters. If a director is required toperform services for us beyond attending meetings, we may remunerate the director as determined by ourBoard of Directors and this remuneration may be either in addition to or as substitution for the remunerationdiscussed above. We have not paid any remuneration to non-executive directors other than the remunerationfor attending each meeting of our board or of a board committee except Mr. K. V. Kamath who is being paida remuneration of Rs. 2,000,000 per annum for a period of three years with effect from May 1, 2009. Theabove remuneration has been approved by shareholders, the Reserve Bank of India and the government ofIndia. Non-Executive Directors are not entitled to the payment of any benefits at the end of their term of office.
Our board or any committee thereof may fix, within the range approved by the shareholders, the salarypayable to the Executive Directors. We are required to obtain specific approval of Reserve Bank of India forthe actual monthly salary and performance bonus paid each year to the Executive Directors.
The following table sets forth the currently applicable monthly salary ranges:
Name and Designation Monthly Salary Range (Rs.)
Ms Chanda D. Kochhar, Managing Director and CEO ...... 700,000 - 1,350,000 (US$15,709 - US$30,296)Mr. N. S. Kannan, Executive Director and CFO................ 300,000 - 1,000,000 (US$6,732 - US$22,442)Mr. K. Ramkumar, Executive Director ............................... 300,000 - 1,000,000(US$6,732 - US$22,442)Mr. Rajiv Sabharwal, Executive Director ........................... 300,000 - 1,000,000 (US$6,732 - US$22,442)
The executive directors are entitled to perquisites (evaluated pursuant to Indian Income-tax Rules,wherever applicable, and at actual cost to us in other cases) like the benefit of our furnished accommodation,gas, electricity, water and furnishings, club fees, personal insurance, use of car and telephone at residence orreimbursement of expenses in lieu thereof, payment of income-tax on perquisites by us to the extentpermissible under the Income-tax Act, 1961 and rules framed thereunder; medical reimbursement, leave andleave travel concession, education benefits, provident fund, superannuation fund, gratuity and other retirementbenefits, in accordance with the scheme/s and rule/s applicable to retired executive directors of the Bank orthe members of the staff, as the case may be, from time to time, for these benefits. If Bank-ownedaccommodation is not provided, the Managing Director and CEO is entitled to house rent allowance of Rs.250,000 per month and the other Executive Directors are eligible for house rent allowance of Rs. 200,000 permonth and maintenance of accommodation including furniture, fixtures and furnishings, as may be providedby us.
There are no service contracts with our executive directors providing for benefits upon termination oftheir employment.
The total compensation paid by ICICI Bank to its executive directors and executive officers i.e. to Mr.K.V. Kamath, Ms. Chanda D. Kochhar, Mr. Sandeep Bakhshi, Mr. N.S. Kannan, Mr. K. Ramkumar, Mr. SonjoyChatterjee. Mr. V. Vaidyanathan and Mr. Pravir Vohra, during fiscal 2010 was Rs. 87.9 million.
148

Bonus
Each year, our Board of Directors awards discretionary bonuses to employees and Executive Directorson the basis of performance and seniority. The performance of each employee is evaluated through aperformance management appraisal system. The aggregate amount paid by ICICI Bank for bonuses to alleligible employees and executive directors for fiscal year 2010 was Rs 1.68 billion. This amount was paid infiscal 2011.
Employee Stock Option Scheme
We have an Employee Stock Option Scheme in terms of which up to 5.0% of our issued equity sharesmay be allocated to employee stock options. ICICI Bank, our subsidiaries’ and our holding company’spermanent employees and directors are eligible employees for grants of stock options. We have no holdingcompany. The maximum number of options granted to any eligible employee in a year is restricted to 0.05%of our issued equity shares at the time of the grant.
Under the stock option scheme, eligible employees are entitled to apply for equity shares. The optionsgranted for fiscal 2003 and earlier vest annually in a graded manner over a three-year period, with 20.0%,30.0% and 50.0% of the grants vesting each year, commencing not earlier than 12 months from the date ofgrant. Options granted for fiscal 2004 through fiscal 2008, vest in a graded manner over a four-year periodwith 20.0%, 20.0%, 30.0% and 30.0% of grants vesting each year, commencing from the end of 12 monthsfrom the date of grant. Options granted for fiscal 2009 vest in a graded manner over a five year period with20.0%, 20.0%, 30.0% and 30.0% of grant vesting each year, commencing from the end of 24 months from thedate of grant. The options can be exercised within 10 years from the date of grant or five years from the dateof vesting, whichever is later.
On the basis of the recommendation of the Board Governance, Remuneration and NominationCommittee, the board at its meeting held on April 24, 2010 approved a grant of approximately 2.39 millionoptions for fiscal 2010 to eligible employees and wholetime Directors. Each option confers on the beneficiarya right to apply for one equity share of face value of Rs. 10 of ICICI Bank at Rs. 977.70, which was the closingprice on that stock exchange which recorded the highest trading volume in ICICI Bank shares on April 23,2010. These options will vest over a four year period, with 20%, 20%, 30% and 30% respectively of the grantvesting each year commencing from the end of 12 months from the date of the grant. The options granted towholetime directors have been approved by Reserve Bank of India.
On the basis of the recommendation of the Board Governance, Remuneration and NominationCommittee, the board at its meeting held on October 29, 2010 approved a grant of approximately 3.1 millionoptions as a special measure to eligible employees and wholetime Directors of ICICI Bank and certain of itssubsidiaries. Each option confers on the beneficiary a right to apply for one equity share of face value of Rs.10 of ICICI Bank at Rs. 967, which was the average closing price of the stock on the stock exchange duringthe six months up to October 28, 2010. It is proposed that 50% of the options would vest on April 30, 2014and the balance 50% on April 30, 2015. The options proposed to be granted to the wholetime Directors aresubject to approval by the Reserve Bank of India.
The exercise price for options granted prior to June 30, 2003 is equal to the market price of our equityshares on the date of grant on the stock exchange, which recorded the highest trading volume on the date ofgrant. On June 30, 2003, the Securities and Exchange Board of India revised its guidelines on employee stockoptions. While the revised guidelines provided that companies were free to determine the exercise price ofstock options granted by them, they prescribed accounting rules and other disclosures, including expensing ofstock options in the income statement, which are applicable to their Indian GAAP financial statements, in theevent the exercise price was not equal to the average of the high and low market price of the equity sharesin the two week period preceding the date of grant of the options, on the stock exchange which recorded thehighest trading volume during the two week period. Effective July 22, 2004, the Securities and ExchangeBoard of India revised this basis of pricing to the latest available closing price, prior to the date of the meetingof our board of directors, in which options are granted, on the stock exchange which recorded the highesttrading volume on that date. The exercise price for options granted by us on or after June 30, 2003, but beforeJuly 22, 2004 is equal to the average of the high and low market price of the equity shares in the two weekperiod preceding the date of grant of the options, on the stock exchange which recorded the highest tradingvolume during the two week period. The exercise price of options granted on or after July 22, 2004 is equalto the closing price on the stock exchange which recorded the highest trading volume preceding the date ofgrant of options.
149
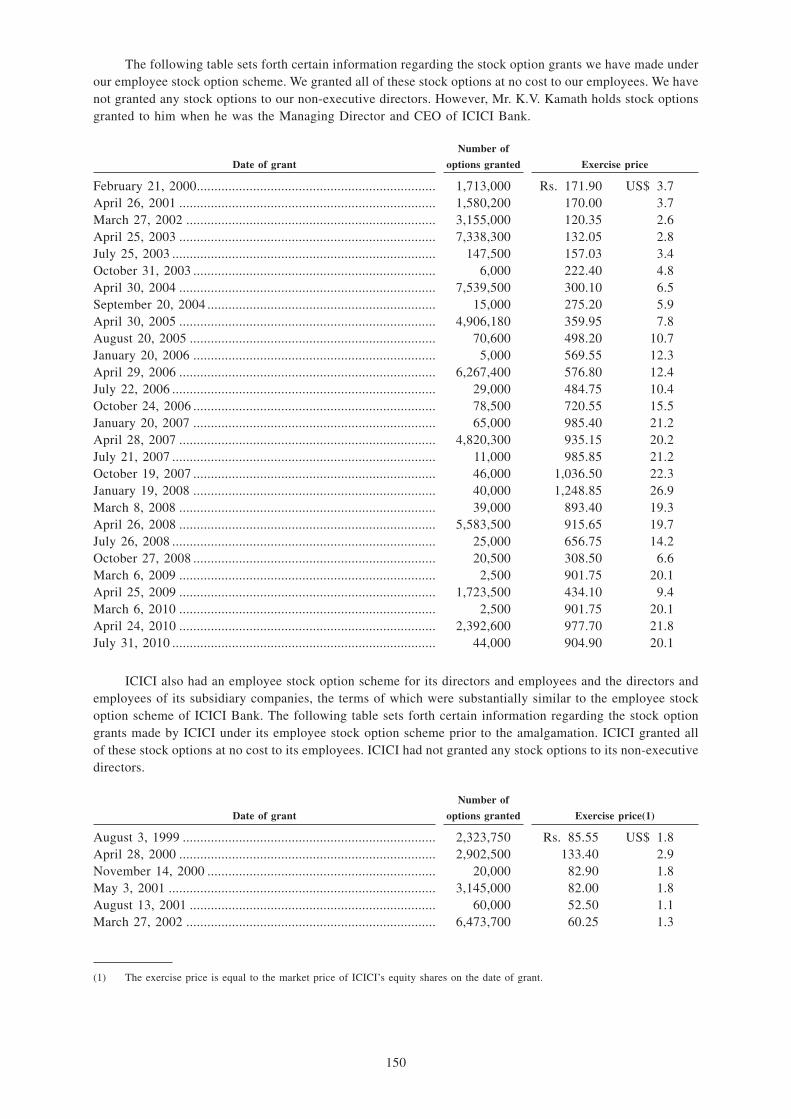
The following table sets forth certain information regarding the stock option grants we have made underour employee stock option scheme. We granted all of these stock options at no cost to our employees. We havenot granted any stock options to our non-executive directors. However, Mr. K.V. Kamath holds stock optionsgranted to him when he was the Managing Director and CEO of ICICI Bank.
Date of grant
Number of
options granted Exercise price
February 21, 2000.................................................................... 1,713,000 Rs. 171.90 US$ 3.7April 26, 2001 ......................................................................... 1,580,200 170.00 3.7March 27, 2002 ....................................................................... 3,155,000 120.35 2.6April 25, 2003 ......................................................................... 7,338,300 132.05 2.8July 25, 2003 ........................................................................... 147,500 157.03 3.4October 31, 2003 ..................................................................... 6,000 222.40 4.8April 30, 2004 ......................................................................... 7,539,500 300.10 6.5September 20, 2004 ................................................................. 15,000 275.20 5.9April 30, 2005 ......................................................................... 4,906,180 359.95 7.8August 20, 2005 ...................................................................... 70,600 498.20 10.7January 20, 2006 ..................................................................... 5,000 569.55 12.3April 29, 2006 ......................................................................... 6,267,400 576.80 12.4July 22, 2006 ........................................................................... 29,000 484.75 10.4October 24, 2006 ..................................................................... 78,500 720.55 15.5January 20, 2007 ..................................................................... 65,000 985.40 21.2April 28, 2007 ......................................................................... 4,820,300 935.15 20.2July 21, 2007 ........................................................................... 11,000 985.85 21.2October 19, 2007 ..................................................................... 46,000 1,036.50 22.3January 19, 2008 ..................................................................... 40,000 1,248.85 26.9March 8, 2008 ......................................................................... 39,000 893.40 19.3April 26, 2008 ......................................................................... 5,583,500 915.65 19.7July 26, 2008 ........................................................................... 25,000 656.75 14.2October 27, 2008 ..................................................................... 20,500 308.50 6.6March 6, 2009 ......................................................................... 2,500 901.75 20.1April 25, 2009 ......................................................................... 1,723,500 434.10 9.4March 6, 2010 ......................................................................... 2,500 901.75 20.1April 24, 2010 ......................................................................... 2,392,600 977.70 21.8July 31, 2010 ........................................................................... 44,000 904.90 20.1
ICICI also had an employee stock option scheme for its directors and employees and the directors andemployees of its subsidiary companies, the terms of which were substantially similar to the employee stockoption scheme of ICICI Bank. The following table sets forth certain information regarding the stock optiongrants made by ICICI under its employee stock option scheme prior to the amalgamation. ICICI granted allof these stock options at no cost to its employees. ICICI had not granted any stock options to its non-executivedirectors.
Date of grant
Number of
options granted Exercise price(1)
August 3, 1999 ........................................................................ 2,323,750 Rs. 85.55 US$ 1.8April 28, 2000 ......................................................................... 2,902,500 133.40 2.9November 14, 2000 ................................................................. 20,000 82.90 1.8May 3, 2001 ............................................................................ 3,145,000 82.00 1.8August 13, 2001 ...................................................................... 60,000 52.50 1.1March 27, 2002 ....................................................................... 6,473,700 60.25 1.3
(1) The exercise price is equal to the market price of ICICI’s equity shares on the date of grant.
150

In accordance with the Scheme of Amalgamation, directors and employees of ICICI and its subsidiarycompanies received stock options in ICICI Bank equal to half the number of their outstanding unexercisedstock options in ICICI. The exercise price for these options is equal to twice the exercise price for the ICICIstock options. All other terms and conditions of these options are similar to those applicable to our stockoptions pursuant to our employee stock option scheme.
The following table sets forth certain information regarding the options granted by us (including optionsgranted by ICICI adjusted in accordance with the Scheme of Amalgamation) at September 30, 2010.
Particulars ICICI Bank
Options granted................................................................................................... 55,143,055Options vested .................................................................................................... 39,494,858Options exercised................................................................................................ 27,615,511Options forfeited/lapsed...................................................................................... 8,799,527Extinguishment or modification of options ........................................................ NoneAmount realized by exercise of options ............................................................. Rs. 6,126,599,839Total number of options in force........................................................................ 18,728,017
151
OVERVIEW OF THE INDIAN FINANCIAL SECTOR
Introduction
The Reserve Bank of India, the central banking and monetary authority of India, is the central regulatoryand supervisory authority for the Indian financial system. A variety of financial intermediaries in the publicand private sectors participate in India’s financial sector, including the following:
• commercial banks;
• long-term lending institutions;
• non-bank finance companies, including housing finance companies;
• other specialized financial institutions, and state-level financial institutions;
• insurance companies; and
• mutual funds.
Until the early 1990s, the Indian financial system was strictly controlled. Interest rates wereadministered, formal and informal parameters governed asset allocation, and strict controls limited entry intoand expansion within the financial sector. The government of India’s economic reform program, which beganin 1991, encompassed the financial sector. The first phase of the reform process began with the implementationof the recommendations of the Committee on the Financial System, the Narasimham Committee I. The secondphase of the reform process began in 1999. See “Banking Sector Reform—Committee on Banking SectorReform (Narasimham Committee II)”.
This discussion presents an overview of the role and activities of the Reserve Bank of India and of eachof the major participants in the Indian financial system, with a focus on commercial banks. This is followedby a brief summary of the banking reform process along with the recommendations of various committees thathave played a key role in the reform process. A brief discussion on the impact of the liberalization process onlong-term lending institutions and commercial banks is then presented. Finally, reforms in the non-bankingfinancial sector are briefly reviewed.
The Reserve Bank of India
The Reserve Bank of India, established in 1935, is the central banking and monetary authority in India.The Reserve Bank of India manages the country’s money supply and foreign exchange and also serves as abank for the government of India and for the country’s commercial banks. In addition to these traditionalcentral banking roles, the Reserve Bank of India undertakes certain developmental and promotional roles.
The Reserve Bank of India issues guidelines on exposure limits, income recognition, asset classification,provisioning for non-performing and restructured assets, investment valuation and capital adequacy forcommercial banks, long-term lending institutions and non-bank finance companies. The Reserve Bank of Indiarequires these institutions to furnish information relating to their businesses to it on a regular basis. For furtherdiscussion regarding the Reserve Bank of India’s role as the regulatory and supervisory authority of India’sfinancial system and its impact on us, see “Supervision and Regulation”.
Commercial Banks
Commercial banks in India have traditionally focused on meeting the short-term financial needs ofindustry, trade and agriculture. At December 31, 2009, there were 165 scheduled commercial banks in thecountry, with a network of 82,511 branches serving approximately Rs. 41.95 trillion in deposit accounts.Scheduled commercial banks are banks that are listed in the schedule to the Reserve Bank of India Act, 1934,and are further categorized as public sector banks, private sector banks and foreign banks. Scheduledcommercial banks have a presence throughout India, with approximately 63.2% of bank branches located inrural or semi-urban areas of the country. A large number of these branches belong to the public sector banks.
Public Sector Banks
Public sector banks make up the largest category in the Indian banking system. They include the StateBank of India and its five associate banks, 19 nationalized banks and 84 regional rural banks. Excluding theregional rural banks, the remaining public sector banks have 57,616 branches, and accounted for 74.4% of theoutstanding gross bank credit and 78.6% of the aggregate deposits of the scheduled commercial banks atDecember 31, 2009. The public sector banks’ large network of branches enables them to fund themselves outof low cost deposits.
152

The State Bank of India is the largest bank in India in terms of total assets. At December 31, 2009, theState Bank of India and its five associate banks had 16,851 branches. They accounted for 23.4% of aggregatedeposits and 23.8% of outstanding gross bank credit of all scheduled commercial banks.
Regional rural banks were established from 1976 to 1987 by the central government, state governmentsand sponsoring commercial banks jointly with a view to develop the rural economy. Regional rural banksprovide credit to small farmers, artisans, small entrepreneurs and agricultural laborers. The National Bank forAgriculture and Rural Development is responsible for supervising the functions of the regional rural banks.In 1986 the Kelkar Committee made comprehensive recommendations covering both the organizational andoperational aspects of regional rural banks, several of which were adopted as amendments to the RegionalRural Banking Act, 1976. As part of a comprehensive restructuring program, re-capitalization of the regionalrural banks was initiated in fiscal 1995, a process which continued until fiscal 2000 and covered 187 regionalrural banks with aggregate financial support of Rs. 21.9 billion from the stakeholders. Simultaneously,prudential norms on income recognition, asset classification and provisioning for loan losses followingcustomary banking benchmarks were introduced.
Currently there are 84 regional rural banks and at December 31, 2009 they had 15,196 branches, andaccounted for 3.0% of aggregate deposits and 2.5% of gross bank credit outstanding of scheduled commercialbanks.
Private Sector Banks
After the first phase of bank nationalization was completed in 1969, public sector banks made up thelargest portion of Indian banking. The focus on public sector banks was maintained throughout the 1970s and1980s. In addition, existing private sector banks that showed signs of an eventual default were merged withstate-owned banks. In July 1993, as part of the banking reform process and as a measure to induce competitionin the banking sector, the Reserve Bank of India permitted entry of the private sector into the banking system.This resulted in the introduction of private sector banks, including us. These banks are collectively known asthe “new” private sector banks. At year-end fiscal 2010, there were seven “new” private sector banks. Inaddition, 15 old private sector banks existing prior to July 1993 were operating. The Sangli Bank Limited, anunlisted “old” private sector bank merged with us with effect from April 19, 2007. The Centurion Bank ofPunjab merged with HDFC Bank in May 2008. The Bank of Rajasthan Limited, a private sector bank, mergedwith us with effect from the close of business on August 12, 2010.
At December 31, 2009, private sector banks accounted for approximately 17.1% of aggregate depositsand 17.8% of gross bank credit outstanding of the scheduled commercial banks. Their network of 9,412branches accounted for 11.4% of the total branch network of scheduled commercial banks in the country.
In August 2010, the Reserve Bank of India released a discussion paper seeking public comment on theentry of new banks in the private sector. The broad aspects covered in the discussion paper include minimumcapital requirements, promoter shareholding, foreign shareholding in the new banks, allowing industrialbusiness houses to promote banks, converting non-banking financial companies to banks and the businessmodel of the new banks.
Foreign Banks
Currently there are 31 foreign banks operating in India and at December 31, 2009, foreign banks had 287branches in India. Foreign banks accounted for 5.5% of aggregate deposits and 5.3% of outstanding gross bankcredit of scheduled commercial banks at December 31, 2009. As part of the liberalization process, the ReserveBank of India has permitted foreign banks to operate more freely, subject to requirements largely similar tothose imposed on domestic banks. The primary activity of most foreign banks in India has been in thecorporate segment. However, some of the larger foreign banks have made retail banking significant part oftheir portfolios. Most foreign banks operate in India through branches of the parent bank. Certain foreignbanks also have wholly-owned non-bank finance company subsidiaries or joint ventures for both corporate andretail lending. In a circular dated July 6, 2004, the Reserve Bank of India stipulated that banks should notacquire any fresh stake in another banks’ equity shares, if by such acquisition, the investing bank’s holdingexceeded 5.0% of the investee bank’s equity capital. This also applies to holdings of foreign banks with apresence in India, in Indian banks.
153

The Reserve Bank of India issued a notification on “Roadmap for presence of foreign banks in India”on February 28, 2005, announcing the following measures with respect to the presence of foreign banks:
• During the first phase (up to March 2009), foreign banks will be allowed to establish a presenceby setting up wholly-owned subsidiaries or by converting existing branches into wholly-ownedsubsidiaries.
• In addition, during the first phase, foreign banks would be allowed to acquire a controlling stakein a phased manner only in private sector banks that are identified by the Reserve Bank of Indiafor restructuring.
• For new and existing foreign banks, it has been proposed to go beyond the existing World TradeOrganization commitment of allowing increases of 12 branches per year. A more liberal policy willbe followed for under-banked areas.
• During the second phase (from April 2009 onwards), after a review of the first phase, foreign bankswould be allowed to acquire up to 74.0% in private sector banks in India.
In April 2009, in view of the deterioration in the global financial markets, the Reserve Bank of Indiadecided to put on hold the second phase until greater clarity emerged on recovery as well as the reformedglobal regulatory and supervisory architecture. In the annual policy review for fiscal 2011, the Reserve Bankof India indicated that a draft discussion paper on the mode of presence of foreign banks would be releasedduring fiscal 2011. The Reserve Bank of India has indicated that the current policy and procedures governingthe presence of foreign banks in India will continue until such time.
Co-operative Banks
Co-operative banks cater to the financing needs of agriculture, small industry and self-employedbusinessmen in urban and semi-urban areas of India. The state land development banks and the primary landdevelopment banks provide long-term credit for agriculture. In the light of liquidity and insolvency problemsexperienced by some cooperative banks in fiscal 2001, the Reserve Bank of India undertook several interimmeasures, pending formal legislative changes, including measures related to lending against shares,borrowings in the call market and term deposits placed with other urban co-operative banks. Presently theReserve Bank of India is responsible for supervision and regulation of urban co-operative banks, and theNational Bank for Agriculture and Rural Development for state co-operative banks and district centralcooperative banks. The Banking Regulation (Amendment) and Miscellaneous Provisions Act, 2004 providesfor the regulation of all co-operative banks by the Reserve Bank of India. See also “—Recent StructuralReforms—Proposed Amendments to the Banking Regulation Act”. A task force appointed by the governmentof India to examine the reforms required in the co-operative banking system submitted its report in December2004. It recommended several structural, regulatory and operational reforms for co-operative banks, includingthe provision of financial assistance by the government for revitalizing this sector. In the Indian government’sbudget for fiscal 2006, the Finance Minister accepted the recommendations of the Task Force in principle andproposed to call state governments for consultation and begin to implement the recommendations in the stateswilling to do so. During fiscal 2006 the Reserve Bank of India outlined a medium term framework for urbanco-operative banks. Subsequently a task force for urban co-operative banks has been set up in select states foridentification of and drawing up of a time- bound action plan for revival of potentially viable urbanco-operative banks and for a non-disruptive exit for non-viable urban co-operative banks.
Long-Term Lending Institutions
The long-term lending institutions were established to provide medium-term and long-term financialassistance to various industries for setting up new projects and for the expansion and modernization of existingfacilities. These institutions provided fund-based and non-fund-based assistance to industry in the form ofloans, underwriting, direct subscription to shares, debentures and guarantees. The primary long-term lendinginstitutions included Industrial Development Bank of India (now a bank), IFCI Limited, and the IndustrialInvestment Bank of India as well as ICICI prior to the amalgamation.
The long-term lending institutions were expected to play a critical role in Indian industrial growth and,accordingly, had access to concessional government funding. However, in recent years, the operating
154

environment of the long-term lending institutions has changed substantially. Although the initial role of theseinstitutions was largely limited to providing a channel for government funding to industry, the reform processrequired such institutions to expand the scope of their business activities, including into:
• fee-based activities like investment banking and advisory services; and
• short-term lending activity including making corporate finance and working capital loans.
Pursuant to the recommendations of the Narasimham Committee II and the Khan Working Group, aworking group created in 1999 to harmonize the role and operations of long-term lending institutions andbanks, the Reserve Bank of India, in its mid-term review of monetary and credit policy for fiscal 2000,announced that long-term lending institutions would have the option of transforming themselves into bankssubject to compliance with the prudential norms as applicable to banks. In April 2001, the Reserve Bank ofIndia issued guidelines on several operational and regulatory issues, which were required to be addressed, inevolving the path for transition of a long-term lending institution into a universal bank. See “—RecentStructural Reforms—Universal Banking Guidelines”. In April 2002, ICICI merged with ICICI Bank. TheIndustrial Development Bank (Transfer of Undertaking and Repeal) Act, 2003 converted the IndustrialDevelopment Bank of India into a banking company incorporated under the Companies Act, 1956 onSeptember 27, 2004, with exemptions from certain statutory and regulatory norms applicable to banks,including an exemption for a certain period from the statutory liquidity ratio. IDBI Bank Limited, a newprivate sector bank that was a subsidiary of the Industrial Development Bank of India, was merged with theIndustrial Development Bank of India in April 2005.
The long-term funding needs of Indian companies are met primarily by banks, Life InsuranceCorporation of India and specialized non-bank finance companies like Infrastructure Development FinanceCorporation. Indian companies also make bond issuances to institutional and retail investors.
Non-Bank Finance Companies
There are about 12,700 non-bank finance companies in India, mostly in the private sector. All non-bankfinance companies are required to register with the Reserve Bank of India. The non-bank finance companiesmay be categorized into entities which take public deposits and those which do not. The companies which takepublic deposits are subject to strict supervision and capital adequacy requirements of the Reserve Bank ofIndia. The Reserve Bank of India classifies non-bank financial companies in three categories—asset financecompanies, loan companies and investment companies. In February 2010, the Reserve Bank of Indiaintroduced a fourth category of non-banking financial company called infrastructure finance companies. ICICISecurities Limited, our subsidiary, is a non-banking financial company which does not accept public depositsand ICICI Home Finance Company, our subsidiary, is a non-banking financial company which accepts publicdeposits. The primary activities of the non-bank finance companies are consumer credit, including automobilefinance, home finance and consumer durable products finance, wholesale finance products such as billdiscounting for small and medium-sized companies and infrastructure finance, and fee-based services such asinvestment banking and underwriting. In 2003, Kotak Mahindra Finance Limited, a large non-bank financecompany, was granted a banking license by the Reserve Bank of India and converted itself into KotakMahindra Bank.
During fiscal 2006, the Reserve Bank of India issued guidelines on the financial regulation ofsystemically important non-banking financial companies and banks’ relationship with them with a view toremove the possibility of regulatory arbitrage leading to an uneven playing field and potential systemic risk.Within non-deposit taking non-banking financial companies, the guidelines classify those with an asset sizeabove Rs. 1.0 billion as per the last audited balance sheet as systemically important. These non-bankingfinancial companies were required to maintain a minimum capital to risk weighted assets ratio of 10.0%, inaddition to conforming with single and group exposure norms. In August 2008, the Reserve Bank of Indiaissued draft guidelines covering non-deposit taking non-banking financial companies. It was proposed thatnon-deposit taking non-banking financial companies with an asset size of Rs. 1.0 billion and above will haveto maintain capital to risk weighted assets ratio of 12.0% against the current minimum of 10.0%. The capitaladequacy ratio was proposed to be increased to 15.0% from April 2009. In the annual policy statementannounced on April 21, 2009, the Reserve Bank of India deferred the implementation of capital to riskweighted assets ratio of 12.0% to March 31, 2010 and of 15.0% to March 31, 2011.
155

Housing Finance Companies
Housing finance companies form a distinct sub-group of the non-bank finance companies. As a result ofthe various incentives given by the government for investing in the housing sector in recent years, the scopeof this business has grown substantially. Housing Development Finance Corporation Limited is a leadingprovider of housing finance in India. In recent years, several other players including banks have entered thehousing finance industry. We also have a housing finance subsidiary, ICICI Home Finance Company. TheNational Housing Bank and the Housing and Urban Development Corporation Limited are the two majorfinancial institutions instituted through acts of Parliament to improve the availability of housing finance inIndia. The National Housing Bank Act provides for securitization of housing loans, foreclosure of mortgagesand setting up of the Mortgage Credit Guarantee Scheme.
Other Financial Institutions
Specialized Financial Institutions
In addition to the long-term lending institutions, there are various specialized financial institutions whichcater to the specific needs of different sectors. These include the National Bank for Agricultural and RuralDevelopment, Export Import Bank of India, Small Industries Development Bank of India, Risk Capital andTechnology Finance Corporation Limited, Tourism Finance Corporation of India Limited, National HousingBank, Power Finance Corporation Limited, Infrastructure Development Finance Corporation Limited andIndia Infrastructure Finance Company.
State Level Financial Institutions
State financial corporations operate at the state level and form an integral part of the institutionalfinancing system. State financial corporations were set up to finance and promote small and medium-sizedenterprises. The state financial institutions are expected to achieve balanced regional socio-economic growthby generating employment opportunities and widening the ownership base of industry. At the state level, thereare also state industrial development corporations, which provide finance primarily to medium-sized andlarge-sized enterprises.
Insurance Companies
Currently, there are 45 insurance companies in India, of which 23 are life insurance companies and 22are general insurance companies. There is also one re-insurance company. Of the 23 life insurance companies,22 are in the private sector and one is in the public sector. Among the general insurance companies, 16 arein the private sector and eight (including the Export Credit Guarantee Corporation of India Limited and theAgriculture Insurance Company of India Limited) are in the public sector. The re-insurance company, GeneralInsurance Corporation of India, is in the public sector. Life Insurance Corporation of India, General InsuranceCorporation of India and public sector general insurance companies also provide long-term financialassistance to the industrial sector.
The insurance sector in India is regulated by the Insurance Regulatory and Development Authority. InDecember 1999, the Indian Parliament passed the Insurance Regulatory and Development Authority Act, 1999which also amended the Insurance Act, 1938. This opened up the Indian insurance sector for foreign andprivate investors. The Insurance Act allows foreign equity participation in new insurance companies of up to26.0%. A new company should have a minimum paid up equity capital of Rs. 1.0 billion to carry on thebusiness of life insurance or general insurance or Rs. 2.0 billion to carry on exclusively the business ofreinsurance.
In the monetary and credit policy for fiscal 2001, the Reserve Bank of India issued guidelines governingthe entry of banks and financial institutions into the insurance business. The guidelines permit banks andfinancial institutions to enter the business of insurance underwriting through joint ventures provided they meetstipulated criteria relating to their net worth, capital adequacy ratio, profitability track record, level ofnon-performing loans and the performance of their existing subsidiary companies. The promoters of insurancecompanies have to divest in a phased manner their shareholding in excess of 26.0% (or such other percentageas may be prescribed), after a period of ten years from the date of commencement of business or within suchperiod as may be prescribed by the Indian government. The Indian government, while presenting its budgetfor fiscal 2005, proposed an increase in the limit on foreign equity participation in private sector insurancecompanies from 26.0% to 49.0%. However, this requires an amendment to the insurance laws and the foreigninvestment policy has not yet been implemented.
156

In fiscal 2010, the new business weighted individual premium underwritten by the life insurance sectorincreased by 16.7% to Rs. 550.2 billion compared to Rs. 471.6 billion in fiscal 2009. Of the above, the shareof private sector decreased from 57.0% in fiscal 2009 to 52.3% in fiscal 2010. The first year premiumunderwritten in the general insurance sector amounted to Rs. 347.6 billion in fiscal 2010 as against Rs. 306.4billion in fiscal 2009, recording a year-on-year growth of 13.4%. The share of private sector decreasedmarginally from 41.2% in fiscal 2009 to 40.9% in fiscal 2010. Recently, the Insurance Regulatory andDevelopment authority introduced revisions to the unit-linked insurance products such as an increase in thelock-in period from three years to five years, a minimum mortality cover, a cap on surrender and other chargesand a minimum guaranteed return of 4.5% on pension annuity products. The minimum guaranteed return of4.5 % on pension products is applicable up to year-end fiscal 2011. From fiscal 2012 the guaranteed returnwill be 50 basis points above the average reverse repo rate subject to a maximum of 6% and a minimum of3%. On October 21, 2010, the Insurance Regulatory and Development Authority ordered that insurers are notpermitted to sell universal life insurance products until guidelines on the regulation of such products arefinalized. These changes are expected to impact the life insurance business in India. See also “RiskFactors—Risks Relating to Our Business—Our life insurance business has reported statutory losses sinceinception until fiscal 2009”. Gross premiums underwritten by general insurance companies moderated in fiscal2008 and fiscal 2009 owing to de-tariffing of the general insurance sector. Until January 1, 2007, almost 70.0%of the general insurance market was subject to price controls under a tariff regime. With the commencementof a tariff free regime effective January 1, 2007, the resultant competitive pricing has led to a significantdecrease in premium rates across the industry leading to moderate premium growth during fiscal 2009 andfiscal 2010. We have joint ventures in each of the life insurance and the general insurance sectors. Our lifeinsurance joint venture, ICICI Prudential Life Insurance Company, and general insurance joint venture, ICICILombard General Insurance Company, are both the largest players in the private sector.
Mutual Funds
Currently there are 40 mutual funds in India with average assets under management for July 2010 of Rs.6,655.7 billion. Average assets under management of all mutual funds increased by 51.5% from Rs. 4,932.9billion at March 2009 to Rs. 7,475.3 billion at March 2010. From year 1963 to 1987, Unit Trust of India wasthe only mutual fund operating in the country. It was set up in 1963 at the initiative of the government andthe Reserve Bank of India. From 1987 onwards, several other public sector mutual funds entered this sector.These mutual funds were established by public sector banks, the Life Insurance Corporation of India andGeneral Insurance Corporation of India. The mutual funds industry was opened up to the private sector in1993. The industry is regulated by the Securities and Exchange Board of India (Mutual Fund) Regulation,1996. Our asset management joint venture, ICICI Prudential Asset Management Company, was among the topthree mutual funds in India based on average assets under management for July 2010 with an overall marketshare of about 10.0%.
In June 2009, the Securities and Exchange Board of India removed the entry load, up front chargesdeducted by mutual funds, for all mutual fund schemes and required that the up front commission todistributors should be paid by the investor to the distributor directly. In February 2010, the Securities andExchange Board of India introduced guidelines for the valuation of money market and debt securities with aview to ensure that the value of money market and debt securities in the portfolio of mutual fund schemesreflect the current market scenario. The valuation guidelines are effective from August 1, 2010.
Impact of Liberalization on the Indian Financial Sector
Until 1991, the financial sector in India was heavily controlled and commercial banks and long-termlending institutions, the two dominant financial intermediaries, had mutually exclusive roles and objectivesand operated in a largely stable environment, with little or no competition. Long-term lending institutions werefocused on the achievement of the Indian government’s various socio-economic objectives, including balancedindustrial growth and employment creation, especially in areas requiring development. Long-term lendinginstitutions were extended access to long-term funds at subsidized rates through loans and equity from thegovernment of India and from funds guaranteed by the government of India originating from commercialbanks in India and foreign currency resources originating from multilateral and bilateral agencies.
The focus of the commercial banks was primarily to mobilize household savings through demand andtime deposits and to use these deposits to meet the short-term financial needs of borrowers in industry, tradeand agriculture. In addition, the commercial banks provided a range of banking services to individuals andbusiness entities.
157

However, since 1991, there have been comprehensive changes in the Indian financial system. Variousfinancial sector reforms, implemented since 1991, have transformed the operating environment of the banksand long-term lending institutions. In particular, the deregulation of interest rates, emergence of a liberalizeddomestic capital market, and entry of new private sector banks, along with the transformation of long-termlending institutions into banks, have progressively intensified the competition among banks. The ReserveBank of India permitted the transformation of long-term lending institutions into banks subject to compliancewith the prudential norms applicable to banks.
Banking Sector Reform
Most large banks in India were nationalized in 1969 and thereafter were subject to a high degree ofcontrol until reform began in 1991. In addition to controlling interest rates and entry into the banking sector,these regulations also channeled lending into priority sectors. Banks were required to fund the public sectorthrough the mandatory acquisition of low interest-bearing government securities or statutory liquidity ratiobonds to fulfill statutory liquidity requirements. As a result, bank profitability was low, non-performing assetswere comparatively high, capital adequacy was diminished, and operational flexibility was hindered.
Committee on the Financial System (Narasimham Committee I)
The Committee on the Financial System (The Narasimham Committee I) was set up in August 1991 torecommend measures for reforming the financial sector. Many of the recommendations made by thecommittee, which addressed organizational issues, accounting practices and operating procedures, wereimplemented by the government of India. The major recommendations that were implemented included thefollowing:
• with fiscal stabilization and the government increasingly resorting to market borrowing to raiseresources, the statutory liquidity ratio or the proportion of the banks’ net demand and timeliabilities that were required to be invested in government securities was reduced from 38.5% inthe pre-reform period to 25.0% in October 1997. The Reserve Bank of India currently requiresbanking companies to maintain a liquidity ratio 25.0%;
• similarly, the cash reserve ratio or the proportion of a bank’s net demand and time liabilities thatwas required to be deposited with the Reserve Bank of India was reduced from 15.0% in thepre-reform period to a low of 4.5%. The cash reserve ratio effective April 24, 2010 is 6.0%.
• special tribunals were created to resolve bad debt problems;
• most of the restrictions on interest rates for deposits were removed. Commercial banks wereallowed to set their own level of interest rates for all deposits except savings bank deposits; and
• substantial capital infusion to several state-owned banks was approved in order to bring theircapital adequacy closer to internationally accepted standards. By the end of fiscal 2002, aggregatere-capitalization amounted to Rs. 217.5 billion. Stronger public sector banks were givenpermission to issue equity to further increase capital.
Committee on Banking Sector Reform (Narasimham Committee II)
The second Committee on Banking Sector Reform (Narasimham Committee II) submitted its report inApril 1998. The major recommendations of the committee were in respect of capital adequacy requirements,asset classification and provisioning, risk management and merger policies. The Reserve Bank of Indiaaccepted and began implementing many of these recommendations in October 1998.
Recent Structural Reforms
Amendments to the Banking Regulation Act
The government promulgated an ordinance in 2007 enabling the Reserve Bank of India to specify thestatutory liquidity ratio without any floor rate. The ordinance has subsequently been repealed and replaced bythe Banking Regulation (Amendment) Act, 2007.
158

Amendments to the Reserve Bank of India Act
In May 2006, the Indian Parliament approved amendments to the Reserve Bank of India Act removingthe floor rate of 3.0% for cash reserve ratio requirement, giving the Reserve Bank of India discretion to reducethe cash reserve ratio to less than 3.0%. The amendments also created a legal and regulatory framework forderivative instruments.
Amendments to Laws Governing Public Sector Banks
In 2006, the Indian Parliament amended the laws governing India’s public sector banks permitting thesebanks to issue preference shares and make preferential allotments or private placements of equity. Theamendments also authorize the Reserve Bank of India to prescribe ‘fit and proper’ criteria for directors of suchbanks and to permit the supercession of their boards and appointment of administrators in certaincircumstances.
Proposed Amendments to the Banking Regulation Act
Legislation seeking to amend the Banking Regulation Act has been introduced in the Indian Parliament.As presently drafted, the main amendments propose to:
• permit all banking companies to issue preference shares that will not carry any voting rights;
• make prior approval of the Reserve Bank of India mandatory for the acquisition of more than 5.0%of a banking company’s paid- up capital or voting rights by any individual or firm or group; and
• remove the 10.0% limit on the maximum voting power exercisable by a shareholder in a bankingcompany.
Legislative Framework for Recovery of Debts due to Banks
In fiscal 2003, the Indian Parliament passed the Securitization and Reconstruction of Financial Assetsand Enforcement of Security Interest Act, 2002. This Act provides that a secured creditor may, in respect ofloans classified as non-performing in accordance with the Reserve Bank of India guidelines, give notice inwriting to the borrower requiring it to discharge its liabilities within 60 days, failing which the secured creditormay take possession of the assets constituting the security for the loan, and exercise management rights inrelation thereto, including the right to sell or otherwise dispose of the assets. This Act also provides for thesetting up of asset reconstruction companies regulated by the Reserve Bank of India to acquire assets frombanks and financial institutions. The Reserve Bank of India has issued guidelines for asset reconstructioncompanies in respect of their establishment, registration and licensing by the Reserve Bank of India, andoperations. Asset Reconstruction Company (India) Limited, set up by us, Industrial Development Bank ofIndia, State Bank of India and certain other banks and institutions, received registration from the Reserve Bankof India and commenced operation in August 2003. Foreign direct investment is now permitted in the equitycapital of asset reconstruction companies and investment by Foreign Institutional Investors registered with theSecurities and Exchange Board of India is permitted in security receipts issued by asset reconstructioncompanies, subject to certain conditions and restrictions.
Several petitions challenging the constitutional validity of the Securitization and Reconstruction ofFinancial Assets and Enforcement of Security Interest Act, 2002 were filed before the Indian Supreme Court.The Supreme Court, in April 2004, upheld the constitutionality of the Act, other than the requirementoriginally included in the Act that the borrower deposit 75.0% of the dues with the debt recovery tribunal asa pre-condition for appeal by the borrower against the enforcement measures. In November 2004, thegovernment of India issued an ordinance amending the Securitization Act. The Indian Parliament hassubsequently passed this ordinance as an Act. This Act, as amended, now provides that a borrower may makean objection or representation to a secured creditor after a notice is issued by the secured creditor to theborrower under the Act demanding payment of dues. The secured creditor has to give reasons to the borrowerfor not accepting the objection or representation. The Act also introduces a deposit requirement for borrowersif they wish to appeal the decision of the debt recovery tribunal. Further, the Act permits a lender to take overthe business of a borrower under the Securitization Act under certain circumstances (unlike the earlierprovisions under which only assets could be taken over). See “Supervision and Regulation—Reserve Bank ofIndia Regulations—Regulations Relating to Sale of Assets to Asset Reconstruction Companies”.
159

Earlier, following the recommendations of the Narasimham Committee, the Recovery of Debts due toBanks and Financial Institutions Act, 1993 was enacted. This legislation provides for the establishment of atribunal for speedy resolution of litigation and recovery of debts owed to banks or financial institutions. TheAct creates tribunals before which the banks or the financial institutions can file a suit for recovery of theamounts due to them. However, if a scheme of reconstruction is pending before the Board for Industrial andFinancial Reconstruction, under the Sick Industrial Companies (Special Provision) Act, 1985, no proceedingfor recovery can be initiated or continued before the tribunals. This protection from creditor action ceases ifthe secured creditor takes action under Securitization and Reconstruction of Financial Assets and Enforcementof Security Interest Act. While presenting its budget for fiscal 2002, the government of India announcedmeasures for the setting up of more debt recovery tribunals and the eventual repeal of the Sick IndustrialCompanies (Special Provision) Act, 1985. To date, however, this Act has not been repealed.
Corporate Debt Restructuring Forum
The Reserve Bank of India has devised a corporate debt restructuring system to put in place aninstitutional mechanism for the restructuring of corporate debt. The objective of this framework is to ensurea timely and transparent mechanism for the restructuring of corporate debts of viable entities facing problems,outside the purview of the Board of Industrial and Financial Rehabilitation, debt recovery tribunals and otherlegal proceedings. In particular, this framework aims to preserve viable corporates that are affected by certaininternal and external factors and minimize the losses to the creditors and other stakeholders through an orderlyand coordinated restructuring program. The corporate debt restructuring system is a non-statutory mechanismand a voluntary system based on debtor-creditor and inter-creditor agreements.
Universal Banking Guidelines
Universal banking in the Indian context means the transformation of long-term lending institutions intobanks. Pursuant to the recommendations of the Narasimham Committee II and the Khan Working Group, theReserve Bank of India, in its mid-term review of monetary and credit policy for fiscal 2000, announced thatlong-term lending institutions would have the option of transforming themselves into banks subject tocompliance with the prudential norms as applicable to banks. If a long-term lending institution chose toexercise the option available to it and formally decided to convert itself into a universal bank, it couldformulate a plan for the transition path and a strategy for smooth conversion into a universal bank over aspecified time frame. In April 2001, the Reserve Bank of India issued guidelines on several operational andregulatory issues which were required to be addressed in evolving the path for transition of a long-term lendinginstitution into a universal bank.
Pension Reforms
Currently, there are three categories of pension schemes in India: pension schemes for governmentemployees, pension schemes for employees in the organized sector and voluntary pension schemes. In case ofpension schemes for government employees, the government pays its employees a defined periodic benefitupon their retirement. Further, the contribution towards the pension scheme is funded solely by thegovernment and not matched by a contribution from the employees. The Employees Provident Fund,established in 1952, is a mandatory program for employees of certain establishments. It is a contributoryprogram that provides for periodic contributions of 10% to 12% of the basic salary by both the employer andthe employees. The contribution is invested in prescribed securities and the accumulated balance in the fund(including the accretion thereto) is paid to the employee as a lump sum on retirement. Besides these, there arevoluntary pension schemes administered by the government (the Public Provident Fund to which contributionmay be made up to a maximum of Rs. 70,000) or offered by insurance companies, where the contribution maybe made on a voluntary basis. Such voluntary contributions are often driven by tax benefits offered under thescheme.
In 1998, the government commissioned the Old Age Social and Income Security project and nominatedan expert committee to suggest changes to the existing policy framework. The committee submitted its reportin January 2000, recommending a system for private sector management of pension funds to providemarket-linked returns. It also recommended the establishment of a separate pension regulatory authority toregulate the pensions system. Subsequently, in the budget for fiscal 2001, the government announced that ahigh level committee would be formulated to design a contribution-based pension scheme for new governmentrecruits. The government also requested that the Insurance Regulatory and Development Authority draw up aroadmap for implementing the OASIS Report. The Insurance Regulatory and Development Authority
160

submitted its report in October 2001. The report suggested that pension fund managers should constitute aseparate legal entity to conduct their pension business. In August 2003, the government announced that itwould be mandatory for its new employees (excluding defense personnel) to join a new defined contributionpension scheme where both the government and the employee would make monthly contributions of 10% ofthe employee’s basic salary. The government also announced that a Pension Fund Development andRegulatory Authority would be set up to regulate the pension industry. The government constituted the interimPension Fund Development and Regulatory Authority on October 11, 2003. In December 2003, thegovernment announced that the new pension system would be applicable to all new recruits to Indiangovernment service (excluding defense personnel) from January 1, 2004. Further, on December 30, 2004, thegovernment promulgated an ordinance establishing the statutory regulatory body, Pension Fund Regulatoryand Development Authority to undertake promotional, developmental and regulatory functions with respect tothe pension sector. In March 2005, the government tabled the Pension Fund and Development Authority Billin Parliament. The Indian government’s budget for fiscal 2006 recognized the opportunities for foreign directinvestment in the pension sector and it has also announced that the government would issue guidelines for suchinvestment. In 2009, the government extended the New Pension System to all citizens of India on a voluntarybasis, effective from May 1, 2009. Private sector participation in managing pension assets was permitted forthe first time in fiscal 2009, and six private sector companies have been issued licenses. See also“Business—Overview”.
Impact of Global Financial Crisis on India
The bankruptcy of Lehman Brothers in September 2008 led to a rapid deterioration of the globalmacroeconomic environment and a sharp moderation in global economic activity. In India, this impact was feltmainly through the trade and capital channels. As a result, there was a sharp reduction in domestic liquidityin September-October 2008. The decline in global commodity prices led to a moderation in inflation andfacilitated substantial reductions in key policy rates and reserve requirements. The Reserve Bank of Indiareduced repo and reverse repo rates and the statutory liquidity ratio and cash reserve ratio requirements to easeliquidity situation, especially for non-banking financial companies and mutual fund companies.
Credit Policy Measures
The Reserve Bank of India issues an annual policy statement setting out its monetary policy stance andannouncing various regulatory measures. The Reserve Bank of India issues a review of the annual policystatement on a quarterly basis.
Annual Policy Statement for Fiscal 2010
In its annual policy statement for fiscal 2010 announced on April 21, 2009, the Reserve Bank of Indiareduced the repo rate by 25 basis points from 5.0% to 4.75% and the reverse repo rate by 25 basis points from3.5% to 3.25% effective April 21, 2009. Other measures announced by the Reserve Bank of India were:
• With effect from April 1, 2010, payment of interest on savings bank accounts of scheduledcommercial banks would be calculated on a daily product basis and not on minimum balances heldin the accounts during the period from the tenth day to the last day of each calendar month. Thiswould increase the cost of savings deposits and total deposits for banks.
• Constitute a working group to review the present benchmark prime lending rate system and suggestchanges to make credit pricing more transparent.
Annual Policy Statement for Fiscal 2011
In its annual policy statement for fiscal 2011, announced on April 20, 2010, the Reserve Bank of Indiaincreased the repo rate by 25 basis points from 5.0% to 5.25%, the reverse repo rate by 25 basis points from3.5% to 3.75% effective April 20, 2010 and the cash reserve ratio by 25 basis points from 5.75% to 6.0%effective April 24, 2010. Other measures announced by the Reserve Bank of India were:
• Preparation of a discussion paper by September 2010 on the mode of presence of foreign banksthrough branches or wholly owned subsidiaries.
161

• Preparation of a discussion paper by end-July 2010 discussing international practices, the Indianexperience and also the current ownership and governance guidelines in considering whether togrant additional banking licenses to private sector players.
• Constituting a working group to recommend a roadmap for the introduction of a holding companystructure.
Effective July 2, 2010, the Reserve Bank of India increased the repo and reverse repo rates by 25 basispoints each to 5.5% and 4.0% respectively.
First Quarter Review of Annual Policy Statement for Fiscal 2011
In its first quarter review of the annual policy statement for fiscal 2011 announced on July 27, 2010, theReserve Bank of India increased the repo rate by 25 basis points from 5.5% to 5.75% and the reverse repo rateby 50 basis points from 4.0% to 4.50%.
Mid Quarter Review of Annual Policy Statement for Fiscal 2011 in September 2010
In its mid quarter review of the annual policy statement for fiscal 2011 announced on September 16,2010, the Reserve Bank of India increased the repo rate by 25 basis points from 5.75% to 6.00% and thereverse repo rate by 50 basis points from 4.50% to 5.00%.
Second Quarter Review of Annual Policy Statement for fiscal 2011
In its second quarter review of the annual policy statement for fiscal 2011 announced on November 2,2010, the Reserve Bank of India increased the repo rate by 25 basis points from 6.00% to 6.25% and thereverse repo by 25 basis points from 5.00% to 5.25%. Other measures announced by the Reserve Bank of Indiawere:
• The risk weight for residential housing loans of more than Rs. 7.5 million irrespective of theloan-to-value ratio was increased to 125%.
• The loan-to-value ratio for housing loans was capped at 80%.
• Standard asset provisioning on home loans sanctioned at teaser rates (loans offered atcomparatively lower rate of interest in the first few years, after which rates are reset at higher rates)was increased from 0.4% to 2.0%.
• The threshold for investments by financial conglomerates in their significant entities wasdecreased to 20% from the present 30%, such that where investments exceed 20% of the paid-upcapital of such entities, it will be deducted at 50% from Tier I and 50% from Tier II capital.
• A discussion paper with pros and cons of deregulation of savings deposit interest rates, which iscurrently fixed at 3.5%, will be released by end December 2010.
• Guidelines stipulating prudential limits to regulate the investments of banks in companies engagedin forms of business other than financial services will be issued separately.
• Draft guidelines on licensing of new private sector banks will be issued by end January 2011.
• Final guidelines on compensation practices in banks will be issued in December 2010.
• Detailed guidelines to fully align corporate governance practices in India with principlesenunciated by the Basel Committee on Banking Supervision will be issued.
• All scheduled commercial banks will convert their opening balance sheet as of April 1, 2013 incompliance with Indian Accounting Standards’ convergence with International Financial ReportingStandards (IFRS).
Reforms of the Non-Bank Finance Companies
Standards relating to income recognition, provisioning and capital adequacy were prescribed fornon-bank finance companies in June 1994. Registered non-bank finance companies were required to achievea minimum capital adequacy of 6.0% by year-end fiscal 1995 and 8.0% by year-end fiscal 1996 and to obtaina minimum credit rating. To encourage the companies complying with the regulatory framework, the ReserveBank of India announced in July 1996 certain liberalization measures under which the non-bank financecompanies registered with it and complying with the prudential norms and credit rating requirements weregranted freedom from the ceiling on interest rates on deposits and amount of deposits. Other measures
162

introduced include requiring non-bank finance companies to maintain a certain percentage of liquid assets andto create a reserve fund. The percentage of liquid assets to be maintained by non-bank finance companies hasbeen revised uniformly upwards to 15.0% of public deposits since April 1999. From January 1, 2000, therequirement should not be less than 10.0% in approved securities and the remaining in unencumbered termdeposits in any scheduled commercial bank, the aggregate of which shall not be less than 15.0% of the “publicdeposit” outstanding at the close of business on the last working day of the second preceding quarter. Themaximum rate of interest that non-bank finance companies could pay on their public deposits was reducedfrom 12.5% per annum to 11.0% per annum effective March 4, 2003. Effective April 24, 2007, the maximumrate of interest on public deposits accepted by non-bank finance companies was increased to 12.5% per annum.
Efforts have also been made to integrate non-bank finance companies into the mainstream financialsector. The first phase of this integration covered measures relating to registrations and standards. The focusof supervision has now shifted to non-bank finance companies accepting public deposits. This is becausecompanies accepting public deposits are required to comply with all the directions relating to public deposits,prudential norms and liquid assets. A task force on non-bank finance companies set up by the government ofIndia submitted its report in October 1998, and recommended several steps to rationalize the regulation ofnon-bank finance companies. Accepting these recommendations, the Reserve Bank of India issued newguidelines for non-bank finance companies, which were as follows:
• a minimum net owned fund of Rs. 3 million is mandatory before existing non-bank financecompanies may accept public deposits;
• a minimum investment grade rating is compulsory for loan and investment companies acceptingpublic deposits, even if they have the minimum net owned funds;
• permission to accept public deposits was also linked to the level of capital to risk assets ratio.Different capital to risk assets ratio levels for non-bank finance companies with different ratingswere specified; and
• non-bank finance companies were advised to restrict their investments in real estate to 10.0% oftheir net owned funds.
In the monetary and credit policy for fiscal 2000, the Reserve Bank of India stipulated a minimum capitalbase of Rs. 20 million for all new non-bank finance companies. In the government of India’s budget for fiscal2002, the procedures for foreign direct investment in non-bank finance companies were substantiallyliberalized.
During fiscal 2003, the Reserve Bank of India introduced a number of measures to enhance theregulatory and supervisory standards of non-bank finance companies, especially in order to bring them at parwith commercial banks, in select operations, over a period of time. Other regulatory measures adopted andsubsequently revised in November 2004 included aligning interest rates in this sector with the rates prevalentin the rest of the economy, tightening prudential norms and harmonizing supervisory directions with therequirements of the Companies Act, procedural changes in nomination facilities, issuance of a Know YourCustomer policy and allowing non-bank finance companies to enter the insurance agency business.
In 2005, the Reserve Bank of India introduced stricter regulatory measures for non-bank financecompanies, including stringent reporting requirements and revised Know Your Customer guidelines.
On December 12, 2006, the Reserve Bank of India issued guidelines on the financial regulation ofsystematically important non-banking financial companies and banks’ relationships with them with a view toremove the possibility of regulatory arbitrage leading to an uneven playing field and potential systemic risk.Within non-deposit taking non-banking financial companies, the guidelines classify those with an asset sizeabove Rs. 1.0 billion as per the last audited balance sheet as systemically important. These non-bankingfinancial companies are required to maintain a minimum capital to risk weighted assets ratio of 10.0%, inaddition to conforming with single and group exposure norms. The guidelines restrict banks’ holdings in adeposit taking non-banking financial company, excluding housing finance companies, to 10.0% of the paid upequity capital of the non-banking financial company. The total exposure to a single non-banking financialcompany has been limited to 10.0% of a bank’s capital funds (15.0% in the case of an asset finance company).The limit may be increased to 15.0% and 20.0%, respectively, provided that the excess exposure is on accountof funds lent by the non-banking financial company to the infrastructure sector. In August 2008, the ReserveBank of India issued draft guidelines covering non-deposit taking non-banking financial companies. It wasproposed that non-deposit taking non-banking financial companies with asset size of Rs. 1.0 billion and above
163

will have to maintain capital to risk weighted assets ratio of 12.0% against the current minimum of 10.0%. Thecapital adequacy ratio was proposed to be increased to 15.0% from April 2009. In the annual policy statementannounced on April 21, 2009, the Reserve Bank of India deferred the implementation of capital to riskweighted assets of 12.0% to March 31, 2010 and of 15.0% to March 31, 2011.
As per existing instructions of the Reserve Bank of India, non-banking financial companies in Indiahaving assets of Rs. 500 million and above as per their last audited results are required to constitute an auditcommittee, consisting of no less than three members of its Board of Directors. In May 2007 the Reserve Bankof India announced that non-banking financial companies with deposit base of Rs. 200 million and above mayalso consider constituting an audit committee on similar lines. Further, the Reserve Bank of India has alsoinstructed non-banking financial companies with public deposits of Rs. 200 million and above or having anasset size of Rs. 1.0 billion or above to form a nomination committee to ensure ‘fit and proper’ status ofproposed/existing directors for such companies. The Reserve Bank of India also instructed such non-bankingfinancial companies to form a risk management committee to manage integrated risk. Additionally, theReserve Bank of India also prohibited such non-banking financial companies from extending loans, advancesor non-fund based facilities or any other financial accommodation/facilities to their directors and/or certainother connected persons. The Reserve Bank of India classifies non-bank finance companies under threecategories—asset finance companies, loan companies and investment companies. In February 2010, theReserve Bank of India introduced a fourth category of non-banking financial company, called infrastructurefinance companies.
164

SUPERVISION AND REGULATION
The main legislation governing commercial banks in India is the Banking Regulation Act. Otherimportant laws include the Reserve Bank of India Act, the Negotiable Instruments Act, the Foreign ExchangeManagement Act and the Banker’s Books Evidence Act. Additionally, the Reserve Bank of India, from timeto time, issues guidelines to be followed by banks. Compliance with all regulatory requirements is evaluatedwith respect to financial statements under Indian GAAP. Banking companies in India are also subject to thepurview of the Companies Act and if such companies are listed on a stock exchange in India, then variousregulations of the Securities Exchange Board of India would additionally apply to such companies.
Reserve Bank of India Regulations
Commercial banks in India are required under the Banking Regulation Act to obtain a license from theReserve Bank of India to carry on banking business in India. Before granting the license, the Reserve Bankof India must be satisfied that certain conditions are complied with, including (i) that the bank has the abilityto pay its present and future depositors in full as their claims accrue; (ii) that the affairs of the bank will notbe or are not likely to be conducted in a manner detrimental to the interests of present or future depositors;(iii) that the bank has adequate capital and earnings prospects; and (iv) that the public interest will be servedif such license is granted to the bank. The Reserve Bank of India can cancel the license if the bank fails tomeet the above conditions or if the bank ceases to carry on banking operations in India.
ICICI Bank, because it is licensed as a banking company, is regulated and supervised by the ReserveBank of India. The Reserve Bank of India requires us to furnish statements and information relating to ourbusiness. It has issued, among others, guidelines for commercial banks on recognition of income, classificationof assets, exposure norms on concentration risk, valuation of investments, maintenance of capital adequacyand provisioning for non-performing assets. The Reserve Bank of India has set up a Board for FinancialSupervision, under the chairmanship of the Governor of the Reserve Bank of India. The appointment of theauditors of banks is subject to the approval of the Reserve Bank of India. The Reserve Bank of India can directa special audit in the interest of the depositors or in the public interest.
Regulations Relating to the Opening of Branches
Section 23 of the Banking Regulation Act provides that banks must obtain the prior approval of theReserve Bank of India to open new branches. Permission is granted based on factors such as the financialcondition and history of the banking company, its management, adequacy of capital structure and earningprospects and the public interest. The Reserve Bank of India may cancel the license for violations of theconditions under which it was granted. Under the banking license granted to us by the Reserve Bank of India,we are required to locate at least 25.0% of our branches in rural and semi-urban areas. A rural area is definedas a center with a population of less than 10,000. A semi-urban area is defined as a center with a populationof greater than 10,000 but less than 100,000. These population figures relate to the 2001 census conducted bythe government of India. In September 2005, the Reserve Bank of India issued a new branch authorizationpolicy in terms of which the system of granting authorizations for opening individual branches from time totime was replaced by a system of aggregated approvals on an annual basis. The Reserve Bank of Indiadiscusses with individual banks their branch expansion strategies and plans over the medium term. The term“branch” for this purpose would include a full-fledged branch, an extension counter, off-site ATMs,administrative office, and back offices. While processing authorization requests, the Reserve Bank of Indiagives importance to the nature and scope of banking services particularly in under-banked areas, credit flowto the priority sector and efforts to promote financial inclusion, the need to induce enhanced competition inthe banking sector, the bank’s regulatory compliance, quality of governance, risk management andrelationships with subsidiaries and affiliates. In December 2009, the Reserve Bank of India permitted banksto open branches in tier 3 to tier 6 centers (centers with population up to 49,999), as defined on the basis ofpopulation size as per the census of 2001, without obtaining prior approval. However, banks are required toreport the opening of such branches to the Reserve Bank of India. In its annual policy statement for fiscal2010, announced on April 21, 2009, the Reserve Bank of India permitted banks to install offsite ATMs withoutprior permission.
In July 2010, permission was granted to schedule commercial banks to operate well-protected vans asmobile branches or ATMs in tier 3 to tier 6 cities.
165

Capital Adequacy Requirements
We are required to comply with the capital adequacy guidelines issued by the Reserve Bank of India. InApril 2007, the Reserve Bank of India issued guidelines for the implementation of a capital adequacyframework based on the revised framework approved by the Basel Committee on Banking Supervision, orBasel II. These guidelines became applicable to banks that have an international presence, like us, effectiveyear-end fiscal 2008 and to all other banks effective year-end fiscal 2009. These guidelines require banks tomaintain a minimum capital to risk weighted asset ratio of 9.0%, of which a minimum of 6.0% (an increasefrom 4.5% required by the earlier Basel I guidelines) must be tier I capital. The guidelines stipulate thatinvestments above 30.0% in the paid up equity of financial subsidiaries and associates which are notconsolidated for capital purposes and investments in other instruments eligible for regulatory capital status inthose entities must be deducted to the extent of 50.0% from tier I capital and 50.0% from tier II capital. Theguidelines also introduce a capital charge for operational risk. We are required to maintain capital adequacybased on the higher of minimum capital required under Basel II or the prudential floor specified for minimumcapital required under Basel I. The prudential floor for Basel I for years ending March 31, 2008, 2009 and2010 is 100.0%, 90.0% and 80.0%, respectively.
Risk adjusted assets and off-balance sheet items considered for determining the capital adequacy ratioare the risk weighted total of funded and non-funded exposures. Degrees of credit risk expressed as percentageweighting have been assigned to various balance sheet asset items and off-balance sheet items. The creditequivalent value of off-balance sheet items is determined by applying conversion factors to the notionalamount of the off-balance sheet items. The conversion factor ranges between 20.0% to 100.0% depending onthe nature and maturity of the off-balance sheet item. The value of each item is multiplied by the relevant riskweight (and conversion factor for off-balance sheet items) to produce risk-adjusted values of assets andoff-balance sheet items. Consumer credit exposures attract a risk weight of 125.0% and exposures meeting thequalifying criteria of regulatory retail, defined by the Reserve Bank of India, attract a risk weight of 75%. Therisk weight for capital market exposure are set at 125% and loans secured by residential property attract adifferential risk weight ranging from 50% to 100% based on the size of the loan and the loan-to-value ratio.Exposures to commercial real estate are risk weighted at 100.0%, venture capital funds are weighted at 150.0%and other unrated loans/credit exposures at 100.0%. Credit exposures to rated corporates are risk weightedbased on the external credit ratings at a facility level. Banks are also required to maintain a capital charge formarket risk in respect of their trading book exposure (including derivatives) and securities included in theavailable for sale category. All open foreign exchange positions carry a 100.0% risk weight. Capitalrequirements have also been prescribed for open positions in gold. Banks are also expected to compute theircredit exposures, arising on account of interest rate and foreign exchange derivative transactions and gold,using the current exposure method.
In July 2009, the Reserve Bank of India issued a time schedule for the introduction of advancedapproaches of Basel II framework in India whereby banks are required to apply to the Reserve Bank of Indiafor migration to internal models approach for market risk and the standardized approach for operational riskafter April 1, 2010 and for advanced measurement approach for operational risk and internal ratings basedapproaches for credit risk after April 1, 2012.
The Reserve Bank of India issued guidelines on securitization of standard assets on February 1, 2006.The guidelines define criteria for true sale of assets, criteria to be met by special purpose vehicles set up forsecuritization, policy on provision of credit enhancement facilities, liquidity facilities, underwriting facilitiesand provision of services. The guidelines also cover capital requirements on securitization, prudential normsfor investment in securities issued by special purpose vehicles, accounting treatment of the securitizationtransactions and disclosure requirements. In April 2007, the Reserve Bank of India issued Basel-II accordbased prudential guidelines pursuant to which certain unrated securitization exposures will have to bededucted 50.0% from tier I and 50.0% from tier II capital. The guidelines have also specified differential riskweight mapping based on the rating of the securitization exposure of the originator/investor.
The total capital of a bank is classified into tier I and tier II capital. Tier I capital provides the mostpermanent and readily available support against unexpected losses. It comprises paid-up capital, reservesconsisting of any statutory reserves, other disclosed free reserves and innovative perpetual debt instrumentsissued in compliance with current regulations issued by the Reserve Bank of India for inclusion in tier I capitalas reduced by intangible assets and losses in the current period and those brought forward from the previousperiod. In fiscal 2003, the Reserve Bank of India issued a guideline requiring a bank’s deferred tax asset tobe treated as an intangible asset and deducted from its tier I capital. In July 2009, the Reserve Bank of Indiaclarified that the special reserve created by banks should be considered net-of-tax payable in the tier I capital.
166

Tier II capital includes undisclosed reserves, revaluation reserves (at a discount of 55.0%), generalprovisions and loss reserves (allowed up to a maximum of 1.25% of risk weighted assets), hybrid debt capitalinstruments (which combine certain features of both equity and debt securities and are able to support losseson an ongoing basis without triggering liquidation), and subordinated debt. Commencing five years frommaturity, any subordinated debt is subject to progressive discounts each year for inclusion in tier II capital andtotal subordinated debt considered as tier II capital cannot exceed 50.0% of tier I capital. Tier II capital cannotexceed tier I capital.
The Reserve Bank of India has issued guidelines permitting banks to issue perpetual debt with a calloption which may be exercised after not less than ten years, with its prior approval, for inclusion in tier Icapital up to a maximum of 15.0% of total tier I capital. The Reserve Bank of India has also permitted banksto issue debt instruments with a minimum maturity of 15 years and a call option after not less than ten years,to be exercised with its prior approval, for inclusion in upper tier II capital. In July 2006, the Reserve Bankof India issued guidelines permitting the issuance of tier I and tier II debt instruments denominated in foreigncurrencies. In October 2007, to enhance the range of eligible instruments available to banks for capitaladequacy purposes, the Reserve Bank of India issued guidelines permitting banks to issue preference sharesas part of regulatory capital. Banks have been allowed to issue perpetual non-cumulative preference shares aspart of tier I capital and perpetual cumulative preference shares, redeemable non-cumulative preference sharesand redeemable cumulative preference shares as part of tier II capital. Further, the Parliament amended thelaws governing India’s public sector banks permitting these banks to issue preference shares and makepreferential allotments or private placements of equity. According to current provisions private sector banksin India are not permitted to issue preference shares. Legislation has been introduced in the Parliament toamend the Banking Regulation Act to allow all banks to issue redeemable and non-redeemable preferenceshares. In September 2009, the Reserve Bank of India issued guidelines permitting banks to issue subordinateddebt as lower tier II capital with call and step-up options. See also “Operating and Financial Review andProspects—Capital Resources”.
In March 2008, the Reserve Bank of India issued guidelines pertaining to the Supervisory RegulatoryProcess and the Internal Capital Adequacy Assessment Process under Basel II. The guidelines require banksto develop and put in place, with approval of their boards, an Internal Capital Adequacy Assessment Processcommensurate with their size, level of complexity, risk profile and scope of operations. In June 2007, theReserve Bank of India issued a circular on stress testing to advise banks to put in place appropriate stresstesting policies frameworks, the details and results of which are included in the Internal Capital AdequacyAssessment Process.
In November 2008, as per guidelines issued by the Reserve Bank of India, restructured housing loansare required to be risk weighted with an additional risk weight of 25.0%.
In February 2010, the Reserve Bank of India issued revised Basel II guidelines, which increased capitalrequirements for specific risk and liquidity facilities for securitization exposures. The guidelines stipulate thatin cases of securitization exposures where the assessment is partly based on unfunded support, banks wouldnot be permitted to use any external credit assessment for risk weighting. The Reserve Bank of India, in itsrevised Basel II guidelines also issued guidance on the assessment of valuation adjustments on account ofilliquidity for less liquid/illiquid positions that are subject to market risk capital requirements. The ReserveBank of India stipulated that these valuation adjustments are to be deducted from tier I capital. ICICI Bankhad applied this guidance in its computation of capital adequacy position at year-end fiscal 2010. Subsequentlyin May 2010, Reserve Bank of India issued a clarification stating deferment of the application of this guidanceto a future date, pending the finalization of a standardized methodology for computing the valuationadjustments for less liquid/illiquid positions, to be formulated by a working group of the Reserve Bank ofIndia. Additional disclosures for securitization and credit risk mitigation were also mandated under Pillar 3 ofthe Basel II framework.
In order to strengthen the resilience of the banking sector to potential future shocks, together withensuring adequate liquidity in the banking system, the Basel Committee on Banking Supervision issuedconsultative documents on capital and liquidity (popularly known as “Basel III” proposals) on December 17,2009. Subsequent amendments to and guidance regarding these proposals were issued in July 2010, August2010 and September 2010. The Basel III proposals seek to increase capital requirements for the bankingsystem and introduce internationally harmonized global liquidity standards. Some aspects of the proposalscontinue to be at the stage of consultation. The complete form of the Basel III framework is expected to befinalized by end of calendar year 2010. See also “Operating And Financial Review And Prospects—CapitalResources—Impending regulatory developments associated with capital adequacy—Basel III proposals.”
167

Loan Loss Provisions and Non-Performing Assets
In April 1992, the Reserve Bank of India issued formal guidelines on income recognition, assetclassification, provisioning standards and valuation of investments, which are revised from time to time.
The principal features of these Reserve Bank of India guidelines, which have been implemented withrespect to our loans, debentures, lease assets, hire purchases and bills in our Indian GAAP financial statementsare set forth below.
Asset Classification
A non-performing asset is an asset in respect of which any amount of interest or principal is overdue formore than 90 days. In particular, an advance is a non-performing asset where:
• interest and/or installment of principal remains overdue for a period of more than 90 days inrespect of a term loan;
• the account remains “out-of-order” (as defined below) for a period of more than 90 days in respectof an overdraft or cash credit;
• the bill remains overdue for a period of more than 90 days in case of bills purchased anddiscounted;
• installment of principal or interest remains overdue for two crop seasons for short duration cropsor for one crop season for long duration crops;
• the amount of liquidity facility remains outstanding for more than 90 days, in respect of asecuritization transaction undertaken in accordance with the Reserve Bank of India guidelines onsecuritization issued on February 1, 2006; or
• in respect of derivative transactions, the overdue receivables related to positive mark-to-marketvalue of a derivative contract, if these remain unpaid for a period of 90 days from the specified duedate for payment.
An account should be treated as “out-of-order” if the outstanding balance remains continuously in excessof the approved drawing limit. In circumstances where the outstanding balance in the principal operatingaccount is less than the approved drawing limit, but (i) there are no credits continuously for a period of 90 daysas of the date the balance sheet of the bank or (ii) the credits are not sufficient to cover the interest debitedduring the same period, these accounts should be treated as “out-of-order”.
Interest in respect of non-performing assets is not recognized or credited to the income account unlesscollected.
Non-performing assets are classified as described below.
Sub-Standard Assets: Assets that are non-performing assets for a period not exceeding 12 months. Insuch cases, the current net worth of the borrower/guarantor or the current market value of the security chargedis not enough to ensure recovery of dues to the banks in full. Such an asset has well-defined credit weaknessesthat jeopardize the liquidation of the debt and are characterized by the distinct possibility that the bank willsustain some loss, if deficiencies are not corrected.
Doubtful Assets: Assets that are non-performing assets for more than 12 months. A loan classified asdoubtful has all the weaknesses inherent in assets that are classified as sub-standard, with the addedcharacteristic that the weaknesses make collection or liquidation in full, on the basis of currently known facts,conditions and values, highly questionable and improbable.
Loss Assets: Assets on which losses have been identified by the bank or internal or external auditors orthe Reserve Bank of India inspection but the amount has not been written off fully.
There are separate guidelines for classification of loans for projects under implementation which arebased on the date of commencement of commercial production and date of completion of the project asoriginally envisaged at the time of financial closure.
The Reserve Bank of India also has separate guidelines for restructured loans. A fully secured standardloan can be restructured by rescheduling of principal repayment and/or the interest element, but must beseparately disclosed as a restructured loan. The amount of diminution, if any, in the fair value of the loan,
168

measured in present value terms, is either written off or provided for to the extent of the diminution involved.Similar guidelines are applicable to sub-standard and doubtful assets. The sub-standard accounts which havebeen subjected to restructuring, whether in respect of principal installment or interest amount, by whatevermodality, are eligible to be upgraded to the standard category only after the specified period, i.e., a period ofone year after the date when first payment of interest or of principal, whichever is earlier, falls due, subjectto satisfactory performance during the period. The Reserve Bank of India has specific sections concerningdebt-restructuring mechanisms for small and medium enterprises in its guidelines on restructuring of loans bybanks issued on August 27, 2008. In fiscal 2009, due to the extraordinary economic circumstances,modifications to guidelines on restructuring of loans covering all categories of loans were issued. In December2008, the Reserve Bank of India permitted commercial real estate exposures to be restructured up to June 30,2009 with asset classification concessions. The second restructuring of loan exposures was made eligible forconcessional regulatory treatment up to June 30, 2009. This however excluded exposures to commercial realestate, capital market exposures, and personal/consumer loans. On January 2, 2009, Reserve Bank of Indiaguidelines were issued, whereby accounts which were standard assets as on September 1, 2008 but slipped intothe non-performing asset category and were restructured for the first time before January 31, 2009 could bereported as standard. On February 4, 2009, the time period for taking up restructuring was extended to March31, 2009. The above revised provisions regarding restructuring of accounts were applicable only up to June30, 2009. Banks were also required to disclose in the balance sheet details regarding applications received ason March 31, 2009 for restructuring, proposals approved, implemented, and proposals under consideration.
In October 2008, the Reserve Bank of India issued guidelines requiring banks to classify derivativescontract receivables over due for ninety days or more as non-performing assets.
In March 2010, norms were issued pertaining to advances for infrastructure and non-infrastructureprojects. In case of infrastructure projects, a loan would be classified as non-performing if it failed tocommence commercial operations within two years from the committed date of commencement, unless it isrestructured during the period. Any extension of the date of commencement would also be treated asrestructuring of the account.
To put in place an institutional mechanism for the restructuring of corporate debt, the Reserve Bank ofIndia has devised a corporate debt restructuring system. See “Overview of the Indian FinancialSector—Recent Structural Reforms—Corporate Debt Restructuring Forum”.
Provisioning and Write-Offs
Provisions under the Indian GAAP are based on guidelines specific to the classification of the assets. Thefollowing guidelines apply to the various asset classifications:
• Standard Assets: A general provision of 0.40% (0.25% until fiscal 2005) is required, other than fordirect advances to the agriculture and small and medium enterprise sectors which continue toattract a provisioning of 0.25%. In fiscal 2007, the Reserve Bank of India increased the generalprovisioning requirement for standard advances in specific sectors including residential housingloans greater than Rs 2.0 million from 0.40% to 1.00%. In January 2007, the general provisioningrequirement for real estate sector loans (excluding residential housing loans), credit cardreceivables, loans and advances qualifying as capital market exposure, personal loans andexposures to non-deposit taking systemically important non-banking financial companies wasincreased to 2.0%. In November 2008, the Reserve Bank of India reinstated the generalprovisioning requirement on incremental advances for all types of standard assets to the uniformlevel of 0.40%, except in the case of direct advances to the agricultural and small and mediumenterprise sectors, which continued to attract provisioning of 0.25%. The revised norms wereeffective prospectively but the existing provisions held by banks could not be reversed. OnNovember 5, 2009, the Reserve Bank of India increased general provisioning requirements foradvances to commercial real estate classified as standard assets from 0.40% to 1.00%.
• Sub-Standard Assets: A general provision of 10.0% of the total outstanding is required. However,unsecured exposures, which are identified as sub-standard attract an additional provision of 10.0%,i.e., a total of 20.0% on the outstanding balance. In April 2010, an exception was given toinfrastructure loan accounts classified as sub-standard, which attract a provisioning of 15%.
169

• Doubtful Assets: A 100.0% provision/write-off is required to be done against the unsecured portionof the doubtful asset and charged against income. For the secured portion of assets classified asdoubtful, 20.0% provision is required to be made for assets that have been classified as doubtfulfor a year, 30.0% for assets that have been classified as doubtful for one to three years and 100.0%assets classified as doubtful for more than three years. The value assigned to the collateral securinga loan is the amount reflected on the borrower’s books or the realizable value determined by thirdparty appraisers.
• Loss Assets: The entire asset is required to be written off or provided for.
• Restructured Loans: Until August 27, 2008, a provision equal to the difference between the presentvalue of the future interest as per the original loan agreement and the present value of futureinterest on the basis of rescheduled terms at the time of restructuring was required to be made. Forloans restructured after August 27, 2008, a provision equal to the difference between the fair valueof the loan before and after restructuring is required to be made. The fair value of the loan beforerestructuring is computed as the present value of cash flows representing the interest at the existingrate charged on the loan before restructuring and the principal. The fair value of the loan afterrestructuring is computed as the present value of cash flows representing the interest at the ratecharged on the loan on restructuring and the principal. Both sets of cash flows are discounted bythe bank’s Benchmark Prime Lending Rate as on the date of restructuring plus the appropriate termpremium and credit risk premium for the borrower category on the date of restructuring.
In June 2006, the Reserve Bank of India issued prudential norms on creation and utilization of floatingprovisions (i.e., provisions which are not made in respect of specific non-performing assets or are made inexcess of regulatory requirements for provisions for standard assets). The norms state that floating provisionscan be used only for contingencies under extraordinary circumstances for making specific provisions againstnon-performing accounts after obtaining approval from the Board of Directors and with the prior permissionof the Reserve Bank of India. Floating provisions for advances and investments must be held separately andcannot be reversed by credit to the profit and loss account. Until utilization of such provisions, they can benetted off from gross non-performing assets to compute the net non-performing assets. Alternatively, floatingprovisions could be treated as part of tier II capital within the overall ceiling of 1.25% of total risk-weightedassets for inclusion of general provisions and loss reserves in tier II capital. Floating provisions do not includespecific voluntary provisions made by banks for advances which are higher than the minimum provisionstipulated by the Reserve Bank of India guidelines. In March 2009, the Reserve Bank of India issued revisednorms relating to prudential treatment of floating provisions whereby effective fiscal 2010 floating provisionscannot be netted off from gross non-performing assets to compute net non-performing assets. However, inAugust 2009, the Reserve Bank of India decided to defer the implementation of this new guideline until furthernotice. Accordingly, banks continue to have the choice between deducting their existing floating provisionsfrom gross non-performing assets to arrive at net non-performing assets or reckon it as part of tier II capitalsubject to the overall ceiling of 1.25% of total risk weighted assets.
In addition, in its second quarter review of the Monetary Policy 2009-10 on October 27, 2009 theReserve Bank of India has advised Indian banks to increase their total provisioning coverage ratio, includingfloating provisions and prudential/technical write-offs, to 70% by September 30, 2010. The Reserve Bank ofIndia allowed the banks to include prudential/technical write-off in both the gross non-performing assets andthe provisions held in the calculation of provisioning coverage ratio. We have been permitted by the ReserveBank of India to achieve the stipulated level of provisioning coverage of 70% in a phased manner by March31, 2011. See also “Risk Factors——Risks Relating to Our Business——Further deterioration of ournon-performing asset portfolio combined with recent Reserve Bank of India requirements that all Indian banksincrease their provisioning coverage as a percentage of gross non-performing assets could adversely affect ourbusiness”.
Regulations Relating to Making Loans
The provisions of the Banking Regulation Act govern the making of loans by banks in India. TheReserve Bank of India also issues directions covering the loan activities of banks. Some of the majorguidelines of the Reserve Bank of India, which are now in effect, are as follows:
• The Reserve Bank of India has prescribed norms for bank lending to non-bank finance companiesand financing of public sector disinvestment.
170

• Banks are free to determine their own lending rates but each bank must declare its prime lendingrate as approved by its Board of Directors. Banks are required to declare a benchmark primelending rate based on various parameters including cost of funds, non-interest expense, capitalcharge and profit margin. Each bank should also indicate the maximum spread over the primelending rate for all credit exposures other than retail loans. The interest charged by banks onadvances up to Rs. 200,000 to any one entity (other than certain permitted types of loans includingloans to individuals for acquiring residential property, loans for purchase of consumer durables andother non-priority sector personal loans) must not exceed the prime lending rate. Banks are alsogiven freedom to lend at a rate below the prime lending rate in respect of creditworthy borrowersand exposures. Interest rates for certain categories of advances are regulated by the Reserve Bankof India. From July 1, 2010, the benchmark prime lending rate was replaced by the base rate, whichtakes into consideration all elements of lending rates that are common across borrowers. The baserate is the minimum rate for all loans, banks are not permitted to lend below the base rate exceptfor Differential Rate of Interest advances, loans to banks’ own employees and loans to banks’depositors against their own deposits. Accordingly, the current stipulation of prime lending rate asthe ceiling rate for loans up to Rs. 200,000 has been withdrawn. Banks have been permitted toarrive at the base rate for a specific tenor that would be needed to be disclosed transparently.Further, banks have been permitted to determine their final lending rates on loans and advanceswith reference to the base rate and by including such other customer specific charges as theyconsider appropriate. Until such time that loans linked to the benchmark prime lending rate exists,both the benchmark prime lending rate and the base rate would have to be announced by banks.
• Section 21A of the Banking Regulation Act provides that the rate of interest charged by a bankshall not be reopened by any court on the ground that the rate of interest charged by a bank isexcessive. In May 2007, the Reserve Bank of India notified that the boards of banks should laydown internal principles and procedures so that interest rates charged by banks are in conformitywith normal banking prudence and are not usurious.
In terms of Section 20(1) of the Banking Regulation Act, a bank cannot grant any loans and advancesagainst the security of its own shares, a banking company is prohibited from entering into any commitmentfor granting any loans or advances to or on behalf of any of its directors, or any firm in which any of itsdirectors is interested as partner, manager, employee or guarantor, or any company (not being a subsidiary ofthe banking company or a company registered under Section 25 of the Companies Act, 1956, or a governmentcompany) of which, or the subsidiary or the holding company of which any of the directors of the bank is adirector, managing agent, manager, employee or guarantor or in which he holds substantial interest, or anyindividual in respect of whom any of its directors is a partner or guarantor. There are certain exemptions inthis regard as the explanation to the section provides that ‘loans or advances’ shall not include any transactionwhich the Reserve Bank of India may specify by general or special order as not being a loan or advance forthe purpose of such section.
There are guidelines on loans against equity shares in respect of amount, margin requirement andpurpose.
In June 2005, the Reserve Bank of India issued guidelines requiring banks to put in place a policy forexposure to real estate with the approval of their boards. The policy is required to include exposure limits,collaterals to be considered, collateral cover and margins and credit authorization. The Reserve Bank of Indiahas also permitted banks to extend financial assistance to Indian companies for acquisition of equity inoverseas joint ventures or wholly owned subsidiaries or in other overseas companies, new or existing, asstrategic investment. Banks are not permitted to finance acquisitions by companies in India.
Guidelines Relating to Use of Recovery Agents by Banks
In April 2008, the Reserve Bank of India issued guidelines for banks engaging recovery agents. TheReserve Bank of India has asked banks to put in place a due diligence process for engagement of recoveryagents, structured to cover individuals involved in the recovery process. Banks are expected to communicatedetails of recovery agents to borrowers and have in place a grievance redressal mechanism pertaining to therecovery process. The Reserve Bank of India has advised banks to initiate a training course for current andprospective recovery agents to ensure prudent recovery practices.
171

Regulations Relating to Sale of Assets to Asset Reconstruction Companies
The Securitization and Reconstruction of Financial Assets and Enforcement of Security Interest Act,2002, as amended, provides for sale of financial assets by banks and financial institutions to assetreconstruction companies. The Reserve Bank of India has issued guidelines to banks on the process to befollowed for sales of financial assets to asset reconstruction companies. These guidelines provide that a bankmay sell financial assets to an asset reconstruction company provided the asset is a non-performing asset.These assets are to be sold on ‘without recourse’ basis only. A bank may sell a standard asset only if theborrower has a consortium or multiple banking arrangement, at least 75.0% by value of the total loans to theborrower are classified as non-performing and at least 75.0% by value of the banks and financial institutionsin the consortium or multiple banking arrangement agree to the sale. The banks selling financial assets shouldensure that there is no known liability devolving on them and that they do not assume any operational, legalor any other type of risks relating to the financial assets sold. Further, banks may not sell financial assets ata contingent price with an agreement to bear a part of the shortfall on ultimate realization. However, banksmay sell specific financial assets with an agreement to share in any surplus realized by the asset reconstructioncompany in the future. While each bank is required to make its own assessment of the value offered in the salebefore accepting or rejecting an offer for purchase of financial assets by an asset reconstruction company, inconsortium or multiple banking arrangements where more than 75.0% by value of the banks or financialinstitutions accept the offer, the remaining banks or financial institutions are obliged to accept the offer.Consideration for the sale may be in the form of cash, bonds or debentures or security receipts or pass throughcertificates issued by the asset reconstruction company or trusts set up by it to acquire the financial assets. TheReserve Bank of India has prescribed that the plan of realization for reconstruction of assets shall not exceed5 years from the date of acquisition of the asset. In April 2009, as an interim measure, the Reserve Bank ofIndia allowed an extension of 2 years for realization of the assets in respect of the security receipts issued bysecuritization/asset reconstruction companies, which have been outstanding for more than 5 years. See also“Overview of the Indian Financial Sector—Recent Structural Reforms—Legislative Framework for Recoveryof Debts Due to Banks”.
In March 2009, the Reserve Bank of India issued guidelines relating to excess provisions on sale ofstandard assets and non-performing assets. Banks were permitted to voluntarily make specific provisions fornon-performing assets at rates higher than prescribed by regulation with the additional provisions fornon-performing assets netted off from gross non-performing assets to arrive at net non-performing assets.According to the guidelines in respect to sale of standard assets, in case the sale consideration is higher thanthe book value, the excess provisions could be credited to the profit and loss account. Excess provisions whicharise on sale of non-performing assets could be treated as tier II capital subject to the overall ceiling of 1.25%of total risk weighted assets. Regarding provisions for diminution of fair value of restructured advances, bothin respect of standard assets and non-performing assets, made on account of reduction in rate of interest and/orre-scheduling of the repayment of principal amount are permitted to be netted from the relative assets.
In April 2010, amendments were made to the Securitization Companies and Reconstruction Companies(Reserve Bank) Guidelines, 2003, wherein the period for realization of assets acquired by securitization andreconstruction companies can be extended from five years to eight years. Securitization and reconstructioncompanies will have to invest and hold a minimum 5% stake of the outstanding amount of security receiptsissued under each scheme until redemption.
Guidelines on Sale and Purchase of Non-performing Assets
In July 2005, the Reserve Bank of India issued guidelines on sales and purchases of non-performingassets between banks, financial institutions and non-bank finance companies. These guidelines require that theboard of directors of the bank must establish a policy for purchases and sales of non-performing assets.Purchases and sales of non-performing assets must be without recourse to the seller and on a cash basis, withthe entire consideration being paid up front. An asset must have been classified as non-performing for at leasttwo years by the seller to be eligible for sale. The purchasing bank must hold the non-performing asset on itsbooks for at least 15 months before it can sell the asset to another bank. The asset cannot be sold back to theoriginal seller.
In October 2007, the Reserve Bank of India issued guidelines regarding valuation of non-performingassets being put up for sale. Banks have been instructed to work out the net present value of the estimated cashflows associated with the realizable value of the available asset net of the cost of realization. The sale priceshould not be lower than the net present value. The Reserve Bank of India has instructed banks to follow thesame procedure in case of compromise settlements as well.
172

Directed Lending
Priority Sector Lending
Until year-end fiscal 2007 the Reserve Bank of India’s directed lending norms required commercialbanks to lend a certain percentage of their net bank credit to specific sectors (the priority sectors), such asagriculture, small-scale industry, small businesses and housing finance. Total priority sector advances were setat 40.0% of net bank credit with agricultural advances required to be 18.0% of net bank credit and advancesto weaker sections required to be at 10.0% of the net bank credit, and 1.0% of the previous year’s totaladvances outstanding is required to be lent under the Differential Rate of Interest scheme. In April 2007, theReserve Bank of India issued revised guidelines on lending to the priority sector. The Reserve Bank of Indiahas linked the priority sector lending targets to adjusted net bank credit (net bank credit plus investments madeby banks in non-statutory liquidity bonds included in the held to maturity category and excludingrecapitalization bonds floated by the government) or credit equivalent amount of off-balance sheet exposure,whichever is higher as of previous fiscal years. Under the revised guidelines the limit on the housing loanseligible for priority sector lending has been increased from Rs. 1.5 million to Rs. 2 million per borrower. Theguidelines have capped eligible direct agriculture finance to non-individuals (i.e., partnership firms, corporatesand institutions) at Rs. 10 million per borrower. One-third of loans in excess of Rs. 10 million per borrowerwould also be considered as direct finance while the remaining two-thirds would constitute indirect finance.In December 2007, guidelines issued by the Reserve Bank of India permitted banks to classify loans grantedto regional rural banks for on-lending to agriculture and allied activities as indirect finance.
In May 2007 the Reserve Bank of India issued revised guidelines on lending to the priority sector.According to the revised guidelines, loans given to people forming part of weaker sections of minoritycommunities (as may be notified by the government of India from time to time) have been brought within thepurview of priority sector loans. In May 2008, in order to ensure that the sub-target of lending to the weakersections within priority sector is achieved, the Reserve Bank of India decided to take into account the shortfallin lending to weaker sections also, for the purpose of allocating amounts to the domestic banks for contributionto the Rural Infrastructure Development Fund maintained with the National Bank for Agriculture and RuralDevelopment or funds with other financial institutions.
In addition, investments made by banks after year-end fiscal 2007 in bonds issued by the National Bankfor Agriculture and the Rural Development in lieu of non-achievement of priority sector lending targets willno longer be considered as indirect finance. However, existing investments in such bonds would continue tobe classified as indirect agriculture finance until fiscal 2010. In December 2008, loans granted by banks tohousing finance companies for on-lending for housing up to Rs. 2 million of each loan were classified underpriority sector.
Prior to the amalgamation, the advances of ICICI were not subject to the requirement applicable to banksin respect of priority sector lending. Pursuant to the terms of the Reserve Bank of India’s approval of theamalgamation, we are required to maintain a total of 50.0% of our domestic adjusted net bank credit (net bankcredit until year-end fiscal 2007) on the residual portion of our advances (i.e., the portion of our total advancesexcluding advances of ICICI) in the form of priority sector advances. This additional requirement of 10.0%by way of priority sector advances will apply until such time as the aggregate priority sector advances reacha level of 40.0% of our total adjusted net bank credit. Any shortfall in the amount required to be lent to thepriority sectors may be required to be deposited with the National Bank for Agriculture and the RuralDevelopment. These deposits have a maturity period of up to seven years.
Export Credit
The Reserve Bank of India also requires commercial banks to make loans to exporters at concessionalrates of interest. This enables exporters to have access to an internationally competitive financing option.Pursuant to existing guidelines, 12.0% of a bank’s net bank credit is required to be in the form of export credit.This target is in addition to the priority sector lending mandate of 40.0% of adjusted net bank credit. Weprovide export credit for pre-shipment and post-shipment requirements of exporter borrowers in rupees andforeign currencies.
Credit Exposure Limits
As a prudent measure aimed at better risk management and avoidance of concentration of credit risk, theReserve Bank of India has prescribed credit exposure limits for banks and long-term lending institutions inrespect of their lending to individual borrowers and to all companies in a single group (or sponsor group).
173

The limits currently set by the Reserve Bank of India are as follows:
• The exposure ceiling for a single borrower is 15.0% of capital funds and group exposure limit is40.0% of capital funds. In case of financing for infrastructure projects, the exposure limit to asingle borrower is extendable by another 5.0%, i.e., up to 20.0% of capital funds and the groupexposure limit is extendable by another 10.0%, i.e., up to 50.0% of capital funds. Effective May29, 2008, the exposure limit in respect of single borrower was raised to 25.0% of capital funds inrespect of oil companies who were issued oil bonds. Banks may, in exceptional circumstances, withthe approval of their Board of Directors, consider enhancement of the exposure to a borrower upto a maximum of further 5.0% of capital funds, subject to the borrower consenting to the banksmaking appropriate disclosures in their annual reports.
• From July 1, 2008, exposures to public sector undertakings were exempted from group exposurelimits.
• Capital funds are the total capital as defined under capital adequacy norms (tier I and tier IIcapital).
• Exposure shall include credit exposure (funded and non-funded credit limits) and investmentexposure (including underwriting and similar commitments). Non-fund based exposures arecalculated at 100.0% and in addition, banks include forward contracts in foreign exchange andother derivative products, like currency swaps and options, at their replacement cost value indetermining individual or group borrower exposure ceilings, effective April 1, 2003.
To ensure that exposures are evenly spread, the Reserve Bank of India requires banks to fix internallimits of exposure to specific sectors. These limits are subject to periodical review by the banks. We have fixeda ceiling of 15.0% on our exposure to any one industry (other than retail loans) and monitor our exposuresaccordingly.
Limits on Exposure to Non-banking financial Companies
The guidelines restrict banks’ holding in a deposit taking non-banking financial company, excludinghousing finance companies, to 10.0% of the paid up equity capital of the entity. The total exposure to a singlenon-banking financial company has been limited to 10.0% of the bank’s capital funds while exposure to anon-banking asset finance company has been restricted to 15.0% of the bank’s capital funds. The limit maybe increased to 15.0% and 20.0% respectively provided that the excess exposure is on account of funds lentby the non-banking financial company to infrastructure sectors. During the second half of fiscal 2009, due tothe global financial crisis, the Reserve Bank of India provided additional liquidity support to non-bankingfinancial companies. In October 2008, systemically important non-deposit taking non-banking financialcompanies were permitted to raise short-term foreign currency borrowings. In November 2008, a special repofacility was introduced allowing banks to avail additional liquidity support exclusively to meet therequirements of non-banking financial companies and mutual funds to the extent of 1.5% of the banks’ netdemand and time liabilities. This facility was available until the end of March 2010.
Regulations Relating to Investments and Capital Market Exposure Limits
Pursuant to the Reserve Bank of India guidelines, a bank’s exposure to capital markets by way ofinvestments in shares, convertible debentures, units of equity oriented mutual funds and loans to brokers,should not exceed 40% of its net worth on a stand-alone and consolidated basis. Within this limit directinvestments in shares, convertible bonds/debentures, units of equity oriented mutual funds and all exposuresto venture capital funds have been restricted to 20.0% of their net worth.
In December 2007, the Reserve Bank of India issued a guideline stating that bank lending to mutualfunds would only be towards the mutual funds’ temporary liquidity requirements for a period not exceedingsix months. Such lending would constitute a part of the bank’s capital market exposure in case of loansextended to equity-linked mutual funds. The guideline became effective from January 1, 2010.
In November 2003, the Reserve Bank of India issued guidelines on investments by banks innon-statutory liquidity ratio securities issued by companies, banks, financial institutions, central and stategovernment sponsored institutions and special purpose vehicles. These guidelines apply to primary marketsubscriptions and secondary market purchases. Pursuant to these guidelines, banks are prohibited frominvesting in non-statutory liquidity ratio securities with an original maturity of less than one year, other than
174

commercial paper and certificates of deposits. Banks are also prohibited from investing in unrated securities.A bank’s investment in unlisted non-statutory liquidity ratio securities may not exceed 10.0% of its totalinvestment in non-statutory liquidity ratio securities at the end of the preceding fiscal year with a sub-ceilingof 5.0% for investments in bonds of public sector undertakings. These guidelines do not apply to investmentsin security receipts issued by securitization or reconstruction companies registered with the Reserve Bank ofIndia and asset backed securities and mortgage backed securities with a minimum investment grade creditrating. These guidelines were effective April 1, 2004, with provision for compliance in a phased manner byJanuary 1, 2005. In December 2007, the Reserve Bank of India permitted banks to invest in unrated bonds ofcorporates engaged in infrastructure activities within the ceiling of 10.0% for unlisted non-statutory liquidityratio securities in order to encourage flow of credit to infrastructure sector.
The Reserve Bank of India requires that the investment by a bank in subordinated debt instruments,representing tier II capital, issued by other banks and financial institutions should not exceed 10.0% of theinvesting bank’s capital including tier II capital and free reserves. In July 2004, the Reserve Bank of Indiaimposed a ceiling of 10.0% of capital funds (tier I plus tier II capital) on investments by banks and financialinstitutions in equity shares, preference shares eligible for capital status, subordinated debt instruments, hybriddebt capital instruments and any other instrument approved as in the nature of capital, issued by other banksand financial institutions. Investments in the instruments which are not deducted from tier I capital of theinvesting bank or financial institution, are subject to a 100.0% risk weight for credit risk for capital adequacypurposes. The risk weight for credit risk exposure in capital markets has been increased to 125.0% from100.0% in July 2005. Further, banks and financial institutions cannot acquire any fresh stake in a bank’s equityshares, if by such acquisition, the investing bank’s or financial institution’s holding exceeds 5.0% of theinvestee bank’s equity capital. Banks with investments in excess of the prescribed limits were required toapply to the Reserve Bank of India with a roadmap for reduction of the exposure.
Consolidated Supervision Guidelines
In fiscal 2003, the Reserve Bank of India issued guidelines for consolidated accounting and consolidatedsupervision for banks. These guidelines became effective April 1, 2003. The principal features of theseguidelines are:
Consolidated Financial Statements: Banks are required to prepare consolidated financial statementsintended for public disclosure.
Consolidated Prudential Returns: Banks are required to submit to the Reserve Bank of Indiaconsolidated prudential returns reporting their compliance with various prudential norms on a consolidatedbasis, excluding insurance subsidiaries and group companies engaged in businesses not pertaining to financialservices. Compliance on a consolidated basis is required in respect of the following main prudential norms:
• single borrower exposure limit of 15.0% of capital funds (20.0% of capital funds provided theadditional exposure of up to 5.0% is for the purpose of financing infrastructure projects);
• borrower group exposure limit of 40.0% of capital funds (50.0% of capital funds provided theadditional exposure of up to 10.0% is for the purpose of financing infrastructure projects);
• deduction from tier I capital of the bank, of any shortfall in capital adequacy of a subsidiary forwhich capital adequacy norms are specified; and
• consolidated capital market exposure limit of 40.0% of consolidated net worth with a directinvestment limit of 20.0% of consolidated net worth (applicable from fiscal 2008).
See “Business—Loan Portfolio—Loan Concentration”.
In June 2004, the Reserve Bank of India published the report of a working group on monitoring offinancial conglomerates, which proposed the following framework:
• identification of financial conglomerates that would be subjected to focused regulatory oversight;
• monitoring intra-group transactions and exposures and large exposures of the group to outsidecounter parties;
• identifying a designated entity within each group that would collate data in respect of all othergroup entities and furnish the same to its regulator; and
• formalizing a mechanism for inter-regulatory exchange of information.
175
The framework covers entities under the jurisdiction of the Reserve Bank of India, the Securities andExchange Board of India, the Insurance Regulatory and Development Authority and the National HousingBank and would in due course be extended to entities regulated by the proposed Pension Fund Regulatory andDevelopment Authority. The Reserve Bank of India has identified us and our related entities as a financialconglomerate with ICICI Bank as the designated entity responsible for reporting to the Reserve Bank of India.
Banks’ Investment Classification and Valuation Norms
The key features of the Reserve Bank of India guidelines on categorization and valuation of banks’investment portfolio are given below.
• The entire investment portfolio is required to be classified under three categories: (a) held tomaturity, (b) held for trading and (c) available for sale. Held to maturity includes securities soclassified in accordance with the Reserve Bank of India guidelines; held for trading includessecurities acquired with the intention of being traded to take advantage of the short-termprice/interest rate movements; and available for sale includes securities not included in held tomaturity and held for trading. Banks should decide the category of investment at the time ofacquisition.
• The held to maturity category can include statutory liquidity ratio securities up to 25 percent of thedemand and time liabilities and certain non-statutory liquidity ratio securities, including freshre-capitalization bonds received from the government of India towards re-capitalizationrequirement and held in the investment portfolio, fresh investment in the equity of subsidiaries andjoint ventures, Rural Infrastructure Development Fund/Small Industries Development Board ofIndia/Rural Housing Development Fund deposits and investment in long-term bonds (with aminimum residual maturity of seven years) issued by companies engaged in infrastructureactivities.
• Profit or loss on the sale of investments in both held for trading and available for sale categoriesis taken in the income statement. Profit on the sale of investments in the held to maturity category,net of tax and statutory reserve, is appropriated to the capital reserve account after being taken inthe income statement. Loss on any sale is recognized in the income statement.
• The market price of the security available from the stock exchange, the price of securities insubsidiary general ledger transactions, the Reserve Bank of India price list or prices declared byPrimary Dealers Association of India jointly with the Fixed Income Money Market and DerivativesAssociation of India serves as the “market value” for investments in available for sale and held fortrading securities.
• Investments under the held for trading category should be sold within 90 days; in the event ofinability to sell due to adverse factors including tight liquidity, extreme volatility or aunidirectional movement in the market, the unsold securities should be shifted to the available forsale category.
• Shifting of investments from or to held to maturity may be done with the approval of the Boardof Directors once a year, normally at the beginning of the accounting year; shifting of investmentsfrom available for sale to held for trading may be done with the approval of the Board of Directors,the Asset Liability Management Committee or the Investment Committee; shifting from held fortrading to available for sale is generally not permitted.
In September 2004, the Reserve Bank of India announced that it would set up an internal group to reviewthe investment classification guidelines to align them with international practices and the current state of riskmanagement practices in India, taking into account the unique requirement applicable to banks in India ofmaintenance of a statutory liquidity ratio equal to 25.0% of their demand and time liabilities. In themeanwhile, the Reserve Bank of India has permitted banks to exceed the limit of 25.0% of investments forthe held to maturity category provided the excess comprises only statutory liquidity ratio investments and theaggregate of such investments in the held to maturity category do not exceed 25.0% of the demand and timeliabilities. The Reserve Bank of India permitted banks to transfer additional securities to the held to maturitycategory as a one time measure, in addition to the transfer permitted under the earlier guidelines. The transferhad to be done at the lower of acquisition cost, book value or market value on the date of transfer and thedepreciation needed to be fully provided for.
176

Held to maturity securities need not be marked to market and are carried at acquisition cost, unless itis more than the face value, in which case the premium should be amortized over the period remaining tomaturity.
Investments under available for sale category could be marked to market at quarterly intervals and heldfor trading securities valued at market at monthly intervals. Depreciation or appreciation for each basketwithin the available for sale and held for trading categories is aggregated. Net appreciation in each basket, ifany, which is not realized, is ignored, while net depreciation is provided for.
Investments in security receipts or pass through certificates issued by asset reconstruction companies ortrusts set up by asset reconstruction companies should be valued at the lower of: (a) the redemption value ofthe security receipts or pass through certificates; and (b) the net book value of the financial asset. However,if the instrument issued by securitization/asset reconstruction companies is limited to the actual realization ofthe financial asset assigned to the instrument, the net asset value should be obtained from thesecuritization/asset reconstruction companies for valuation of the investments.
In June 2008, the Reserve Bank of India issued guidelines for the valuation of non-statutory liquidityratio securities, requiring banks to value such securities issued by the government of India at a spread of 25basis points above the corresponding yield on government of India securities from an earlier spread of 50 basispoints above the corresponding yield on government of India securities.
In April 2010, the Reserve Bank of India issued guidelines permitting banks to classify investments inlong-term bonds issued by companies engaged in executing infrastructure projects and having a minimumresidual maturity of seven years under the held to maturity category.
In August 2010, the Reserve Bank of India has issued guidelines with regards to sales and transfer ofsecurities to/from the “held to maturity” category. If the value of sales and transfers exceed 5% of the bookvalue of the investment held in the “held to maturity” category at the beginning of the year, the market valueof the investment will have to be disclosed in the notes to accounts in the annual report along with the excessbook value over market value for which provision was not made.
Limit on Transactions through Individual Brokers
Guidelines issued by the Reserve Bank of India require banks to appoint brokers for transactions insecurities. These guidelines also require that a disproportionate part of the bank’s business should not betransacted only through one broker or a few brokers. The Reserve Bank of India specifies that not more than5.0% of the total transactions through appointed brokers can be transacted through one broker. If for anyreason this limit is breached, the Reserve Bank of India has stipulated that the board of directors of the bankshould ratify such action.
Prohibition on Short-Selling
The Reserve Bank of India does not permit short selling of securities by banks excluding intra-day shortselling in central government securities. The Reserve Bank of India has permitted banks to sell governmentof India securities already contracted for purchase provided the purchase contract is confirmed and the contractis guaranteed by Clearing Corporation of India Limited or the security is contracted for purchase from theReserve Bank of India. Each security is deliverable or receivable on a net basis for a particular settlementcycle.
In February 2006, the Reserve Bank of India introduced intra-day short selling in central governmentsecurities as a measure to develop the central government securities market. In its Annual Policy Statementfor fiscal 2007, the Reserve Bank of India proposed to introduce a ‘when issued’ market in governmentsecurities in order to further strengthen the debt management framework. In January 2007 the Reserve Bankof India permitted scheduled commercial banks and primary dealers to undertake short sale of centralgovernment dated securities, subject to the short position being covered within a maximum period of fivetrading days, including the day of trade. The short positions shall have to be covered only by outright purchaseof an equivalent amount of the same security.
Introduction of Credit Default Swaps for Corporate Bonds
In August 2010, the Reserve Bank of India released a draft report on the operational framework for theintroduction of credit default swaps. Key recommendations covered in the report include allowing creditdefault swaps only on the corporate bonds of rated companies and special purpose vehicles of ratedinfrastructure companies, settlement methods, managing associated risks and back-end infrastructure.
177

Subsidiaries and Other Financial Sector Investments
We need the prior permission of the Reserve Bank of India to incorporate a subsidiary. We are requiredto maintain an “arms’ length” relationship with our subsidiaries and with mutual funds sponsored by us inregard to business parameters such as not taking undue advantage in borrowing/lending funds,transferring/selling/buying of securities at rates other than market rates, giving special consideration forsecurities transactions, in supporting/financing the subsidiary or financing our clients through them when weis not able or not permitted to do so our self. We have to observe the prudential norms stipulated by theReserve Bank of India, from time to time, in respect of our underwriting commitments. Pursuant to suchprudential norms, our underwriting or the underwriting commitment of our subsidiaries under any singleobligation shall not exceed 15.0% of an issue. We also need the prior specific approval of the Reserve Bankof India to participate in the equity of financial services ventures including stock exchanges and depositoriesnotwithstanding the fact that such investments may be within the ceiling (the lower of 30.0% of the paid-upcapital of the investee company and 30.0% of the investing bank’s own paid up capital and reserves)prescribed under Section 19(2) of the Banking Regulation Act. Our investment in a subsidiary company,financial services company, financial institution and stock and other exchanges cannot exceed 10.0% of ourpaid-up capital and reserves and our aggregate investments in all such companies, financial institutions, stockand other exchanges put together cannot exceed 20.0% of our paid-up capital and reserves. In August 2006,the Reserve Bank of India issued guidelines which included banks’ investments in venture capital funds in thislimit. Subsequently the Reserve Bank of India has clarified that investments in overseas banking subsidiariesmay be excluded from this limit.
Holding Companies
In August 2007, the Reserve Bank of India issued a discussion paper on holding companies in bankinggroups, on which it has invited comments. In the discussion paper, the Reserve Bank of India has stated thatthere are advantages in having a financial or bank holding company structure, for which a proper legalframework needs to be created. However, it has stated that it would be desirable to avoid intermediate holdingcompany structures. In November 2007, the Reserve Bank of India communicated that it would study thefeedback received on the discussion paper from a legal and regulatory perspective before initiating furtheraction. In the annual policy review for fiscal 2011, the Reserve Bank of India announced the formation of aworking group with representatives from the government, various regulatory authorities and banks for drawinga roadmap for the introduction of holding company structure.
Benchmark Prime Lending Rate
In February 2010, the Reserve Bank of India released a draft circular recommending revision to thepresent benchmark prime lending rate system. A proposal to replace the benchmark prime lending rate witha ‘Base Rate’ system effective April 1, 2010 was made. The recommendations include calculating the base ratetaking into consideration cost elements that can be clearly identified and are common across borrowers. InApril 2010, the Reserve Bank of India released final guidelines on the base rate which replaced the benchmarkprime lending rates effective July 1, 2010. The guidelines recommend calculating the base rate taking intoconsideration all elements of lending rates that are common across borrowers. Banks have been permitted toarrive at the base rate for a specific tenor that would be needed to be disclosed transparently. Further, bankshave been permitted to determine their final lending rates on loans and advances with reference to the baserate and by including such other customer specific charges as they consider appropriate.
Regulations Relating to Deposits
The Reserve Bank of India has permitted banks to independently determine rates of interest offered onterm deposits. However, banks are not permitted to pay interest on current account deposits. Further, banksmay only pay interest of 3.5% per annum on savings deposits. In its annual policy statement for fiscal 2010,the Reserve Bank of India prescribed calculating payment of interest on savings bank accounts on a dailyproduct basis effective April 1, 2010 instead of on minimum balances held in the accounts during the periodfrom the 10th day to the last day of each calendar month. In respect of savings and time deposits accepted fromemployees, we are permitted by the Reserve Bank of India to pay an additional interest of 1.0% over theinterest payable on deposits from the public.
Domestic time deposits have a minimum maturity of seven days. Time deposits from non-residentIndians denominated in foreign currency have a minimum maturity of one year and a maximum maturity offive years.
178

Starting April 1998, the Reserve Bank of India has permitted banks the flexibility to offer varying ratesof interests on domestic deposits of the same maturity subject to the following conditions:
• Time deposits are of Rs. 2 million and above; and
• Interest on deposits is paid in accordance with the schedule of interest rates disclosed in advanceby the bank and not pursuant to negotiation between the depositor and the bank.
We stipulate a minimum balance of Rs. 10,000 for a non-resident rupee savings deposit account. Untilthe year-end of fiscal 2007, interest rates on non-resident rupee term deposits of one to three years maturitywere not permitted to exceed the LIBOR/SWAP rate plus 50 basis points for US dollar of correspondingmaturity. Similarly interest rates on non-resident rupee savings deposits were not permitted to exceed theLIBOR/SWAP rate plus 50 basis points for six months maturity on US dollar deposits and are fixed quarterlyon the basis of the LIBOR/SWAP rate of US dollar on the last working day of the preceding quarter. In theAnnual Policy Statement for fiscal 2008 the Reserve Bank of India reduced the interest rates on non-residentforeign currency savings deposits by 50 basis points to LIBOR/SWAP minus 75 basis points and reduced theinterest rate on non-resident rupee term deposits of one to three years by 50 basis points to the LIBOR/SWAPrate. The interest rate on non-resident savings deposits is at the rate applicable to domestic savings deposits.
With effect from November 2008, interest rates on non-resident rupee term deposits for one to threeyears were not permitted to exceed LIBOR/SWAP rate plus 175 basis points for US dollar of correspondingmaturity. Interest rates on non-resident foreign currency deposits were raised by 75 basis points toLIBOR/SWAP plus 100 basis points.
In October 2007, the Reserve Bank of India instructed banks to discontinue special deposit schemes,with lock-in periods and other features that do not conform with deposit regulations of the Reserve Bank ofIndia.
Regulations Relating to Knowing the Customer and Anti-Money Laundering
The Reserve Bank of India issued a notification in November 2004 prescribing guidelines for Know YourCustomer and anti-money laundering procedures. Banks are required to have a customer acceptance policylaying down explicit criteria for acceptance of customers and defining risk parameters. A profile of thecustomers should be prepared based on risk categorization. Banks have been advised to apply enhanced duediligence for high-risk customers. The guidelines provide that banks should undertake customer identificationprocedures while establishing a banking relationship or carrying out a financial transaction or when the bankhas a doubt about the authenticity or the adequacy of the previously obtained customer identification data.Banks need to obtain sufficient information necessary to establish the identity of each new customer and thepurpose of the intended banking relationship. The guidelines also provide that banks should monitortransactions depending on the account’s risk sensitivity. In February 2006, the Reserve Bank of India issuedguidelines on the obligations of banks under the Prevention of Money Laundering Act, 2002. The ReserveBank of India also issued anti-money laundering guidelines to other entities such as non-bank financecompanies and authorized money changers.
In August 2005, the Reserve Bank of India simplified the Know Your Customers procedure for openingaccounts for those persons who intend to keep balances not exceeding Rs. 50,000 in all their accounts takentogether and the total credit in all the accounts taken together is not expected to exceed Rs. 100,000 in a yearin order to ensure that the implementation of the Know Your Customers guidelines do not result in the denialof the banking services to those who are financially or socially disadvantaged.
The Parliament had enacted the Prevention of Money Laundering Act in 2002. Effective July 1, 2005,the provisions of this Act have come into force. The Act seeks to prevent money laundering and to providefor confiscation of property derived from, or involved in, money laundering. In addition, the applicableexchange control regulations prescribe reporting mechanisms for transactions in foreign exchange and requireauthorized dealers to report identified suspicious transactions to the Reserve Bank of India. In December 2004,the Indian Parliament passed the Unlawful Activities (Prevention) Amendment Ordinance/Act, 2004incorporating the provisions considered necessary to deal with various facets of terrorism. The Narcotic Drugsand Psychotropic Substances Act, 1985 deals with proceeds of drug related crime.
179

Regulations on Asset Liability Management
At present, the Reserve Bank of India’s regulations for asset liability management require banks to drawup asset-liability gap statements separately for rupee and for four major foreign currencies. These gapstatements are prepared by scheduling all assets and liabilities according to the stated and anticipated repricingdate, or maturity date. These statements have to be submitted to the Reserve Bank of India on a quarterly basis.The Reserve Bank of India has advised banks to actively monitor the difference in the amount of assets andliabilities maturing or being repriced in a particular period and place internal prudential limits on the gaps ineach time period, as a risk control mechanism. Additionally, the Reserve Bank of India has asked banks tomanage their asset-liability structure such that the negative liquidity gap in the 1-14 day and 15-28 day timeperiods does not exceed 20.0% of cash outflows in these time periods. This 20.0% limit on negative gaps wasmade mandatory with effect from April 1, 2000. In respect of other time periods, up to one year, the ReserveBank of India has directed banks to lay down internal norms in respect of negative liquidity gaps. In April2006, the Reserve Bank of India issued draft guidelines on improvements to banks’ asset liability managementframework.
In March 2007, the Reserve Bank of India issued guidelines regarding prudential limits for inter-bankliabilities. Inter-bank liabilities of a bank cannot exceed 200.0% of its net worth as on the last day of theprevious fiscal year. Individual banks have been permitted, with the approval of their boards of directors, tofix a lower limit for their inter-bank liabilities, keeping in view their business model. However banks whosecapital to risk assets ratio is at least 25% more than the minimum capital to risk assets ratio (currently 9%)i.e., 11.25% as on the last day of the previous fiscal year are allowed a higher limit with respect to inter-bankliability of up to 300.0% of their net worth. It may be noted that the limits prescribed above would includeonly fund-based inter-bank liabilities within India (including inter-bank liabilities in foreign currency to banksoperating within India) and inter-bank liabilities outside India are excluded. The Reserve Bank of India’sguidelines also stipulate that existing limits on call-money borrowing shall form a sub-limit of theabove-mentioned limit.
In October 2007, the Reserve Bank of India issued amendments to guidelines on asset liabilitymanagement to improve management of liquidity by banks and to provide a stimulus for development of theterm-money market. The Reserve Bank of India has advised banks to adopt a more detailed approach tomeasurement of liquidity risk effective January 1, 2008 by splitting the first time period (1-14 days at present)in the statement of structural liquidity into three time periods—next day, 2-7 days and 8-14 days. The netcumulative negative liquidity mismatches during the next day, 2-7 days, 8-14 days and 15-28 days periodsshould not exceed 5.0%, 10.0%, 15.0% and 20.0% of the cumulative cash outflows in the respective timeperiods in order to recognize the cumulative impact on liquidity. Banks have also been permitted to undertakedynamic liquidity management and prepare the structural liquidity statement on a daily basis.
Foreign Currency Dealership
The Reserve Bank of India has granted us a full-fledged authorized dealers’ license to deal in foreignexchange through our designated branches. Under this license, we have been granted permission to:
• engage in foreign exchange transactions in all currencies;
• open and maintain foreign currency accounts abroad;
• raise foreign currency and rupee denominated deposits from non-resident Indians;
• grant foreign currency loans to on-shore and off-shore corporations;
• open documentary credits;
• grant import and export loans;
• handle collection of bills, funds transfer services;
• issue guarantees; and
• enter into derivative transactions and risk management activities that are incidental to its normalfunctions authorized under its organizational documents.
Further, we have been permitted to hedge foreign currency loan exposures of Indian corporations in theform of interest rate swaps, currency swaps and forward rate agreements, subject to certain conditions. In theAnnual Policy Statement for fiscal 2008 the Reserve Bank of India permitted banks and primary dealers to
180

begin transactions in single-entity credit default swaps and has issued draft guidelines regarding thesetransactions. Further in April 2007 the Reserve Bank of India published comprehensive guidelines onderivatives. The prudential guidelines require any amount remaining unpaid for a period 90 days with respectto derivative transactions to be classified as non-performing assets.
In August 2008, the Reserve Bank of India issued guidelines permitting banks in the authorized dealercategory to become trading or clearing members of the currency derivatives segment to be set up by stockexchanges recognized by Securities and Exchange Board of India, subject to their fulfilling the requirementsof (i) minimum net worth of Rs. 5.0 billion, (ii) minimum capital adequacy ratio of 10%, (iii) netnon-performing assets not exceeding 3% and (iv) net profit for the previous three years.
Our foreign exchange operations are subject to the guidelines specified by the Reserve Bank of India inthe exchange control manual. As an authorized dealer, we are required to enroll as a member of the ForeignExchange Dealers Association of India, which prescribes the rules relating to foreign exchange business inIndia.
Authorized dealers, like us, are required to determine their limits on open positions and maturity gapsin accordance with the Reserve Bank of India’s guidelines and these limits are approved by the Reserve Bankof India.
In July 2010, the Reserve Bank of India permitted persons resident in India to enter into currency futureson stock exchanges.
Ownership Restrictions
The government of India regulates foreign ownership in Indian banks. The total foreign ownership in aprivate sector bank, like us, cannot exceed 74.0% of the paid-up capital and shares held by foreign institutionalinvestors under portfolio investment schemes through stock exchanges cannot exceed 49.0% of the paid-upcapital.
The Reserve Bank of India’s acknowledgement is required for the acquisition or transfer of a bank’sshares which will take the aggregate holding (direct and indirect, beneficial or otherwise) of an individual ora group to the equivalent of 5.0% or more of its total paid up capital. The Reserve Bank of India, whilegranting acknowledgement, may take into account all matters that it considers relevant to the application,including ensuring that shareholders whose aggregate holdings are above specified thresholds meet fitness andpropriety tests. In determining whether the acquirer or transferee is fit and proper to be a shareholder, theReserve Bank of India may take into account various factors including, but not limited to, the acquirer ortransferee’s integrity, reputation and track record in financial matters and compliance with tax laws,proceedings of a serious disciplinary or criminal nature against the acquirer or transferee and the source offunds for the investment.
While granting acknowledgement for acquisition or transfer of shares that takes the acquirer’sshareholding to 10.0% or more and up to 30.0% of a private sector bank’s paid-up capital, the Reserve Bankof India may consider additional factors, including but not limited to:
• the source and stability of funds for the acquisition and ability to access financial markets as asource of continuing financial support for the bank;
• the business record and experience of the applicant including any experience of acquisition ofcompanies;
• the extent to which the acquirer’s corporate structure is in consonance with effective supervisionand regulation of its operations; and
• in case the applicant is a financial entity, whether the applicant is a widely held entity, publiclylisted and a well established regulated financial entity in good standing in the financial community.
While granting acknowledgment for acquisition or transfer of shares that takes the acquirer’sshareholding to 30.0% or more of a private sector bank’s paid-up capital, the Reserve Bank of India mayconsider additional factors, including but not limited to, whether or not the acquisition is in the public interest,and shareholder agreements and their impact on the control and management of the bank’s operations.
In February 2005, the Reserve Bank of India issued guidelines on ownership and governance in privatesector banks. The key provisions of the guidelines on ownership are:
181
• No single entity or group of related entities would be permitted to directly or indirectly hold orcontrol more than 10.0% of the paid up equity capital of a private sector bank and any higher levelof acquisition would require the Reserve Bank of India’s prior approval;
• In respect of corporate shareholders, the objective will be to ensure that no entity or group ofrelated entities has a shareholding in excess of 10.0% in the corporate shareholder. In case ofshareholders that are financial entities, the objective will be to ensure that it is widely held,publicly listed and well regulated;
• The Reserve Bank of India may permit a higher level of shareholding in case of restructuring ofproblem banks or weak banks or in the interest of consolidation in the banking industry;
• No single non-resident Indian can invest in excess of 5.0% of the paid-up capital of a private sectorbank. The aggregate limit for investments by non-resident Indians is restricted to 10.0% of aprivate sector bank’s paid-up capital and can be increased to 24.0% of the bank’s paid-up capitalby approval of its Board of Directors;
• Banks would be responsible for compliance with the “fit and proper” criteria for shareholders onan ongoing basis; and
• Banks where shareholders holdings are in excess of the prescribed limit would have to indicate aplan for compliance.
The Reserve Bank of India has recently announced guidelines stating that these regulations would alsoapply in the event an existing shareholder’s shareholding exceed the specified limit as a result of a rights issueof shares where other shareholders do not subscribe to the issue.
A legislation has been introduced in the Parliament to amend the Banking Regulation Act making theprior approval of the Reserve Bank of India mandatory for the acquisition of more than 5.0% of a bankingcompany’s paid up capital or voting rights by any individual or firm or group.
In February 2009, the government of India issued guidelines for calculation of total foreign investment,both direct and indirect, in Indian companies. Pursuant to this guideline, the foreign shareholding in an Indiancompany which is not majority owned and controlled by Indian shareholders will be taken into account incomputing the foreign shareholding in investee companies of such Indian company (other than investeecompanies in the insurance sector, for which there are separate specific regulations). Since foreign ownershipup to 74% is permitted in Indian private sector banks, such as us, this would impact investments made byIndian private sector banks, including us, and their subsidiaries, in other companies. This would also requireassessment whether any of the Indian shareholders are to be reckoned for purposes of adherence to the foreignownership limit of 74%. This does not however impact our investments in our insurance subsidiaries. We havesought clarification from the Department of Industrial Policy and Promotion on our status and that of oursubsidiaries under these guidelines, which are awaited.
Restrictions on Payment of Dividends
The Banking Regulation Act requires banks to completely write off capitalized expenses and transfer20.0% of the disclosed yearly profit to a reserve account before declaring a dividend.
In May 2005, the Reserve Bank of India issued guidelines stating that a bank may declare dividends onlyif all of the following conditions are met:
• The capital adequacy ratio is at least 9.0% for the preceding two completed years and theaccounting year for which the bank proposes to declare a dividend.
• The net non-performing asset ratio is less than 7.0%.
• The Bank is in compliance with the prevailing regulations and guidelines issued by the ReserveBank of India, including the creation of adequate provision for the impairment of assets, staffretirement benefits, transfer of profits to statutory reserves, etc.
• The proposed dividend will be paid out of the current year’s profit.
• The Reserve Bank of India has not placed any explicit restrictions on the bank regarding thedeclaration of dividends.
In case a bank does not meet the capital adequacy norms for two consecutive years, but has a capitaladequacy ratio of at least 9.0% for the accounting year for which it proposes to declare a dividend, it wouldbe eligible to do so if its net non-performing asset ratio is less than 5.0%.
182

Banks that are eligible to declare dividends under the above rules can do so subject to the following:
• The dividend payout ratio (calculated as a percentage of dividend payable in a year to net profitduring the year) must not exceed 40.0%. The maximum permissible dividend payout ratio wouldvary from bank to bank, depending on the capital adequacy ratio in each of the last three years andthe net non-performing asset ratio.
• In case the profit for the relevant period includes any extraordinary income, the payout ratio mustbe calculated after excluding that income for compliance with the prudential payout ratio.
• The financial statements pertaining to the financial year for which the bank is declaring a dividendshould be free of any qualification by the statutory auditors, which might have an adverse effecton the profit during that year. In case there are any such qualifications, the net profit should besuitably adjusted while computing the dividend payout ratio.
Moratorium, Reconstruction and Amalgamation of Banks
The Reserve Bank of India can apply to the government of India for suspension of business by a bankingcompany. The government of India after considering the application of the Reserve Bank of India may ordera moratorium staying commencement of action or proceedings against such company for a maximum periodof six months. During such period of moratorium, the Reserve Bank of India may (a) in the public interest;or (b) in the interest of the depositors; or (c) in order to secure the proper management of the bank; or (d) inthe interests of the banking system of the country as a whole, prepare a scheme for the reconstruction of thebank or amalgamation of the bank with any other bank. In circumstances entailing reconstruction of the bankor amalgamation of the bank with another bank, the Reserve Bank of India invites suggestions and objectionson the draft scheme prior to placing the scheme before the government of India for its approval. The centralgovernment may approve the scheme with or without modifications. The law does not require consent of theshareholders or creditors of such banks.
Regulations on Mergers of Private Sector Banks and Banks and Non-banking financial Companies
In May 2005, the Reserve Bank of India issued guidelines on mergers between private sector banks andbetween banks and non-banking financial companies. The guidelines particularly emphasize the examinationof the rationale for amalgamation, the systemic benefits arising from it and the advantages accruing to themerged entity. With respect to a merger between two private sector banks, the guidelines require the draftscheme of amalgamation to be approved by the shareholders of both banks with a two-thirds majority afterapproval by the boards of directors of the two banks concerned. The draft scheme should also consider theimpact of amalgamation on the valuation, profitability and capital adequacy ratio of the amalgamating bankand verify that the reconstituted board conforms to the Reserve Bank of India norms. The approved schemeneeds to be submitted to the Reserve Bank of India for valuation and approval in accordance with the BankingRegulation Act, along with other documentation such as the draft document of proposed merger, copies of allrelevant notices and certificates, swap ratio, share prices, etc. With respect to a merger of a bank and anon-banking company, the guidelines specify that the non-banking financial company has to comply withKnow Your Customer norms for all accounts and all relevant norms issued by the Reserve Bank of India andthe Securities and Exchange Board of India. The non-banking financial company should also conform toinsider trading norms issued by the Securities and Exchange Board of India, whether it is listed or not, in orderto regulate the promoter’s trading of shares before and after the amalgamation discussion period.
Credit Information Bureaus
The Parliament of India has enacted the Credit Information Companies (Regulation) Act, 2005, pursuantto which every credit institution, including a bank, has to become a member of a credit information bureauand furnish to it such credit information as may be required of the credit institution by the credit informationbureau about persons who enjoy a credit relationship with it. Other credit institutions, credit informationbureaus and such other persons as the Reserve Bank of India specifies may access such disclosed creditinformation.
Financial Stability and Development Council and Financial Sector Legislative Reforms Commission
In the Indian government’s budget for fiscal 2011, the government announced plans to set up anapex-level body called the Financial Stability and Development Council. This would be an independent bodythat would oversee regulation and strengthen mechanisms for maintaining financial stability. As per functionsidentified in the budget, the institution would monitor macro-prudential supervision of the economy, thefunctioning of large financial conglomerates, address inter-regulatory coordination issues and focus onfinancial literacy and financial inclusion activities.
183

The government also proposed to set up a Financial Sector Legislative Reforms Commission to reviewthe financial sector laws and bring them in line with the requirements of the sector. Further details on thecreation and functions of these bodies are awaited.
In August 2010, the parliament passed The Securities and Insurance Laws (Amendment and Validation)Bill, 2010, which provides a mechanism to settle disputes between regulators. A committee chaired by theFinance Minister, with the governor of the Reserve Bank of India as vice chairperson and chairpersons ofSecurities and Exchange Board of India, Insurance Regulatory and Development Authority of India, PensionFund Regulatory of India and Development Authority and secretaries of Department of Economic Affairs andDepartment of Financial Services will make the final decision on such disputes.
Deposit Insurance
Demand and time deposits of up to Rs. 100,000 accepted by Indian banks have to be mandatorily insuredwith the Deposit Insurance and Credit Guarantee Corporation, a wholly-owned subsidiary of the Reserve Bankof India. Banks are required to pay the insurance premium for the eligible amount to the Deposit Insuranceand Credit Guarantee Corporation on a semi-annual basis. The cost of the insurance premium cannot be passedon to the customer.
Statutes Governing Foreign Exchange and Cross-Border Business Transactions
Foreign exchange and cross border transactions undertaken by banks are subject to the provisions of theForeign Exchange Management Act. We monitor transactions of customers based on pre-defined rules usinga risk-based approach. The transaction monitoring system envisages identification of unusual transactions,undertaking due diligence on such transactions and, if confirmed as suspicious, reporting to the financialintelligence unit of the respective jurisdiction. Our transaction monitoring system is periodically reviewed andis being supplemented with appropriate anti-money laundering software technology solutions.
The Reserve Bank of India issued guidelines on external commercial borrowings through its mastercircular in July 2005, which stated that no financial intermediary, including banks, will be permitted to raisesuch borrowings or provide guarantees in favor of overseas lenders for such borrowings. Eligible borrowersmay raise such borrowings to finance the import of equipment and to meet foreign exchange needs ofinfrastructure projects. In a guideline dated August 1, 2005 the Reserve Bank of India announced that externalcommercial borrowing proceeds can be utilized for overseas direct investment in joint ventures/wholly ownedsubsidiaries subject to the existing guidelines on Indian Direct Investment in joint ventures/wholly ownedsubsidiaries abroad. Further utilization of external commercial borrowing proceeds is not permitted forlending, capital market investments or acquisitions in India or real estate investments (including integratedtownships). In May 2007 the Reserve Bank of India decided to reduce the all-in-cost ceilings for ExternalCommercial Borrowings from LIBOR plus 350 basis points to LIBOR plus 250 basis points (for ExternalCommercial Borrowings with an average maturity period of over five years).
In August 2007, the Reserve Bank of India decided to modulate capital inflows coming in throughexternal commercial borrowings. External commercial borrowings of more than US$ 20 million per companyare now permitted only for foreign currency expenditure. In addition, external commercial borrowings of morethan US$ 20 million need to be parked overseas until there is an actual requirement of funds. For rupeeexpenditure, external commercial borrowings are permitted only up to US$ 20 million with the prior approvalof the Reserve Bank of India.
In May 2008, the Reserve Bank of India enhanced the external commercial borrowings limit from US$20 million to US$ 50 million for incurring rupee expenditure for permissible end uses. The Reserve Bank ofIndia also permitted companies in the infrastructure sector to raise up to US$ 100 million through externalcommercial borrowings. Additionally, the all-in-cost ceilings for external commercial borrowings forborrowings were enhanced. For borrowings with average maturity of three to five years, the all-in-cost ceiling
184
over six-month Libor was raised from 150 basis points to 200 basis points. Further the Reserve Bank of Indiadecided to enhance the all-in-cost ceilings for External Commercial Borrowings from LIBOR plus 150 basispoints to LIBOR plus 200 basis points (for External Commercial Borrowings with an average maturity periodof up to five years) and from LIBOR plus 250 basis points to 350 basis points in the case of borrowings witha maturity period of over five years. In June 2008, the Reserve Bank of India permitted service sectorcompanies, belonging to the hotels, hospitals and software sectors to avail external commercial borrowing upto US$ 100 million per financial year for import of capital goods under the automatic approval route. This wasallowed to exceed US$ 100 million in August 2010.
In October 2008, the external commercial borrowings limit was enhanced further to US$ 500 million perborrower per year for rupee expenditure and/or foreign currency expenditure for permissible end uses. TheReserve Bank of India decided to enhance the all-in-cost ceilings for external commercial borrowings fromLIBOR plus 200 basis points to LIBOR plus 300 basis points (for external commercial borrowings with anaverage maturity period of up to five years) and from LIBOR plus 350 basis points to 500 basis points in thecase of borrowings with a maturity period of over five years. The all-in-cost ceiling was dispensed with untilDecember 31, 2009 under the approval route. The ceilings were reintroduced from January 2010 at LIBORplus 300 basis points for borrowing up to five years and LIBOR plus 500 basis points for borrowings over fiveyears.
In March 2010, non-banking financial companies categorized as infrastructure finance companies wereallowed to raise borrowings through external commercial borrowing and in May 2010 were permitted toborrow up to 50% of their owned funds under the automatic approval route.
In March 2006, in view of enhanced stability in India’s external and financial sectors and increasedintegration of the financial sector in the global economy, the Reserve Bank of India constituted a Committeeto set out a roadmap towards fuller capital account convertibility. The Committee submitted its report in July2006.
In October 2006, the Reserve Bank of India proposed to allow banks to borrow funds from their overseasbranches and correspondent banks (including borrowings for financing export credit, external commercialborrowings and overdrafts from their head office/nostro account) up to a limit of 50.0% of unimpaired tier Icapital or US$ 10 million, whichever is higher, as against the earlier overall limit of 25.0% (excludingborrowings for financing export credit). However, short-term borrowings up to a period of one year or lessshould not exceed 20.0% of unimpaired tier I capital within the overall limit of 50.0%. In October 2008, bankswere permitted to borrow funds from their overseas branches and correspondent banks to the extent of 50%of their unimpaired tier I capital or US$ 10 million, whichever is higher. Capital funds raised by issue ofinnovative perpetual debt instruments and other overseas borrowings with the specific approval of the ReserveBank of India would continue to be outside the limit of 50.0%. In April 2007 the Reserve Bank of India issueda circular deferring the implementation of the above guidelines until further notice.
In July 2010, the Reserve Bank of India permitted take-out financing arrangement through externalcommercial borrowing, under the approval route, for refinancing rupee loans availed for new infrastructureprojects, including sea port, airport, roads including bridges and the power sector.
Legal Reserve Requirements
Cash Reserve Ratio
A bank is required to maintain a specified percentage of its net demand and time liabilities, excludinginter-bank deposits, by way of cash reserve with itself and by way of balance in current account with theReserve Bank of India. Following the enactment of the Reserve Bank of India (Amendment) Bill 2006, thefloor and ceiling rates (earlier 3.0% and 20.0% respectively) on the cash reserve ratio were removed.
The following liabilities are excluded from the calculation of the demand and time liabilities todetermine the cash reserve ratio:
• inter-bank liabilities;
• liabilities to primary dealers;
• refinancing from the Reserve Bank of India and other institutions permitted to offer refinancing tobanks; and
• perpetual debt qualifying for lower tier I capital treatment.
185

The Reserve Bank of India increased the cash reserve ratio to 6.0% effective April 24, 2010. EffectiveApril 13, 2007 the Reserve Bank of India does not pay any interest on cash reserve ratio balances.
The cash reserve ratio has to be maintained on an average basis for a fortnightly period and should notbe below 70.0% of the required cash reserve ratio on any day of the fortnight.
Statutory Liquidity Ratio
In addition to the cash reserve ratio, a bank is required to maintain a specified percentage of its netdemand and time liabilities by way of liquid assets like cash, gold or approved unencumbered securities. Thepercentage of this liquidity ratio is fixed by the Reserve Bank of India from time to time, and had to be aminimum of 25.0% and a maximum of 40.0% pursuant to section 24 of the Banking Regulation Act. TheBanking Regulation (Amendment) Bill, 2005 introduced in the Indian Parliament proposal to amend section24 of the Banking Regulation Act to remove the minimum Statutory Liquidity Ratio stipulation of 25.0%,thereby giving the Reserve Bank of India the freedom to fix the Statutory Liquidity Ratio below this level. Seealso “Overview of the Indian Financial Sector—Recent Structural Reforms—Proposed Amendments to theBanking Regulation Act”. The Reserve Bank of India required banking companies to maintain a liquidity ratioof 24.0%, effective from November 8, 2008 up to November 7, 2009. Beginning on November 7, 2009,banking companies are required to maintain a liquidity ratio of 25.0%.
Requirements of the Banking Regulation Act
Prohibited Business
The Banking Regulation Act specifies the business activities in which a bank may engage. Banks areprohibited from engaging in business activities other than the specified activities.
Reserve Fund
Any bank incorporated in India is required to create a reserve fund to which it must transfer not less than25.0% of the profits of each year before dividends. If there is an appropriation from this account, the bank isrequired to report the same to the Reserve Bank of India within 21 days, explaining the circumstances leadingto such appropriation. The government of India may, on the recommendation of the Reserve Bank of India,exempt a bank from requirements relating to its reserve fund.
Payment of Dividend
Pursuant to the provisions of the Banking Regulation Act, a bank can pay dividends on its shares onlyafter all its capitalized expenses (including preliminary expenses, share selling commission, brokerage,amounts of losses and any other item of expenditure not represented by tangible assets) have been completelywritten off. The Indian government may exempt banks from this provision by issuing a notification on therecommendation of the Reserve Bank of India. Further, the payment of the dividend by banks is subject to theeligibility criteria specified by the Reserve Bank of India from time to time.
Restriction on Share Capital and Voting Rights
Banks can issue only ordinary shares. The Banking Regulation Act currently specifies that noshareholder in a banking company can exercise voting rights on poll in excess of 10.0% of total voting rightsof all the shareholders of the banking company.
In 2006, the Indian Parliament amended the laws governing India’s public sector banks permitting thesebanks to issue preference shares and make preferential allotments or private placements of equity. Accordingto current provisions private sector banks in India are not permitted to issue preference shares. Legislation hasbeen introduced in the Parliament to amend the Banking Regulation Act to allow all banks to issue redeemableand non-redeemable preference shares. Prior to the amalgamation, ICICI had preference share capital of Rs.3.5 billion redeemable in 2018. The government of India, on the recommendation of the Reserve Bank ofIndia, had granted us an exemption which allowed the inclusion of preference capital in our capital structureuntil the maturity of these shares. However, the Reserve Bank of India in March 2010, issued a guidelinerequiring all commercial banks to treat preference shares as borrowings.
186

A legislation has been introduced in the Indian parliament to amend the Banking Regulation Act toremove the limit of 10.0% on the maximum voting power exercisable by an shareholder in a banking companyand allow banks to issue redeemable and non-redeemable preference shares. See also “Overview of the IndianFinancial Sector—Recent Structural Reforms—Proposed Amendments to the Banking Regulation Act”.
Restrictions on Investments in a Single Company
No bank may hold shares, as a pledgee, mortgagee or absolute owner in any company other than asubsidiary, exceeding 30.0% of the paid up share capital of that company or 30.0% of its own paid up sharecapital and reserves, whichever is less.
Regulatory Reporting and Examination Procedures
The Reserve Bank of India is authorized under the Banking Regulation Act to inspect a bank. TheReserve Bank of India monitors prudential parameters at quarterly intervals. To this end and to enable off-sitemonitoring and surveillance by the Reserve Bank of India, banks are required to report to the Reserve Bankof India on aspects such as:
• assets, liabilities and off-balance sheet exposures;
• the risk weighting of these exposures, the capital base and the capital adequacy ratio;
• the unaudited operating results for each quarter;
• asset quality;
• concentration of exposures;
• connected and related lending and the profile of ownership, control and management; and
• other prudential parameters.
The Reserve Bank of India also conducts periodic on-site inspections on matters relating to the bank’sportfolio, risk management systems, internal controls, credit allocation and regulatory compliance, at intervalsranging from one to three years. We are subject to the on-site inspection by the Reserve Bank of India at yearlyintervals. The inspection report, along with the report on actions taken by us, has to be placed before our boardof directors. On approval by our board of directors, we are required to submit the report on actions taken byus to the Reserve Bank of India. The Reserve Bank of India also discusses the report with our managementteam including the Managing Director and CEO.
The Reserve Bank of India also conducts on-site supervision of selected branches with respect to theirgeneral operations and foreign exchange related transactions.
Appointment and Remuneration of the Chairman, Managing Director and Other Directors
We are required to obtain prior approval of the Reserve Bank of India before we appoint our chairman,managing director and any other executive directors and fix their remuneration. The Reserve Bank of Indiais authorized to remove an appointee to the posts of chairman, managing director and other executive directorson the grounds of public interest, interest of depositors or to ensure our proper management. Further, theReserve Bank of India may order meetings of our board of directors to discuss any matter in relation to us,appoint observers to such meetings and in general may make such changes to the management as it may deemnecessary and may also order the convening of a general meeting of our shareholders to elect new directors.We cannot appoint as a director any person who is a director of another banking company. In July 2004, theReserve Bank of India issued guidelines on ‘fit and proper’ criteria for directors of banks. Our directors mustsatisfy the requirements of these guidelines.
On July 2, 2010, the Reserve Bank of India issued, for comments and feedback, draft guidelines on thecompensation of whole time directors/chief executive officers/risk takers and control function staff of privatesector and local area banks and all foreign banks operating in India. The guidelines include principles foreffective governance of compensation, alignment of compensation with risk taking and effective supervisoryoversight and engagement by stakeholders.
187

Penalties
The Reserve Bank of India may impose penalties on banks and its employees in case of infringementof regulations under the Banking Regulation Act. The penalty may be a fixed amount or may be related to theamount involved in any contravention of the regulations. The penalty may also include imprisonment. A pressrelease has been issued by the Reserve Bank of India giving details of the circumstances under which thepenalty is imposed on the bank along with the communication on the imposition of the penalty in publicdomain. The banks are also required to disclose the penalty in their annual report. In April 2008, the ReserveBank of India issued guidelines for banks engaging recovery agents. Under these guidelines, the Reserve Bankof India may ban banks from engaging recovery agents in a particular area, either jurisdictional or functional,for a limited period, in case of complaints received by the reserve bank regarding violation of the aboveguidelines and adoption of abusive practices followed by banks’ recovery agents. In case of persistent breachof above guidelines, the Reserve Bank of India may consider extending the period of ban or the area of ban.Similar supervisory action could be attracted when the High Courts or the Supreme Court pass strictures orimpose penalties against any bank or its directors/officers/agents with regard to policy, practice and procedurerelated to the recovery process.
Assets to be Maintained in India
Every bank is required to ensure that its assets in India (including import-export bills drawn in India andthe Reserve Bank of India approved securities, even if the bills and the securities are held outside India) arenot less than 75.0% of its demand and time liabilities in India.
Restriction on Creation of Floating Charge
Prior approval of the Reserve Bank of India is required for creating floating charge on our undertakingor property. Currently, all of our borrowings, including bonds, are unsecured.
Maintenance of Records
We are required to maintain books, records and registers. The Banking Regulation Act specificallyrequires banks to maintain books and records in a particular manner and file the same with the Registrar ofCompanies on a periodic basis. The provisions for production of documents and availability of records forinspection by shareholders as stipulated under the Companies Act and the rules thereunder would apply to usas in the case of any company. The Know Your Customer Guidelines framed by the Reserve Bank of India alsoprovide for certain records to be updated every five years. As per the Prevention of Money Laundering Actrecords of a transaction are to be preserved for 10 years from the date of the transaction between a customerand a bank.
Secrecy Obligations
Our obligations relating to maintaining secrecy arise out of common law principles governing itsrelationship with our customers. We cannot disclose any information to third parties except under clearlydefined circumstances. The following are the exceptions to this general rule:
• where disclosure is required to be made under any law;
• where there is an obligation to disclose to the public;
• where we need to disclose information in its interest; and
• where disclosure is made with the express or implied consent of the customer.
We are also required to disclose information if ordered to do so by a court. The Reserve Bank of Indiamay, in the public interest, publish the information obtained from the bank. Under the provisions of theBanker’s Books Evidence Act, a copy of any entry in a bankers’ book, such as ledgers, day books, cash booksand account books certified by an officer of the bank may be treated as prima facie evidence of the transactionin any legal proceeding.
188

Regulations Governing Offshore Banking Units
The government and the Reserve Bank of India have permitted banks to set up Offshore Banking Unitsin Special Economic Zones, which are specially delineated duty free enclaves deemed to be foreign territoryfor the purpose of trade operations, duties and tariffs. We have an Offshore Banking Unit located in theSantacruz Electronic Exports Promotion Zone, Mumbai. The key regulations applicable to offshore bank unitsinclude, but are not limited to, the following:
• No separate assigned capital is required. However, the parent bank is required to provide aminimum of US$ 10 million to its offshore banking unit.
• Offshore Banking Units are exempt from cash reserve ratio requirements.
• The Reserve Bank of India may exempt a bank’s offshore banking unit from statutory liquidityratio requirements on specific application by the bank.
• An offshore banking unit may not enter into any transactions in foreign exchange with residentsin India, unless such a person is eligible to enter into or undertake such transactions under theForeign Exchange Management Act, 1999.
• All prudential norms applicable to overseas branches of Indian banks apply to Offshore BankingUnits.
• Offshore banking units are required to adopt liquidity and interest rate risk management policiesprescribed by the Reserve Bank of India in respect of overseas branches of Indian banks as wellas within the overall risk management and asset and liability management framework of the banksubject to monitoring by the bank’s Board of Directors at prescribed intervals. Further, the bank’sboard would be required to set comprehensive overnight limits for each currency for thesebranches, which would be separate from the open position limit of the parent bank.
• Offshore banking units may raise funds in convertible foreign currency as deposits and borrowingsfrom non-residents including non-resident Indians but excluding overseas corporate bodies.
• Offshore banking units may operate and maintain balance sheets only in foreign currency.
• The loans and advances of Offshore Banking Units would not be reckoned as net bank credit forcomputing priority sector lending obligations.
• Offshore banking units must follow the Know Your Customer guidelines and must be able toestablish the identity and address of the participants in a transaction, the legal capacity of theparticipants and the identity of the beneficial owner of the funds.
The Special Economic Zone Act, 2005 permitted Offshore Banking Units to additionally undertake thefollowing activities:
• Lend outside India and take part in international syndications/consortiums on par with foreignoffices.
• Invest in foreign currency denominated debt of Indian units: and
• Extend facilities to subsidiaries/units of Indian entities, located outside India.
Regulations Governing Use of Business Correspondents
For increasing the outreach of banking and ensuring greater financial inclusion, the Reserve Bank ofIndia issued guidelines for the engagement of Business Correspondents by banks for providing banking andfinancial services in January 2006. Business Correspondents are agents engaged by banks to provide bankingservices at locations other than a bank branch or ATM. Business Correspondents enable a bank to expand itsoutreach and offer a limited range of banking services at low cost, as setting up a brick and mortar branch maynot be viable in all areas. Banks are required to take full responsibility for the acts of omission and commissionof the Business Correspondents that they engage and have to conduct due diligence for minimizing agencyrisks. When the Business Correspondent model was introduced in January 2006, the entities permitted to actas Business Correspondents included individuals such as retired bank employees, retired teachers, individualowners of kirana/medical/fair price shops and certain other individuals. The non-individual entities includedNon-Government Organizations or Micro Finance Institutions set up under Societies/Trust Acts, societiesregistered under Mutually Aided Cooperative Societies Acts or the Cooperative Societies Acts of States,
189

Section 25 companies and post offices. The Reserve Bank of India clarified in April 2008 that banks canengage Section 25 companies as Business Correspondents provided the companies are stand-alone entities orSection 25 companies in which non-banking financial companies, banks, telecom companies and othercorporate entities or their holding companies do not have holdings in excess of 10%. On September 28, 2010,the Reserve Bank of India allowed banks to engage for-profit companies registered under the IndianCompanies Act, 1956, excluding non-banking financial companies, as business correspondents in addition tothe individuals/entities permitted earlier.
Regulations and Guidelines of the Securities and Exchange Board of India
The Securities and Exchange Board of India was established to protect the interests of public investorsin securities and to promote the development of, and to regulate, the Indian securities market. We and oursubsidiaries and affiliates are subject to the Securities and Exchange Board of India regulations for publiccapital issuances, as well as underwriting, custodial, depositary participant, investment banking, brokering,asset management and debenture trusteeship activities. These regulations provide for its registration with theSecurities and Exchange Board of India for each of these activities, functions and responsibilities. We and oursubsidiaries are required to adhere to codes of conduct applicable for these activities.
Special Status of Banks in India
The special status of banks is recognized under various statutes including the Sick Industrial CompaniesAct, 1985, Recovery of Debts Due to Banks and Financial Institutions Act, 1993, and the Securitization Act.As a bank, we are entitled to certain benefits under various statutes including the following:
• The Recovery of Debts Due to Banks and Financial Institutions Act, 1993 provides forestablishment of Debt Recovery Tribunals for expeditious adjudication and recovery of debts dueto any bank or Public Financial Institution or to a consortium of banks and Public FinancialInstitutions. Under this Act, the procedures for recoveries of debt have been simplified and timeframes have been fixed for speedy disposal of cases. Upon establishment of the Debt RecoveryTribunal, no court or other authority can exercise jurisdiction in relation to matters covered by thisAct, except the higher courts in India in certain circumstances.
• The Sick Industrial Companies Act, 1985, provides for reference of sick industrial companies tothe Board for Industrial and Financial Reconstruction. Under the Act, other than the Board ofDirectors of a company, a scheduled bank (where it has an interest in the sick industrial companyby any financial assistance or obligation, rendered by it or undertaken by it) may refer the companyto the Board of Industrial and Financial Reconstruction.
• The Securitization Act focuses on improving the rights of banks and financial institutions and otherspecified secured creditors as well as asset reconstruction companies by providing that suchsecured creditors can take over management control of a borrower company upon default and/orsell assets without the intervention of courts, in accordance with the provisions of theSecuritization Act.
Taxation
In its budget for fiscal 2010, the government of India proposed two major reforms to Indian tax laws,namely the introduction of the Direct Taxes Code, proposed to be effective April 1, 2012, and to the Goodsand Services Tax which is proposed to be effective from April 1, 2011. Under the Goods and Services Taxreforms, it has been proposed to introduce unified goods and services tax structure to expand the tax base,rationalize the input tax credit and harmonize the current multiple taxation laws in India. The goods andservices tax would replace the indirect taxes on goods and services such as central excise duty, service tax,customs duty, central sales tax, surcharge and cess currently being collected by the central and stategovernments.
The Direct Taxes Code Bill has been tabled in the Parliament in August 2010, which is proposed to comein effect from April 2012, if enacted. It seeks to consolidate and amend laws relating to all direct taxes likeincome tax, dividend distribution tax, fringe benefit tax and wealth tax and facilitate voluntary compliance.
Income Tax Benefits
As a banking company, the Bank is entitled to certain tax benefits under the Indian Income-tax Actincluding the following:
190

• We are allowed a deduction of up to 20% of the profits derived from the business of providinglong-term finance (defined as loans and advances extended for a period of not less than five years)computed in the manner specified under the Indian Income Tax Act and carried to a SpecialReserve account. The deduction is allowed subject to the aggregate of the amounts transferred tothe Special Reserve Account for this purpose from time to time not exceeding twice our paid-upshare capital and general reserves. The amount withdrawn from such a Special Reserve Accountwould be chargeable to income tax in the year of withdrawal, in accordance with the provisionsof the Income-tax Act.
• We are entitled to a tax deduction on the provisioning towards bad and doubtful debts equal to7.5% of our total business income, computed before making any deductions permitted pursuant toChapter VIA of the Indian Income-tax Act, and to the extent of 10.0% of the aggregate averageadvances made by our rural branches computed in the manner prescribed. We have the option ofclaiming a deduction in excess of the specified limits, for an amount not exceeding the incomederived from redemption of securities in accordance with the scheme framed by the centralgovernment.
• We are entitled to a tax deduction, for income from an offshore banking unit in a special economiczone, at the rate of 100.0% for a period of five consecutive years beginning with the year in whichpermission under Banking Regulation Act, 1949 is obtained, i.e., up to March 31, 2008 forOffshore Banking Unit in Santacruz Electronics Export Processing Zone, Mumbai and 50.0%deduction for a period of five consecutive years thereafter in accordance with and subject to theconditions prescribed therein.
Subject to application for and receipt of certain approvals, we are eligible to issue tax saving bondsapproved in accordance with and subject to the provisions of the Indian Income-tax Act and are also eligibleto issue zero coupon bonds in accordance with the applicable guidelines.
For income tax purposes, our bonds are prescribed modes of investing and depositing surplus money bycharitable and religious trusts subject to and in accordance with the provisions contained therein.
Regulations Governing Insurance Companies
ICICI Prudential Life Insurance Company and ICICI Lombard General Insurance Company, oursubsidiaries offering life insurance and non-life insurance respectively, are subject to the provisions of theInsurance Act, 1938 and the various regulations prescribed by the Insurance Regulatory and DevelopmentAuthority. These regulations regulate and govern, among other things, registration as an insurance company,investment, solvency margin requirements, licensing of insurance agents, advertising, sale and distribution ofinsurance products and services and protection of policyholders’ interests. In May 2002, the Indian Parliamentapproved the Insurance (Amendment) Act 2002, which facilitates the appointment of corporate agents byinsurance companies and prohibits intermediaries and brokers from operating as surrogate insurance agents.The Indian government, while presenting its budget for fiscal 2005, has proposed an increase in the limit onforeign equity participation in private sector insurance companies from 26.0% to 49.0%. However, this wouldrequire an amendment to the insurance laws and the foreign direct investment policy and has not yet beenimplemented. In fiscal 2007, the general insurance industry in India was de-tariffed whereby insurancepremiums were freed from price controls, resulting in a significant reduction in premium rates and negativeimpact on growth in the general insurance sector. In July 2009, the Insurance Regulatory and DevelopmentAuthority issued guidelines introducing a cap on charges levied on customers investing in equity linked lifeinsurance policies. Further, in August 2009, Insurance Regulatory and Development Authority clarified thatmortality and morbidity charges are not a part of the cap and removed any policy surrender charges from thefifth policy year onwards for unit- linked products. In September 2009, the Insurance Regulatory andDevelopment Authority issued guidelines restricting the transfer of agency/corporate agency from one insurerto another. In September 2009, the Committee on Investor Awareness and Protection, constituted by thegovernment of India for developing minimum common standards for financial advisers and financialeducation, submitted its draft report for public comments. The recommendations include that agentcommissions on insurance products be paid directly by the customer and not by the insurer and setting up ofan organization to promote financial literacy and evolve a common standard for financial advisers.
In July 2009, the Insurance Regulatory and Development Authority introduced a cap on charges ofunit-linked insurance products. The difference between gross and net yields were capped at 300 basis pointsfor products with a tenor of less than 10 years and 225 basis points for products with a tenor more than 10years. The fund management charges within these charges were capped at 150 basis points and 125 basisproducts with tenors of less than 10 years and more than 10 years respectively. The life insurance industry will
191

also have to incorporate specific changes in its product offering as mandated by the Insurance RegulatoryDevelopment Authority, with effect from September 1, 2010. The changes specified by the InsuranceRegulatory and Development Authority include a cap on surrender charges, an increase in the minimumpremium paying term and minimum guaranteed returns on pension products. The minimum guaranteed returnof 4.5% on pension products is applicable up to year-end fiscal 2011. From fiscal 2012 the guaranteed returnwill be 50 basis points above the average reverse repo rate subject to a maximum of 6% and a minimum of3%. On October 21, 2010, the Insurance Regulatory and Development Authority ordered that insurers can notsell universal life insurance products until guidelines on regulation of such products are finalized. See also“Risk Factors—Risks Relating to Our Business—The regulatory environment for financial institutions isfacing unprecedented change in the post-financial crisis environment”.
Regulations Governing Mutual Funds
ICICI Prudential Asset Management Company, our asset management subsidiary, is subject to provisionsof the Securities and Exchange Board of India (Mutual Fund) Regulations 1996, as amended from time to time.These regulations regulate and govern, among other things, registration as a mutual fund, restrictions onbusiness activities of an asset management company, process for launching of mutual fund schemes,investment objectives and valuation policies and pricing. In June 2009, the Securities and Exchange Board ofIndia issued guidelines stating that mutual funds could not charge any entry load to investors investing inmutual fund schemes. In August 2009, the Securities and Exchange Board of India issued guidelines directingmutual funds to ensure parity of exit loads charged across various unit holder groups.
In February 2010, the Securities and Exchange Board of India introduced guidelines for the valuationof money market and debt securities with a view to ensuring that the value of money market and debt securitiesin the portfolio of mutual fund schemes reflect the current market scenario. The valuation guidelines areeffective from August 1, 2010.
Regulations Governing International Operations
Our international operations are governed by regulations in the countries in which we have a presence.
Overseas Banking Subsidiaries
Our wholly-owned subsidiary in the United Kingdom, ICICI Bank UK PLC is authorized and regulatedby the FSA, which granted its application under Part IV of the Financial Services and Markets Act, 2000. TheUK subsidiary has established a branch in Antwerp, Belgium under the European Union Passportingarrangements and also opened a branch in Frankfurt, Germany. The UK subsidiary implemented the Basel IIcapital adequacy framework for calculating minimum capital requirements effective January 1, 2008.
Our wholly owned subsidiary in Canada, ICICI Bank Canada (a Schedule II Bank in Canada), isregulated by the Office of the Superintendent of Financial Institutions, which provided it with an order tocommence and carry on business, on November 25, 2003. ICICI Bank Canada’s wholly owned subsidiary,ICICI Wealth Management Inc., is regulated by Ontario Securities Commission, which licensed it as a LimitedMarket Dealer, on March 2, 2007. The Canadian subsidiary adopted the capital adequacy framework (BaselII) as required by the Office of the Superintendent of Financial Institutions effective January 1, 2008.
Our wholly-owned subsidiary in Russia, ICICI Bank Eurasia LLC, is regulated by the Central Bank ofthe Russian Federation. The capital requirements prescribed by the Central Bank of Russia, which are basedon Basel I, are applicable for ICICI Bank Eurasia LLC.
Offshore Branches
The Foreign Exchange Management (Borrowing or Lending in Foreign Exchange) Regulations, 2000, asamended, and rules issued thereunder, permit a branch located outside India of a bank incorporated orconstituted in India to borrow in foreign currency in the normal course of its banking business outside Indiasubject to the directions or guidelines issued by the Reserve Bank of India from time to time, and theRegulatory Authority of the country where the branch is located.
In Singapore, we have an offshore branch regulated by the Monetary Authority of Singapore. TheSingapore branch is allowed to accept foreign currency deposits from Singapore non-bank-residents whoseinitial deposit is not less than US$ 100,000. The Singapore branch is currently engaged in corporate andinstitutional banking, private banking and treasury-related activities. On March 22, 2010, the MonetaryAuthority of Singapore granted the Singapore branch Qualified Full Banking Privileges. In Bahrain, we havean offshore branch, regulated by the Central Bank of Bahrain. The Bahrain branch is permitted to transact
192

banking business with approved financial institutions within Bahrain, individuals or institutions outsideBahrain. It is also permitted to offer banking services to non-resident Indians in Bahrain. Our branch in HongKong is regulated by the Hong Kong Monetary Authority and is permitted to undertake banking business inthat jurisdiction with certain restrictions. Our branch in Sri Lanka is regulated by the Central Bank of SriLanka. Our branch in the Dubai International Financial Center (DIFC) is regulated by the DIFC FinancialServices Authority and is licensed to engage in the arrangement of credit or investment and to provide adviceon financial products and services. In addition we also have an Offshore Banking Unit located in the SantacruzElectronic Exports Promotion Zone, Mumbai. The Qatar Financial Center Regulatory Authority regulates ourbranch in Qatar. Our branch in New York is regulated by the State of New York Banking Department, theFederal Reserve Board and the Office of the Comptroller of the Currency.
Representative Offices
Our representative office in Dubai and Abu Dhabi in the United Arab Emirates is regulated by theCentral Bank of the United Arab Emirates. Our representative office in Shanghai, China is regulated by theChina Banking Regulatory Commission. The representative office in Bangladesh is regulated by theBangladesh Bank. Our representative office in South Africa is regulated by the South African Reserve Bank.Our representative office in Malaysia is regulated by Bank Negara Malaysia. Our representative office inIndonesia is regulated by Bank Indonesia. Bank of Thailand regulates our representative office in Thailand.
193

DESCRIPTION OF THE NOTES
The following description is a summary of the material provisions of the notes and the indenture. Thissummary is not complete and is subject to, and qualified in its entirety by reference to, the provisions of theindenture and the notes. Capitalized terms used in the following summary and not otherwise defined hereinshall have the meanings ascribed to them in the indenture. You may obtain copies of the indenture andspecimen notes upon request to the trustee at the address set forth under “—The Trustee” below.
General
We will issue the notes under an indenture to be dated on or about November 16, 2010, between us andThe Bank of New York Mellon, as trustee.
The notes will have the following basic terms:
• The notes issued in this offering will be in an aggregate principal amount of US$1,000,000,000.The principal amount of the notes will be payable in full in a single payment on November 16,2020.
• The regular record dates for the notes will be the day that is fifteen calendar days prior to eachinterest payment date for the respective notes.
The notes will bear interest at a fixed rate of 5.75% per annum, from November 16, 2010. Interest onthe notes will be paid semi-annually in arrears on May 16 and November 16 of each year, commencing on May16, 2011, to the holders of notes registered as such as of the close of business on May 2 and November 2immediately preceding the relevant interest payment date. Interest on the notes will accrue from the date oforiginal issuance or, if interest has already been paid, from the date it was most recently paid. Interest will becomputed on the basis of a 360-day year of twelve 30-day months.
In the event that any payments of interest or otherwise on the notes are made through India, suchpayments are subject to approval by the Reserve Bank of India.
Ranking
The notes will be our general unsecured and unsubordinated obligations, and will rank pari passuamongst themselves and equal in right of payment with all of our existing and future unsecured andunsubordinated obligations that are not either (i) required to be preferred by applicable law or (ii) by theirterms expressly subordinated in right of payment to the notes.
Listing
We have received approval in-principle for the listing of the notes on the Singapore Exchange. The noteswill be traded on the Singapore Exchange in a minimum board lot size of S$200,000 (or its equivalent inforeign currencies) for so long as the notes are listed on the Singapore Exchange and the rules of that exchangeso require.
Payments of Principal and Interest
Payment of the principal of the notes, together with accrued and unpaid interest thereon, will be madeon the payment date therefor to the person in whose name the note is registered as of the close of business,New York City time, on the record date prior to that payment date. The notes do not need to be surrenderedto receive payment of principal, interest or other amounts, except in connection with a redemption or inconnection with the final payment of principal on the relevant maturity date.
Payments of principal and interest shall be made by depositing immediately available funds in USdollars into an account maintained by, or on behalf of, the trustee, acting on behalf of the noteholders.
The notes will initially be represented by one or more global notes. Payments of principal and intereston the global notes will be made to DTC, Euroclear or Clearstream, Luxembourg, as registered holder thereof.It is expected that such registered holder of global notes will receive the funds for distribution to the holdersof beneficial interests in the global notes. Neither ICICI Bank, the trustee nor any paying agent shall have anyresponsibility or liability for any of the records of, or payments made by, DTC, Euroclear or Clearstream,Luxembourg. See “Form, Denomination and Transfer”.
194

If any date for a payment of principal or interest or redemption is not a business day in a city wherepayment is made or in the city of any paying agent, payment will be made on the next business day in thatcity unless it would thereby fall into the next calendar month, in which case payment will be brought forwardto the preceding business day in such city. The amount of interest or other payment shall not be altered as aresult of such arrangements.
Additional Amounts
We will make all payments of principal and interest on the notes without withholding or deducting anypresent or future taxes, penalties, fines, duties, assessments or other governmental charges of any nature(which we refer to collectively as “taxes”) imposed by India or Hong Kong, including any political subdivisionor governmental authority of those jurisdictions having power to tax (each, a “Taxing Jurisdiction”) unlesssuch taxes are required by law to be deducted or witheld. If we are required by law to withhold or deductamounts for any such taxes, except as provided below, we will pay the noteholders or the trustee, as the casemay be, any additional amounts necessary so that they receive the same amounts as they would have receivedwithout such withholding or deduction. We will not, however, pay such additional amounts in connection withany taxes imposed due to any of the following:
• the noteholder or beneficial owner having or having had some connection with a TaxingJurisdiction other than merely holding the notes, receiving principal or interest payments on thenotes or enforcement of such notes (such as citizenship, nationality, residence, domicile, orexistence of a business, a permanent establishment, a dependent agent, a place of business or aplace of management present or deemed present within a Taxing Jurisdiction);
• any tax imposed on, or measured by, net income of the noteholder or beneficial owner;
• the noteholder’s or beneficial owner’s failure to comply with any certification, identification orother reporting requirements concerning its nationality, residence, identity or connection with aTaxing Jurisdiction, if (1) compliance is required by applicable law (but not including treaties),regulation or administrative practice as a precondition to exemption from all or a part of the taxes,(2) the noteholder or beneficial owner is able to comply with those requirements without unduehardship and (3) we have given noteholders at least 30 days’ prior written notice before any suchwithholding or deduction that they will be required to comply with such requirements;
• the noteholder’s failure to surrender (where surrender is required) its note within 30 days after wehave made available to the noteholder a payment of principal or interest, provided that we will payadditional amounts to which a noteholder would have been entitled had such note been surrenderedon any day (including the last day) within such 30-day period;
• any estate, inheritance, gift, transfer, capital gains, excise, value added, use or sales taxes or anysimilar taxes, assessments or other governmental charges;
• where such withholding or deduction is imposed on a payment to an individual and is required tobe made pursuant to European Council Directive 2003/48/EC or any other directive implementingthe conclusions of the ECOFIN Council meeting of November 26-27, 2000 on the taxation ofsavings income, or any law implementing or complying with, or introduced in order to conformto, such Directive or such other directive;
• where the noteholder or beneficial owner who presents a note for payment (where presentation isrequired) would be able to avoid such withholding or deduction by presenting the note elsewherein a member state of the European Union; or
• any combination of the above items.
Nor will additional amounts be paid with respect to any payment on a note to a noteholder who is afiduciary, a partnership, a limited liability company or other than the sole beneficial owner of that payment,to the extent that payment would be required by the laws of a Taxing Jurisdiction to be included in the income,for tax purposes, of a beneficiary or settlor with respect to the fiduciary, a member of that partnership, aninterest holder in that limited liability company or a beneficial owner who would not have been entitled to theadditional amounts had it been the noteholder.
Any additional amounts paid by us on the notes through India would be subject to approval fromthe Reserve Bank of India.
195

We will make any required withholding or deduction and remit the full amount withheld or deducted tothe relevant taxing authority in accordance with applicable law. We will furnish to the trustee, within 30 daysafter the date of payment of any such taxes, certified copies of tax receipts or other documentation reasonablysatisfactory to the trustee evidencing that payment. We will use reasonable efforts to attach to each certifiedcopy a certificate stating (x) that the amount of taxes evidenced by the certified copy was paid in connectionwith payments on the notes then outstanding upon which such taxes were due and (y) the amount of suchwithholding taxes paid per US$1,000 principal amount of the notes upon which such taxes were paid. At least10 business days prior to each date on which any payment under or with respect to the notes is due andpayable, if we are obligated to pay additional amounts with respect to such payment, we will deliver to thetrustee an officer’s certificate stating that additional amounts will be payable, the amounts so payable andsetting forth such other information as the trustee shall reasonably require for tax purposes.
We will pay any stamp, administrative, court, documentary, excise or property taxes imposed on theinitial issuance and delivery of the notes in a Taxing Jurisdiction and will indemnify the noteholders for anysuch taxes paid by the noteholders, excluding any such duties or taxes which may relate to any transfer ortransmission of the notes following their initial issuance and delivery by us.
All references to principal, interest or other amounts payable on the notes in this offering memorandumare deemed to include any additional amounts payable by us with respect thereto. These obligations willsurvive any termination, defeasance or discharge of the notes and the indenture.
If we are required at any time to pay additional amounts to noteholders pursuant to the terms of the notesand the indenture, we will use our reasonable efforts to obtain an exemption from the payment of (or otherwiseavoid the obligation to pay) the taxes which have resulted in the requirement that we pay additional amounts.
Certain Covenants
For so long as any of the notes are outstanding and any amount remains unpaid under the indenture andthe notes, we will comply with the terms of the covenants described below, among others:
Performance of Obligations Under the Notes and the Indenture
We will pay all amounts owed by us under the terms of the notes and the indenture.
Maintenance of Approvals
We will obtain and maintain in full force and effect all governmental approvals, consents or licenses ofany governmental authority under the laws of Hong Kong or India necessary for the conduct of our businessor the consummation of the transactions contemplated herein; provided that it is acknowledged that thegranting of such approvals, consents or licenses may be within the discretion of such governmental authority.
Maintenance of Books and Records
We will keep proper books of record and account and maintain proper accounting, managementinformation and control systems in accordance with generally accepted accounting principles in India andprudential guidelines stipulated by the Reserve Bank of India and, where applicable, the Hong Kong MonetaryAuthority and all other applicable laws and regulations.
Maintenance of Office or Agency
We will maintain an office or agency in the Borough of Manhattan, The City of New York where noticesto and demands upon us in respect of the indenture and the notes may be served. Initially this office will beat our New York representative office located at ICICI Bank Limited, New York Representative Office, 500Fifth Avenue, Suite 2830, New York, New York 10110, and we will agree not to change the designation of suchoffice without prior notice to the trustee and designation of a replacement office.
Appointment to Fill a Vacancy in the Office of the Trustee
Whenever necessary to avoid or fill a vacancy in the office of the trustee, we will appoint a successortrustee so that there will at all times be a trustee with respect to the notes.
196

Maintenance of Existence and Conduct of Business
Subject to the covenant described in “—Consolidation, Merger, Conveyance or Transfer”, we will do allthings necessary to preserve and keep in full force and effect our corporate existence and rights with respectto our corporate existence; provided, however, that we will not be required to preserve any such right if wedetermine that the preservation thereof is no longer desirable in the conduct of our business and that the lossthereof is not disadvantageous in any material respect to the noteholders.
Notice of Certain Events
Upon the occurrence of any event of default under the indenture, we will give written notice to thetrustee promptly, and in any event within ten days after we become aware of such occurrence.
Provision of Information
If the trustee has received written notice of an event of default, the trustee will give notice of that eventto the noteholders within 90 days after the trustee has received written notice thereof. The trustee maywithhold notice to the noteholders of such an event (except the non-payment of principal or interest) if itsboard of directors or a committee of its trust officers determines in good faith that withholding notice is in theinterests of the noteholders.
We will provide to the trustee, in English or accompanied by a certified English translation thereof:
• within 90 days after the end of each fiscal quarter (other than the fourth quarters), our unauditedand unconsolidated balance sheet and statement of income for the quarter then ended if requiredto be published under Indian law, rules or regulations;
• within 120 days after the end of the first half of the fiscal year, our audited and unconsolidatedbalance sheet and statement of income for the six months then ended if required to be publishedunder Indian law, rules or regulations;
• within 120 days after the end of each fiscal year, our audited unconsolidated balance sheet andstatement of income for the year then ended as required to be published under Indian law, rules orregulations; and
• such other publicly available financial data about us or our Hong Kong branch as the trustee mayreasonably request.
Compliance Certificate
We will provide to the trustee, together with each of the financial statements described above, acompliance certificate signed by one of our directors or executive officers stating that no event of default hasoccurred during that period or, if one or more events have actually occurred, specifying those events and whatactions, if any, have been taken by us upon becoming aware of the occurrence and will be taken by us withrespect to each such event.
Reports to Holders
While any notes remain outstanding, we shall, during any period in which we are not subject to Section13 or 15(d) of the Exchange Act or exempt from reporting pursuant to Rule 12g3-2(b) under the Exchange Act,make available to any qualified institutional buyer (as defined in Rule 144A under the Securities Act) who isa holder and any prospective purchaser of a note who is a qualified institutional buyer (as so defined)designated by such holder, upon the request of such holder or prospective purchaser, the informationconcerning us required to be provided to such holder or prospective purchaser by Rule 144A(d)(4) under theSecurities Act.
Further Actions
We will, at our own cost and expense, take any action at any time required, as necessary or as requestedby the trustee, in accordance with applicable laws and regulations, to be taken in order:
• to enable us lawfully to enter into, exercise our rights and perform our obligations under the notesand the indenture;
• to ensure that our obligations under the notes and the indenture are legally binding andenforceable;
197

• to make the notes and the indenture admissible in evidence in the courts of the State of New York,India or Hong Kong; and
• to enable the trustee to exercise and enforce its rights under and carry out the terms, provisions andpurposes of the indenture.
Negative Pledge
So long as any of the notes remain outstanding (within the meaning of the indenture), we will not createor permit to be outstanding a Security Interest to secure any External Obligations without according to thenotes, to the satisfaction of the trustee, the same security or such other security as the trustee, in its absolutediscretion, shall deem not materially less beneficial to the interests of the noteholders or as shall be approvedby noteholders holding no less than a majority of the aggregate principal amount of the notes then outstanding;provided, however, that the foregoing shall not apply to:
(1) any Security Interest in existence on the date of the issuance of the notes;
(2) any Security Interest granted by us in favor of a Governmental Agency to secure any ExternalObligations issued to such Governmental Agency for the purposes of implementing adevelopmental policy of a Governmental Agency, pursuant to a law or by contract;
(3) any Security Interest on property existing at the time of acquisition of such property by us providedsuch Security Interest was not created in contemplation of such acquisition or in connectiontherewith and the principal, capital or nominal amount of the indebtedness secured by suchSecurity Interest outstanding as at the time of such acquisition is not increased and is repaid inaccordance with its original schedule of maturity; and
(4) any Security Interest arising in the ordinary course of our banking arrangements or by operationof law in our ordinary course of trading or banking transactions or in the ordinary course of anytransaction to which we are a party in our capacity as a member of any applicable clearing system.Notwithstanding anything to the contrary in this restriction, any credit enhancement, including aguarantee (but not including a Security Interest), provided by us in connection with a QualifiedReceivables Transaction (executed pursuant to applicable laws and regulations) shall not be subjectto this negative pledge.
As used herein, the following terms have the respective meanings set forth below:
“External Obligations” means all of our obligations, including guarantees, in respect of bonds,debentures, notes or other debt securities which by their terms (i) are payable in a currency other than Rupeesor are denominated in Rupees and more than 50% of the aggregate principal amount of which is initiallydistributed outside of India by or with our authorization; and (ii) which are quoted, listed or ordinarily dealtin on any stock exchange or over-the-counter or other securities market outside India.
“Security Interest” means any mortgage, charge, pledge or other security interest upon the whole or anypart of our properties, assets or revenues.
“Governmental Agency” means the government of India or any state or political sub-division ordepartment thereof or any regulatory agency, body or authority thereof or a body corporate owned andcontrolled by any of them.
“Qualified Receivables Transaction” means any transaction or series of transactions entered into by uspursuant to which we (i) sell, convey or otherwise transfer or (ii) grant a participation or beneficial interestin, our receivables and any assets related thereto.
Consolidation, Merger, Conveyance or Transfer
We will not, without the consent of noteholders holding no less than 66 2/3% in aggregate principalamount of the notes outstanding, consolidate with or merge into any other person or convey or transfersubstantially all of our properties and assets to any other person unless thereafter:
• the person formed by such consolidation or into which we are merged, or the person whichacquires all or substantially all of our properties and assets, expressly assumes the due andpunctual payment of the principal of and interest on the notes and the performance or observance
198

of every covenant of the indenture on our part to be performed or observed (including, if suchperson is not organized in or a resident of India or Hong Kong for tax purposes, substituting suchperson’s jurisdiction of organization or residence for tax purposes for India or Hong Kong whereapplicable, including for the obligation to pay additional amounts and the right to redeem the notesas described in “—Redemption—Optional Tax Redemption”);
• immediately after giving effect to such transaction, no event of default has occurred and iscontinuing and no covenant or agreement in the indenture has been materially breached; and
• the person formed by such consolidation or into which we are merged, or the person whichacquires all or substantially all of our properties and assets delivers to the trustee an officers’certificate and an opinion of counsel, each stating that the consolidation, merger, conveyance ortransfer and, if a supplemental indenture is required in connection with the transaction, thesupplemental indenture comply with the indenture and that all conditions precedent in theindenture relating to the transaction have been complied with, except that such certificate andopinion shall not be required in the event any such consolidation, merger, conveyance or transferis made by order of any court or tribunal having jurisdiction over us, our assets or properties.
Redemption
Redemption at Maturity
Unless previously redeemed, or purchased and cancelled, the notes shall be redeemed at their principalamount in US dollars on November 16, 2020. The redemption price payable at such time shall be the originalprincipal amount of the notes plus accrued and unpaid interest thereon, and all other amounts due and payableunder the terms of the notes and the indenture.
Optional Redemption
The notes will be redeemable as a whole or in part, at our option at any time, at the redemption priceequal to the greater of (i) 100% of the principal amount of such notes and (ii) the sum of the present valuesof the remaining scheduled payments of principal and interest (exclusive of interest accrued to the date ofredemption) discounted to the redemption date on a semiannual basis (assuming a 360-day year consisting oftwelve 30-day months) at the Treasury Rate plus 50 basis points, plus in each case accrued interest thereonto the date of redemption.
“Treasury Rate” means, with respect to any redemption date, the rate per annum equal to the semiannualequivalent yield to maturity or interpolated (on a day count basis) of the Comparable Treasury Issue, assuminga price for the Comparable Treasury Issue (expressed as a percentage of its principal amount) equal to theComparable Treasury Price for such redemption date.
“Comparable Treasury Issue” means the United States Treasury security or securities selected by anIndependent Investment Banker as having an actual or interpolated maturity comparable to the remaining termof the notes to be redeemed that would be utilized, at the time of selection and in accordance with customaryfinancial practice, in pricing new issues of corporate debt securities of a comparable maturity to the remainingterm of such notes.
“Independent Investment Banker” means one of the Reference Treasury Dealers appointed by the trusteeafter consultation with us.
“Comparable Treasury Price” means, with respect to any redemption date, (A) the average of theReference Treasury Dealer Quotations for such redemption date, after excluding the highest and lowest suchReference Treasury Dealer Quotations, or (B) if the trustee obtains fewer than four such Reference TreasuryDealer Quotations, the average of all such quotations.
“Reference Treasury Dealer Quotations” means, with respect to such Reference Treasury Dealer and anyredemption date, the average, as determined by the trustee, of the bid and asked prices for the ComparableTreasury Issue (expressed in each case as a percentage of its principal amount) quoted in writing to the trusteeby such Reference Treasury Dealer at 3:30 p.m. New York time on the third business day preceding suchredemption date.
199
“Reference Treasury Dealer” means each of Barclays Bank PLC, Citigroup Global Markets Limited andDeutsche Bank AG, Singapore Branch or their affiliates which are primary US Government securities dealers,and their respective successors; provided, however, that if any of the foregoing or their affiliates shall ceaseto be a primary US Government securities dealer in The City of New York (a “Primary Treasury Dealer”), weshall substitute therefor another Primary Treasury Dealer.
Notice of any redemption will be mailed at least 30 days but not more than 60 days before theredemption date to each holder of notes to be redeemed.
Unless we default in payment of the redemption price, on and after the redemption date interest willcease to accrue on the notes, or portions thereof called for redemption.
Optional Tax Redemption
The notes may be redeemed at any time at our option, in whole, but not in part, upon not less than 30nor more than 60 days prior notice to the holders of such notes, at a redemption price equal to 100% of theprincipal amount of the notes then outstanding plus accrued and unpaid interest on the principal amount beingredeemed to (but excluding) the redemption date, if (i) as a result of any change in, or amendment to, the lawsof a Taxing Jurisdiction or any regulations or rulings promulgated thereunder or any change in the officialinterpretation or official application of such laws, regulations or rulings (and with respect to India, suchchange or amendment must increase the rate of withholding above the current 20% (plus applicable surchargeand cess)), which change or amendment becomes effective on or after the date of this offering memorandum(or, if the person formed by a consolidation, merger, conveyance or transfer is not organized or resident inIndia or Hong Kong for tax purposes, on or after the date of such consolidation, merger, conveyance ortransfer), we (or our successor) are or would be obligated on the next succeeding due date for a payment withrespect to the notes to pay additional amounts and (ii) such obligation cannot be avoided by us takingreasonable measures available to us, which may include changing the jurisdiction from which or throughwhich payments are made. Prior to any redemption of notes, the indenture requires that we deliver to thetrustee an opinion of tax counsel of recognized standing to the effect that such change or amendment hasoccurred, and an officer’s certificate stating that we are entitled to effect such redemption and setting forth astatement of facts showing that the conditions precedent to the right of redemption have occurred. No noticeof redemption may be given earlier than 90 days prior to the earliest date on which we would be obligated topay additional amounts if a payment in respect of the notes were then due.
Cancellation
Any notes redeemed by us will be immediately canceled and may not be reissued or resold.
Purchases of Notes by the Issuer
We and each of our subsidiaries may at any time purchase any notes in the open market or otherwise atany price. In determining whether noteholders holding any requisite principal amount of notes have given anyrequest, demand, authorization, direction, notice, consent or waiver under the indenture, notes owned by usor our affiliates will be deemed not outstanding for purposes thereof. We may at any time deliver to the trusteefor cancellation any notes previously authenticated and delivered pursuant to the indenture which we may haveacquired in any manner whatsoever.
Events of Default
The following events will each be an event of default under the terms of the notes and the indenture:
• we fail to make any principal payment on the notes, whether on the maturity date, upon redemptionor otherwise;
• we fail to make any interest payment or any payment of additional amounts in accordance with theterms of the notes and the indenture and this non-payment continues for 15 days;
• we fail to perform any other covenant in the indenture and this failure to perform continues for 60days after written notice as provided in the indenture;
• a court or agency or supervisory authority in India institutes a proceeding under any bankruptcy,insolvency, rehabilitation, readjustment of debt, marshalling of assets and liabilities or similar law,or for our winding up or the liquidation of our affairs, or adjudging us bankrupt or insolvent, andsuch proceedings have not been vacated or have remained in force undischarged or unstayed for60 days;
200

• (i) a court or agency or supervisory authority in Hong Kong institutes a proceeding under anybankruptcy, insolvency, rehabilitation, readjustment of debt, marshalling of assets and liabilities orsimilar law, or for our winding up or the liquidation of our affairs, or adjudging us bankrupt orinsolvent; or (ii) a court or agency or supervisory authority in Hong Kong or India (1) enters adecree or order for relief under any bankruptcy, insolvency, rehabilitation, readjustment of debt,marshalling of assets and liabilities or similar law, or for our winding up or the liquidation of ouraffairs, or adjudging us bankrupt or insolvent, (2) enters a decree or order approving as properlyfiled a petition seeking our reorganization, arrangement, adjustment or composition under anyapplicable law except a reorganization permitted under the indenture or (3) enters a decree or orderappointing a custodian, receiver, liquidator, assignee, trustee, sequestrator or other similar officialfor us or all or substantially all our assets; or (iii) any event occurs that under the laws of HongKong or India has an analogous effect to any of the foregoing events; and provided that, in eachcase, those proceedings, decree or order have not been vacated or have remained in forceundischarged or unstayed for 60 days;
• we commence a voluntary case or proceeding under any applicable bankruptcy, insolvency,reorganization or other similar law or any other case or proceeding to be adjudicated bankrupt orinsolvent, or we consent by answer or otherwise to the entry of a decree or order for relief in aninvoluntary case or proceeding under any applicable bankruptcy, insolvency, reorganization orother similar law or to the commencement of any bankruptcy or insolvency case or proceedingagainst us or our dissolution or any event occurs that under the laws of Hong Kong or India hasan analogous effect to any of the foregoing events;
• any default under any mortgage, indenture or instrument under which there may be issued or bywhich there may be secured or evidenced any of our Indebtedness, whether such Indebtedness nowexists, or is created after the date of the indenture, if that default:
(1) is caused by a failure to pay principal of, or interest or premium, if any, on, suchIndebtedness within the grace period provided in such Indebtedness on the date of suchdefault, or a Payment Default; or
(2) results in the principal amount of such Indebtedness being deemed to be or otherwisebecomes due and payable prior to its express maturity and such default continues for 60 daysafter written notice as provided in the indenture,
and, in each case, the principal amount of any such Indebtedness, together with the principalamount of any other such Indebtedness under which there has been a Payment Default or thematurity of which has been so accelerated, aggregates US$25,000,000 (or its equivalent in anothercurrency) or more;
• distress, attachment, execution or other legal process is levied or enforced upon or against anymaterial part of our property, assets or revenues and is not either discharged or stayed within 120days (or such longer period as the trustee may agree in light of the jurisdiction concerned), unless,and for so long as, the trustee is satisfied that such levy or enforcement is being contested in goodfaith and by appropriate proceedings;
• an encumbrancer takes possession or an administrative or other receiver, manager or other similarperson is appointed over, or an attachment order is issued in respect of, the whole or any materialpart of our undertaking, property, assets or revenues and in any such case possession orappointment is not stayed or terminated or the debt on account of which such possession was takenor appointment was made is not discharged or satisfied within 120 days (or such longer period asthe trustee may agree in light of the jurisdiction concerned) of such possession, appointment or theissue of such order; and
• any governmental authority or agency condemns, seizes, compulsorily purchases or expropriatesall or any material part of our assets or shares without fair compensation.
As used herein, the following terms have the respective meanings set forth below:
“GAAP” means generally accepted accounting principles set forth in the relevant opinions andpronouncements in the relevant jurisdiction or in such other statements by such other entity as have beenapproved by a significant segment of the accounting profession in the relevant jurisdiction, which are in effecton the date of the indenture.
201

“Hedging Obligations” means, with respect to any specified Person, the obligations of such Personunder:
(a) interest rate swap agreements (whether from fixed to floating or from floating to fixed), interestrate cap agreements and interest rate collar agreements;
(b) other agreements or arrangements designed to manage interest rates or interest rate risk; and
(c) other agreements or arrangements designed to protect such Person against fluctuations in currencyexchange rates or commodity prices.
“Indebtedness” means, with respect to any specified Person, any indebtedness of such Person (excludingaccrued expenses and trade payables), whether or not contingent:
(a) in respect of borrowed money (excluding customer deposits);
(b) evidenced by bonds, notes, debentures or similar instruments or letters of credit;
(c) in respect of banker’s acceptances;
(d) in respect of the amount of any liability in respect of any lease or hire purchase contract whichwould, in accordance with Indian GAAP, be treated as a finance or capital lease;
(e) representing the balance deferred and unpaid of the purchase price of any property or services duemore than six months after such property is acquired or such services are completed; or
(f) in respect of any derivative transaction entered into in connection with protection against or benefitfrom fluctuation in any rate or price (and, when calculating the value of any derivative transaction,only the marked to market value shall be taken into account), if and to the extent any of thepreceding items (other than letters of credit and Hedging Obligations) would appear as a liabilityupon a balance sheet of the specified Person prepared in accordance with Indian GAAP.
In addition, the term “Indebtedness” with respect to any specified Person includes, to the extent nototherwise included, any Indebtedness of others guaranteed by such specified Person.
“Person” means an individual, partnership, corporation, limited liability company, business trust, jointstock company, trust, unincorporated association, joint venture or any nation or government, any state,province or other political subdivision thereof, any central bank (or similar monetary or regulatory authority)thereof, and any entity exercising executive, legislative, judicial, regulatory or administrative functions of orpertaining to government.
Upon the occurrence and continuation of an event of default described in the fifth or sixth bullet pointabove, the principal of and accrued and unpaid interest on all the notes will become immediately due andpayable without any declaration or other act on the part of the trustee or any noteholders. Upon the occurrenceand continuation of any other events of default, the trustee shall, if so requested in writing by the holders ofnot less than 33 1/3% in aggregate principal amount of the outstanding notes, give notice in writing to us thatthe principal amount of and accrued and unpaid interest on each note is, and shall thereupon immediatelybecome, due and payable.
In the context of an Event of Default, “continuing” means that where the underlying circumstanceswhich caused that Event of Default are incapable of remedy when viewed objectively, that Event of Defaultis continuing, unless and until it has been expressly waived in writing by the trustee and any conditions of suchwaiver have all been fulfilled to the satisfaction of the trustee; or that in any other case, that Event of Defaultis continuing unless and until either: it has been expressly waived in writing by the trustee and any conditionsof such waiver have all been fulfilled to the satisfaction of the trustee; or the underlying circumstances whichcaused that Event of Default have been remedied to the satisfaction of the trustee and the resulting positionis what it would have been if such Event of Default had not occurred (so that, for example, in the case of thelate delivery of a document which is subsequently satisfactorily delivered, or the withdrawal or settlement ofa claim the existence or pursuance of which constituted an Event of Default, that Event of Default is notcontinuing once the underlying circumstances no longer apply).
In addition, if an event of default occurs or if we breach any covenant or warranty under the indentureor the notes, the trustee may pursue any available remedy to enforce any provision of the notes or theindenture.
202

The holders of a majority in aggregate principal amount of the outstanding notes may rescind adeclaration of acceleration if an amount has been paid to or deposited with the trustee sufficient to pay theamounts set forth in the applicable provisions of the indenture and all events of default, other than the failureto pay principal or interest due have been cured or waived.
The holders of a majority in aggregate principal amount of the outstanding notes will have the right todirect the time, method and place of conducting any proceeding for any remedy available to the trustee orexercising any trust or power conferred on the trustee, subject to the limitations specified in the indenture.Subject to the provisions of the indenture relating to the trustee’s duties, the trustee will be under no obligationto exercise any of its rights and powers under the indenture unless it has been offered an indemnity and/orsecurity to its satisfaction against the costs, expenses and liabilities it may properly incur.
No noteholder will have any right to institute any proceeding with respect to the indenture or the notesor for any remedy thereunder unless the noteholder has previously given written notice to the trustee of acontinuing event of default under the notes or the continuing breach of a covenant contained in the indenture,the holders of not less than 33 1/3% in aggregate principal amount of the outstanding notes have made awritten request to the trustee to institute proceedings in respect of the event of default or breach in its ownname as trustee, the holders of the notes have offered to the trustee indemnity and/or security satisfactory toit, the trustee for 60 days thereafter has failed to institute any such proceeding and no direction inconsistentwith that request has been given to the trustee during that 60-day period by the holders of a majority inaggregate principal amount of the outstanding notes. However, the right of any noteholder to institute a suitfor the enforcement of the payment of principal or interest on the due date therefor may not be impairedwithout its consent.
The holders of a majority in aggregate principal amount of the outstanding notes may waive any pastdefault under the indenture except an uncured default in the payment of principal of or interest on the notesor an uncured default relating to a covenant or provision of the indenture that cannot be modified or amendedwithout the consent of each affected noteholder.
Further Issues
We shall be entitled to issue additional notes under the indenture which shall have identical terms as thenotes, other than with respect to the date of issuance, issue price and the amount of the first interest paymentand for the interest paid on the notes prior to the issuance of the additional notes. We may consolidate suchadditional notes with the outstanding notes to form a single series; provided that such additional notes and theoutstanding notes are fungible for US federal income tax purposes. Any further notes forming a single serieswith the outstanding notes shall be treated as a single class for all purposes under the indenture, includingwithout limitation, waiver, amendments, redemptions and offers to purchase.
Modification of the Indenture
We and the trustee may, without the consent of the holders of the notes, modify the indenture for certainspecific purposes, including, among other things, curing ambiguities, defects or inconsistencies or includingany other provisions with respect to matters or questions arising under the indenture, so long as that correctionor added provision will not adversely affect the interests of the noteholders in any material respect. In addition,we and the trustee may modify and amend the indenture with the consent of the holders of a majority inaggregate principal amount then outstanding of the notes thereunder. However, no modification or amendmentmay, without the consent of the noteholders of each outstanding note affected thereby:
• change the maturity of any payment of principal of or any installment of interest on the notes;
• reduce the principal amount or the rate of interest, or change the method of computing the amountof principal or interest payable on any date, with respect to the notes;
• change the coin or currency in which the principal of or interest on the notes are payable;
• impair the right of the holders of notes to institute suit for the enforcement of any payment on orafter the date due;
• reduce the percentage in principal amount of the outstanding notes, the consent of whose holdersis required for any modification of or waiver of compliance with any provision of the indenture ordefaults under the indenture and their consequences; or
• modify the provisions summarized in this paragraph or the provisions of the indenture regardingwaivers of past defaults.
203

After an amendment described in the preceding paragraph, we are required to mail through the trustee,to the holders of the notes a notice briefly describing the amendment. However, the failure to give that noticeto all the holders of the notes, or any defect in the notice, will not affect the validity of the amendment.
A meeting of the holders of the notes may be called by the trustee at any time. We or the holders of atleast 10% in aggregate principal amount of the outstanding notes may call a meeting if we or they haverequested the trustee in writing to call such a meeting and the trustee has not given notice of such a meetingwithin 20 days of receiving the request. Notices of meetings must include the time and place of the meetingand a general description of the action proposed to be taken at the meeting and must be given not less than30 days nor more than 60 days before the date of the meeting, except that notices of meetings reconvened afteradjournment must be given not less than 10 days nor more than 60 days before the date of the meeting. At anymeeting, the presence of holders holding notes in an aggregate principal amount sufficient to take the actionfor which the meeting was called will constitute a quorum. Any modifications to or waivers of the indentureor the notes of will be conclusive and binding on all holders of notes, whether or not they have given theirconsent (unless required under the indenture) or were present at any duly held meeting.
Notes owned by us or our affiliates will not be considered outstanding for the purpose of determiningwhether the requisite aggregate principal amount of notes has concurred in any request, demand, notice,consent or waiver under the indenture.
It is not necessary for the noteholders to approve the particular form of any proposed modification ofthe indenture, but it is sufficient if that consent approves the substance of the proposed modification.
Legal Defeasance and Covenant Defeasance
We may, at our option at any time, defease our obligations with respect to the notes by “legal defeasance”or “covenant defeasance”. In general, upon legal defeasance, we will be deemed to have paid and dischargedall our indebtedness under the notes and to have satisfied all of our obligations under the notes and theindenture except that the following will survive: (1) our obligations relating to the transfer and exchange ofnotes, maintenance of a paying agent and a note registrar and certain other matters specified in the indentureand (2) the rights, powers, trusts, duties and immunities of the trustee.
In addition, through covenant defeasance, we may defease our obligations under the covenants describedabove under the caption “—Certain Covenants”, other than the covenants described under “—Performance ofObligations Under the Notes and the Indenture”, “—Maintenance of Office or Agency”, “—Appointment toFill a Vacancy in the Office of the Trustee”, “—Maintenance of Existence and Conduct of Business” and“—Use of Proceeds” and certain covenants relating to the deposit of amounts to pay principal and interest onthe notes, actions with respect to paying agents, the return of unclaimed monies and other matters. Followingcovenant defeasance, we may omit to comply with any defeased covenant.
In order to exercise either legal defeasance or covenant defeasance, we must satisfy the followingconditions:
• we must irrevocably deposit with the trustee, cash in US dollars, US government obligations or acombination thereof, in amounts sufficient, in the opinion of an internationally recognized firm ofindependent public accountants, to pay and discharge the principal of and each installment ofinterest on the notes in accordance with the terms of the indenture and the notes;
• we must deliver to the trustee an opinion of tax counsel of recognized standing with respect to USfederal income tax matters to the effect that the beneficial owners of the notes will not recognizeincome, gain or loss for US federal income tax purposes as a result of that deposit and defeasanceand will be subject to US federal income tax on the same amount, in the same manner and at thesame time as would have been the case if that deposit and defeasance had not occurred (whichopinion must be based on a change in US federal income tax law occurring after the date hereofin the case of legal defeasance);
• no event of default has occurred and is continuing on the date of the deposit and, with respect tothe bankruptcy, insolvency and other events described in the fifth and sixth bullet points under“—Events of Default”, at any time during the period ending on the 123rd day after the date of thatdeposit or, if longer, ending on the day after the longest applicable preference period relating tothat deposit expires;
204

• we must deliver to the trustee an opinion of tax counsel of recognized standing to the effect thatpayment of amounts deposited in trust with the trustee will not be subject to future taxes or othergovernmental charges imposed by any Taxing Jurisdiction, except to the extent that additionalamounts in respect thereof have been deposited in trust with the trustee;
• such defeasance will not result in the trust arising from that deposit constituting an investmentcompany as defined under the US Investment Company Act of 1940, as amended; and
• we have delivered to the trustee an officer’s certificate and an opinion of counsel stating that allthe conditions to defeasance have been complied with.
Satisfaction and Discharge
The notes will be deemed to be paid for all purposes under the indenture, and our indebtedness underthe notes will be deemed to have been satisfied and discharged if the following conditions are met, amongothers:
• either we have given a notice of redemption and all other conditions to redemption have been metor the notes have otherwise become due and payable or will become due and payable within oneyear;
• we have irrevocably deposited money in trust with the trustee that will be sufficient to pay whendue all the principal of and interest on the notes to maturity or redemption together withirrevocable instructions from us directing the trustee to apply such funds to the payment thereofat maturity or redemption, as the case may be; and
• no event of default has occurred and is continuing on the date of the deposit, and the deposit willnot breach any other instrument to which we are a party or by which we are bound.
The indenture will cease to be of further effect when:
• either (1) all the notes issued under the indenture have been delivered to the trustee for cancellation(other than destroyed, lost or stolen notes that have been replaced or paid in accordance with theindenture, notes that are deemed to have been paid as described in the preceding paragraph andnotes for whose payment money has been deposited in trust or held in trust by us and has thereafterbeen returned to us) or (2) all notes issued under the indenture that have not been delivered to thetrustee for cancellation have been deemed to have been paid as described in the precedingparagraph;
• all other amounts due and payable under the indenture have been paid; and
• we have delivered to the trustee a certificate and an opinion of counsel of recognized standingstating that the conditions to satisfaction and discharge of the indenture have been complied with.
Notwithstanding the satisfaction and discharge of the notes and/or the indenture, our obligations underspecified provisions of the indenture relating to the transfer and exchange of notes, payment of additionalamounts, maintenance of a paying agent and a note registrar and certain other matters specified in theindenture will survive.
Replacement of Notes
If any note becomes mutilated, destroyed, lost or stolen, we will execute and, upon our request, thetrustee will authenticate and deliver a new note of like tenor, interest rate and principal amount in exchangeand substitution for that note, so long as the noteholder delivers to us, the note registrar and the trusteesatisfactory evidence of its ownership and of the destruction, loss or theft of the note and provides suchsecurity or indemnity as they may require to hold them harmless. However, if a mutilated, destroyed, lost orstolen note has become or is about to become due and payable, we may pay the outstanding amounts due underthe note instead of issuing a new note. Mutilated or defaced notes must be surrendered before replacementswill be issued. We may require that the noteholder pay any taxes or other expenses in connection with thereplacement of the note.
205

The Trustee
The Bank of New York Mellon is the trustee under the indenture. The address of the trustee is The Bankof New York Mellon, 101 Barclay Street, New York, New York 10286, Attention: Corporate TrustAdministration.
The indenture contains provisions for the indemnification of the trustee and for its relief fromresponsibility. The obligations of the trustee to any noteholder are subject to the immunities and rights set forthin the indenture.
We and our affiliates may from time to time enter into normal banking and trustee relationships with thetrustee and its affiliates in the ordinary course of business.
The trustee and its affiliates may hold notes in their own names.
Paying Agents; Transfer Agents; Registrar
We have initially appointed The Bank of New York Mellon as paying agent and note registrar. We mayat any time appoint other paying agents, transfer agents and note registrars.
If the global notes are exchanged for notes in certificated form, unless we obtain an exemption from theSingapore Exchange, we shall (so long as the notes are listed on the Singapore Exchange and the rules of thatexchange so require) (a) appoint a registrar and paying agent in Singapore where the notes may be presentedfor registration, for payment or redemption and (b) promptly make an announcement to the SingaporeExchange and include in such announcement all material information in relation to such exchange and thedetails of the Singapore paying agent.
Notices
Whenever the indenture requires notice to the holders of the notes, such notice will be given by thetrustee by (unless the indenture specifies otherwise):
• first class mail, postage prepaid, to the address of each noteholder as it appears in the note register;
• publication in English on a business day in a leading newspaper having general circulation in theBorough of Manhattan, The City of New York; and
• so long as the notes are listed on the Singapore Exchange and the rules of that exchange so require,publication in English in a leading newspaper of general circulation in Singapore (which isexpected to be the Straits Times) or, if that is not practicable, in another English-language dailynewspaper of general circulation in Singapore.
Notice will be deemed to have been validly given on the date of mailing or first publication in all therequired newspapers, as the case may be. If the publication as provided above is not practicable, notice willbe given in such other manner, and shall be deemed to have been given on such date, as the trustee mayapprove.
Governing Law
The indenture, and the notes are governed by the laws of the State of New York.
Jurisdiction
We have consented to the non-exclusive jurisdiction of any court of the State of New York or any USfederal court sitting in the Borough of Manhattan, The City of New York, and any appellate court from anyof those courts. Service of process in any such action or proceeding may be served upon us at our New Yorkrepresentative office located at ICICI Bank Limited, New York Representative Office, 500 Fifth Avenue, Suite2830, New York, New York 10110. The notes and the indenture provide that if we no longer maintain an officein New York City, then we will appoint a new process agent in New York City.
206

Currency Rate Indemnity
US dollars is the sole currency of account of the notes and payment for all sums payable by us underthe notes, including damages. Any amount received or recovered in a currency other than US dollars (whetheras a result of, or of the enforcement of, a judgment or order of a court of any jurisdiction, in our winding-upor dissolution or otherwise) by a noteholder with respect to any amount due to it under the notes will constitutea discharge to us only to the extent of the amount in US dollars that the noteholder is able to purchase withthe amount it receives or recovers (or if it is not practicable to make a purchase of US dollars on that date,on the first date on which it is practicable to do so). If the amount in US dollars is less than the amountexpressed to be due to the noteholder, we will indemnify the noteholder against any loss sustained as a result.In any event, we will indemnify the noteholder against the cost of any such purchase.
For the purposes of the preceding paragraph, it will be sufficient for the noteholder to certify in asatisfactory manner (indicating sources of information used) that it would have suffered a loss had it made anactual purchase of US dollars with the amount it received or recovered in the other currency on the date itreceived or recovered that amount (or, if a purchase of US dollars on that date had not been practicable, onthe first date on which it would have been practicable, so long as the noteholder certifies the need for thechange of date).
These indemnities are a separate and independent obligation from our other obligations, will give riseto a separate and independent cause of action, will apply regardless of any waiver or extension granted by thenoteholder and will continue in full force and effect in spite of any other judgment or order or the filing ofany proof of claim in the winding-up of our company for a liquidated sum.
207

FORM, DENOMINATION AND TRANSFER
Book-Entry; Delivery and Form
The notes will be issued in registered form without interest coupons. No notes will be issued in bearerform.
Notes of each tranche offered and sold to qualified institutional buyers in reliance on Rule 144A underthe Securities Act, or “restricted notes”, will be issued in minimum denominations of US$100,000 and integralmultiples of US$1,000 in excess thereof. The restricted notes of each tranche will initially be represented byone or more permanent global notes for such tranche in definitive, fully registered book-entry form that willbe registered in the name of DTC or its nominee and deposited with the trustee, as custodian for DTC, forcredit to the accounts of direct or indirect participants in DTC as described below. We refer to these globalnotes collectively as the “Restricted Global Notes”.
Notes of each tranche offered and sold in reliance on Regulation S, or “Regulation S Notes”, will beissued in minimum denominations of US$100,000 and integral multiples of US$1,000 in excess thereof. TheRegulation S Notes of each tranche will initially be represented by a single permanent global note for suchtranche in definitive, fully registered book-entry form that will be registered in the name of DTC or itsnominee and deposited with the trustee, as custodian for DTC, for credit to the accounts of direct or indirectparticipants in DTC as described below. We refer to these global notes as the “Regulation S Global Notes” andto the Restricted Global Notes and the Regulation S Global Notes collectively as the “global notes”.
Through and including the 40th day after the later of the commencement of this offering and the closingof this offering (such period through and including such 40th day, the “distribution compliance period”),beneficial interests in the Regulation S Global Notes may be held only through Euroclear and Clearstream,Luxembourg (as indirect participants in DTC), unless transferred to a person that takes delivery through a Rule144A Global Note in accordance with the certification requirements described below. Beneficial interests inthe Rule 144A Global Notes may not be exchanged for beneficial interests in the Regulation S Global Notesat any time except in the limited circumstances described below. See “—Exchanges and Transfers BetweenRegulation S Notes and Restricted Global Notes and Other Notes”.
Owners of beneficial interests in a global note will be entitled to receive physical delivery of certificatednotes only in the circumstances described under “—Exchange of Book-Entry Notes for Certificated Notes”below.
Transfer of Notes
Each note will be subject to certain restrictions on transfer set forth therein as described under“—Exchanges and Transfers Between Regulation S Notes and Restricted Global Notes and Other Notes” and“Transfer Restrictions”. In addition, transfers of beneficial interests in the global notes will be subject to theapplicable rules and procedures of DTC, Euroclear and Clearstream, Luxembourg, as the case may be, whichmay change at any time.
If we issue notes of any tranche in certificated form, those notes may be transferred or exchanged inwhole or in part only in authorized denominations upon surrender of the note to be transferred or exchanged,together with a duly executed instrument of transfer or exchange in form satisfactory to us and the trustee, asnote registrar, or any transfer agent, at the specified office of the note registrar or of any transfer agent. Solong as any tranche of notes are listed on the Singapore Exchange and the rules of that exchange so require,we will maintain a transfer agent in Singapore. Each time that we transfer or exchange a note of any tranchefor a note in certificated form, and after the note registrar or transfer agent receives the instrument of transferor exchange and all other required documents, we will make available for delivery the new certificated noteof such tranche at the office of the note registrar or the applicable transfer agent. Alternatively, at the optionof the person requesting the transfer or exchange, we will mail, at that person’s risk, the new certificated noteof such tranche to the address of the person specified in the instrument of transfer.
No service charge will be required for any registration of transfer or exchange of the notes, but the noteregistrar may require payment of a sum sufficient to cover any tax or other governmental charge in connectiontherewith, other than any such tax or governmental charge payable in connection with an exchange describedin the first paragraph under “—Exchange of Book-Entry Notes for Certificated Notes” not involving anytransfer.
208

Depository Procedures
The description of the clearing systems in this section reflects our understanding of the rules andprocedures of DTC, Euroclear and Clearstream, Luxembourg as they are currently in effect. DTC, Euroclearand Clearstream, Luxembourg and their participants perform these clearance and settlement functions underagreements they have made with one another or with their customers. You should be aware that they are notobligated to you to perform or continue to perform these procedures and may modify them or discontinue themat any time.
The Depository Trust Company
Book-entry interests in the Restricted Global Notes will be shown on, and transfers of these interests willbe made only through, records maintained by DTC and its participants. DTC has provided us with thefollowing information: DTC is a limited-purpose trust company organized under the New York Banking Law,a “banking organization” within the meaning of the New York Uniform Commercial Code and a “clearingagency” registered under the provisions of Section 17A of the Exchange Act. DTC holds securities that itsdirect participants deposit with DTC. DTC also records the settlements among direct participants of securitiestransactions, such as transfers and pledges, in deposited securities through computerized records for directparticipants’ accounts. This eliminates the need to exchange certificated securities. Direct participants includesecurities brokers and dealers, banks, trust companies, clearing corporations and certain other organizations.
DTC’s book-entry system is also used by other organizations such as securities brokers and dealers,banks and trust companies that work through a direct participant. The rules that apply to DTC and itsparticipants are on file with the SEC.
DTC is owned by a number of its direct participants and by The New York Stock Exchange, Inc., theAmerican Stock Exchange, LLC. and the Financial Industry Regulatory Authority, Inc.
DTC will keep a computerized record of its participants whose clients have purchased interests in theRestricted Global Note of any tranche. Each participant will then keep a record of its clients. Unless theRestricted Global Note of such tranche is exchanged in whole or in part for a certified note or notes or for aninterest in the Regulation S Global Note of such tranche, such Restricted Global Note may not be transferred.DTC, its nominees and their successors may, however, transfer such Restricted Global Note in whole to oneanother.
When you purchase interests in the Restricted Global Notes of a tranche through the DTC system, thepurchases must be made by or through a direct participant, which will receive for the interests on DTC’srecords. When you purchase interests in the notes of such tranche, you will become their beneficial owner.Your ownership interest will be recorded only on the direct or indirect participants’ records. DTC will haveno knowledge of your individual ownership of interest. DTC’s records will show only the identity of the directparticipants and the amount of the notes held by or through them. You will not receive a written confirmationof your purchase or sale or any periodic account statement directly from DTC. You should instead receivethese from your direct or indirect participant. As a result, the direct or indirect participants are responsible forkeeping accurate account of the holdings of their customers. The trustee will wire payments of principal andinterest on the notes to DTC or its nominee. We and the trustee will treat DTC or its nominee as the ownerof the Restricted Global Notes representing the restricted notes of a tranche for all purposes. Accordingly, we,the trustee and the applicable paying agent will have no direct responsibility or liability to pay amounts dueon the Restricted Global Notes representing the notes to you or any other beneficial owners in the RestrictedGlobal Notes. Any redemption notices will be sent by us or the trustee to DTC, which will, in turn, informthe direct participants (or the indirect participants), which will then contact you as a beneficial holder.
It is DTC’s current practice, upon receipt of any payment of principal or interest, to proportionatelycredit direct participants’ accounts on the payment date based on their holdings. In addition, it is DTC’s currentpractice to pass through any consenting or voting rights to such participants by using an omnibus proxy. Thoseparticipants will, in turn, make payments to and solicit votes from you, the ultimate beneficial owner of thenotes, based on their customary practices. Payments to you will be the responsibility of the participants andnot of DTC, the trustee or our company.
Euroclear and Clearstream, Luxembourg
Euroclear and Clearstream, Luxembourg will record the ownership interests of their participants in muchthe same way as DTC.
209

Clearstream, Luxembourg advises that it is incorporated under the laws of Luxembourg as a bank.Clearstream, Luxembourg will facilitate the clearance and settlement of securities transactions between itscustomers through electronic book-entry transfers between their accounts. Clearstream, Luxembourg willprovide to its customers, among other things, services for safekeeping, administration, clearance andsettlement of internationally traded securities and securities lending and borrowing. Clearstream, Luxembourgwill interface with domestic securities markets in over 30 countries through established depository andcustodial relationships. As a bank, Clearstream, Luxembourg is subject to regulation by the LuxembourgCommission for the Supervision of the Financial Sector, also known as the Commission de Surveillance duSecteur Financier and the Luxembourg Central Bank. Customers of Clearstream, Luxembourg are recognizedfinancial institutions around the world, including underwriters, securities brokers and dealers, banks, trustcompanies, clearing corporations and certain other organizations. US customers of Clearstream, Luxembourgare limited to securities brokers and dealers and banks. Indirect access to Clearstream, Luxembourg is alsoavailable to other institutions such as banks, brokers, dealers and trust companies that clear through ormaintain a custodial relationship with a Clearstream, Luxembourg customer.
Euroclear advises that it was created in 1968 and that it will clear and settle transactions betweenEuroclear participants through simultaneous electronic book-entry delivery against payment, therebyeliminating the need for physical movement of certificates and any risk from lack of simultaneous transfersof securities and cash. Euroclear will provide various other services, including securities lending andborrowing and interfacing with domestic markets in several countries. Euroclear is operated by EuroclearBank S.A./N.V., which we refer to as the “Euroclear Operator”, under contract with Euroclear ClearanceSystems, S.C., a Belgian cooperative corporation, which we refer to as the “Cooperative”. All operations areconducted by the Euroclear Operator, and all Euroclear securities clearance accounts and Euroclear cashaccounts are accounts with the Euroclear Operator, not the Cooperative. The Cooperative establishes policyfor Euroclear on behalf of Euroclear participants. Euroclear participants include banks, including centralbanks, securities brokers and dealers and other professional financial intermediaries and may include theInitial Purchasers. Indirect access to Euroclear is also available to other firms that clear through or maintaina custodial relationship with a Euroclear participant, either directly or indirectly.
We have no responsibility for any aspect of the actions or the records kept by DTC, Euroclear orClearstream, Luxembourg, or any of their direct or indirect participants. We also do not supervise thesesystems in any way and urge investors to contact the system of their participants directly to discuss thesematters.
Holding of the Notes through DTC, Euroclear and Clearstream, Luxembourg
Investors in the Restricted Global Note of a tranche may hold their interests therein directly throughDTC, if they are direct participants in such system, or through direct or indirect participants in such system.Investors in the Regulation S Global Note of a tranche will hold their interests therein through Euroclear orClearstream, Luxembourg if they are accountholders in such systems, or indirectly through organizations thatare accountholders in such systems. All interests in a global note may be subject to the procedures andrequirements of DTC, Euroclear or Clearstream.
The laws of some states require that certain persons take physical delivery in definitive form of securitiesthat they own. Consequently, the ability to transfer beneficial interests in a global note to such persons maybe limited to that extent. Because DTC can act only on behalf of the participants, which in turn act on behalfof the indirect participants and certain banks, the ability of a person having beneficial interests in theRestricted Global Notes to pledge those interests to persons or entities that do not participate in the DTCsystem, or otherwise take actions in respect of those interests, may be affected by the lack of a physicalcertificate evidencing those interests.
Transfers between participants in DTC will be effected in the ordinary way in accordance with DTCrules and will be settled in same-day funds. Transfers between participants in Euroclear and Clearstream,Luxembourg will be effected in the ordinary way in accordance with their respective rules and operatingprocedures.
On or after the date of original issuance of the notes, transfers of notes between accountholders inEuroclear and Clearstream, Luxembourg and transfers of notes between participants in DTC will generallyhave a settlement day three business days after the trade date (T+3). The customary arrangements for deliveryversus payment will apply to such transfers.
210

Cross-market transfers between accountholders in Euroclear or Clearstream, Luxembourg and DTCparticipants will be effected in accordance with their respective rules and will need to have an agreedsettlement date between the parties to such transfer. Because there is no direct link between DTC, on the onehand, and Euroclear and Clearstream, Luxembourg, on the other, transfers of interests in the relevant globalnote will be effected through the paying agent, the custodian and the note registrar receiving instructions (and,where appropriate, certification) from the transferor and arranging for delivery of the interest being transferredto the credit of the designated account for the transferee. Transfers will be effected on the later of (i) threebusiness days after the trade date for the disposal if the interest in the relevant global note resulting in suchtransfer and (ii) two business days after receipt by the paying agent or the note registrar, as the case may be,of the necessary certification or information to effect such transfer. In the case of cross-market transfers,settlement between Euroclear and Clearstream, Luxembourg accountholders and DTC participants cannot bemade on delivery versus payment basis. The notes will be delivered on a free delivery basis and arrangementsfor payment must be made separately.
We expect that DTC, Euroclear and Clearstream, Luxembourg will take any action permitted to be takenby a holder of notes (including the presentation of notes for exchange) only at the direction of the participantsto whose accounts interest in the applicable global notes are credited and only in respect of the aggregateprincipal amount of notes as to which such participant has given such direction. However, if any of the eventsdescribed in the first two paragraphs of “Exchange of Book-Entry Notes for Certificated Notes” occurs, DTC,Euroclear and Clearstream, Luxembourg reserve the right to exchange the applicable global note for definitivenotes in certificated form and to distribute those notes to participants with the legends set forth under “TransferRestrictions”.
The information in this section concerning DTC, Euroclear and Clearstream, Luxembourg and their bookentry systems has been obtained from sources that we believe to be reliable, but we take no responsibility forthe accuracy thereof.
Exchange of Book-Entry Notes for Certificated Notes
The Restricted Global Note of any tranche is exchangeable for definitive notes of such tranche inregistered certificated form if:
• we advise the trustee in writing that (1) DTC is unwilling or unable to continue as depository forthe global notes of such tranche or (2) DTC has ceased to be a clearing agency registered underthe Exchange Act and, in either case, we are unable to appoint a qualified successor within 90 daysafter notice from DTC or, if applicable, after we become aware that DTC has ceased to be aregistered clearing agency,
• we, at our option, elect to cause the issuance of the notes of such tranche in certificated form, or
• after the occurrence and during the continuation of a default or an event of default with respect tothe notes of such tranche, DTC or beneficial owners holding interests representing an aggregateprincipal amount of more than 50% of the notes of such tranche represented by the RestrictedGlobal Note so advise the trustee in writing.
The Regulation S Global Note of any tranche is exchangeable for definitive notes of such tranche inregistered certificated form if:
• we advise the trustee in writing that Euroclear or Clearstream, Luxembourg is closed for businessfor a continuous period of 14 days (other than by reason of legal holidays) or has announced anintention permanently to cease business, or
• after the occurrence and during the continuation of a default or an event of default with respect tosuch tranche of notes, Euroclear or Clearstream, Luxembourg or beneficial owners holdinginterests representing an aggregate principal amount of notes of such tranche of more than 50% ofthe notes represented by the Regulation S Global Note so advise the trustee in writing; provided,that in no event shall the Regulation S Global Note of such tranche be exchanged for notes of suchtranche in definitive form prior to the expiration of the distribution compliance period.
After the expiration of the distribution compliance period, any noteholder may exchange its beneficialinterests in global notes of any tranche in whole or in part for certificated notes of such tranche of likeprincipal amount in authorized denominations registered in the name of that noteholder, or may transferbeneficial interests in global notes of such tranche to a person that wishes to take delivery thereof in the form
211

of certificated notes of such tranche registered in the name of that person. In order to effect such an exchangeor transfer for certificated notes of any tranche, a noteholder must cause prior written notice to be sent to thetrustee by or on behalf of DTC, Euroclear and Clearstream, Luxembourg and, if any global note of suchtranche is being exchanged or transferred in whole, must cause such global note to be surrendered to the officeor agency, we must maintain for that purpose in accordance with the indenture.
In all the above cases, certificated notes delivered in exchange for any global note or beneficial intereststherein will be registered in the names, and issued in any approved denominations, requested by or on behalfof DTC, Euroclear, Clearstream, Luxembourg (in accordance with their customary procedures) and will bear,in the case of the Restricted Global Note, the restrictive legend described in “Transfer Restrictions” unless wedetermine otherwise in compliance with applicable law.
Exchanges and Transfers Between Regulation S Notes and Restricted Global Notes and Other Notes
Prior to the expiration of the distribution compliance period, a beneficial interest in the Regulation SGlobal Note of any tranche may be transferred to a person who takes delivery in the form of an interest in thecorresponding Restricted Global Note only upon receipt by the note registrar of a written certification fromthe transferor to the effect that such transfer is being made (1)(a) to a person whom the transferor reasonablybelieves is a qualified institutional buyer in a transaction meeting the requirements of Rule 144A, (b) inaccordance with Rule 144 under the Securities Act (if available) or (c) pursuant to another exemption fromthe registration requirements under the Securities Act, accompanied by an opinion of counsel regarding theavailability of such exemption, and (2) in accordance with all applicable securities laws of the states of theUnited States or other jurisdictions. We refer to such a certificate as a “restricted notes certificate”.
Beneficial interests in the Restricted Global Note of any tranche may be transferred to a person whotakes delivery in the form of an interest in the relevant Regulation S Global Note, whether before or after theexpiration of the distribution compliance period, only if the transferor first delivers to the note registrar awritten certificate to the effect that (1) such transfer is being made in accordance with Rule 903 or 904 ofRegulation S or Rule 144 under the Securities Act (if available), (2) such transfer is being made in accordancewith all applicable securities laws of the states of the United States and other jurisdictions and (3) if suchtransfer occurs prior to the expiration of the distribution compliance period, the interest transferred will beheld immediately thereafter through Euroclear or Clearstream, Luxembourg. We refer to such a certificate asa “Regulation S certificate”.
Any beneficial interest in one of the global notes that is transferred to a person who takes delivery inthe form of an interest in another global note will, upon transfer, cease to be an interest in that global note andbecome an interest in the other global note and, accordingly, will thereafter be subject to all transferrestrictions and other procedures applicable to beneficial interests in that other global note.
In addition, restricted notes that are held in certificated form may be transferred to a person who takesdelivery in the form of an interest in the Restricted Global Note of any tranche only if the transferor firstdelivers to the note registrar a restricted notes certificate. Restricted notes that are held in certificated formmay be transferred to a person who takes delivery in the form of an interest in the Regulation S Global Noteof any tranche only if the transferor first delivers to the note registrar a Regulation S certificate.
A note may be transferred to a person who takes delivery in the form of an interest in a restricted notein certificated form only if the transferor first delivers to the note registrar a restricted notes certificate.
In connection with a transfer of beneficial interests in one global note for beneficial interests in anotherglobal note, of notes in certificated form for beneficial interests in a global note or of beneficial interests ina global note for notes in certificated form, DTC, Euroclear or Clearstream, Luxembourg or the note registrarmay require that the transferor deliver a written order in accordance with the applicable rules and proceduresof DTC, Euroclear or Clearstream, Luxembourg containing information regarding the participant’s account tobe credited with a beneficial interest in the applicable global note and/or the participant’s account to be debitedin an amount equal to the beneficial interest in the global note being transferred, as the case may be.
Upon the transfer, exchange or replacement of certificated notes bearing a restrictive legend describedin “Transfer Restrictions,” or upon specific request for removal of the legend on a certificated note, we willdeliver only notes that bear that legend, or will refuse to remove that legend, as the case may be, unless (1)such notes are otherwise sold under an effective registration statement under the Securities Act, (2) those notesare issued upon transfer or exchange of Regulation S Notes after the expiration of the distribution complianceperiod, or (3) there is delivered to us such satisfactory evidence as we may reasonably require, which mayinclude an opinion of counsel, that neither the legend nor the restrictions on transfer set forth therein arerequired to ensure compliance with the provisions of the Securities Act.
212

TAXATION
The information provided below does not purport to be a comprehensive description of all taxconsiderations that may be relevant to a decision to purchase notes. In particular, the information does notconsider any specific facts or circumstances that may apply to a particular purchaser. Neither these statementsnor any other statements in this offering memorandum are to be regarded as advice on the tax position of anyholder of notes or of any person acquiring, selling or otherwise dealing in securities or on any tax implicationsarising from the acquisition, sale or other dealings in notes. The statements do not purport to be acomprehensive description of all the tax considerations that may be relevant to a decision to purchase, ownor dispose of notes and do not purport to deal with the tax consequences applicable to all categories ofinvestors, some of which (such as dealers in notes) may be subject to special rules.
Prospective purchasers of notes are advised to consult their own tax advisors as to the taxconsequences of the purchase, ownership and disposition of notes, including the effect of any state orlocal taxes, under the tax laws of India, Hong Kong and each country of which they are residents orcountries of purchase, holding or disposition of notes. Additionally, in view of the number of differentjurisdictions where local laws may apply, this offering memorandum does not discuss the local taxconsequences to a potential holder, purchaser or seller arising from the acquisitions, holding ordisposition of the notes. Prospective investors must, therefore, inform themselves as to any tax, exchangecontrol legislation or other laws and regulations in force relating to the subscription, holding ordisposition of the notes at their place of residence and in the countries of which they are citizens orcountries of purchase, holding or disposition of notes.
Hong Kong Taxation
Withholding tax
No withholding tax in Hong Kong is payable on payments of principal and interest in respect of thenotes.
Profits tax
Hong Kong profits tax is charged on every person carrying on a trade, profession or business in HongKong in respect of assessable profits arising in or derived from Hong Kong from such trade, profession orbusiness.
Under the Inland Revenue Ordinance (Chapter 112 of the Laws of Hong Kong) (the “Inland RevenueOrdinance”) as it is currently applied, Hong Kong profits tax may be charged on revenue profits arising onthe sale, disposal or redemption of the notes where such sale, disposal or redemption is or forms part of a trade,profession or business carried on in Hong Kong.
Interest on the notes will be subject to Hong Kong profits tax where such interest has a Hong Kongsource, and is received by or accrues to:
(i) a financial institution (as defined in the Inland Revenue Ordinance) and arises through or from thecarrying on by the financial institution of its business in Hong Kong, notwithstanding that themoneys in respect of which such interest is received or accrues are made available outside HongKong; or
(ii) a corporation carrying on a trade, profession or business in Hong Kong; or
(iii) a person, other than a corporation, carrying on a trade, profession or business in Hong Kong andsuch interest is in respect of the funds of the trade, profession or business.
Stamp duty
No stamp duty is chargeable in Hong Kong for the issue, sale or transfer of a note.
213

Indian Taxation
The following is a summary of the principal Indian tax consequences to non-resident investors of India,or Non-resident Investors, of purchasing notes issued by us through our Hong Kong branch. This summarydiscusses the Indian tax consequences of payments on the notes being made through Hong Kong and India.However, it is anticipated that all payments will be made through the Hong Kong branch. The summary isbased on Indian taxation law and practice in force at the date of this offering memorandum and is subject tochange, possibly with retroactive effect. The summary does not constitute legal or tax advice and is notintended to represent a complete analysis of the tax consequences under Indian law of the acquisition,ownership or disposition of notes. Prospective investors should, therefore, consult their own tax advisorsregarding the Indian tax consequences, as well as the tax consequences under any other applicable taxingjurisdiction, of acquiring, owning and disposing of notes.
Hong Kong Branch making payments
There is currently no requirement to withhold Indian tax on interest payments made on the notes by ourHong Kong branch, if the amounts raised through these notes are utilized outside India. If the amounts soraised are utilized in India, Indian tax consequences would be applicable as detailed under the paragraphs“Withholding taxes” and “Taxation of interest” which are set out below.
Payments through India
Any payments we make on the notes, including additional amounts, made through India would be subjectto the regulations of the Reserve Bank of India.
Withholding taxes
There may be a requirement to withhold tax at the current rate of 20% (plus applicable surcharge andeducation cess and secondary and higher education cess) on interest payments made on the notes through Indiasubject to and in accordance with the conditions contained in the Income Tax Act, 1961. However, anapplicable Tax Treaty may reduce such withholding tax liability to rates ranging from 10% to 15% (dependingon the Tax Treaty), subject to fulfillment of the conditions prescribed therein.
If we were to make payments of interest on the notes through India, we would be obligated to payadditional amounts in certain circumstances. Please see “Description of the Notes—Additional Amounts”.
Taxation of interest
A Non-resident Investor may be liable to pay income tax at a rate of 20% (plus applicable surcharge andeducation cess and secondary and higher education cess) on interest paid on the notes through India subjectto and in accordance with the conditions contained in the Income Tax Act, 1961. However, an applicable TaxTreaty may reduce such tax liability to rates ranging from 10% to 15% (depending on the Tax Treaty), subjectto fulfillment of the conditions prescribed therein. The rate under the US—India tax treaty is generally 15%.A Non-resident Investor would be obligated to pay such income tax in an amount equal to, or would be entitledto a refund of, as the case may be, any difference between amounts withheld in respect of interest paid on thenotes through India and its ultimate Indian tax liability for such interest, subject to and in accordance with theprovisions of the Income Tax Act, 1961.
Taxation of gains arising on disposition
Any gains arising to a Non-resident Investor from disposition of notes held as a capital asset willgenerally be chargeable to income tax in India if the notes are regarded as property situated in India. ANon-resident Investor generally will not be chargeable to income tax in India from a disposition of notes heldas a capital asset provided the notes are regarded as being situated outside India. There is a possibility that theIndian tax authorities may treat the notes as being located in India as we are incorporated in and resident inIndia. The US—India tax treaty does not impose any limitation on India’s right to tax capital gains.
If the notes are regarded as situated in India, upon disposition of a note:
(i) a Non-resident Investor, who has held the notes for a period of more than 36 months preceding thedate of their dispositions, would be liable to pay capital gains tax at rates ranging from 0% to 20%(plus applicable surcharge, education cess and secondary & higher education cess) subject to andin accordance with the provisions of the Income Tax Act, 1961;
214

(ii) a Non-resident Investor who has held the notes for 36 months or less would be liable to pay capitalgains tax at rates ranging from 0% to 40% (plus applicable surcharge, and education cess andsecondary and higher education cess), depending on the legal status of the Non-resident Investor,and his taxable income in India, subject to any lower rate provided for by an applicable Tax Treaty;and
(iii) any surplus realized by a Non-resident Investor from a disposition of notes held as stock-in-tradewould be subject to income tax in India to the extent, if any, that the surplus are attributable to a“business connection in India” or, where a Tax Treaty applies, to a “permanent establishment” inIndia of the Non-resident Investor. A Non-resident Investor would be liable to pay Indian tax onthe gains which are so attributable at a rate of tax ranging from 0% to 40% (plus applicablesurcharge and education cess and secondary and higher education cess), depending on the legalstatus of the Non-resident Investor and his taxable income in India, subject to any lower rateprovided for by a Tax Treaty.
Non-resident Investors should consult their own tax advisors regarding the Indian tax consequences ofdisposing of notes.
Wealth Tax
No wealth tax is payable at present in relation to the notes in India.
Estate Duty
No estate duty is payable at present in relation to the notes in India.
Gift Tax
No gift tax is payable at present in India.
Stamp Duty
A transfer of notes outside India will not give rise to any Indian stamp duty liability unless brought intoIndia. But in the event that these notes are brought into India for enforcement or for any other purpose, thesame will attract stamp duty as payable in the relevant state. This stamp duty will have to be paid within aperiod of 3 months from the date the notes are first received in India.
Certain US Federal Income Tax Considerations
This disclosure is limited to the US federal tax issues addressed herein. Additional issues may existthat are not addressed in this disclosure and that could affect the US federal tax treatment of the notes.This tax disclosure was written in connection with the promotion or marketing of the notes, and itcannot be used by any holder for the purpose of avoiding penalties that may be asserted against theholder under the Internal Revenue Code of 1986, as amended (the “Code”). Holders should seek theirown advice based on their particular circumstances from their tax advisers.
The following is a description of certain US federal income tax consequences to the US Holdersdescribed below of owning and disposing of notes, but it does not purport to be a comprehensive descriptionof all tax considerations that may be relevant to a particular person’s decision to acquire the notes. Thisdiscussion applies only to initial US Holders that (i) purchase notes in this offering at the “issue price”, whichwill equal the first price to the public (not including bond houses, brokers or similar persons or organizationsacting in the capacity of underwriters, placement agents or wholesalers) at which a substantial amount of thenotes is sold for money and (ii) hold the notes as capital assets for US federal income tax purposes.
This discussion does not describe all of the tax consequences that may be relevant in light of a USHolder’s particular circumstances, including alternative minimum tax consequences and tax consequencesapplicable to US Holders subject to special rules, such as:
• certain financial institutions;
• dealers or traders in securities who use a mark-to-market method of tax accounting;
215

• persons holding notes as part of a hedging transaction, straddle, wash sale, conversion transactionor integrated transaction or persons entering into a constructive sale with respect to the notes;
• persons whose functional currency for US federal income tax purposes is not the US dollar;
• entities classified as partnerships for US federal income tax purposes;
• tax-exempt entities;
• persons that own or are deemed to own ten percent or more of our voting stock; or
• persons holding notes in connection with a trade or business conducted outside of the UnitedStates.
If an entity that is classified as a partnership for US federal income tax purposes holds notes, the USfederal income tax treatment of a partner will generally depend on the status of the partner and the activitiesof the partnership. Partnerships holding notes and partners in such partnerships should consult their taxadvisers as to the particular US federal income tax consequences of holding and disposing of the notes.
This discussion is based on the Code, administrative pronouncements, judicial decisions and Treasuryregulations, all as of the date hereof, any of which is subject to change, possibly with retroactive effect.
As used herein, a “US Holder” is a holder that is a beneficial owner of a note and is, for US federalincome tax purposes:
• a citizen or individual resident of the United States;
• a corporation, or other entity taxable as a corporation, created or organized in or under the lawsof the United States, any state therein or the District of Columbia; or
• an estate or trust the income of which is subject to US federal income taxation regardless of itssource.
Payments of Interest. It is expected, and therefore this discussion assumes, that the notes will be issuedwithout original issue discount for US federal income tax purposes. Accordingly, interest paid on a note (andany additional amount paid pursuant to the obligations described under “Description of the Notes—AdditionalAmounts”) will be taxable to a US Holder as ordinary interest income at the time it accrues or is received inaccordance with the US Holder’s method of accounting for US federal income tax purposes. If, contrary to theBank’s expectation, the notes’ principal amount exceeds the issue price by more than a de minimis amount,as determined under applicable Treasury Regulations, a US Holder would be required to include such excessin income as original issue discount, as it accrues, in accordance with a constant yield method based on acompounding of interest before the receipt of cash payments attributable to this income.
The amount of interest taxable as ordinary income will include amounts withheld in respect of Indiantaxes (if any). Interest income earned by a US Holder with respect to a note will constitute foreign sourceincome for US federal income tax purposes, which may be relevant to a US Holder in calculating the USHolder’s foreign tax credit limitation. Indian taxes (if any) withheld from interest income on a note (at the ratenot exceeding the rate provided by the income tax treaty between India and the United States if the US Holderis eligible for the benefits of the treaty) generally will be creditable against the US Holder’s US federal incometax liability, subject to applicable limitations that may vary depending upon the US Holder’s circumstances.The limitation on foreign taxes eligible for credit is calculated separately with respect to two specific classesof income. For this purpose, interest income on the notes will generally constitute “passive category income”or, in the case of certain US Holders, “general category income”. The rules governing foreign tax credits arecomplex and, therefore, US Holders should consult their own tax advisers regarding the availability of foreigntax credits in their particular circumstances. Instead of claiming a credit, the US Holder may, at its election,deduct such Indian withholding taxes in computing its taxable income. An election to deduct foreign taxesinstead of claiming foreign tax credits must apply to all applicable foreign taxes paid or accrued in the taxableyear.
Sale, Retirement or Other Taxable Disposition of the Notes. Upon the sale, retirement or other taxabledisposition of a note, a US Holder will recognize taxable gain or loss equal to the difference between theamount realized on the sale, retirement or taxable disposition and the US Holder’s tax basis in the note. Forthese purposes, the amount realized does not include any amount attributable to accrued interest. Amountsattributable to accrued interest are treated as interest as described under “—Payments of Interest” above. A USHolder’s tax basis in a note will generally equal the cost of such note to the US Holder.
216

Gain or loss realized on the sale, retirement or other taxable disposition of a note will generally be capitalgain or loss and will be long-term capital gain or loss if at the time of the sale, retirement or taxable dispositionthe US holder has held the note for more than one year. Long-term capital gains recognized by non-corporateUS Holders are currently subject to reduced tax rates. The deductibility of capital losses may be subject tolimitations.
Any gain or loss will generally be US source income for purposes of computing a US Holder’s foreigntax credit limitation. As described in “Indian Taxation—Payment through India—Taxation of gains arising ondisposition” above, holders may be subject to Indian tax on the disposition of notes. US Holders should consulttheir tax advisers as to whether they would be able to credit any such Indian tax against their US federalincome tax liabilities in their particular circumstances.
Information Reporting and Backup Withholding. Payments of interest and proceeds from the sale of anote that are made within the United States or through certain US-related financial intermediaries generallyare subject to information reporting, and may be subject to backup withholding, unless (i) the US Holder isan exempt recipient or (ii) in the case of backup withholding, the US Holder provides a correct taxpayeridentification number and certifies that it is not subject to backup withholding. The amount of any backupwithholding from a payment to a US Holder will be allowed as a credit against the holder’s US federal incometax liability and may entitle it to a refund, provided that the required information is timely furnished to theInternal Revenue Service.
217

UNITED STATES BENEFIT PLAN INVESTOR CONSIDERATIONS
The following is a summary of certain considerations associated with an investment in the notes by apension, profit sharing or other employee benefit plan subject to Title I of the Employee Retirement IncomeSecurity Act of 1974, as amended (“ERISA”) or Section 4975 of the Code. THE FOLLOWING IS MERELYA SUMMARY, HOWEVER, AND SHOULD NOT BE CONSTRUED AS LEGAL ADVICE OR ASCOMPLETE IN ALL RELEVANT RESPECTS. BECAUSE THIS SUMMARY WAS WRITTEN INCONNECTION WITH THE MARKETING OF THE NOTE, IT IS NOT INTENDED TO BE USED ANDCANNOT BE USED BY ANY NOTE HOLDER FOR THE PURPOSE OF AVOIDING PENALTIES AND/OREXCISE TAX. ALL PURCHASERS ARE URGED TO CONSULT THEIR LEGAL ADVISORS BEFOREINVESTING ASSETS OF AN EMPLOYEE BENEFIT PLAN IN THE NOTES AND TO MAKE THEIROWN INDEPENDENT DECISIONS.
Each fiduciary of a pension, profit-sharing or other employee benefit plan (an “ERISA Plan”) subject toERISA should consider the fiduciary standards of ERISA in the context of the ERISA Plan’s particularcircumstances before authorizing an investment in the notes. Accordingly, among other factors, the fiduciaryshould consider whether the investment would satisfy the prudence and diversification requirements of ERISAand would be consistent with the documents and instruments governing the ERISA Plan.
Section 406 of ERISA and Section 4975 of the Code generally prohibit ERISA Plans, as well asindividual retirement accounts and Keogh plans subject to Section 4975 of the Code (together with ERISAPlans, “Plans”), from engaging in certain transactions involving “plan assets” with persons who are “partiesin interest” under ERISA or “disqualified persons” under the Code with respect to such Plan (together, “Partiesin Interest”). For example, if we are a Party in Interest with respect to a Plan (either directly or by reason ofthe ownership of affiliated entities), the purchase of the notes by or on behalf of the Plan would likely be aprohibited transaction under Section 406(a)(1) of ERISA and Section 4975(c)(1) of the Code, unless the notesare acquired pursuant to an exemption from the “prohibited transaction” rules. A violation of these prohibitedtransaction rules could result in an excise tax or other liabilities under ERISA and/or Section 4975 of the Codefor such persons, unless relief is available under an applicable statutory or administrative exemption.
Certain prohibited transaction class exemptions (“PTCEs”) issued by the US Department of Labor mayprovide exemptive relief for direct or indirect prohibited transactions resulting from the purchase or holdingof the notes. Those class exemptions are PTCE 96-23 (for certain transactions determined by in-house assetmanagers), PTCE 95-60 (for certain transactions involving insurance company general accounts), PTCE 91-38(for certain transactions involving bank collective investment funds), PTCE 90-1 (for certain transactionsinvolving insurance company separate accounts) and PTCE 84-14 (for certain transactions determined byindependent qualified professional asset managers). In addition, ERISA Section 408(b)(l7) and Section4975(d)(20) of the Code provide a limited exemption for the purchase and sale of securities and related lendingtransactions, provided that neither the issuer of the securities nor any of its affiliates have or exercise anydiscretionary authority or control or render any investment advice with respect to the assets of any Planinvolved in the transaction and provided further that the Plan pays no more and receives no less than adequateconsideration in connection with the transaction (the so-called “service provider exemption”). There can be noassurances that any of these statutory or class exemptions will be available with respect to transactionsinvolving the notes.
Accordingly, the notes may not be purchased or held by any Plan, any entity whose underlying assetsinclude “plan assets” by reason of any Plan’s investment in the entity (a “Plan Asset Entity”) or any personinvesting “plan assets” of any Plan, unless the purchase and holding of the notes will not result in a nonexemptprohibited transaction. Any purchaser of the notes or any interest therein, including in the secondary market,will be deemed to have represented that, among other things, either (a) it is not a Plan or Plan Asset Entityand is not purchasing the notes on behalf of or with “plan assets” of any Plan or Plan Asset Entity or with anyassets of a governmental, church or non-US plan that is subject to any federal, state, local or non-US law thatis substantially similar to the provisions of Section 406 of ERISA or Section 4975 of the Code (“SimilarLaws”) or (b) its purchase, holding and disposition of the notes will not result in a nonexempt prohibitedtransaction under Section 406 of ERISA or Section 4975 of the Code or any Similar Law and that suchrepresentations shall be deemed to be made each day from the date on which the purchaser purchases throughand including the date on which the purchaser disposes of the notes. See “Transfer Restrictions” herein.
218

Due to the complexity of these rules and the penalties that may be imposed upon persons involved innonexempt prohibited transactions, it is particularly important that fiduciaries or other persons consideringpurchasing the notes on behalf of or with “plan assets” of any Plan or plan subject to Similar Laws consultwith their counsel regarding the potential consequences under ERISA and the Code and the availability ofexemptive relief. Purchasers of the notes have exclusive responsibility for ensuring that their purchase andholding of the notes do not violate the fiduciary or prohibited transaction rules of ERISA or the Code or anysimilar provisions under any Similar Laws. The sale of any notes to a Plan or plan subject to Similar Lawsis in no respect a representation by us or the Initial Purchaser or any of our or their affiliates or representativesthat such an investment meets all relevant legal requirements with respect to investments by any such plansgenerally or any particular plan, or that such investment is appropriate for such plans generally or anyparticular plan.
219

PLAN OF DISTRIBUTION
We intend to offer the notes through the Initial Purchasers. Subject to the terms and conditions containedin a purchase agreement dated the date of this offering memorandum between us, and Barclays Bank PLC,Citigroup Global Markets Limited and Deutsche Bank AG, Singapore Branch, being the Initial Purchasers,have severally agreed to purchase, and we have agreed to sell to them, US$1,000,000,000 aggregate principalamount of the notes, as follows:
Initial Purchasers Principal Amount
Barclays Bank PLC .......................................................................................................... US$333,000,000Citigroup Global Markets Limited. .................................................................................. US$333,000,000Deutsche Bank AG, Singapore Branch ............................................................................ US$334,000,000
Total ................................................................................................................................. US$1,000,000,000
The Initial Purchasers have agreed to purchase all of the notes being sold pursuant to the purchaseagreement if any of these notes are purchased.
We have agreed in the purchase agreement, that for a period of 30 days after the date of this offeringmemorandum, subject to certain exceptions, we will not issue or guarantee any other non-Rupee denominatedborrowings or debt instruments or securities which have a tenor of four years or more and which are eitherplaced or distributed on a syndicated basis directly or on our behalf, outside India.
We have agreed to indemnify the Initial Purchasers against certain liabilities, including liabilities underthe Securities Act, and will contribute to payments the Initial Purchasers may be required to make in respectof those liabilities.
The Initial Purchasers are offering the notes, subject to prior sale, when, as and if issued to and acceptedby them, subject to approval of legal matters by their counsel, including the validity of the notes, and otherconditions contained in the purchase agreement, such as the receipt by the Initial Purchasers of officer’scertificates and legal opinions. The Initial Purchasers reserve the right to withdraw, cancel or modify offersto investors and to reject orders in whole or in part.
Delivery of the notes is expected on or about November 16, 2010, which is the fifth business dayfollowing the date of pricing of the notes (such settlement cycle being referred to as “T+5”). Under Rule15c6-1 under the Exchange Act, trades in the secondary market generally are required to settle in threebusiness days, unless the parties to any such trade expressly agree otherwise. Accordingly, purchasers whowish to trade the notes on the date of pricing or the next succeeding business day will be required, becausethe notes will initially settle in T+5, to specify an alternate settlement cycle at the time of any such trade toprevent a failed settlement. Purchasers who wish to trade the notes on the pricing date or the next succeedingbusiness day should consult their own advisors.
New Issue of Notes
The notes are a new issue of notes with no established trading market. We have received approval inprinciple for the listing of the notes on the Singapore Exchange. The Initial Purchasers may make a marketin the notes after completion of this offering as permitted by applicable laws and regulations. However, theyare under no obligation to do so and may discontinue any market-making activities at any time without anynotice. Accordingly, we cannot assure you as to the liquidity of, or the development or continuation of tradingmarkets for, the notes.
Selling Restrictions
United States
The notes have not been registered under the Securities Act and may not be offered or sold in the UnitedStates or to US persons (other than distributors) unless they are registered under the Securities Act or anexemption from the registration requirements of the Securities Act is available. See “Transfer Restrictions”.
220

We have been advised by the Initial Purchasers that they propose to resell the notes initially to qualifiedinstitutional buyers (as defined in Rule 144A) in reliance on the exemption from the registration requirementsof the Securities Act provided by Rule 144A and to non-US Persons in reliance on the exemption from theregistration requirements of the Securities Act provided by Regulation S.
The Initial Purchasers have agreed that, except as permitted by the purchase agreement, they will notoffer, sell or deliver the notes (i) as part of their distribution at any time or (ii) otherwise until 40 days afterthe later of the commencement of this offering and the original issuance date of the notes, within the UnitedStates or to, or for the account or benefit of, US persons, other than in accordance with Rule 144A, and theywill send to each distributor, dealer or other person receiving a selling concession or similar fee to which theysell notes in reliance on Regulation S during such 40-day period, a confirmation or other notice detailing therestrictions on offers and sales of the notes within the United States or to, or for the account or benefit of, USpersons. In addition, until the expiration of the 40-day “distribution compliance period” (within the meaningof Regulation S) referred to above, an offer or sale of notes within the United States by a dealer (whether ornot it is participating in this offering) may violate the registration requirements of the Securities Act if suchoffer or sale is made otherwise than pursuant to Rule 144A or pursuant to another exemption from registrationunder the Securities Act. Terms used in this paragraph have the meanings given to them by Regulation S.
Each purchaser of the notes will be deemed to have made acknowledgements as described under“Transfer Restrictions”.
United Kingdom
Any communication of an invitation or inducement to engage in investment activity (within the meaningof section 21 of the Financial Services and Markets Act 2000 (the “FSMA”) in connection with the issue orsale of the notes may be made only in circumstances in which Section 21(1) of the FSMA does not apply tous and in compliance with all applicable provisions of the FSMA with respect to anything done by the InitialPurchasers relating to the notes in, from or otherwise involving the United Kingdom.
India
This offering memorandum has not and will not be registered as a prospectus with the Registrar ofCompanies, the Securities and Exchange Board of India or any other statutory or regulatory body of like naturein India. This offering memorandum or any other offering document or material relating to the notes, may notbe circulated or distributed, directly or indirectly, to any person or the public or any member of the public inIndia or otherwise generally distributed or circulated in India. The notes may not be offered or sold in Indiain circumstances which would constitute an offer to the public within the meaning of the Companies Act, 1956and other laws for the time being in force.
Hong Kong
The notes may not be offered or sold in Hong Kong, by means of any document, other than (a) to“professional investors” as defined in the Securities and Futures Ordinance (Cap. 571) of Hong Kong and anyrules made under that Ordinance; or (b) in other circumstances which do not result in the document being a“prospectus” as defined in the Companies Ordinance (Cap. 32) of Hong Kong or which do not constitute anoffer to the public within the meaning of that Ordinance.
No advertisement, invitation or document relating to the notes may be issued, whether in Hong Kong orelsewhere, which is directed at, or the contents of which are likely to be accessed or read by, the public ofHong Kong (except if permitted to do so under the securities laws of Hong Kong) other than with respect tonotes which are or are intended to be disposed of only to persons outside Hong Kong or only to “professionalinvestors” as defined in the Securities and Futures Ordinance (Cap. 571) of Hong Kong and any rules madeunder that Ordinance.
Singapore
This offering memorandum has not been registered as a prospectus with the Monetary Authority ofSingapore. Accordingly, the notes may not be offered or sold or made the subject of an invitation forsubscription or purchase, and the offering memorandum or any other document or material in connection withthe offer or sale, or invitation for subscription or purchase, of the notes, may not be circulated or distributed,
221

whether directly or indirectly, to persons in Singapore other than (i) to an institutional investor under Section274 of the Securities and Futures Act, Chapter 289 of Singapore (the “SFA”), (ii) to a relevant person pursuantto Section 275(1), or any person pursuant to Section 275(1A), and in accordance with the conditions specifiedin Section 275, of the SFA or (iii) otherwise pursuant to, and in accordance with the conditions of, any otherapplicable provision of the SFA.
Where the notes are subscribed or purchased under Section 275 of the SFA by a relevant person whichis:
(a) a corporation (which is not an accredited investor (as defined in Section 4A of the SFA)) the solebusiness of which is to hold investments and the entire share capital of which is owned by one ormore individuals, each of whom is an accredited investor; or
(b) a trust (where the trustee is not an accredited investor) whose sole purpose is to hold investmentsand each beneficiary of the trust is an individual who is an accredited investor,
securities (as defined in Section 239(1) of the SFA) of that corporation or the beneficiaries’ rights and interest(howsoever described) in that trust shall not be transferred within six months after that corporation or that trusthas acquired the notes pursuant to an offer made under Section 275 of the SFA except:
(1) to an institutional investor or to a relevant person defined in Section 275(2) of the SFA, or to anyperson arising from an offer referred to in Section 275(1A) or Section 276(4)(i)(B) of the SFA;
(2) where no consideration is or will be given for the transfer;
(3) where the transfer is by operation of law; or
(4) as specified in Section 276(7) of the SFA.
Japan
The notes have not been and will not be registered under the Financial Instruments and Exchange Lawof Japan. The notes may not be offered or sold, directly or indirectly, in Japan or to or for the benefit of anyresident of Japan or to any persons for reoffering or resale, directly or indirectly, in Japan or to any residentof Japan, except (i) pursuant to an exemption from the registration requirements of the Securities andExchange Law of Japan available thereunder and (ii) in compliance with the Financial Instruments andExchange Law and other applicable laws, regulations and ministerial guidelines of Japan. As used in thisparagraph, “resident of Japan” means any person residing in Japan, including any corporation or other entityorganized under the laws of Japan.
Price Stabilization and Short Positions
In connection with this offering, Deutsche Bank AG, Singapore Branch or its affiliates may engage intransactions that stabilize, maintain or otherwise affect the price of the notes. Specifically, the InitialPurchasers may bid for and purchase notes in the open market for the purpose of pegging, fixing ormaintaining the price of the notes. In addition, if the Initial Purchasers create a short position in the notes inconnection with the offering by selling more notes than are listed on the cover page of this offeringmemorandum, then the Initial Purchasers may reduce that short position by purchasing notes in the openmarket. The Initial Purchasers may also impose penalty bids, which would permit the Initial Purchasers toreclaim a selling concession from a dealer when the notes originally sold by that dealer are purchased in acovering transaction to cover short positions. In general, purchases of a security for the purpose of stabilizingor reducing a short position could cause the price of that note to be higher than it might otherwise have beenin the absence of those purchases.
Neither we nor the Initial Purchasers make any representation or prediction as to the direction ormagnitude of any effect that the transactions described above may have on the price of the notes. In addition,neither we nor the Initial Purchasers make any representation that anyone will engage in these transactions orthat these transactions, if they are commenced, will not be discontinued without notice.
Other Relationships
The Initial Purchasers and their affiliates have engaged in, and may in the future engage in, investmentbanking and other commercial dealings in the ordinary course of business with us. They have receivedcustomary fees and commissions for these transactions.
222

The Initial Purchasers and certain of their affiliates may have been and may currently be our clients, towhom we provide, from time to time, ordinary course commercial banking services.
223

TRANSFER RESTRICTIONS
The notes have not been registered under the Securities Act and may not be offered or sold in the UnitedStates or to, or for the account or benefit of, US persons except in accordance with an applicable exemptionfrom the registration requirements thereof. Accordingly, the notes are being offered and sold only (1) to“qualified institutional buyers” (as defined in Rule 144A under the Securities Act) in compliance with Rule144A, or (2) outside the United States to non-US persons in reliance upon Regulation S under the SecuritiesAct. As used in this section, the terms “United States”, “US person” and “offshore transactions” have themeanings given to them in Regulation S.
Each purchaser of notes, by its acceptance thereof, will be deemed to have acknowledged, representedto and agreed with us and the Initial Purchasers as follows:
1. It is:
• a qualified institutional buyer, is aware that the sale of the notes to it is being made inreliance on Rule 144A and is acquiring the notes for its own account or for the account ofa qualified institutional buyer; or
• it is not a US person and is purchasing the notes outside the United States in compliance withRegulation S.
2. It understands that the notes are being offered in a transaction not involving any public offeringin the United States within the meaning of the Securities Act and that the notes have not beenregistered under the Securities Act.
3. If it is acquiring the notes in a sale made in reliance upon Rule 144A, it will not offer, resell, pledgeor otherwise transfer notes prior to the date that is one year after the later of the original issue dateof the notes and the last date on which we or any of our affiliates was the owner of that note (orany predecessor of that security) except:
• to us or any of our subsidiaries;
• inside the United States to a qualified institutional buyer in compliance with Rule 144A;
• outside the United States to non-US persons in offshore transactions in accordance with Rule903 or Rule 904 of Regulation S;
• in a transaction complying with Rule 144 under the Securities Act (if available); or
• pursuant to an effective registration statement under the Securities Act;
in each case in accordance with any applicable securities laws of any state of the United States andother jurisdictions. In addition, it will, and each subsequent holder is required to, notify anysubsequent purchaser of those notes from it of the resale restrictions referred to above.
4. If it is acquiring the notes in a sale being made in reliance upon Rule 144A, it understands that thenotes will, until one year after the later of the original issue date of the notes and the last date onwhich we or any of our affiliates was the owner of that note (or any predecessor of that note),unless otherwise agreed by us and the securityholder, bear a legend substantially to the followingeffect:
“This note has not been registered under the United States Securities Act of 1933, asamended (the “Securities Act”), or the securities laws of any state or other jurisdiction.Neither this note nor any interest or participation herein may be reoffered, sold, assigned,transferred, pledged, encumbered or otherwise disposed of in the absence of such registrationor unless such transaction is exempt from, or not subject to, such registration.
The holder of this note by its acceptance hereof (1) represents that it is a “qualifiedinstitutional buyer” (as defined in Rule 144A under the Securities Act) purchasing this note for itsown account or for the account of one or more qualified institutional buyers; (2) agrees to offer,sell or otherwise transfer such note, prior to the date (the “resale restriction termination date”)which is one year after the later of the original issue date hereof and the last date on which theissuer or any affiliate of the issuer was the owner of this security (or any predecessor of such note),only (a) to the issuer or any subsidiary thereof, (b) pursuant to a registration statement that hasbeen declared effective under the Securities Act, (c) for so long as the notes are eligible for resale
224

pursuant to Rule 144A, to a person it reasonably believes is a “qualified institutional buyer”, thatpurchases for its own account or for the account of a qualified institutional buyer to whom noticeis given that the transfer is being made in reliance on Rule 144A, in a principal amount of not lessthan US$100,000, (d) pursuant to offers and sales that occur outside the United States incompliance with Rule 903 or 904 under Regulation S under the Securities Act, (e) pursuant toanother available exemption from the registration requirements of the Securities Act, in each casein accordance with all applicable securities laws of the states of the United States or any otherapplicable jurisdiction; and (3) agrees that it will deliver to each person to whom this security istransferred a notice substantially to the effect of this restrictive legend. This legend will beremoved upon the request of the holder after the resale restriction termination date”.
5. If it is acquiring the notes in a sale being made in reliance upon Regulation S, it understands thatthe notes will, until the expiration of a 40-day “distribution compliance period” within the meaningof Rule 903 of Regulation S, bear a legend substantially to the following effect:
“This note has not been registered under the United States Securities Act of 1933, asamended (the “Securities Act”), or the securities laws of any state or other jurisdiction, and,accordingly, may not be offered or sold within the United States or to or for the account or benefitof US persons except as set forth in the following sentence. By its acquisition hereof, the holder(1) represents that it is not a US person, is not acquiring this note for the account or benefit of aUS person and is acquiring this note in an offshore transaction, (2) by its acceptance hereof, agreesto offer, sell or otherwise transfer such security only (a) to the issuer or any subsidiary thereof, (b)pursuant to a registration statement that has been declared effective under the Securities Act, (c)for so long as the notes are eligible for resale pursuant to Rule 144A under the Securities Act(“Rule 144A”), to a person it reasonably believes is a “qualified institutional buyer” as defined inRule 144A that purchases for its own account or for the account of a qualified institutional buyerto whom notice is given that the transfer is being made in reliance on Rule 144A in a transactionmeeting the requirements of Rule 144A, (d) pursuant to offers and sales that occur outside theUnited States in compliance with Rule 903 or 904 under Regulation S under the Securities Act or(e) pursuant to another available exemption from the registration requirements of the SecuritiesAct, in each case in accordance with all applicable securities laws of the states of the United Statesor any other applicable jurisdiction and (3) agrees that it will deliver to each person to whom thissecurity is transferred a notice substantially to the effect of this restrictive legend. This legend willbe removed after 40 consecutive days beginning on and including the later of (a) the day on whichthe notes are offered to persons other than distributors (as defined in Regulation S) and (b) the dateof the closing of the original offering. As used herein, the terms “offshore transaction”, “UnitedStates” and “US person” have the meanings given to them by Regulation S under the SecuritiesAct.
6. If it is a purchaser in a sale that occurs outside the United States within the meaning of RegulationS, it agrees that until the expiration of a 40-day “distribution compliance period” within themeaning of Rule 903 of Regulation S under the Securities Act, no offer or sale of the notes shallbe made by it to a US person or for the account or benefit of a US person within the meaning ofRule 902(o) of the Securities Act except to a qualified institutional buyer and in compliance withthe applicable restrictions set forth in paragraph (4) above.
7. It acknowledges that the trustee will not be required to accept for registration of transfer any notesacquired by it, except upon presentation of evidence satisfactory to us and the trustee that therestrictions set forth herein have been complied with.
8. It acknowledges that we and the Initial Purchasers will rely upon the truth and accuracy of theforegoing acknowledgments, representations and agreements and agrees that, if any of theacknowledgments, representations or warranties deemed to have been made by its purchase ofnotes are no longer accurate, it will promptly notify us and the Initial Purchasers. If it is acquiringany notes as a fiduciary or agent for one or more investor accounts, it represents that it has soleinvestment discretion with respect to each such account and that it has full power to make theforegoing acknowledgments, representations and agreements on behalf of each such account.
225

9. Either (i) it is not and for so long as it holds notes will not be (and is not acquiring the notesdirectly or indirectly with the assets of a person who is or while the notes are held will be) anERISA Plan or other Plan, an entity whose underlying assets include the assets of any such ERISAPlan or other Plan, or a governmental, church or non-US plan which is subject to any US federal,state or local law, or foreign law, that is substantially similar to the provisions of Section 406 ofERISA or Section 4975 of the Code (“Similar Laws”), or (ii) its purchase, holding and dispositionof the notes will not result in a nonexempt prohibited transaction under Section 406 of ERISA,Section 4975 of the Code or any provision of Similar Laws. Similarly, each transferee of any notes,by virtue of the transfer of such notes to such transferee, will be deemed to have represented andagreed either that (i) it is not and for so long as it holds notes will not be (and is not acquiring thenotes directly or indirectly with the assets of a person who is or while the notes are held will be)an ERISA Plan or other Plan, an entity whose underlying assets include the assets of any suchERISA Plan or other Plan, or a governmental, church or non-US which is subject to any SimilarLaws, or (ii) its purchase, holding and disposition of the notes will not result in a nonexemptprohibited transaction under Section 406 of ERISA or Section 4975 of the Code or any provisionof Similar Laws.
226

LEGAL MATTERS
The validity of the notes will be passed upon for us by Davis Polk & Wardwell LLP, our US counsel,and for the Initial Purchasers by Latham & Watkins LLP, US counsel to the Initial Purchasers.
Matters of Indian law will be passed upon by Amarchand & Mangaldas & Suresh A. Shroff & Co., Indiancounsel to the Initial Purchasers. Matters of Hong Kong law under “Taxation—Hong Kong Taxation” will bepassed upon by Latham & Watkins, Hong Kong counsel to the Initial Purchasers.
227

INDEPENDENT ACCOUNTANTS
The unconsolidated financial statements of ICICI Bank Limited as of and for the years ended March 31,2008, 2009 and 2010, included in this offering memorandum, have been audited by B S R & Co., CharteredAccountants, as stated in their report appearing herein which refers to reliance on other auditors. Theunconsolidated financial statements of ICICI Bank Limited as of and for the six months ended September 30,2010, included in this offering memorandum, have been audited by S.R. Batliboi & Co., CharteredAccountants, as stated in their report appearing herein which refers to reliance on other auditors.
The consolidated financial statements of ICICI Bank Limited as of and for the year ended March 31,2009 and 2010, incorporated by reference in this offering memorandum, have been audited by B S R & Co.,Chartered Accountants, as stated in their report incorporated by reference herein which refers to reliance onother auditors to the extent set forth therein.
As per statutory requirements, the appointment of S.R. Batliboi & Co., Chartered Accountants, asindependent statutory auditors with respect to the Bank within the meaning of the Indian Companies Act,1956, as amended and in accordance with the guidelines issued by the Institute of Chartered Accountants ofIndia, for fiscal 2011 has been approved by the Board of Directors of the Bank and the Reserve Bank of India.The appointment has been approved by the shareholders at the Annual General Meeting held on June 28, 2010.
228

DESCRIPTION OF CERTAIN DIFFERENCES BETWEEN INDIAN GAAP AND US GAAP
The following is a general summary of certain differences between Indian GAAP and US GAAP asapplicable to us. The differences identified below are limited to those significant differences that areappropriate to our financial statements. However, they should not be construed as being exhaustive, and noattempt has been made to identify possible future differences between Indian GAAP and US GAAP as a resultof prescribed changes in accounting standards nor to identify future differences that may affect the financialstatements as a result of transactions or events that may occur in the future.
Indian GAAP US GAAP
1. Financial Statements Presentation and Disclosure
Two years’ balance sheets, profit and loss account,accounting policies and notes and cash flowstatements are required under Indian GAAP.
Companies filing US GAAP financial statements withthe SEC are required to present three years’ statementof operations, statement of stockholders’ equity andother comprehensive income and cash flow statementsand two years’ balance sheets.
Pursuant to the option available under Form 20-F, wefile consolidated financial statements under IndianGAAP including reconciliation of net income andstockholder’s equity under Indian GAAP to netincome and stockholder’s equity under US GAAP.
2. Consolidation
We have presented our Indian GAAP financialstatements on an unconsolidated basis where thefinancial position and results of operations of ourcontrolled entities are not consolidated, but arereflected on the basis of cost subject to considerationof impairment. Under Indian GAAP, we also prepareconsolidated financial statements as per AccountingStandard 21 on “Consolidated Financial Statements”where the investments in subsidiaries are consolidatedon a line-by-line basis by adding together items ofassets, liabilities, income and expenses. Investmentsin associates are accounted for as per the equitymethod of accounting as defined in AccountingStandard 23 on “Accounting for Investments inAssociates in Consolidated Financial Statements” andin joint ventures as per the proportionateconsolidation method as defined in AccountingStandard 27 on “Financial Reporting of Interests inJoint Ventures”. The financial statements ofcompanies which are jointly controlled entities byvirtue of the contractual agreements but which arealso subsidiaries as per Accounting Standard 21 on“Consolidated Financial Statements”, areconsolidated on a line-by-line basis as per AccountingStandard 21 on “Consolidated Financial Statements”,consequent to the limited revision to AccountingStandard 27 on “Financial Reporting of Interests inJoint Ventures”. Under Indian GAAP, we have notconsolidated certain entities in which control isintended to be temporary.
US GAAP requires consolidation and generally doesnot consider financial statements to be prepared undera “fundamental basis of accounting” if a consolidationaccounting policy is not followed. US GAAP alsorequires consolidation of variable interest entities, ifthe investing entity is a primary beneficiary as definedin FASB ASC Topic 810-10,“Consolidation—Overall”. Under US GAAP, theentries are considered for consolidation on aline-by-line basis or as per equity method ofaccounting primarily in accordance with FASB ASCTopic 810, “Consolidation” and FASB ASC Topic323, “Investments—equity method and joint venture”.
229

Indian GAAP US GAAP
3. Business Combination
Under Indian GAAP, for legal and accountingpurposes, ICICI Bank acquired ICICI by issuingshares of ICICI Bank to the shareholders of ICICI.The business combination was accounted for inaccordance with purchase method of accounting. Theexcess of fair value of the assets of ICICI over thepaid up value of the shares issued by ICICI Bank wastaken to general reserves.
In accordance with FASB ASC Topic 805, “BusinessCombinations”, the amalgamation of ICICI withICICI Bank qualifies as a reverse acquisition. Forfinancial reporting purposes ICICI was the acquiringentity and hence the assets and liabilities of ICICIBank were fair valued under the purchase method ofaccounting. The total purchase price was determinedby taking into consideration the fair value of thecommon stock issued and stock options assumed andthe direct acquisition costs. The total purchase pricewas allocated to the acquired assets and assumedliabilities based on management estimates andindependent appraisals. The difference between thetotal purchase price and net tangible and intangibleassets acquired was treated as goodwill. Under USGAAP, goodwill has been accounted for in accordancewith ASC Topic 805 and FASB ASC Topic 350,“Intangibles—Goodwill and others”. Subsequent tothe adoption of ASC Topic 350, goodwill andintangibles with infinite life are tested for impairmentat least annually.
4. Unrealized gains/losses on Investments
All investments are categorized into “Held toMaturity”, “Available for Sale” and “Trading”. “Heldto Maturity” securities are carried at their acquisitioncost or at amortized cost if acquired at a premium overthe face value. “Available for Sale” and “Trading”securities are valued periodically as per the ReserveBank of India’s guidelines. Depreciation/appreciationfor each basket within “Available for Sale” and“Trading” category is aggregated. Net appreciation ineach basket if any, being unrealized, is ignored, whilenet depreciation is charged to the profit and lossaccount.
Investments are classified into “Trading” or“Available for Sale” based on management’s intentand ability. Currently, no investments are classified as“Held to Maturity”. While “Trading” and “AvailableFor Sale” securities are valued at fair value, “Held toMaturity” securities are valued at cost, adjusted foramortization of premiums and accretion of discount.The unrealized gains and losses on “Trading”securities are taken to the income statement, whilethose on “Available for Sale” securities are reportedas a separate component of stockholders’ equity, netof applicable taxes, until realized. We assess theavailable for sale or held to maturity securities forother than temporary impairment. In case a security isassessed to be other than temporarily impaired, theunrealized losses are recognized in income statement.As per a recent pronouncement in US GAAP, a certainportion of the amount of other than temporaryimpairment loss should be taken to othercomprehensive income if criteria relating to probablesale of the security as given in the pronouncement arefulfilled. Under US GAAP, the impact of movementson non-hedged “available for sale” debt securitiesdenominated in foreign currencies is taken to othercomprehensive income.
230

Indian GAAP US GAAP
Under US GAAP, unrealized gains or losses oninvestments of venture capital subsidiaries arerecognized in the profit and loss account.
Under Indian GAAP, the impact of movements inforeign exchange rates on debt securities denominatedin foreign currencies is taken to profit and lossaccount.
Under Indian GAAP, unrealized gains or losses oninvestments of venture capital subsidiaries are takento reserves.
5. Amortization of premium/discount onpurchase of investments
No amortization of premium/discount on investmentsis required except for premium on investmentscategorized as Held to Maturity.
Premium/discount is amortized on all categories ofinvestments.
6. Retirement benefits
Effective April 1, 2006 the liability for defined benefitplans like gratuity and pension is determined using theprojected unit credit actuarial method. The discountrate for obligations is based on market yields ofgovernment securities. The actuarial gains or lossesare recognized immediately in the statement ofincome. Past service cost is recognized as an expenseon a straight-line basis over the average period untilthe benefits become vested.
The liability for defined benefit schemes isdetermined using the projected unit credit actuarialmethod. The discount rate for obligations is based onmarket yields of high quality corporate bonds. As aminimum, amortization of an unrecognized net gainor loss is included as a component of net pension costfor a year if, as of the beginning of the year,unrecognized net gain or loss exceeds 10% of thegreater of the projected benefit obligation or themarket-related value of plan assets. Gains and lossesand prior service costs are recognized as a componentof other comprehensive income to the extent they arenot recognized as components of net periodic benefitcost. The balance, if any, is amortized over theaverage remaining service period of active employeesexpected to receive benefits under the plan.
7. Accounting for share based payments
We follow the intrinsic value method to account forour stock-based employees’ compensation plans.Compensation cost is measured by the excess, if any,of the fair market price, of the underlying stock overthe exercise price on the grant date. Under IndianGAAP, fringe benefit tax (FBT) recovered fromemployees is recorded as an offset against thecorresponding expenses.
Under US GAAP, share based payments are accountedfor under FASB ASC Topic 718,“Compensation—stock compensation”, whichrequires such payments to employees, includinggrants of employee stock options, to be recognized inthe income statement based on their fair values. UnderUS GAAP, the effect of FBT is considered indetermining the fair value of the award on the grantdate.
8. Revaluation of property
Property is carried at historical cost or other amountsubstituted for historical cost less accumulateddepreciation. An increase in net book value as a resultof revaluation is taken directly to revaluation reserveswhile a decline is charged to profit and loss account.
Revaluation of property is not permitted in accountsunder US GAAP. As a result, depreciation charge islower under US GAAP and the realized profit or losson sale of revalued property is different from IndianGAAP.
231

Indian GAAP US GAAP
9. Allowance for credit losses
All credit exposures, including overdues arising fromcrystallized derivative contracts, are classified as perReserve Bank of India guidelines, into performing andNPAs. Further, NPAs are classified into sub-standard,doubtful and loss assets based on the criteriastipulated by Reserve Bank of India. In the case ofcorporate loans, provisions are made for sub-standardand doubtful assets at rates prescribed by ReserveBank of India. Loss assets and the unsecured portionof doubtful assets are provided/written off as per theextant Reserve Bank of India guidelines. Provisionson homogeneous retail loans, subject to minimumprovisioning requirements of Reserve Bank of India,are assessed at a portfolio level on the basis of dayspast due. We hold specific provisions againstnon-performing loans and general provision againstperforming loans. The assessment of incrementalspecific provisions is made after taking intoconsideration existing specific provision. The specificprovisions on retail loans held by us are higher thanthe minimum regulatory requirements. Provision onassets restructured/rescheduled is made in accordancewith the applicable Reserve Bank of India guidelineson restructuring of advances by banks under which theprovision is calculated by discounting the original andrestructured cash flows at the current lending rate. Inrespect of non-performing loan accounts subjected torestructuring, the account is upgraded to standard onlyafter the specified period i.e., a period of one yearafter the date when first payment of interest or ofprincipal, whichever is earlier, falls due, subject tosatisfactory performance of the account during theperiod. In addition to the specific provision on NPAs,we maintain a general provision on performing loans.The general provision covers the requirements of theReserve Bank of India guidelines. Under IndianGAAP, in respect of non-performing loan accountssubjected to restructuring, the account is upgraded tostandard category if the borrower demonstrates, over aminimum period of one year, the ability to repay theloan in accordance with the contractual terms.
Under US GAAP, the impaired loans portfolio isclassified into restructured loans and other impairedloans. Restructured loans represent loans whose termsrelating to interest and installment payments havebeen modified and qualify as troubled debtrestructurings as defined in FASB ASC Subtopic310-40, “Troubled Debt Restructurings by creditors”.Other impaired loans represent loans other thanrestructured loans, which qualify for impairment asper FASB ASC Subtopic 310-10, “ReceivablesOverall”. Under US GAAP, larger balance,non-homogenous exposures representing significantindividual credit exposures (both funded andnon-funded), are evaluated on the basis of borrower’soverall financial condition, resources and paymentrecord and the realizable value of any collateral. Thisestimate considers all available evidence including thepresent value of the expected future cash flowsdiscounted at the loan’s contractual effective rate andthe fair value of collateral. Allowances recognized onaccount of reductions of future interest rates as a partof troubled debt restructurings are accreted as a creditto the provision for loan losses over the tenor of therestructured loan. Each portfolio of smaller-balance,homogenous loans, including consumer mortgage,installment, revolving credit and most other consumerloans is individually evaluated for impairment. Theallowance for loan losses attributed to these loans isestablished through a process that includes anestimate of probable losses inherent in the portfolio,based upon various statistical analysis. Under USGAAP, the allowance for loan losses for restructuredloans is created by discounting expected cash flows atcontracted interest rates. Under US GAAP, theallowances on the performing portfolios are based onthe estimated probable losses inherent in the portfolio.The allowances on the performing portfolios areestablished after considering historical and projecteddefault rates and loss severities. The process ofup-gradation of non-performing accounts, subjectedto restructuring, under US GAAP is not rule-basedand the timing of up-gradation may differ acrossindividual loans.
232

Indian GAAP US GAAP
10. Loan origination fees/costs
Loan origination fees are accounted for up frontexcept for certain fees which are received in lieu ofsacrifice of future interest, which are amortized overthe remaining period of the facility. Also under IndianGAAP, loan origination costs, including commissionspaid to direct marketing agents, are expensed in theyear in which they are incurred.
Loan origination fees (net of certain costs) areamortized over the period of the loans as anadjustment to the yield on the loan.
11. Acceptances
Acceptances are not recorded on the balance sheet andare disclosed as off-balance sheet contingentliabilities.
Acceptances and the related customer liabilities aredisclosed on the balance sheet as an asset and aliability.
12. Derivatives instruments and hedgingactivities
The impact of changes in fair value of the derivativeinstruments are correlated with the changes in fairvalue of the underlying assets and liabilities andaccounted pursuant to the principles of hedgeaccounting. The related amount receivable from andpayable to the swap counter parties is included in theother assets or liabilities in the balance sheet. Whenthere is no correlation of movements betweenderivatives and the underlying asset or liability, or ifthe underlying asset or liability specifically related tothe derivative instrument has matured or is sold orterminated, the derivative instrument is closed out ormarked to market as an element of non interestincome on an outgoing basis.
All derivatives, either assets or liabilities, aremeasured at fair value. Fair values of derivatives arebased on quoted market prices, which take intoaccount current market and contractual prices of theunderlying instrument as well as time valueunderlying the positions. Derivatives that are notdesignated as part of a hedging relationship areaccounted for in other assets and are adjusted to fairvalue through income. If the derivative qualifies as ahedge, depending on the nature of the hedge, theeffective portion of the hedge’s change in fair value iseither offset against the change in fair value of thehedged asset, liability or firm commitment throughincome or held in equity until the hedged item isrecognized as income. The ineffective portion of ahedge’s change in fair value is immediatelyrecognized in income.
13. Deferred Taxes
Deferred taxation is provided on timing differenceswhere it is considered probable that a benefit or aliability will crystallize. Deferred tax is not created onundistributed earnings of subsidiaries and affiliates.
Under FASB ASC Topic 740, “Income Taxes”,asset/liability method is used such that deferred taxassets and liabilities are calculated for all temporarydifferences. A valuation allowance is created against adeferred tax asset where it is more likely than not thatsome portion of the deferred tax assets will not berealized. Deferred tax is required on temporarydifferences relating to investments in domesticsubsidiaries unless the investment can be recoveredtax-free. Deferred tax is created on undistributedearnings of subsidiaries and affiliates.
Under Indian GAAP, deferred tax assets or liabilitiesare created based on substantively enacted tax rates.
Under US GAAP, deferred tax assets or liabilities arecreated based on enacted tax rates in force at thebalance sheet date.
233

Indian GAAP US GAAP
14. Basis for Depreciation
Depreciation is charged over the estimated useful lifeof a fixed asset on a straight line basis at rates whichare not lower than the rates prescribed in theCompanies Act, 1956.
Depreciation is provided over the useful life of a fixedasset.
15. Accounting policies, errors and estimates
Under Indian GAAP, the cumulative amount of thechange or correction is recognized and disclosed inthe profit and loss account in the period of change.Recent standards in some cases require the cumulativeeffect of changes to be adjusted in reserves.
Changes in accounting principle and estimate andcorrection of errors are required to be made throughretrospective adjustment of prior periods. Thecumulative effect of the change on periods prior tothose presented is reflected in the opening balances.Changes in accounting estimate are accountedprospectively.
16. Accounting for Securitization
Under Indian GAAP, with effect from February 1,2006, profits/premium arising from securitization ofloan assets are accounted for over the life of thesecurities issued or to be issued by the special purposevehicle/special purpose entity to which the assets aresold. The losses, if any, are charged off immediately.The float income is accrued as it is earned underIndian GAAP.
Under US GAAP, the gain on sale of loans securitized(including float income) is accounted for at the timeof sale in accordance with FASB ASC Topic 860,“Transfers and Servicing Financial Assets andExtinguishment”. As per ASC Topic 860, any gain orloss on the sale of the financial asset is accounted forin the income statement at the time of the sale.
17. Dividend
Indian GAAP, dividends on common stock and therelated dividend tax are recognized in the year towhich it relates to.
Under US GAAP, dividends on common stock and therelated dividend tax are recognized in the year ofapproval by the board of directors.
18. Others
Under Indian GAAP, gain on redemption of certainventure capital units were recognized by exchangingthe units with underlying equity shares.
Under US GAAP, gain is recognized only if beneficialinterest is not retained.
234

IMPORTANT INFORMATION RELATING TO THE FINANCIAL INFORMATION PRESENTED
This offering memorandum includes our unconsolidated audited financial statements prepared inaccordance with Indian GAAP guidelines issued by the Reserve Bank of India from time to time, and practicesgenerally prevailing in the banking industry. The financial information in our annual report on Form 20-F forfiscal 2006 to 2010 is based on our audited consolidated financial statements and accompanying notesprepared in accordance with Indian GAAP with the net income and stockholders’ equity reconciled to USGAAP. Financial information in our annual reports on Form 20-F for fiscal 2000 to 2005 filed with the SECwas prepared in accordance with US GAAP. US GAAP requires consolidation as a fundamental basis ofaccounting, and is different in many respects to Indian GAAP. For further discussion of certain significantdifferences between Indian GAAP and US GAAP, see “Description of Certain Differences between IndianGAAP and US GAAP”. Our audited consolidated financial statements at and for the year ended March 31,2009 prepared in accordance with Indian GAAP as included in our 15th annual report to shareholders and ouraudited consolidated financial statements at and for the year ended March 31, 2010 prepared in accordancewith Indian GAAP as included in our 16th annual report to shareholders are incorporated by reference into thisoffering memorandum (but not any other parts of such annual reports). The information incorporated byreference is part of this offering memorandum.
235

INDEX TO FINANCIAL STATEMENTS
Page
Financial Statements of ICICI Bank Limited (Unconsolidated) for the quarter endedSeptember 30, 2010
Auditors’ Report to the Board of Directors of ICICI Bank Limitedfor the six months ended September 30, 2010 . . . . . . . . . . . . . . . . . . . . . . . . . . . . . . . . . . . . . . F-2
Balance Sheet as on September 30, 2010 . . . . . . . . . . . . . . . . . . . . . . . . . . . . . . . . . . . . . . . . . . . F-3
Profit and Loss Account for the six months ended September 30, 2010 . . . . . . . . . . . . . . . . . . . . . . F-4
Cash Flow Statement for the six months ended September 30, 2010 . . . . . . . . . . . . . . . . . . . . . . . . F-5
Schedules to the financial statements . . . . . . . . . . . . . . . . . . . . . . . . . . . . . . . . . . . . . . . . . . . . . . F-7
Financial Statements of ICICI Bank Limited (Unconsolidated) for the year endedMarch 31, 2010
Auditors’ Report to the Members of ICICI Bank Limitedfor the year ended March 31, 2010 . . . . . . . . . . . . . . . . . . . . . . . . . . . . . . . . . . . . . . . . . . . . . F-43
Balance Sheet as on March 31, 2010 . . . . . . . . . . . . . . . . . . . . . . . . . . . . . . . . . . . . . . . . . . . . . F-45
Profit and Loss Account for the year ended March 31, 2010 . . . . . . . . . . . . . . . . . . . . . . . . . . . . . F-46
Cash Flow Statement for the year ended March 31, 2010 . . . . . . . . . . . . . . . . . . . . . . . . . . . . . . . F-47
Schedules to the financial statements . . . . . . . . . . . . . . . . . . . . . . . . . . . . . . . . . . . . . . . . . . . . . F-48
Financial Statements of ICICI Bank Limited (Unconsolidated) for the year endedMarch 31, 2009
Auditors’ Report to the Members of ICICI Bank Limitedfor the year ended March 31, 2009 . . . . . . . . . . . . . . . . . . . . . . . . . . . . . . . . . . . . . . . . . . . . .F-100
Balance Sheet as on March 31, 2009 . . . . . . . . . . . . . . . . . . . . . . . . . . . . . . . . . . . . . . . . . . . . .F-102
Profit and Loss Account for the year ended March 31, 2009 . . . . . . . . . . . . . . . . . . . . . . . . . . . . .F-103
Cash Flow Statement for the year ended March 31, 2009 . . . . . . . . . . . . . . . . . . . . . . . . . . . . . . .F-104
Schedules to the financial statements . . . . . . . . . . . . . . . . . . . . . . . . . . . . . . . . . . . . . . . . . . . . .F-105
Financial Statements of ICICI Bank Limited (Unconsolidated) for the year endedMarch 31, 2008
Auditors’ Report to the Members of ICICI Bank Limitedfor the year ended March 31, 2008 . . . . . . . . . . . . . . . . . . . . . . . . . . . . . . . . . . . . . . . . . . . . . .F-152
Balance Sheet as on March 31, 2008 . . . . . . . . . . . . . . . . . . . . . . . . . . . . . . . . . . . . . . . . . . . . . .F-154
Profit and Loss Account for the year ended March 31, 2008. . . . . . . . . . . . . . . . . . . . . . . . . . . . . .F-155
Cash Flow Statement for the year ended March 31, 2008 . . . . . . . . . . . . . . . . . . . . . . . . . . . . . . . .F-156
Schedules to the financial statements . . . . . . . . . . . . . . . . . . . . . . . . . . . . . . . . . . . . . . . . . . . . . .F-157
F-1

Auditors’ Report on Interim Financial Statements
The Board of DirectorsICICI Bank Limited
1. We have audited the accompanying condensed Balance Sheet of ICICI Bank Limited (the ‘Bank’) as at30 September 2010, the condensed Profit and Loss Account and condensed Cash Flow Statement for thesix months period then ended prepared in accordance with accounting principles generally accepted inIndia. Incorporated in the said condensed financial statements are the returns of the Singapore, Bahrainand Hong Kong branches of the Bank, audited by other auditors.
2. These financial statements are the responsibility of the Bank’s management. Our responsibility is toexpress an opinion on these financial statements based on our audit. We conducted our audit inaccordance with generally accepted auditing standards in India. These Standards require that we plan andperform the audit to obtain reasonable assurance whether the financial statements are free of materialmisstatements. An audit includes, examining on a test basis, evidence supporting the amounts anddisclosures in the financial statements. An audit also includes assessing the accounting principles usedand significant estimates made by management, as well as evaluating the overall financial statements.We believe that our audit provides a reasonable basis for our opinion.
3. The Bank has not recorded transfer of profit to various reserves as required by the RBI guidelines andthe Banking Regulation Act, 1949 as these are interim financial statements. These transfers will recordedat the time of annual financial statements. This does not affect the net profit after tax or the total reservesreported in the condensed financial statements
4. The condensed balance sheet and condensed profit and loss account are drawn up in conformity withForms A and B (revised) of the Third Schedule to the Banking Regulation Act, 1949 and in accordancewith the requirements of Accounting Standard (AS) 25, Interim Financial Reporting, notified pursuantto the Companies (Accounting Standards) Rules, 2006, read with Section 211 of the Companies Act,1956.
5. We did not audit the financial statements of Singapore, Bahrain and Hong Kong branches, whosefinancial statements reflect total assets of Rs. 747,037.7 million as at 30 September 2010, the totalrevenue of Rs. 19,640.3 million and net cash flows amounting to (Rs. 8,933.6 million) for the period thenended. These financial statements have been audited by other auditors, duly qualified to acts as auditorsin the country of incorporation of the said branches, whose reports have been furnished to us, and ouropinion is based solely on the report of other auditors.
6. We report that:
a) We have obtained all the information and explanations, which to the best of our knowledge andbelief were necessary for the purposes of our audit and have found them to be satisfactory;
b) The condensed balance sheet, condensed profit and loss account and condensed cash flowstatement dealt with by this report are in agreement with the books of account;
c) In our opinion, proper books of account as required by law have been kept by the Bank so far asappears from our examination of those books and proper returns adequate for the purposes of ouraudit have been received from branches not visited by us. The Branch Auditor’s Reports have beenforwarded to us and have been appropriately dealt with;
d) Subject to paragraph 3, on the basis of the information and explanations given to us and onconsideration of auditors reports submitted by Singapore, Bahrain and Hong Kong branches, weare of the opinion that these financial statements give a true and fair view in conformity with theaccounting principles generally accepted in India:
a. in the case of the Condensed Balance Sheet, of the state of affairs of ICICI Bank Limited asat 30 September 2010;
b. in the case of the Condensed Profit and Loss Account, of the net profit of ICICI Bank Limitedfor the six months period then ended; and
c. in the case of the Condensed Cash Flow Statement, of the cash flows of ICICI Bank Limitedfor the six months period then ended.
For S.R. Batliboi & Co.Firm Registration Number: 301003EChartered Accountants
per Shrawan JalanPartnerMembership No.: 102102
F-2

ICICI BANK LIMITEDUnconsolidated Condensed Balance Sheet at September 30, 2010
Schedule At 30.09.2010 At 31.03.2010 At 30.09.2009
in million
CAPITAL AND LIABILITIESCapital............................................................................. 1 11,508.3 11,148.9 11,136.0Reserves and surplus ...................................................... 2 528,240.2 505,034.8 501,446.6Deposits .......................................................................... 3 2,230,941.2 2,020,166.0 1,978,320.5Borrowings ..................................................................... 4 970,097.5 942,635.7 1,001,231.5Other liabilities and provisions ...................................... 5 159,192.8 155,011.7 171,606.8
TOTAL CAPITAL AND LIABILITIES.......................... 3,899,980.0 3,633,997.1 3,663,741.4
ASSETSCash and balances with Reserve Bank of India ............. 6 228,672.1 275,142.9 200,388.4Balances with banks and money at call and short
notice........................................................................... 7 119,806.0 113,594.0 92,278.0Investments ..................................................................... 8 1,362,755.1 1,208,928.0 1,199,648.2Advances......................................................................... 9 1,942,007.2 1,812,056.0 1,908,601.8Fixed assets..................................................................... 10 47,808.3 32,126.9 35,515.7Other assets..................................................................... 11 198,931.3 192,149.3 227,309.3
TOTAL ASSETS............................................................. 3,899,980.0 3,633,997.1 3,663,741.4
Contingent liabilities....................................................... 12 8,468,461.3 7,270,840.6 7,395,052.1Bills for collection.......................................................... 75,337.5 64,749.5 61,742.5Significant accounting policies and notes to accounts ... 18 & 19
The schedules referred to above form an integral part of the Balance Sheet.
As per our Report of even date.
For and on behalf of the Board of Directors
For S.R. Batliboi & Co.Firm’s Registration No.: 301003E
Chartered Accountants
K. V. KamathChairman
Chanda D. KochharManaging Director
& CEO
N. S. KannanExecutive Director
& CFO
Shrawan JalanPartner
Membership No.: 102102
K. RamkumarExecutive Director
Rajiv SabharwalExecutive Director
Sandeep BatraGroup Compliance Officer
& Company SecretaryRakesh Jha
Deputy Chief FinancialOfficer
Place: MumbaiDate: October 29, 2010
F-3

ICICI BANK LIMITEDUnconsolidated Condensed Profit and Loss Account for the period ended September 30, 2010
Schedule At 30.09.2010 At 31.03.2010 At 30.09.2009
in million
I. INCOMEInterest earned ....................................................... 13 121,216.4 257,069.3 137,903.8Other income ......................................................... 14 32,584.4 74,776.5 39,136.7
TOTAL INCOME ........................................................... 153,800.8 331,845.8 177,040.5
II. EXPENDITUREInterest expended................................................... 15 79,262.1 175,925.7 97,690.5Operating expenses................................................ 16 30,538.6 58,598.3 29,705.5Provisions and contingencies ............................... 17 21,377.6 57,072.0 30,461.0
TOTAL EXPENDITURE................................................ 131,178.3 291,596.0 157,857.0
III. PROFIT/(LOSS)Net profit for the period/year ................................ 22,622.5 40,249.8 19,183.5Profit brought forward........................................... 34,643.8 28,096.5 28,096.5
TOTAL PROFIT/(LOSS)....................................... 57,266.3 68,346.3 47,280.0
IV. APPROPRIATIONS/TRANSFERSTransfer to Statutory Reserve................................ — 10,070.0 —Transfer to Reserve Fund ...................................... — 2.2 —Transfer to Capital Reserve ................................... — 4,440.0 —Transfer to Investment Reserve Account............... — 1,160.0 —Transfer to General Reserve.................................. — 10.4 —Transfer to Special Reserve................................... — 3,000.0 —Dividend (including corporate dividend tax) for
the previous year paid during the period/year) . 21.7 0.9 0.9Proposed equity share dividend............................. — 13,378.6 —Proposed preference share dividend ...................... — — —Corporate dividend tax ......................................... — 1,640.4 —Balance carried over to balance sheet ................... 57,244.6 34,643.8 47,279.1
TOTAL............................................................................ 57,266.3 68,346.3 47,280.0
Significant accounting policies and notes to accounts ... 18 & 19Earnings per share (Refer note. 19.5)
Basic ( ) .................................................................... 20.11 36.14 17.23Diluted ( ) ................................................................. 20.03 35.99 17.17
Face value per share ( ) ............................................... 10.00 10.00 10.00
The schedules referred to above form an integral part of the Profit and Loss Account.
As per our Report of even date.
For and on behalf of the Board of Directors
For S.R. Batliboi & Co.Firm’s Registration no.: 301003E
Chartered Accountants
K. V. KamathChairman
Chanda D. KochharManaging Director
& CEO
N. S. KannanExecutive Director
& CFO
Shrawan JalanPartner
Membership no.: 102102
K. RamkumarExecutive Director
Rajiv SabharwalExecutive Director
Sandeep BatraGroup Compliance Officer
& Company SecretaryRakesh Jha
Deputy Chief FinancialOfficer
Place: MumbaiDate: October 29, 2010
F-4

ICICI BANK LIMITEDUnconsolidated Condensed Cash Flow Statement for the half year ended September 30, 2010
PARTICULARS
Half year
ended
30.09.2010
Year ended
31.03.2010
Half year
ended
30.09.2009
in million
Cash flow from operating activitiesNet profit before taxes ................................................................... 29,610.6 53,453.2 25,695.0Adjustments for:Depreciation and amortisation........................................................ 3,539.0 7,550.3 4,252.4Net (appreciation)/depreciation on investments ............................. 5,624.5 6,242.8 444.6Provision in respect of non-performing assets (including
prudential provision on .............................................................standard assets)............................................................................... 13,625.6 43,621.6 24,075.4Provision for contingencies & others ............................................. 423.9 273.5 262.5Income from subsidiaries, joint ventures and consolidated
entities......................................................................................... (2,166.0) (3,934.0) (1,674.0)(Profit)/loss on sale of fixed assets ................................................ (445.0) (1,345.2) (525.0)
50,212.6 105,862.2 52,530.9
Adjustments for:(Increase)/decrease in investments ................................................. (68,818.6) (243,844.2) (211,420.0)(Increase)/decrease in advances...................................................... (80,226.1) 327,300.6 250,272.7Increase/(decrease) in borrowings .................................................. 21,235.7 (17,220.9) 76,369.8Increase/(decrease) in deposits ....................................................... 75,487.8 (163,312.3) (205,157.8)(Increase)/decrease in other assets ................................................. (12,016.9) 54,586.5 17,159.4Increase/(decrease) in other liabilities and provisions ................... 956.6 (28,694.6) 2,620.5
(63,381.5) (71,184.9) (70,155.4)Refund/(payment) of direct taxes ................................................... (7,233.8) (15,985.2) (7,984.0)
Net cash flow from operating activities (A) ............................... (20,402.7) 18,692.1 (25,608.5)
Cash flow from investing activitiesInvestments in subsidiaries and/or joint ventures (including
application money) ..................................................................... — (1,113.2) (333.8)Income from subsidiaries, joint ventures and consolidated
entities......................................................................................... 2,166.0 3,934.0 1,674.0Purchase of fixed assets ................................................................. (3,095.1) (5,101.6) (2,935.5)Proceeds from sale of fixed assets ................................................. 984.8 3,164.8 831.8(Purchase)/sale of held to maturity securities ................................ (18,931.4) 60,623.3 42,432.1
Net cash from investing activities (B) ......................................... (18,875.7) 61,507.3 41,668.6
Cash flow from financing activitiesProceeds from issue of share capital (including ESOPs) net of
issue expenses............................................................................. 1,045.2 610.4 121.0Net proceeds/(repayment) of bonds (including subordinated
debt) ............................................................................................ 1,277.4 26,946.8 (7,416.9)Dividend and dividend tax paid ..................................................... (15,004.8) (13,731.0) (13,726.8)
Net cash generated from financing activities (C) ...................... (12,682.2) 13,826.2 (21,022.7)
Effect of exchange fluctuation on translation reserve (D) ........ (70.5) (4,954.3) (2,036.6)
Net cash and cash equivalents taken over from The Bank ofRajasthan Limited on amalgamation (E) ............................... 11,772.3 — —
Net increase/(decrease) in cash and cash equivalents(A) + (B) + (C) + (D) + (E) ...................................................... (40,258.8) 89,071.3 (6,999.2)
Cash and cash equivalents at beginning of period/year ........... 388,736.9 299,665.6 299,665.6
Cash and cash equivalents at end of period/year ...................... 348,478.1 388,736.9 292,666.4
F-5

Significant accounting policies and notes to accounts (refer schedule 18 & 19). The schedules referred toabove form an integral part of the Balance Sheet.
As per our Report of even date.
For and on behalf of the Board of Directors
For S.R. Batliboi & Co.Firm’s Registration no.: 301003E
Chartered Accountants
K. V. KamathChairman
Chanda D. KochharManaging Director
& CEO
N. S. KannanExecutive Director
& CFO
Shrawan JalanPartner
Membership no.: 102102
K. RamkumarExecutive Director
Rajiv SabharwalExecutive Director
Sandeep BatraGroup Compliance Officer
& Company SecretaryRakesh Jha
Deputy Chief FinancialOfficer
Place: MumbaiDate: October 29, 2010
F-6

Schedules forming part of the balance sheet
At 30.09.2010 At 31.03.2010 At 30.09.2009
in million
SCHEDULE 1 - CAPITALAuthorised capital1,275,000,000 equity shares of 10 each (March 31, 2010:
1,275,000,000 equity shares of 10 each, September 30,2009: 1,275,000,000 equity shares of 10 each) ...................... 12,750.0 12,750.0 12,750.0
15,000,000 shares of 100 each (March 31, 2010: 15,000,000shares of 100 each, September 30, 2009: 15,000,000 sharesof 100 each)1........................................................................... 1,500.0 1,500.0 1,500.0
350 preference shares of 10 million each (March 31, 2010:350 preference shares of 10 million each, September 30,2009: 350 preference shares of 10 million each)2 ................. 3,500.0 3,500.0 3,500.0
Equity share capitalIssued, subscribed and paid-up capital1,114,845,114 equity shares of 10 each (March 31, 2010:
1,113,250,642 equity shares, September 30, 2009:1,113,250,642 equity shares)3..................................................... 11,148.4 11,132.5 11,132.5
Add : 31,323,951 equity shares of 10 each fully paid upissued to shareholders of erstwhile The Bank of RajasthanLimited........................................................................................ 313.2 — —
Add: 1,750,472 equity shares of 10 each fully paid up (March31, 2010: 1,594,672 equity shares, September 30, 2009:313,503 equity shares) issued pursuant to exercise ofemployee stock options. ............................................................ 17.6 15.9 3.1
11,479.2 11,148.4 11,135.6Less: Calls unpaid ......................................................................... 0.3 0.3 0.4Add: 111,603 equity shares forfeited (March 31, 2010: 111,603
equity shares, September 30, 2009: 111,603 equity shares)....... 0.8 0.8 0.8Share capital suspense [net]4 ......................................................... 28.6 — —
TOTAL CAPITAL .......................................................................... 11,508.3 11,148.9 11,136.0
1. These shares will be of such class and with such rights, privileges, conditions or restrictions as may be determined by the Bankin accordance with the Articles of Association of the Bank and subject to the legislative provisions in force for the time being inthat behalf.
2. Pursuant to RBI circular no. DBOD.BP.BC No.81/ 21.01.002/2009-10, the issued and paid-up preference shares are grouped underSchedule 4 - “Borrowings”.
3. Net of 200 shares of the Bank, earlier held by erstwhile The Bank of Rajasthan Limited, extinguished on amalgamation.
4. Represents 2,860,170 equity shares kept in abeyance and to be issued in lieu of 13,500,000 unlisted equity shares of erstwhile TheBank of Rajasthan Limited, which are the subject matter of a civil appeal and regulatory direction.
F-7

Schedules forming part of the balance sheet
At 30.09.2010 At 31.03.2010 At 30.09.2009
in million
SCHEDULE 2 - RESERVES AND SURPLUSI. Statutory reserve
Opening balance .................................................................... 58,863.8 48,793.8 48,793.8Additions during the period/year [includes 2,002.7
million on amalgamation].................................................. 2,002.7 10,070.0 —Deductions during the period/year ........................................ — — —Closing balance ..................................................................... 60,866.5 58,863.8 48,793.8
II. Special reserveOpening balance .................................................................... 26,440.0 23,440.0 23,440.0Additions during the period/year........................................... — 3,000.0 —Deductions during the period/year ........................................ — — —Closing balance ..................................................................... 26,440.0 26,440.0 23,440.0
III. Securities premiumOpening balance ................................................................... 313,511.8 312,917.4 312,917.4Additions during the period/year1 ......................................... 853.3 594.4 117.8Deductions during the period/year2....................................... (2,180.9) — —Closing balance ..................................................................... 312,184.2 313,511.8 313,035.2
IV. Investment reserve AccountOpening balance .................................................................... 1,160.0 — —Additions during the period/year........................................... — 1,160.0 —Deductions during the period/year ........................................ — — —Closing balance ..................................................................... 1,160.0 1,160.0 —
V. Capital reserveOpening balance .................................................................... 20,630.0 16,190.0 16,190.0Additions during the period/year........................................... — 4,440.0 —Deductions during the period/year ........................................ — — —Closing balance ..................................................................... 20,630.0 20,630.0 16,190.0
VI. Foreign currency translation reserveOpening balance .................................................................... (20.0) 4,966.8 4,966.8Additions during the period/year........................................... — —Deductions during the period/year ........................................ (70.5) 4,986.8 (2,051.1)Closing balance ..................................................................... (90.5) (20.0) 2,915.7
VII. Reserve fundOpening balance ................................................................... 10.9 8.7 8.7Additions during the period/year3 ......................................... — 2.2 —Deductions during the period/year ........................................ — — —Closing balance ..................................................................... 10.9 10.9 8.7
VIII. Revenue and other reservesOpening balance ................................................................... 49,794.5 49,784.1 49,784.1Additions during the period/year........................................... — 10.4 —Deductions during the period/year ........................................ — — —Closing balance ..................................................................... 49,794.5 49,794.5 49,784.1
IX. Balance in profit and loss account ........................................ 57,244.6 34,643.8 47,279.1
TOTAL RESERVES AND SURPLUS............................................ 528,240.2 505,034.8 501,446.6
1. 842.4 million (March 31, 2010: 568.3 million, September 30, 2009: 108.7 million) on exercise of employee stock options.
2. Represents excess of paid up value of equity shares issued over the fair value of the net assets acquired and amalgamationexpenses.
3. Represents appropriation of 5% of net profit by Sri Lanka branch to meet the requirements of Section 20 of Sri Lankan BankingAct No 30 of 1988.
F-8

Schedules forming part of the balance sheet
At 30.09.2010 At 31.03.2010 At 30.09.2009
in million
SCHEDULE 3 - DEPOSITSA. I. Demand deposits
i) From banks.......................................................... 13,657.1 14,856.0 8,763.8ii) From others ......................................................... 334,913.3 295,118.6 227,351.9
II. Savings bank deposits .................................................. 632,478.8 532,183.7 493,180.8III. Term deposits
i) From banks.......................................................... 160,077.0 88,149.4 75,789.9ii) From others ......................................................... 1,089,815.0 1,089,858.3 1,173,234.1
TOTAL DEPOSITS ........................................................................ 2,230,941.2 2,020,166.0 1,978,320.5
B. I. Deposits of branches in India ...................................... 2,141,174.6 1,921,759.6 1,873,589.6II. Deposits of branches outside India .............................. 89,766.6 98,406.4 104,730.9
TOTAL DEPOSITS ........................................................................ 2,230,941.2 2,020,166.0 1,978,320.5
F-9

Schedules forming part of the balance sheet
At 30.09.2010 At 31.03.2010 At 30.09.2009
in millionSCHEDULE 4 - BORROWINGSI. Borrowings in India
i) Reserve Bank of India ................................................ — — —ii) Other banks .................................................................. 28,378.7 25,000.0 124,912.8iii) Other institutions and agencies
a) Government of India ........................................... 493.5 687.5 881.4b) Financial institutions ........................................... 60,222.1 54,405.3 34,695.1
iv) Borrowings in the form of Bonds and debentures(excluding subordinated debt)- Debentures and bonds guaranteed by the
Government of India ................................................ 7,055.0 8,355.0 10,655.0- Borrowings under private placement of bonds
carrying maturity of 1 to 30 years from the date ofplacement.................................................................. 2,988.7 3,567.4 6,159.6
Bonds issued under multiple option/safety bondsseries
- Regular interest bonds ............................................... 2,350.6 2,924.2 3,114.7- Deep discount bonds.................................................. 2,611.8 2,517.8 2,529.5- Tax saving bonds ...................................................... — 8,713.2 16,109.7- Pension bonds ............................................................ 57.9 59.4 60.8
v) Application money-bonds1 ........................................... — 25,000.0 —vi) Capital instruments .....................................................
Innovative Perpetual Debt Instruments (IPDI)(qualifying as Tier l capital)..................................... 13,010.0 13,010.0 13,010.0
Hybrid debt capital instruments issued asbonds/debentures (qualifying as upper Tier IIcapital) ...................................................................... 98,192.2 97,502.0 73,702.0
Redeemable Non-Cumulative Preference Shares(RNCPS) ..................................................................
(Redeemable Non-Cumulative Preference Shares of10 million each issued to preference share
holders of erstwhile ICICI Limited onamalgamation redeemable at par on April 20,2018)......................................................................... 3,500.0 3,500.0 3,500.0
Unsecured redeemable debentures/bonds(subordinated debt included in Tier II capital)......... 178,456.5 138,547.5 129,206.4
TOTAL BORROWINGS IN INDIA............................................... 397,317.0 383,789.3 418,537.0II. Borrowings outside India
i) From multilateral/bilateral credit agencies guaranteedby the Government of India for the equivalent of
16,903.3 million (March 31, 2010: 17,252.7million, September 30, 2009: 19,738.9 million)....... 18,026.9 18,525.1 21,529.8
ii) From international banks, institutions andconsortiums................................................................... 268,720.4 233,809.4 256,744.7
iii) By way of bonds and notes.......................................... 230,375.5 250,570.3 244,271.1iv) Capital instruments
Innovative Perpetual Debt Instruments (IPDI)(qualifying as Tier l capital)..................................... 15,216.2 15,200.0 16,279.5
Hybrid debt capital instruments issued asbonds/debentures (qualifying as upper Tier IIcapital) ...................................................................... 40,441.5 40,410.0 43,294.5
v) Other borrowings.......................................................... — 331.6 574.9
TOTAL BORROWINGS OUTSIDE INDIA .................................. 572,780.5 558,846.4 582,694.5
TOTAL BORROWINGS ................................................................ 970,097.5 942,635.7 1,001,231.5
1. Application money received towards subordinated debt.2. Secured borrowings in I and II above are Nil, except borrowings of 7,001.5 million under CBLO and market repurchase
transactions with banks and financials institutions.(March 31, 2010: Nil; September 30, 2009: 107,280.0 million).
F-10

Schedules forming part of the balance sheet
At 30.09.2010 At 31.03.2010 At 30.09.2009
in million
SCHEDULE 5 - OTHER LIABILITIES AND PROVISIONSI. Bills payable.......................................................................... 35,711.1 27,069.2 24,238.2II. Inter-office adjustments (net credit) ..................................... — 244.1 1,451.0III. Interest accrued ..................................................................... 25,195.4 24,421.8 25,959.6IV. Others
a) Security deposits from clients ...................................... 8,115.0 5,934.8 6,858.7b) Sundry creditors ........................................................... 54,253.0 39,664.0 62,558.0c) Received for disbursements under special program..... 1,681.1 1,663.3 1,638.5d) Provision for standard assets........................................ 14,796.0 14,360.7 14,360.6e) Other liabilities1 ........................................................... 19,441.2 41,653.8 34,542.2
TOTAL OTHER LIABILITIES AND PROVISIONS .................... 159,192.8 155,011.7 171,606.8
1. Includes :
a) Proposed dividend amounting to Nil. (March 31, 2010: 13,378.6 million, September 30, 2009: Nil).
b) Corporate dividend tax payable amounting to Nil. (March 31, 2010: 1,640.4 million, September 30, 2009: Nil).
At 30.09.2010 At 31.03.2010 At 30.09.2009
in million
SCHEDULE 6 - CASH AND BALANCES WITH RESERVEBANK OF INDIA
I. Cash in hand (including foreign currency notes).................. 30,706.5 33,410.2 27,325.1II. Balances with Reserve Bank of India in current accounts ... 197,965.6 241,732.7 173,063.3
TOTAL CASH AND BALANCES WITH RESERVE BANK OFINDIA ......................................................................................... 228,672.1 275,142.9 200,388.4
At 30.09.2010 At 31.03.2010 At 30.09.2009
in million
SCHEDULE 7 - BALANCES WITH BANKS AND MONEY ATCALL AND SHORT NOTICE
I. In Indiai) Balances with banks
a) In current accounts .............................................. 3,676.1 9,595.8 3,589.4b) In other deposit accounts .................................... 40,122.5 36,076.3 44,260.8
ii) Money at call and short noticea) With banks ............................................................... — 70.0 50.0b) With other institutions ............................................. — — —
TOTAL ........................................................................................... 43,798.6 45,742.1 47,900.2II. Outside India
i) In current accounts ....................................................... 27,800.6 15,722.1 16,123.9ii) In other deposit accounts ............................................. 22,334.2 44,241.2 17,574.7iii) Money at call and short notice........................................ 25,872.6 7,888.6 10,679.2
TOTAL ........................................................................................... 76,007.4 67,851.9 44,377.8
TOTAL BALANCES WITH BANKS AND MONEY AT CALLAND SHORT NOTICE .............................................................. 119,806.0 113,594.0 92,278.0
F-11

Schedules forming part of the balance sheet
At 30.09.2010 At 31.03.2010 At 30.09.2009
in million
SCHEDULE 8 - INVESTMENTSI. Investments in India [net of provisions]
i) Government securities .................................................. 696,585.2 683,991.4 778,358.6ii) Other approved securities............................................. 406.7 45.0 77.7iii) Shares (includes equity and preference shares) .......... 31,981.5 27,557.4 16,980.2iv) Debentures and bonds ................................................. 96,894.9 36,353.9 16,579.0v) Subsidiaries and/or joint ventures1............................... 62,280.9 62,226.8 61,226.8vi) Others (commercial paper, mutual fund units, pass
through certificates, security receipts, certificate ofdeposits etc.) ............................................................... 385,470.7 307,378.4 230,241.3
TOTAL INVESTMENTS IN INDIA.............................................. 1,273,619.9 1,117,552.9 1,103,463.6II. Investments outside India [net of provisions]
i) Government securities .................................................. 1,286.0 1,645.0 3,848.9ii) Subsidiaries and/or joint ventures abroad (includes
equity and preference shares) ..................................... 65,952.0 66,005.0 66,225.7iii) Others .......................................................................... 21,897.2 23,725.1 26,110.0
TOTAL INVESTMENTS OUTSIDE INDIA ................................. 89,135.2 91,375.1 96,184.6
TOTAL INVESTMENTS ............................................................... 1,362,755.1 1,208,928.0 1,199,648.2
A. Investments in IndiaGross value of investments ............................................................ 1,288,641.4 1,129,332.4 1,113,671.1Less: Aggregate of provision/depreciation ..................................... 15,021.5 11,779.5 10,207.5
Net investments .............................................................................. 1,273,619.9 1,117,552.9 1,103,463.6
B. Investments outside IndiaGross value of investments ............................................................ 89,514.3 91,756.7 96,364.6Less: Aggregate of provision/depreciation ..................................... 379.1 381.6 180.0
Net investments .............................................................................. 89,135.2 91,375.1 96,184.6
TOTAL INVESTMENTS ............................................................... 1,362,755.1 1,208,928.0 1,199,648.2
1. Includes application money amounting to 50.6 million. (March 31, 2010: 1,000.0 million; September 30, 2009: Nil.).
F-12

Schedules forming part of the balance sheet
At 30.09.2010 At 31.03.2010 At 30.09.2009
in million
SCHEDULE 9 - ADVANCES [net of provisions]A. i) Bills purchased and discounted .................................... 40,216.8 44,531.6 41,413.7
ii) Cash credits, overdrafts and loans repayable ondemand ......................................................................... 294,730.5 255,552.3 294,218.7
iii) Term loans .................................................................... 1,515,342.3 1,404,149.2 1,493,253.4iv) Securitisation, finance lease and hire purchase
receivables ................................................................... 91,717.6 107,822.9 79,716.0
TOTAL ADVANCES ...................................................................... 1,942,007.2 1,812,056.0 1,908,601.8
B. i) Secured by tangible assets (includes advances againstbook debts) ................................................................... 1,444,852.8 1,336,426.8 1,366,019.6
ii) Covered by bank/government guarantees..................... 23,676.1 21,202.5 18,375.9iii) Unsecured ..................................................................... 473,478.3 454,426.7 524,206.3
TOTAL ADVANCES ...................................................................... 1,942,007.2 1,812,056.0 1,908,601.8C. I. Advances in India
i) Priority sector ...................................................... 448,254.6 539,773.9 447,219.2ii) Public sector ........................................................ 41,193.0 3,201.1 3,263.3iii) Banks................................................................... 709.4 41.8 167.1iv) Others .................................................................. 965,187.1 817,672.5 950,153.6
TOTAL ADVANCES IN INDIA .................................................... 1,455,344.0 1,360,689.3 1,400,803.2II. Advances outside India
i) Due from banks................................................... 7,407.6 13,516.0 10,730.1ii) Due from others
a) Bills purchased and discounted.................. 22,444.4 15,060.9 20,813.9b) Commercial loans....................................... 346,295.3 206,115.1 264,621.3c) Others ......................................................... 110,515.8 216,674.7 211,633.3
TOTAL ADVANCES OUTSIDE INDIA........................................ 486,663.2 451,366.7 507,798.6
TOTAL ADVANCES ...................................................................... 1,942,007.2 1,812,056.0 1,908,601.8
F-13

Schedules forming part of the balance sheet
At 30.09.2010 At 31.03.2010 At 30.09.2009
in million
SCHEDULE 10 - FIXED ASSETSI. Premises
At cost at March 31 of preceding year ................................ 23,122.4 24,110.3 24,110.3Additions during the period/year1 ......................................... 14,578.4 777.6 478.2Deductions during the period/year ........................................ (525.7) (1,765.6) (636.1)Depreciation to date ............................................................. (5,235.0) (4,781.3) (4,484.9)
Net block1 ............................................................................. 31,940.1 18,341.0 19,467.5
II. Other fixed assets (including furniture and fixtures)At cost at March 31 of preceding year ................................ 30,468.3 32,575.6 32,575.5Additions during the period/year2 ......................................... 4,446.6 1,599.7 581.1Deductions during the period/year ........................................ (498.8) (3,707.0) (549.3)Depreciation to date ............................................................. (21,491.7) (20,216.4) (20,487.7)
Net block .............................................................................. 12,924.4 10,251.9 12,119.6
III. Assets given on leaseAt cost at March 31 of preceding year ................................ 17,550.5 17,751.2 17,751.2Additions during the period/year........................................... — — —Deductions during the period/year ........................................ (3.7) (200.7) —Depreciation to date, accumulated lease adjustment and
provisions ......................................................................... (14,603.0) (14,016.5) (13,822.6)
Net block ............................................................................... 2,943.8 3,534.0 3,928.6
TOTAL FIXED ASSETS................................................................ 47,808.3 32,126.9 35,515.7
1. Includes assets amounting to Nil (March 31, 2010: 446.1 million; September 2009: Nil) which are in the process of being sold.
2. Includes assets acquired from erstwhile The Bank of Rajasthan Limited.
At 30.09.2010 At 31.03.2010 At 30.09.2009
in millionSCHEDULE 11 - OTHER ASSETSI. Inter-office adjustments (net) ................................................ 788.1 — —II. Interest accrued ..................................................................... 37,371.6 32,528.4 37,790.7III. Tax paid in advance/tax deducted at source (net)................. 34,925.1 37,793.2 37,846.2IV. Stationery and stamps ........................................................... 125.8 0.6 0.7V. Non-banking assets acquired in satisfaction of claims1 ....... 796.2 675.0 2,307.1VI. Others
a) Advance for capital assets............................................ 2,226.1 11,744.5 10,318.1b) Outstanding fees and other income.............................. 8,030.3 5,983.7 4,521.3c) Deposits ........................................................................ 13,898.8 17,976.9 23,196.0d) Deferred tax asset (net) ................................................ 24,698.0 20,756.7 19,393.4e) Others ........................................................................... 76,071.3 64,690.3 91,935.8
TOTAL OTHER ASSETS .............................................................. 198,931.3 192,149.3 227,309.3
1. Includes certain non-banking assets acquired in satisfaction of claims which are in the process of being transferred in the Bank’sname.
F-14

Schedules forming part of the balance sheet
At 30.09.2010 At 31.03.2010 At 30.09.2009
in million
SCHEDULE 12 - CONTINGENT LIABILITIESI. Claims against the Bank not acknowledged as debts ........... 31,568.5 33,568.3 32,424.0II. Liability for partly paid investments..................................... 128.1 128.1 128.1III. Liability on account of outstanding forward exchange
contracts................................................................................. 2,175,480.9 1,660,687.2 1,875,350.6IV. Guarantees given on behalf of constituents
a) In India ......................................................................... 561,840.9 489,280.8 454,124.8b) Outside India ................................................................ 143,265.1 129,084.6 133,257.1
V. Acceptances, endorsements and other obligations ................ 332,500.4 321,224.1 310,233.8VI. Currency swaps ..................................................................... 491,517.2 524,786.1 601,490.9VII. Interest rate swaps, currency options and interest rate
futures.................................................................................... 4,656,320.4 4,012,141.2 3,861,416.1VIII. Other items for which the Bank is contingently liable ......... 75,839.8 99,940.2 126,626.7
TOTAL CONTINGENT LIABILITIES .......................................... 8,468,461.3 7,270,840.6 7,395,052.1
Schedules forming part of the profit and loss account
For the period
ended
30.09.2010
Year ended
31.03.2010
For the period
ended
30.09.2009
in million
SCHEDULE 13 - INTEREST EARNEDI. Interest/discount on advances/bills ........................................ 77,277.0 173,727.3 95,795.9II. Income on investments1 ........................................................ 35,746.8 64,663.5 32,040.9III. Interest on balances with Reserve Bank of India and other
inter-bank funds..................................................................... 1,803.6 6,249.9 3,864.0IV. Others2, 3................................................................................ 6,389.0 12,428.6 6,203.0
TOTAL INTEREST EARNED ....................................................... 121,216.4 257,069.3 137,903.8
1. Includes amortisation of premium on Government securities 3,805.9 million (March 31, 2010: 8,121.5 million, September30, 2009: 3,463.2 million).
2. Includes interest on income tax refunds amounting to 841.3 million (March 31, 2010: 1,208.3 milion, September 30, 2009:722.3 million).
3. Includes interest and amortisation of premium on non-trading interest rate swaps and foreign currency swaps.
F-15

Schedules forming part of the profit and loss account
For the period
ended
30.09.2010
Year ended
31.03.2010
For the period
ended
30.09.2009
in million
SCHEDULE 14 - OTHER INCOMEI. Commission, exchange and brokerage ................................. 26,040.9 48,308.1 23,170.0II. Profit/(loss) on sale of investments (net) .............................. 1,086.9 5,464.2 3,555.0III. Profit/(loss) on revaluation of investments (net)................... (1,458.8) 1,852.2 2,630.3IV. Profit/(loss) on sale of land, buildings and other assets
(net)1...................................................................................... 445.0 1,345.2 525.0V. Profit/(loss) on exchange transactions (net) .......................... 3,889.7 11,060.5 6,445.7VI. Income earned by way of dividends, etc. from subsidiary
companies and/or joint ventures abroad/in India .................. 2,049.7 3,692.7 1,546.8VII. Miscellaneous income (including lease income) ................. 531.0 3,053.6 1,263.9
TOTAL OTHER INCOME............................................................. 32,584.4 74,776.5 39,136.7
1. Includes profit/(loss) on sale of assets given on lease.
For the period
ended
30.09.2010
Year ended
31.03.2010
For the period
ended
30.09.2009
in million
SCHEDULE 15 - INTEREST EXPENDEDI. Interest on deposits................................................................ 47,295.3 115,134.7 66,353.8II. Interest on Reserve Bank of India/inter-bank borrowings1... 5,481.5 11,951.3 6,951.4III. Others (including interest on borrowings of erstwhile
ICICI Limited) ..................................................................... 26,485.3 48,839.7 24,385.3
TOTAL INTEREST EXPENDED .................................................. 79,262.1 175,925.7 97,690.5
For the period
ended
30.09.2010
Year ended
31.03.2010
For the period
ended
30.09.2009
in million
SCHEDULE 16 - OPERATING EXPENSESI. Payments to and provisions for employees........................... 11,998.5 19,257.9 9,160.7II. Rent, taxes and lighting ........................................................ 3,347.3 5,924.3 2,936.6III. Printing and stationery .......................................................... 453.8 916.0 474.4IV. Advertisement and publicity.................................................. 643.8 1,108.0 399.0V. Depreciation on Bank’s property ......................................... 2,344.4 4,778.5 2,547.4VI. Depreciation (including lease equalisation) on leased assets 564.0 1,416.5 980.9VII. Directors’ fees, allowances and expenses ............................. 2.8 4.2 2.2VIII. Auditors’ fees and expenses .................................................. 11.3 22.5 11.2IX. Law charges........................................................................... 348.0 987.4 405.3X. Postages, telegrams, telephones, etc...................................... 765.7 2,007.7 1,153.0XI. Repairs and maintenance ..................................................... 2,271.4 4,724.6 2,310.2XII. Insurance ............................................................................... 999.4 2,005.6 1,031.2XIII. Direct marketing agency expenses ....................................... 712.9 1,254.8 484.0XIV. Other expenditure ................................................................. 6,075.3 14,190.3 7,809.4
TOTAL OPERATING EXPENSES ................................................ 30,538.6 58,598.3 29,705.5
F-16

Schedules forming part of the profit and loss account
For the period
ended
30.09.2010
Year ended
31.03.2010
For the period
ended
30.09.2009
in million
SCHEDULE 17 - PROVISIONS AND CONTINGENCIESI. Income tax
- Current period tax............................................................... 10,087.0 15,977.8 7,938.4- Deferred tax adjustment...................................................... (3,114.0) (2,804.4) (1,441.9)- Fringe benefit tax................................................................ — — —
II. Wealth tax.............................................................................. 15.0 30.0 15.0
TOTAL TAXES .............................................................................. 6,988.0 13,203.4 6,511.5III. Provision for investments (net) ............................................. 359.7 (26.5) (388.4)IV. Provision for advances (net)1 ................................................ 13,605.9 43,621.6 24,075.4V. Others .................................................................................... 424.0 273.5 262.5
TOTAL PROVISIONS AND CONTINGENCIES.......................... 21,377.6 57,072.0 30,461.0
1. Includes provisions on standard assets, non-performing advances, non-performing leased assets and others.
F-17

SCHEDULE 18SIGNIFICANT ACCOUNTING POLICIES
OVERVIEW
ICICI Bank Limited (ICICI Bank or the Bank), incorporated in Vadodara, India is a publicly heldbanking company engaged in providing a wide range of banking and financial services including commercialbanking and treasury operations. ICICI Bank is governed by the Banking Regulation Act, 1949.
Basis of preparation
The financial statements have been prepared in accordance with requirements prescribed under the ThirdSchedule of the Banking Regulation Act, 1949. The accounting and reporting policies of ICICI Bank used inthe preparation of these financial statements conform to Generally Accepted Accounting Principles in India(Indian GAAP), the guidelines issued by Reserve Bank of India (RBI) from time to time, the AccountingStandards (AS) issued by the Institute of Chartered Accountants of India (ICAI) and notified by the Companies(Accounting Standards) Rules, 2006 to the extent applicable and practices generally prevalent in the bankingindustry in India. The Bank follows the historical cost convention and the accrual method of accounting,except in the case of interest income on non-performing assets (NPAs) where it is recognised upon realisation.
The preparation of financial statements requires the management to make estimates and assumptionsconsidered in the reported amounts of assets and liabilities (including contingent liabilities) at the date of thefinancial statements and the reported income and expenses during the reporting period. Management believesthat the estimates used in the preparation of the financial statements are prudent and reasonable. Future resultscould differ from these estimates.
These financial statements have been prepared in accordance with AS 25 - Interim Financial Reportingissued by ICAI.
SIGNIFICANT ACCOUNTING POLICIES
There has been no significant change in the significant accounting policies during the half year endedSeptember 30, 2010 as compared to those followed in the previous year.
F-18

SCHEDULE 19NOTES FORMING PART OF THE ACCOUNTS
The following additional disclosures have been made taking into account the requirements of accountingstandards and Reserve Bank of India (RBI) guidelines in this regard.
1. Amalgamation of The Bank of Rajasthan Limited
The Bank of Rajasthan Limited (Bank of Rajasthan), a banking company incorporated under theCompanies Act, 1956 and licensed by RBI under the Banking Regulation Act, 1949 was amalgamated withICICI Bank Limited (ICICI Bank) with effect from close of business of August 12, 2010 in terms of theScheme of Amalgamation (the Scheme) approved by the Reserve Bank of India vide its order DBOD No.PSBD 2603/16.01.128/2010-11 dated August 12, 2010 under sub section (4) of section 44A of the BankingRegulation Act, 1949. The consideration for the amalgamation was 25 equity shares of ICICI Bank of the facevalue of 10/- each fully paid-up for every 118 equity shares of 10/- each of Bank of Rajasthan.Accordingly, on August 26, 2010, ICICI Bank allotted 31,323,951 equity shares to the shareholders of Bankof Rajasthan and 2,860,170 equity shares have been kept in abeyance pending civil appeal.
ICICI Bank is also a banking company incorporated under the Companies Act, 1956 and licensed by RBIunder the Banking Regulation Act, 1949.
As per the Scheme, the undertaking of Bank of Rajasthan including all its assets and liabilities stoodtransferred/deemed to be transferred to and vested in ICICI Bank as a going concern.
The amalgamation has been accounted for as per the Scheme. Accordingly the assets and liabilities ofBank of Rajasthan have been accounted at the values at which they were appearing in the books of Bank ofRajasthan at August 12, 2010 and provisions were made for the difference between the book values appearingin the books of Bank of Rajasthan and the fair value as determined by ICICI Bank.
In the books of ICICI Bank, an amalgamation expenses provision account was credited by an amountdetermined for the expenses and costs of the Scheme arising as a direct consequence on account of anychanges in the business or operations of Bank of Rajasthan proposed or considered necessary by the Board ofDirectors of ICICI Bank (including but not limited to rationalisation, upgradation and enhancement of humanresources and expenses relating to modifying signage, modifying stationery, branding, changing systems andnetwork, communication including media costs, impairment of technology and fixed assets, conductinggeneral meetings, payment of listing fees and other statutory and regulatory charges, travel in relation to theconsolidation contemplated in the Scheme, valuation, due diligence, investment banking expenses and chargesrelating to preparation of the Scheme, consultations in relation to the consolidation contemplated in theScheme and training), and other extraordinary expenses on integration and consolidation under the Scheme,to be incurred by ICICI Bank and the balance in such account has been debited to the securities premiumaccount.
Accordingly, the excess of the paid up value of shares issued over the fair value of the net asset acquired(including Statutory Reserves) of 1,490.9 million and amalgamation expenses of 690.0 million have beendebited to the securities premium account. The computation of this amount is detailed in the table below:
Particulars Amount Amount
in million31,323,951 equity shares of face value of 10/- each.................................................................. 313.2
2,860,170 equity shares of face value 10/- each kept in abeyance pending civil appeal .......... 28.6 341.8
Less:
Net assets of Bank of Rajasthan at August 12, 2010 ..................................................................... 3,557.2
Fair value adjustments .................................................................................................................... (2,703.6)
Reserves taken over on amalgamation............................................................................................ (2,002.7)
Total fair value of the net assets acquired (including Statutory Reserves) of Bank of Rajasthanat August 12, 2010 ..................................................................................................................... (1,149.1)
Excess of paid-up value of equity shares issued over the fair value of the net assets acquired ... 1,490.9
Amalgamation expenses .................................................................................................................. 690.0
F-19

As per the accounting done for amalgamation in terms of the Scheme, the identity of reserves of Bankof Rajasthan is not required to be preserved in the books of ICICI Bank. However, the balance in StatutoryReserve Account of Bank of Rajasthan at August 12, 2010 has been added to the Statutory Reserves of ICICIBank. As a result, the balance in Statutory Reserve is higher to the extent of 2,002.7 million. The excess ofthe paid up value of shares issued over the fair value of the net asset acquired (including Statutory Reserves)and amalgamation expenses has been debited to the Securities Premium account of ICICI Bank. As a result,the balance in Securities Premium is lower to the extent of 2,180.9 million.
2. Capital adequacy ratio
The Bank is subject to the capital adequacy norms stipulated by the RBI guidelines on Basel II whichbecame applicable with effect from March 31, 2008. The guidelines require the Bank to maintain a minimumratio of total capital to risk adjusted assets (CRAR) of 9.0%, with a minimum Tier I capital ratio of 6.0%. Priorto March 31, 2008, the Bank was subject to the capital adequacy norms as stipulated by the RBI guidelineson Basel I.
RBI has stipulated that the minimum capital maintained by banks on adoption of the Basel II frameworkshall be subject to a prudential floor, which shall be higher of the minimum capital required as per Basel IIor a specified percentage of the minimum capital required as per Basel I (80% at September 30, 2010). Thecomputation under Basel II guidelines results in a higher minimum capital requirement as compared to BaselI and hence the capital adequacy at September 30, 2010 has been maintained and reported by the Bank as perBasel II guidelines.
The following table sets forth, for the periods indicated, computation of capital adequacy requirements.
As per Basel I framework As per Basel II framework
At
September
30, 2010
At March
31, 2010
At
September
30, 2009
At
September
30, 2010
At March
31, 2010
At
September
30, 2009
in million
Tier I capital ................................... 454,518.3 432,614.3 437,821.1 436,547.1 410,615.1 431,416.9(Of which Lower Tier I).................. 28,226.2 28,210.0 29,289.5 28,226.2 28,210.0 29,289.5Tier II capital .................................. 221,023.5 181,569.1 148,076.2 204,021.2 160,409.9 141,672.0(Of which Upper Tier II) ................ 138,554.5 137,912.0 116,996.5 138,554.5 137,912.0 116,996.5Total capital .................................... 675,541.8 614,183.4 585,897.3 640,568.3 571,025.0 573,088.9Total risk weighted assets ............... 3,515,711.3 3,208,425.4 3,254,756.3 3,166,803.7 2,941,805.8 3,240,321.9CRAR (%)....................................... 19.21% 19.14% 18.00% 20.23% 19.41% 17.69%CRAR — Tier I capital (%) ........... 12.93% 13.48% 13.45% 13.79% 13.96% 13.32%CRAR — Tier II capital (%) .......... 6.28% 5.66% 4.55% 6.44% 5.45% 4.37%Amount raised by issue of
Innovative Perpetual DebtInstruments (IPDI) during theperiod/year................................... — — — — — —
Amount of subordinated debtraised as Tier I capital/Tier IIcapital during the period /year .... 39,790.0 62,000.0 25,000.0 39,790.0 62,000.0 25,000.0
F-20
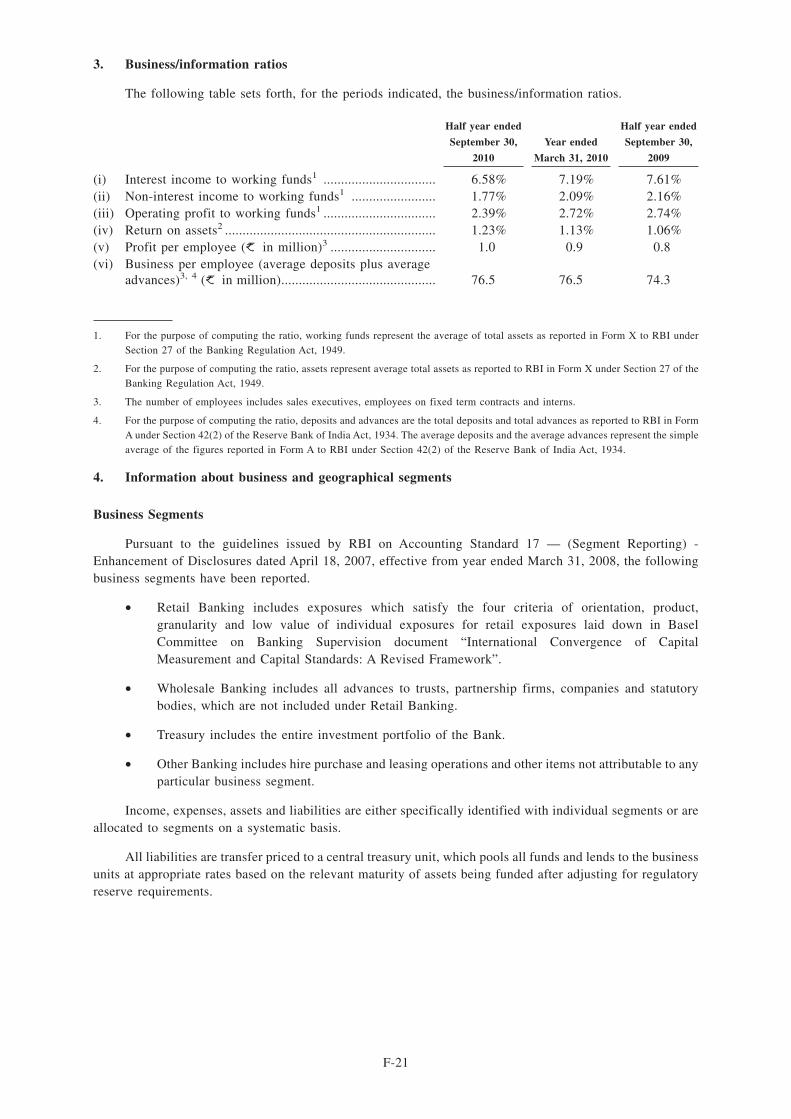
3. Business/information ratios
The following table sets forth, for the periods indicated, the business/information ratios.
Half year ended
September 30,
2010
Year ended
March 31, 2010
Half year ended
September 30,
2009
(i) Interest income to working funds1 ................................ 6.58% 7.19% 7.61%(ii) Non-interest income to working funds1 ........................ 1.77% 2.09% 2.16%(iii) Operating profit to working funds1 ................................ 2.39% 2.72% 2.74%(iv) Return on assets2 ............................................................ 1.23% 1.13% 1.06%(v) Profit per employee ( in million)3 .............................. 1.0 0.9 0.8(vi) Business per employee (average deposits plus average
advances)3, 4 ( in million)............................................ 76.5 76.5 74.3
1. For the purpose of computing the ratio, working funds represent the average of total assets as reported in Form X to RBI underSection 27 of the Banking Regulation Act, 1949.
2. For the purpose of computing the ratio, assets represent average total assets as reported to RBI in Form X under Section 27 of theBanking Regulation Act, 1949.
3. The number of employees includes sales executives, employees on fixed term contracts and interns.
4. For the purpose of computing the ratio, deposits and advances are the total deposits and total advances as reported to RBI in FormA under Section 42(2) of the Reserve Bank of India Act, 1934. The average deposits and the average advances represent the simpleaverage of the figures reported in Form A to RBI under Section 42(2) of the Reserve Bank of India Act, 1934.
4. Information about business and geographical segments
Business Segments
Pursuant to the guidelines issued by RBI on Accounting Standard 17 — (Segment Reporting) -Enhancement of Disclosures dated April 18, 2007, effective from year ended March 31, 2008, the followingbusiness segments have been reported.
• Retail Banking includes exposures which satisfy the four criteria of orientation, product,granularity and low value of individual exposures for retail exposures laid down in BaselCommittee on Banking Supervision document “International Convergence of CapitalMeasurement and Capital Standards: A Revised Framework”.
• Wholesale Banking includes all advances to trusts, partnership firms, companies and statutorybodies, which are not included under Retail Banking.
• Treasury includes the entire investment portfolio of the Bank.
• Other Banking includes hire purchase and leasing operations and other items not attributable to anyparticular business segment.
Income, expenses, assets and liabilities are either specifically identified with individual segments or areallocated to segments on a systematic basis.
All liabilities are transfer priced to a central treasury unit, which pools all funds and lends to the businessunits at appropriate rates based on the relevant maturity of assets being funded after adjusting for regulatoryreserve requirements.
F-21

The following tables set forth, for the periods indicated, the business segment results on this basis.
Half year ended September 30, 2010
Particulars Retail Banking
Wholesale
Banking Treasury
Other Banking
Business Total
in million
1 Revenue.................................... 77,715.6 88,400.7 111,161.4 2,044.8 279,322.52 Less: Inter-segment revenue..... 125,521.73 Total revenue (1) - (2) ............. 153,800.84 Segment results ........................ (3,340.7) 21,405.2 10,871.2 674.8 29,610.55 Unallocated expenses ............... —6 Income tax expenses (net of
deferred tax credit)................... 6,988.07 Net Profit (4) - (5) - (6)........... 22,622.58 Segment assets ......................... 669,179.8 1,380,770.3 1,776,646.7 12,406.4 3,839,003.29 Unallocated assets1................... 60,976.810 Total assets (8) + (9)................ 3,899,980.011 Segment liabilities .................. 1,390,899.7 929,083.5 1,573,117.12 5,159.0 3,898,259.312 Unallocated liabilities............... 1,720.713 Total liabilities (11) + (12) ...... 3,899,980.014 Capital expenditure .................. 9,928.2 8,813.4 165.7 117.6 19,025.015 Depreciation ............................. 1,697.8 628.1 1.5 580.9 2,908.4
1. Includes tax paid in advance/tax deducted at source (net) and deferred tax asset (net).
2. Includes share capital and reserves and surplus.
For the year ended March 31, 2010
Particulars Retail BankingWholesaleBanking Treasury
Other BankingBusiness Total
in million1 Revenue.................................... 177,244.1 192,541.3 247,978.0 4,375.7 622,139.12 Less: Inter-segment revenue..... 290,293.33 Total revenue (1) - (2) ............. 331,845.84 Segment results ........................ (13,335.1) 36,451.0 27,886.4 2,450.9 53,453.25 Unallocated expenses ............... —6 Income tax expenses (net of
deferred tax credit)................... 13,203.47 Net profit (4) - (5) - (6) ........... 40,249.88 Segment assets ......................... 737,339.9 1,184,314.3 1,642,098.9 10,676.8 3,574,429.99 Unallocated assets1................... 59,567.310 Total assets (8) + (9)................ 3,633,997.211 Segment liabilities .................. 1,186,393.0 915,021.2 1,525,898.62 5,970.5 3,633,283.312 Unallocated liabilities............... 713.913 Total liabilities (11) + (12) ...... 3,633,997.214 Capital expenditure .................. 1,721.0 635.8 2.9 17.6 2,377.315 Depreciation ............................. 3,749.0 996.4 16.3 1,433.3 6,195.0
1. Includes tax paid in advance/tax deducted at source (net) and deferred tax asset (net).
2. Includes share capital and reserves and surplus.
F-22

Half year ended September 30, 2009
Particulars Retail BankingWholesaleBanking Treasury
Other BankingBusiness Total
in million1 Revenue.................................... 94,332.6 106,351.6 137,670.1 2,391.2 340,745.52 Less: Inter-segment revenue ... 163,705.03 Total revenue (1) - (2) ............. 177,040.54 Segment results ........................ (7,592.2) 15,256.3 16,977.0 1,053.9 25,695.05 Unallocated expenses ............... —6 Income tax expenses (net of
deferred tax credit)................... 6,511.57 Net profit (4) - (5) - (6) ........... 19,183.58 Segment assets ......................... 795,186.6 1,243,075.1 1,553,419.8 11,852.3 3,603,533.89 Unallocated assets1................... 60,207.610 Total assets (8) + (9)................ 3,663,741.411 Segment liabilities .................. 1,155,459.9 915,800.5 1,580,798.32 5,786.7 3,657,845.412 Unallocated liabilities............... 5,896.013 Total liabilities (11) + (12) ...... 3,663,741.414 Capital expenditure .................. 693.8 352.4 1.1 12.0 1,059.315 Depreciation ............................. 1,868.9 659.5 2.2 997.7 3,528.3
1. Includes tax paid in advance/tax deducted at source (net) and deferred tax asset (net).2. Includes share capital and reserves and surplus.
Geographical segments
The Bank reports its operations under the following geographical segments.
• Domestic operations comprise branches in India
• Foreign operations comprise branches outside India and offshore banking unit in India.
The following tables set forth, for the periods indicated, geographical segmental results.
Revenue
Half year ended
September 30,
2010
Year ended
March 31,
2010
Half year ended
September 30,
2009
in million
Domestic operations ................................................................ 136,475.9 287,247.7 149,474.5Foreign operations ................................................................... 17,324.9 44,598.1 27,566.0
Total ......................................................................................... 153,800.8 331,845.8 177,040.5
Assets
At September
30, 2010
At March 31,
2010
At September
30, 2009
in million
Domestic operations ................................................................ 3,210,869.4 2,963,616.4 2,930,045.5Foreign operations ................................................................... 629,832.9 611,827.7 676,937.3
Total ......................................................................................... 3,840,702.3 3,575,444.1 3,606,982.8
Capital expenditure incurred during Depreciation provided during
Half year
ended
September 30,
2010
Year ended
March 31,
2010
Half year
ended
September 30,
2009
Half year
ended
September 30,
2010
Year ended
March 31,
2010
Half year
ended
September 30,
2009
in million
Domestic operations ... 19,016.0 2,341.0 1,049.2 2,891.4 6,147.6 3,502.5Foreign operations ...... 9.0 36.3 10.1 17.0 47.4 25.8
Total ............................ 19,024.9 2,377.3 1,059.3 2,908.4 6,195.0 3,528.3
F-23

5. Earnings per share
Basic and diluted earnings per equity share are computed in accordance with AS 20 — Earnings pershare. Basic earnings per share is computed by dividing net profit after tax by the weighted average numberof equity shares outstanding during the period/year. The diluted earnings per equity share is computed usingthe weighted average number of equity shares and dilutive potential equity shares outstanding during theperiod/year.
The following table sets forth, for the periods indicated, the computation of earnings per share.
Half year ended
September 30,
2010
Year ended
March 31,
2010
Half year ended
September 30,
2009
in million, except per share data
BasicWeighted average no. of equity shares outstanding ................ 1,124,662,336 1,113,737,557 1,113,328,392Net profit ................................................................................. 22,622.5 40,249.8 19,183.5Basic earnings per share ( ) (not annualised) ....................... 20.11 36.14 17.23DilutedWeighted average no. of equity shares outstanding ................ 1,129,269,688 1,118,224,665 1,117,148,017Net profit ................................................................................. 22,622.5 40,249.8 19,183.5Diluted earnings per share ( ) (not annualised) .................... 20.03 35.99 17.17Nominal value per share ( ) .................................................. 10.00 10.00 10.00
The dilutive impact is due to options granted to employees by the Bank.
6. Maturity pattern
• In compiling the information of maturity pattern, certain estimates and assumptions have beenmade by the management.
• Assets and liabilities in foreign currency exclude off-balance sheet assets and liabilities.
a) The following table sets forth, the maturity pattern of assets and liabilities of the Bank at September 30,2010.
Maturity buckets
Loans &
Advances 2
Investment
securities 2 Deposits 2 Borrowings2,3
Total foreign
currency
assets
Total foreign
currency
liabilities
in million
Day 11 ...................................... 8,618.4 156,391.3 55,028.1 6,656.0 60,309.5 25,650.02 to 7 days1 .............................. 14,013.5 14,870.1 65,429.0 1,709.2 13,536.2 3,631.18 to 14 days1 ............................ 15,963.8 20,434.0 51,604.5 4,131.3 10,149.8 6,362.115 to 28 days ........................... 28,225.7 86,230.5 64,718.3 7,158.8 13,815.5 13,102.229 days to 3 months................. 114,463.4 92,814.6 244,888.6 77,087.2 29,101.6 86,829.63 to 6 months ........................... 201,616.8 61,393.6 195,214.8 73,080.5 25,917.8 68,109.16 months to 1 year ................... 247,953.5 114,778.5 320,306.0 93,560.2 63,568.3 71,696.41 to 3 years .............................. 781,068.6 350,225.7 1,160,454.1 282,159.8 223,002.7 251,552.73 to 5 years .............................. 292,059.3 72,062.9 31,044.4 66,011.9 100,296.9 56,913.5Above 5 years .......................... 238,024.2 393,553.8 42,253.5 358,542.6 152,599.9 109,050.8
Total ......................................... 1,942,007.2 1,362,755.1 2,230,941.2 970,097.5 692,298.2 692,897.5
1. The aforesaid disclosure is in accordance with the revised maturity buckets as per the RBI circular no.DBOD.BP.BC.22/21.04.018/2009-10 dated July 1, 2009.
2. Includes foreign currency balances.
3. Includes borrowings in the nature of subordinated debts and preference shares as per RBI guidelines vide circular no.DBOD.BP.BC no. 81/21.01.002/2009-10. Includes borrowings in the nature of sub-ordinated debts.
F-24

b) The following table sets forth the maturity pattern of assets and liabilities of the Bank at March 31, 2010.
Maturity buckets
Loans &
Advances 2
Investment
securities 2 Deposits 2 Borrowings2,3
Total foreign
currency
assets
Total foreign
currency
liabilities
in million
Day 11 ...................................... 5,611.1 157,239.2 32,042.0 391.9 35,810.8 18,545.82 to 7 days1 .............................. 14,761.9 12,256.1 59,269.5 1,306.2 8,507.6 6,922.28 to 14 days1 ............................ 11,134.4 12,895.5 96,406.6 11,072.9 9,116.6 12,425.415 to 28 days ........................... 20,104.7 74,070.6 50,419.0 11,213.4 17,080.5 18,698.529 days to 3 months................. 131,799.4 98,926.0 265,944.0 80,480.7 38,366.8 78,145.43 to 6 months ........................... 148,751.8 71,931.7 188,743.9 74,597.9 26,502.9 85,551.56 months to 1 year ................... 248,066.9 97,333.9 276,686.1 76,724.4 39,432.1 69,197.51 to 3 years .............................. 713,445.1 295,899.3 1,030,992.7 302,987.4 218,294.1 223,871.93 to 5 years .............................. 292,216.2 39,413.6 15,503.1 88,361.1 106,911.0 85,270.9Above 5 years .......................... 226,164.5 348,962.1 4,159.1 295,499.8 153,711.3 82,846.3
Total ......................................... 1,812,056.0 1,208,928.0 2,020,166.0 942,635.7 653,733.7 681,475.4
1. The aforesaid disclosure is in accordance with the revised maturity buckets as per the RBI circular no. DBOD.BP.BCno.22/21.04.018/2009-10 dated July 1, 2009.
2. Includes foreign currency balances.
3. Includes borrowings in the nature of subordinated debt and preference shares as per RBI guidelines vide circular no. DBOD.BP.BCno. 81/21.01.002/2009-10.
c) The following table sets forth, the maturity pattern of assets and liabilities of the Bank at September 30,2009.
Maturity buckets
Loans &
Advances 2
Investment
securities 2 Deposits 2 Borrowings2,3
Total foreign
currency
assets
Total foreign
currency
liabilities
in million
Day 11 ...................................... 7,758.7 288,989.0 39,349.9 122,180.5 40,988.3 13,158.32 to 7 days1 .............................. 15,884.5 1,788.2 66,678.4 488.5 7,903.3 9,347.48 to 14 days1 ............................ 14,759.8 2,167.4 46,715.6 2,176.6 6,128.2 11,722.915 to 28 days ........................... 20,854.3 52,578.7 84,478.3 5,979.4 10,738.0 7,884.229 days to 3 months................. 121,975.5 69,788.5 215,839.0 40,760.4 25,895.6 68,048.73 to 6 months ........................... 169,177.6 70,899.5 316,678.0 71,651.3 24,694.6 85,943.86 months to 1 year ................... 223,859.9 108,319.3 301,306.8 118,126.5 37,157.7 114,476.81 to 3 years .............................. 672,399.4 275,522.2 887,992.0 179,268.1 185,578.0 164,011.73 to 5 years .............................. 377,043.2 19,310.3 17,526.5 137,856.4 181,671.5 141,097.9Above 5 years .......................... 284,888.9 310,285.1 1,956.0 43,751.4 190,291.5 112,172.0
Total ......................................... 1,908,601.8 1,199,648.2 1,978,320.5 722,239.1 711,046.7 727,863.7
1. The aforesaid disclosure is in accordance with the revised maturity buckets as per the RBI circularno.DBOD.BP.BC.22/21.04.018/2009-10 dated July 1, 2009.
2. Includes foreign currency balances.
3. Excludes borrowings in the nature of sub-ordinated debt.
7. Related party transactions
The Bank has transactions with its related parties comprising subsidiaries, associates/joint ventures/otherrelated entities, key management personnel and relatives of key management personnel.
F-25

Subsidiaries
ICICI Bank UK PLC, ICICI Bank Canada, ICICI Bank Eurasia Limited Liability Company, ICICIPrudential Life Insurance Company Limited1, ICICI Lombard General Insurance Company Limited1, ICICIPrudential Asset Management Company Limited1, ICICI Securities Limited, ICICI Securities PrimaryDealership Limited, ICICI Home Finance Company Limited, ICICI Venture Funds Management CompanyLimited, ICICI International Limited, ICICI Trusteeship Services Limited, ICICI Investment ManagementCompany Limited, ICICI Securities Holdings Inc., ICICI Securities Inc., ICICI Prudential Trust Limited1,ICICI Wealth Management Inc. (upto December 31, 2009) and ICICI Prudential Pension Funds ManagementCompany Limited.
1. Jointly controlled entities.
Associates/joint ventures/other related entities
ICICI Equity Fund1, ICICI Eco-net Internet and Technology Fund1, ICICI Emerging Sectors Fund1,ICICI Strategic Investments Fund1, ICICI Kinfra Limited1, ICICI West Bengal Infrastructure DevelopmentCorporation Limited1, Financial Inclusion Network & Operations Limited (earlier known as FinancialInformation Network and Operations Limited), TCW/ICICI Investment Partners LLC, I-Process Services(India) Private Limited, I-Solutions Providers (India) Private Limited, NIIT Institute of Finance, Banking andInsurance Training Limited, ICICI Venture Value Fund1, Comm Trade Services Limited, Loyalty Solutions &Research Limited1 (upto March 31, 2010), Transafe Services Limited1 (upto September 30, 2009), PrizePetroleum Company Limited, ICICI Foundation for Inclusive Growth, Firstsource Solutions Limited (uptoDecember 31, 2009), I-Ven Biotech Limited1, Rainbow Fund, ICICI Merchant Services Private Limited2 andMewar Aanchalik Gramin Bank3.
1. Entities consolidated as per Accounting Standard (AS) 21 on ‘consolidated financial statements’.
2. With respect to an entity, which has been identified as a related party during the quarter ended December 31, 2009, previousperiod’s comparative figures have not been reported.
3. With respect to an entity, which has been identified as a related party during the quarter ended September 30, 2010, previousperiod’s comparative figures have not been reported.
Key management personnel
Mr. K. V. Kamath1, Ms. Chanda D. Kochhar, Mr. Sandeep Bakhshi2, Mr. N. S. Kannan3, Mr. K.Ramkumar, Mr. Rajiv Sabharwal4, Mr. Sonjoy Chatterjee5, Mr. V. Vaidyanathan1.
Relatives of key management personnel
Ms. Rajalakshmi Kamath1, Mr. Ajay Kamath1, Ms. Ajnya Pai1, Mr. Mohan Kamath1, Mr. DeepakKochhar, Mr. Arjun Kochhar, Ms. Aarti Kochhar, Mr. Mahesh Advani, Ms. Varuna Karna, Ms. Sunita R.Advani, Ms. Mona Bakhshi2, Mr. Sameer Bakhshi2, Ms. Rangarajan Kumudalakshmi3, Ms. Aditi Kannan3, Mr.Narayanan Raghunathan3, Mr. Narayanan Rangarajan3, Mr. Narayanan Krishnamachari3, Ms. NarayananSudha3, Mr. R. Shyam, Ms. R. Suchithra, Mr. K. Jayakumar, Ms. J. Krishnaswamy, Ms. Sangeeta Sabharwal4,Ms. Ameeta Chatterjee5, Mr. Somnath Chatterjee5, Mr. Tarak Nath Chatterjee5, Ms. Sunaina Chatterjee5, Ms.Nandini Chatterjee5, Ms. Jeyashree V.1, Mr. V. Satyamurthy1, Mr. V. Krishnamurthy1, Mr. K. Vembu1.
1. Transactions reported upto April 30, 2009.
2. Transactions reported with effect from May 1, 2009 upto July 31, 2010.
3. Transactions reported with effect from May 1, 2009.
4. Transactions reported with effect from June 24, 2010.
5. Transactions reported upto April 30, 2010.
The following were the significant transactions between the Bank and its related parties for the half yearended September 30, 2010. A specific related party transaction is disclosed as a material related partytransaction wherever it exceeds 10% of all related party transactions in that category.
F-26

Insurance services
During the half year ended September 30, 2010, the Bank paid insurance premium to insurancesubsidiaries amounting to 557.6 million (March 31, 2010: 1,162.5 million, September 30, 2009: 603.6million). The material transaction for the half year ended September 30, 2010 was payment of insurancepremium to ICICI Lombard General Insurance Company Limited amounting to 546.0 million (March 31,2010: 1,057.3 million, September 30, 2009: 603.6 million).
During the half year ended September 30, 2010, the Bank’s insurance claims from the insurancesubsidiaries amounted to 471.0 million (March 31, 2010: 876.1 million, September 30, 2009: 448.7million). The material transaction for the half year ended September 30, 2010 was with ICICI LombardGeneral Insurance Company Limited amounting to 458.0 million (March 31, 2010: 823.0 million,September 30, 2009: 422.7 million).
Fees and commission
During the half year ended September 30, 2010, the Bank received fees from its subsidiaries amountingto 1,381.6 million (March 31, 2010: 3,793.9 million, September 30, 2009: 2,048.5 million), from itsassociates/joint ventures/other related entities amounting to 0.4 million (March 31, 2010: 5.3 million,September 30, 2009: 2.5 million), from key management personnel amounting to Nil (March 31, 2010: 0.2million, September 30, 2009: 0.2 million) and from relatives of key management personnel amounting toNil (March 31, 2010: 0.1 million, September 30, 2009: Nil). The material transactions for the half yearended September 30, 2010 were with ICICI Prudential Life Insurance Company Limited amounting to
1,006.9 million (March 31, 2010: 2,708.9 million, September 30, 2009: 1,419.2 million), ICICILombard General Insurance Company Limited amounting to 128.7 million (March 31, 2010: 403.5million, September 30, 2009: 206.0 million) and with ICICI Securities Limited amounting to 196.0million (March 31, 2010: 437.4 million, September 30, 2009: 257.3 million).
During the half year ended September 30, 2010, the Bank received commission from its subsidiariesamounting to 2.7 million (March 31, 2010: 8.1 million, September 30, 2009: 4.8 million) and from itsassociates/joint ventures/other related entities amounting to Nil (March 31, 2010: 15.4 million, September30, 2009: 3.9 million). The material transactions for the half year ended September 30, 2010 were withICICI Bank UK PLC amounting to 1.9 million (March 31, 2010: 0.7 million, September 30, 2009: Nil),ICICI Securities Limited amounting to 0.7 million (March 31, 2010: 1.2 million, September 30, 2009:
0.6 million), ICICI Home Finance Company Limited amounting to Nil (March 31, 2010: 5.7 million,September 30, 2009: 3.9 million) and with Firstsource Solutions Limited amounting to Nil (March 31, 2010:
15.3 million, September 30, 2009: 3.8 million).
Lease of premises and facilities
During the half year ended September 30, 2010, the Bank recovered from its subsidiaries an amount of564.7 million (March 31, 2010: 1,493.9 million, September 30, 2009: 797.1 million) and from its
associates/joint ventures/other related entities an amount of 52.2 million (March 31, 2010: 34.5 million,September 30, 2009: 0.7 million) for lease of premises, facilities and other administrative costs. Thematerial transactions for the half year ended September 30, 2010 were with ICICI Home Finance CompanyLimited amounting to 125.1 million (March 31, 2010: 484.0 million, September 30, 2009: 259.7million), ICICI Securities Limited amounting to 120.4 million (March 31, 2010: 231.9 million, September30, 2009: 139.7 million), ICICI Prudential Life Insurance Company Limited amounting to 99.3 million(March 31, 2010: 203.1 million, September 30, 2009: 72.2 million), ICICI Lombard General InsuranceCompany Limited amounting to 87.4 million (March 31, 2010: 175.0 million, September 30, 2009: 76.1million) and with ICICI Bank UK PLC amounting to 64.7 million (March 31, 2010: 263.9 million,September 30, 2009: 187.2 million).
Secondment of employees
During the half year ended September 30, 2010, the Bank received compensation from its subsidiariesamounting to 17.0 million (March 31, 2010: 24.8 million, September 30, 2009: 11.7 million) and fromits associates/joint ventures/other related entities amounting to 33.0 million (March 31, 2010: 36.8million, September 30, 2009: 7.8 million) for secondment of employees. The material transactions for thehalf year ended September 30, 2010 were with ICICI Merchant Services Private Limited amounting to 24.4million (March 31, 2010: 22.5 million), ICICI Investment Management Company Limited amounting to
F-27

11.3 million (March 31, 2010: 11.9 million, September 30, 2009: 5.0 million), ICICI Securities Limitedamounting to 5.6 million (March 31, 2010: 13.0 million, September 30, 2009: 6.5 million) and withICICI West Bengal Infrastructure Development Corporation Limited amounting to 5.1 million (March 31,2010: 9.8 million, September 30, 2009: 5.4 million).
Purchase of investments
During the half year ended September 30, 2010, the Bank purchased certain investments from itssubsidiaries amounting to 1,907.5 million (March 31, 2010: 6,355.0 million, September 30, 2009:
4,897.8 million). The material transactions for the half year ended September 30, 2010 were with ICICISecurities Primary Dealership Limited amounting to 1,907.5 million (March 31, 2010: 5,414.1 million,September 30, 2009: 4,051.7 million) and with ICICI Prudential Life Insurance Company Limitedamounting to Nil (March 31, 2010: 704.7 million, September 30, 2009: 604.1 million).
During the half year ended September 30, 2010, the Bank invested in the equity shares, preference sharesand bonds of its subsidiaries amounting to Nil (March 31, 2010: 32.1 million, September 30, 2009: 32.1millon) and in its associates/joint ventures/other related entities amounting to Nil (March 31, 2010: 765.3million, September 30, 2009: Nil). The material transactions were with ICICI Merchant Services PrivateLimited amounting to Nil (March 31, 2010: 755.8 million) and with ICICI Prudential Life InsuranceCompany Limited amounting to Nil (March 31, 2010: 32.1 million, September 30, 2009: 32.1 million).
At March 31, 2010, ICICI Bank had applied for equity shares in ICICI Securites Limited, which wereallotted during half year ended September 30, 2010. The amount of application money was 1.00 billion.
Sale of investments
During the half year ended September 30, 2010, the Bank sold certain investments to its subsidiariesamounting to 7,399.9 million (March 31, 2010: 3,646.0 million, September 30, 2009: 1,052.3 million).The material transactions for the half year ended September 30, 2010 were with ICICI Securities PrimaryDealership Limited amounting to 5,852.6 million (March 31, 2010: 2,408.8 million, September 30, 2009:
528.2 million) and with ICICI Prudential Life Insurance Company Limited amounting to 1,546.2 million(March 31, 2010: 1,237.2 million, September 30, 2009: 524.1 million).
Investment in bonds and Certificate of Deposits (CDs) issued by ICICI Bank
During the half year ended September 30, 2010, subsidiaries have invested in bonds issued by the Bankamounting to Nil (March 31, 2010: 650.0 million, September 30, 2009: 500.0 million). The materialtransactions for the half year ended September 30, 2010 were with ICICI Securities Primary DealershipLimited amounting to Nil (March 31, 2010: 150.0 million, September 30, 2009: Nil) and with ICICIPrudential Life Insurance Company Limited amounting to Nil (March 31, 2010: 500.0 million, September30, 2009: 500.0 million).
During the half year ended September 30, 2010, subsidiaries have invested in CDs issued by the Bankamounting to 3,001.9 million (March 31, 2010: 11,173.9 million, September 30, 2009: 2,968.4 million).The material transactions for the half year ended September 30, 2010 were with ICICI Prudential LifeInsurance Company Limited amounting to 3,001.9 million (March 31, 2010: 8,131.2 million, September30, 2009: 468.4 million) and with ICICI Securities Primary Dealership Limited amounting to Nil (March 31,2010: 2,338.6 million, September 30, 2009: 2,500.0 million).
Redemption/buyback and conversion of investments
During the half year ended September 30, 2010, the Bank received a consideration from itsassociates/joint ventures/other related entities amounting to 1,929.3 million (March 31, 2010: 1,379.9million, September 30, 2009: 1,379.9 million) on account of redemption/buyback/ distribution of loss onunits/equity shares by associates/joint ventures/other related entities. The material transactions for the halfyear ended September 30, 2010 were with ICICI Equity Fund 1,336.9 million (March 31, 2010: Nil,September 30, 2009: Nil), ICICI Emerging Sectors Fund 389.2 million (March 31, 2010: 846.4 million,September 30, 2009: 846.4 million) and with ICICI Eco-net Internet and Technology Fund 203.2 million(March 31, 2010: 533.5 million, September 30, 2009: 533.5 million).
F-28

Reimbursement of expenses
During the half year ended September 30, 2010, the Bank reimbursed expenses to ICICI Bank Canadaamounting to Nil (March 31, 2010: 11.7 million, September 30, 2009: 10.1 million).
Brokerage and fee expenses
During the half year ended September 30, 2010, the Bank paid brokerage/fees to its subsidiariesamounting to 378.4 million (March 31, 2010: 865.5 million, September 30, 2009: 241.9 million) andto its associates/joint ventures/other related entities amounting to 490.5 million (March 31, 2010: 1,346.2million, September 30, 2009: 737.2 million). The material transactions for the half year ended September30, 2010 were with ICICI Home Finance Company Limited amounting to 267.4 million (March 31, 2010:
608.2 million, September 30, 2009: 173.2 million), ICICI Merchant Services Private Limited amountingto 312.8 million (March 31, 2010: 169.6 million), I-Process Services (India) Private Limited amountingto 169.2 million (March 31, 2010: 686.1 million, September 30, 2009: 420.4 million) and with LoyaltySolutions & Research Limited amounting to Nil (March 31, 2010: 407.0 million, September 30, 2009:
261.1 million).
Income on custodial services
During the half year ended September 30, 2010, the Bank recovered custodial charges from itssubsidiaries amounting to 0.8 million (March 31, 2010: 1.6 million, September 30, 2009: 0.9 million)and from its associates/joint ventures/other related entities amounting to 1.4 million (March 31, 2010: 3.3million, September 30, 2009: 1.6 million). The material transactions for the half year ended September 30,2010 were with ICICI Securities Primary Dealership Limited amounting to 0.7 million (March 31, 2010:
1.5 million, September 30, 2009: 0.8 million), ICICI Emerging Sectors Fund amounting to 0.5 million(March 31, 2010: 1.3 million, September 30, 2009: 0.6 million), ICICI Strategic Investments Fundamounting to 0.5 million (March 31, 2010: 1.1 million, September 30, 2009: 0.5 million) and withICICI Equity Fund amounting to 0.3 million (March 31, 2010: 0.8 million, September 30, 2009: 0.4million).
Interest expenses
During the half year ended September 30, 2010, the Bank paid interest to its subsidiaries amounting to317.5 million (March 31, 2010: 902.2 million, September 30, 2009: 443.3 million), to its
associates/joint ventures/other related entities amounting to 10.1 million (March 31, 2010: 3.3 million,September 30, 2009: 1.9 million), to its key management personnel amounting to 0.2 million (March 31,2010: 2.5 million, September 30, 2009: 0.4 million) and to relatives of key management personnelamounting to 0.2 million (March 31, 2010: 1.2 million, September 30, 2009: 0.7 million). The materialtransactions for the half year ended September 30, 2010 were with ICICI Prudential Life Insurance CompanyLimited amounting to 158.8 million (March 31, 2010: 420.4 million, September 30, 2009: 218.7million), ICICI Securities Limited amounting to 85.8 million (March 31, 2010: 159.3 million, September30, 2009: 75.3 million) and with ICICI Bank Eurasia Limited Liability Company amounting to 10.9million (March 31, 2010: 146.8 million, September 30, 2009: 62.5 million).
Interest income
During the half year ended September 30, 2010, the Bank received interest from its subsidiariesamounting to 783.3 million (March 31, 2010: 1,588.0 million, September 30, 2009: 819.7 million), fromits associates/joint ventures/other related entities amounting to 2.4 million (March 31, 2010: 2.9 million,September 30, 2009: Nil), from its key management personnel amounting to 0.2 million (March 31, 2010:
0.5 million, September 30, 2009: 0.4 million) and from relatives of key management personnel amountingto 0.3 million (March 31, 2010: 1.0 million, September 30, 2009: 0.7 million). The material transactionsfor the half year ended September 30, 2010 were with ICICI Home Finance Company Limited amounting to
564.5 million (March 31, 2010: 913.7 million, September 30, 2009: 432.3 million) and with ICICI BankEurasia Limited Liability Company amounting to 94.4 million (March 31, 2010: 351.0 million, September30, 2009: 200.4 million).
Other income
The Bank undertakes derivative transactions with its subsidiaries, associates, joint ventures and otherrelated entities. Within the overall position limits, the Bank manages its foreign exchange and interest raterisks arising from these transactions by covering the same in the market.
F-29

Upto the quarter ended June 30, 2010, the reported gain/loss on forex and derivative transactionscomprised the mark-to-market (MTM) gains/losses of the Bank on the forex and derivative transactions andthe realised gains/losses on settled cash flows of forex and derivative transactions during the period. From theperiod ended September 30, 2010, the gain/loss on forex and derivative transactions reported also includes therevaluation impact of the related matured transactions to more appropriately reflect the impact on the profitand loss account.
During the half year ended September 30, 2010, the net gain of the Bank on forex and derivativetransactions for the half year ended September 30, 2010 with subsidiaries was 1,422.6 million (March 31,2010: gain of 568.8 million, September 30, 2009: loss of 613.5 million) and with its associates/jointventures/other related entities was Nil (March 31, 2010: loss of 220.9 million, September 30, 2009: Nil). Thematerial transactions for the half year ended September 30, 2010 were gain of 1,084.3 million (March 31,2010: loss of 1,096.9 million, September 30, 2009: loss of 1,252.6 million) with ICICI Bank Canada, gainof 373.2 million (March 31, 2010: gain of 1,494.5 million, September 30, 2009: gain of 581.2 million)with ICICI Bank UK PLC, loss of 56.2 million (March 31, 2010: gain of 215.8 million, September 30,2009: gain of 77.1 million) with ICICI Home Finance Company Limited, gain of 15.0 million (March 31,2010: loss of 50.7 million, September 30, 2009: loss of 18.6 million) with ICICI Securities PrimaryDealership Limited and gain of 6.3 million (March 31, 2010: gain of 3.0 million, September 30, 2009: lossof 0.6 million) with ICICI Bank Eurasia Limited Liability Company. While the Bank within its overallposition limits covers these transactions in the market, the above amounts represents only the transactions withits subsidiaries, associates, joint ventures and other related entities and not the offsetting/covering transactions,which generally results in lower net impact on the profit and loss account.
Dividend income
During the half year ended September 30, 2010, the Bank received dividend from its subsidiariesamounting to 2,049.7 million (March 31, 2010: 3,692.7 million, September 30, 2009: 1,546.8 million).The material transactions for the half year ended September 30, 2010 were with ICICI Home FinanceCompany Limited amounting to 796.6 million (March 31, 2010: 934.0 million, September 30, 2009:
329.6 million), ICICI Securities Limited amounting to 450.0 million (March 31, 2010: 920.0 million,September 30, 2009: 350.0 million), ICICI Securities Primary Dealership Limited amounting to 101.6million (March 31, 2010: 422.1 million, September 30, 2009: 277.5 million), ICICI Lombard GeneralInsurance Company Limited amounting to 238.0 million (March 31, 2010: 476.1 million, September 30,2009: 238.0 million), ICICI Venture Funds Management Company Limited amounting to 210.0 million(March 31, 2010: 260.0 million, September 30, 2009: 80.0 million) and with ICICI Prudential AssetManagement Company Limited amounting to 117.0 million (March 31, 2010: 409.6 million, September30, 2009: 135.0 million).
Dividend paid
During the half year ended September 30, 2010, the Bank paid dividend to its key management personnelamounting to 4.2 million (March 31, 2010: 4.5 million, September 30, 2009: 4.5 million). The dividendpaid during the half year ended September 30, 2010 to Ms. Chanda D. Kochhar was 3.2 million (March 31,2010: 3.0 million, September 30, 2009: 3.0 million), to Mr. Sandeep Bakhshi was 0.04 million (March31, 2010: 0.03 million, September 30, 2009: 0.03 million), to Mr. N. S. Kannan was 1.0 million (March31, 2010: 0.9 million, September 30, 2009: 0.9 million) to Mr. K. Ramkumar was Nil (March 31, 2010:
0.2 million, September 30, 2009: 0.2 million) and to Mr. Sonjoy Chatterjee was Nil (March 31, 2010:0.3 million, September 30, 2009: 0.3 million).
Remuneration to whole-time directors
Remuneration paid to the whole-time directors of the Bank during the half year ended September 30,2010 was 41.1 million (March 31, 2010: 119.4 million, September 30, 2009: 35.0 million). Theremuneration paid for the year ended March 31, 2010 to Mr. K. V. Kamath was 4.1 million (September 30,2009 4.1 million). The remuneration paid for the half year ended September 30, 2010 to Ms. Chanda D.Kochhar was 12.9 million (March 31, 2010: 17.3 million, September 30, 2009 7.5 million), to Mr.Sandeep Bakhshi was 7.1 million (March 31, 2010: 12.6 million, September 30, 2009 5.0 million), toMr. N. S. Kannan was 8.0 million (March 31, 2010: 10.2 million, September 30, 2009 4.0 million), toMr. K. Ramkumar was 9.0 million [(March 31, 2010: 53.7 million (includes perquisite value of 40.6million on employee stock options (ESOPs) exercised) , September 30, 2009: 7.4 million)], to Mr. Rajiv
F-30

Sabharwal was 3.1 million and to Mr. Sonjoy Chatterjee was 1.1 million [(March 31, 2010: 19.6 million(includes perquisite value of 7.9 million on ESOPs exercised), September 30, 2009: 5.0 million)]. Theremuneration paid for the year ended March 31, 2010 to Mr. V. Vaidyanathan was 1.9 million (September30, 2009: 1.9 million).
Sale of fixed assets
During the half year ended September 30, 2010, the Bank sold fixed assets to its subsidiaries amountingto 0.4 million (March 31, 2010: 574.2 million, September 30, 2009: 2.8 million). The materialtransactions for the half year ended September 30, 2010 were with ICICI Securities Limited amounting to
0.4 million (March 31, 2010: 2.8 million, September 30, 2009: 2.8 million) and with ICICI HomeFinance Company Limited amounting to Nil (March 31, 2010: 570.0 million, September 30, 2009: Nil).
Purchase of fixed assets
During the half year ended September 30, 2010, the Bank purchased fixed assets from its subsidiariesamounting to 0.7 million (March 31, 2010: 21.3 million, September 30, 2009: Nil). The materialtransactions for the half year ended September 30, 2010 were with ICICI Prudential Asset ManagementCompany Limited amounting to 0.7 million (March 31, 2010: 0.5 million, September 30, 2009: Nil) andwith ICICI Securities Limited amounting to Nil (March 31, 2010: 19.2 million, September 30, 2009: Nil).
Donation
During the half year ended September 30, 2010, the Bank has given donation to ICICI Foundation forInclusive Growth amounting to 61.0 million (March 31, 2010: 153.0 million, September 30, 2009: Nil).
Purchases of Loan
During the half year ended September 30, 2010, the Bank has purchased a loan from ICICI Bank UKPLC amounting to 693.9 million (March 31, 2010: Nil, September 30, 2009: Nil).
Transfer of merchant acquiring operations
During the year ended March 31, 2010, the Bank and First Data, a company engaged in electroniccommerce and payment services, formed a merchant acquiring alliance and a new entity, 81% owned by FirstData, was formed, which has acquired ICICI Bank’s merchant acquiring operations through transfer of assets,primarily comprising fixed assets and receivables, and assumption of liabilities, for a total consideration of
3,744.0 million. This transfer of assets and liabilities to the new entity would be considered a ‘slump sale’for tax purposes. The Bank realised a profit of 2,029.0 million from this transaction, which was includedin Schedule 14 — “Other income” for the year ended March 31, 2010.
Letters of Comfort
The Bank has issued letters of comfort on behalf of its banking subsidiaries, ICICI Bank UK PLC andICICI Bank Canada. The details of the letters are given below.
On behalf of To Purpose
ICICI Bank UK PLC ............... Financial Services Authority, UK(‘FSA’)
Financially support ICICI Bank UKPLC to ensure that it meets all of itsobligations as they fall due.
ICICI Bank Canada.................. Canada Deposit InsuranceCorporation (‘CDIC’)
To comply with the Bank Act and theCDIC regulations or by-laws thereunder and to indemnify CDIC againstall losses, damages, reasonable costsand expenses arising from failure ofICICI Bank Canada in performing thesame.
F-31
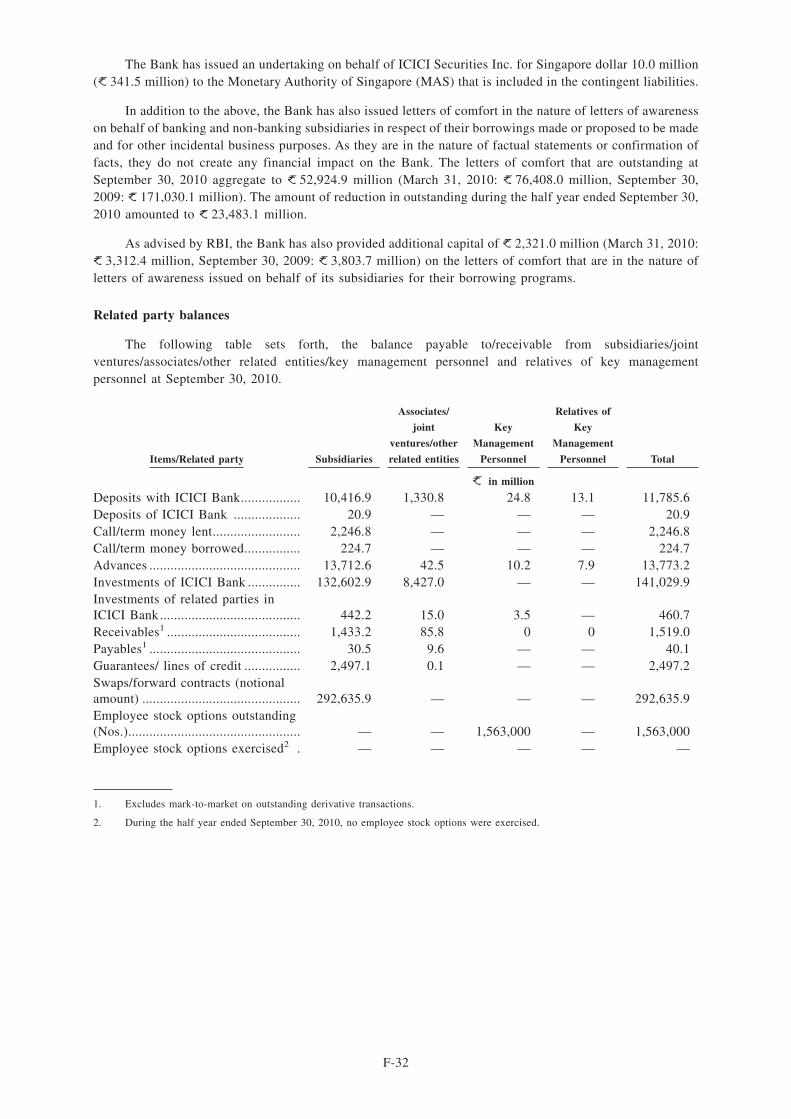
The Bank has issued an undertaking on behalf of ICICI Securities Inc. for Singapore dollar 10.0 million( 341.5 million) to the Monetary Authority of Singapore (MAS) that is included in the contingent liabilities.
In addition to the above, the Bank has also issued letters of comfort in the nature of letters of awarenesson behalf of banking and non-banking subsidiaries in respect of their borrowings made or proposed to be madeand for other incidental business purposes. As they are in the nature of factual statements or confirmation offacts, they do not create any financial impact on the Bank. The letters of comfort that are outstanding atSeptember 30, 2010 aggregate to 52,924.9 million (March 31, 2010: 76,408.0 million, September 30,2009: 171,030.1 million). The amount of reduction in outstanding during the half year ended September 30,2010 amounted to 23,483.1 million.
As advised by RBI, the Bank has also provided additional capital of 2,321.0 million (March 31, 2010:3,312.4 million, September 30, 2009: 3,803.7 million) on the letters of comfort that are in the nature of
letters of awareness issued on behalf of its subsidiaries for their borrowing programs.
Related party balances
The following table sets forth, the balance payable to/receivable from subsidiaries/jointventures/associates/other related entities/key management personnel and relatives of key managementpersonnel at September 30, 2010.
Items/Related party Subsidiaries
Associates/
joint
ventures/other
related entities
Key
Management
Personnel
Relatives of
Key
Management
Personnel Total
in million
Deposits with ICICI Bank................. 10,416.9 1,330.8 24.8 13.1 11,785.6Deposits of ICICI Bank ................... 20.9 — — — 20.9Call/term money lent......................... 2,246.8 — — — 2,246.8Call/term money borrowed................ 224.7 — — — 224.7Advances ........................................... 13,712.6 42.5 10.2 7.9 13,773.2Investments of ICICI Bank ............... 132,602.9 8,427.0 — — 141,029.9Investments of related parties inICICI Bank........................................ 442.2 15.0 3.5 — 460.7Receivables1 ...................................... 1,433.2 85.8 0 0 1,519.0Payables1 ........................................... 30.5 9.6 — — 40.1Guarantees/ lines of credit ................ 2,497.1 0.1 — — 2,497.2Swaps/forward contracts (notionalamount) ............................................. 292,635.9 — — — 292,635.9Employee stock options outstanding(Nos.)................................................. — — 1,563,000 — 1,563,000Employee stock options exercised2 . — — — — —
1. Excludes mark-to-market on outstanding derivative transactions.
2. During the half year ended September 30, 2010, no employee stock options were exercised.
F-32
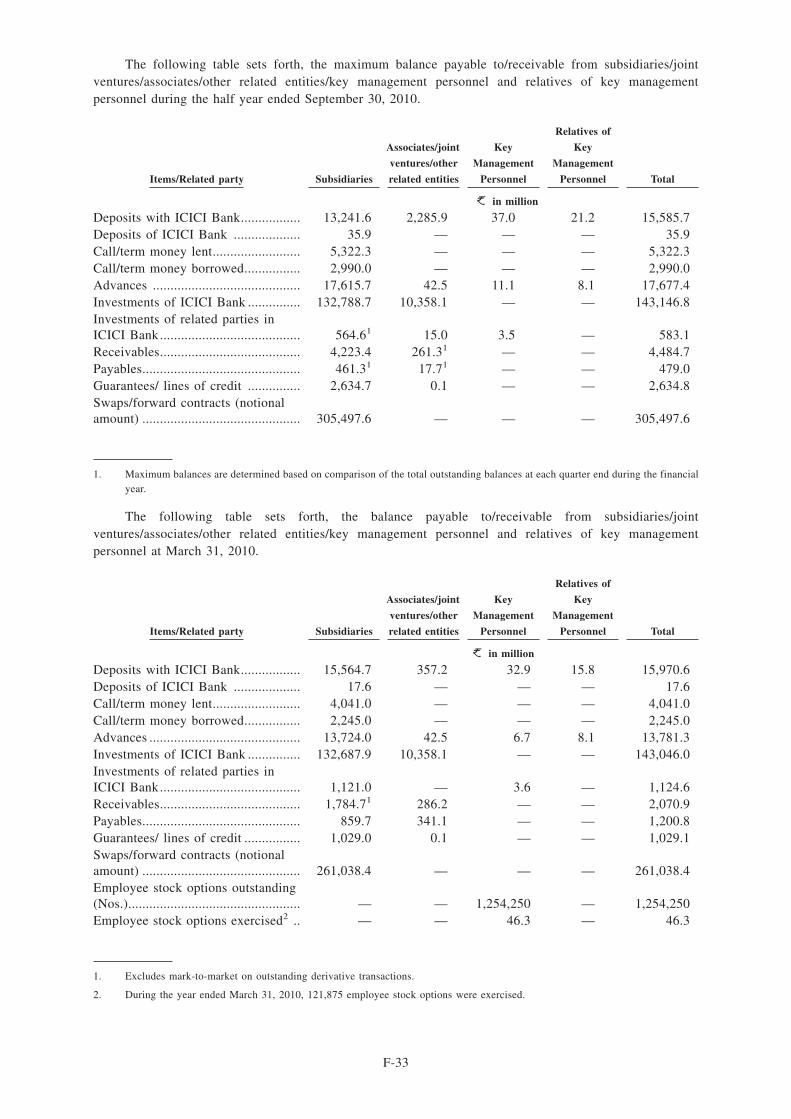
The following table sets forth, the maximum balance payable to/receivable from subsidiaries/jointventures/associates/other related entities/key management personnel and relatives of key managementpersonnel during the half year ended September 30, 2010.
Items/Related party Subsidiaries
Associates/joint
ventures/other
related entities
Key
Management
Personnel
Relatives of
Key
Management
Personnel Total
in million
Deposits with ICICI Bank................. 13,241.6 2,285.9 37.0 21.2 15,585.7Deposits of ICICI Bank ................... 35.9 — — — 35.9Call/term money lent......................... 5,322.3 — — — 5,322.3Call/term money borrowed................ 2,990.0 — — — 2,990.0Advances .......................................... 17,615.7 42.5 11.1 8.1 17,677.4Investments of ICICI Bank ............... 132,788.7 10,358.1 — — 143,146.8Investments of related parties inICICI Bank........................................ 564.61 15.0 3.5 — 583.1Receivables........................................ 4,223.4 261.31 — — 4,484.7Payables............................................. 461.31 17.71 — — 479.0Guarantees/ lines of credit ............... 2,634.7 0.1 — — 2,634.8Swaps/forward contracts (notionalamount) ............................................. 305,497.6 — — — 305,497.6
1. Maximum balances are determined based on comparison of the total outstanding balances at each quarter end during the financialyear.
The following table sets forth, the balance payable to/receivable from subsidiaries/jointventures/associates/other related entities/key management personnel and relatives of key managementpersonnel at March 31, 2010.
Items/Related party Subsidiaries
Associates/joint
ventures/other
related entities
Key
Management
Personnel
Relatives of
Key
Management
Personnel Total
in million
Deposits with ICICI Bank................. 15,564.7 357.2 32.9 15.8 15,970.6Deposits of ICICI Bank ................... 17.6 — — — 17.6Call/term money lent......................... 4,041.0 — — — 4,041.0Call/term money borrowed................ 2,245.0 — — — 2,245.0Advances ........................................... 13,724.0 42.5 6.7 8.1 13,781.3Investments of ICICI Bank ............... 132,687.9 10,358.1 — — 143,046.0Investments of related parties inICICI Bank........................................ 1,121.0 — 3.6 — 1,124.6Receivables........................................ 1,784.71 286.2 — — 2,070.9Payables............................................. 859.7 341.1 — — 1,200.8Guarantees/ lines of credit ................ 1,029.0 0.1 — — 1,029.1Swaps/forward contracts (notionalamount) ............................................. 261,038.4 — — — 261,038.4Employee stock options outstanding(Nos.)................................................. — — 1,254,250 — 1,254,250Employee stock options exercised2 .. — — 46.3 — 46.3
1. Excludes mark-to-market on outstanding derivative transactions.
2. During the year ended March 31, 2010, 121,875 employee stock options were exercised.
F-33
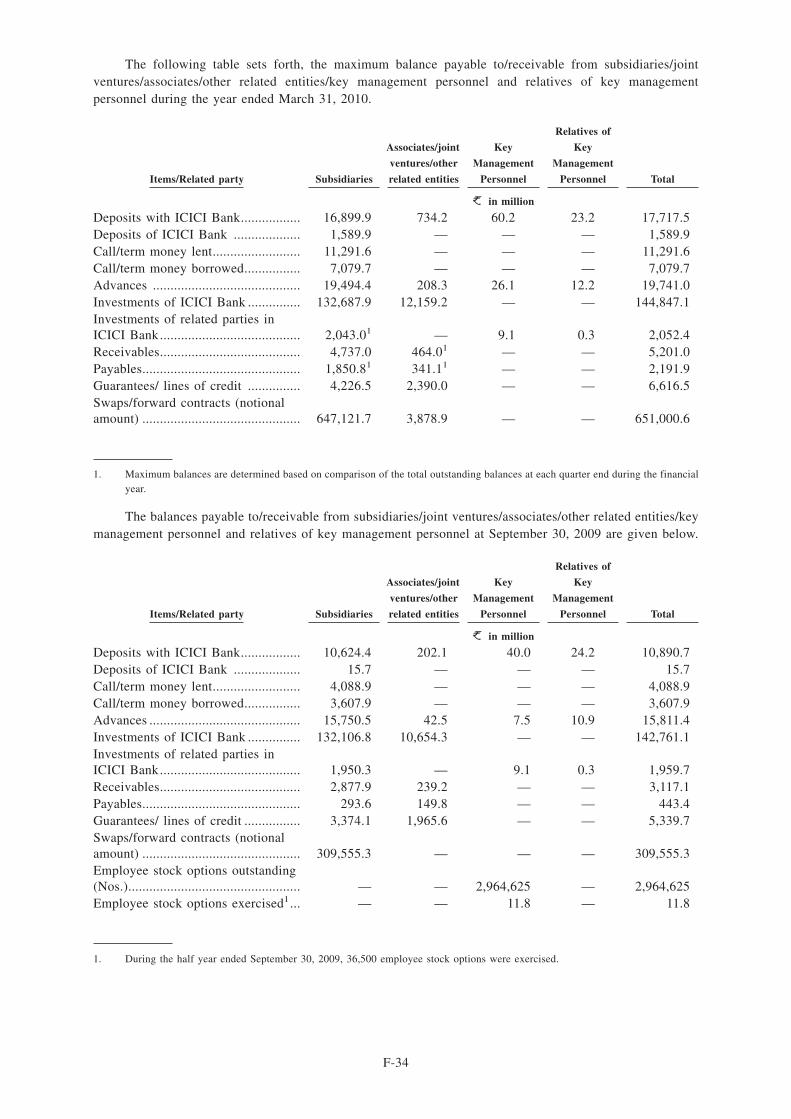
The following table sets forth, the maximum balance payable to/receivable from subsidiaries/jointventures/associates/other related entities/key management personnel and relatives of key managementpersonnel during the year ended March 31, 2010.
Items/Related party Subsidiaries
Associates/joint
ventures/other
related entities
Key
Management
Personnel
Relatives of
Key
Management
Personnel Total
in million
Deposits with ICICI Bank................. 16,899.9 734.2 60.2 23.2 17,717.5Deposits of ICICI Bank ................... 1,589.9 — — — 1,589.9Call/term money lent......................... 11,291.6 — — — 11,291.6Call/term money borrowed................ 7,079.7 — — — 7,079.7Advances .......................................... 19,494.4 208.3 26.1 12.2 19,741.0Investments of ICICI Bank ............... 132,687.9 12,159.2 — — 144,847.1Investments of related parties inICICI Bank........................................ 2,043.01 — 9.1 0.3 2,052.4Receivables........................................ 4,737.0 464.01 — — 5,201.0Payables............................................. 1,850.81 341.11 — — 2,191.9Guarantees/ lines of credit ............... 4,226.5 2,390.0 — — 6,616.5Swaps/forward contracts (notionalamount) ............................................. 647,121.7 3,878.9 — — 651,000.6
1. Maximum balances are determined based on comparison of the total outstanding balances at each quarter end during the financialyear.
The balances payable to/receivable from subsidiaries/joint ventures/associates/other related entities/keymanagement personnel and relatives of key management personnel at September 30, 2009 are given below.
Items/Related party Subsidiaries
Associates/joint
ventures/other
related entities
Key
Management
Personnel
Relatives of
Key
Management
Personnel Total
in million
Deposits with ICICI Bank................. 10,624.4 202.1 40.0 24.2 10,890.7Deposits of ICICI Bank ................... 15.7 — — — 15.7Call/term money lent......................... 4,088.9 — — — 4,088.9Call/term money borrowed................ 3,607.9 — — — 3,607.9Advances ........................................... 15,750.5 42.5 7.5 10.9 15,811.4Investments of ICICI Bank ............... 132,106.8 10,654.3 — — 142,761.1Investments of related parties inICICI Bank........................................ 1,950.3 — 9.1 0.3 1,959.7Receivables........................................ 2,877.9 239.2 — — 3,117.1Payables............................................. 293.6 149.8 — — 443.4Guarantees/ lines of credit ................ 3,374.1 1,965.6 — — 5,339.7Swaps/forward contracts (notionalamount) ............................................. 309,555.3 — — — 309,555.3Employee stock options outstanding(Nos.)................................................. — — 2,964,625 — 2,964,625Employee stock options exercised1... — — 11.8 — 11.8
1. During the half year ended September 30, 2009, 36,500 employee stock options were exercised.
F-34
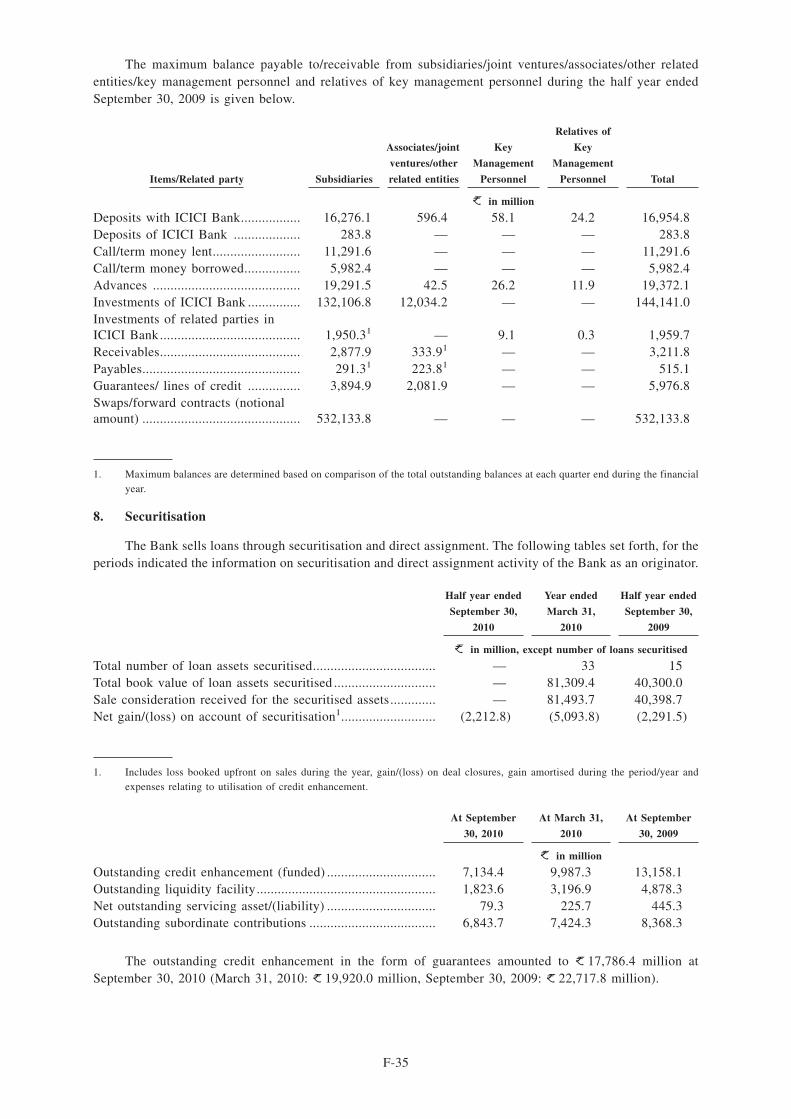
The maximum balance payable to/receivable from subsidiaries/joint ventures/associates/other relatedentities/key management personnel and relatives of key management personnel during the half year endedSeptember 30, 2009 is given below.
Items/Related party Subsidiaries
Associates/joint
ventures/other
related entities
Key
Management
Personnel
Relatives of
Key
Management
Personnel Total
in million
Deposits with ICICI Bank................. 16,276.1 596.4 58.1 24.2 16,954.8Deposits of ICICI Bank ................... 283.8 — — — 283.8Call/term money lent......................... 11,291.6 — — — 11,291.6Call/term money borrowed................ 5,982.4 — — — 5,982.4Advances .......................................... 19,291.5 42.5 26.2 11.9 19,372.1Investments of ICICI Bank ............... 132,106.8 12,034.2 — — 144,141.0Investments of related parties inICICI Bank........................................ 1,950.31 — 9.1 0.3 1,959.7Receivables........................................ 2,877.9 333.91 — — 3,211.8Payables............................................. 291.31 223.81 — — 515.1Guarantees/ lines of credit ............... 3,894.9 2,081.9 — — 5,976.8Swaps/forward contracts (notionalamount) ............................................. 532,133.8 — — — 532,133.8
1. Maximum balances are determined based on comparison of the total outstanding balances at each quarter end during the financialyear.
8. Securitisation
The Bank sells loans through securitisation and direct assignment. The following tables set forth, for theperiods indicated the information on securitisation and direct assignment activity of the Bank as an originator.
Half year ended
September 30,
2010
Year ended
March 31,
2010
Half year ended
September 30,
2009
in million, except number of loans securitised
Total number of loan assets securitised................................... — 33 15Total book value of loan assets securitised ............................. — 81,309.4 40,300.0Sale consideration received for the securitised assets............. — 81,493.7 40,398.7Net gain/(loss) on account of securitisation1........................... (2,212.8) (5,093.8) (2,291.5)
1. Includes loss booked upfront on sales during the year, gain/(loss) on deal closures, gain amortised during the period/year andexpenses relating to utilisation of credit enhancement.
At September
30, 2010
At March 31,
2010
At September
30, 2009
in million
Outstanding credit enhancement (funded) ............................... 7,134.4 9,987.3 13,158.1Outstanding liquidity facility................................................... 1,823.6 3,196.9 4,878.3Net outstanding servicing asset/(liability) ............................... 79.3 225.7 445.3Outstanding subordinate contributions .................................... 6,843.7 7,424.3 8,368.3
The outstanding credit enhancement in the form of guarantees amounted to 17,786.4 million atSeptember 30, 2010 (March 31, 2010: 19,920.0 million, September 30, 2009: 22,717.8 million).
F-35

Outstanding credit enhancement in the form of guarantees for third party originated securitisationtransactions amounted to 7,329.2 million at September 30, 2010 (March 31, 2010: 6,442.0 million,September 30, 2009: 4,786.5 million) and outstanding liquidity facility for third party originatedsecuritisation transactions amounted to Nil at September 30, 2010 (March 31, 2010: 0.2 million, September30, 2009: 0.5 million).
The following table sets forth, for the periods indicated, the details of provision created at the time ofsecuritisation.
Particulars
At September
30, 2010
Year ended
March 31, 2010
At September
30, 2009
in million
Opening balance ...................................................................... 2,253.8 5,567.2 5,567.2Add: Additions during the period............................................ 312.8 1,038.4 161.9Less: Deductions during the period......................................... 1,092.2 4,351.8 1,640.7Closing balance........................................................................ 1,474.4 2,253.8 4,088.4
9. Repurchase transactions
Till March 31, 2010, the Bank used to account for market repurchase and reverse repurchase transactionsin government securities and corporate debt securities, if any, as “sale and repurchase” transactions. However,as per RBI circular no. RBI/2009-2010/356 IDMD/ 4135/11.08.43/2009-10 dated March 23, 2010, the Bankhas started accounting for such transactions as “borrowing and lending” transactions, effective April 1, 2010.
The following table sets forth, for the periods indicated, the details of securities sold and purchasedunder repo and reverse repo.
Minimum
outstanding
balance during
the half
year/year
Maximum
outstanding
balance during
the half
year/year
Daily average
outstanding
balance during
the half year/
year Outstanding
in million
Half year ended September 30, 2010Securities sold under Repoi. Government Securities .................................... 1.5 214,553.6 51,983.0 1.5ii. Corporate Debt Securities............................... — — — —Securities purchased under Reverse Repoi. Government Securities .................................... 168.4 7,817.1 437.2 485.3ii. Corporate Debt Securities............................... — — — —Year ended March 31, 2010Securities sold under Repoi. Government Securities .................................... 7.6 294,964.7 153,396.0 27,194.4ii. Corporate Debt Securities............................... — — — —Securities purchased under Reverse Repoi. Government Securities .................................... — 827.8 233.5 84.2ii. Corporate Debt Securities............................... — — — —Half year ended September 30, 2009Securities sold under Repoi. Government Securities .................................... 20,601.4 294,955.7 159,469.3 24,678.0ii. Corporate Debt Securities............................... — — — —Securities purchased under Reverse Repoi. Government Securities .................................... — 601.9 167.0 541.0ii. Corporate Debt Securities............................... — — — —
1. The above figures do not include securities sold and purchased under Liquidity Adjustment Facility (LAF) of RBI.
2. Amounts reported are based on face value of securities under repo and reverse repo.
F-36

10. Appropriation of net profit
The Bank appropriates net profit towards various reserves only at year-end. For half year endedSeptember 30, 2010, appropriations required as per RBI guidelines would have been 5,655.6 million towardsstatutory reserves, 374.7 million towards capital reserves and 1,151.5 million towards investment reserveaccount.
11. Advances
The following table sets forth, for the periods indicated, the details of movement of grossnon-performing assets (NPAs), net NPAs and provisions.
Particulars
Half year ended
September 30,
2010
Year ended
March 31,
2010
Half year ended
September 30,
2009
in million
i) Net NPAs (funded) to net advances (%) ........................ 1.62% 2.12% 2.36%ii) Movement of NPAs (Gross)
a) Opening balance1................................................... 94,806.5 96,493.1 96,493.1b) Additions during the period/year2,3,4 ..................... 19,389.8 64,168.9 38,632.7c) Reductions during the period/year2 ...................... (12,784.7) (65,855.5) (43,116.9)d) Closing balance1 ................................................... 101,411.6 94,806.5 92,008.9
iii) Movement of Net NPAsa) Opening balance1................................................... 38,411.1 45,539.4 45,539.4b) Additions during the period/year2,3,4 ..................... 11,952.2 36,666.5 26,795.2c) Reductions during the period/year2 ...................... (18,911.0) (43,794.8) (27,344.1)d) Closing balance1 ................................................... 31,452.3 38,411.1 44,990.5
iv) Movement of provisions for NPAs (excludingprovision on standard assets)a) Opening balance1................................................... 56,395.4 50,953.7 50,953.7b) Provisions made during the period/ year4,5 ........... 17,302.7 43,181.4 21,563.4c) Write-off/write-back of excess provisions ........... (3,738.8) (37,739.7) (25,498.7)d) Closing balance1 .................................................... 69,959.3 56,395.4 47,018.4
1. Net of write-off.
2. Includes cases added to and deleted from NPAs during the half year ended September 30, 2010, with such gross loans amountingto 980.2 million (March 31, 2010: 9,970.7 million and September 30, 2009: 2,041.6 million) and such net loans amountingto 849.5 million (March 31, 2010: 8,716.8 million and 1,788.5 million).
3. Till year ended March 31, 2010, the difference between the opening and closing balances (other than accounts written off duringthe period) of NPAs in retail loans was included in additions during the period. From quarter ended June 30, 2010, the bifurcationbetween additions and deletions is made except for the NPAs in credit cards. For NPAs in credit cards, the difference between theopening and closing balances (other than accounts written off during the period) is included in additions during the period. Theprevious period amounts have been reclassified accordingly.
4. Includes NPAs acquired on account of amalgamation of Bank of Rajasthan.
5. Till year ended March 31, 2010, the difference between the opening and closing balances of provisions (adjusted for write-off andsale of NPAs during period) in retail loans was included in provisions made during the period/year from quarter ended on June30, 2010, the bifurcation between provision made and write back of excess provision is made except for the NPAs in credit cards.For NPAs in credit cards, the difference between the opening and closing balances (adjusted for write-off and sale of NPAs duringperiod) is included in additions during the period. The previous period/year amounts have been reclassified accordingly.
12. Financial assets transferred during the period/year to securitisation company (SC)/reconstructioncompany (RC)
The Bank has transferred certain assets to Asset Reconstruction Companies (ARCs) in terms of theguidelines issued by RBI governing such transfer. For the purpose of the valuation of the underlying securityreceipts issued by the underlying trusts managed by ARCs, the security receipts are valued at their respectiveNAVs as advised by the ARCs.
F-37

The following table sets forth, for the periods indicated, the details of the assets transferred.
Half year ended
September 30,
2010
Year ended
March 31,
2010
Half year ended
September 30,
2009
in million, except number of accounts
No. of accounts........................................................................ — 55,1601 55,1601
Aggregate value (net of provisions) of accounts sold toSC/RC .................................................................................. — 7,617.9 7,617.9
Aggregate consideration .......................................................... — 7,866.7 7,866.7Additional consideration realised in respect of accounts
transferred in earlier years 2 ................................................ — — —Aggregate gain/(loss) over net book value.............................. — 248.8 248.8
1. Excludes accounts previously written-off.
2. During the half year ended September 30, 2010, Asset Reconstruction Company (India) Limited (ARCIL) has not fully redeemedany of the security receipts. The Bank realised Nil over the gross book value in respect of these trusts (March 31, 2010: 89.8million).
13. Provision on standard assets
The Bank makes provision on standard assets as per RBI guidelines. The Bank has adopted the revisedrates for making provision on standard assets during the half year ended September 30, 2010, in accordancewith RBI circular no. DBOD.BP.BC.58/ 21.04.048/2009-10 dated November 5, 2009.
The Bank has not written back any standard asset provision pursuant to the RBI circular no.DBOD.BP.BC.83/21.01.002/2008-09 dated November 15, 2008. The provision on standard assets held by theBank at September 30, 2010 (including 434.8 million on account of amalgamation of Bank of Rajasthan)was 14,795.4 million (March 31, 2010: 14,360.6 million; September 30, 2010: 14,360.6 million).
F-38

14. Information in respect of restructured assets
The following table sets forth, for the periods indicated, details of loan assets subjected to restructuring.
Half year ended September 30, 2010 Half year ended September 30, 2009
CDR
Mechanism
SME Debt
Restructuring Others
CDR
Mechanism
SME Debt
Restructuring Others
in million
Standardadvancesrestructured.....
Number ofborrowers — 1 53 8 6 943Amountoutstanding — 75.3 4,529.9 10,215.2 210.7 33,328.0of whichrestructuredamount — 74.5 4,231.3 9,839.3 112.6 32,084.9Sacrifice(diminution in thefair value) — — 549.3 653.2 1.9 1,364.0
Sub standardadvancesrestructured.....
Number ofborrowers — — 1 1 — 38Amountoutstanding — — 21.2 113.9 — 175.0of whichrestructuredamount — — 22.3 113.1 — 155.4Sacrifice(diminution in thefair value) — — — 9.4 — 7.9
Doubtfuladvancesrestructured.....
Number ofborrowers — — 1 — — 1Amountoutstanding — — 103.7 — — 0.7of whichrestructuredamount — — 99.9 — — 0.7Sacrifice(diminution in thefair value) — — — — — —
Total ................Number ofborrowers — 1 55 9 6 982Amountoutstanding — 75.3 4,654.8 10,329.1 210.7 33,503.7of whichrestructuredamount — 74.5 4,353.5 9,952.4 112.6 32,241.0Sacrifice(diminution in thefair value) — — 549.3 662.6 1.9 1,371.9
1. The aforesaid disclosure for the half year ended September 30, 2010, includes the reversal of interest income of 134.7 million(for the half year ended September 30, 2009, 608.1 million) on account of conversion of overdue interest into Funded InterestTerm Loan (FITL).
2. The aforesaid disclosure excludes the reversal of derivative income of nil (for the half year ended September 30, 2009, 303.1million) on account of conversion of derivative receivables into term loan/preference shares.
3. Includes eight borrowal accounts restructured for a second time with asset classification benefit upto June 30, 2009, amountingto 24,280.8 million against which sacrifice (diminution in fair value) was 1,498.1 million.
F-39

Year ended March 31, 2010
CDRMechanism
SME DebtRestructuring Others
in millionStandard advancesrestructured...................... Number of borrowers 11 11 3,806
Amount outstanding 14,186.6 397.6 40,918.8of which restructured amount 12,444.3 251.4 39,248.4Sacrifice (diminution in the fair value) 1,006.0 4.8 1,406.5
Sub standard advancesrestructured...................... Number of borrowers 3 1 98
Amount outstanding 640.2 77.8 288.2of which restructured amount 624.3 77.8 244.9Sacrifice (diminution in the fair value) 80.7 5.9 8.7
Doubtful advancesrestructured...................... Number of borrowers — — 3
Amount outstanding — — 207.2of which restructured amount — — 187.8Sacrifice (diminution in the fair value) — — 17.5
Total ................................. Number of borrowers 14 12 3,907Amount outstanding 14,826.8 475.4 41,414.2of which restructured amount 13,068.7 329.2 39,681.0Sacrifice (diminution in the fair value) 1,086.6 10.8 1,432.7
1. The above disclosure for the year ended March 31, 2010, includes the reversal of interest income of 704.3 million on accountof conversion of overdue interest into Funded Interest Term Loan (FITL).
2. The aforesaid disclosure excludes the reversal of derivative income of 303.1 million during the year ended March 31, 2010 onaccount of conversion of derivative receivables into term loan/preference shares.
3. Includes eight borrowal accounts restructured for a second time with asset classification benefit upto June 30, 2009, amountingto 24,280.8 million against which sacrifice (diminution in fair value) is 1,498.1 million.
15. Details of non-performing assets purchased/sold, excluding those sold to SC/RC
The Bank has not purchased any non-performing assets in terms of the guidelines issued by the ReserveBank of India circular no. DBOD.No.BP.BC.16/21.04.048/2005-06 dated July 13, 2005.
The Bank has sold certain non-performing assets in terms of the guidelines issued by RBI circular no.DBOD.No.BP.BC.16/21.04.048/2005-06 dated July 13, 2005 on such sale.
The following table sets forth, for the periods indicated, details of non-performing assets sold, excludingthose sold to SC/RC.
Particulars
Half year ended
September 30,
2010
Year ended
March 31, 2010
Half year ended
September 30,
2009
in million, except no. of accounts
No. of accounts........................................................................ — 7,4281 7,4281
Aggregate value (net of provisions) of accounts sold,excluding those sold to SC/RC............................................ — 479.0 479.0
Aggregate consideration .......................................................... — 463.6 463.6Aggregate gain/(loss) over net book value.............................. — (15.4) (15.4)
1. Excludes accounts previously written off.
16. Deferred tax
At September 30, 2010, the Bank has recorded net deferred tax asset of 24,698.0 million (March 31,2010: 20,756.7 million, September 30, 2009: 19,393.4 million), which has been included in other assets.
F-40

The following table sets forth, for the periods indicated, the break-up of deferred tax assets and liabilitiesinto major items.
At September
30, 20101
At March 31,
2010
At September
30, 2009
in million
Deferred tax assetProvision for bad and doubtful debts1..................................... 27,192.5 23,597.6 22,564.4Capital loss .............................................................................. — — 77.6Others1 ..................................................................................... 2,098.2 1,827.4 1,715.4
Total deferred tax assets .......................................................... 29,290.7 25,425.0 24,357.4
Deferred tax liabilityDepreciation on fixed assets.................................................... 4,595.6 4,671.1 4,966.1Total deferred tax liability ....................................................... 4,595.6 4,671.1 4,966.1Deferred tax asset/(liability) pertaining to foreign branches... 2.9 2.8 2.1
Total net deferred tax asset/(liability) ..................................... 24,698.0 20,756.7 19,393.4
1. Pursuant to the amalgamation of erstwhile Bank of Rajasthan with the Bank as of August 12, 2010, the Bank has recogniseddeferred tax assets of 827.3 million on eligible amount of timing difference on the date of amalgamation.
17. Provision Coverage Ratio
The provision coverage ratio of the Bank at September 30, 2010 computed as per the Reserve Bank ofIndia circular dated December 1, 2009 is 69.0%. The Bank has been permitted by Reserve Bank of India toachieve the stipulated level of 70.0% in a phased manner by March 31, 2011.
18. Bancassurance
The following table sets forth, for the periods indicated, the break-up of income derived frombancassurance business.
Sr.
No. Nature of income
Half year ended
September 30,
2010
in million
1. Income from selling life insurance policies ..................................................................... 996.52. Income from selling non life insurance policies .............................................................. 110.73. Income from selling mutual fund/Collective Investment Scheme products..................... 312.7
During the year ended March 31, 2010, the Bank earned fees/remuneration of 2,955.9 million inrespect of the bancassurance business.
F-41

19. Comparative figures
Figures of the previous period/year have been re-grouped to conform to the current period presentation.
Signatures to Schedules 1 to 19
For and on behalf of the Board of Directors
K. V. KamathChairman
Chanda D. KochharManaging Director & CEO
N. S. KannanExecutive Director & CFO
K. RamkumarExecutive Director
Rajiv SabharwalExecutive Director
Sandeep BatraGroup Compliance Officer
& Company Secretary
Rakesh JhaDeputy Chief Financial Officer
Place: MumbaiDate : October 29, 2010
F-42

To the Members ofICICI Bank Limited
Auditors’ report on the financial statements of ICICI Bank Limited
1. We have audited the attached Balance Sheet of ICICI Bank Limited (‘the Bank’) as at 31 March 2010and also the Profit and Loss Account and the Cash Flow Statement for the year then ended, both annexedthereto. These financial statements are the responsibility of the Bank’s management. Our responsibilityis to express an opinion on these financial statements based on our audit. Incorporated in the saidfinancial statements are the returns of the Singapore, Bahrain and Hong Kong branches of the Bank,audited by other auditors.
2. We conducted our audit in accordance with auditing standards generally accepted in India. Thosestandards require that we plan and perform the audit to obtain reasonable assurance about whether thefinancial statements are free of material misstatements. An audit includes examining, on a test basis,evidence supporting the amounts and disclosures in the financial statements. An audit also includesassessing the accounting principles used and significant estimates made by the management, as well asevaluating the overall financial statements presentation. We believe that our audit provides a reasonablebasis for our opinion.
3. We did not audit the financial statements of the Singapore, Bahrain and Hong Kong branches of theBank, whose financial statements reflect total assets of Rs. 719,480.4 million as at 31 March 2010, totalrevenues of Rs. 41,095.5 million and cash flows of Rs. 11,195.0 million for the year then ended. Thesefinancial statements have been audited by other auditors, duly qualified to act as auditors in the countryof incorporation of the said branches, whose reports have been furnished to us, and which were reliedupon by us for our opinion on the financial statements of the Bank.
4. The Balance Sheet and the Profit and Loss Account have been drawn up in accordance with theprovisions of Section 29 of the Banking Regulation Act, 1949 read with Section 211(1), (2) and (3C) ofthe Companies Act, 1956.
5. We report that:
a) we have obtained all the information and explanations which, to the best of our knowledge andbelief, were necessary for the purpose of our audit and have found them to be satisfactory;
b) the transactions of the Bank, which have come to our notice, have been within the powers of theBank; and
c) the returns received from the offices and branches of the Bank have been found adequate for thepurposes of our audit.
6. In our opinion, the Balance Sheet, the Profit and Loss Account and the Cash Flow Statement dealt withby this report comply with the accounting principles generally accepted in India including AccountingStandards referred to in subsection (3C) of section 211 of the Companies Act, 1956, to the extent theyare not inconsistent with the accounting policies prescribed by the Reserve Bank of India.
7. We further report that:
a) the Balance Sheet, the Profit and Loss Account and the Cash Flow Statement dealt with by thisreport are in agreement with the books of account and the returns;
b) in our opinion, proper books of account as required by law have been kept by the Bank so far asappears from our examination of those books;
c) the reports on the financial statements of the Singapore, Bahrain and Hong Kong branches auditedby other auditors have been dealt with in preparing our report in the manner considered appropriateby us;
d) as per information and explanation given to us, the Central Government has till date, not prescribedany cess payable under Section 441A of the Companies Act, 1956;
e) on the basis of written representations received from the directors, as on 31 March 2010, and takenon record by the Board of Directors, we report that none of the directors is disqualified as on 31March 2010 from being appointed as a director in terms of clause (g) of sub-section (1) of Section274 of the Companies Act, 1956.
F-43

8. In our opinion and to the best of our information and according to the explanations given to us and onconsideration of reports submitted by the Singapore, Bahrain and Hong Kong branch auditors, the saidfinancial statements together with the notes thereon give the information required by the BankingRegulation Act, 1949 as well as the Companies Act, 1956, in the manner so required for bankingcompanies and give a true and fair view in conformity with accounting principles generally accepted inIndia:
a) in the case of the Balance Sheet, of the state of affairs of the Bank as at 31 March 2010;
b) in the case of the Profit and Loss Account, of the profit of the Bank for the year ended on that date;and
c) in the case of the Cash Flow Statement, of the cash flows of the Bank for the year ended on thatdate.
For B S R & Co.Chartered AccountantsFirm’s Registration No.: 101248W
Akeel MasterPartnerMembership No.: 046768
MumbaiApril 24, 2010
F-44

Unconsolidated Balance Sheet at March 31, 2010
Schedule
At
31.03.2010
At
31.03.2009
(Rupees in ’000s)
CAPITAL AND LIABILITIESCapital .......................................................................................... 1 11,148,892 11,132,898Reserves and surplus.................................................................... 2 505,034,767 484,197,292Deposits........................................................................................ 3 2,020,165,972 2,183,478,249Borrowings ................................................................................... 4 942,635,686 931,554,542Other liabilities and provisions .................................................... 5 155,011,834 182,646,642
TOTAL CAPITAL AND LIABILITIES.................................... 3,633,997,151 3,793,009,623
ASSETSCash and balances with Reserve Bank of India .......................... 6 275,142,920 175,363,342Balances with banks and money at call and short notice ............ 7 113,594,020 124,302,296Investments................................................................................... 8 1,208,928,005 1,030,583,080Advances ...................................................................................... 9 1,812,055,971 2,183,108,492Fixed assets .................................................................................. 10 32,126,899 38,016,209Other assets .................................................................................. 11 192,149,336 241,636,204
TOTAL ASSETS ......................................................................... 3,633,997,151 3,793,009,623
Contingent liabilities .................................................................... 12 7,270,840,587 8,346,830,027Bills for collection ....................................................................... 64,749,539 60,004,383Significant accounting policies and notes to accounts ................ 18 & 19
The schedules referred to above form an integral part of the Balance Sheet.
As per our Report of even date. For and on behalf of the Board of Directors
For B S R & Co.Chartered Accountants
Firm’s Registration no.: 101248W
K. V. KamathChairman
Chanda D. KochharManaging Director & CEO
Sandeep BakhshiDeputy Managing Director
Akeel MasterPartner
Membership no.: 046768
N. S. KannanExecutive Director & CFO
K. RamkumarExecutive Director
Sonjoy ChatterjeeExecutive Director
Sandeep BatraGroup Compliance Officer
& Company Secretary
Rakesh JhaDeputy Chief Financial
Officer
Place: MumbaiDate: April 24, 2010
F-45

Unconsolidated Profit and Loss Account for the year ended March 31, 2010
Schedule
Year ended
31.03.2010
Year ended
31.03.2009
(Rupees in ’000s)
I. INCOMEInterest earned ......................................................................... 13 257,069,331 310,925,484Other income ........................................................................... 14 74,776,500 76,037,271
TOTAL INCOME ........................................................................... 331,845,831 386,962,755
II. EXPENDITUREInterest expended ..................................................................... 15 175,925,704 227,259,343Operating expenses .................................................................. 16 58,598,327 70,451,137Provisions and contingencies ................................................. 17 57,071,971 51,670,943
TOTAL EXPENDITURE................................................................ 291,596,002 349,381,423
III. PROFIT/LOSSNet profit for the year ............................................................. 40,249,829 37,581,332Profit brought forward ............................................................. 28,096,510 24,363,159
TOTAL PROFIT/(LOSS)................................................................ 68,346,339 61,944,491
IV. APPROPRIATIONS/TRANSFERSTransfer to Statutory Reserve .................................................. 10,070,000 9,400,000Transfer to Reserve Fund ........................................................ 2,170 4,221Transfer to Capital Reserve ..................................................... 4,440,000 8,180,000Transfer to Investment Reserve Account................................. 1,160,000 —Transfer to General Reserve .................................................... 10,369 —Transfer to Special Reserve..................................................... 3,000,000 2,500,000Dividend (including corporate dividend tax) for the previous
year paid during the year..................................................... 929 5,811Proposed equity share dividend............................................... 13,378,604 12,245,771Proposed preference share dividend ........................................ 35 35Corporate dividend tax ........................................................... 1,640,425 1,512,143Balance carried over to balance sheet ..................................... 34,643,807 28,096,510
TOTAL ............................................................................................. 68,346,339 61,944,491
Significant accounting policies and notes to accounts ..................... 18 & 19Earnings per share (Refer note 19.4)
Basic (Rs.) .................................................................................... 36.14 33.76Diluted (Rs.) ................................................................................. 35.99 33.70
Face value per share (Rs.) ................................................................ 10.00 10.00
The schedules referred to above form an integral part of the Profit and Loss Account.
As per our Report of even date. For and on behalf of the Board of Directors
For B S R & Co.Chartered Accountants
Firm’s Registration no.: 101248W
K. V. KamathChairman
Chanda D. KochharManaging Director & CEO
Sandeep BakhshiDeputy Managing Director
Akeel MasterPartner
Membership no.: 046768
N. S. KannanExecutive Director & CFO
K. RamkumarExecutive Director
Sonjoy ChatterjeeExecutive Director
Sandeep BatraGroup Compliance Officer
& Company Secretary
Rakesh JhaDeputy Chief Financial
Officer
Place: MumbaiDate: April 24, 2010
F-46

Unconsolidated Cash Flow Statement for the year ended March 31, 2010
PARTICULARSYear ended31.03.2010
Year ended31.03.2009
(Rupees in ’000s)Cash flow from operating activitiesNet profit before taxes ................................................................................................... 53,453,218 51,169,693Adjustments for:Depreciation and amortisation ....................................................................................... 7,550,323 8,576,435Net (appreciation)/depreciation on investments ............................................................. 6,242,755 13,371,083Provision in respect of non-performing assets (including prudential provision onstandard assets) .............................................................................................................. 43,621,629 37,500,259Provision for contingencies & others............................................................................. 273,494 (395,005)Income from subsidiaries, joint ventures and consolidated entities .............................. (3,933,959) (3,636,999)(Profit)/loss on sale of fixed assets................................................................................ (1,345,173) (175,113)
105,862,287 106,410,353
Adjustments for:(Increase)/decrease in investments ................................................................................. (243,844,179) 26,560,241(Increase)/decrease in advances ..................................................................................... 327,300,630 34,618,121Increase/(decrease) in borrowings.................................................................................. (17,220,942) 32,785,480Increase/(decrease) in deposits....................................................................................... (163,312,277) (260,832,253)(Increase)/decrease in other assets ................................................................................. 54,586,538 (33,283,816)Increase/(decrease) in other liabilities and provisions ................................................... (28,694,588) (32,683,319)
(71,184,818) (232,835,546)Refund/(payment) of direct taxes................................................................................... (15,985,360) (15,459,704)
Net cash generated from operating activities (A)...................................................... 18,692,109 (141,884,897)
Cash flow from investing activitiesInvestments in subsidiaries and/or joint ventures (including application money)......... (1,113,156) (42,016,414)Income from subsidiaries, joint ventures and consolidated entities .............................. 3,933,959 3,636,999Purchase of fixed assets ................................................................................................. (5,101,617) (10,568,742)Proceeds from sale of fixed assets................................................................................. 3,164,763 667,236(Purchase)/sale of held to maturity securities ................................................................ 60,623,375 86,859,726
Net cash generated from investing activities (B) ....................................................... 61,507,324 38,578,805
Cash flow from financing activitiesProceeds from issue of share capital (including ESOPs) net of issue expenses ........... 610,429 452,464Net proceeds/(repayment) of bonds (including subordinated debt) ............................... 26,946,780 29,492,463Dividend and dividend tax paid..................................................................................... (13,731,041) (13,691,338)
Net cash generated from financing activities (C) ...................................................... 13,826,168 16,253,589
Effect of exchange fluctuation on translation reserve (D)........................................ (4,954,299) 6,306,853
Net increase/(decrease) in cash and cash equivalents (A) + (B) + (C) + (D) ......... 89,071,302 (80,745,650)
Cash and cash equivalents at April 1 ......................................................................... 299,665,638 380,411,288
Cash and cash equivalents at March 31 .................................................................... 388,736,940 299,665,638
Significant accounting policies and notes to accounts (refer Schedule 18 & 19)
The schedules referred to above form an integral part of the Balance Sheet.
As per our Report of even date. For and on behalf of the Board of Directors
For B S R & Co.Chartered Accountants
Firm’s Registration no.: 101248W
K. V. KamathChairman
Chanda D. KochharManaging Director & CEO
Sandeep BakhshiDeputy Managing Director
Akeel MasterPartner
Membership no.: 046768
N. S. KannanExecutive Director & CFO
K. RamkumarExecutive Director
Sonjoy ChatterjeeExecutive Director
Sandeep BatraGroup Compliance Officer
& Company Secretary
Rakesh JhaDeputy Chief Financial
Officer
Place: MumbaiDate: April 24, 2010
F-47

Schedules forming part of the balance sheet
At
31.03.2010
At
31.03.2009
(Rupees in ’000s)
SCHEDULE 1 — CAPITALAuthorised capital1,275,000,000 equity shares of Rs. 10 each (March 31, 2009:
1,275,000,000 equity shares of Rs. 10 each) ............................................... 12,750,000 12,750,00015,000,000 shares of Rs. 100 each (March 31, 2009:
15,000,000 shares of Rs. 100 each)1 ............................................................ 1,500,000 1,500,000350 preference shares of Rs. 10 million each (March 31, 2009:
350 preference shares of Rs. 10 million each)2 .......................................... 3,500,000 3,500,000
Equity share capitalIssued, subscribed and paid-up capital1,113,250,642 equity shares of Rs. 10 each (March 31, 2009:
1,112,687,495 equity shares) ....................................................................... 11,132,506 11,126,875Add : 1,594,672 equity shares of Rs. 10 each fully paid up (March 31,
2009: 563,147 equity shares) issued pursuant to exercise of employeestock options ......................................................................................... 15,947 5,631
11,148,453 11,132,506Less: Calls unpaid ........................................................................................... 331 378Add: 111,603 equity shares forfeited (March 31, 2009:
111,603 equity shares) ............................................................................. 770 770
TOTAL CAPITAL .......................................................................................... 11,148,892 11,132,898
1. These shares will be of such class and with such rights, privileges, conditions or restrictions as may be determinedby the Bank in accordance with the Articles of Association of the Bank and subject to the legislative provisions inforce for the time being in that behalf.
2. Pursuant to RBI circular no. DBOD.BP.BC No.81/ 21.01.002/2009-10, the issued and paid-up preference shares aregrouped under schedule 4 - “Borrowings”.
F-48

Schedules forming part of the balance sheet
At
31.03.2010
At
31.03.2009
(Rupees in ’000s)
SCHEDULE 2 — RESERVES AND SURPLUSI. Statutory reserve
Opening balance ...................................................................................... 48,793,807 39,393,807Additions during the year ...................................................................... 10,070,000 9,400,000Deductions during the year ..................................................................... — —
Closing balance ....................................................................................... 58,863,807 48,793,807II. Special reserve
Opening balance ...................................................................................... 23,440,000 20,940,000Additions during the year ...................................................................... 3,000,000 2,500,000Deductions during the year ..................................................................... — —
Closing balance ....................................................................................... 26,440,000 23,440,000III. Securities premium
Opening balance ..................................................................................... 312,917,382 312,471,030Additions during the year1 ...................................................................... 594,435 446,352Deductions during the year ..................................................................... — —
Closing balance ....................................................................................... 313,511,817 312,917,382IV. Investment reserve Account
Opening balance ...................................................................................... — —Additions during the year ...................................................................... 1,160,000 —Deductions during the year ..................................................................... — —
Closing balance ....................................................................................... 1,160,000 —V. Capital reserve
Opening balance ...................................................................................... 16,190,000 8,010,000Additions during the year ...................................................................... 4,440,000 8,180,000Deductions during the year ..................................................................... — —
Closing balance ....................................................................................... 20,630,000 16,190,000VI. Foreign currency translation reserve
Opening balance ...................................................................................... 4,966,797 (1,391,262)Additions during the year ...................................................................... — 6,358,059Deductions during the year ..................................................................... 4,986,796 —
Closing balance ....................................................................................... (19,999) 4,966,797VII. Reserve fund
Opening balance ..................................................................................... 8,749 4,528Additions during the year2 ...................................................................... 2,170 4,221Deductions during the year ..................................................................... — —
Closing balance ....................................................................................... 10,919 8,749VIII. Revenue and other reserves
Opening balance ..................................................................................... 49,784,047 49,784,047Additions during the year ...................................................................... 10,369 —Deductions during the year ..................................................................... — —
Closing balance ....................................................................................... 49,794,416 49,784,047
IX. Balance in profit and loss account .......................................................... 34,643,807 28,096,510
TOTAL RESERVES AND SURPLUS ........................................................... 505,034,767 484,197,292
1. Rs. 568.3 million (March 31, 2009: Rs. 184.1 million) on exercise of employee stock options.
2. Represents appropriation of 5% of net profit by Sri Lanka branch to meet the requirements of Section 20 of SriLankan Banking Act No 30 of 1988.
F-49

Schedules forming part of the balance sheet
At
31.03.2010
At
31.03.2009
(Rupees in ’000s)
SCHEDULE 3 — DEPOSITSA. I. Demand deposits
i) From banks............................................................................ 14,855,980 7,455,466ii) From others ........................................................................... 295,118,656 208,861,406
II. Savings bank deposits .................................................................... 532,183,675 410,361,455III. Term deposits
i) From banks............................................................................ 88,149,385 158,017,816ii) From others ........................................................................... 1,089,858,276 1,398,782,106
TOTAL DEPOSITS ........................................................................................ 2,020,165,972 2,183,478,249
B. I. Deposits of branches in India......................................................... 1,921,759,603 2,078,376,652II. Deposits of branches outside India ................................................ 98,406,369 105,101,597
TOTAL DEPOSITS ........................................................................................ 2,020,165,972 2,183,478,249
F-50

Schedules forming part of the balance sheet
At
31.03.2010
At
31.03.2009
(Rupees in ’000s)
SCHEDULE 4 — BORROWINGSI. Borrowings in India
i) Reserve Bank of India .................................................................. — —ii) Other banks .................................................................................... 25,000,000 23,246,348iii) Other institutions and agencies
a) Government of India ............................................................. 687,491 1,075,400b) Financial institutions ............................................................. 54,405,331 35,427,632
iv) Borrowings in the form ofBonds and debentures (excluding subordinated debt)- Debentures and bonds guaranteed by the Government of India . 8,355,000 11,755,000- Borrowings under private placement of bonds carrying
maturity of 1 to 30 years from the date of placement ............... 3,567,373 6,680,649Bonds issued under multiple option/safety bonds series- Regular interest bonds ................................................................. 2,924,220 3,278,880- Deep discount bonds.................................................................... 2,517,822 4,332,005- Tax saving bonds ........................................................................ 8,713,170 16,033,862- Pension bonds .............................................................................. 59,370 61,805
v) Application money — bonds 1 ....................................................... 25,000,000 —vi) Capital instruments
Innovative Perpetual Debt Instruments (IPDI)(qualifying as Tier I capital)....................................................... 13,010,000 13,010,000
Hybrid debt capital instruments issued as bonds/debentures(qualifying as upper Tier II capital) ........................................... 97,502,000 63,702,000
Redeemable Non-Cumulative Preference Shares (RNCPS)(Redeemable Non-Cumulative Preference Shares of Rs. 10million each issued to preference share holders of erstwhileICICI Limited on amalgamation redeemable at par on April20, 2018)..................................................................................... 3,500,000 3,500,000
Unsecured redeemable debentures/bonds (subordinated debtincluded in Tier II capital) ......................................................... 138,547,481 115,299,082
TOTAL BORROWINGS IN INDIA .............................................................. 383,789,258 297,402,663II. Borrowings outside India
i) From multilateral/bilateral credit agencies guaranteed by theGovernment of India for the equivalent of Rs. 17,252.7 million(March 31, 2009: Rs. 20,523.1 million)......................................... 18,525,159 22,862,196
ii) From international banks, institutions and consortiums................. 233,809,366 285,348,542iii) By way of bonds and notes............................................................ 250,570,342 262,531,035iv) Capital instruments
Innovative Perpetual Debt Instruments (IPDI)(qualifying as Tier I capital)....................................................... 15,199,979 17,158,574
Hybrid debt capital instruments issued as bonds/debentures(qualifying as upper Tier II capital) ............................................... 40,410,000 45,648,000
v) Other borrowings............................................................................ 331,582 603,532
TOTAL BORROWINGS OUTSIDE INDIA ................................................. 558,846,428 634,151,879
TOTAL BORROWINGS ................................................................................ 942,635,686 931,554,542
1. Application money received towards subordinated debt.
2. Secured borrowings in I and II above are Nil (March 31, 2009: Nil).
F-51

Schedules forming part of the balance sheet
At
31.03.2010
At
31.03.2009
(Rupees in ’000s)
SCHEDULE 5 — OTHER LIABILITIES AND PROVISIONSI. Bills payable ............................................................................................ 27,069,240 18,251,332II. Inter-office adjustments (net) ................................................................. 244,147 4,213,071III. Interest accrued........................................................................................ 24,421,815 27,989,208IV. Others
a) Security deposits from clients ........................................................ 5,934,848 9,463,352b) Sundry creditors ............................................................................. 39,664,039 61,267,278c) Received for disbursements under special program....................... 1,663,273 1,644,645d) Provision for standard assets .......................................................... 14,360,648 14,360,648e) Other liabilities1 ............................................................................. 41,653,824 45,457,108
TOTAL OTHER LIABILITIES AND PROVISIONS.................................. 155,011,834 182,646,642
1. Includes:
a) Proposed dividend of Rs. 13,378.6 million (March 31, 2009: Rs. 12,245.8 million).
b) Corporate dividend tax payable of Rs. 1,640.4 million (March 31, 2009: Rs. 1,512.1 million).
At
31.03.2010
At
31.03.2009
(Rupees in ’000s)
SCHEDULE 6 — CASH AND BALANCES WITH RESERVEBANK OF INDIA
I. Cash in hand (including foreign currency notes) .................................... 33,410,225 28,557,057II. Balances with Reserve Bank of India in current accounts ..................... 241,732,695 146,806,285
TOTAL CASH AND BALANCES WITH RESERVE BANK OF INDIA .. 275,142,920 175,363,342
At
31.03.2010
At
31.03.2009
(Rupees in ’000s)
SCHEDULE 7 — BALANCES WITH BANKS AND MONEY AT CALLAND SHORT NOTICE
I. In Indiai) Balances with banks
a) In current accounts ................................................................ 9,595,803 7,559,863b) In other deposit accounts ...................................................... 36,076,344 36,456,555
ii) Money at call and short noticea) With banks............................................................................. 70,000 —b) With other institutions ........................................................... — —
TOTAL............................................................................................................. 45,742,147 44,016,418
II. Outside Indiai) In current accounts ......................................................................... 15,722,069 23,561,910ii) In other deposit accounts................................................................ 44,241,179 28,407,146iii) Money at call and short notice....................................................... 7,888,625 28,316,822
TOTAL.................................................................................................... 67,851,873 80,285,878
TOTAL BALANCES WITH BANKS AND MONEY AT CALL ANDSHORT NOTICE ........................................................................................ 113,594,020 124,302,296
F-52

Schedules forming part of the balance sheet
At
31.03.2010
At
31.03.2009
(Rupees in ’000s)
SCHEDULE 8 — INVESTMENTSI. Investments in India [net of provisions]
i) Government securities .................................................................... 683,991,406 633,774,902ii) Other approved securities ............................................................... 45,009 93,405iii) Shares (includes equity and preference shares) ............................ 27,557,381 17,031,332iv) Debentures and bonds ................................................................... 36,353,907 26,000,683v) Subsidiaries and/or joint ventures1................................................. 62,226,766 61,194,621vi) Others (commercial paper, mutual fund units, pass through
certificates, security receipts, certificate of deposits etc.) ............ 307,378,383 196,688,823
TOTAL INVESTMENTS IN INDIA ............................................................. 1,117,552,852 934,783,766
II. Investments outside India [net of provisions]i) Government securities .................................................................... 1,645,046 953,347ii) Subsidiaries and/or joint ventures abroad (includes equity and
preference shares) ......................................................................... 66,005,026 65,924,016iii) Others ............................................................................................ 23,725,081 28,921,951
TOTAL INVESTMENTS OUTSIDE INDIA ................................................ 91,375,153 95,799,314
TOTAL INVESTMENTS ............................................................................... 1,208,928,005 1,030,583,080
III. Investments in IndiaGross value of investments ..................................................................... 1,129,332,338 947,314,476Less: Aggregate of provision/depreciation .............................................. 11,779,486 12,530,710
Net investments ...................................................................................... 1,117,552,852 934,783,766IV. Investments outside India
Gross value of investments ..................................................................... 91,756,742 97,586,277Less: Aggregate of provision/depreciation .............................................. 381,589 1,786,963
Net investments ...................................................................................... 91,375,153 95,799,314
TOTAL INVESTMENTS ............................................................................... 1,208,928,005 1,030,583,080
1. Includes application money of Rs. 1,000.0 million (March 31, 2009: Nil).
F-53
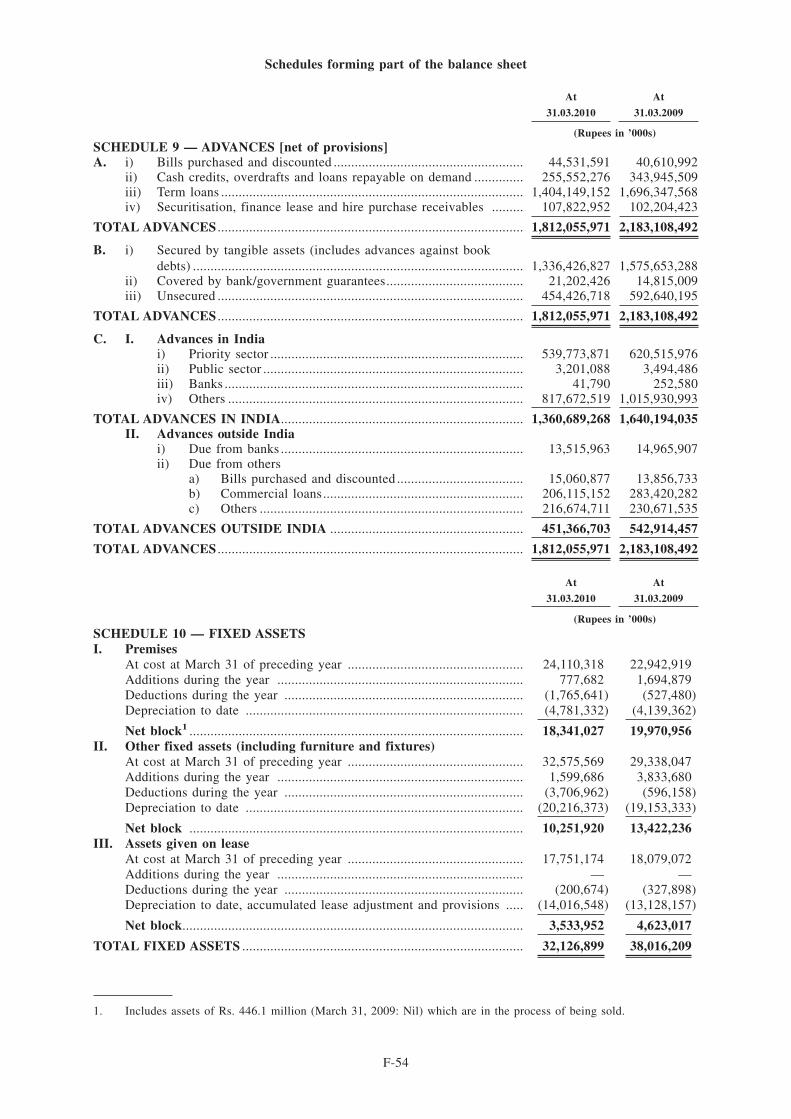
Schedules forming part of the balance sheet
At
31.03.2010
At
31.03.2009
(Rupees in ’000s)SCHEDULE 9 — ADVANCES [net of provisions]A. i) Bills purchased and discounted ...................................................... 44,531,591 40,610,992
ii) Cash credits, overdrafts and loans repayable on demand .............. 255,552,276 343,945,509iii) Term loans ...................................................................................... 1,404,149,152 1,696,347,568iv) Securitisation, finance lease and hire purchase receivables ......... 107,822,952 102,204,423
TOTAL ADVANCES ....................................................................................... 1,812,055,971 2,183,108,492
B. i) Secured by tangible assets (includes advances against bookdebts) .............................................................................................. 1,336,426,827 1,575,653,288
ii) Covered by bank/government guarantees....................................... 21,202,426 14,815,009iii) Unsecured ....................................................................................... 454,426,718 592,640,195
TOTAL ADVANCES ....................................................................................... 1,812,055,971 2,183,108,492
C. I. Advances in Indiai) Priority sector ........................................................................ 539,773,871 620,515,976ii) Public sector .......................................................................... 3,201,088 3,494,486iii) Banks ..................................................................................... 41,790 252,580iv) Others .................................................................................... 817,672,519 1,015,930,993
TOTAL ADVANCES IN INDIA..................................................................... 1,360,689,268 1,640,194,035II. Advances outside India
i) Due from banks ..................................................................... 13,515,963 14,965,907ii) Due from others
a) Bills purchased and discounted .................................... 15,060,877 13,856,733b) Commercial loans......................................................... 206,115,152 283,420,282c) Others ........................................................................... 216,674,711 230,671,535
TOTAL ADVANCES OUTSIDE INDIA ....................................................... 451,366,703 542,914,457
TOTAL ADVANCES ....................................................................................... 1,812,055,971 2,183,108,492
At
31.03.2010
At
31.03.2009
(Rupees in ’000s)
SCHEDULE 10 — FIXED ASSETSI. Premises
At cost at March 31 of preceding year .................................................. 24,110,318 22,942,919Additions during the year ...................................................................... 777,682 1,694,879Deductions during the year .................................................................... (1,765,641) (527,480)Depreciation to date ............................................................................... (4,781,332) (4,139,362)
Net block1 ............................................................................................... 18,341,027 19,970,956II. Other fixed assets (including furniture and fixtures)
At cost at March 31 of preceding year .................................................. 32,575,569 29,338,047Additions during the year ...................................................................... 1,599,686 3,833,680Deductions during the year .................................................................... (3,706,962) (596,158)Depreciation to date ............................................................................... (20,216,373) (19,153,333)
Net block ............................................................................................... 10,251,920 13,422,236III. Assets given on lease
At cost at March 31 of preceding year .................................................. 17,751,174 18,079,072Additions during the year ...................................................................... — —Deductions during the year .................................................................... (200,674) (327,898)Depreciation to date, accumulated lease adjustment and provisions ..... (14,016,548) (13,128,157)
Net block................................................................................................. 3,533,952 4,623,017
TOTAL FIXED ASSETS ................................................................................ 32,126,899 38,016,209
1. Includes assets of Rs. 446.1 million (March 31, 2009: Nil) which are in the process of being sold.
F-54

Schedules forming part of the balance sheet
At
31.03.2010
At
31.03.2009
(Rupees in ’000s)
SCHEDULE 11 — OTHER ASSETSI. Inter-office adjustments (net) .................................................................. — —II. Interest accrued........................................................................................ 32,528,366 41,382,870III. Tax paid in advance/tax deducted at source (net) ................................... 37,793,206 37,815,636IV. Stationery and stamps.............................................................................. 641 928V. Non-banking assets acquired in satisfaction of claims1 .......................... 674,945 3,089,212VI. Others
a) Advance for capital assets.............................................................. 11,744,493 8,776,627b) Outstanding fees and other income ................................................ 5,983,666 6,581,734c) Deposits .......................................................................................... 17,976,859 25,189,917d) Deferred tax asset (net) .................................................................. 20,756,703 17,923,148e) Others ............................................................................................. 64,690,457 100,876,132
TOTAL OTHER ASSETS .............................................................................. 192,149,336 241,636,204
1. Includes certain non-banking assets acquired in satisfaction of claims which are in the process of being transferredin the Bank’s name.
At
31.03.2010
At
31.03.2009
(Rupees in ’000s)
SCHEDULE 12 — CONTINGENT LIABILITIESI. Claims against the Bank not acknowledged as debts.............................. 33,568,263 32,824,550II. Liability for partly paid investments ....................................................... 128,126 128,126III. Liability on account of outstanding forward exchange contracts ........... 1,660,687,240 2,583,670,864IV. Guarantees given on behalf of constituents
a) In India ........................................................................................... 489,280,827 453,001,349b) Outside India .................................................................................. 129,084,608 127,880,113
V. Acceptances, endorsements and other obligations .................................. 321,224,087 306,782,689VI. Currency swaps ....................................................................................... 524,786,068 569,648,391VII. Interest rate swaps, currency options and interest rate futures ............... 4,012,141,159 4,146,346,015VIII. Other items for which the Bank is contingently liable ........................... 99,940,209 126,547,930
TOTAL CONTINGENT LIABILITIES ........................................................ 7,270,840,587 8,346,830,027
F-55

Schedules forming part of the profit and loss account
Year ended
31.03.2010
Year ended
31.03.2009
(Rupees in ’000s)
SCHEDULE 13 — INTEREST EARNEDI. Interest/discount on advances/bills .......................................................... 173,727,325 223,238,295II. Income on investments1 .......................................................................... 64,663,488 74,030,595III. Interest on balances with Reserve Bank of India and other inter-bank
funds ........................................................................................................ 6,249,906 5,187,095IV. Others2, 3.................................................................................................. 12,428,612 8,469,499
TOTAL INTEREST EARNED....................................................................... 257,069,331 310,925,484
1. Includes amortisation of premium on Government securities Rs. 8,121.5 million (March 31, 2009: Rs. 7,253.4million).
2. Includes interest on income tax refunds Rs. 1,208.3 million (March 31, 2009: Rs. 3,331.7 million).
3. Includes interest and amortisation of premium on non-trading interest rate swaps and foreign currency swaps.
Year ended31.03.2010
Year ended31.03.2009
(Rupees in ’000s)
SCHEDULE 14 — OTHER INCOMEI. Commission, exchange and brokerage ................................................... 48,308,087 56,258,933II. Profit/(loss) on sale of investments (net) ................................................ 5,464,210 18,004,745III. Profit/(loss) on revaluation of investments (net)..................................... 1,852,196 (5,140,339)IV. Profit/(loss) on sale of land, buildings and other assets (net)1 ............... 1,345,173 175,113V. Profit/(loss) on exchange transactions (net) ............................................ 11,060,537 84,146VI. Income earned by way of dividends, etc. from subsidiary companies
and/or joint ventures abroad/in India ...................................................... 3,692,716 3,348,233VII. Miscellaneous income (including lease income) .................................... 3,053,581 3,306,440
TOTAL OTHER INCOME ............................................................................ 74,776,500 76,037,271
1. Includes profit/(loss) on sale of assets given on lease.
Year ended
31.03.2010
Year ended
31.03.2009
(Rupees in ’000s)
SCHEDULE 15 — INTEREST EXPENDEDI. Interest on deposits.................................................................................. 115,134,716 157,851,583II. Interest on Reserve Bank of India/inter-bank borrowings1 ..................... 11,951,326 20,045,886III. Others (including interest on borrowings of erstwhile ICICI Limited) . 48,839,662 49,361,874
TOTAL INTEREST EXPENDED.................................................................. 175,925,704 227,259,343
1. Includes interest paid on inter-bank deposits.
F-56

Schedules forming part of the profit and loss account
Year ended
31.03.2010
Year ended
31.03.2009
(Rupees in ’000s)
SCHEDULE 16 — OPERATING EXPENSESI. Payments to and provisions for employees ............................................. 19,257,929 19,717,045II. Rent, taxes and lighting........................................................................... 5,924,256 6,257,960III. Printing and stationery ............................................................................ 915,957 1,200,296IV. Advertisement and publicity.................................................................... 1,108,010 1,402,840V. Depreciation on Bank’s property ........................................................... 4,778,512 4,684,901VI. Depreciation (including lease equalisation) on leased assets ................ 1,416,505 2,101,070VII. Directors’ fees, allowances and expenses ............................................... 4,193 3,640VIII. Auditors’ fees and expenses .................................................................... 22,500 22,738IX. Law charges............................................................................................. 987,406 924,040X. Postages, telegrams, telephones, etc........................................................ 2,007,720 2,538,545XI. Repairs and maintenance ........................................................................ 4,724,642 4,896,929XII. Insurance.................................................................................................. 2,005,645 2,282,926XIII. Direct marketing agency expenses ......................................................... 1,254,784 5,289,235XIV. Other expenditure ................................................................................... 14,190,268 19,128,972
TOTAL OPERATING EXPENSES ............................................................... 58,598,327 70,451,137
Year ended
31.03.2010
Year ended
31.03.2009
(Rupees in ’000s)
SCHEDULE 17 — PROVISIONS AND CONTINGENCIESI. Income tax
- Current period tax................................................................................. 15,977,789 17,933,052- Deferred tax adjustment........................................................................ (2,804,400) (4,716,700)- Fringe benefit tax.................................................................................. — 342,010
II. Wealth tax 30,000 30,000
TOTAL TAXES ............................................................................................... 13,203,389 13,588,362III. Provision for investments (net) ............................................................... (26,540) 977,328IV. Provision for advances (net)1 .................................................................. 43,621,629 37,500,259V. Others ...................................................................................................... 273,493 (395,006)
TOTAL PROVISIONS AND CONTINGENCIES ........................................ 57,071,971 51,670,943
1. Includes provisions on standard assets, non-performing advances, non-performing leased assets and others.
F-57

SCHEDULE 18 — SIGNIFICANT ACCOUNTING POLICIES
OVERVIEW
ICICI Bank Limited (ICICI Bank or the Bank), incorporated in Vadodara, India is a publicly heldbanking company engaged in providing a wide range of banking and financial services including commercialbanking and treasury operations. ICICI Bank is governed by the Banking Regulation Act, 1949.
Basis of preparation
The financial statements have been prepared in accordance with requirements prescribed under the ThirdSchedule of the Banking Regulation Act, 1949. The accounting and reporting policies of ICICI Bank used inthe preparation of these financial statements conform to Generally Accepted Accounting Principles in India(Indian GAAP), the guidelines issued by Reserve Bank of India (RBI) from time to time, the AccountingStandards (AS) issued by the Institute of Chartered Accountants of India (ICAI) and notified by the Companies(Accounting Standards) Rules, 2006 to the extent applicable and practices generally prevalent in the bankingindustry in India. The Bank follows the accrual method of accounting, except where otherwise stated, and thehistorical cost convention.
The preparation of financial statements requires the management to make estimates and assumptionsconsidered in the reported amounts of assets and liabilities (including contingent liabilities) as of the date ofthe financial statements and the reported income and expenses during the reporting period. Managementbelieves that the estimates used in the preparation of the financial statements are prudent and reasonable.Future results could differ from these estimates.
SIGNIFICANT ACCOUNTING POLICIES
1. Revenue recognition
a) Interest income is recognised in the profit and loss account as it accrues except in the case ofnon-performing assets (NPAs) where it is recognised upon realisation, as per the incomerecognition and asset classification norms of RBI.
b) Income from hire purchase operations is accrued by applying the implicit interest rate tooutstanding balances.
c) Income from leases is calculated by applying the interest rate implicit in the lease to the netinvestment outstanding on the lease over the primary lease period. Leases entered into till March31, 2001 have been accounted for as operating leases.
d) Income on discounted instruments is recognised over the tenure of the instrument on a constantyield basis.
e) Dividend is accounted on an accrual basis when the right to receive the dividend is established.
f) Loan processing fee is accounted for upfront when it becomes due.
g) Project appraisal/structuring fee is accounted for on the completion of the agreed service.
h) Arranger fee is accounted for as income when a significant portion of the arrangement/syndicationis completed.
i) Commission received on guarantees issued is amortised on a straight-line basis over the period ofthe guarantee.
j) All other fees are accounted for as and when they become due.
k) Net income arising from sell-down/securitisation of loan assets prior to February 1, 2006 has beenrecognised upfront as interest income. With effect from February 1, 2006, net income arising fromsecuritisation of loan assets is amortised over the life of securities issued or to be issued by thespecial purpose vehicle/special purpose entity to which the assets are sold. Net income arising fromsale of loan assets through direct assignment with recourse obligation is amortised over the life ofunderlying assets sold and net income from sale of loan assets through direct assignment, withoutany recourse obligation, is recognised at the time of sale. Net loss arising on account of thesell-down/securitisation and direct assignment of loan assets is recognised at the time of sale.
F-58

l) The Bank deals in bullion business on a consignment basis. The difference between pricerecovered from customers and cost of bullion is accounted for at the time of sale to the customers.The Bank also deals in bullion on a borrowing and lending basis and the interest paid/received isaccounted on accrual basis.
2. Investments
Investments are accounted for in accordance with the extant RBI guidelines on investment classificationand valuation as given below.
a) All investments are classified into ‘Held to Maturity’, ‘Available for Sale’ and ‘Held for Trading’.Reclassifications, if any, in any category are accounted for as per RBI guidelines. Under eachclassification, the investments are further categorised as (a) government securities, (b) otherapproved securities, (c) shares, (d) bonds and debentures, (e) subsidiaries and joint ventures and(f) others.
b) ‘Held to Maturity’ securities are carried at their acquisition cost or at amortised cost, if acquiredat a premium over the face value. Any premium over the face value of fixed rate and floating ratesecurities acquired is amortised over the remaining period to maturity on a constant yield basis andstraight line basis respectively.
c) ‘Available for Sale’ and ‘Held for Trading’ securities are valued periodically as per RBI guidelines.Any premium over the face value of investments in government securities, classified as ‘Availablefor Sale’, is amortised over the remaining period to maturity on constant yield basis. Quotedinvestments are valued based on the trades/quotes on the recognised stock exchanges, subsidiarygeneral ledger account transactions, price list of RBI or prices declared by Primary DealersAssociation of India jointly with Fixed Income Money Market and Derivatives Association(FIMMDA), periodically.
The market/fair value of unquoted government securities which are in the nature of StatutoryLiquidity Ratio (SLR) securities included in the ‘Available for Sale’ and ‘Held for Trading’categories is as per the rates published by FIMMDA. The valuation of other unquoted fixed incomesecurities wherever linked to the Yield-to-Maturity (YTM) rates, is computed with a mark-up(reflecting associated credit risk) over the YTM rates for government securities published byFIMMDA.
Unquoted equity shares are valued at the break-up value, if the latest balance sheet is available, orat Re. 1, as per RBI guidelines.
Securities are valued scrip-wise and depreciation/appreciation is aggregated for each category. Netappreciation in each category, if any, being unrealised, is ignored, while net depreciation isprovided for.
d) Costs including brokerage and commission pertaining to investments, paid at the time ofacquisition, are charged to the profit and loss account.
e) Equity investments in subsidiaries/joint ventures are categorised as ‘Held to Maturity’ inaccordance with RBI guidelines.
f) Profit on sale of investments in the ‘Held to Maturity’ category is credited to the profit and lossaccount and is thereafter appropriated (net of applicable taxes and statutory reserve requirements)to Capital Reserve. Profit on sale of investments in ‘Available for Sale’ and ‘Held for Trading’categories is credited to profit and loss account.
g) Repurchase and reverse repurchase transactions are accounted for in accordance with the extantRBI guidelines.
h) Broken period interest (the amount of interest from the previous interest payment date till the dateof purchase/sale of instruments) on debt instruments is treated as a revenue item.
i) At the end of each reporting period, security receipts issued by the asset reconstruction companyare valued in accordance with the guidelines applicable to such instruments, prescribed by RBIfrom time to time. Accordingly, in cases where the cash flows from security receipts issued by theasset reconstruction company are limited to the actual realisation of the financial assets assignedto the instruments in the concerned scheme, the Bank reckons the net asset value obtained fromthe asset reconstruction company from time to time, for valuation of such investments at eachreporting period end.
F-59

j) The Bank follows trade date method for accounting of its investments.
3. Provisions/write-offs on loans and other credit facilities
a) All credit exposures, including overdues arising from crystallised derivative contracts, areclassified as per RBI guidelines, into performing and non-performing assets (NPAs). Further, NPAsare classified into sub-standard, doubtful and loss assets based on the criteria stipulated by RBI.
In the case of corporate loans, provisions are made for sub-standard and doubtful assets at ratesprescribed by RBI. Loss assets and the unsecured portion of doubtful assets are providedfor/written off as per the extant RBI guidelines. Provisions on homogeneous retail loans, subjectto minimum provisioning requirements of RBI, are assessed at a portfolio level on the basis of dayspast due. The Bank holds specific provisions against non-performing loans and general provisionagainst performing loans. The assessment of incremental specific provisions is made after takinginto consideration existing specific provision. The specific provisions on retail loans held by theBank are higher than the minimum regulatory requirements.
b) Provision on assets restructured/rescheduled is made in accordance with the applicable RBIguidelines on restructuring of advances by Banks.
In respect of non-performing loan accounts subjected to restructuring, the account is upgraded tostandard only after the specified period i.e. a period of one year after the date when first paymentof interest or of principal, whichever is earlier, falls due, subject to satisfactory performance of theaccount during the period.
c) Amounts recovered against debts written off in earlier years and provisions no longer considerednecessary in the context of the current status of the borrower are recognised in the profit and lossaccount.
d) In addition to the specific provision on NPAs, the Bank maintains a general provision onperforming loans. The general provision covers the requirements of the RBI guidelines.
e) In addition to the provisions required to be held according to the asset classification status,provisions are held for individual country exposures (other than for home country exposure). Thecountries are categorised into seven risk categories namely insignificant, low, moderate, high, veryhigh, restricted and off-credit and provisioning is made on exposures exceeding 180 days on agraded scale ranging from 0.25% to 100%. For exposures with contractual maturity of less than180 days, 25% of the above provision is required to be held. If the country exposure (net) of theBank in respect of each country does not exceed 1% of the total funded assets, no provision isrequired on such country exposure.
4. Transfer and servicing of assets
The Bank transfers commercial and consumer loans through securitisation transactions. The transferredloans are de-recognised and gains/losses are accounted for only if the Bank surrenders the rights to benefitsspecified in the underlying securitised loan contract. Recourse and servicing obligations are accounted for netof provisions.
In accordance with the RBI guidelines for securitisation of standard assets, with effect from February 1,2006, the Bank accounts for any loss arising from securitisation immediately at the time of sale and theprofit/premium arising from securitisation is amortised over the life of the securities issued or to be issued bythe special purpose vehicle to which the assets are sold. In the case of loans sold to an asset reconstructioncompany, the excess provision, if any, is not reversed but is utilised to meet the shortfall/loss on account ofsale of other financial assets to asset reconstruction company.
F-60
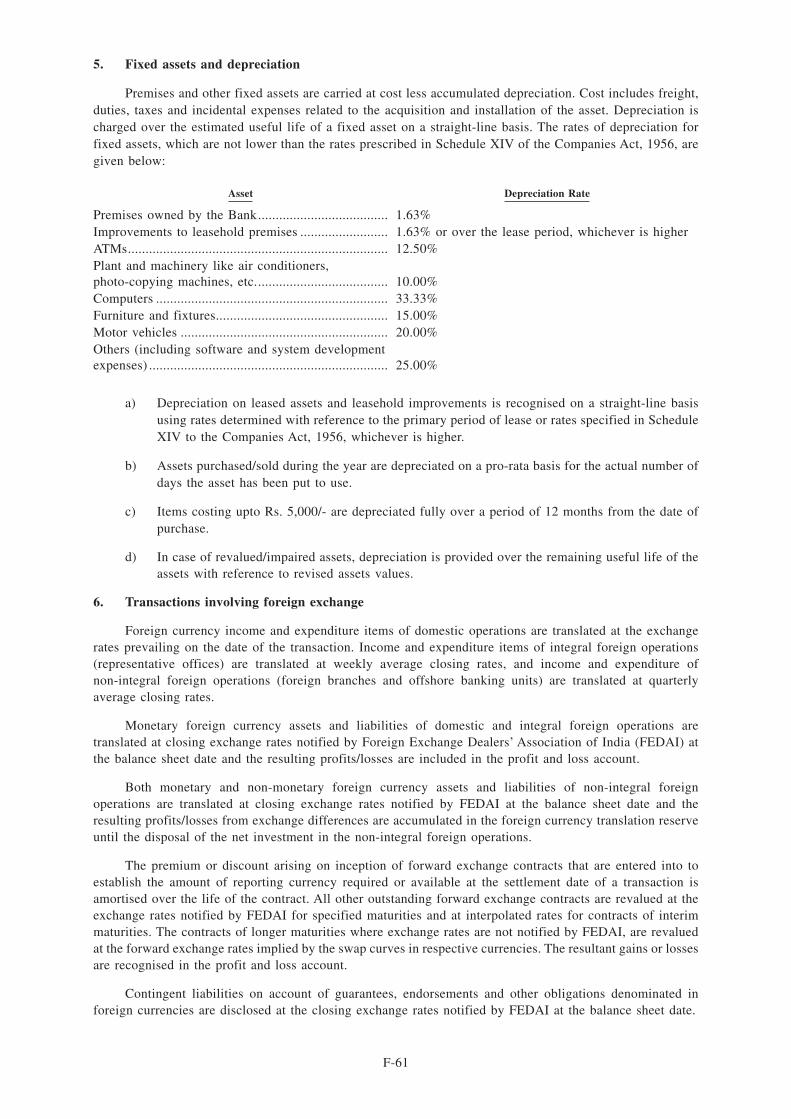
5. Fixed assets and depreciation
Premises and other fixed assets are carried at cost less accumulated depreciation. Cost includes freight,duties, taxes and incidental expenses related to the acquisition and installation of the asset. Depreciation ischarged over the estimated useful life of a fixed asset on a straight-line basis. The rates of depreciation forfixed assets, which are not lower than the rates prescribed in Schedule XIV of the Companies Act, 1956, aregiven below:
Asset Depreciation Rate
Premises owned by the Bank..................................... 1.63%Improvements to leasehold premises ......................... 1.63% or over the lease period, whichever is higherATMs.......................................................................... 12.50%Plant and machinery like air conditioners,photo-copying machines, etc...................................... 10.00%Computers .................................................................. 33.33%Furniture and fixtures................................................. 15.00%Motor vehicles ........................................................... 20.00%Others (including software and system developmentexpenses) .................................................................... 25.00%
a) Depreciation on leased assets and leasehold improvements is recognised on a straight-line basisusing rates determined with reference to the primary period of lease or rates specified in ScheduleXIV to the Companies Act, 1956, whichever is higher.
b) Assets purchased/sold during the year are depreciated on a pro-rata basis for the actual number ofdays the asset has been put to use.
c) Items costing upto Rs. 5,000/- are depreciated fully over a period of 12 months from the date ofpurchase.
d) In case of revalued/impaired assets, depreciation is provided over the remaining useful life of theassets with reference to revised assets values.
6. Transactions involving foreign exchange
Foreign currency income and expenditure items of domestic operations are translated at the exchangerates prevailing on the date of the transaction. Income and expenditure items of integral foreign operations(representative offices) are translated at weekly average closing rates, and income and expenditure ofnon-integral foreign operations (foreign branches and offshore banking units) are translated at quarterlyaverage closing rates.
Monetary foreign currency assets and liabilities of domestic and integral foreign operations aretranslated at closing exchange rates notified by Foreign Exchange Dealers’ Association of India (FEDAI) atthe balance sheet date and the resulting profits/losses are included in the profit and loss account.
Both monetary and non-monetary foreign currency assets and liabilities of non-integral foreignoperations are translated at closing exchange rates notified by FEDAI at the balance sheet date and theresulting profits/losses from exchange differences are accumulated in the foreign currency translation reserveuntil the disposal of the net investment in the non-integral foreign operations.
The premium or discount arising on inception of forward exchange contracts that are entered into toestablish the amount of reporting currency required or available at the settlement date of a transaction isamortised over the life of the contract. All other outstanding forward exchange contracts are revalued at theexchange rates notified by FEDAI for specified maturities and at interpolated rates for contracts of interimmaturities. The contracts of longer maturities where exchange rates are not notified by FEDAI, are revaluedat the forward exchange rates implied by the swap curves in respective currencies. The resultant gains or lossesare recognised in the profit and loss account.
Contingent liabilities on account of guarantees, endorsements and other obligations denominated inforeign currencies are disclosed at the closing exchange rates notified by FEDAI at the balance sheet date.
F-61

7. Accounting for derivative contracts
The Bank enters into derivative contracts such as foreign currency options, interest rate and currencyswaps, credit default swaps and cross currency interest rate swaps.
The swap contracts entered into to hedge on-balance sheet assets and liabilities are structured such thatthey bear an opposite and offsetting impact with the underlying on-balance sheet items. The impact of suchderivative instruments is correlated with the movement of underlying assets and accounted pursuant to theprinciples of hedge accounting. Hedged swaps are accounted for on an accrual basis.
Foreign currency and rupee derivative contracts entered into for trading purposes are marked to marketand the resulting gain or loss (net of provisions, if any) is accounted for in the profit and loss account. Pursuantto RBI guidelines, any receivables under derivative contracts, which remain overdue for more than 90 days,are reversed through profit and loss account.
8. Employee Stock Option Scheme (ESOS)
The Employees Stock Option Scheme (the Scheme) provides for grant of equity shares of the Bank towholetime directors and employees of the Bank and its subsidiaries. The Scheme provides that employees aregranted an option to subscribe to equity shares of the Bank that vest in a graded manner. The options may beexercised within a specified period. The Bank follows the intrinsic value method to account for its stock-basedemployee compensation plans. Compensation cost is measured as the excess, if any, of the fair market priceof the underlying stock over the exercise price on the grant date. The fair market price is the latest closingprice, immediately prior to the date of the Board of Directors meeting in which the options are granted, on thestock exchange on which the shares of the Bank are listed. If the shares are listed on more than one stockexchange, then the stock exchange where there is highest trading volume on the said date is considered.
Since the exercise price of the Bank’s stock options is equal to fair market price on the grant date, thereis no compensation cost under the intrinsic value method.
The Finance (No.2) Act, 2009 has abolished fringe benefit tax (FBT) and introduced tax on the perquisitevalue in the hands of the employees which is computed on the difference between the fair market value on dateof exercise and the exercise price with effect from April 1, 2009.
9. Staff Retirement Benefits
Gratuity
ICICI Bank pays gratuity to employees who retire or resign after a minimum period of five years ofcontinuous service and in case of employees at overseas locations as per the rules in force in the respectivecountries. ICICI Bank makes contributions to four separate gratuity funds, for employees inducted fromerstwhile ICICI Limited (erstwhile ICICI), employees inducted from erstwhile Bank of Madura, employeesinducted from erstwhile The Sangli Bank Limited (erstwhile Sangli Bank) and employees of ICICI Bank otherthan employees inducted from erstwhile ICICI, erstwhile Bank of Madura and erstwhile Sangli Bank.
Separate gratuity funds for employees inducted from erstwhile ICICI, erstwhile Bank of Madura anderstwhile Sangli Bank are managed by ICICI Prudential Life Insurance Company Limited. The gratuity fundfor employees of ICICI Bank, other than employees inducted from erstwhile ICICI, erstwhile Bank of Maduraand erstwhile Sangli Bank is administered by Life Insurance Corporation of India and ICICI Prudential LifeInsurance Company Limited.
Actuarial valuation of the gratuity liability for all the above funds is determined by an actuary appointedby the Bank. In accordance with the gratuity funds’ rules, actuarial valuation of gratuity liability is calculatedbased on certain assumptions regarding rate of interest, salary growth, mortality and staff attrition as per theprojected unit credit method.
Superannuation Fund
ICICI Bank contributes 15.0% of the total annual basic salary of each employee to a superannuation fundfor ICICI Bank employees. The employee gets an option on retirement or resignation to commute one-thirdof the total credit balance in his/her account and receive a monthly pension based on the remaining balance.In the event of death of an employee, his or her beneficiary receives the remaining accumulated balance. ICICIBank also gives an option to its employees, allowing them to receive the amount contributed by ICICI Bankalong with their monthly salary during their employment.
F-62
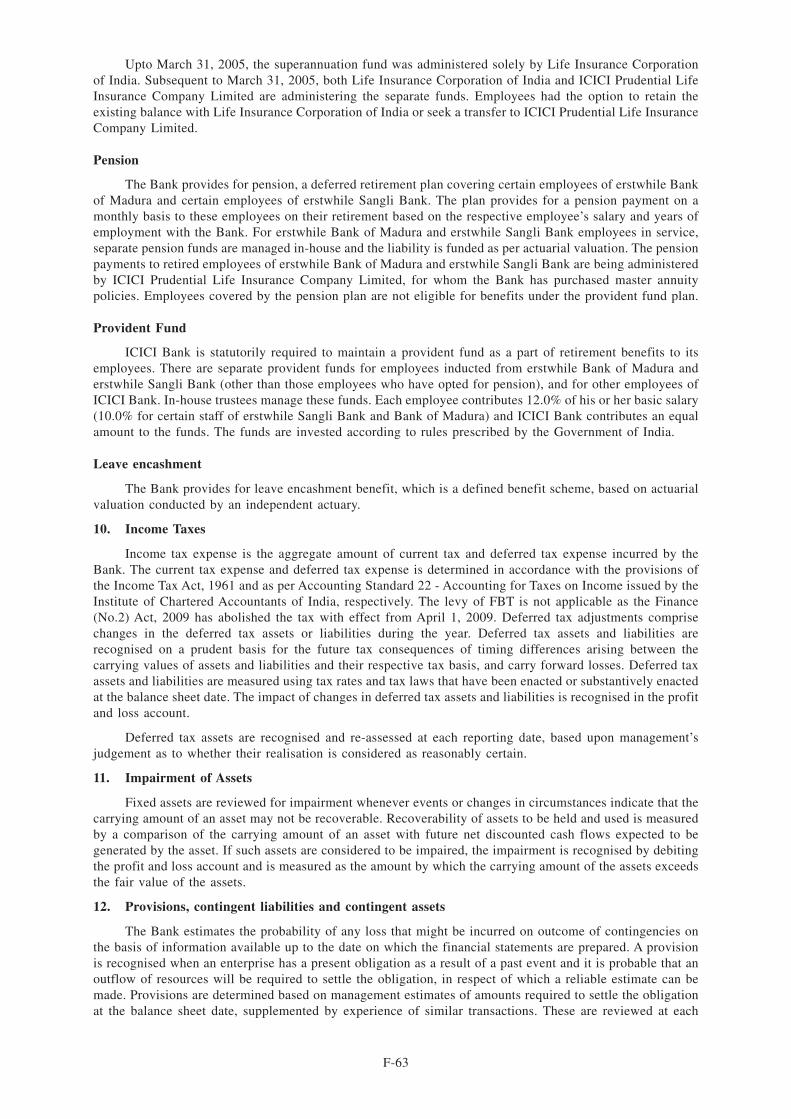
Upto March 31, 2005, the superannuation fund was administered solely by Life Insurance Corporationof India. Subsequent to March 31, 2005, both Life Insurance Corporation of India and ICICI Prudential LifeInsurance Company Limited are administering the separate funds. Employees had the option to retain theexisting balance with Life Insurance Corporation of India or seek a transfer to ICICI Prudential Life InsuranceCompany Limited.
Pension
The Bank provides for pension, a deferred retirement plan covering certain employees of erstwhile Bankof Madura and certain employees of erstwhile Sangli Bank. The plan provides for a pension payment on amonthly basis to these employees on their retirement based on the respective employee’s salary and years ofemployment with the Bank. For erstwhile Bank of Madura and erstwhile Sangli Bank employees in service,separate pension funds are managed in-house and the liability is funded as per actuarial valuation. The pensionpayments to retired employees of erstwhile Bank of Madura and erstwhile Sangli Bank are being administeredby ICICI Prudential Life Insurance Company Limited, for whom the Bank has purchased master annuitypolicies. Employees covered by the pension plan are not eligible for benefits under the provident fund plan.
Provident Fund
ICICI Bank is statutorily required to maintain a provident fund as a part of retirement benefits to itsemployees. There are separate provident funds for employees inducted from erstwhile Bank of Madura anderstwhile Sangli Bank (other than those employees who have opted for pension), and for other employees ofICICI Bank. In-house trustees manage these funds. Each employee contributes 12.0% of his or her basic salary(10.0% for certain staff of erstwhile Sangli Bank and Bank of Madura) and ICICI Bank contributes an equalamount to the funds. The funds are invested according to rules prescribed by the Government of India.
Leave encashment
The Bank provides for leave encashment benefit, which is a defined benefit scheme, based on actuarialvaluation conducted by an independent actuary.
10. Income Taxes
Income tax expense is the aggregate amount of current tax and deferred tax expense incurred by theBank. The current tax expense and deferred tax expense is determined in accordance with the provisions ofthe Income Tax Act, 1961 and as per Accounting Standard 22 - Accounting for Taxes on Income issued by theInstitute of Chartered Accountants of India, respectively. The levy of FBT is not applicable as the Finance(No.2) Act, 2009 has abolished the tax with effect from April 1, 2009. Deferred tax adjustments comprisechanges in the deferred tax assets or liabilities during the year. Deferred tax assets and liabilities arerecognised on a prudent basis for the future tax consequences of timing differences arising between thecarrying values of assets and liabilities and their respective tax basis, and carry forward losses. Deferred taxassets and liabilities are measured using tax rates and tax laws that have been enacted or substantively enactedat the balance sheet date. The impact of changes in deferred tax assets and liabilities is recognised in the profitand loss account.
Deferred tax assets are recognised and re-assessed at each reporting date, based upon management’sjudgement as to whether their realisation is considered as reasonably certain.
11. Impairment of Assets
Fixed assets are reviewed for impairment whenever events or changes in circumstances indicate that thecarrying amount of an asset may not be recoverable. Recoverability of assets to be held and used is measuredby a comparison of the carrying amount of an asset with future net discounted cash flows expected to begenerated by the asset. If such assets are considered to be impaired, the impairment is recognised by debitingthe profit and loss account and is measured as the amount by which the carrying amount of the assets exceedsthe fair value of the assets.
12. Provisions, contingent liabilities and contingent assets
The Bank estimates the probability of any loss that might be incurred on outcome of contingencies onthe basis of information available up to the date on which the financial statements are prepared. A provisionis recognised when an enterprise has a present obligation as a result of a past event and it is probable that anoutflow of resources will be required to settle the obligation, in respect of which a reliable estimate can bemade. Provisions are determined based on management estimates of amounts required to settle the obligationat the balance sheet date, supplemented by experience of similar transactions. These are reviewed at each
F-63

balance sheet date and adjusted to reflect the current management estimates. In cases where the availableinformation indicates that the loss on the contingency is reasonably possible but the amount of loss cannot bereasonably estimated, a disclosure to this effect is made in the financial statements. In case of remotepossibility neither provision nor disclosure is made in the financial statements. The Bank does not account foror disclose contingent assets, if any.
13. Earnings per share (EPS)
Basic and diluted earnings per share are computed in accordance with Accounting Standard 20 —Earnings per share.
Basic earnings per share is calculated by dividing the net profit or loss after tax for the year attributableto equity shareholders by the weighted average number of equity shares outstanding during the year.
Diluted earnings per share reflect the potential dilution that could occur if contracts to issue equity shareswere exercised or converted during the year. Diluted earnings per equity share is computed using the weightedaverage number of equity shares and dilutive potential equity shares outstanding during the year, except wherethe results are anti-dilutive.
14. Lease transactions
Lease payments for assets taken on operating lease are recognised as an expense in the profit and lossaccount over the lease term.
15. Cash and cash equivalents
Cash and cash equivalents include cash in hand, balances with RBI, balances with other banks andmoney at call and short notice.
F-64

SCHEDULE 19 — NOTES FORMING PART OF THE ACCOUNTS
The following additional disclosures have been made taking into account the requirements of accountingstandards and Reserve Bank of India (RBI) guidelines in this regard.
1. Capital adequacy ratio
The Bank is subject to the capital adequacy norms stipulated by the RBI guidelines on Basel II whichbecame applicable with effect from March 31, 2008. The guidelines require the Bank to maintain a minimumratio of total capital to risk adjusted assets (CRAR) of 9.0%, with a minimum Tier I capital ratio of 6.0%. Priorto March 31, 2008, the Bank was subject to the capital adequacy norms as stipulated by the RBI guidelineson Basel I.
RBI has stipulated that the minimum capital maintained by banks on adoption of the Basel II frameworkshall be subject to a prudential floor, which shall be higher of the minimum capital required as per Basel IIor a specified percentage of the minimum capital required as per Basel I (80% at March 31, 2010). Thecomputation under Basel II guidelines results in a higher minimum capital requirement as compared to BaselI and hence the capital adequacy at March 31, 2010 has been maintained and reported by the Bank as per BaselII guidelines.
The following table sets forth, for the periods indicated, computation of capital adequacy.
As per Basel I framework As per Basel II framework
At March 31,
2010
At March 31,
2009
At March 31,
2010
At March 31,
2009
(Rupees in million)
Tier I capital ................................................................ 432,614.3 420,098.1 410,615.1 421,967.6(Of which Lower Tier I) .............................................. 28,210.0 30,168.6 28,210.0 30,168.6Tier II capital............................................................... 181,569.1 129,715.9 160,409.9 131,585.3(Of which Upper Tier II) ............................................. 137,912.0 109,100.0 137,912.0 109,100.0Total capital ................................................................. 614,183.4 549,814.0 571,025.0 553,552.9Total risk weighted assets............................................ 3,208,425.4 3,453,378.9 2,941,805.8 3,564,629.9CRAR (%) ................................................................... 19.14% 15.92% 19.41% 15.53%CRAR — Tier I capital (%) ........................................ 13.48% 12.16% 13.96% 11.84%CRAR — Tier II capital (%)....................................... 5.66% 3.76% 5.45% 3.69%Amount raised by issue of Innovative Perpetual DebtInstruments (IPDI) during the year ............................. — — — —Amount of subordinated debt raised as Tier IIcapital during the year................................................. 62,000.0 45,210.0 62,000.0 45,210.0
2. Business/information ratios
The following table sets forth, for the periods indicated, the business/information ratios.
Year ended
March 31, 2010
Year ended
March 31, 2009
i) Interest income to working funds1 ......................................................... 7.19% 8.11%ii) Non-interest income to working funds1 ................................................. 2.09% 1.98%iii) Operating profit to working funds1 ......................................................... 2.72% 2.33%iv) Return on assets2 ..................................................................................... 1.13% 0.98%v) Profit per employee (Rs. in million) ....................................................... 1.2 1.1vi) Business per employee (average deposits plus average advances)3
(Rs. in million) ........................................................................................ 102.9 115.4
1. For the purpose of computing the ratio, working funds represent the average of total assets as reported in Form Xto RBI under Section 27 of the Banking Regulation Act, 1949.
2. For the purpose of computing the ratio, assets represent average total assets as reported to RBI in Form X underSection 27 of the Banking Regulation Act, 1949.
F-65

3. For the purpose of computing the ratio, deposits and advances are the total deposits and total advances as reportedto RBI in Form A under Section 42(2) of the Reserve Bank of India Act, 1934. The average deposits and the averageadvances represent the simple average of the figures reported in Form A to RBI under Section 42(2) of the Reserve
Bank of India Act, 1934.
3. Information about business and geographical segments
Business Segments
Pursuant to the guidelines issued by RBI on Accounting Standard 17 — (Segment Reporting) —Enhancement of Disclosures dated April 18, 2007, effective from year ended March 31, 2008, the followingbusiness segments have been reported.
• Retail Banking includes exposures which satisfy the four criteria of orientation, product,granularity and low value of individual exposures for retail exposures laid down in BaselCommittee on Banking Supervision document “International Convergence of CapitalMeasurement and Capital Standards: A Revised Framework”.
• Wholesale Banking includes all advances to trusts, partnership firms, companies and statutorybodies, which are not included under Retail Banking.
• Treasury includes the entire investment portfolio of the Bank.
• Other Banking includes hire purchase and leasing operations and other items not attributable to anyparticular business segment.
Income, expenses, assets and liabilities are either specifically identified with individual segments or areallocated to segments on a systematic basis.
All liabilities are transfer priced to a central treasury unit, which pools all funds and lends to the businessunits at appropriate rates based on the relevant maturity of assets being funded after adjusting for regulatoryreserve requirements.
The following tables set forth, for the period indicated, the business segment results on this basis.
For the year ended March 31, 2010
Particulars Retail Banking
Wholesale
Banking Treasury
Other Banking
Business Total
(Rupees in million)
1 Revenue.................................... 177,244.1 192,541.3 247,978.0 4,375.7 622,139.12 Less: Inter-segment revenue..... 290,293.33 Total revenue (1) - (2) ............. 331,845.84 Segment results ........................ (13,335.1) 36,451.0 27,886.4 2,450.9 53,453.25 Unallocated expenses ............... —6 Income tax expenses (net of
deferred tax credit)................... 13,203.47 Net profit (4) - (5) - (6) ........... 40,249.88 Segment assets ......................... 737,339.9 1,184,314.3 1,642,098.9 10,676.8 3,574,429.99 Unallocated assets1................... 59,567.310 Total assets (8) + (9)................ 3,633,997.211 Segment liabilities .................. 1,186,393.0 915,021.2 1,525,898.62 5,970.5 3,633,283.312 Unallocated liabilities............... 713.913 Total liabilities (11) + (12) ...... 3,633,997.214 Capital expenditure .................. 1,721.0 635.8 2.9 17.6 2,377.315 Depreciation ............................. 3,749.0 996.4 16.3 1,433.3 6,195.0
1. Includes tax paid in advance/tax deducted at source (net) and deferred tax asset (net).
2. Includes share capital and reserves and surplus.
F-66

For the year ended March 31, 2009
Particulars Retail BankingWholesaleBanking Treasury
Other BankingBusiness Total
(Rupees in million)1 Revenue.................................... 230,152.1 248,077.1 295,908.7 6,125.7 780,263.62 Less: Inter-segment revenue..... 393,300.93 Total revenue (1) - (2) ............. 386,962.74 Segment results ....................... 580.5 34,133.1 12,843.5 3,612.6 51,169.75 Unallocated expenses ............... —6 Income tax expenses (net of
deferred tax credit)................... 13,588.47 Net profit (4) - (5) - (6) .......... 37,581.38 Segment assets ......................... 958,656.7 1,357,062.5 1,400,638.6 11,887.0 3,728,244.89 Unallocated assets1................... 64,764.810 Total assets (8) + (9)............... 3,793,009.611 Segment liabilities .................. 1,117,555.2 1,111,564.6 1,529,581.82 6,166.6 3,764,868.212 Unallocated liabilities............... 28,141.413 Total liabilities (11) + (12) ..... 3,793,009.614 Capital expenditure .................. 4,224.2 1,264.2 3.3 36.9 5,528.615 Depreciation ............................. 3,628.6 1,027.3 4.7 2,125.4 6,786.0
1. Includes tax paid in advance/tax deducted at source (net) and deferred tax asset (net).
2. Includes share capital and reserves and surplus.
Geographical segments
The Bank reports its operations under the following geographical segments.
• Domestic operations comprise branches in India
• Foreign operations comprise branches outside India and offshore banking unit in India.
The following tables set forth, for the periods indicated, geographical segmental results.
Revenue
Year ended
March 31, 2010
Year ended
March 31, 2009
(Rupees in million)
Domestic operations ......................................................................................... 287,247.7 347,986.2Foreign operations ............................................................................................ 44,598.1 38,976.6
Total .................................................................................................................. 331,845.8 386,962.8
Assets
At
March 31, 2010
At
March 31, 2009
(Rupees in million)
Domestic operations ......................................................................................... 2,963,616.4 3,004,203.2Foreign operations ............................................................................................ 611,827.7 733,259.4
Total .................................................................................................................. 3,575,444.1 3,737,462.6
Capital expenditure incurred
during the year ended
Depreciation provided
during the year ended
March 31, 2010 March 31, 2009 March 31, 2010 March 31, 2009
(Rupees in million)
Domestic operations ....................................... 2,341.0 5,431.7 6,147.6 6,734.1Foreign operations .......................................... 36.3 96.9 47.4 51.9
Total ................................................................ 2,377.3 5,528.6 6,195.0 6,786.0
F-67
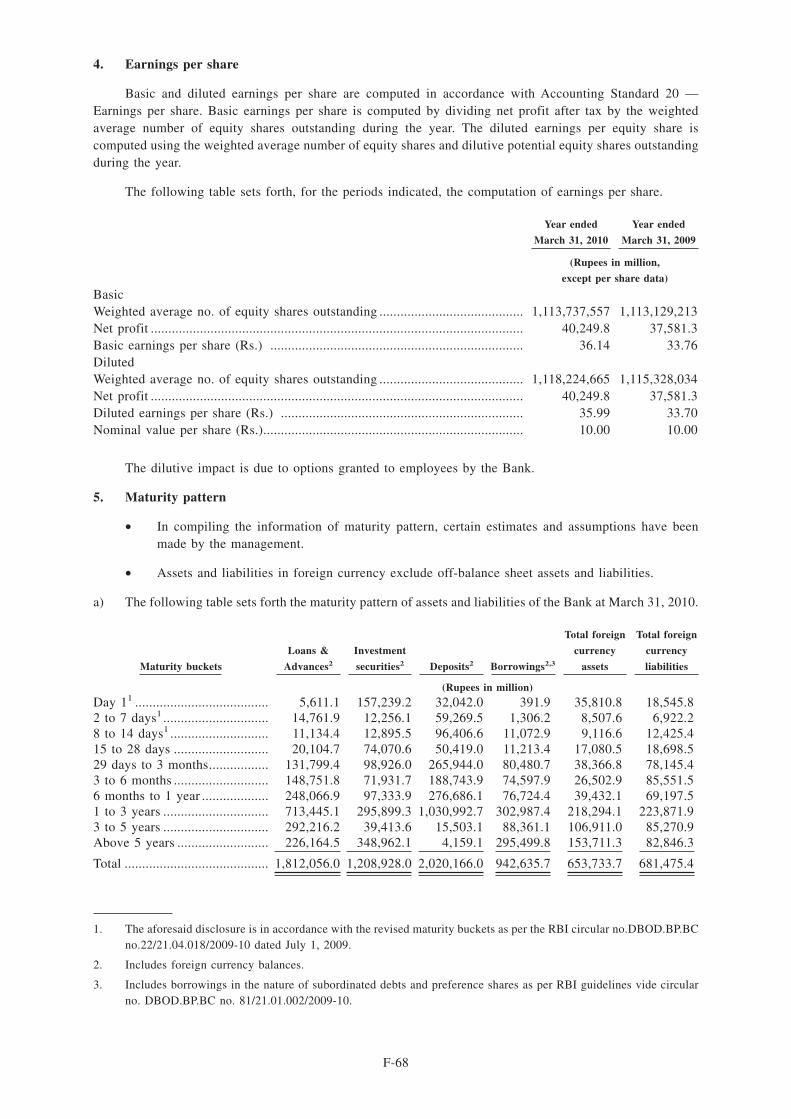
4. Earnings per share
Basic and diluted earnings per share are computed in accordance with Accounting Standard 20 —Earnings per share. Basic earnings per share is computed by dividing net profit after tax by the weightedaverage number of equity shares outstanding during the year. The diluted earnings per equity share iscomputed using the weighted average number of equity shares and dilutive potential equity shares outstandingduring the year.
The following table sets forth, for the periods indicated, the computation of earnings per share.
Year ended
March 31, 2010
Year ended
March 31, 2009
(Rupees in million,
except per share data)
BasicWeighted average no. of equity shares outstanding ......................................... 1,113,737,557 1,113,129,213Net profit .......................................................................................................... 40,249.8 37,581.3Basic earnings per share (Rs.) ........................................................................ 36.14 33.76DilutedWeighted average no. of equity shares outstanding ......................................... 1,118,224,665 1,115,328,034Net profit .......................................................................................................... 40,249.8 37,581.3Diluted earnings per share (Rs.) ..................................................................... 35.99 33.70Nominal value per share (Rs.).......................................................................... 10.00 10.00
The dilutive impact is due to options granted to employees by the Bank.
5. Maturity pattern
• In compiling the information of maturity pattern, certain estimates and assumptions have beenmade by the management.
• Assets and liabilities in foreign currency exclude off-balance sheet assets and liabilities.
a) The following table sets forth the maturity pattern of assets and liabilities of the Bank at March 31, 2010.
Maturity buckets
Loans &
Advances2
Investment
securities2 Deposits2 Borrowings2,3
Total foreign
currency
assets
Total foreign
currency
liabilities
(Rupees in million)
Day 11 ...................................... 5,611.1 157,239.2 32,042.0 391.9 35,810.8 18,545.82 to 7 days1 .............................. 14,761.9 12,256.1 59,269.5 1,306.2 8,507.6 6,922.28 to 14 days1 ............................ 11,134.4 12,895.5 96,406.6 11,072.9 9,116.6 12,425.415 to 28 days ........................... 20,104.7 74,070.6 50,419.0 11,213.4 17,080.5 18,698.529 days to 3 months................. 131,799.4 98,926.0 265,944.0 80,480.7 38,366.8 78,145.43 to 6 months ........................... 148,751.8 71,931.7 188,743.9 74,597.9 26,502.9 85,551.56 months to 1 year ................... 248,066.9 97,333.9 276,686.1 76,724.4 39,432.1 69,197.51 to 3 years .............................. 713,445.1 295,899.3 1,030,992.7 302,987.4 218,294.1 223,871.93 to 5 years .............................. 292,216.2 39,413.6 15,503.1 88,361.1 106,911.0 85,270.9Above 5 years .......................... 226,164.5 348,962.1 4,159.1 295,499.8 153,711.3 82,846.3
Total ......................................... 1,812,056.0 1,208,928.0 2,020,166.0 942,635.7 653,733.7 681,475.4
1. The aforesaid disclosure is in accordance with the revised maturity buckets as per the RBI circular no.DBOD.BP.BCno.22/21.04.018/2009-10 dated July 1, 2009.
2. Includes foreign currency balances.
3. Includes borrowings in the nature of subordinated debts and preference shares as per RBI guidelines vide circularno. DBOD.BP.BC no. 81/21.01.002/2009-10.
F-68

b) The following table sets forth the maturity pattern of assets and liabilities of the Bank at March 31, 2009.
Maturity Buckets
Loans &
Advances1
Investment
securities1 Deposits1 Borrowings1,2
Total foreign
currency
assets
Total foreign
currency
liabilities
(Rupees in million)
1 to 14 days ............................. 77,002.6 116,387.7 159,613.6 17,973.0 92,686.3 52,220.815 to 28 days ........................... 18,547.3 45,611.8 80,388.8 20,224.0 12,581.7 26,476.929 days to 3 months................. 95,975.6 101,038.8 381,487.7 45,557.0 20,572.8 68,052.03 to 6 months ........................... 112,396.9 74,045.9 356,088.8 59,445.9 17,960.5 55,441.06 months to 1 year ................... 220,770.0 99,709.9 458,313.7 80,134.0 29,985.6 87,612.21 to 3 years .............................. 887,376.0 260,527.2 731,623.0 257,189.3 156,996.3 215,855.33 to 5 years .............................. 423,545.6 25,850.1 14,368.4 190,317.0 219,948.8 164,054.1Above 5 years .......................... 347,494.5 307,411.7 1,594.2 260,714.3 226,356.6 110,888.5
Total ......................................... 2,183,108.5 1,030,583.1 2,183,478.2 931,554.5 777,088.6 780,600.8
1. Includes foreign currency balances.
2. Includes borrowings in the nature of subordinated debts and preference shares as per RBI guidelines vide circularno. DBOD.BP.BC no. 81/21.01.002/2009-10.
6. Related party transactions
The Bank has transactions with its related parties comprising subsidiaries, associates/joint ventures/otherrelated entities, key management personnel and relatives of key management personnel.
Subsidiaries
ICICI Bank UK PLC, ICICI Bank Canada, ICICI Bank Eurasia Limited Liability Company, ICICIPrudential Life Insurance Company Limited1, ICICI Lombard General Insurance Company Limited1, ICICIPrudential Asset Management Company Limited1, ICICI Securities Limited, ICICI Securities PrimaryDealership Limited, ICICI Home Finance Company Limited, ICICI Venture Funds Management CompanyLimited, ICICI International Limited, ICICI Trusteeship Services Limited, ICICI Investment ManagementCompany Limited, ICICI Securities Holdings Inc., ICICI Securities Inc., ICICI Prudential Trust Limited1,ICICI Wealth Management Inc. (upto December 31, 2009) and ICICI Prudential Pension Funds ManagementCompany Limited2.
1. Jointly controlled entities.
2. For an entity that has been identified as a related party during the year ended March 31, 2010, previous year’scomparative figures have not been reported.
Associates/joint ventures/other related entities
ICICI Equity Fund1, ICICI Eco-net Internet and Technology Fund1, ICICI Emerging Sectors Fund1,ICICI Strategic Investments Fund1, ICICI Kinfra Limited1, ICICI West Bengal Infrastructure DevelopmentCorporation Limited1, Financial Information Network and Operations Limited, TCW/ICICI InvestmentPartners LLC, TSI Ventures (India) Private Limited (upto June 30, 2008), I-Process Services (India) PrivateLimited, I-Solutions Providers (India) Private Limited, NIIT Institute of Finance, Banking and InsuranceTraining Limited, ICICI Venture Value Fund1, Comm Trade Services Limited, Loyalty Solutions & ResearchLimited1, Transafe Services Limited1 (upto June 30, 2009), Prize Petroleum Company Limited, ICICIFoundation for Inclusive Growth, Firstsource Solutions Limited (upto December 31, 2009), I-Ven BiotechLimited1, Rainbow Fund2, Contests2win.com India Private Limited (upto March 31, 2009), CrossdomainSolutions Private Limited (upto March 31, 2009) and ICICI Merchant Services Private Limited2.
1. Entities consolidated as per Accounting Standard (AS) 21 on ‘Consolidated Financial Statements’.
2. For entities that have been identified as related parties during the year ended March 31, 2010, previous year’s comparative figureshave not been reported.
F-69

Key management personnel
Mr. K. V. Kamath1, Ms. Chanda D. Kochhar, Mr. Sandeep Bakhshi2, Mr. N. S. Kannan2, Mr. K.Ramkumar3, Mr. Sonjoy Chatterjee, Mr. V. Vaidyanathan1, Ms. Madhabi Puri Buch4.
Relatives of key management personnel
Ms. Rajalakshmi Kamath1, Mr. Ajay Kamath1, Ms. Ajnya Pai1, Mr. Mohan Kamath1, Mr. DeepakKochhar, Mr. Arjun Kochhar, Ms. Aarti Kochhar, Mr. Mahesh Advani, Ms. Varuna Karna, Ms. Sunita R.Advani, Ms. Mona Bakhshi2, Mr. Sameer Bakhshi2, Ms. Rangarajan Kumudalakshmi2, Ms. Aditi Kannan2, Mr.Narayanan Raghunathan2, Mr. Narayanan Rangarajan2, Mr. Narayanan Krishnamachari2, Ms. NarayananSudha2, Mr. R. Shyam3, Ms. R. Suchithra3, Ms. J. Krishnaswamy3, Mr. K. Jayakumar3, Ms. AmeetaChatterjee, Mr. Somnath Chatterjee, Mr. Tarak Nath Chatterjee, Ms. Sunaina Chatterjee, Ms. NandiniChatterjee, Ms. Jeyashree V.1, Mr. V. Satyamurthy1, Mr. V. Krishnamurthy1, Mr. K. Vembu1, Mr. DhavalBuch4, Mr. Kamal Puri4, Ms. Rama Puri4.
1. Transactions reported upto April 30, 2009.
2. Transactions reported with effect from May 1, 2009.
3. Transactions reported with effect from February 1, 2009.
4. Transactions reported upto January 31, 2009.
The following were the significant transactions between the Bank and its related parties for the yearended March 31, 2010. A specific related party transaction is disclosed as a material related party transactionwherever it exceeds 10% of all related party transactions in that category.
Insurance services
During the year ended March 31, 2010, the Bank paid insurance premium to insurance subsidiariesamounting to Rs. 1,162.5 million (March 31, 2009: Rs. 1,132.6 million). The material transaction for the yearended March 31, 2010 was payment of insurance premium to ICICI Lombard General Insurance CompanyLimited amounting to Rs. 1,057.3 million (March 31, 2009: Rs. 1,039.9 million).
During the year ended March 31, 2010, the Bank’s insurance claims from the insurance subsidiariesamounted to Rs. 876.1 million (March 31, 2009: Rs. 965.1 million). The material transaction for the yearended March 31, 2010 was with ICICI Lombard General Insurance Company Limited amounting to Rs. 823.0million (March 31, 2009: Rs. 924.1 million).
Fees and commission
During the year ended March 31, 2010, the Bank received fees from its subsidiaries amounting to Rs.3,793.9 million (March 31, 2009: Rs. 3,704.8 million), from its associates/joint ventures/other related entitiesamounting to Rs. 5.3 million (March 31, 2009: Rs. 142.1 million), from key management personnel amountingto Rs. 0.2 million (March 31, 2009: Rs. 0.6 million) and from relatives of key management personnelamounting to Rs. 0.1 million (March 31, 2009: Nil). The material transactions for the year ended March 31,2010 were with ICICI Securities Limited amounting to Rs. 437.4 million (March 31, 2009: Rs. 454.8 million),ICICI Prudential Life Insurance Company Limited amounting to Rs. 2,708.9 million (March 31, 2009: Rs.2,385.3 million) and ICICI Lombard General Insurance Company Limited amounting to Rs. 403.5 million(March 31, 2009: Rs. 625.6 million).
During the year ended March 31, 2010, the Bank received commission from its subsidiaries amountingto Rs. 8.1 million (March 31, 2009: Rs. 9.0 million) and from its associates/joint ventures/other related entitiesamounting to Rs. 15.4 million (March 31, 2009: Rs. 7.5 million). The material transactions for the year endedMarch 31, 2010 were with ICICI Home Finance Company Limited amounting to Rs. 5.7 million (March 31,2009: Rs. 7.8 million) and Firstsource Solutions Limited amounting to Rs. 15.3 million (March 31, 2009: Rs.7.2 million).
Lease of premises and facilities
During the year ended March 31, 2010, the Bank recovered from its subsidiaries an amount of Rs.1,493.9 million (March 31, 2009: Rs. 1,670.5 million) and from its associates/joint ventures/other relatedentities an amount of Rs. 34.5 million (March 31, 2009: Rs. 7.0 million) for lease of premises, facilities andother administrative costs. The material transactions for the year ended March 31, 2010 were with ICICISecurities Limited amounting to Rs. 231.9 million (March 31, 2009: Rs. 361.5 million), ICICI Home Finance
F-70

Company Limited amounting to Rs. 484.0 million (March 31, 2009: Rs. 344.2 million), ICICI Bank UK PLCamounting to Rs. 263.9 million (March 31, 2009: Rs. 431.6 million), ICICI Lombard General InsuranceCompany Limited amounting to Rs. 175.0 million (March 31, 2009: Rs. 202.4 million) and ICICI PrudentialLife Insurance Company Limited amounting to Rs. 203.1 million (March 31, 2009: Rs. 164.0 million).
Secondment of employees
During the year ended March 31, 2010, the Bank received compensation from its subsidiaries amountingto Rs. 24.8 million (March 31, 2009: Rs. 277.1 million) and from its associates/joint ventures/other relatedentities amounting to Rs. 36.8 million (March 31, 2009: Rs. 16.8 million) for secondment of employees. Thematerial transactions for the year ended March 31, 2010 were with ICICI Merchant Services Private Limitedamounting to Rs. 22.5 million, ICICI Home Finance Company Limited amounting to Nil (March 31, 2009: Rs.217.2 million), ICICI Securities Limited amounting to Rs. 13.0 million (March 31, 2009: Rs. 53.4 million),ICICI West Bengal Infrastructure Development Corporation Limited amounting to Rs. 9.8 million (March 31,2009: Rs. 11.5 million) and ICICI Investment Management Company Limited amounting to Rs. 11.9 million(March 31, 2009: Nil).
Purchase of investments
During the year ended March 31, 2010, the Bank purchased certain investments from its subsidiariesamounting to Rs. 6,355.0 million (March 31, 2009: Rs. 15,170.3 million). The material transactions for theyear ended March 31, 2010 were with ICICI Securities Primary Dealership Limited amounting to Rs. 5,414.1million (March 31, 2009: Rs. 6,695.0 million) and ICICI Prudential Life Insurance Company Limitedamounting to Rs. 704.7 million (March 31, 2009: Rs. 7,922.9 million).
During the year ended March 31, 2010, the Bank invested in the equity shares, preference shares andbonds of its subsidiaries amounting to Rs. 32.1 million (March 31, 2009: Rs. 41,755.0 million) and in itsassociates/joint ventures/other related entities amounting to Rs. 765.3 million (March 31, 2009: Nil). Thematerial transactions for the year ended March 31, 2010 were with ICICI Merchant Services Private Limitedamounting to Rs. 755.8 million, ICICI Prudential Life Insurance Company Limited amounting to Rs. 32.1million (March 31, 2009: Rs. 8,081.6 million), ICICI Bank UK PLC amounting to Nil (March 31, 2009: Rs.4,696.5 million) and ICICI Bank Canada amounting to Nil (March 31, 2009: Rs. 22,188.3 million).
At March 31, 2010 ICICI Bank has applied for equity shares in ICICI Securities Limited, which havenot yet been allotted. The amount of application money is Rs. 1.00 billion.
Sale of investments
During the year ended March 31, 2010, the Bank sold certain investments to its subsidiaries amountingto Rs. 3,646.0 million (March 31, 2009: Rs. 11,547.9 million). The material transactions were with ICICISecurities Primary Dealership Limited amounting to Rs. 2,408.8 million (March 31, 2009: Rs. 5,103.5million), ICICI Prudential Life Insurance Company Limited amounting to Rs. 1,237.2 million (March 31,2009: Rs. 4,058.0 million) and with ICICI Bank UK PLC amounting to Nil (March 31, 2009: Rs. 1,836.0million).
Investment in bonds and Certificate of Deposits (CDs) issued by ICICI Bank
During the year ended March 31, 2010, subsidiaries have invested in bonds issued by the Bankamounting to Rs. 650.0 million (March 31, 2009: Nil). The material transactions for the year ended March 31,2010 were with ICICI Securities Primary Dealership Limited amounting to Rs. 150.0 million (March 31, 2009:Nil) and with ICICI Prudential Life Insurance Company Limited amounting to Rs. 500.0 million (March 31,2009: Nil).
During the year ended March 31, 2010, subsidiaries have invested in certificate of deposits (CDs) issuedby the Bank amounting to Rs. 11,173.9 million (March 31, 2009: Rs. 2,306.8 million). The materialtransactions for the year ended March 31, 2010 were with ICICI Securities Primary Dealership Limitedamounting to Rs. 2,338.6 million (March 31, 2009: Nil) and with ICICI Prudential Life Insurance CompanyLimited amounting to Rs. 8,131.2 million (March 31, 2009: Rs. 2,306.8 million).
Redemption/buyback and conversion of investments
During the year ended March 31, 2010, the Bank received a consideration from its subsidiariesamounting to Nil (March 31, 2009: Rs. 583.5 million) on account of redemption/buyback of equity shares bysubsidiaries and from its associates/joint ventures/other related entities amounting to Rs. 1,379.9 million
F-71

(March 31, 2009: Rs. 183.5 million) on account of redemption/buyback/distribution of loss on units/equityshares by associates/joint ventures/other related entities. The material transactions were with ICICI EmergingSectors Fund amounting to Rs. 846.4 million (March 31, 2009: Nil), ICICI Eco-net Internet and TechnologyFund amounting to Rs. 533.5 million (March 31, 2009: Nil), ICICI Securities Primary Dealership Limitedamounting to Nil (March 31, 2009: Rs. 583.5 million) and ICICI Equity Fund amounting to Nil (March 31,2009: Rs. 125.0 million).
Reimbursement of expenses
During the year ended March 31, 2010, the Bank reimbursed expenses to its subsidiaries amounting toRs. 11.7 million (March 31, 2009: Rs. 60.8 million). The material transactions were with ICICI Bank Canadaamounting to Rs. 11.7 million (March 31, 2009: Nil) and ICICI Home Finance Company Limited amountingto Nil (March 31, 2009: Rs. 60.8 million).
Brokerage and fee expenses
During the year ended March 31, 2010, the Bank paid brokerage/fees to its subsidiaries amounting to Rs.865.5 million (March 31, 2009: Rs. 627.0 million) and to its associates/joint ventures/other related entitiesamounting to Rs. 1,346.2 million (March 31, 2009: Rs. 2,151.2 million). The material transactions for the yearended March 31, 2010 were with I-Process Services (India) Private Limited amounting to Rs. 686.1 million(March 31, 2009: Rs. 1,027.5 million), ICICI Home Finance Company Limited amounting to Rs. 608.2 million(March 31, 2009: Rs. 438.7 million) and Loyalty Solutions & Research Limited amounting to Rs. 407.0million (March 31, 2009: Rs. 673.6 million).
Custodial charges income
During the year ended March 31, 2010, the Bank recovered custodial charges from its subsidiariesamounting to Rs. 1.6 million (March 31, 2009: Rs. 11.4 million) and from its associates/joint ventures/otherrelated entities amounting to Rs. 3.3 million (March 31, 2009: Rs. 3.3 million). The material transactions werewith ICICI Securities Primary Dealership Limited amounting to Rs. 1.5 million (March 31, 2009: Rs. 7.6million), ICICI Emerging Sectors Fund amounting to Rs. 1.3 million (March 31, 2009: Rs. 1.0 million), ICICIStrategic Investments Fund amounting to Rs. 1.1 million (March 31, 2009: Rs. 1.1 million), ICICI Equity Fundamounting to Rs. 0.8 million (March 31, 2009: Rs. 0.9 million), and ICICI Lombard General InsuranceCompany Limited amounting to Rs. 0.1 million (March 31, 2009: Rs. 3.8 million).
Interest expenses
During the year ended March 31, 2010, the Bank paid interest to its subsidiaries amounting to Rs. 902.2million (March 31, 2009: Rs. 869.3 million), to its associates/joint ventures/other related entities amountingto Rs. 3.3 million (March 31, 2009: Rs. 11.6 million), to its key management personnel amounting to Rs. 2.5million (March 31, 2009: Rs. 2.3 million) and to relatives of key management personnel amounting to Rs. 1.2million (March 31, 2009: Rs. 1.3 million). The material transactions for the year ended March 31, 2010 werewith ICICI Securities Limited amounting to Rs. 159.3 million (March 31, 2009: Rs. 171.0 million), ICICIBank UK PLC amounting to Rs. 49.8 million (March 31, 2009: Rs. 98.9 million), ICICI Prudential LifeInsurance Company Limited amounting to Rs. 420.4 million (March 31, 2009: Rs. 427.7 million), ICICILombard General Insurance Company Limited amounting to Rs. 54.0 million (March 31, 2009: Rs. 94.3million) and with ICICI Bank Eurasia Limited Liability Company amounting to Rs. 146.8 million (March 31,2009: Rs. 3.1 million).
Interest income
During the year ended March 31, 2010, the Bank received interest from its subsidiaries amounting to Rs.1,588.0 million (March 31, 2009: Rs. 1,468.2 million), from its associates/joint ventures/other related entitiesamounting to Rs. 2.9 million (March 31, 2009: Rs. 5.3 million), from its key management personnelamounting to Rs. 0.5 million (March 31, 2009: Rs. 2.3 million) and from relatives of key managementpersonnel amounting to Rs. 1.0 million (March 31, 2009: Rs. 0.3 million). The material transactions for theyear ended March 31, 2010 were with ICICI Home Finance Company Limited amounting to Rs. 913.7 million(March 31, 2009: Rs. 520.3 million), ICICI Bank Eurasia Limited Liability Company amounting to Rs. 351.0million (March 31, 2009: Rs. 547.1 million) and with ICICI Bank UK PLC amounting to Rs. 123.3 million(March 31, 2009: Rs. 171.2 million).
F-72

Other income
The Bank undertakes derivative transactions with its subsidiaries, associates, joint ventures and otherrelated entities. The Bank manages its foreign exchange and interest rate risks arising from these transactionsby covering them in the market. During the year ended March 31, 2010, the loss on derivative transactionsentered into with subsidiaries was Rs. 17,346.2 million (March 31, 2009: gain of Rs. 16,054.5 million) andthe loss was Rs. 220.9 million (March 31, 2009: loss of Rs. 0.3 million) with its associates/joint ventures/otherrelated entities. The material transactions for the year ended March 31, 2010 were gain of Rs. 495.2 million(March 31, 2009: gain of Rs. 2,447.9 million) with ICICI Bank UK PLC, loss of Rs. 17,913.1 million (March31, 2009: gain of Rs. 11,931.0 million) with ICICI Bank Canada, loss of Rs. 50.7 million (March 31, 2009:gain of Rs. 1,795.0 million) with ICICI Securities Primary Dealership Limited and gain of Rs. 215.8 million(March 31, 2009: loss of Rs. 40.6 million) with ICICI Home Finance Company Limited. While the Bankcovers these transactions in the market, the above amounts represent only the transactions with its subsidiaries,associates, joint ventures and other related entities and not the offsetting/covering transactions, which resultsin lower net impact on the profit and loss account.
Dividend income
During the year ended March 31, 2010, the Bank received dividend from its subsidiaries amounting toRs. 3,692.7 million (March 31, 2009: Rs. 3,348.2 million). The material transactions for the year ended March31, 2010 were with ICICI Home Finance Company Limited amounting to Rs. 934.0 million (March 31, 2009:Rs. 740.6 million), ICICI Securities Limited amounting to Rs. 920.0 million (March 31, 2009: Rs. 240.1million), ICICI Lombard General Insurance Company Limited amounting to Rs. 476.1 million (March 31,2009: Nil), ICICI Securities Primary Dealership Limited amounting to Rs. 422.1 million (March 31, 2009: Rs.1,300.5 million), ICICI Prudential Asset Management Company Limited amounting to Rs. 409.6 million(March 31, 2009: Rs. 117.0 million) and ICICI Venture Funds Management Company Limited amounting toRs. 260.0 million (March 31, 2009: Rs. 950.0 million).
Dividend paid
During the year ended March 31, 2010, the Bank paid dividend to its key management personnelamounting to Rs. 4.5 million (March 31, 2009: Rs. 10.2 million). The dividend paid to Mr. K. V. Kamathduring the year ended March 31, 2009 was Rs. 5.4 million, dividend paid during the year ended March 31,2010 to Ms. Chanda D. Kochhar was Rs. 3.0 million (March 31, 2009: Rs. 3.0 million), to Mr. SandeepBakhshi was Rs. 0.03 million, to Mr. N. S. Kannan was Rs. 0.9 million, to Mr. K. Ramkumar was Rs. 0.2million (March 31, 2009: Rs. 0.2 million), to Mr. Sonjoy Chatterjee was Rs. 0.3 million (March 31, 2009: Rs.0.3 million), to Ms. Madhabi Puri Buch during the year ended March 31, 2009 was Rs. 1.1 million and to Mr.V. Vaidyanathan during the year ended March 31, 2009 was Rs. 0.2 million.
Remuneration to wholetime directors
Remuneration paid to the wholetime directors of the Bank during the year ended March 31, 2010 wasRs. 119.4 million (March 31, 2009: Rs. 91.7 million). The remuneration paid for the year ended March 31,2010 to Mr. K. V. Kamath was Rs. 4.1 million (March 31, 2009: Rs. 30.8 million), to Ms. Chanda D. Kochharwas Rs. 17.3 million (March 31, 2009: Rs. 18.4 million), to Mr. Sandeep Bakhshi was Rs. 12.6 million, to Mr.N. S. Kannan was Rs. 10.2 million, to Mr. K. Ramkumar was Rs. 53.7 million (includes perquisite value ofRs. 40.6 million on employee stock options (ESOPs) exercised) (March 31, 2009: Rs. 1.6 million), to Mr.Sonjoy Chatterjee was Rs. 19.6 million (includes perquisite value of Rs. 7.9 million on ESOPs exercised)(March 31, 2009: Rs. 13.0 million), to Ms. Madhabi Puri Buch during the year ended March 31, 2009 was Rs.13.5 million and to Mr. V. Vaidyanathan was Rs. 1.9 million (March 31, 2009: Rs. 14.4 million).
Sale of fixed assets
During the year ended March 31, 2010, the Bank sold fixed assets to its subsidiaries amounting to Rs.574.2 million (March 31, 2009: Rs. 65.3 million). The material transaction for the year ended March 31, 2010was with ICICI Home Finance Company Limited amounting to Rs. 570.0 million (March 31, 2009: Rs. 58.3million).
F-73

Purchase of fixed assets
During the year ended March 31, 2010, the Bank purchased fixed assets from its subsidiaries amountingto Rs. 21.3 million (March 31, 2009: Rs. 1.2 million) and from its associates/joint ventures/other relatedentities amounting to Nil (March 31, 2009: Rs. 13.0 million). The material transactions were with ICICISecurities Limited amounting to Rs. 19.2 million (March 31, 2009: Nil) and Financial Information Networkand Operations Limited amounting to Nil (March 31, 2009: Rs. 12.4 million).
Donation
During the year ended March 31, 2010, the Bank has given donation to ICICI Foundation for InclusiveGrowth amounting to Rs. 153.0 million (March 31, 2009: Rs. 300.0 million).
Transfer of merchant acquiring operations
During the year ended March 31, 2010, the Bank and First Data, a company engaged in electroniccommerce and payment services, formed a merchant acquiring alliance and a new entity, 81% owned by FirstData, was formed, which has acquired ICICI Bank’s merchant acquiring operations through transfer of assets,primarily comprising fixed assets and receivables, and assumption of liabilities, for a total consideration of Rs.3,744.0 million. This transfer of assets and liabilities to the new entity would be considered a ‘slump sale’ fortax purposes. The Bank realised a profit of Rs. 2,029.0 million from this transaction, which is included inSchedule 14 - “Other income”.
Letters of Comfort
The Bank has issued letters of comfort on behalf of its banking subsidiaries, ICICI Bank UK PLC andICICI Bank Canada. The details of the letters are given below.
On behalf of To Purpose
ICICI Bank UK PLC ............... Financial Services Authority, UK(‘FSA’)
Financially support ICICI Bank UKPLC to ensure that it meets all of itsobligations as they fall due.
ICICI Bank Canada.................. Canada Deposit InsuranceCorporation (‘CDIC’)
To comply with the Bank Act and theCDIC regulations or by-laws thereunder and to indemnify CDIC againstall losses, damages, reasonable costsand expenses arising from failure ofICICI Bank Canada in performing thesame.
The Bank has issued an undertaking on behalf of ICICI Securities Inc. for Singapore dollar 10.0 million(Rs. 320.8 million) to the Monetary Authority of Singapore (MAS) that is included in the contingent liabilities.
As per the assessment made, there is no likely financial impact of the above letters issued to overseasregulators at March 31, 2010.
In addition to the above, the Bank has also issued letters of comfort in the nature of letters of awarenesson behalf of banking and non-banking subsidiaries in respect of their borrowings made or proposed to be madeand for other incidental business purposes. As they are in the nature of factual statements or confirmation offacts, they do not create any financial impact or financial obligations for the Bank.
The letters of comfort that are outstanding at March 31, 2010 pertain to facilities aggregating equivalentto Rs. 76,408.0 million (March 31, 2009: Rs. 191,583.1 million) as availed of by such subsidiaries.Additionally, the repayments of facilities pertaining to which such letters were issued, aggregate to Rs.32,157.6 million and letters that were withdrawn during the year ended March 31, 2010 pertained to facilitiesaggregating to Rs. 153,500.0 million. The letters as re-issued pertain to facilities aggregating to Rs. 71,210.0million availed of by such subsidiaries.
As advised by RBI, the Bank has also provided additional capital of Rs. 3,312.4 million on the lettersof comfort that are in the nature of letters of awareness issued on behalf of its subsidiaries for their borrowingprogrammes.
F-74

Related party balances
The following table sets forth, the balance payable to/receivable from subsidiaries/joint ventures/associates/other related entities/key management personnel and relatives of key management personnel atMarch 31, 2010.
Items/Related party Subsidiaries
Associates/joint
ventures/other
related entities
Key
Management
Personnel
Relatives
of Key
Management
Personnel Total
(Rupees in million)
Deposits with ICICI Bank................. 15,564.7 357.2 32.9 15.8 15,970.6Deposits by ICICI Bank .................. 17.6 — — — 17.6Call/term money lent......................... 4,041.0 — — — 4,041.0Call/term money borrowed................ 2,245.0 — — — 2,245.0Advances ........................................... 13,724.0 42.5 6.7 8.1 13,781.3Investments by ICICI Bank .............. 132,687.9 10,358.1 — — 143,046.0Investments by related parties inICICI Bank........................................ 1,121.0 — 3.6 — 1,124.6Receivables........................................ 1,784.7 286.2 — — 2,070.9Payables............................................. 859.7 341.1 — — 1,200.8Guarantees/lines of credit.................. 1,029.0 0.1 — — 1,029.1Swaps/forward contracts (notionalamount) ............................................. 261,038.4 — — — 261,038.4Employee stock options outstanding(numbers) .......................................... — — 1,254,250 — 1,254,250Employee stock options exercised1 . — — 46.3 — 46.3
1. During the year ended March 31, 2010, 121,875 employee stock options were exercised.
The following table sets forth, the maximum balance payable to/receivable from subsidiaries/jointventures/associates/other related entities/key management personnel and relatives of key managementpersonnel during year ended March 31, 2010.
Items/Related party Subsidiaries
Associates/joint
ventures/other
related entities
Key
Management
Personnel
Relatives
of Key
Management
Personnel Total
(Rupees in million)
Deposits with ICICI Bank................. 16,899.9 734.2 60.2 23.2 17,717.5Deposits by ICICI Bank .................. 1,589.9 — — — 1,589.9Call/term money lent......................... 11,291.6 — — — 11,291.6Call/term money borrowed................ 7,079.7 — — — 7,079.7Advances .......................................... 19,494.4 208.3 26.1 12.2 19,741.0Investments by ICICI Bank .............. 132,687.9 12,159.2 — — 144,847.1Investments by related parties inICICI Bank........................................ 2,043.01 — 9.1 0.3 2,052.4Receivables........................................ 4,737.0 464.01 — — 5,201.0Payables............................................. 1,850.81 341.11 — — 2,191.9Guarantees/lines of credit ................ 4,226.5 2,390.0 — — 6,616.5Swaps/forward contracts (notionalamount) ............................................. 647,121.7 3,878.9 — — 651,000.6
1. Maximum balances are determined based on comparison of the total outstanding balances at each quarter end duringthe financial year.
F-75

The following table sets forth, the balance payable to/receivable from subsidiaries/jointventures/associates/other related entities/key management personnel and relatives of key managementpersonnel at March 31, 2009.
Items/Related party Subsidiaries
Associates/joint
ventures/other
related entities
Key
Management
Personnel
Relatives
of Key
Management
Personnel Total
(Rupees in million)
Deposits with ICICI Bank................. 12,390.3 434.2 56.7 16.9 12,898.1Deposits by ICICI Bank .................. 55.8 — — — 55.8Call/term money lent......................... 4,260.5 — — — 4,260.5Call/term money borrowed................ 3,544.7 — — — 3,544.7Advances ........................................... 19,294.0 42.5 7.9 7.5 19,351.9Investments by ICICI Bank .............. 131,711.6 12,034.2 — — 143,745.8Investments by related parties inICICI Bank........................................ 794.8 — 9.3 — 804.1Receivables........................................ 1,964.3 239.4 — — 2,203.7Payables............................................. 67.8 289.5 — — 357.3Guarantees/lines of credit.................. 3,404.5 1,916.1 — — 5,320.6Swaps/forward contracts (notionalamount) ............................................. 550,751.0 — — — 550,751.0Employee stock options outstanding(numbers) .......................................... — — 3,318,125 — 3,318,125Employee stock options exercised1 . — — — — —
1. During the year ended March 31, 2009, no employee stock options were exercised.
The following table sets forth, the maximum balance payable to/receivable from subsidiaries/jointventures/associates/other related entities/key management personnel and relatives of key managementpersonnel during the year ended March 31, 2009.
Items/Related party Subsidiaries
Associates/joint
ventures/other
related entities
Key
Management
Personnel
Relatives
of Key
Management
Personnel Total
(Rupees in million)
Deposits with ICICI Bank................. 16,899.9 845.0 119.7 38.0 17,902.6Deposits by ICICI Bank .................. 1,589.9 — — — 1,589.9Call/term money lent......................... 10,922.1 — — — 10,922.1Call/term money borrowed................ 3,690.5 — — — 3,690.5Advances .......................................... 20,981.4 208.3 63.6 7.6 21,260.9Investments by ICICI Bank .............. 131,711.6 12,159.2 — — 143,870.8Investments by related parties inICICI Bank........................................ 2,043.01 — 9.3 — 2,052.3Receivables........................................ 3,649.0 464.01 — — 4,113.0Payables............................................. 1,382.61 289.51 — — 1,672.1Guarantees/lines of credit.................. 3,407.2 2,441.4 — — 5,848.6Swaps/forward contracts (notionalamount) ............................................. 647,121.7 880.4 — — 648,002.1
1. Maximum balances are determined based on comparison of the total outstanding balances at each quarter end duringthe financial year.
F-76

7. Securitisation
The Bank sells loans through securitisation and direct assignment. The following tables set forth, for theperiods indicated the information on securitisation and direct assignment activity of the Bank as an originator.
Year ended
March 31, 2010
Year ended
March 31, 2009
(Rupees in million, except
number of loans securitised)
Total number of loan assets securitised............................................................ 33 7,053Total book value of loan assets securitised...................................................... 81,309.4 8,581.1Sale consideration received for the securitised assets...................................... 81,493.7 8,621.9Net gain/(loss) on account of securitisation1 ................................................... (5,093.8) (3,211.5)
1. Includes loss booked upfront on sales during the year, gain/(loss) on deal closures, gain amortised during the yearand expenses relating to utilisation of credit enhancement.
At
March 31, 2010
At
March 31, 2009
(Rupees in million)
Outstanding credit enhancement (funded) ........................................................ 9,987.3 13,086.1Outstanding liquidity facility............................................................................ 3,196.9 6,853.4Net outstanding servicing asset/(liability) ........................................................ 225.7 748.9Outstanding subordinate contributions ............................................................. 7,424.3 8,849.0
The outstanding credit enhancement in the form of guarantees amounted to Rs. 19,920.0 million atMarch 31, 2010 (March 31, 2009: Rs. 27,732.9 million).
Outstanding credit enhancement in the form of guarantees for third party originated securitisationtransactions amounted to Rs. 6,442.0 at March 31, 2010 (March 31, 2009: Rs. 6,520.5) and outstandingliquidity facility for third party originated securitisation transactions amounted to Rs. 0.2 million at March 31,2010 (March 31, 2009: Rs. 4.0 million).
The following table sets forth, for the periods indicated, the details of provision created at the time ofsecuritisation.
Particulars
Year ended
March 31, 2010
Year ended
March 31, 2009
(Rupees in million)
Opening balance ............................................................................................... 5,567.2 9,186.7Add: Additions during the period..................................................................... 1,038.4 630.5Less: Deductions during the period.................................................................. 4,351.8 4,250.0Closing balance ................................................................................................ 2,253.8 5,567.2
F-77

8. Staff retirement benefits
Pension
The following tables set forth, for the periods indicated, reconciliation of opening and closing balanceof the present value of the defined benefit obligation for pension benefits.
Particulars
Year ended
March 31, 2010
Year ended
March 31, 2009
(Rupees in million)
Opening obligations.......................................................................................... 1,932.2 1,678.1Service cost ...................................................................................................... 51.8 62.5Interest cost ...................................................................................................... 134.5 146.6Actuarial (gain)/loss ......................................................................................... (32.1) 484.8Liabilities extinguished on settlement .............................................................. (287.7) (364.2)Benefits paid..................................................................................................... (50.0) (75.6)Obligations at end of year ................................................................................ 1,748.7 1,932.2
Opening plan assets, at fair value .................................................................... 2,145.3 1,490.1Expected return on plan assets ......................................................................... 169.9 117.4Actuarial gain/(loss) ......................................................................................... (130.7) 144.8Assets distributed on settlement ....................................................................... (322.6) (395.8)Contributions .................................................................................................... 28.0 864.4Benefits paid..................................................................................................... (50.0) (75.6)Closing plan assets, at fair value ..................................................................... 1,839.9 2,145.3
Fair value of plan assets at the end of the year............................................... 1,839.9 2,145.3Present value of the defined benefit obligations at the end of the year .......... 1,748.7 1,932.2Amount not recognised as an asset (limit in Para 59(b)) ................................ 7.7 51.2Asset/(liability) ................................................................................................ 83.5 161.9
Cost for the yearService cost ...................................................................................................... 51.8 62.5Interest cost ...................................................................................................... 134.5 146.6Expected return on plan assets ......................................................................... (169.9) (117.4)Actuarial (gain)/loss ......................................................................................... 98.6 340.0Curtailments & settlements (gain)/loss............................................................. 34.9 31.6Effect of the limit in para 59(b)....................................................................... (43.5) 51.2Net cost............................................................................................................. 106.4 514.5
Investment details of plan assets
Majority of the plan assets are invested in Government securities and corporate bonds.
AssumptionsInterest rate ....................................................................................................... 7.75% 6.85%Salary escalation rate........................................................................................ 7.00% 7.00%Estimated rate of return on plan assets ............................................................ 8.00% 8.00%
F-78

Experience adjustment
ParticularsYear ended
March 31, 2010Year ended
March 31, 2009Year ended
March 31, 2008Year ended
March 31, 2007
(Rupees in million)Plan assets....................................................... 1,839.9 2,145.3 1,490.1 988.5Defined benefit obligations............................. 1,748.7 1,932.2 1,678.1 1,029.4Amount not recognised as an asset(limit in para 59(b)) ........................................ 7.7 51.2 — —Surplus/(deficit) .............................................. 83.5 161.9 (188.0) (40.9)Experience adjustment on plan assets ............ (130.7) 144.8 (117.9) (110.1)Experience adjustment on plan liabilities ....... 196.9 6.6 (121.9) 32.8
Gratuity
The following tables set forth, for the periods indicated, reconciliation of opening and closing balanceof the present value of the defined benefit obligation for gratuity benefits.
ParticularsYear ended
March 31, 2010Year ended
March 31, 2009
(Rupees in million)Opening obligations.......................................................................................... 2,195.7 1,840.4Add: Adjustment for exchange fluctuation on opening obligations................. (4.8) 6.4Add: Addition due to amalgamation/initial recognition of foreign branches... — 0.9Service cost ...................................................................................................... 276.9 321.6Interest cost ...................................................................................................... 161.5 183.9Actuarial (gain)/loss ......................................................................................... (144.9) 140.3Transitional obligation/(asset) .......................................................................... — —Liability assumed on acquisition/(settled on divestiture) ................................. (8.4) (28.8)Benefits paid..................................................................................................... (165.5) (269.0)Obligations at end of year ................................................................................ 2,310.5 2,195.7
Opening plan assets, at fair value .................................................................... 2,272.1 1,506.7Expected return on plan assets ......................................................................... 186.9 128.5Actuarial gain/(loss) ......................................................................................... 168.8 (118.0)Contributions .................................................................................................... 45.2 1,052.7Assets acquired on acquisition/(distributed on divestiture).............................. — (28.8)Benefits paid..................................................................................................... (165.5) (269.0)Closing plan assets, at fair value ..................................................................... 2,507.5 2,272.1
Fair value of plan assets at the end of the year............................................... 2,507.5 2,272.1Present value of the defined benefit obligations at the end of the year .......... 2,310.5 2,195.7Amount not recognised as an asset (limit in Para 59(b)) ................................ 47.9 7.9Asset/(liability) ................................................................................................ 149.1 68.5
Cost for the yearService cost ...................................................................................................... 276.9 321.6Interest cost ...................................................................................................... 161.5 183.9Expected return on plan assets ......................................................................... (186.9) (128.5)Actuarial (gain)/loss ......................................................................................... (313.7) 258.3Exchange fluctuation loss/(gain) ...................................................................... (4.8) 6.4Transitional obligation/(asset) .......................................................................... — —Effect of the limit in para 59(b)....................................................................... 40.0 7.9Net cost............................................................................................................. (27.0) 649.6
Investment details of plan assets
Majority of the plan assets are invested in Government securities and corporate bonds.
AssumptionsInterest rate ....................................................................................................... 7.75% 6.85%Salary escalation rate........................................................................................ 7.00% 7.00%Estimated rate of return on plan assets ............................................................ 8.00% 8.00%
F-79

Experience adjustment
Particulars
Year ended
March 31, 2010
Year ended
March 31, 2009
Year ended
March 31, 2008
Year ended
March 31, 2007
(Rupees in million)
Plan assets....................................................... 2,507.5 2,272.1 1,506.7 891.7Defined benefit obligations............................. 2,310.5 2,195.7 1,840.4 1,142.1Amount not recognised as an asset(limit in para 59(b)) ........................................ 47.9 7.9 — —Surplus/(deficit) .............................................. 149.1 68.5 (333.7) (250.4)Experience adjustment on plan assets ............ 168.8 (118.0) (24.8) (18.0)Experience adjustment on plan liabilities ....... (0.8) (4.1) 14.0 38.1
The estimates of future salary increases, considered in actuarial valuation, take into considerationinflation, seniority, promotion and other relevant factors.
The guidance on implementing Accounting Standard 15 - Employee Benefits (revised 2005) issued bythe Accounting Standards Board (ASB) provides that exempt provident funds which require employers to meetthe interest shortfall are in effect defined benefit plans. The Bank’s actuary has informed that it is notpracticable to actuarially determine the interest shortfall obligation.
9. Employee Stock Option Scheme (ESOS)
In terms of the ESOS, as amended, the maximum number of options granted to any eligible employeein a financial year shall not exceed 0.05% of the issued equity shares of the Bank at the time of grant of theoptions and aggregate of all such options granted to the eligible employees shall not exceed 5.0% of theaggregate number of the issued equity shares of the Bank on the date(s) of the grant of options. Under the stockoption scheme, eligible employees are entitled to apply for equity shares. Options granted in April 2009 vestin a graded manner over a five year period with 20.0%, 20.0%, 30.0% and 30.0% of grant vesting each year,commencing from the end of 24 months from the date of grant. The options can be exercised within 10 yearsfrom the date of grant or five years from the date of vesting, whichever is later. No options have been grantedto wholetime Directors for fiscal 2009.
In terms of the scheme, 18,763,460 options (March 31, 2009: 18,992,504 options) granted to eligibleemployees were outstanding at March 31, 2010.
As per the scheme, the exercise price of the Bank’s options is the last closing price on the stockexchange, which recorded highest trading volume preceding the date of grant of options. Hence, there is nocompensation cost for the year ended March 31, 2010 based on intrinsic value of options. However, if the Bankhad used the fair value of options based on the Black-Scholes model, compensation cost for the year endedMarch 31, 2010 would have been higher by Rs. 901.2 million and proforma profit after tax would have beenRs. 39.35 billion. On a proforma basis, the Bank’s basic and diluted earnings per share would have been Rs.35.33 and Rs. 35.19 respectively. The following table sets forth, the key assumptions used to estimate the fairvalue of options granted during the year ended March 31, 2010.
Risk-free interest rate........................................................................................................ 6.53% to 7.76%Expected life ..................................................................................................................... 6.35 to 6.85 yearsExpected volatility ............................................................................................................ 48.65% to 49.18%Expected dividend yield.................................................................................................... 1.22% to 2.53%
The weighted average fair value of options granted during the year ended March 31, 2010 is Rs. 199.91(March 31, 2009: Rs. 331.19).
F-80

The following table sets forth, for the periods indicated, summary of the status of the Bank’s stock optionplan.
Stock option outstanding
Year ended March 31, 2010 Year ended March 31, 2009
Particulars
Number of
options
Weighted
Average
Exercise Price
Number of
options
Weighted
Average
Exercise Price
(Rupees, except number of options)
Outstanding at the beginning of the year ....... 18,992,504 685.05 15,638,152 596.32Add: Granted during the year......................... 1,731,000 434.78 5,640,500 912.30Less: Lapsed during the year.......................... 365,372 661.78 1,723,001 737.40Less: Exercised during the year .................... 1,594,672 366.38 563,147 336.96Outstanding at the end of the year ................. 18,763,460 689.50 18,992,504 685.05Options exercisable......................................... 10,104,780 609.18 7,188,420 496.10
The following table sets forth, summary of stock options outstanding at March 31, 2010.
Range of exercise price (Rupees per share)
Number of
shares arising
out of options
Weighted
average exercise
price (Rupees
per share)
Weighted
average
remaining
contractual life
(Number of
years)
105-299 .................................................................................... 117,601 146.21 2.03300-599 .................................................................................... 9,339,639 462.04 6.08600-999 .................................................................................... 9,238,220 923.24 7.611,000-1,399 .............................................................................. 68,000 1,114.57 7.65
The options were exercised regularly throughout the period and weighted average share price as perNational Stock Exchange (NSE) price volume data during the year ended March 31, 2010 was Rs. 853.80(March 31, 2009: Rs. 723.55).
The Finance (No.2) Act, 2009 has abolished fringe benefit tax and introduced tax on the perquisite valuein the hands of the employees which is computed on the difference between the fair market value on date ofexercise and the exercise price with effect from April 1, 2009.
10. Preference shares
Certain government securities amounting to Rs. 2,405.2 million at March 31, 2010 (March 31, 2009: Rs.2,356.6 million) have been earmarked against redemption of preference shares issued by the Bank, which falldue for redemption on April 20, 2018, as per the original issue terms.
11. Subordinated debt
During the year ended March 31, 2010, the Bank raised subordinated debt qualifying for Tier II capitalamounting to Rs. 62,000.0 million. The following table sets forth the details of these bonds.
Particulars Date of Issue Coupon Rate (%) Tenure Amount
(Rupees in million)
Lower Tier II .............. April 22, 2009 9.30% (annually) 10 years 15,000.0Upper Tier II ................ August 31, 2009 8.92% (semi-annually)1 15 years1 10,000.0Lower Tier II .............. December 9, 2009 8.75% (annually) 10 years 13,200.0Upper Tier II ................ January 12, 2010 8.90% (annually)2 15 years2 7,800.0Upper Tier II ................ January 29, 2010 8.81% (semi-annually)3 15 years3 16,000.0
Total ............................ 62,000.0
F-81

1. 50 basis points over and above the coupon rate payable semi-annually for the balance years after August 30, 2019,if the call option is not exercised by the Bank; call option exercisable on August 31, 2019 with RBI approval.
2. 50 basis points over and above the coupon rate payable annually for the balance years after February 27, 2020, ifthe call options is not exercised by the Bank; call option exercisable on February 28, 2020 with RBI approval.
3. 50 basis points over and above the coupon rate payable annually for the balance years after February 27, 2020, ifthe call options is not exercised by the Bank; call option exercisable on February 28, 2020 with RBI approval.
During the year ended March 31, 2010, the Bank has also raised an amount of Rs. 25,000.0 milliontowards application money on subordinated debt bonds which is pending for allotment at March 31, 2010.
During the year ended March 31, 2009, the Bank raised subordinated debt qualifying for Tier II capitalamounting to Rs. 45,210.0 million. The following table sets forth the details of these bonds.
Particulars Date of Issue Coupon Rate (%) Tenure Amount
(Rupees in million)
Upper Tier II(Tranche 3) ............... June 20, 2008 10.00% (annually)1 15 years1 7,500.0
Upper Tier II ................ September 22, 2008 11.25% (annually)1 15 years1 10,000.0Upper Tier II ................ November 11, 2008 12.00% (annually)2 15 years2 15,000.0Upper Tier II ................ March 26, 2009 9.95% (annually)3 15 years3 12,710.0
Total ............................. 45,210.0
1. 50 basis points over and above the coupon rate payable annually for the balance years after October 31, 2018, if thecall option is not exercised by the Bank; call option exercisable on October 31, 2018 with RBI approval.
2. 50 basis points over and above the coupon rate payable annually for the balance years after November 30, 2018,if the call option is not exercised by the Bank; call option exercisable on November 30, 2018 with RBI approval.
3. 50 basis points over and above the coupon rate payable annually for the balance years after March 26, 2019, if the
call option is not exercised by the Bank; call option exercisable on March 26, 2019 with RBI approval.
12. Investments
The following table sets forth, for the periods indicated, the details of investments and the movement ofprovision held towards depreciation on investments of the Bank.
Particulars
At
March 31, 2010
At
March 31, 2009
(Rupees in million)
1. Value of Investmentsi) Gross value of investments
a) In India................................................................................................ 1,129,332.3 947,314.5b) Outside India....................................................................................... 91,756.8 97,586.3
ii) Provision for depreciationa) In India................................................................................................ (11,779.5) (12,530.7)b) Outside India....................................................................................... (381.6) (1,787.0)
iii) Net value of investmentsa) In India................................................................................................ 1,117,552.8 934,783.8b) Outside India....................................................................................... 91,375.2 95,799.3
2. Movement of provisions held towards depreciation on investmentsi) Opening balance ...................................................................................... 14,317.7 6,698.5ii) Add: Provisions made during the year .................................................... 4,647.5 8,912.7iii) Less: Write-off/write back of excess provisions during the year............ (6,804.1) (1,293.5)iv) Closing balance ....................................................................................... 12,161.1 14,317.7
F-82

13. Investment in securities, other than government and other approved securities (Non-SLRinvestments)
i) Issuer composition of investments in securities, other than government and other approvedsecurities.
a) The following tables set forth, the issuer composition of investments of the Bank in securities, other thangovernment and other approved securities at March 31, 2010.
No. Issuer Amount
Extent ofprivate
placement
Extent of‘below
investmentgrade’
securities2
Extent of‘unrated’
securities3,4,5
Extent of‘unlisted’
securities3,4,6
(a) (b) (c) (d)
(Rupees in million)
1 PSUs......................................... 9,394.5 3,035.0 13.5 0.0 0.02 FIs ............................................ 5,458.7 2,022.4 — 987.8 1,068.53 Banks........................................ 105,435.6 63,704.4 2,375.7 5,623.8 11,595.54 Private corporates..................... 60,293.2 41,292.4 — 9,142.2 10,906.25 Subsidiaries/Joint ventures ....... 132,687.9 324.1 — — —6 Others7...................................... 222,074.1 69,687.8 37,352.5 224.5 224.57 Provision held towards
depreciation .............................. (12,097.3) — — — —
Total ......................................... 523,246.7 180,066.1 39,741.7 15,978.3 23,794.7
1. Amounts reported under columns (a), (b), (c) and (d) above are not mutually exclusive.2. Excludes investments in non-Indian government securities by branches amounting to Rs. 1,279.5 million.3. Excludes Rs. 11,499.8 million of application money towards corporate bonds/debentures.4. Excludes investments, amounting to Rs. 6,226.9 million, in preference shares of subsidiaries and Rs. 4,456.1 million
in subordinated bonds of subsidiaries, namely ICICI Bank UK PLC and ICICI Bank Canada. This also excludesinvestments in non-Indian government securities of Rs. 1,645.0 million made by overseas branches.
5. Excludes equity shares, units of equity-oriented mutual fund and units of venture capital fund.6. Excludes equity shares, units of equity-oriented mutual fund, units of venture capital fund, pass through certificates,
security receipts, commercial paper and certificates of deposit.7. Other investments include deposit with NABARD under RIDF Deposit Scheme amounting to Rs. 101,096.8 million
(March 31, 2009: Rs. 59,999.4 million).8. Collateralised debt obligations securities have been included in the above data based on the arranger of such
instruments.
b) The following table sets forth, the issuer composition of investments of the Bank in securities other thangovernment and other approved securities at March 31, 2009.
No. Issuer Amount
Extent of
private
placement2
Extent of
‘below
investment
grade’
securities3
Extent of
‘unrated’
securities2,4,5
Extent of
‘unlisted’
securities2,4,6
(a) (b) (c) (d)
(Rupees in million)
1 PSUs......................................... 946.1 — 22.8 — —2 FIs ............................................ 14,279.1 8,981.6 — 45.6 126.33 Banks........................................ 40,794.4 12,688.2 1,876.6 8,723.8 15,469.94 Private corporates..................... 32,554.1 15,972.6 — 8,961.2 5,525.95 Subsidiaries/ Joint ventures...... 131,711.6 324.1 — — —6 Others7...................................... 188,604.2 73,680.5 33,536.3 — —7 Provision held towards
depreciation .............................. (12,174.7) — — — —
Total ......................................... 396,714.8 111,647.0 35,435.7 17,730.6 21,122.1
F-83

1. Amounts reported under columns (a), (b), (c) and (d) above are not mutually exclusive.
2. Includes Nil application money towards corporate bonds/debentures.
3. Excludes investments in non-Indian government securities by branches amounting to Rs. 590.1 million.
4. Excludes investments, amounting to Rs. 6,192.6 million, in preference shares of subsidiaries, namely ICICI BankUK PLC and ICICI Bank Canada. This also excludes investments in non-Indian government securities of Rs. 953.4million made by overseas branches.
5. Excludes equity shares, units of equity-oriented mutual fund and units of venture capital fund.
6. Excludes equity shares, units of equity-oriented mutual fund, units of venture capital fund, pass through certificates,security receipts, commercial paper and certificates of deposit.
7. Other investments include deposit with NABARD under RIDF Deposit Scheme amounting to Rs. 59,999.4 million.
8. Collateralised debt obligations securities have been included in the above data based on the arranger of such
instruments.
ii) Non-performing investments in securities, other than government and other approved securities
The following table sets forth, for the periods indicated, the movement in gross non-performinginvestments in securities, other than government and other approved securities.
Particulars
Year ended
March 31, 2010
Year ended
March 31, 2009
(Rupees in million)
Opening balance ............................................................................................... 3,829.1 3,689.6Additions during the year................................................................................. 2,626.3 278.7Reduction during the year ................................................................................ (1,236.1) (139.2)Closing balance ................................................................................................ 5,219.3 3,829.1
Total provision held.......................................................................................... 3,599.8 3,213.8
14. Repurchase transactions
The following table sets forth, for the periods indicated, the details of securities sold and purchasedunder repos and reverse repos.
Minimum
outstanding
balance during
the year
Maximum
outstanding
balance during
the year
Daily average
outstanding
balance during
the year
Balance at
year end
(Rupees in million)
Year ended March 31, 2010Securities sold under repurchase transaction.. — 304,922.4 160,895.7 27,301.0Securities purchased under reverserepurchase transaction..................................... — — — —Year ended March 31, 2009Securities sold under repurchase transaction.. — 145,875.0 66,861.3 22,092.3Securities purchased under reverserepurchase transaction..................................... — 10,499.7 31.5 —
1. The above figures do not include securities sold and purchased under Liquidity Adjustment Facility (LAF) of RBI.
2. The above figures are for Indian branches only.
3. Minimum, maximum & average outstanding is based on first leg of transaction & balance outstanding is based onbook value.
4. Corporate debt securities sold and purchased under repo and reverse repo transactions is Nil.
F-84

15. Reconciliation of nostro account
In terms of RBI circular no. DBOD.BP.BC.No. 133/21.04.018/2008-09 dated May 11, 2009, Rs. 10.4million representing outstanding credit balances of individual value less than US$ 2,500 or equivalent lyingin nostro account, which were originated up to March 31, 2002 and parked in blocked account, was transferredto profit and loss account during the year ended March 31, 2010.
16. CBLO transactions
Collateralised Borrowing and Lending Obligation (CBLO) is a discounted money market instrument,developed by The Clearing Corporation of India Limited (CCIL) and approved by RBI which involves securedborrowings and lending transactions. At March 31, 2010, the Bank had outstanding borrowings amounting toNil and outstanding lending amounting to Nil in the form of CBLO. The amortised book value of securitiesgiven as collateral by the Bank to CCIL for availing the CBLO facility was Rs. 44,699.4 million at March 31,2010.
17. Lending to sensitive sectors
The Bank has lending to sectors, which are sensitive to asset price fluctuations. The sensitive sectorsinclude capital markets and real estate.
The following table sets forth, for the periods indicated, the position of lending to capital market sector.
At
March 31, 2010
At
March 31, 2009
(Rupees in million)
Capital market sectori) Direct investment in equity shares, convertible debentures and units
of equity-oriented mutual funds, the corpus of which is notexclusively invested in corporate debt .................................................... 22,082.3 13,167.9
ii) Advances against shares/bonds/debentures or other securities or onclean basis to individuals for investment in shares (includingIPOs/ESOPs), convertible bonds, convertible debentures, and units ofequity-oriented mutual funds................................................................... 34,463.6 7,408.5
iii) Advances for any other purposes where shares or convertible bonds orconvertible debentures or units of equity oriented mutual funds aretaken as primary security ....................................................................... 5,315.6 271.7
iv) Advances for any other purposes to the extent secured by thecollateral security of shares or convertible bonds or convertibledebentures or units of equity oriented mutual funds .............................. 330.6 609.7
v) Secured and unsecured advances to stockbrokers and guaranteesissued on behalf of stockbrokers and market makers ............................ 22,771.3 22,890.5
vi) Loans sanctioned to corporate against the security ofshares/bonds/debentures or other securities or on clean basis formeeting promoter’s contribution to the equity of new companies inanticipation of raising resources.............................................................. — —
vii) Bridge loans to companies against expected equity flows/issues ........... — —viii) Underwriting commitments taken up by the Bank in respect of
primary issue of shares or convertible bonds or convertible debenturesor units of equity oriented mutual funds................................................. — —
ix) Financing to stockbrokers for margin trading ......................................... — —x) All exposures to Venture Capital Funds (both registered and
unregistered) ............................................................................................ 12,214.3 13,564.3xi) Others ...................................................................................................... 14,091.8 3,922.2
Total Exposure to Capital Market ........................................................... 111,269.5 61,834.8
F-85

The following table sets forth, for the periods indicated, the summary of lending to real estate sector.
At March 31,
2010
At March 31,
2009
(Rupees in million)
Real estate sectorI Direct exposure........................................................................................ 579,950.5 697,579.8i) Residential mortgages of which: individual housing loans eligible for
priority sector advances...........................................................................434,865.1205,019.4
545,263.3266,820.6
ii) Commercial real estate1........................................................................... 135,198.6 142,441.7iii) Investments in mortgage backed securities (MBS) and other
securitised exposure................................................................................. 9,886.8 9,874.8a. Residential ........................................................................................... 9,886.8 9,874.8b. Commercial real estate ........................................................................ — —
II Indirect exposure ..................................................................................... 58,756.8 70,441.1i) Fund based and non-fund based exposures on National Housing Bank
(NHB) and Housing Finance Companies (HFCs) ................................... 58,104.1 66,477.4ii) Others ...................................................................................................... 652.7 3,963.7
Total Exposure to Real Estate Sector2 .................................................... 638,707.3 768,020.9
1. Commercial real estate exposure include loans to individuals against non-residential premises, loans given to landand building developers for construction, corporate loans for development of special economic zone, loans toborrowers where servicing of loans is from a real estate activity and exposures to mutual funds/venture capitalfunds/private equity funds investing primarily in the real estate companies.
2. Excludes non-banking assets acquired in satisfaction of claims.
18. Details of Single Borrower Limit and Borrower Group Limit exceeded by the Bank
During the year ended March 31, 2010, the Bank’s exposure to any single borrower and borrower groupwere within the limits prescribed by RBI except in the cases of Reliance Industries Limited, Barclays BankPLC and ICICI Prudential Flexible Income Plan where exposures to single borrowers were above thestipulated ceiling of 15.0% of capital funds. At March 31, 2010, the exposure to these borrowers as percentageof capital funds was: Reliance Industries Limited: 15.7%, Barclays Bank PLC: 10.7% and ICICI PrudentialFlexible Income Plan: 5.4%.
The excess exposure in the above cases were duly approved/confirmed by the Board of Directors of theBank with exposures being within 20.0% of Bank’s capital funds in accordance with the guidelines issued byRBI.
19. Risk category-wise country-wise exposure
As per the extant RBI guidelines, the country exposure of the Bank is categorised into various riskcategories listed in the following table. The funded country exposure (net) of the Bank as a percentage of totalfunded assets for United Kingdom was 1.44% (March 31, 2009: 1.22%), Canada was 1.11% (March 31, 2009:1.05%) and United States of America was 0.66% (March 31, 2009: 1.34%). As the net funded exposure toUnited Kingdom and Canada exceeds 1.0% of total funded assets, the Bank has made a provision of Rs. 235.0million on country exposures at March 31, 2010 (Provision at March 31, 2009: Rs. 285.0 million).
F-86

The following table sets forth, for the periods indicated, the details of exposure (net) and provision heldby the bank.
Risk category
Exposure (net)
at March 31,
2010
Provision held
at March 31,
2010
Exposure (net)
at March 31,
2009
Provision held
at March 31,
2009
(Rupees in million)
Insignificant .................................................... 392,684.7 235.0 442,570.4 285.0Low................................................................. 131,940.9 — 172,910.8 —Moderate ......................................................... 25,024.4 — 21,870.7 —High ................................................................ 696.4 — 784.1 —Very High........................................................ — — 22.8 —Restricted ........................................................ — — — —Off-Credit........................................................ — — — —
Total ................................................................ 550,346.4 235.0 638,158.8 285.0
- Of which: funded ......................................... 245,144.8 — 289,482.0 —
20. Advances
The following table sets forth, for the periods indicated, the details of movement of grossnon-performing assets (NPAs), net NPAs and provisions.
Particulars
Year ended
March 31, 2010
Year ended
March 31, 2009
(Rupees in million)
i) Net NPAs (funded) to Net Advances (%) ............................................... 2.12% 2.09%ii) Movement of NPAs (Gross)
a) Opening balance ............................................................................. 96,493.1 75,795.4b) Additions during the year1, 2 .......................................................... 32,513.2 50,637.1c) Reductions during the year1 .......................................................... (34,199.8) (29,939.4)d) Closing balance ............................................................................. 94,806.5 96,493.1
iii) Movement of Net NPAsa) Opening balance ............................................................................. 45,539.4 34,905.5b) Additions during the year1, 2 .......................................................... 1,452.5 19,824.5c) Reductions during the year1 .......................................................... (8,580.8) (9,190.6)d) Closing balance ............................................................................. 38,411.1 45,539.4
iv) Movement of provisions for NPAs (excluding provision onstandard assets)a) Opening balance3............................................................................ 50,953.7 39,432.7b) Provisions made during the year4 .................................................. 41,809.2 35,615.4c) Write-off/write-back of excess provisions .................................... (36,367.5) (24,094.4)d) Closing balance3 ............................................................................. 56,395.4 50,953.7
1. Includes cases added to and deleted from NPAs during the year ended March 31, 2010, with such gross loansamounting to Rs. 1,060.2 million (March 31, 2009: Rs. 4,713.0 million) and such net loans amounting to Rs. 936.5million (March 31, 2009: Rs. 4,066.8 million).
2. The difference between the opening and closing balances (other than accounts written off during the year) of NPAsin retail loans is included in additions during the year.
3. Net of write-off.
4. The difference between the opening and closing balances (adjusted for write-off and sale of NPAs during the year)of provisions in retail loans is included in provisions made during the year.
21. Unsecured advances against intangible assets
The Bank has made advances against intangible collaterals of the borrowers which are classified as‘unsecured’ in its financial statements. At March 31, 2010, the amount of such advances was Nil and theestimated value of the intangible collaterals was Nil.
F-87

22. Financial assets transferred during the year to securitisation company (SC)/reconstructioncompany (RC)
The Bank has transferred certain assets to Asset Reconstruction Companies (ARCs) in terms of theguidelines issued by RBI governing such transfer. For the purpose of the valuation of the underlying securityreceipts issued by the underlying trusts managed by ARCs, the security receipts are valued at their respectiveNAVs as advised by the ARCs.
The following table sets forth, for the periods indicated, the details of the assets transferred.
Year ended
March 31, 2010
Year ended
March 31, 2009
(Rupees in million,
except number of accounts)
Number of accounts.......................................................................................... 55,1601 18,429Aggregate value (net of provisions) of accounts sold to SC/RC..................... 7,617.9 6,810.7Aggregate consideration ................................................................................... 7,866.7 6,737.9Additional consideration realised in respect of accounts transferred inearlier years2..................................................................................................... — —Aggregate gain/(loss) over net book value....................................................... 248.8 (72.8)
1. Excludes accounts previously written-off.
2. During the year ended March 31, 2010, Asset Reconstruction Company (India) Limited (ARCIL) fully redeemedsecurity receipts of three trusts. The Bank realised Rs. 89.8 million over the gross book value in respect of these
trusts (March 31, 2009: Rs. 27.6 million).
23. Provision on standard assets
The Bank makes provision on standard assets as per RBI guidelines. The Bank has adopted the revisedrates for making provision on standard assets during the year ended March 31, 2010, in accordance with RBIcircular no. DBOD.BP.BC.58/ 21.04.048/2009-10 dated November 5, 2009.
The Bank has not written back any standard asset provision pursuant to the RBI circular no.DBOD.BP.BC.83/21.01.002/2008-09 dated November 15, 2008. The provision on standard assets held by theBank at March 31, 2010 was Rs. 14,360.6 million (March 31, 2009: Rs. 14,360.6 million).
24. Provisions and contingencies
The following table sets forth, for the periods indicated, the break-up of provisions and contingenciesincluded in profit and loss account.
Year ended
March 31, 2010
Year ended
March 31, 2009
(Rupees in million)
Provisions for depreciation of investments ...................................................... (26.5) 977.3Provision towards non-performing assets......................................................... 43,621.6 37,690.3Provision towards standard assets .................................................................... — (190.0)Provision towards income tax1 ......................................................................... 13,173.4 13,558.4Provision towards wealth tax ........................................................................... 30.0 30.0Other provision and contingencies ................................................................... 273.5 (395.0)
1. Includes fringe benefit tax amounting to Nil for the year ended March 31, 2010 (March 31, 2009: Rs. 342.0 million)and creation of net deferred tax asset amounting to Rs. (2,804.4) million for the year ended March 31, 2010 (March31, 2009: Rs. (4,716.7) million).
F-88

25. Movement in provision for credit card/debit card reward points
The following table sets forth, for the periods indicated, movement in provision for credit card/ debitcard reward points.
Year endedMarch 31, 2010
Year endedMarch 31, 2009
(Rupees in million)
Opening provision for reward points ............................................................... 232.0 576.3Provision for reward points made during the year........................................... 476.0 599.4Utilisation/write-back of provision for reward points ...................................... 438.3 943.7Closing provision for reward points1 .............................................................. 269.7 232.0
1. The closing provision is based on the actuarial valuation of accumulated credit/debit card reward points. Thisamount will be utilised towards redemption of the credit/debit card reward points.
26. Description of contingent liabilities
The following table sets forth description of contingent liabilities.
Sr.no. Contingent liability Brief Description
1 Claims against the Bank notacknowledged as debts
This item represents demands made in certain tax and legal matters againstthe Bank in the normal course of business. The Bank does not considerthese matters to have a material adverse financial impact in excess ofprovisions already made in the financial statements.
2 Liability for partly paidinvestments
These represent amounts remaining unpaid towards purchase ofinvestments. These payment obligations of the Bank do not have anyprofit/loss impact.
3 Liability on account ofoutstanding forwardexchange contracts
The Bank enters into foreign exchange forward contracts in its normalcourse of business, to exchange currencies at a pre-fixed price at a futuredate. This item represents the notional principal amount of such contracts,which are derivative instruments. With respect to the transactions enteredinto with its customers, the Bank generally enters into off-settingtransactions in the inter-bank market. This results in generation of a highernumber of outstanding transactions, and hence a large value of grossnotional principal of the portfolio, while the net market risk is lower.
4 Guarantees given on behalfof constituents, acceptances,endorsements and otherobligations
These items represent the guarantees and documentary credits issued by theBank as part of its trade finance banking activities, on behalf of itscustomers in favour of third parties, with a view to augment the customers’credit standing. Through these instruments, the Bank undertakes to makepayments for its customers’ obligations, either directly or in case of failureof the customers to fulfil their financial or performance obligations.
5 Currency swaps, interestrate swaps, currencyoptions and interest ratefutures
This item represents the notional principal amounts of various derivativeinstruments which the Bank undertakes in its normal course of business.The Bank offers these products to its customers to enable them to transfer,modify or reduce their foreign exchange and interest rate risks. The Bankalso undertakes these contracts to manage its own interest rate and foreignexchange positions. With respect to the transactions entered into with itscustomers, the Bank generally enters into off-setting transactions in theinter-bank market. This results in generation of a higher number ofoutstanding transactions, and hence a large value of gross notional principalof the portfolio, while the net market risk is lower.
6 Other items for which theBank is contingently liable
Other items for which the Bank is contingently liable include primarily thesecuritisation, notional principal amounts of credit derivatives andrepurchase obligations. The Bank is also obligated under a number ofcapital contracts. Capital contracts are job orders of a capital nature whichhave been committed.
F-89

27. Information in respect of restructured assets
The following table sets forth, for the periods indicated, details of loan assets subjected to restructuring.
Year ended March 31, 2010 Year ended March 31, 2009
CDR
Mechanism
SME Debt
Restructuring Others
CDR
Mechanism
SME Debt
Restructuring Others
(Rupees in million)
Standardadvancesrestructured3
Number of Borrowers 11 11 3,806 1 7 937Amount outstanding 14,186.6 397.6 40,918.8 928.0 406.4 13,282.7Of which:restructured amount 12,444.3 251.4 39,248.4 912.2 263.9 9,917.5Sacrifice (diminutionin the fair value) 1,006.0 4.8 1,406.5 107.0 12.2 196.0
Sub-standardadvancesrestructured
Number of Borrowers 3 1 98 — — 51Amount outstanding 640.2 77.8 288.2 — — 213.4Of which:restructured amount 624.3 77.8 244.9 — — 213.4Sacrifice (diminutionin the fair value) 80.7 5.9 8.7 — — 12.0
Doubtfuladvancesrestructured
Number of Borrowers — — 3 — — —Amount outstanding — — 207.2 — — —Of which:restructured amount — — 187.8 — — —Sacrifice (diminutionin the fair value) — — 17.5 — — —
Total Number of Borrowers 14 12 3,907 1 7 988Amount outstanding 14,826.8 475.4 41,414.2 928.0 406.4 13,496.2Of which:restructured amount 13,068.7 329.2 39,681.0 912.2 263.9 10,130.9Sacrifice (diminutionin the fair value) 1,086.6 10.8 1,432.7 107.0 12.2 208.0
1. The above disclosure for the year ended March 31, 2010, includes the reversal of interest income of Rs. 704.3million on account of conversion of overdue interest into Funded Interest Term Loan (FITL).
2. The aforesaid disclosure excludes the reversal of derivative income of Rs. 303.1 million during the year endedMarch 31, 2010 on account of conversion of derivative receivables into term loan/preference shares.
3. Includes eight borrowal accounts restructured for a second time with asset classification benefit upto June 30, 2009,amounting to Rs. 24,280.8 million against which sacrifice (diminution in fair value) is Rs. 1,498.1 million.
F-90

28. Details of non-performing assets purchased/sold, excluding those sold to SC/RC
The Bank has sold certain non-performing assets in terms of the guidelines issued by RBI circular no.DBOD.No.BP.BC.16/21.04.048/2005-06 dated July 13, 2005 on such sale.
The following table sets forth, for the periods indicated, details of non-performing assets sold, excludingthose sold to SC/RC.
Particulars
Year ended
March 31, 2010
Year ended
March 31, 2009
(Rupees in million,
except no. of accounts)
No. of accounts................................................................................................. 7,4281 —Aggregate value (net of provisions) of accounts sold,excluding those sold to SC/RC ........................................................................ 479.0 —Aggregate consideration ................................................................................... 463.6 —Aggregate gain/(loss) over net book value....................................................... (15.4) —
1. Excludes accounts previously written off.
29. Fixed Assets
The following table sets forth, for the periods indicated, the movement in software acquired by the Bank,as included in fixed assets.
Particulars
At
March 31, 2010
At
March 31, 2009
(Rupees in million)
At cost at March 31st of preceding year.......................................................... 5,267.4 4,448.8Additions during the year................................................................................. 824.9 818.6Deductions during the year .............................................................................. (239.7) —Depreciation to date ......................................................................................... (4,043.3) (3,509.5)Net block .......................................................................................................... 1,809.3 1,757.9
30. Assets given on lease
Assets under finance lease
The following table sets forth, for the periods indicated, the details of finance leases.
Particulars
At
March 31, 2010
At
March 31, 2009
(Rupees in million)
Future minimum lease receiptsPresent value of lease receipts ......................................................................... 17.4 174.8Unmatured finance charges .............................................................................. 0.2 9.3
Total .................................................................................................................. 17.6 184.1
Maturity profile of future minimum lease receipts- Not later than one year .................................................................................. 17.6 176.4- Later than one year and not later than five years ......................................... — 7.7- Later than five years ...................................................................................... — —
Total .................................................................................................................. 17.6 184.1
F-91

Maturity profile of present value of lease rentals
The following table sets forth, for the periods indicated, the details of maturity profile of present valueof finance lease receipts.
Particulars
At
March 31, 2010
At
March 31, 2009
(Rupees in million)
Not later than one year..................................................................................... 17.4 167.3Later than one year and not later than five years ............................................ — 7.5Later than five years......................................................................................... — —
Total ................................................................................................................. 17.4 174.8
31. Provisions for income tax
The provision for income tax (including deferred tax) for the year ended March 31, 2010 amounted toRs. 13,173.4 million (March 31, 2009: Rs. 13,558.4 million). The levy of fringe benefit tax (FBT) is notapplicable as the Finance (No.2) Act, 2009 has abolished FBT with effect from financial year 2009-10.
The Bank has a comprehensive system of maintenance of information and documents required bytransfer pricing legislation under section 92-92F of the Income Tax Act, 1961. The Bank is of the opinion thatall international transactions are at arm’s length so that the above legislation will not have material impact onthe financial statements.
32. Deferred tax
At March 31, 2010, the Bank has recorded net deferred tax asset of Rs. 20,756.7 million (March 31,2009: Rs. 17,923.1 million), which has been included in other assets.
The following table sets forth, for the periods indicated, the break-up of deferred tax assets and liabilitiesinto major items.
At
March 31, 2010
At
March 31, 2009
(Rupees in million)
Deferred tax assetProvision for bad and doubtful debts ............................................................... 23,597.6 21,597.8Capital loss ....................................................................................................... — 131.4Others ............................................................................................................... 1,827.4 1,680.3
Total deferred tax assets ................................................................................... 25,425.0 23,409.5
Deferred tax liabilityDepreciation on fixed assets............................................................................. 4,671.1 5,460.1Total deferred tax liability ................................................................................ 4,671.1 5,460.1Deferred tax asset/(liability) pertaining to foreign branches............................ 2.8 (26.3)
Total net deferred tax asset/(liability) .............................................................. 20,756.7 17,923.1
33. Dividend distribution tax
For the purpose of computation of dividend distribution tax on the proposed dividend, the Bank hasreduced the dividend distribution tax on dividend received from its Indian subsidiaries as per the provisionsof section 115-O of the Income Tax Act, 1961 read with Finance Bill, 2010 and Section 294 of the IncomeTax Act, 1961.
34. Derivatives
ICICI Bank is a major participant in the financial derivatives market. The Bank deals in derivatives forbalance sheet management and market making purposes whereby the Bank offers derivative products to itscustomers, enabling them to hedge their risks.
F-92

Dealing in derivatives is carried out by identified groups in the treasury of the Bank based on the purposeof the transaction. Derivative transactions are entered into by the treasury front office. Treasury middle officeconducts an independent check of the transactions entered into by the front office and also undertakesactivities such as confirmation, settlement, accounting, risk monitoring and reporting and ensures compliancewith various internal and regulatory guidelines.
The market making and the proprietary trading activities in derivatives are governed by the investmentpolicy of the Bank, which lays down the position limits, stop loss limits as well as other risk limits. The RiskManagement Group lays down the methodology for computation and monitoring of risk. The Risk Committeeof the Board (RCB) reviews the Bank’s risk management policy in relation to various risks (portfolio, liquidity,interest rate, off-balance sheet and operational risks), investment policies and compliance issues in relationthere to. The RCB comprises independent directors and the Managing Director and CEO.
Risk monitoring of the derivatives portfolio including credit derivatives is done on a daily basis. TheBank generally measures and monitors risk using Value at Risk (VAR) approach and the relevant greeks foroptions. Risk reporting on derivatives forms an integral part of the management information system and themarked to market position and the VAR of the derivatives portfolio, including credit derivatives is reportedon a daily basis.
The use of derivatives for hedging purposes is governed by the hedge policy approved by Asset LiabilityManagement Committee (ALCO). Subject to prevailing RBI guidelines, the Bank deals in derivatives forhedging fixed rate, floating rate or foreign currency assets/liabilities. Transactions for hedging and marketmaking purposes are recorded separately. For hedge transactions, the Bank identifies the hedged item (assetor liability) at the inception of the transaction itself. The effectiveness is assessed at the time of inception ofthe hedge and periodically thereafter.
Hedge derivative transactions are accounted for pursuant to the principles of hedge accounting.Derivatives for market making purpose are marked to market and the resulting gain/loss is recorded in theprofit and loss account. The premium on option contracts is accounted for as per Foreign Exchange DealersAssociation of India (FEDAI). Derivative transactions are covered under International Swap DealersAssociation (ISDA) master agreements with the respective counter parties. The exposure on account ofderivative transactions is marked against the credit limits approved for the respective counter-parties.
The following tables set forth, for the period indicated, details of derivative positions.
At March 31, 2010
Sr.No. Particulars
Currencyderivatives1
Interest ratederivatives2
(Rupees in million)
1 Derivatives (Notional principal amount)a) For hedging .................................................................................... 23,432.8 235,286.1b) For trading ...................................................................................... 1,136,020.6 3,145,275.0
2 Marked to market positions3
a) Asset (+) ......................................................................................... 13,891.8 1,459.8b) Liability (-) ..................................................................................... — —
3 Credit exposure4 ...................................................................................... 115,703.5 91,886.04 Likely impact of one percentage change in interest rate (100*PV01)5
a) On hedging derivatives6 ................................................................. 58.2 7,288.5b) On trading derivatives .................................................................... 1,380.6 1,646.7
5 Maximum and minimum of 100*PV01 observed during the yeara) On hedging6
Maximum........................................................................................ (54.6) (6,835.8)Minimum ........................................................................................ (323.9) (9,071.7)
b) On tradingMaximum........................................................................................ (1,358.8) 2,322.6Minimum ........................................................................................ (2,121.7) 1,282.0
1. Options and cross currency interest rate swaps and currency futures are included in currency derivatives.2. Foreign currency interest rate swaps, forward rate agreements and swaptions are included in interest rate derivatives.3. For trading portfolio including accrued interest. Represents net positions.4. Includes accrued interest.5. Amounts given are absolute values on a net basis, excluding options.
The swap contracts entered for hedging purpose would have an opposite and offsetting impact with the underlyingon-balance sheet items.
F-93
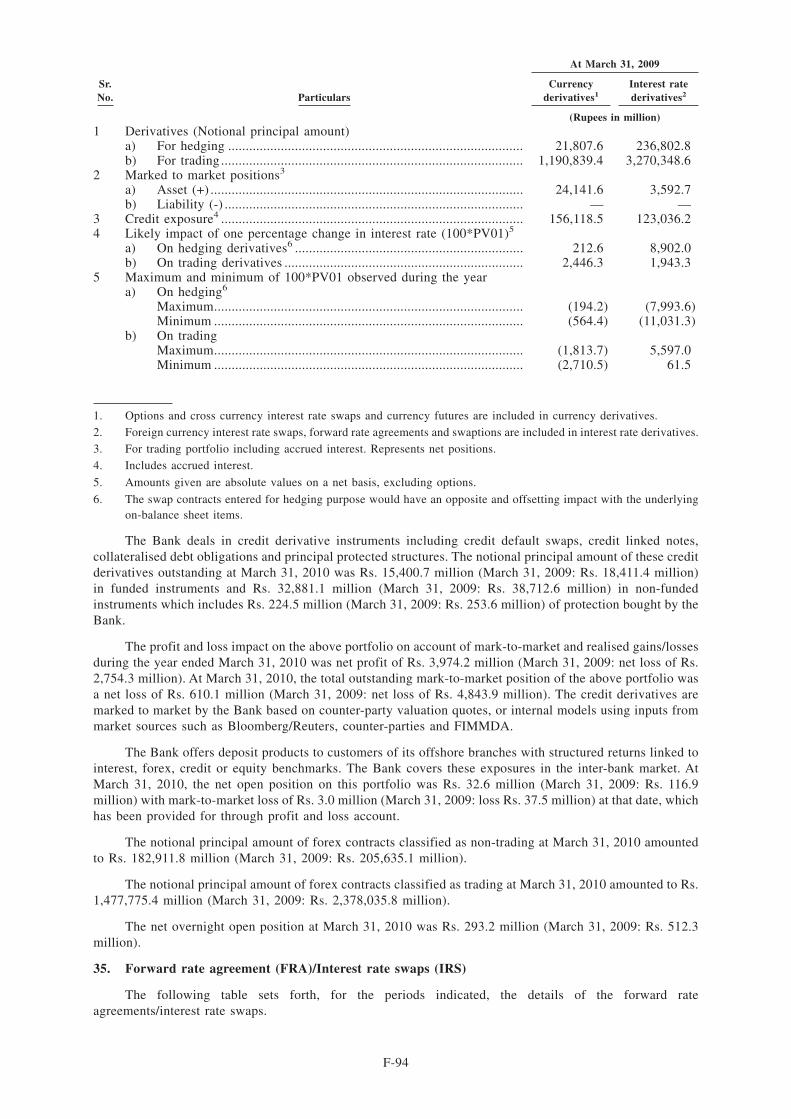
At March 31, 2009
Sr.No. Particulars
Currencyderivatives1
Interest ratederivatives2
(Rupees in million)1 Derivatives (Notional principal amount)
a) For hedging .................................................................................... 21,807.6 236,802.8b) For trading ...................................................................................... 1,190,839.4 3,270,348.6
2 Marked to market positions3
a) Asset (+) ......................................................................................... 24,141.6 3,592.7b) Liability (-) ..................................................................................... — —
3 Credit exposure4 ...................................................................................... 156,118.5 123,036.24 Likely impact of one percentage change in interest rate (100*PV01)5
a) On hedging derivatives6 ................................................................. 212.6 8,902.0b) On trading derivatives .................................................................... 2,446.3 1,943.3
5 Maximum and minimum of 100*PV01 observed during the yeara) On hedging6
Maximum........................................................................................ (194.2) (7,993.6)Minimum ........................................................................................ (564.4) (11,031.3)
b) On tradingMaximum........................................................................................ (1,813.7) 5,597.0Minimum ........................................................................................ (2,710.5) 61.5
1. Options and cross currency interest rate swaps and currency futures are included in currency derivatives.2. Foreign currency interest rate swaps, forward rate agreements and swaptions are included in interest rate derivatives.3. For trading portfolio including accrued interest. Represents net positions.4. Includes accrued interest.
5. Amounts given are absolute values on a net basis, excluding options.
6. The swap contracts entered for hedging purpose would have an opposite and offsetting impact with the underlyingon-balance sheet items.
The Bank deals in credit derivative instruments including credit default swaps, credit linked notes,collateralised debt obligations and principal protected structures. The notional principal amount of these creditderivatives outstanding at March 31, 2010 was Rs. 15,400.7 million (March 31, 2009: Rs. 18,411.4 million)in funded instruments and Rs. 32,881.1 million (March 31, 2009: Rs. 38,712.6 million) in non-fundedinstruments which includes Rs. 224.5 million (March 31, 2009: Rs. 253.6 million) of protection bought by theBank.
The profit and loss impact on the above portfolio on account of mark-to-market and realised gains/lossesduring the year ended March 31, 2010 was net profit of Rs. 3,974.2 million (March 31, 2009: net loss of Rs.2,754.3 million). At March 31, 2010, the total outstanding mark-to-market position of the above portfolio wasa net loss of Rs. 610.1 million (March 31, 2009: net loss of Rs. 4,843.9 million). The credit derivatives aremarked to market by the Bank based on counter-party valuation quotes, or internal models using inputs frommarket sources such as Bloomberg/Reuters, counter-parties and FIMMDA.
The Bank offers deposit products to customers of its offshore branches with structured returns linked tointerest, forex, credit or equity benchmarks. The Bank covers these exposures in the inter-bank market. AtMarch 31, 2010, the net open position on this portfolio was Rs. 32.6 million (March 31, 2009: Rs. 116.9million) with mark-to-market loss of Rs. 3.0 million (March 31, 2009: loss Rs. 37.5 million) at that date, whichhas been provided for through profit and loss account.
The notional principal amount of forex contracts classified as non-trading at March 31, 2010 amountedto Rs. 182,911.8 million (March 31, 2009: Rs. 205,635.1 million).
The notional principal amount of forex contracts classified as trading at March 31, 2010 amounted to Rs.1,477,775.4 million (March 31, 2009: Rs. 2,378,035.8 million).
The net overnight open position at March 31, 2010 was Rs. 293.2 million (March 31, 2009: Rs. 512.3million).
35. Forward rate agreement (FRA)/Interest rate swaps (IRS)
The following table sets forth, for the periods indicated, the details of the forward rateagreements/interest rate swaps.
F-94

Particulars
At
March 31, 2010
At
March 31, 2009
(Rupees in million)
i) The notional principal of rupee swap agreements ................................. 1,870,819.1 1,942,528.9ii) Losses which would be incurred if all counter parties failed to fulfil
their obligations under the agreement1 .................................................. 20,533.2 35,591.8iii) Collateral required by the Bank upon entering into swaps..................... — —iv) Concentration of credit risk arising from the rupee swaps2 .................. 500.0 919.7v) The fair value of rupee trading swap book3 ........................................... (180.5) 622.1
1. For trading portfolio both mark-to-market and accrued interest have been considered and for hedging portfolio, onlyaccrued interest has been considered.
2. Credit risk concentration is measured as the highest net receivable under swap contracts from a particular counterparty.
3. Fair value represents mark-to-market including accrued interest.
36. Exchange traded interest rate derivatives
The following table sets forth, for the periods indicated, the details of exchange traded interest ratederivatives.
Particulars
At
March 31, 2010
At
March 31, 2009
(Rupees in million)
i) Notional principal amount of exchange traded interest rate derivativesundertaken during the year (instrument-wise)a) Euro dollar futures ......................................................................... — —b) Treasury note futures — 10 years .................................................. — 7,608.0c) Treasury note futures — 5 years.................................................... — —d) Treasury note futures — 2 years.................................................... — 6,390.7e) NSE — GOI Bond futures ............................................................. 0.2 N.A
ii) Notional principal amount of exchange traded interest rate derivativesoutstanding (instrument-wise)a) Euro dollar futures ......................................................................... — —b) Treasury note futures — 10 years .................................................. — —c) Treasury note futures — 5 years.................................................... — —d) Treasury note futures — 2 years.................................................... — —e) NSE — GOI Bond futures ............................................................ — N.A
iii) Notional principal amount of exchange traded interest rate derivativesoutstanding and not “highly effective” (instrument wise) ...................... N.A N.A
iv) Mark-to-market value of exchange traded interest rate derivativesoutstanding and not “highly effective” (instrument-wise) ...................... N.A N.A
37. Penalties/fines imposed by RBI and other banking regulatory bodies
There was no penalty imposed by RBI and other banking regulatory bodies during the year ended March31, 2010 (March 31, 2009: Rs. 400).
38. Small and micro enterprises
Under the Micro, Small and Medium Enterprises Development Act, 2006 which came into force fromOctober 2, 2006, certain disclosures are required to be made relating enterprises covered under the Act. Duringthe year ended March 31, 2010, the amount paid to vendors registered under the MSMED Act, 2006 after thedue date was Rs. 65.2 million (March 31, 2009: Nil). An amount of Rs. 1.7 million (March 31, 2009: Nil) hasbeen charged to profit & loss account towards accrual of interest on these delayed payments.
39. Farm loan waiver
The Ministry of Finance, Government of India had issued guidelines for the implementation of theAgriculture debt waiver and relief scheme for farmers on May 23, 2008. The Bank has implemented thescheme as per guidelines issued by RBI circular DBOD No.BP.BC.26/21.04.048/2008-09 dated July 30, 2008on “Agricultural Debt Waiver and Debt Relief Scheme, 2008 — Prudential norms on income recognition, assetclassification and provisioning and Capital Adequacy”.
F-95

Pursuant to the scheme an aggregate amount of Rs. 2,758.1 million (March 31, 2009: Rs. 2,666.7million) has been waived which is recoverable from Government of India. Of the above, an amount of Rs.1,220.8 million has been received by March 31, 2010 (March 31, 2009: Rs. 773.0 million) and balance of Rs.1,537.3 million (March 31, 2009:Rs. 1,893.7 million) is receivable in future.
40. Transfer of merchant acquiring operations
During the year ended March 31, 2010, the Bank and First Data, a global company engaged in electroniccommerce and payment services, formed a merchant acquiring alliance and a new entity, 81.0% owned by FirstData, was formed, which has acquired ICICI Bank’s merchant acquiring operations through transfer of assets,primarily comprising fixed assets and receivables, and assumption of liabilities, for a total consideration of Rs.3,744.0 million. This transfer of assets and liabilities to the new entity would be considered a ‘slump sale’ fortax purposes. The Bank realised a profit of Rs. 2,029.0 million from this transaction, which is included inSchedule 14 - “Other income”.
41. Provision Coverage Ratio
The provision coverage ratio of the Bank at March 31, 2010 computed as per the RBI circular datedDecember 1, 2009 is 59.5%. The Bank has been permitted by RBI to achieve the stipulated level of 70.0% ina phased manner by March 31, 2011.
42. Bancassurance
During the year March 31, 2010, the Bank earned fees/remuneration of Rs. 2,955.9 million in respectof the bancassurance business.
43. Concentration of Deposits, Advances, Exposures and NPAs
RBI has recently issued new guidelines for additional disclosures by Banks vide its circular referenceDBOD.BP.BC.No.79/21.04.018/2009-10. The following tables set forth, for the periods indicated, theadditional disclosures.
(I) Concentration of deposits, advances, exposures and NPAs
Concentration of Deposits
Year ended
March 31, 2010
Year ended
March 31, 2009
(Rupees in million)
Total deposits of twenty largest depositors ...................................................... 304,189.2 424,751.8Deposits of twenty largest depositors as a percentageof total deposits of the Bank ............................................................................ 15.06% 19.45%
Concentration of advances1
Year ended
March 31, 2010
Year ended
March 31, 2009
(Rupees in million)
Total advances to twenty largest non-bank borrowers ..................................... 881,190.5 817,692.1Advances to twenty largest borrowers as percentageof total advances of the Bank .......................................................................... 18.09% 15.24%
1. Represents credit exposure as per RBI guidelines on exposure norms. Total advances do not include the exposureto consolidated entities which are deducted from capital funds of the Bank.
Concentration of exposures1
Year ended
March 31, 2010
Year ended
March 31, 2009
(Rupees in million)
Total exposure to twenty largest non-bank borrowers .................................... 904,426.8 860,515.8Exposures to twenty largest non-bank borrowers as percentage of totalexposure of the Bank on borrowers. ................................................................ 17.50% 15.42%
1. Represents credit and investment exposures as per RBI guidelines on exposure norms. Total exposure does notinclude the exposure to consolidated entities which are deducted from capital funds of the Bank. It also does notinclude SLR investments and mandatory contributions towards shortfall in advances to priority sector.
F-96
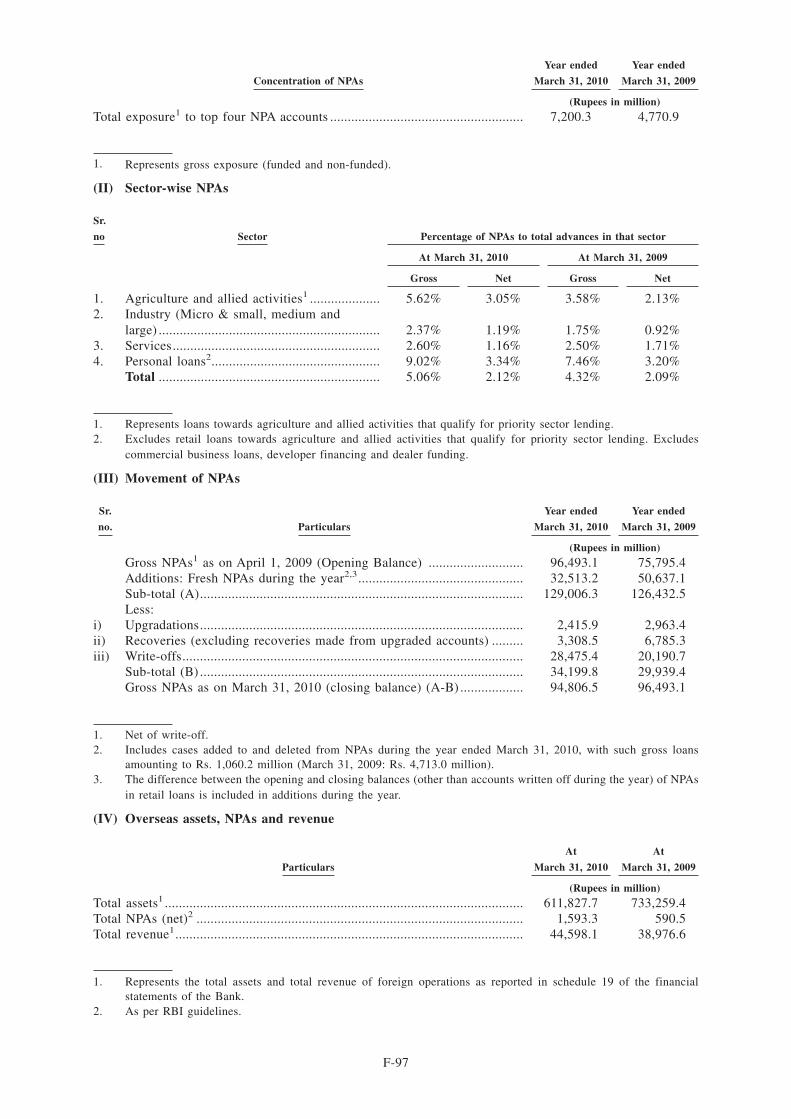
Concentration of NPAs
Year ended
March 31, 2010
Year ended
March 31, 2009
(Rupees in million)
Total exposure1 to top four NPA accounts ....................................................... 7,200.3 4,770.9
1. Represents gross exposure (funded and non-funded).
(II) Sector-wise NPAs
Sr.
no Sector Percentage of NPAs to total advances in that sector
At March 31, 2010 At March 31, 2009
Gross Net Gross Net
1. Agriculture and allied activities1 .................... 5.62% 3.05% 3.58% 2.13%2. Industry (Micro & small, medium and
large) ............................................................... 2.37% 1.19% 1.75% 0.92%3. Services........................................................... 2.60% 1.16% 2.50% 1.71%4. Personal loans2................................................ 9.02% 3.34% 7.46% 3.20%
Total ............................................................... 5.06% 2.12% 4.32% 2.09%
1. Represents loans towards agriculture and allied activities that qualify for priority sector lending.2. Excludes retail loans towards agriculture and allied activities that qualify for priority sector lending. Excludes
commercial business loans, developer financing and dealer funding.
(III) Movement of NPAs
Sr.
no. Particulars
Year ended
March 31, 2010
Year ended
March 31, 2009
(Rupees in million)
Gross NPAs1 as on April 1, 2009 (Opening Balance) ........................... 96,493.1 75,795.4Additions: Fresh NPAs during the year2,3............................................... 32,513.2 50,637.1Sub-total (A)............................................................................................ 129,006.3 126,432.5Less:
i) Upgradations............................................................................................ 2,415.9 2,963.4ii) Recoveries (excluding recoveries made from upgraded accounts) ......... 3,308.5 6,785.3iii) Write-offs................................................................................................. 28,475.4 20,190.7
Sub-total (B) ............................................................................................ 34,199.8 29,939.4Gross NPAs as on March 31, 2010 (closing balance) (A-B) .................. 94,806.5 96,493.1
1. Net of write-off.2. Includes cases added to and deleted from NPAs during the year ended March 31, 2010, with such gross loans
amounting to Rs. 1,060.2 million (March 31, 2009: Rs. 4,713.0 million).3. The difference between the opening and closing balances (other than accounts written off during the year) of NPAs
in retail loans is included in additions during the year.
(IV) Overseas assets, NPAs and revenue
Particulars
At
March 31, 2010
At
March 31, 2009
(Rupees in million)
Total assets1 ...................................................................................................... 611,827.7 733,259.4Total NPAs (net)2 ............................................................................................. 1,593.3 590.5Total revenue1................................................................................................... 44,598.1 38,976.6
1. Represents the total assets and total revenue of foreign operations as reported in schedule 19 of the financialstatements of the Bank.
2. As per RBI guidelines.
F-97

(V) Off-balance sheet special purpose vehicles (SPVs) sponsored (which are required to beconsolidated as per accounting norms)
(a) The following table sets forth, the names of SPVs/trusts sponsored by the bank/subsidiaries which areconsolidated:
Sr. no Name of the SPV sponsored1
A. Domestic1. ICICI Eco-net Internet and Technology Fund2. ICICI Equity Fund3. ICICI Emerging Sectors Fund4. ICICI Strategic Investments Fund5. ICICI Venture Value FundB Overseas
None
1. The nature of business of the above entities is given in significant accounting policies (schedule 18) in theconsolidated notes to accounts.
(b) The following table sets forth, the names of SPVs/trusts which are not sponsored by theBank/subsidiaries and are consolidated:
Sr. no Name of the SPV1
A Domestic1. Rainbow FundB Overseas
None
1. The nature of business of the above entities is given in significant accounting policies (schedule 18) in theconsolidated notes to accounts.
44. Disclosure of complaints
The following table sets forth, for the periods indicated, the movement of the outstanding number ofcomplaints.
Particulars
Year ended
March 31, 2010
Year ended
March 31, 2009
a) No. of complaints pending at the beginning of the year ........................ 886 1,863b) No. of complaints received during the year ............................................ 112,051 102,488c) No. of complaints redressed during the year .......................................... 110,835 103,465d) No. of complaints pending at the end of the year .................................. 2,102 886
1. Does not include complaints redressed within 1 working day.
2. The complaints in year ended March 31, 2010 have increased, as the Bank has started considering all criticalrequests as complaints from October 2009.
The following table sets forth, for the periods indicated, the details of awards during the year.
Particulars
Year ended
March 31, 2010
Year ended
March 31, 2009
a) No. of unimplemented awards at the beginning of the year................... — 1b) No. of awards passed by the Banking Ombudsmen during the year ...... — —c) No. of awards implemented during the year ........................................... — 1d) No. of unimplemented awards at the end of the year............................. — —
F-98

45. Comparative figures
Figures of the previous year have been re-grouped to conform to the current year presentation.
SIGNATURES TO SCHEDULES 1 TO 19
For and on behalf of the Board of Directors
K. V. KamathChairman
Chanda D. KochharManaging Director & CEO
Sandeep BakhshiDeputy Managing Director
N. S. KannanExecutive Director & CFO
K. RamkumarExecutive Director
Sonjoy ChatterjeeExecutive Director
Sandeep BatraGroup Compliance Officer &
Company Secretary
Rakesh JhaDeputy Chief Financial Officer
Place: MumbaiDate: April 24, 2010
F-99

To the MembersICICI Bank Limited
Auditors’ report on the financial statements of ICICI Bank Limited
1. We have audited the attached Balance Sheet of ICICI Bank Limited (‘the Bank’) as at March 31, 2009and also the Profit and Loss Account and the Cash Flow Statement for the year then ended, both annexedthereto. These financial statements are the responsibility of the Bank’s management. Our responsibilityis to express an opinion on these financial statements based on our audit. Incorporated in the saidfinancial statements are the returns of the Singapore, Bahrain and Hong Kong branches of the Bank,audited by other auditors.
2. We conducted our audit in accordance with auditing standards generally accepted in India. Thosestandards require that we plan and perform the audit to obtain reasonable assurance about whether thefinancial statements are free of material misstatements. An audit includes examining, on a test basis,evidence supporting the amounts and disclosures in the financial statements. An audit also includesassessing the accounting principles used and significant estimates made by the management, as well asevaluating the overall financial statements presentation. We believe that our audit provides a reasonablebasis for our opinion.
3. We did not audit the financial statements of the Singapore, Bahrain and Hong Kong branches of theBank, whose financial statements reflect total assets of Rs. 812,373.4 million as at March 31, 2009, totalrevenues of Rs. 46,276.6 million and cash flows of Rs. (4,607.5) million for the year then ended. Thesefinancial statements have been audited by other auditors, duly qualified to act as auditors in the countryof incorporation of the said branches, whose reports have been furnished to us, and which were reliedupon by us for our opinion on the financial statements of the Bank.
4. The Balance Sheet and the Profit and Loss Account have been drawn up in accordance with theprovisions of Section 29 of the Banking Regulation Act, 1949 read with Section 211(1), (2) and (3C) ofthe Companies Act, 1956.
5. We report that:
a) we have obtained all the information and explanations which, to the best of our knowledge andbelief, were necessary for the purpose of our audit and have found them to be satisfactory;
b) the transactions of the Bank, which have come to our notice, have been within the powers of theBank;
c) the returns received from the offices and branches of the Bank have been found adequate for thepurposes of our audit.
6. In our opinion, the Balance Sheet, the Profit and Loss Account and the Cash Flow Statement dealt withby this report comply with the accounting principles generally accepted in India including AccountingStandards referred to in subsection (3C) of section 211 of the Companies Act, 1956, to the extent theyare not inconsistent with the accounting policies prescribed by the Reserve Bank of India.
7. We further report that:
a) the Balance Sheet, Profit and Loss Account and Cash Flow Statement dealt with by this report arein agreement with the books of account and the returns;
b) in our opinion, proper books of account as required by law have been kept by the Bank so far asappears from our examination of those books;
c) the reports on the financial statements of the Singapore, Bahrain and Hong Kong branches auditedby other auditors have been dealt with in preparing our report in the manner considered appropriateby us;
d) as per information and explanation given to us the Central Government has, till date, not prescribedany cess payable under Section 441A of the Companies Act, 1956.
e) on the basis of written representations received from the directors, as on March 31, 2009, and takenon record by the Board of Directors, we report that none of the directors is disqualified as on March31, 2009 from being appointed as a director in terms of clause (g) of sub-section (1) of Section 274of the Companies Act, 1956;
F-100

8. In our opinion and to the best of our information and according to the explanations given to us andon consideration of reports submitted by the Singapore, Bahrain and Hong Kong branch auditors,the said financial statements together with the notes thereon give the information required by theBanking Regulation Act, 1949 as well as the Companies Act, 1956, in the manner so required forbanking companies and give a true and fair view in conformity with accounting principlesgenerally accepted in India:
a) in the case of the Balance Sheet, of the state of affairs of the Bank as at March 31, 2009;
b) in the case of the Profit and Loss Account, of the profit of the Bank for the year ended on that date;and
c) in the case of the Cash Flow Statement, of the cash flows of the Bank for the year ended on thatdate.
For B S R & Co.Chartered Accountants
Akeel MasterPartnerMembership No.: 046768
MumbaiApril 25, 2009
F-101

Unconsolidated Balance Sheet as on March 31, 2009
Schedule
As on
31.03.2009
As on
31.03.2008
(Rupees in ’000s)
CAPITAL AND LIABILITIESCapital .......................................................................................... 1 14,632,898 14,626,786Reserves and surplus.................................................................... 2 484,197,292 453,575,309Deposits........................................................................................ 3 2,183,478,249 2,444,310,502Borrowings ................................................................................... 4 673,236,886 656,484,338Other liabilities and provisions .................................................... 5 437,464,298 428,953,827
TOTAL CAPITAL AND LIABILITIES.................................... 3,793,009,623 3,997,950,762
ASSETSCash and balances with Reserve Bank of India .......................... 6 175,363,342 293,775,337Balances with banks and money at call and short notice ............ 7 124,302,296 86,635,952Investments................................................................................... 8 1,030,583,080 1,114,543,415Advances ...................................................................................... 9 2,183,108,492 2,256,160,827Fixed assets .................................................................................. 10 38,016,209 41,088,975Other assets .................................................................................. 11 241,636,204 205,746,256
TOTAL ASSETS ......................................................................... 3,793,009,623 3,997,950,762
Contingent liabilities .................................................................... 12 8,346,830,027 12,110,823,313Bills for collection ....................................................................... 60,004,383 42,782,842Significant accounting policies and notes to accounts ................ 18 & 19
The schedules referred to above form an integral part of the Balance Sheet.
As per our Report of even date. For and on behalf of the Board of Directors
For B S R & Co.Chartered Accountants
N. VaghulChairman
K. V. KamathManaging Director & CEO
Chanda D. KochharJoint Managing Director & CFO
Akeel MasterPartner
Membership no.: 046768
V. VaidyanathanExecutive Director
Sonjoy ChatterjeeExecutive Director
K. RamkumarExecutive Director
Sandeep BatraGroup Compliance Officer
& Company Secretary
Rakesh JhaDeputy Chief Financial Officer
Place : MumbaiDate : April 25, 2009
F-102

Unconsolidated Profit and Loss Account for the year ended March 31, 2009
Schedule
Year ended
31.03.2009
Year ended
31.03.2008
(Rupees in ’000s)
I. INCOMEInterest earned ......................................................................... 13 310,925,484 307,883,429Other income ........................................................................... 14 76,037,271 88,107,628
TOTAL INCOME ........................................................................... 386,962,755 395,991,057
II. EXPENDITUREInterest expended ..................................................................... 15 227,259,343 234,842,423Operating expenses .................................................................. 16 70,451,137 81,541,819Provisions and contingencies ................................................. 17 51,670,943 38,029,536
TOTAL EXPENDITURE................................................................ 349,381,423 354,413,778
III. PROFIT/LOSSNet profit for the year ............................................................. 37,581,332 41,577,279Profit brought forward ............................................................. 24,363,159 9,982,741
TOTAL PROFIT/(LOSS)................................................................ 61,944,491 51,560,020
IV. APPROPRIATIONS/TRANSFERSTransfer to Statutory Reserve .................................................. 9,400,000 10,400,000Transfer to Reserve Fund ........................................................ 4,221 3,138Transfer to Capital Reserve ..................................................... 8,180,000 1,270,000Transfer to Special Reserve..................................................... 2,500,000 1,750,000Dividend (including corporate dividend tax) for the previousyear paid during the year......................................................... 5,811 43,822Proposed equity share dividend............................................... 12,245,771 12,239,562Proposed preference share dividend ........................................ 35 35Corporate dividend tax ........................................................... 1,512,143 1,490,304Balance carried over to balance sheet ..................................... 28,096,510 24,363,159
TOTAL ............................................................................................. 61,944,491 51,560,020
Significant accounting policies and notes to accounts ..................... 18 & 19Earnings per share (Refer note 19.4)
Basic (Rs.) ............................................................................... 33.76 39.39Diluted (Rs.) ............................................................................ 33.70 39.15
Face value per share (Rs.) ................................................................ 10.00 10.00
The schedules referred to above form an integral part of the Profit and Loss Account.
As per our Report of even date. For and on behalf of the Board of Directors
For B S R & Co.Chartered Accountants
N. VaghulChairman
K. V. KamathManaging Director & CEO
Chanda D. KochharJoint Managing Director & CFO
Akeel MasterPartner
Membership no.: 046768
V. VaidyanathanExecutive Director
Sonjoy ChatterjeeExecutive Director
K. RamkumarExecutive Director
Sandeep BatraGroup Compliance Officer
& Company Secretary
Rakesh JhaDeputy Chief Financial Officer
Place : MumbaiDate : April 25, 2009
F-103

Unconsolidated Cash Flow Statement for the year ended March 31, 2009
PARTICULARSYear ended31.03.2009
Year ended31.03.2008
(Rupees in ’000s)Cash flow from operating activitiesNet profit before taxes ................................................................................................... 51,169,693 50,560,977Adjustments for:Depreciation and amortisation ....................................................................................... 8,576,435 7,711,011Net (appreciation)/depreciation on investments ............................................................. 13,371,083 10,279,608Provision in respect of non-performing assets (including prudential provision onstandard assets) .............................................................................................................. 37,500,259 27,009,924Provision for contingencies & others............................................................................. (395,005) 1,413,354Income from subsidiaries, joint ventures and consolidated entities .............................. (3,636,999) (12,783,599)(Profit)/Loss on sale of fixed assets .............................................................................. (175,113) (656,069)
106,410,353 83,535,206
Adjustments for:(Increase)/decrease in investments ................................................................................. 26,560,241 (25,015,908)(Increase)/decrease in advances ..................................................................................... 34,618,121 (320,850,355)Increase/(decrease) in borrowings.................................................................................. 32,785,480 43,122,293Increase/(decrease) in deposits....................................................................................... (260,832,253) 126,079,339(Increase)/decrease in other assets ................................................................................. (33,283,816) (27,149,533)Increase/(decrease) in other liabilities and provisions ................................................... (32,683,319) 22,330,716
(232,835,546) (181,483,448)Refund/(payment) of direct taxes................................................................................... (15,459,704) (18,363,292)
Net cash generated from operating activities (A)...................................................... (141,884,897) (116,311,534)
Cash flow from investing activitiesInvestments in subsidiaries and/or joint ventures(including application money) ....................................................................................... (42,016,414) (44,379,917)Income from subsidiaries, joint ventures and consolidated entities .............................. 3,636,999 12,783,799Purchase of fixed assets ................................................................................................. (10,568,742) (9,592,487)Proceeds from sale of fixed assets................................................................................. 667,236 1,064,035(Purchase)/sale of held to maturity securities ................................................................ 86,859,726 (135,486,579)
Net cash generated from investing activities (B) ....................................................... 38,578,805 (175,611,149)
Cash flow from financing activitiesProceeds from issue of share capital (including ESOPs) net of issue expenses ........... 452,464 197,897,060Net proceeds/(repayment) of bonds (including subordinated debt) ............................... 29,492,463 112,316,167Dividend and dividend tax paid..................................................................................... (13,691,338) (10,565,000)
Net cash generated from financing activities (C) ...................................................... 16,253,589 299,648,227
Effect of exchange fluctuation on translation reserve (D)........................................ 6,306,853 (890,065)
Net cash and cash equivalents taken over from Sangli Bank Ltdon amalgamation (E).................................................................................................... — 2,362,563
Net increase/(decrease) in cash and cash equivalents(A) + (B) + (C) + (D) + (E) ......................................................................................... (80,745,650) 9,198,042
Cash and cash equivalents at April 1 ......................................................................... 380,411,288 371,213,247
Cash and cash equivalents at March 31 .................................................................... 299,665,638 380,411,289
Significant accounting policies and notes to accounts (refer Schedule 18 & 19)
The schedules referred to above form an integral part of the Balance Sheet.
As per our Report of even date For and on behalf of the Board of Directors
For B S R & Co.Chartered Accountants
N. VaghulChairman
K. V. KamathManaging Director & CEO
Chanda D. KochharJoint Managing Director
& CFO
Akeel MasterPartner
Membership no.: 046768
V. VaidyanathanExecutive Director
Sonjoy ChatterjeeExecutive Director
K. RamkumarExecutive Director
Sandeep BatraGroup Compliance Officer
& Company Secretary
Rakesh JhaDeputy Chief Financial Officer
Place : MumbaiDate : April 25, 2009
F-104

Schedules forming part of the balance sheet
As on
31.03.2009
As on
31.03.2008
(Rupees in ’000s)
SCHEDULE 1 — CAPITALAuthorised capital1,275,000,000 equity shares of Rs. 10 each [March 31,
2008: 1,275,000,000 equity shares of Rs. 10 each] ..................................... 12,750,000 12,750,00015,000,000 shares of Rs. 100 each [March 31, 2008: 15,000,000 shares
of Rs. 100 each] 1......................................................................................... 1,500,000 1,500,000350 preference shares of Rs. 10 million each [March 31, 2008: 350
preference shares of Rs. 10 million each] ................................................... 3,500,000 3,500,000
Equity share capitalIssued, subscribed and paid-up capital 2
1,112,687,495 equity shares of Rs. 10 each (March 31, 2008:1,111,218,782equity shares) ............................................................................................... 11,126,875 11,112,188Add: 563,147 equity shares of Rs. 10 each fully paid up (March 31,
2008: 1,468,713 equity shares) issued pursuant to exercise ofemployee stock options .................................................................. 5,631 14,687
11,132,506 11,126,875Less: Calls unpaid ........................................................................................... 378 859Add: 111,603 equity shares forfeited (March 31, 2008: 111,603 equity
shares) ................................................................................................. 770 770
TOTAL EQUITY CAPITAL ......................................................................... 11,132,898 11,126,786[Preference share capitalRepresents face value of 350 preference shares of Rs. 10 million each
issued to preference share holders of erstwhile ICICI Limited onamalgamation redeemable at par on April 20, 2018] ................................... 3,500,000 3,500,000
TOTAL CAPITAL .......................................................................................... 14,632,898 14,626,786
1. These shares will be of such class and with such rights, privileges, conditions or restrictions as may be determinedby the Bank in accordance with the Articles of Association of the Bank and subject to the legislative provisions forthe time being in that behalf.
2 Includes:-
a) 3,455,008 equity shares of Rs. 10 each fully paid up allotted to shareholders of erstwhile Sangli Bank Limitedon amalgamation on May 28, 2007.
b) 108,598,626 equity shares of Rs. 10 each fully paid up issued vide prospectus dated June 26, 2007 (includes13,762,869 shares issued under green shoe option).
c) 99,898,476 equity shares of Rs. 10 each fully paid up underlying 49,949,238 American Depository Shares(ADSs) issued vide prospectus dated June 23, 2007 (includes 6,497,462 ADSs issued under green shoeoption).
F-105

Schedules forming part of the balance sheet
As on
31.03.2009
As on
31.03.2008
(Rupees in ’000s)
SCHEDULE 2 — RESERVES AND SURPLUSI. Statutory reserve
Opening balance ...................................................................................... 39,393,807 28,787,307Additions during the year ...................................................................... 9,400,000 10,606,500Deductions during the year ..................................................................... — —Closing balance ....................................................................................... 48,793,807 39,393,807
II. Special reserveOpening balance ...................................................................................... 20,940,000 19,190,000Additions during the year ...................................................................... 2,500,000 1,750,000Deductions during the year ..................................................................... — —Closing balance ....................................................................................... 23,440,000 20,940,000
III. Securities premiumOpening balance ..................................................................................... 312,471,030 120,154,919Additions during the year 1 ..................................................................... 446,352 197,644,847Deductions during the year 2................................................................... — 5,328,736Closing balance ....................................................................................... 312,917,382 312,471,030
IV. Capital reserveOpening balance ...................................................................................... 8,010,000 6,740,000Additions during the year ...................................................................... 8,180,000 1,270,000Deductions during the year ..................................................................... — —Closing balance ....................................................................................... 16,190,000 8,010,000
V. Foreign currency translation reserve ....................................................... 4,966,797 (1,391,262)VI. Reserve fund
Opening balance ..................................................................................... 4,528 1,390Additions during the year 3 ..................................................................... 4,221 3,138Deductions during the year ..................................................................... — —Closing balance ....................................................................................... 8,749 4,528
VII. Revenue and other reservesOpening balance ..................................................................................... 49,784,047 49,784,047Additions during the year ...................................................................... — —Deductions during the year .................................................................... — —Closing balance ....................................................................................... 49,784,047 49,784,047
VIII. Balance in profit and loss account .......................................................... 28,096,510 24,363,159
TOTAL RESERVES AND SURPLUS ........................................................... 484,197,292 453,575,309
1. Includes:-
a) Rs. 98,865.1 million in the previous year (net of share premium in arrears of Rs. 486.1 million) consequentto public issue (including shares issued under green shoe option) vide prospectus dated June 26, 2007.
b) Rs. 98,237.4 million in the previous year consequent to issue of ADSs (including shares issued under greenshoe option) vide prospectus dated June 23, 2007.
c) Rs. 184.1 million (March 31, 2008: Rs. 542.3 million) on exercise of employee stock options.
2. Represents:-
a) Rs. 3,482.2 million in the previous year being the excess of the paid-up value of the shares issued to theshareholders of The Sangli Bank Limited over the fair value of the net assets acquired on merger andamalgamation expenses as per the scheme of amalgamation.
b) Rs. 1,846.6 million in the previous year being the share issue expenses, written-off from the securitiespremium account as per the objects of the issue.
3. Represents appropriation of 5% of net profit by Sri Lanka branch to meet the requirements of Section 20 of SriLankan Banking Act No 30 of 1988.
F-106

Schedules forming part of the balance sheet
As on
31.03.2009
As on
31.03.2008
(Rupees in ’000s)
SCHEDULE 3 — DEPOSITSA. I. Demand deposits
i) From banks............................................................................ 7,455,466 5,018,339ii) From others ........................................................................... 208,861,406 241,894,532
II. Savings bank deposits .................................................................... 410,361,455 390,893,090III. Term deposits
i) From banks............................................................................ 158,017,816 125,024,337ii) From others ........................................................................... 1,398,782,106 1,681,480,204
TOTAL DEPOSITS ........................................................................................ 2,183,478,249 2,444,310,502
B. I. Deposits of branches in India......................................................... 2,078,376,652 2,372,239,318II. Deposits of branches outside India ................................................ 105,101,597 72,071,184
TOTAL DEPOSITS ........................................................................................ 2,183,478,249 2,444,310,502
As on
31.03.2009
As on
31.03.2008
(Rupees in ’000s)
SCHEDULE 4 — BORROWINGSI. Borrowings in India
i) Reserve Bank of India .................................................................. — —ii) Other banks .................................................................................... 23,246,348 32,105,635iii) Other institutions and agencies
a) Government of India ............................................................. 1,075,400 1,592,480b) Financial institutions ............................................................. 35,427,632 27,541,146
iv) Borrowings in the form ofBonds and debentures (excluding subordinated debt)- Debentures and bonds guaranteed by the Government of India . 11,755,000 14,815,000- Borrowings under private placement of bonds carrying
maturity of 1 to 30 years from the date of placement ................ 6,680,649 6,545,648Bonds issued under multiple option/safety bonds series- Regular interest bonds ................................................................. 3,278,880 5,393,095- Deep discount bonds.................................................................... 4,332,005 4,401,234- Tax saving bonds ........................................................................ 16,033,862 17,376,227- Pension bonds .............................................................................. 61,805 61,722
TOTAL BORROWINGS IN INDIA .............................................................. 101,891,581 109,832,187
II. Borrowings outside Indiai) From multilateral/bilateral credit agencies guaranteed by the
Government of India for the equivalent of Rs. 20,523.1 million(March 31, 2008: Rs. 18,402.9 million)......................................... 22,862,196 20,966,276
ii) From international banks, institutions and consortiums................. 285,348,542 241,652,121iii) By way of bonds and notes............................................................ 262,531,035 283,229,410iv) Other borrowings............................................................................ 603,532 804,344
TOTAL BORROWINGS OUTSIDE INDIA ................................................. 571,345,305 546,652,151
TOTAL BORROWINGS ................................................................................ 673,236,886 656,484,338
Secured borrowings in I and II above is Rs. Nil [March 31, 2008: Rs. Nil].
F-107

Schedules forming part of the balance sheet
As on
31.03.2009
As on
31.03.2008
(Rupees in ’000s)
SCHEDULE 5 — OTHER LIABILITIES AND PROVISIONSI. Bills payable ............................................................................................ 18,251,332 29,007,972II. Inter-office adjustments (net) ................................................................. 4,213,071 4,293,542III. Interest accrued........................................................................................ 27,989,208 25,968,705IV. Unsecured redeemable/perpetual debentures/bonds
[Subordinated debt included in Tier I and Tier II Capital] ..................... 254,817,656 207,501,787V. Others
a) Security deposits from clients ........................................................ 9,463,352 15,197,638b) Sundry creditors ............................................................................. 61,267,278 74,101,312c) Received for disbursements under special program....................... 1,644,645 2,034,281d) Provision for standard assets .......................................................... 14,360,648 14,550,250e) Other liabilities 1 ............................................................................ 45,457,108 56,298,340
TOTAL OTHER LIABILITIES AND PROVISIONS.................................. 437,464,298 428,953,827
1. Includes:
a) Proposed dividend of Rs. 12,245.8 million [March 31, 2008: Rs. 12,239.6 million].
b) Corporate dividend tax payable of Rs. 1,512.1 million [March 31, 2008: Rs. 1,490.3 million].
As on31.03.2009
As on31.03.2008
(Rupees in ’000s)
SCHEDULE 6 — CASH AND BALANCES WITH RESERVEBANK OF INDIA
I. Cash in hand (including foreign currency notes) .................................... 28,557,057 28,478,239II. Balances with Reserve Bank of India in current accounts ..................... 146,806,285 265,297,098
TOTAL CASH AND BALANCES WITH RESERVE BANK OF INDIA .. 175,363,342 293,775,337
As on31.03.2009
As on31.03.2008
(Rupees in ’000s)
SCHEDULE 7 — BALANCES WITH BANKS ANDMONEY AT CALL AND SHORT NOTICE
I. In Indiai) Balances with banks
a) In current accounts ................................................................ 7,559,863 8,705,555b) In other deposit accounts ...................................................... 36,456,555 3,343,519
ii) Money at call and short noticea) With banks............................................................................. — —b) With other institutions ........................................................... — —
TOTAL............................................................................................................. 44,016,418 12,049,074II. Outside India
i) In current accounts ......................................................................... 23,561,910 16,473,903ii) In other deposit accounts................................................................ 28,407,146 31,635,362iii) Money at call and short notice....................................................... 28,316,822 26,477,613
TOTAL............................................................................................................. 80,285,878 74,586,878TOTAL BALANCES WITH BANKS AND MONEY AT CALL ANDSHORT NOTICE ............................................................................................ 124,302,296 86,635,952
F-108

Schedules forming part of the balance sheet
As on
31.03.2009
As on
31.03.2008
(Rupees in ’000s)
SCHEDULE 8 — INVESTMENTSI. Investments in India [net of provisions]
i) Government securities .................................................................... 633,774,902 753,777,483ii) Other approved securities ............................................................... 93,405 97,946iii) Shares (includes equity and preference shares) ............................ 17,031,332 29,200,790iv) Debentures and bonds ................................................................... 26,000,683 18,871,649v) Subsidiaries and/or joint ventures .................................................. 61,194,621 46,382,774vi) Others (commercial paper, mutual fund units, pass through
certificates, security receipts etc.) ................................................. 196,688,823 202,833,016
TOTAL INVESTMENTS IN INDIA ............................................................. 934,783,766 1,051,163,658
II. Investments outside India [net of provisions]i) Government securities .................................................................... 953,347 1,402,546ii) Subsidiaries and/or joint ventures abroad (includes equity and
preference shares) ......................................................................... 65,924,016 38,719,449iii) Others ............................................................................................ 28,921,951 23,257,762
TOTAL INVESTMENTS OUTSIDE INDIA ................................................ 95,799,314 63,379,757
TOTAL INVESTMENTS ............................................................................... 1,030,583,080 1,114,543,415
III. Investments in IndiaGross value of investments ..................................................................... 947,314,476 1,056,883,463Less: Aggregate of provision/depreciation .............................................. 12,530,710 5,719,805
Net investments ...................................................................................... 934,783,766 1,051,163,658IV. Investments outside India
Gross value of investments ..................................................................... 97,586,277 64,358,489Less: Aggregate of provision/depreciation .............................................. 1,786,963 978,732
Net investments ...................................................................................... 95,799,314 63,379,757
TOTAL INVESTMENTS ............................................................................... 1,030,583,080 1,114,543,415
F-109

Schedules forming part of the balance sheet
As on31.03.2009
As on31.03.2008
(Rupees in ’000s)
SCHEDULE 9 — ADVANCES [net of provisions]A. i) Bills purchased and discounted ...................................................... 40,610,992 46,763,159
ii) Cash credits, overdrafts and loans repayable on demand .............. 343,945,509 348,051,840iii) Term loans ...................................................................................... 1,696,347,568 1,755,794,419iv) Securitisation, finance lease and hire purchase receivables ......... 102,204,423 105,551,409
TOTAL ADVANCES ....................................................................................... 2,183,108,492 2,256,160,827
B. i) Secured by tangible assets (includes advances against bookdebts) .............................................................................................. 1,575,653,288 1,693,135,659
ii) Covered by bank/government guarantees....................................... 14,815,009 42,087,202iii) Unsecured ....................................................................................... 592,640,195 520,937,966
TOTAL ADVANCES ....................................................................................... 2,183,108,492 2,256,160,827
C. I. Advances in Indiai) Priority sector ........................................................................ 620,515,976 597,325,197ii) Public sector .......................................................................... 3,494,486 3,559,887iii) Banks ..................................................................................... 252,580 45,947iv) Others .................................................................................... 1,015,930,993 1,177,773,278
TOTAL ADVANCES IN INDIA..................................................................... 1,640,194,035 1,778,704,309II. Advances outside India
i) Due from banks ..................................................................... 14,965,907 41,225,542ii) Due from others
a) Bills purchased and discounted .................................... 13,856,733 19,965,470b) Commercial loans......................................................... 283,420,282 271,379,347c) Others ........................................................................... 230,671,535 144,886,159
TOTAL ADVANCES OUTSIDE INDIA ....................................................... 542,914,457 477,456,518
TOTAL ADVANCES ....................................................................................... 2,183,108,492 2,256,160,827
As on31.03.2009
As on31.03.2008
(Rupees in ’000s)
SCHEDULE 10 — FIXED ASSETSI. Premises
At cost as on March 31 of preceding year ............................................ 22,942,919 20,496,202Additions during the year ...................................................................... 1,694,879 2,719,704Deductions during the year .................................................................... (527,480) (272,987)Depreciation to date ............................................................................... (4,139,362) (3,326,017)
Net block ............................................................................................... 19,970,956 19,616,902II. Other fixed assets (including furniture and fixtures)
At cost as on March 31 of preceding year ............................................ 29,338,047 24,352,894Additions during the year ...................................................................... 3,833,680 5,588,730Deductions during the year .................................................................... (596,158) (603,577)Depreciation to date ............................................................................... (19,153,333) (15,836,691)
Net block ............................................................................................... 13,422,236 13,501,356III. Assets given on lease
At cost as on March 31 of preceding year ............................................ 18,079,072 18,136,532Additions during the year ...................................................................... — —Deductions during the year ..................................................................... (327,898) (57,460)Depreciation to date, accumulated lease adjustment and provisions ..... (13,128,157) (10,108,355)
Net block................................................................................................. 4,623,017 7,970,717
TOTAL FIXED ASSETS ................................................................................ 38,016,209 41,088,975
F-110

Schedules forming part of the balance sheet
As on
31.03.2009
As on
31.03.2008
(Rupees in ’000s)
SCHEDULE 11 — OTHER ASSETSI. Inter-office adjustments (net) .................................................................. — —II. Interest accrued........................................................................................ 41,382,870 34,867,173III. Tax paid in advance/tax deducted at source (net) ................................... 37,815,636 40,660,994IV. Stationery and stamps.............................................................................. 928 574V. Non-banking assets acquired in satisfaction of claims 1......................... 3,089,212 3,658,544VI. Others
a) Advance for capital assets.............................................................. 8,776,627 6,404,148b) Outstanding fees and other income ................................................ 6,581,734 5,772,850c) Deposits .......................................................................................... 25,189,917 27,606,644d) Deferred tax asset (net) .................................................................. 17,923,148 13,233,940e) Early retirement option expenses not written off........................... — 117,979f) Others ............................................................................................. 100,876,132 73,423,410
TOTAL OTHER ASSETS .............................................................................. 241,636,204 205,746,256
1. Includes certain non-banking assets acquired in satisfaction of claims which are in the process of being transferredin the Bank’s name.
As on31.03.2009
As on31.03.2008
(Rupees in ’000s)
SCHEDULE 12 — CONTINGENT LIABILITIESI. Claims against the Bank not acknowledged as debts.............................. 32,824,550 40,306,033II. Liability for partly paid investments ....................................................... 128,126 128,126III. Liability on account of outstanding forward exchange contracts ........... 2,583,670,864 3,071,712,304IV. Guarantees given on behalf of constituents
a) In India ........................................................................................... 453,001,349 338,313,547b) Outside India .................................................................................. 127,880,113 74,501,645
V. Acceptances, endorsements and other obligations .................................. 306,782,689 250,992,610VI. Currency swaps ....................................................................................... 569,648,391 477,039,283VII. Interest rate swaps, currency options and interest rate futures ............... 4,146,346,015 7,665,289,657VIII. Other items for which the Bank is contingently liable ........................... 126,547,930 192,540,108
TOTAL CONTINGENT LIABILITIES ........................................................ 8,346,830,027 12,110,823,313
F-111

Schedules forming part of the profit and loss account
Year ended
31.03.2009
Year ended
31.03.2008
(Rupees in ’000s)
SCHEDULE 13 — INTEREST EARNEDI. Interest/discount on advances/bills .......................................................... 223,238,295 226,009,874II. Income on investments1 .......................................................................... 74,030,595 74,660,091III. Interest on balances with Reserve Bank of India and other inter-bank
funds ........................................................................................................ 5,187,095 6,119,944IV. Others 2.................................................................................................... 8,469,499 1,093,520
TOTAL INTEREST EARNED....................................................................... 310,925,484 307,883,429
1. Includes amortisation of premium on Government securities Rs. 7,253.4 million (March 31, 2008: Rs. 8,976.2million).
2. Includes interest on income tax refunds Rs. 3,331.7 million (March 31, 2008: Rs. 871.0 million).
Year ended31.03.2009
Year ended31.03.2008
(Rupees in ’000s)
SCHEDULE 14 — OTHER INCOMEI. Commission, exchange and brokerage ................................................... 56,258,933 56,053,127II. Profit/(loss) on sale of investments (net) ................................................ 18,004,745 18,802,235III. Profit/(loss) on revaluation of investments (net)..................................... (5,140,339) (680,855)IV. Profit/(loss) on sale of land, buildings and other assets (net) 1.............. 175,113 656,069V. Profit/(loss) on foreign exchange transactions (net) .............................. 84,146 1,101,719VI. Income earned by way of dividends, etc. from subsidiary companies
and/or joint ventures abroad/in India ...................................................... 3,348,233 11,519,500VII. Miscellaneous income (including lease income) .................................... 3,306,440 655,833
TOTAL OTHER INCOME ............................................................................ 76,037,271 88,107,628
1. Includes profit/(loss) on sale of assets given on lease.
Year ended31.03.2009
Year ended31.03.2008
(Rupees in ’000s)
SCHEDULE 15 — INTEREST EXPENDEDI. Interest on deposits.................................................................................. 157,851,583 171,102,433II. Interest on Reserve Bank of India/inter-bank borrowings 1.................... 20,045,886 18,269,621III. Others (including interest on borrowings of erstwhile ICICI Limited) . 49,361,874 45,470,369
TOTAL INTEREST EXPENDED.................................................................. 227,259,343 234,842,423
1. Includes interest paid on inter-bank deposits.
F-112

Schedules forming part of the profit and loss account
Year ended
31.03.2009
Year ended
31.03.2008
(Rupees in ’000s)
SCHEDULE 16 — OPERATING EXPENSESI. Payments to and provisions for employees ............................................. 19,717,045 20,788,974II. Rent, taxes and lighting........................................................................... 6,257,960 5,166,414III. Printing and stationery ............................................................................ 1,200,296 1,742,100IV. Advertisement and publicity.................................................................... 1,402,840 2,078,608V. Depreciation on Bank’s property ........................................................... 4,684,901 3,962,822VI. Depreciation (including lease equalisation) on leased assets ................ 2,101,070 1,820,689VII. Directors’ fees, allowances and expenses ............................................... 3,640 4,190VIII. Auditors’ fees and expenses .................................................................... 22,738 23,034IX. Law charges............................................................................................. 924,040 453,673X. Postages, telegrams, telephones, etc........................................................ 2,538,545 3,305,702XI. Repairs and maintenance ........................................................................ 4,896,929 4,198,727XII. Insurance.................................................................................................. 2,282,926 2,249,540XIII. Direct marketing agency expenses ......................................................... 5,289,235 15,427,433XIV. Other expenditure ................................................................................... 19,128,972 20,319,913
TOTAL OPERATING EXPENSES ............................................................... 70,451,137 81,541,819
Year ended
31.03.2009
Year ended
31.03.2008
(Rupees in ’000s)
SCHEDULE 17 — PROVISIONS AND CONTINGENCIESI. Income tax
- Current period tax................................................................................. 17,933,052 15,695,283- Deferred tax adjustment........................................................................ (4,716,700) (7,133,600)- Fringe benefit tax.................................................................................. 342,010 392,015
II. Wealth tax................................................................................................ 30,000 30,000III. Provision for investments (net) ............................................................... 977,328 622,560IV. Provision for advances (net) 1................................................................. 37,500,259 27,009,924V. Others ...................................................................................................... (395,006) 1,413,354
TOTAL PROVISIONS AND CONTINGENCIES ........................................ 51,670,943 38,029,536
1. Includes provisions on standard assets, non-performing advances, non-performing leased assets and others.
F-113

SCHEDULE 18 — SIGNIFICANT ACCOUNTING POLICIES
OVERVIEW
ICICI Bank Limited (“ICICI Bank” or “the Bank”), incorporated in Vadodara, India is a publicly heldbanking company engaged in providing a wide range of banking and financial services including commercialbanking and treasury operations. ICICI Bank is a banking company governed by the Banking Regulation Act,1949.
Basis of preparation
The financial statements have been prepared in accordance with statutory requirements prescribed underthe Banking Regulation Act, 1949. The accounting and reporting policies of ICICI Bank used in thepreparation of these financial statements conform to Generally Accepted Accounting Principles in India(“Indian GAAP”), the guidelines issued by Reserve Bank of India (“RBI”) from time to time, the AccountingStandards (‘AS’) issued by the Institute of Chartered accountants of India (‘ICAI’) and notified by theCompanies (Accounting Standards) Rules, 2006 to the extent applicable and practices generally prevalent inthe banking industry in India. The Bank follows the accrual method of accounting, except where otherwisestated, and the historical cost convention.
The preparation of financial statements requires the management to make estimates and assumptionsconsidered in the reported amounts of assets and liabilities (including contingent liabilities) as of the date ofthe financial statements and the reported income and expenses during the reporting period. Managementbelieves that the estimates used in the preparation of the financial statements are prudent and reasonable.Future results could differ from these estimates.
SIGNIFICANT ACCOUNTING POLICIES
1. Revenue recognition
a. Interest income is recognised in the profit and loss account as it accrues except in the case ofnon-performing assets (“NPAs”) where it is recognised upon realisation, as per the incomerecognition and asset classification norms of RBI.
b. Income from hire purchase operations is accrued by applying the implicit interest rate tooutstanding balances.
c. Income from leases is calculated by applying the interest rate implicit in the lease to the netinvestment outstanding on the lease over the primary lease period. Leases entered into till March31, 2001 have been accounted for as operating leases.
d. Income on discounted instruments is recognised over the tenure of the instrument on a constantyield basis.
e. Dividend is accounted on an accrual basis when the right to receive the dividend is established.
f. Loan processing fee is accounted for upfront when it becomes due.
g. Project appraisal/structuring fee is accounted for on the completion of the agreed service.
h. Arranger fee is accounted for as income when a significant portion of the arrangement/syndicationis completed.
i. Commission received on guarantees issued is amortised on a straight-line basis over the period ofthe guarantee.
j. All other fees are accounted for as and when they become due.
k. Net income arising from sell-down/securitisation of loan assets prior to February 1, 2006 has beenrecognised upfront as interest income. With effect from February 1, 2006, net income arising fromsecuritisation of loan assets is amortised over the life of securities issued or to be issued by thespecial purpose vehicle/special purpose entity to which the assets are sold. Net income arising fromsale of loan assets through direct assignment with recourse obligation is amortised over the life ofunderlying assets sold and net income from sale of loan assets through direct assignment, withoutany recourse obligation, is recognised at the time of sale. Net loss arising on account of thesell-down/securitisation and direct assignment of loan assets is recognised at the time of sale.
F-114

2. Investments
Investments are accounted for in accordance with the extant RBI guidelines on investment classificationand valuation as given below.
a. All investments are classified into ‘Held to Maturity’, ‘Available for Sale’ and ‘Held for Trading’.Reclassifications, if any, in any category are accounted for as per RBI guidelines. Under eachclassification, the investments are further categorised as (a) government securities, (b) otherapproved securities, (c) shares, (d) bonds and debentures, (e) subsidiaries and joint ventures and(f) others.
b. ‘Held to Maturity’ securities are carried at their acquisition cost or at amortised cost, if acquiredat a premium over the face value. Any premium over the face value of fixed rate and floating ratesecurities acquired is amortised over the remaining period to maturity on a constant yield basis andstraight line basis respectively.
c. ‘Available for Sale’ and ‘Held for Trading’ securities are valued periodically as per RBI guidelines.Any premium over the face value of investments in government securities, classified as ‘Availablefor Sale’, is amortised over the remaining period to maturity on constant yield basis. Quotedinvestments are valued based on the trades/quotes on the recognised stock exchanges, subsidiarygeneral ledger account transactions, price list of RBI or prices declared by Primary DealersAssociation of India jointly with Fixed Income Money Market and Derivatives Association,periodically.
The market/fair value of unquoted government securities which are in the nature of “SLR”securities included in the ‘Available for Sale’ and ‘Held for Trading’ categories is as per the ratespublished by Fixed Income Money Market and Derivatives Association. The valuation of otherunquoted fixed income securities wherever linked to the Yield-to-Maturity (“YTM”) rates, iscomputed with a mark-up (reflecting associated credit risk) over the YTM rates for governmentsecurities published by Fixed Income Money Market and Derivatives Association.
Unquoted equity shares are valued at the break-up value, if the latest balance sheet is available, orat Re. 1, as per RBI guidelines.
Securities are valued scrip-wise and depreciation/appreciation is aggregated for each category. Netappreciation in each category, if any, being unrealised, is ignored, while net depreciation isprovided for.
d. Costs including brokerage and commission pertaining to investments, paid at the time ofacquisition, are charged to the profit and loss account.
e. Equity investments in subsidiaries/joint ventures are categorised as ‘Held to Maturity’ inaccordance with RBI guidelines.
f. Profit on sale of investments in the ‘Held to Maturity’ category is credited to the profit and lossaccount and is thereafter appropriated (net of applicable taxes and statutory reserve requirements)to Capital Reserve. Profit on sale of investments in ‘Available for Sale’ and ‘Held for Trading’categories is credited to profit and loss account.
g. Repurchase and reverse repurchase transactions are accounted for in accordance with the extantRBI guidelines.
h. Broken period interest on debt instruments is treated as a revenue item.
i. At the end of each reporting period, security receipts issued by the asset reconstruction companyare valued in accordance with the guidelines applicable to such instruments, prescribed by RBIfrom time to time. Accordingly, in cases where the cash flows from security receipts issued by theasset reconstruction company are limited to the actual realisation of the financial assets assignedto the instruments in the concerned scheme, the Bank reckons the net asset value obtained fromthe asset reconstruction company from time to time, for valuation of such investments at eachreporting year/period end.
j. The Bank follows trade date method for accounting of its investments.
F-115
3. Provisions/Write-offs on loans and other credit facilities
a. All credit exposures, including overdues arising from crystallised derivative contracts, areclassified as per RBI guidelines, into performing and non-performing assets (“NPAs”). Further,NPAs are classified into sub-standard, doubtful and loss assets based on the criteria stipulated byRBI.
In the case of corporate loans, provisions are made for sub-standard and doubtful assets at ratesprescribed by RBI. Loss assets and the unsecured portion of doubtful assets are provided/writtenoff as per the extant RBI guidelines. Provisions on homogeneous retail loans, subject to minimumprovisioning requirements of RBI, are assessed at a portfolio level on the basis of days past due.The Bank holds specific provisions against non-performing loans and general provision againstperforming loans. The assessment of incremental specific provisions is made after taking intoconsideration existing specific provision. The specific provisions on retail loans held by the Bankare higher than the minimum regulatory requirements.
b. Provision on assets restructured/rescheduled is made in accordance with the applicable RBIguidelines on restructuring of advances by Banks.
In respect of non-performing loan accounts subjected to restructuring, the account is upgraded tostandard only after the specified period i.e., a period of one year after the date when first paymentof interest or of principal, whichever is earlier, falls due, subject to satisfactory performance of theaccount during the period.
c. Amounts recovered against debts written off in earlier years and provisions no longer considerednecessary in the context of the current status of the borrower are recognised in the profit and lossaccount.
d. In addition to the specific provision on NPAs, the Bank maintains a general provision onperforming loans. The general provision covers the requirements of the RBI guidelines.
e. In addition to the provisions required to be held according to the asset classification status,provisions are held for individual country exposures (other than for home country exposure). Thecountries are categorised into seven risk categories namely insignificant, low, moderate, high, veryhigh, restricted and off-credit and provisioning is made on exposures exceeding 180 days on agraded scale ranging from 0.25% to 100%. For exposures with contractual maturity of less than180 days, 25% of the above provision is required to be held. If the country exposure (net) of theBank in respect of each country does not exceed 1% of the total funded assets, no provision isrequired on such country exposure.
4. Transfer and servicing of assets
The Bank transfers commercial and consumer loans through securitisation transactions. The transferredloans are de-recognised and gains/losses are accounted for only if the Bank surrenders the rights to benefitsspecified in the underlying securitised loan contract. Recourse and servicing obligations are accounted for netof provisions.
In accordance with the RBI guidelines for securitisation of standard assets, with effect from February 1,2006, the Bank accounts for any loss arising from securitisation immediately at the time of sale and theprofit/premium arising from securitisation is amortised over the life of the securities issued or to be issued bythe special purpose vehicle to which the assets are sold. In the case of loans sold to an asset reconstructioncompany the gain, if any, is ignored.
F-116

5. Fixed assets and depreciation
Premises and other fixed assets are carried at cost less accumulated depreciation. Cost includes freight,duties, taxes and incidental expenses related to the acquisition and installation of the asset. Depreciation ischarged over the estimated useful life of a fixed asset on a straight-line basis. The rates of depreciation forfixed assets, which are not lower than the rates prescribed in Schedule XIV of the Companies Act, 1956, aregiven below:
Asset Depreciation Rate
Premises owned by the Bank..................................... 1.63%Improvements to leasehold premises ......................... 1.63% or over the lease period, whichever is higherATMs.......................................................................... 12.50%Plant and machinery like air conditioners,photo-copying machines, etc...................................... 10.00%Computers .................................................................. 33.33%Card acceptance devices ............................................ 12.50%Furniture and fixtures................................................. 15.00%Motor vehicles ........................................................... 20.00%Others (including Software and system developmentexpenses) .................................................................... 25.00%
a) Depreciation on leased assets and leasehold improvements is recognised on a straight-line basisusing rates determined with reference to the primary period of lease or rates specified in ScheduleXIV to the Companies Act, 1956, whichever is higher.
b) Assets purchased/sold during the year are depreciated on a pro-rata basis for the actual number ofdays the asset has been put to use.
c) Items costing upto Rs. 5,000/- are depreciated fully over a period of 12 months from the date ofpurchase.
d) In case of revalued/impaired assets, depreciation is provided over the remaining useful life of theassets.
6. Transactions involving foreign exchange
Foreign currency income and expenditure items of domestic operations are translated at the exchangerates prevailing on the date of the transaction. Income and expenditure items of integral foreign operations(representative offices) are translated at weekly average closing rates, and income and expenditure ofnon-integral foreign operations (foreign branches and offshore banking units) are translated at quarterlyaverage closing rates.
Monetary foreign currency assets and liabilities of domestic and integral foreign operations aretranslated at closing exchange rates notified by Foreign Exchange Dealers’ Association of India (“FEDAI”) atthe balance sheet date and the resulting profits/losses are included in the profit and loss account.
Both monetary and non-monetary foreign currency assets and liabilities of non-integral foreignoperations are translated at closing exchange rates notified by FEDAI at the balance sheet date and theresulting profits/losses from exchange differences are accumulated in the foreign currency translation reserveuntil the disposal of the net investment in the non-integral foreign operations.
The premium or discount arising on inception of forward exchange contracts that are entered into toestablish the amount of reporting currency required or available at the settlement date of a transaction isamortised over the life of the contract. All other outstanding forward exchange contracts are revalued at theexchange rates notified by FEDAI for specified maturities and at interpolated rates for contracts of interimmaturities. The contracts of longer maturities where exchange rates are not notified by FEDAI, are revaluedat the forward exchange rates implied by the swap curves in respective currencies. The resultant gains or lossesare recognised in the profit and loss account.
Contingent liabilities on account of guarantees, endorsements and other obligations denominated inforeign currencies are disclosed at the closing exchange rates notified by FEDAI at the balance sheet date.
F-117

7. Accounting for derivative contracts
The Bank enters into derivative contracts such as foreign currency options, interest rate and currencyswaps, credit default swaps and cross currency interest rate swaps.
The swap contracts entered to hedge on-balance sheet assets and liabilities are structured such that theybear an opposite and offsetting impact with the underlying on-balance sheet items. The impact of suchderivative instruments is correlated with the movement of underlying assets and accounted pursuant to theprinciples of hedge accounting. Hedged swaps are accounted for on an accrual basis.
Foreign currency and rupee derivative contracts entered into for trading purposes are marked to marketand the resulting gain or loss (net of provisions, if any) is accounted for in the profit and loss account. Pursuantto RBI guidelines, any receivables under derivative contracts, which remain overdue for more than 90 days,are reversed through profit and loss account.
8. Employee Stock Option Scheme (“ESOS”)
The Employees Stock Option Scheme (“the Scheme”) provides for grant of equity shares of the Bankto wholetime directors and employees of the Bank and its subsidiaries. The Scheme provides that employeesare granted an option to subscribe to equity shares of the Bank that vests in a graded manner. The options maybe exercised within a specified period. The Bank follows the intrinsic value method to account for itsstock-based employee compensation plans. Compensation cost is measured as the excess, if any, of the fairmarket price of the underlying stock over the exercise price on the grant date. The fair market price is the latestclosing price, immediately prior to the date of the Board of Directors meeting in which the options are granted,on the stock exchange on which the shares of the Bank are listed. If the shares are listed on more than onestock exchange, then the stock exchange where there is highest trading volume on the said date is considered.
Since the exercise price of the Bank’s stock options are equal to fair market price on the grant date, thereis no compensation cost under the intrinsic value method.
The Finance Act, 2007 introduced Fringe Benefit Tax (“FBT”) on employee stock options. The FBTliability crystallises on the date of exercise of stock options by employees and is computed based on thedifference between fair market value on date of vesting and the exercise price. FBT is recovered fromemployees as per the Scheme.
9. Staff Retirement Benefits
Gratuity
ICICI Bank pays gratuity to employees who retire or resign after a minimum period of five years ofcontinuous service and in case of employees at overseas locations as per the rules in force in the respectivecountries. ICICI Bank makes contributions to four separate gratuity funds, for employees inducted fromerstwhile ICICI Limited (erstwhile ICICI), employees inducted from erstwhile Bank of Madura, employeesinducted from erstwhile The Sangli Bank Limited (erstwhile Sangli Bank) and employees of ICICI Bank otherthan employees inducted from erstwhile ICICI, erstwhile Bank of Madura and erstwhile Sangli Bank.
Separate gratuity funds for employees inducted from erstwhile ICICI, erstwhile Bank of Madura anderstwhile Sangli Bank are managed by ICICI Prudential Life Insurance Company Limited. The gratuity fundfor employees of ICICI Bank, other than employees inducted from erstwhile ICICI, erstwhile Bank of Maduraand erstwhile Sangli Bank is administered by Life Insurance Corporation of India and ICICI Prudential LifeInsurance Company Limited.
Actuarial valuation of the gratuity liability for all the above funds is determined by an actuary appointedby the Bank. In accordance with the gratuity funds’ rules, actuarial valuation of gratuity liability is calculatedbased on certain assumptions regarding rate of interest, salary growth, mortality and staff attrition as per theprojected unit credit method.
Superannuation Fund
ICICI Bank contributes 15.0% of the total annual basic salary of each employee to a superannuation fundfor ICICI Bank employees. The employee gets an option on retirement or resignation to commute one-thirdof the total credit balance in his/her account and receive a monthly pension based on the remaining balance.In the event of death of an employee, his or her beneficiary receives the remaining accumulated balance. ICICIBank also gives an option to its employees, allowing them to receive the amount contributed by ICICI Bankalong with their monthly salary during their employment.
F-118

Upto March 31, 2005, the superannuation fund was administered solely by Life Insurance Corporationof India. Subsequent to March 31, 2005, both Life Insurance Corporation of India and ICICI Prudential LifeInsurance Company Limited are administering the fund. Employees had the option to retain the existingbalance with Life Insurance Corporation of India or seek a transfer to ICICI Prudential Life InsuranceCompany Limited.
Pension
The Bank provides for pension, a deferred retirement plan covering certain employees of erstwhile Bankof Madura and certain employees of erstwhile Sangli Bank. The plan provides for a pension payment on amonthly basis to these employees on their retirement based on the respective employee’s salary and years ofemployment with the Bank. For erstwhile Bank of Madura and erstwhile Sangli Bank employees in service,separate pension funds are managed in-house and the liability is funded as per actuarial valuation. The pensionpayments to retired employees of erstwhile Bank of Madura and erstwhile Sangli Bank are being administeredby ICICI Prudential Life Insurance Company Limited, for whom the Bank has purchased master annuitypolicies. Employees covered by the pension plan are not eligible for benefits under the provident fund plan.
Provident Fund
ICICI Bank is statutorily required to maintain a provident fund as a part of retirement benefits to itsemployees. There are separate provident funds for employees inducted from erstwhile Bank of Madura anderstwhile Sangli Bank (other than those employees who have opted for pension), and for other employees ofICICI Bank. In-house trustees manage these funds. Each employee contributes 12.0% of his or her basic salary(10.0% for certain staff of erstwhile Sangli Bank) and ICICI Bank contributes an equal amount to the funds.The funds are invested according to rules prescribed by the Government of India.
Leave encashment
The Bank provides for leave encashment benefit, which is a defined benefit scheme, based on actuarialvaluation as at the balance sheet date conducted by an independent actuary.
10. Income Taxes
Income tax expense is the aggregate amount of current tax, deferred tax and fringe benefit tax borne bythe Bank. The income tax provision is determined in accordance with the provisions of the Income Tax Act,1961. Deferred tax adjustments comprise of changes in the deferred tax assets or liabilities during the year.
Deferred tax assets and liabilities are recognised on a prudent basis for the future tax consequences oftiming differences arising between the carrying values of assets and liabilities and their respective tax basis,and carry forward losses. Deferred tax assets and liabilities are measured using tax rates and tax laws that havebeen enacted or substantively enacted at the balance sheet date. The impact of changes in deferred tax assetsand liabilities is recognised in the profit and loss account.
Deferred tax assets are recognised and re-assessed at each reporting date, based upon management’sjudgement as to whether their realisation is considered as reasonably certain.
11. Impairment of Assets
Fixed assets are reviewed for impairment whenever events or changes in circumstances indicate that thecarrying amount of an asset may not be recoverable. Recoverability of assets to be held and used is measuredby a comparison of the carrying amount of an asset with future net discounted cash flows expected to begenerated by the asset. If such assets are considered to be impaired, the impairment is recognised by debitingthe profit and loss account and is measured as the amount by which the carrying amount of the assets exceedsthe fair value of the assets.
12. Provisions, contingent liabilities and contingent assets
The Bank estimates the probability of any loss that might be incurred on outcome of contingencies onthe basis of information available up to the date on which the financial statements are prepared. A provisionis recognised when an enterprise has a present obligation as a result of a past event and it is probable that anoutflow of resources will be required to settle the obligation, in respect of which a reliable estimate can bemade. Provisions are determined based on management estimates required to settle the obligation at thebalance sheet date, supplemented by experience of similar transactions. These are reviewed at each balancesheet date and adjusted to reflect the current management estimates. In cases where the available information
F-119

indicates that the loss on the contingency is reasonably possible but the amount of loss cannot be reasonablyestimated, a disclosure to this effect is made in the financial statements. In case of remote possibility neitherprovision nor disclosure is made in the financial statements. The Bank does not account for or disclosecontingent assets, if any.
13. Earnings per share (“EPS”)
Basic earnings per share is calculated by dividing the net profit or loss for the year attributable to equityshareholders by the weighted average number of equity shares outstanding during the year.
Diluted earnings per share reflect the potential dilution that could occur if contracts to issue equity shareswere exercised or converted during the year. Diluted earnings per equity share is computed using the weightedaverage number of equity shares and dilutive potential equity shares outstanding during the year, except wherethe results are anti-dilutive.
14. Lease transactions
Lease payments for assets taken on operating lease are recognised as an expense in the profit and lossaccount over the lease term.
15. Cash and cash equivalents
Cash and cash equivalents include cash in hand, balances with RBI, balances with other banks andmoney at call and short notice.
F-120

SCHEDULE 19 — NOTES FORMING PART OF THE ACCOUNTS
The following additional disclosures have been made taking into account the requirements of accountingstandards and Reserve Bank of India (“RBI”) guidelines in this regard.
1. Capital adequacy ratio
The Bank is subject to the capital adequacy norms stipulated by the RBI guidelines on Basel II whichbecame applicable with effect from March 31, 2008. The guidelines require the Bank to maintain a minimumratio of total capital to risk adjusted assets of 9.0%, with a minimum Tier I capital ratio of 6.0%. Prior to March31, 2008, the Bank was subject to the capital adequacy norms as stipulated by the RBI guidelines on BaselI.
In view of its transitional arrangements to the Basel II framework, the RBI has prescribed a parallel rununder which the Bank has calculated capital adequacy under both Basel I and Basel II. Further at March 31,2009, the Bank is required to maintain capital adequacy based on the higher of the minimum capital requiredunder Basel II or 90.0% of the minimum capital required under Basel I (100% as at March 31, 2008). Thecomputation under Basel II guidelines has resulted in a higher minimum capital requirement as compared toBasel I and hence the capital adequacy as at March 31, 2008 and March 31, 2009 has been maintained andreported by the Bank as per Basel II guidelines.
As per Basel I framework
As per Basel II
framework
As on March 31,
2009
As on March 31,
2008
As on March 31,
2009
As on March 31,
2008
(Rupees in million)
Tier I capital ................................................................ 420,098.1 381,340.1 421,967.6 421,724.0(of which Lower Tier I) ............................................... 30,168.6 26,573.4 30,168.6 26,573.4Tier II capital............................................................... 129,715.9 121,212.1 131,585.3 78,861.0(of which Upper Tier II).............................................. 109,100.0 24,510.0 109,100.0 24,510.0Total capital ................................................................. 549,814.0 502,552.2 553,552.9 500,585.0Total risk weighted assets............................................ 3,453,378.9 3,367,547.0 3,564,629.9 3,584,566.2CRAR (%) ................................................................... 15.92% 14.92% 15.53% 13.97%CRAR — Tier I capital (%) ........................................ 12.16% 11.32% 11.84% 11.76%CRAR — Tier II capital (%)....................................... 3.76% 3.60% 3.69% 2.20%Amount of subordinated debt raised as Tier I capital/Tier II capital during the year ..................................... 45,210.0 22,350.0 45,210.0 22,350.0
2. Business/information ratios
The business/information ratios for the year ended March 31, 2009 and March 31, 2008 are given in thetable below:
Year ended
March 31, 2009
Year ended
March 31, 2008
(i) Interest income to working funds1 .......................................................... 8.11% 8.29%(ii) Non-interest income to working funds1 ................................................. 1.98% 2.37%(iii) Operating profit to working funds1 ......................................................... 2.33% 2.14%(iv) Return on assets2 ..................................................................................... 0.98% 1.12%(v) Profit per employee (Rs. in million) ....................................................... 1.1 1.0(vi) Business per employee (average deposits plus average advances)3
(Rs. in million) ........................................................................................ 115.4 100.8
1. For the purpose of computing the ratios, working funds represent the average of total assets as reported in Form Xto RBI under Section 27 of the Banking Regulation Act, 1949.
2. For the purpose of computing the ratio, assets represent average total assets as reported to RBI in Form X underSection 27 of the Banking Regulation Act, 1949.
F-121

3. For the purpose of computing the ratio, deposits and advances are the total deposits and total advances as reportedto RBI in Form A under Section 42(2) of the Reserve Bank of India Act, 1934. The average deposits and the averageadvances represent the simple average of the figures reported in Form A to RBI under Section 42(2) of the ReserveBank of India Act, 1934.
3. Information about business and geographical segments
Business segments
Pursuant to the guidelines issued by RBI on Accounting Standard-17 (Segment Reporting) —Enhancement of Disclosures dated April 18, 2007, effective from year ended March 31, 2008, the followingbusiness segments have been reported.
• Retail Banking includes exposures which satisfy the four criteria of orientation, product,granularity and low value of individual exposures for retail exposures laid down in BaselCommittee on Banking Supervision document “International Convergence of CapitalMeasurement and Capital Standards: A Revised Framework”.
• Wholesale Banking includes all advances to trusts, partnership firms, companies and statutorybodies, which are not included under the Retail Banking.
• Treasury includes the entire investment portfolio of the Bank.
• Other Banking includes hire purchase and leasing operations and other items not attributable to anyparticular business segment.
Income, expenses, assets and liabilities are either specifically identified with individual segments or areallocated to segments on a systematic basis.
All liabilities are transfer priced to a central treasury unit, which pools all funds and lends to the businessunits at appropriate rates based on the relevant maturity of assets being funded after adjusting for regulatoryreserve requirements.
The business segment results on this basis are given below:
For the year ended March 31, 2009
Particulars Retail Banking
Wholesale
Banking
Treasury/
Investment
Banking
Other Banking
Business Total
(Rupees in million)
1 Revenue.................................... 230,152.1 248,077.1 295,908.7 6,125.7 780,263.62 Less: Inter-segment revenue..... 393,300.93 Total revenue (1) - (2) ............. 386,962.74 Segment results ........................ 580.5 34,133.1 12,843.5 3,612.6 51,169.75 Unallocated expenses ............... —6 Income tax expenses
(net of deferred tax credit)....... 13,588.47 Net Profit (4) - (5) - (6)........... 37,581.38 Segment assets ......................... 958,656.7 1,357,062.5 1,400,638.6 11,887.0 3,728,244.89 Unallocated assets1................... 64,764.810 Total assets (8) + (9)................ 3,793,009.611 Segment liabilities .................. 1,117,555.2 1,111,564.6 1,529,581.82 6,166.6 3,764,868.212 Unallocated liabilities............... 28,141.413 Total liabilities (11) + (12) ...... 3,793,009.614 Capital expenditure .................. 4,224.2 1,264.2 3.3 36.9 5,528.615 Depreciation ............................. 3,628.6 1,027.3 4.7 2,125.4 6,786.0
1. Includes tax paid in advance/tax deducted at source (net) and deferred tax asset (net).
2. Includes share capital and reserves and surplus.
F-122

For the year ended March 31, 2008
Particulars Retail BankingWholesaleBanking
Treasury/Investment
BankingOther Banking
Business Total
(Rupees in million)1 Revenue.................................... 244,185.4 249,493.5 290,982.6 2,749.2 787,410.72 Less: Inter-segment revenue..... 391,419.63 Total revenue (1) - (2) ............. 395,991.14 Segment results ........................ 9,472.4 35,746.8 5,134.9 206.9 50,561.05 Unallocated expenses ............... —6 Income tax expenses
(net of deferred tax credit)....... 8,983.77 Net Profit (4) - (5) - (6)........... 41,577.38 Segment assets ......................... 1,112,510.1 1,263,992.0 1,540,852.6 27,053.4 3,944,408.19 Unallocated assets1................... 53,542.710 Total assets (8) + (9)................ 3,997,950.811 Segment liabilities .................. 1,152,965.5 1,378,224.6 1,442,104.82 20,360.4 3,993,655.312 Unallocated liabilities............... 4,295.513 Total liabilities (11) + (12) ...... 3,997,950.814 Capital expenditure .................. 6,430.8 1,364.6 8.5 504.5 8,308.415 Depreciation ............................. 2,836.8 889.1 5.3 2,052.3 5,783.5
1. Includes tax paid in advance/tax deducted at source (net) and deferred tax asset (net).
2. Includes share capital and reserves and surplus.
Geographical segments
The Bank reports its operations under the following geographical segments.
• Domestic operations comprises branches having operations in India.
• Foreign operations comprises branches having operations outside India and offshore banking unithaving operations in India.
Geographical segment results are given below:
Revenue1
For the
year ended
March 31, 2009
For the
year ended
March 31, 2008
(Rupees in million)
Domestic operation........................................................................................... 347,986.2 362,828.2Foreign operation.............................................................................................. 38,976.6 33,162.9
Total .................................................................................................................. 386,962.8 395,991.1
1. Gains and losses on offsetting transactions are accounted for separately in domestic and foreign segmentsrespectively and not netted off.
AssetsAs on
March 31, 2009As on
March 31, 2008
(Rupees in million)
Domestic operation........................................................................................... 3,004,203.2 3,329,664.8Foreign operation.............................................................................................. 733,259.4 614,743.3
Total .................................................................................................................. 3,737,462.6 3,944,408.1
F-123
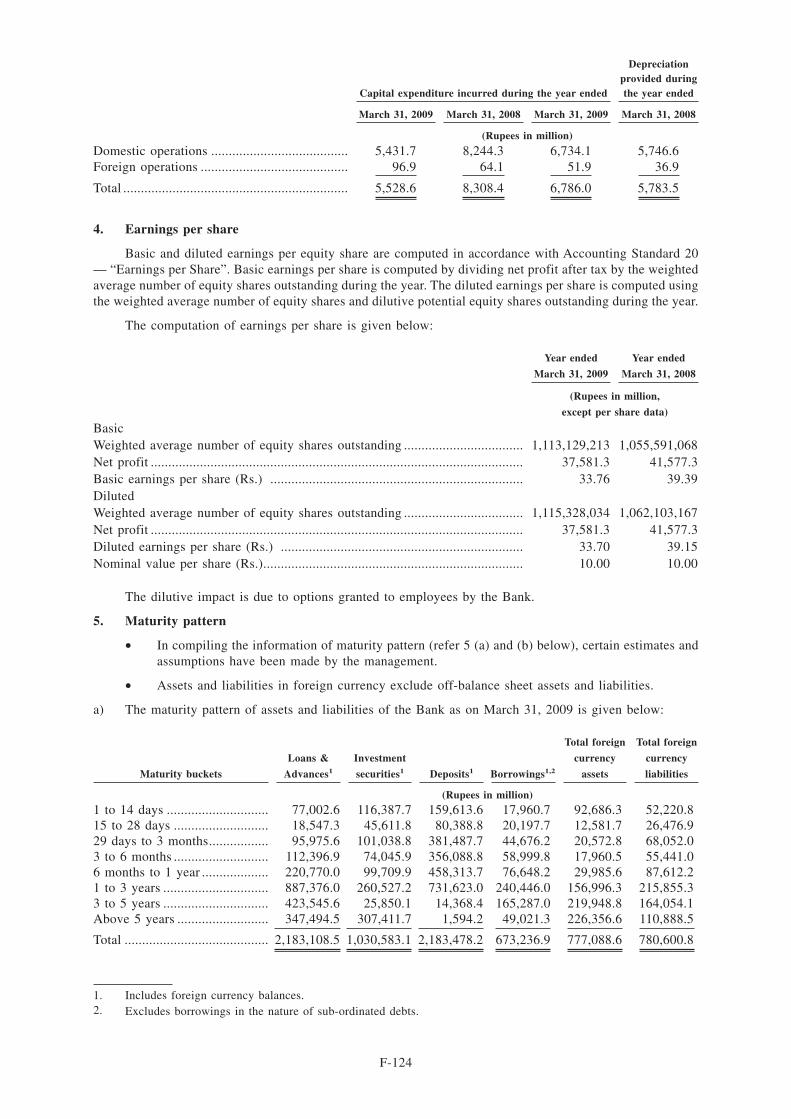
Capital expenditure incurred during the year ended
Depreciationprovided duringthe year ended
March 31, 2009 March 31, 2008 March 31, 2009 March 31, 2008
(Rupees in million)
Domestic operations ....................................... 5,431.7 8,244.3 6,734.1 5,746.6Foreign operations .......................................... 96.9 64.1 51.9 36.9
Total ................................................................ 5,528.6 8,308.4 6,786.0 5,783.5
4. Earnings per share
Basic and diluted earnings per equity share are computed in accordance with Accounting Standard 20— “Earnings per Share”. Basic earnings per share is computed by dividing net profit after tax by the weightedaverage number of equity shares outstanding during the year. The diluted earnings per share is computed usingthe weighted average number of equity shares and dilutive potential equity shares outstanding during the year.
The computation of earnings per share is given below:
Year ended
March 31, 2009
Year ended
March 31, 2008
(Rupees in million,
except per share data)
BasicWeighted average number of equity shares outstanding .................................. 1,113,129,213 1,055,591,068Net profit .......................................................................................................... 37,581.3 41,577.3Basic earnings per share (Rs.) ........................................................................ 33.76 39.39DilutedWeighted average number of equity shares outstanding .................................. 1,115,328,034 1,062,103,167Net profit .......................................................................................................... 37,581.3 41,577.3Diluted earnings per share (Rs.) ..................................................................... 33.70 39.15Nominal value per share (Rs.).......................................................................... 10.00 10.00
The dilutive impact is due to options granted to employees by the Bank.
5. Maturity pattern
• In compiling the information of maturity pattern (refer 5 (a) and (b) below), certain estimates andassumptions have been made by the management.
• Assets and liabilities in foreign currency exclude off-balance sheet assets and liabilities.
a) The maturity pattern of assets and liabilities of the Bank as on March 31, 2009 is given below:
Maturity buckets
Loans &
Advances1
Investment
securities1 Deposits1 Borrowings1,2
Total foreign
currency
assets
Total foreign
currency
liabilities
(Rupees in million)
1 to 14 days ............................. 77,002.6 116,387.7 159,613.6 17,960.7 92,686.3 52,220.815 to 28 days ........................... 18,547.3 45,611.8 80,388.8 20,197.7 12,581.7 26,476.929 days to 3 months................. 95,975.6 101,038.8 381,487.7 44,676.2 20,572.8 68,052.03 to 6 months ........................... 112,396.9 74,045.9 356,088.8 58,999.8 17,960.5 55,441.06 months to 1 year ................... 220,770.0 99,709.9 458,313.7 76,648.2 29,985.6 87,612.21 to 3 years .............................. 887,376.0 260,527.2 731,623.0 240,446.0 156,996.3 215,855.33 to 5 years .............................. 423,545.6 25,850.1 14,368.4 165,287.0 219,948.8 164,054.1Above 5 years .......................... 347,494.5 307,411.7 1,594.2 49,021.3 226,356.6 110,888.5
Total ......................................... 2,183,108.5 1,030,583.1 2,183,478.2 673,236.9 777,088.6 780,600.8
1. Includes foreign currency balances.2. Excludes borrowings in the nature of sub-ordinated debts.
F-124

b) The maturity pattern of assets and liabilities of the Bank as on March 31, 2008 is given below:
Maturity buckets
Loans &
Advances1
Investment
securities1 Deposits1 Borrowings1,2
Total foreign
currency
assets
Total foreign
currency
liabilities
(Rupees in million)
1 to 14 days ............................. 93,299.9 144,138.8 150,415.1 18,949.7 67,356.4 49,954.815 to 28 days ........................... 27,857.4 102,926.6 105,105.3 5,407.0 11,229.6 12,310.029 days to 3 months................. 155,107.3 110,681.3 377,315.6 37,476.4 64,606.8 60,017.73 to 6 months ........................... 156,415.2 106,274.8 353,452.6 98,782.1 31,405.6 82,855.86 months to 1 year ................... 260,207.4 171,675.0 596,599.9 112,847.4 61,401.7 121,563.81 to 3 years .............................. 773,243.4 208,115.1 812,119.4 176,727.5 66,300.5 143,269.23 to 5 years .............................. 331,808.1 46,577.8 34,047.3 176,974.8 125,974.1 170,063.8Above 5 years .......................... 458,222.1 224,154.0 15,255.3 29,319.4 229,717.0 74,283.0
Total ......................................... 2,256,160.8 1,114,543.4 2,444,310.5 656,484.3 657,991.7 714,318.1
1. Includes foreign currency balances.
2. Excludes borrowings in the nature of sub-ordinated debts.
6. Related party transactions
The Bank has transactions with its related parties comprising of subsidiaries, associates/jointventures/other related entities and key management personnel.
Subsidiaries
ICICI Venture Funds Management Company Limited, ICICI Securities Primary Dealership Limited,ICICI Securities Limited, ICICI International Limited, ICICI Trusteeship Services Limited, ICICI HomeFinance Company Limited, ICICI Investment Management Company Limited, ICICI Securities Holdings Inc.,ICICI Securities Inc., ICICI Bank UK PLC, ICICI Bank Canada, ICICI Prudential Life Insurance CompanyLimited1, ICICI Lombard General Insurance Company Limited1, ICICI Prudential Asset ManagementCompany Limited1, ICICI Prudential Trust Limited1, ICICI Bank Eurasia Limited Liability Company andICICI Wealth Management Inc.
1. Jointly controlled entities.
Associates/Joint Ventures/other related entities
ICICI Equity Fund1, ICICI Eco-net Internet and Technology Fund1, ICICI Emerging Sectors Fund1,ICICI Strategic Investments Fund1, ICICI Kinfra Limited1,, ICICI West Bengal Infrastructure DevelopmentCorporation Limited1,, Financial Information Network and Operations Limited, TCW/ICICI InvestmentPartners LLC, TSI Ventures (India) Private Limited (upto June 30, 2008), I-Process Services (India) PrivateLimited, I-Solutions Providers (India) Private Limited, NIIT Institute of Finance, Banking and InsuranceTraining Limited, ICICI Venture Value Fund, Comm Trade Services Limited, Loyalty Solutions & ResearchLimited1, Traveljini.com Limited (upto March 31, 2008), Contests2win.com India Private Limited2,Crossdomain Solutions Private Limited2, Transafe Services Limited2, Prize Petroleum Company Limited2,ICICI Foundation for Inclusive Growth2, Firstsource Solutions Limited (Bank’s holding is 24.79% as onMarch 21, 2009) and I-Ven Biotech Limited1, 2.
1. Entities consolidated under Accounting Standard-21 (AS-21) on “Consolidated Financial Statements”.
2. With respect to entities, which have been identified as related parties during the year ended March 31, 2009,previous year’s comparative figures have not been reported.
Key management personnel
K. V. Kamath, Chanda D. Kochhar, V. Vaidyanathan, Madhabi Puri Buch1, Sonjoy Chatterjee2, K.Ramkumar3, Kalpana Morparia4, Nachiket Mor5.
F-125

Relatives of key management personnel
Rajalakshmi Kamath, Ajay Kamath, Ajnya Pai, Mohan Kamath, Deepak Kochhar, Arjun Kochhar, AartiKochhar, Mahesh Advani, Varuna Karna, Sunita R. Advani, Jeyashree V., V. Satyamurthy, V. Krishnamurthy,K. Vembu, Dhaval Buch1, Kamal Puri1, Rama Puri1, Ameeta Chatterjee2, Somnath Chatterjee2, Tarak NathChatterjee2, R. Shyam3, R. Suchithra3, J. Krishnaswamy3.
1. Transactions reported with effect from June 1, 2007 and upto January 31, 2009.2. Transactions reported with effect from October 22, 20073. Transactions reported with effect from February 1, 2009.4. Transactions reported upto May 31, 20075. Transactions reported upto October 18, 2007
The following are the significant transactions between the Bank and its related parties for the year endedMarch 31, 2009. The material transactions are reported wherever the transaction with an entity exceeds 10%of the particular category of transactions.
Insurance services
During the year ended March 31, 2009, the Bank paid insurance premium to insurance subsidiariesamounting to Rs. 1,132.6 million (March 31, 2008: Rs. 1,065.3 million). The material transactions for the yearended March 31, 2009 were with ICICI Lombard General Insurance Company Limited for Rs. 1,039.9 million(March 31, 2008: Rs. 974.8 million).
During the year ended March 31, 2009, the Bank received claims from insurance subsidiaries amountingto Rs. 965.1 million (March 31, 2008: Rs. 713.9 million). The material transactions for the year ended March31, 2009 were with ICICI Lombard General Insurance Company Limited for Rs. 924.1 million (March 31,2008: Rs. 688.9 million).
Fees and commission
During the year ended March 31, 2009, the Bank received fees from its subsidiaries amounting to Rs.3,704.8 million (March 31, 2008: Rs. 5,748.7 million), from its associates/joint ventures/other related entitiesamounting to Rs. 142.1 million (March 31, 2008: Rs. 72.5 million) and from key management personnelamounting to Rs. 0.6 million. The material transactions for the year ended March 31, 2009 were with ICICISecurities Limited for Rs. 454.8 million (March 31, 2008: Rs. 903.7 million), ICICI Prudential Life InsuranceCompany Limited for Rs. 2,385.3 million (March 31, 2008: Rs. 3,033.1 million) and ICICI Lombard GeneralInsurance Company Limited for Rs. 625.6 million (March 31, 2008: Rs. 948.2 million).
During the year ended March 31, 2009, the Bank received commission from its subsidiaries of Rs. 9.0million (March 31, 2008: Rs. 9.3 million) and from its associates/joint ventures/other related entitiesamounting to Rs. 7.5 million (March 31, 2008: Rs. 7.4 million). The material transactions for the year endedMarch 31, 2009 were with ICICI Home Finance Company Limited for Rs. 7.8 million (March 31, 2008: Rs.7.8 million) and Firstsource Solutions Limited for Rs. 7.2 million (March 31, 2008: Rs. 7.4 million).
Lease of premises and facilities
During the year ended March 31, 2009, the Bank received income from its subsidiaries amounting to Rs.1,670.5 million (March 31, 2008: Rs. 982.8 million) and from its associates/joint ventures/other related entitiesamounting to Rs. 7.0 million (March 31, 2008: Rs. 3.9 million) for lease of premises, facilities and otheradministrative costs. The material transactions for the year ended March 31, 2009 were with ICICI SecuritiesLimited for Rs. 361.5 million (March 31, 2008: Rs. 266.9 million), ICICI Home Finance Company Limitedfor Rs. 344.2 million (March 31, 2008: Rs. 3.1 million), ICICI Bank UK PLC for Rs. 431.6 million (March31, 2008: Rs. 254.9 million), ICICI Bank Canada for Rs. 137.1 million (March 31, 2008: Rs. 102.6 million),ICICI Prudential Life Insurance Company Limited for Rs. 164.0 million (March 31, 2008: Rs. 102.5 million)and ICICI Lombard General Insurance Company Limited for Rs. 202.4 million (March 31, 2008: Rs. 186.8million).
Sale of housing loan portfolio
During the year ended March 31, 2009, the Bank sold housing loan portfolio to ICICI Home FinanceCompany Limited amounting to Rs. Nil (March 31, 2008: Rs. 6,231.4 million).
F-126

Secondment of employees
During the year ended March 31, 2009, the Bank received compensation from its subsidiaries amountingto Rs. 277.1 million (March 31, 2008: Rs. 302.8 million) and from its associates/joint ventures/other relatedentities amounting to Rs. 16.8 million (March 31, 2008: Rs. 12.7 million) for secondment of employees. Thematerial transactions for the year ended March 31, 2009 were with ICICI Securities Limited for Rs. 53.4million (March 31, 2008: Rs. 91.5 million) and ICICI Home Finance Company Limited for Rs. 217.2 million(March 31, 2008: Rs. 190.5 million).
Purchase of investments
During the year ended March 31, 2009, the Bank purchased certain investments from its subsidiariesamounting to Rs. 15,170.3 million (March 31, 2008: Rs. 7,934.2 million). The material transactions for theyear ended March 31, 2009 were with ICICI Securities Primary Dealership Limited for Rs. 6,695.0 million(March 31, 2008: Rs. 7,636.3 million) and ICICI Prudential Life Insurance Company Limited for Rs. 7,922.9million (March 31, 2008: Rs. 146.2 million).
During the year ended March 31, 2009, the Bank invested in the equity shares, preference shares andbonds of its subsidiaries amounting to Rs. 41,755.0 million (March 31, 2008: Rs. 43,009.2 million) and in itsassociates/joint ventures/other related entities amounting to Rs. Nil (March 31, 2008: Rs. 57.5 million). Thematerial transactions for the year ended March 31, 2009 were with ICICI Home Finance Company Limitedfor Rs. 3,000.0 million (March 31, 2008: Rs. 5,000.0 million), ICICI Bank UK PLC for Rs. 4,696.5 million(March 31, 2008: Rs. 12,404.9 million), ICICI Bank Canada for Rs. 22,188.3 million (March 31, 2008: Rs.10,414.9 million) and ICICI Prudential Life Insurance Company Limited for Rs. 8,081.6 million (March 31,2008: Rs. 12,580.0 million).
Sale of investments
During the year ended March 31, 2009, the Bank sold certain investments to its subsidiaries amountingto Rs. 13,854.6 million (March 31, 2008: Rs. 15,526.7 million). The material transactions for the year endedMarch 31, 2009 were with ICICI Securities Primary Dealership Limited for Rs. 5,103.5 million (March 31,2008: Rs. 11,705.0 million), ICICI Bank UK PLC for Rs. 1,836.0 million (March 31, 2008: Rs. Nil) and ICICIPrudential Life Insurance Company Limited for Rs. 6,364.8 million (March 31, 2008: Rs. 3,223.2 million).
Redemption/buyback and conversion of investments
During the year ended March 31, 2009, the Bank received Rs. 583.5 million (March 31, 2008: Rs. 1.2million) on account of buyback of equity shares by subsidiaries and Rs. 183.5 million (March 31, 2008: Rs.2,762.4 million) on account of buyback/redemption of equity shares/units by associates/joint ventures/otherrelated entities. The material transactions for the year ended March 31, 2009 were with ICICI SecuritiesPrimary Dealership Limited for Rs. 583.5 million (March 31, 2008: Rs. 1.2 million), ICICI Equity Fund forRs. 125.0 million (March 31, 2008: Rs. 571.5 million), ICICI Emerging Sectors Fund for Rs. Nil (March 31,2008: Rs. 2,070.3 million) and Crossdomain Solutions Private Limited for Rs. 58.5 million.
Reimbursement of expenses
During the year ended March 31, 2009, the Bank reimbursed expenses to ICICI Home Finance CompanyLimited amounting to Rs. 60.8 million (March 31, 2008: Rs. 526.8 million) and to its associates/jointventures/other related entities amounting to Rs. Nil (March 31, 2008: Rs. 0.8 million).
Brokerage and fee expenses
During the year ended March 31, 2009, the Bank paid brokerage/fees to its subsidiaries amounting to Rs.627.0 million (March 31, 2008: Rs. 950.7 million) and to its associates/joint ventures/other related entitiesamounting to Rs. 2,151.2 million (March 31, 2008: Rs. 2,354.7 million). The material transactions for the yearended March 31, 2009 were with ICICI Home Finance Company Limited for Rs. 438.7 million (March 31,2008: Rs. 621.3 million), Loyalty Solutions & Research Limited for Rs. 673.6 million (March 31, 2008: Rs.23.3 million), I-Process Services (India) Private Limited for Rs. 1,027.5 million (March 31, 2008: Rs. 1,029.0million) and I-Solutions Providers (India) Private Limited for Rs. 227.2 million (March 31, 2008: Rs. 932.1million).
F-127
Custodial charges income
During the year ended March 31, 2009, the Bank received custodial charges from its subsidiariesamounting to Rs. 11.4 million (March 31, 2008: Rs. 16.3 million) and from its associates/joint ventures/otherrelated entities amounting to Rs. 3.3 million (March 31, 2008: Rs. 6.8 million). The material transactions forthe year ended March 31, 2009 were with ICICI Securities Primary Dealership Limited for Rs. 7.6 million(March 31, 2008: Rs. 12.1 million), ICICI Lombard General Insurance Company Limited for Rs. 3.8 million(March 31, 2008: Rs. 4.0 million) and ICICI Emerging Sectors Fund for Rs. 1.0 million (March 31, 2008: Rs.3.1 million).
Interest expenses
During the year ended March 31, 2009, the Bank paid interest to its subsidiaries amounting to Rs.1,592.6 million (March 31, 2008: Rs. 3,311.9 million) to its associates/joint ventures/other related entitiesamounting to Rs. 21.8 million (March 31, 2008: Rs. 28.2 million) to its key management personnel amountingto Rs. 2.3 million and to relatives of key management personnel amounting to Rs. 1.3 million. The materialtransactions for the year ended March 31, 2009 were with ICICI Securities Limited for Rs. 171.4 million(March 31, 2008: Rs. 72.1 million), ICICI Bank UK PLC for Rs. 98.9 million (March 31, 2008: Rs. 1,804.5million), ICICI Bank Canada for Rs. 660.1 million (March 31, 2008: Rs. 834.2 million) and ICICI PrudentialLife Insurance Company Limited for Rs. 427.7 million (March 31, 2008: Rs. 348.6 million).
Interest income
During the year ended March 31, 2009, the Bank received interest from its subsidiaries amounting to Rs.9,006.7 million (March 31, 2008: Rs. 1,575.3 million), from its associates/joint ventures/other related entitiesamounting to Rs. 5.3 million (March 31, 2008: Rs. 21.0 million), from its key management personnel Rs. 2.3million (March 31, 2008: Rs. 0.7 million) and from relatives of key management personnel amounting to Rs.0.3 million. The material transactions for the year ended March 31, 2009 were with ICICI Securities PrimaryDealership Limited for Rs. 1,544.8 million (March 31, 2008: Rs. 342.8 million), ICICI Home FinanceCompany Limited for Rs. 522.8 million (March 31, 2008: Rs. 273.0 million), ICICI Bank Eurasia LimitedLiability Company for Rs. 547.1 million (March 31, 2008: Rs. 611.9 million), ICICI Bank UK PLC for Rs.1,443.8 million (March 31, 2008: Rs. 105.3 million) and ICICI Bank Canada for Rs. 4,834.7 million (March31, 2008: Rs. 86.2 million).
Other income
During the year ended March 31, 2009, the net gain/(loss) on derivative transactions entered into withsubsidiaries amounted to Rs. 9,239.3 million (March 31, 2008: net gain of Rs. 4,398.0 million) and with itsassociates/joint ventures/other related entities amounted to Rs. 9.9 million (March 31, 2008: Rs. Nil). Thematerial transactions for the year ended March 31, 2009 were with ICICI Bank UK PLC for Rs. 1,175.3million (March 31, 2008: Rs. 4,677.0 million) and ICICI Bank Canada for Rs. 7,861.4 million (March 31,2008: Rs. 401.5 million).
Dividend income
During the year ended March 31, 2009, the Bank received dividend from its subsidiaries amounting toRs. 3,348.2 million (March 31, 2008: Rs. 3,636.6 million) and from its associates/joint ventures/other relatedentities amounting to Rs. Nil (March 31, 2008: Rs. 8,931.4 million). The material transactions for the yearended March 31, 2009 were with ICICI Securities Primary Dealership Limited for Rs. 1,300.5 million (March31, 2008: Rs. 729.5 million), ICICI Venture Funds Management Company Limited for Rs. 950.0 million(March 31, 2008: Rs. 725.0 million), ICICI Home Finance Company Limited for Rs. 740.6 million (March 31,2008: Rs. 431.3 million) and ICICI Emerging Sectors Fund for Rs. Nil (March 31, 2008: Rs. 7,725.7 million).
Dividend paid
During the year ended March 31, 2009, the Bank paid dividend to its key management personnelamounting to Rs. 10.2 million (March 31, 2008: Rs. 15.0 million). The material transactions for the year endedMarch 31, 2009 were with K. V. Kamath for Rs. 5.4 million (March 31, 2008: Rs. 6.2 million), Chanda D.Kochhar for Rs. 3.0 million (March 31, 2008: Rs. 2.8 million), Madhabi Puri Buch for Rs. 1.1 million (March31, 2008: Rs. 1.2 million) and Kalpana Morparia for Rs. Nil (March 31, 2008: Rs. 4.3 million).
F-128

Remuneration to whole-time directors
During the year ended March 31, 2009, the Bank paid remuneration to the whole-time directors of theBank amounting to Rs. 91.7 million (March 31, 2008: Rs. 90.3 million). The material transactions for the yearended March 31, 2009 were with K. V. Kamath for Rs. 30.8 million (March 31, 2008: Rs. 27.9 million),Madhabi Puri Buch for Rs. 13.5 million (March 31, 2008: Rs. 10.0 million), Chanda D. Kochhar for Rs. 18.4million (March 31, 2008: Rs. 15.6 million), Kalpana Morparia for Rs. Nil (March 31, 2008 : Rs. 9.7 million),Nachiket Mor for Rs. Nil (March 31, 2008: Rs. 10.0 million), V. Vaidyanathan for Rs. 14.4 million (March 31,2008: Rs. 13.4 million) and Sonjoy Chatterjee for Rs. 13.0 million (March 31, 2008: Rs. 3.7 million).
Lines of credit
As on March 31, 2009, the Bank had issued lines of credit to its subsidiaries amounting to Rs. 1,601.5million (March 31, 2008: Rs. 1,003.0 million). The material transactions for the year ended March 31, 2009were with ICICI Securities Limited for Rs. 333.5 million (March 31, 2008: Rs. Nil) and ICICI Bank Canadafor Rs. 1,268.0 million (March 31, 2008: Rs. 1,003.0 million).
Sale of fixed assets
During the year ended March 31, 2009, the Bank sold fixed assets to its subsidiaries amounting to Rs.65.3 million (March 31, 2008: Rs. 151.8 million). The material transactions for the year ended March 31, 2009were with ICICI Home Finance Company Limited for Rs. 58.3 million (March 31, 2008: Rs. Nil), ICICISecurities Limited for Rs. 5.9 million (March 31, 2008: Rs. 99.3 million), ICICI Prudential Life InsuranceCompany Limited for Rs. 1.1 million (March 31, 2008: Rs. 24.2 million) and ICICI Lombard GeneralInsurance Company Limited for Rs. Nil (March 31, 2008: Rs. 28.3 million).
Purchase of fixed assets
During the year ended March 31, 2009, the Bank purchased fixed assets from its subsidiaries amountingto Rs. 1.2 million (March 31, 2008: Rs. Nil) and from its associates/joint ventures/other related entitiesamounting to Rs. 13.0 million (March 31, 2008: Rs. Nil). The material transactions for the year ended March31, 2009 were with Financial Information Network and Operations Limited for Rs. 12.4 million (March 31,2008: Rs. Nil).
Donation
During the year ended March 31, 2009, the Bank has given donation to ICICI Foundation for InclusiveGrowth amounting to Rs. 300.0 million.
Letters of Comfort
The Bank has issued letters of comfort on behalf of its foreign subsidiaries namely, ICICI Bank UK PLCand ICICI Bank Canada. The details of the same are given under:
On behalf of To Purpose
ICICI Bank UK PLC ............... Financial Services Authority, UK(“FSA”)
To financially support ICICI Bank UKPLC to ensure that it meets all of itsfinancial obligations as they fall due
ICICI Bank Canada.................. Office of the Superintendent ofFinancial Institutions, Canada(“OSFI”)
To infuse additional capital shouldICICI Bank Canada’s capital fall belowthe minimum requirement and provideICICI Bank Canada ongoing financial,managerial and operational support
ICICI Bank Canada.................. Canada Deposit InsuranceCorporation (“CDIC”)
To comply with the Bank Act and theCDIC regulations or by-laws thereunder and to indemnify CDIC againstall losses, damages, reasonable costsand expenses arising from failure ofICICI Bank Canada in performing thesame
F-129
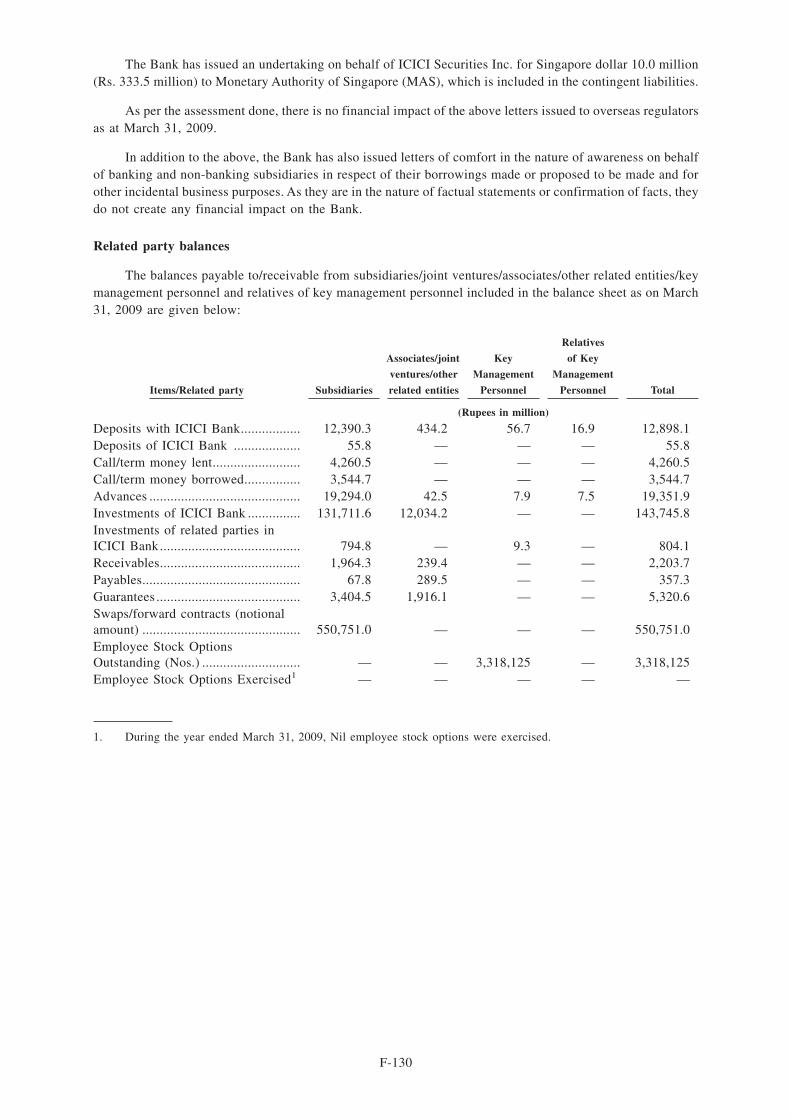
The Bank has issued an undertaking on behalf of ICICI Securities Inc. for Singapore dollar 10.0 million(Rs. 333.5 million) to Monetary Authority of Singapore (MAS), which is included in the contingent liabilities.
As per the assessment done, there is no financial impact of the above letters issued to overseas regulatorsas at March 31, 2009.
In addition to the above, the Bank has also issued letters of comfort in the nature of awareness on behalfof banking and non-banking subsidiaries in respect of their borrowings made or proposed to be made and forother incidental business purposes. As they are in the nature of factual statements or confirmation of facts, theydo not create any financial impact on the Bank.
Related party balances
The balances payable to/receivable from subsidiaries/joint ventures/associates/other related entities/keymanagement personnel and relatives of key management personnel included in the balance sheet as on March31, 2009 are given below:
Items/Related party Subsidiaries
Associates/joint
ventures/other
related entities
Key
Management
Personnel
Relatives
of Key
Management
Personnel Total
(Rupees in million)
Deposits with ICICI Bank................. 12,390.3 434.2 56.7 16.9 12,898.1Deposits of ICICI Bank ................... 55.8 — — — 55.8Call/term money lent......................... 4,260.5 — — — 4,260.5Call/term money borrowed................ 3,544.7 — — — 3,544.7Advances ........................................... 19,294.0 42.5 7.9 7.5 19,351.9Investments of ICICI Bank ............... 131,711.6 12,034.2 — — 143,745.8Investments of related parties inICICI Bank........................................ 794.8 — 9.3 — 804.1Receivables........................................ 1,964.3 239.4 — — 2,203.7Payables............................................. 67.8 289.5 — — 357.3Guarantees ......................................... 3,404.5 1,916.1 — — 5,320.6Swaps/forward contracts (notionalamount) ............................................. 550,751.0 — — — 550,751.0Employee Stock OptionsOutstanding (Nos.) ............................ — — 3,318,125 — 3,318,125Employee Stock Options Exercised1 — — — — —
1. During the year ended March 31, 2009, Nil employee stock options were exercised.
F-130

The maximum balance payable to/receivable from subsidiaries/joint ventures/associates/other relatedentities/key management personnel and relatives of key management personnel during the year ended March31, 2009 is given below:
Items/Related party Subsidiaries
Associates/joint
ventures/other
related entities
Key
Management
Personnel
Relatives of
Key
Management
Personnel Total
(Rupees in million)
Deposits with ICICI Bank................. 16,899.9 845.0 119.7 38.0 17,902.6Deposits of ICICI Bank ................... 1,589.9 — — — 1,589.9Call/term money lent......................... 10,922.1 — — — 10,922.1Call/term money borrowed................ 3,690.5 — — — 3,690.5Advances .......................................... 20,981.4 208.3 63.6 7.6 21,260.9Investments of ICICI Bank ............... 131,711.6 12,159.2 — — 143,870.8Investments of related parties inICICI Bank........................................ 2,043.01 — 9.3 — 2,052.3Receivables........................................ 3,649.0 464.01 — — 4,113.0Payables............................................. 1,382.61 289.51 — — 1,672.1Guarantees ......................................... 3,407.2 2,441.4 — — 5,848.6Swaps/forward contracts (notionalamount) ............................................. 647,121.7 880.4 — — 648,002.1
1. Maximum balances are determined based on comparison of the total outstanding balances as at each quarter endduring the financial year.
The balances payable to/receivable from subsidiaries/joint ventures/associates/other related entities/keymanagement personnel and relatives of key management personnel included in the balance sheet as on March31, 2008 are given below:
Items/Related party Subsidiaries
Associates/joint
ventures/other
related entities
Key
Management
Personnel
Relatives of
Key
Management
Personnel Total
(Rupees in million)
Deposits with ICICI Bank................. 11,476.0 268.9 27.1 14.1 11,786.1Deposits of ICICI Bank ................... (17.1) — — — (17.1)Call/term money lent......................... 15,917.8 — — — 15,917.8Call/term money borrowed................ 240.7 — — — 240.7Advances ........................................... 5,002.5 145.5 13.9 2.2 5,164.1Investments of ICICI Bank ............... 88,178.8 12,109.2 — — 100,288.0Investments of related parties inICICI Bank........................................ 2,250.5 — 8.6 0.5 2,259.6Receivables........................................ 3,351.7 52.5 — — 3,404.2Payables............................................. 436.4 350.1 — — 786.5Guarantees ......................................... 3,400.2 2,360.2 — — 5,760.4Swaps/forward contracts (notionalamount) ............................................. 508,047.8 — — — 508,047.8Employee Stock OptionsOutstanding (Nos.) ............................ — — 2,860,625 — 2,860,625Employee Stock Options Exercised1 — — 138.1 — 138.1
1. During the year ended March 31, 2008, 317,125 employee stock options were exercised.
F-131

The maximum balance payable to/receivable from subsidiaries/joint ventures/associates/other relatedentities/key management personnel and relatives of key management personnel during the year ended March31, 2008 is given below:
Items/Related party Subsidiaries
Associates/joint
ventures/other
related entities
Key
Management
Personnel
Relatives of
Key
Management
Personnel Total
(Rupees in million)
Deposits with ICICI Bank................. 50,517.8 5,603.3 71.4 22.5 56,215.0Deposits of ICICI Bank ................... 1,120.8 — — — 1,120.8Call/term money lent......................... 17,249.5 — — — 17,249.5Call/term money borrowed................ 2,865.0 — — — 2,865.0Advances .......................................... 11,496.4 1,021.3 28.7 2.2 12,548.6Investments of ICICI Bank ............... 88,178.8 18,895.0 — — 107,073.8Investments of related parties inICICI Bank........................................ 2,250.51 — 10.8 1.6 2,262.9Receivables........................................ 5,593.5 49.71 — — 5,643.2Payables............................................. 1,483.41 350.11 — — 1,833.5Guarantees ........................................ 3,450.2 2,360.2 — — 5,810.4Swaps/forward contracts (notionalamount) ............................................. 524,892.6 — — — 524,892.6
1. Maximum balances are determined based on comparison of the total outstanding balances as at each quarter endduring the financial year.
7. Securitisation
The Bank sells loans through securitisation and direct assignment. The information on securitisationactivity of the Bank as an originator for the year ended March 31, 2009 (including direct assignment) andMarch 31, 2008 is given in the table below:
Year ended
March 31, 2009
Year ended
March 31, 2008
(Rupees in million, except
number of loans securitised)
Total number of loan assets securitised............................................................ 7,053 1,149,931Total book value of loan assets securitised...................................................... 8,581.1 140,852.0Sale consideration received for the securitised assets...................................... 8,621.9 142,470.4Net gain/(loss) on account of securitisation1 ................................................... (3,211.5) 168.2
1. Includes loss booked upfront on sales during the year, gain/(loss) on deal closures, gain amortised during the year& expenses relating to utilisation of credit enhancement.
As onMarch 31, 2009
As onMarch 31, 2008
(Rupees in million)
Outstanding credit enhancement (funded) ........................................................ 13,086.1 15,601.2Outstanding liquidity facility............................................................................ 6,853.4 7,740.8Net outstanding servicing asset/(liability) ........................................................ 748.9 1,355.4Outstanding subordinate contributions ............................................................. 8,849.0 11,459.5
The outstanding credit enhancement in the form of guarantees amounted to Rs. 27,732.9 million as onMarch 31, 2009 (March 31, 2008: Rs. 29,155.6 million).
F-132

Outstanding credit enhancement in the form of guarantees for third party originated securitisationtransactions amounted to Rs. Nil as on March 31, 2009 (March 31, 2008: Rs. 805.0 million) and outstandingliquidity facility for third party originated securitisation transactions amounted to Rs. 4.0 million as on March31, 2009 (March 31, 2008: Rs. 8.6 million).
The details of provision created at the time of securitisation are given below:
Particulars Year ended March 31, 2009
(Rupees in million)
Opening balance ................................................................................................. 9,186.7Add: Additions during the year .......................................................................... 630.5Less: Deductions during the year ....................................................................... 4,250.0Closing balance................................................................................................... 5,567.2
8. Staff retirement benefits
Pension
Reconciliation of opening and closing balance of the present value of the defined benefit obligation forpension benefits is given below:
Particulars
Year ended
March 31, 2009
Year ended
March 31, 2008
(Rupees in million)Opening obligations.......................................................................................... 1,678.1 1,029.4Add: Addition due to amalgamation ................................................................ — 1,807.4Service cost ...................................................................................................... 62.5 54.0Interest cost ...................................................................................................... 146.6 230.7Actuarial (gain)/loss ......................................................................................... 484.8 (172.3)Liabilities extinguished on settlement .............................................................. (364.2) (1,071.0)Benefits paid..................................................................................................... (75.6) (200.1)Obligations at end of year ................................................................................ 1,932.2 1,678.1
Opening plan assets, at fair value .................................................................... 1,490.1 988.5Add: Addition due to amalgamation ................................................................ — 584.8Expected return on plan assets ......................................................................... 117.4 115.8Actuarial gain/(loss) ......................................................................................... 144.8 (118.0)Assets distributed on settlement ....................................................................... (395.8) (1,145.2)Contributions .................................................................................................... 864.4 1,264.3Benefits paid..................................................................................................... (75.6) (200.1)Closing plan assets, at fair value ..................................................................... 2,145.3 1,490.1
Fair value of plan assets at the end of the year............................................... 2,145.3 1,490.1Present value of the defined benefit obligations at the end of the year .......... 1,932.2 1,678.1Amount not recognised as an asset (limit in Para 59(b)) ................................ 51.2 —Asset/(liability) ................................................................................................ 161.9 (188.0)
Cost for the yearService cost ...................................................................................................... 62.5 54.0Interest cost ...................................................................................................... 146.6 230.7Expected return on plan assets ......................................................................... (117.4) (115.8)Actuarial (gain)/loss ......................................................................................... 340.0 (54.3)Curtailments & settlements (gain)/loss............................................................. 31.6 74.2Effect of the limit in para 59(b)....................................................................... 51.2 —Net cost............................................................................................................. 514.5 188.8
Investment details of plan assets
Majority of the plan assets are invested in Government securities and corporate bonds.
AssumptionsInterest rate ....................................................................................................... 6.85% 8.57%Salary escalation rate........................................................................................ 7.00% 7.00%Estimated rate of return on plan assets ............................................................ 8.00% 8.00%
F-133

Experience adjustment
Particulars
Year ended
March 31, 2009
Year ended
March 31, 2008
Year ended
March 31, 2007
(Rupees in million)Plan assets................................................................................ 2,145.3 1,490.1 988.5Defined benefit obligations ..................................................... 1,932.2 1,678.1 1,029.4Amount not recognised as an asset (limit in para 59(b))........ 51.2 — —Surplus/(deficit) ....................................................................... 161.9 (188.0) (40.9)Experience adjustment on plan assets ..................................... 144.8 (117.9) (110.1)Experience adjustment on plan liabilities................................ 6.6 (121.9) 32.8
Gratuity
Reconciliation of opening and closing balance of the present value of the defined benefit obligation forgratuity benefits is given below:
Particulars
Year ended
March 31, 2009
Year ended
March 31, 2008
(Rupees in million)Opening obligations.......................................................................................... 1,840.4 1,142.1Add: Adjustment for exchange fluctuation on opening obligations................. 6.4 —Add: Addition due to amalgamation/initial recognition of foreign branches... 0.9 506.6Service cost ...................................................................................................... 321.6 292.8Interest cost ...................................................................................................... 183.9 136.4Actuarial (gain)/loss ......................................................................................... 140.3 (62.0)Transitional obligation/(asset) .......................................................................... — (0.2)Liability assumed on acquisition/(settled on divestiture) ................................. (28.8) —Benefits paid..................................................................................................... (269.0) (175.3)Obligations at end of year ................................................................................ 2,195.7 1,840.4
Opening plan assets, at fair value .................................................................... 1,506.7 891.7Add: Addition due to amalgamation ................................................................ — 73.1Expected return on plan assets ......................................................................... 128.5 74.4Actuarial gain/(loss) ......................................................................................... (118.0) (24.8)Contributions .................................................................................................... 1,052.7 667.6Assets acquired on acquisition/(distributed on divestiture).............................. (28.8) —Benefits paid..................................................................................................... (269.0) (175.3)Closing plan assets, at fair value ..................................................................... 2,272.1 1,506.7
Fair value of plan assets at the end of the year............................................... 2,272.1 1,506.7Present value of the defined benefit obligations at the end of the year .......... 2,195.7 1,840.4Amount not recognised as an asset (limit in Para 59(b)) ................................ 7.9 —Asset/(liability) ................................................................................................ 68.5 (333.7)
Cost for the year .............................................................................................Service cost ...................................................................................................... 321.6 292.8Interest cost ...................................................................................................... 183.9 136.4Expected return on plan assets ......................................................................... (128.5) (74.4)Actuarial (gain)/loss ......................................................................................... 258.3 (37.2)Exchange fluctuation loss/(gain) ...................................................................... 6.4 —Transitional obligation/(asset) .......................................................................... — (0.2)Effect of the limit in para 59(b)....................................................................... 7.9 —Net cost............................................................................................................. 649.6 317.4
Investment details of plan assets
Majority of the plan assets are invested in insurer managed funds and special deposit schemes.
AssumptionsInterest rate ....................................................................................................... 6.85% 8.57%Salary escalation rate........................................................................................ 7.00% 7.00%Estimated rate of return on plan assets ............................................................ 8.00% 8.00%
F-134

Experience adjustment
Particulars
Year ended
March 31, 2009
Year ended
March 31, 2008
Year ended
March 31, 2007
(Rupees in million)
Plan assets................................................................................ 2,272.1 1,506.7 891.7Defined benefit obligations ..................................................... 2,195.7 1,840.4 1,142.1Amount not recognised as an asset (limit in para 59(b))........ 7.9 — —Surplus/(deficit) ....................................................................... 68.5 (333.7) (250.4)Experience adjustment on plan assets ..................................... (118.0) (24.8) (18.0)Experience adjustment on plan liabilities................................ (4.1) 14.0 38.1
The estimates of future salary increases, considered in actuarial valuation, take into considerationinflation, seniority, promotion and other relevant factors.
The guidance on implementing Accounting Standard 15, Employee Benefits (revised 2005) issued by theAccounting Standards Board (ASB) provides that exempt provident funds which require employers to meetthe interest shortfall are in effect defined benefit plans. The Bank’s actuary has informed that it is notpracticable to actuarially determine the interest shortfall obligation.
9. Employee Stock Option Scheme (“ESOS”)
In terms of the ESOS, as amended, the maximum number of options granted to any eligible employeein a financial year shall not exceed 0.05% of the issued equity shares of the Bank at the time of grant of theoptions and aggregate of all such options granted to the eligible employees shall not exceed 5% of theaggregate number of the issued equity shares of the Bank on the date(s) of the grant of options. Under the stockoption scheme, options vest in a graded manner over a four-year period, with 20%, 20%, 30% and 30% ofgrants vesting each year, commencing from the end of 12 months from the date of grant. The options can beexercised within 10 years from the date of grant or five years from the date of vesting, whichever is later.
In terms of the Scheme, 18,992,504 options (March 31, 2008: 15,638,152 options) granted to eligibleemployees were outstanding as at March 31, 2009.
As per the scheme, the exercise price of ICICI Bank’s options is the last closing price on the stockexchange, which recorded highest trading volume preceding the date of grant of options. Hence, there is nocompensation cost in the year ended March 31, 2009 based on intrinsic value of options. However, if ICICIBank had used the fair value of options based on the Black-Scholes model, compensation cost for the yearended March 31, 2009 would have been higher by Rs. 1,411.7 million and proforma profit after tax would havebeen Rs. 36,169.6 million. On a proforma basis, ICICI Bank’s basic and diluted earnings per share would havebeen Rs. 32.49 and Rs. 32.43 respectively. The key assumptions used to estimate the fair value of optionsgranted during the year ended March 31, 2009 are given below:
Risk-free interest rate........................................................................................................ 7.62% to 9.24%Expected life ..................................................................................................................... 2-6.4 yearsExpected volatility ............................................................................................................ 38.90% to 45.23%Expected dividend yield.................................................................................................... 1.20% to 3.57%
The weighted average fair value of options granted during the year ended March 31, 2009 is Rs. 331.19.
F-135

A summary of the status of the Bank’s stock option plan is given below:
Stock options outstanding
Year ended March 31, 2009 Year ended March 31, 2008
Particulars
Number of
options
Weighted
Average
Exercise Price
Number of
options
Weighted
Average
Exercise Price
(Rupees, except number of options)
Outstanding at the beginning of the year ....... 15,638,152 596.32 13,187,783 442.50Add: Granted during the year......................... 5,640,500 912.30 4,956,300 938.41Less: Lapsed during the year.......................... 1,723,001 737.40 1,037,218 582.51Less: Exercised during the year ..................... 563,147 336.96 1,468,713 379.34Outstanding at the end of the year ................. 18,992,504 685.05 15,638,152 596.32Options exercisable......................................... 7,188,420 496.10 3,272,292 411.89
Summary of stock options outstanding as on March 31, 2009 is given below:
Range of exercise price (Rupees per share)
Number of
shares arising
out of options
(Number of
shares)
Weighted
average exercise
price (Rupees)
Weighted
average
remaining
contractual life
(Number of
years)
105-299 .................................................................................... 136,682 150.53 2.79300-599 .................................................................................... 9,384,822 451.17 6.34600-999 .................................................................................... 9,403,000 923.15 8.611,000-1,399 .............................................................................. 68,000 1,114.57 8.65
Weighted average share price at the date of exercise of options as per National Stock Exchange pricevolume data was Rs. 723.55 for the year ended March 31, 2009. Weighted average share price as per NationalStock Exchange price volume data was Rs. 1,044.02 for the year ended March 31, 2008.
The Finance Act, 2007 introduced Fringe Benefit Tax (“FBT”) on employee stock options. The FBTliability crystallises on the date of exercise of stock options by employees and is computed based on thedifference between fair market value on date of vesting and the exercise price. As per the ESOS scheme, FBTof Rs 81.9 million (March 31, 2008: Rs. 226.7 million) has been recovered from the employees on 563,147(March 31, 2008: 1,468,713) stock options exercised during the year ended March 31, 2009.
10. Preference shares
Certain government securities amounting to Rs. 2,356.6 million (March 31, 2008: Rs. 2,331.8 million)have been earmarked against redemption of preference share capital, which falls due for redemption on April20, 2018, as per the original issue terms.
11. Subordinated debt
During the year ended March 31, 2009, the Bank raised subordinated debt qualifying for Tier II capitalamounting to Rs. 45,210.0 million. The details of these bonds are given below:
Particulars Date of Issue Coupon Rate (%) Tenure Amount
(Rupees in million)
Upper Tier II (Tranche 3). June 20, 2008 10.00% (annually)1 15 years 7,500.0Upper Tier II..................... September 22, 2008 11.25% (annually)1 15 years 10,000.0Upper Tier II..................... November 11, 2008 12.00% (annually)2 15 years 15,000.0Upper Tier II..................... March 26, 2009 9.95% (annually)3 15 years 12,710.0Total Upper Tier II ........... 45,210.0
1. 50 basis points over and above the coupon rate payable annually for the balance years after October 31, 2018, if thecall option is not exercised by the Bank, call option exercisable on October 31, 2018 with RBI approval.
F-136

2. 50 basis points over and above the coupon rate payable annually for the balance years after November 30, 2018,if the call option is not exercised by the Bank, call option exercisable on November 30, 2018 with RBI approval.
3. 50 basis points over and above the coupon rate payable annually for the balance years after March 26, 2019, if thecall option is not exercised by the Bank, call option exercisable on March 26, 2019 with RBI approval.
During the year ended March 31, 2008, the Bank raised subordinated debt qualifying for Tier I/Tier IIcapital amounting to Rs. 22,350.0 million. The details of these bonds are given below:
Particulars Date of Issue Coupon Rate (%) Tenure Amount
(Rupees in million)
Tier I (Tranche 1Option I)................... January 10, 2008 10.15% (annually)1 Perpetual2 5,000.0
Total Tier I (1) ............. 5,000.0Upper Tier II (Tranche
1 Option II) .............. January 10, 2008 9.70% (annually)1 15 years3 5,000.0Total Upper Tier II (2) . 5,000.0Tier II (Tranche 2
Option I)................... January 21, 2008 9.15% (annually) 5 years and 3 months 1,230.0Tier II (Tranche 2
Option II) ................. January 21, 2008 9.25% (annually) 10 years 1,120.0Tier II (Option A-I)...... November 10, 2007 9.80% (annually) 5 years and 3 months 6,098.7Tier II (Option A-II) .... November 10, 2007 9.39% (monthly) 5 years and 3 months 74.8Tier II (Option B-I)...... November 10, 2007 10.00% (annually) 10 years 3,718.0Tier II (Option B-II) .... November 10, 2007 9.57% (monthly) 10 years 108.5Total Tier II (3) ............ 12,350.0Total (1+2+3) ............... 22,350.0
1. 50 basis points over and above the coupon rate payable annually for the balance years after April 30, 2018, if thecall option is not exercised by the bank.
2. These bonds have been issued with a call option exercisable after 10 years from the date of issue i.e. April 30, 2018,and on every interest payment date thereafter with RBI approval.
3. These bonds have been issued with a call option exercisable after 10 years i.e. April 30, 2018, with RBI approval.
F-137
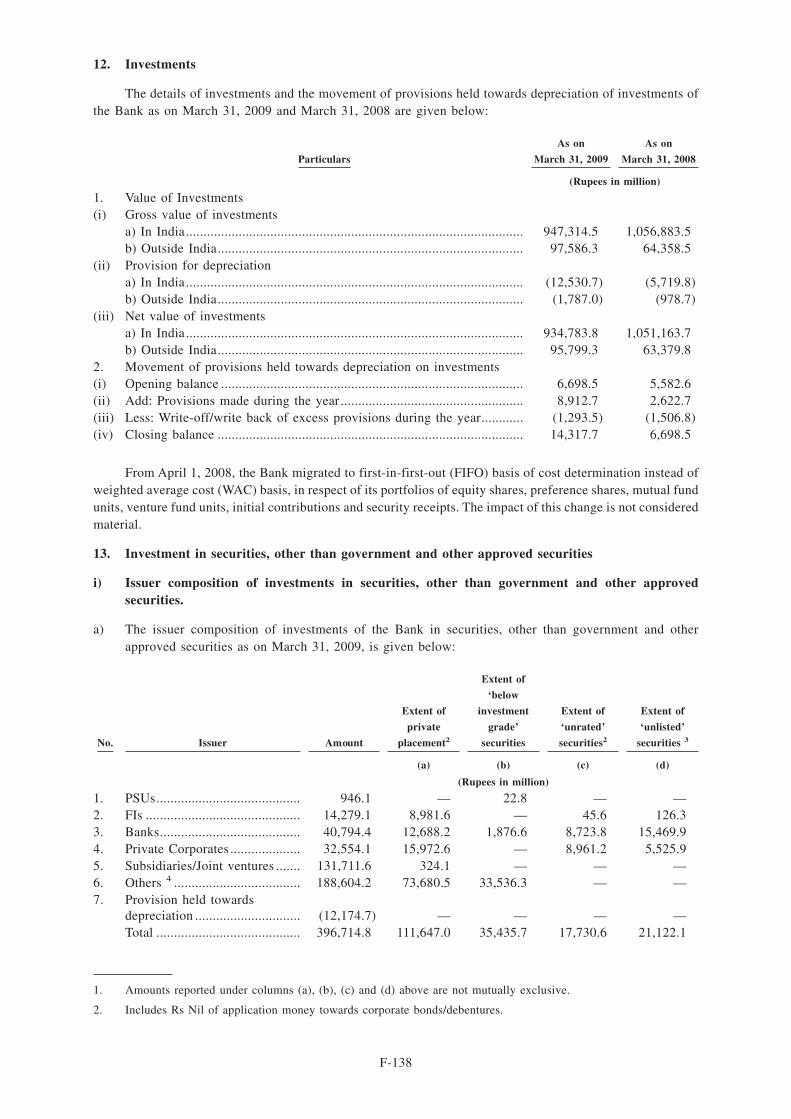
12. Investments
The details of investments and the movement of provisions held towards depreciation of investments ofthe Bank as on March 31, 2009 and March 31, 2008 are given below:
Particulars
As on
March 31, 2009
As on
March 31, 2008
(Rupees in million)
1. Value of Investments(i) Gross value of investments
a) In India................................................................................................ 947,314.5 1,056,883.5b) Outside India....................................................................................... 97,586.3 64,358.5
(ii) Provision for depreciationa) In India................................................................................................ (12,530.7) (5,719.8)b) Outside India....................................................................................... (1,787.0) (978.7)
(iii) Net value of investmentsa) In India................................................................................................ 934,783.8 1,051,163.7b) Outside India....................................................................................... 95,799.3 63,379.8
2. Movement of provisions held towards depreciation on investments(i) Opening balance ...................................................................................... 6,698.5 5,582.6(ii) Add: Provisions made during the year .................................................... 8,912.7 2,622.7(iii) Less: Write-off/write back of excess provisions during the year............ (1,293.5) (1,506.8)(iv) Closing balance ....................................................................................... 14,317.7 6,698.5
From April 1, 2008, the Bank migrated to first-in-first-out (FIFO) basis of cost determination instead ofweighted average cost (WAC) basis, in respect of its portfolios of equity shares, preference shares, mutual fundunits, venture fund units, initial contributions and security receipts. The impact of this change is not consideredmaterial.
13. Investment in securities, other than government and other approved securities
i) Issuer composition of investments in securities, other than government and other approvedsecurities.
a) The issuer composition of investments of the Bank in securities, other than government and otherapproved securities as on March 31, 2009, is given below:
No. Issuer Amount
Extent of
private
placement2
Extent of
‘below
investment
grade’
securities
Extent of
‘unrated’
securities2
Extent of
‘unlisted’
securities 3
(a) (b) (c) (d)
(Rupees in million)
1. PSUs......................................... 946.1 — 22.8 — —2. FIs ............................................ 14,279.1 8,981.6 — 45.6 126.33. Banks........................................ 40,794.4 12,688.2 1,876.6 8,723.8 15,469.94. Private Corporates .................... 32,554.1 15,972.6 — 8,961.2 5,525.95. Subsidiaries/Joint ventures ....... 131,711.6 324.1 — — —6. Others 4 .................................... 188,604.2 73,680.5 33,536.3 — —7. Provision held towards
depreciation .............................. (12,174.7) — — — —Total ......................................... 396,714.8 111,647.0 35,435.7 17,730.6 21,122.1
1. Amounts reported under columns (a), (b), (c) and (d) above are not mutually exclusive.
2. Includes Rs Nil of application money towards corporate bonds/debentures.
F-138

3. This excludes investments, amounting to Rs. 6,192.6 million, in preference shares of subsidiaries, namely ICICIBank UK PLC and ICICI Bank Canada. This also excludes investments in government securities Rs. 953.35 millionof non-Indian origin made by overseas branches.
4. Other investments include deposit with NABARD under RIDF Deposit Scheme amounting to Rs. 59,999.4 million(March 31, 2008: Rs. 14,850.2 million).
5. Collateralised debt obligations securities have been included in the above data based on the arranger of suchinstruments.
b) The issuer composition of investments of the Bank in securities, other than government and otherapproved securities as on March 31, 2008, is given below:
No. Issuer Amount
Extent of
private
placement
Extent of
‘below
investment
grade’
securities
Extent of
‘unrated’
securities2
Extent of
‘unlisted’
securities 2,3
(a) (b) (c) (d)
(Rupees in million)
1 PSUs......................................... 6,022.8 3,000.0 22.5 — —2 FIs ............................................ 11,601.6 6,711.0 — 1,656.0 3,426.03 Banks........................................ 40,374.6 13,376.2 437.8 7,101.2 5,456.04 Private Corporates .................... 35,542.1 14,345.7 — 10,068.9 6,633.65 Subsidiaries/Joint ventures ....... 88,178.8 3,851.4 — 150.0 150.06 Others ....................................... 188,582.0 75,586.5 26,358.2 — —7 Provision held towards
depreciation .............................. (6,067.9) — — — —Total ......................................... 364,234.0 116,870.8 26,818.5 18,976.1 15,665.9
1. Amounts reported under columns (a), (b), (c) and (d) above are not mutually exclusive.
2. This excludes investments, amounting to Rs. 3,701.4 million, in preference shares of subsidiaries, namely ICICIBank UK PLC and ICICI Bank Canada. This also excludes investments in government securities (Rs. 1,402.5million) of non-Indian origin made by overseas branches.
3. Includes Rs. 1,770.0 million of application money towards bonds issued by banks, which were listed before theAudit Committee Meeting held on April 25, 2008.
4. Collateralised debt obligations securities have been included in the above data based on the arranger of suchinstruments.
ii) Non-performing investments in securities, other than government and other approved securities
The movement in gross non-performing investments in securities, other than government and otherapproved securities for the year ended March 31, 2009 and March 31, 2008 is given below:
Particulars
Year ended
March 31, 2009
Year ended
March 31, 2008
(Rupees in million)
Opening balance ............................................................................................... 3,689.6 3,083.1Additions during the year................................................................................. 278.7 851.3Reduction during the year ................................................................................ (139.2) (244.8)Closing balance ................................................................................................ 3,829.1 3,689.6
Total provisions held ........................................................................................ 3,213.8 2,276.3
F-139

14. Repurchase transactions
The details of securities sold and purchased under repos and reverse repos during the year ended March31, 2009 and March 31, 2008 are given below:
Minimumoutstanding
balance duringthe year
Maximumoutstanding
balance duringthe year
Daily averageoutstanding
balance duringthe year
Balance as onyear end
(Rupees in million)Year ended March 31, 2009Securities sold under repurchase transaction.. — 145,875.0 66,861.3 22,092.3Securities purchased under reverse
repurchase transaction................................. — 10,499.7 31.5 —Year ended March 31, 2008Securities sold under repurchase transaction.. — 101,463.6 34,644.5 24,496.8Securities purchased under reverse
repurchase transaction................................. — 23,044.2 1,330.2 —
1. The above figures do not include securities sold and purchased under Liquidity Adjustment Facility (“LAF”) of RBI.2. The above figures are for Indian branches only.3. Minimum, maximum & average outstanding is based on first leg of transaction & balance outstanding is based on
book value.
15. Lending to sensitive sectors
The Bank has lending to sectors, which are sensitive to asset price fluctuations. The sensitive sectorsinclude capital markets and real estate.
The position of lending to capital market sector is given below:
As on
March 31, 2009
As on
March 31, 2008
(Rupees in million)Capital market sector
i) Direct investment in equity shares, convertible debentures and unitsof equity-oriented mutual funds the corpus of which is not exclusivelyinvested in corporate debt ....................................................................... 13,167.9 29,240.6
ii) Advances against shares/bonds/debentures or other securities or onclean basis to individuals for investment in shares (includingIPOs/ESOPs), convertible bonds, convertible debentures, and units ofequity-oriented mutual funds................................................................... 7,408.5 14,324.2
iii) Advances for any other purposes where shares or convertible bonds orconvertible debentures or units of equity oriented mutual funds aretaken as primary security ........................................................................ 271.7 423.2
iv) Advances for any other purposes to the extent secured by thecollateral security of shares or convertible bonds or convertibledebentures or units of equity oriented mutual funds .............................. 609.7 1,692.3
v) Secured and unsecured advances to stockbrokers and guaranteesissued on behalf of stockbrokers and market makers1............................ 22,890.5 26,342.6
vi) Loans sanctioned to corporates against the security ofshares/bonds/debentures or other securities or on clean basis formeeting promoter’s contribution to the equity of new companies inanticipation of raising resources.............................................................. — —
vii) Bridge loans to companies against expected equity flows/issues ........... — —viii) Underwriting commitments taken up by the Bank in respect of
primary issue of shares or convertible bonds or convertible debenturesor units of equity oriented mutual funds................................................. — —
ix) Financing to stockbrokers for margin trading ......................................... — —x) All exposures to Venture Capital Funds (both registered and
unregistered) ............................................................................................ 13,564.3 12,805.2xi) Others ...................................................................................................... 3,922.2 —
Total......................................................................................................... 61,834.8 84,828.1
F-140

1. Includes a guarantee of Rs. Nil (March 31, 2008: Rs. 3,040.0 million) issued on behalf of a corporate customer toensure equity capital contribution.
The summary of lending to real estate sector is given below:
As on March 31,
2009
As on March 31,
2008
(Rupees in million)Real estate sector
I Direct exposure........................................................................................ 697,579.8 779,388.9i) Residential mortgages of which; individual housing loans eligible for
priority sector advances...........................................................................545,263.3266,820.6
630,857.6314,071.6
ii) Commercial real estate1........................................................................... 142,441.7 137,336.2iii) Investments in mortgage backed securities (MBS) and other
securitised exposure................................................................................. 9,874.8 11,195.1a. Residential ........................................................................................... 9,874.8 11,195.1b. Commercial real estate ........................................................................ — —
II Indirect exposure ..................................................................................... 70,441.1 33,613.5Fund based and non-fund based exposures on National Housing Bank(NHB) and Housing Finance Companies (HFCs) ................................... 66,477.4 20,901.3Others ...................................................................................................... 3,963.7 12,712.2
Total2 ....................................................................................................... 768,020.9 813,002.4
1. Commercial real estate exposure includes loans given to land and building developers for construction, corporatesfor their real estate requirements, corporates for development of SEZs and to individuals/firms/corporates againstnon-residential premises.
2. Excludes non-banking assets acquired in satisfaction of claims.
16. Details of Single Borrower Limit (“SBL”), Group Borrower Limit (“GBL”) exceeded by the Bank
During the year ended March 31, 2009, the Bank had no exposure to any single borrower and groupborrower, which exceeded the prudential exposure limits prescribed by RBI.
17. Risk category-wise country-wise exposure
As per the extant RBI guidelines, the country exposure of the Bank is categorised into various riskcategories listed in the following table. The funded country exposure (net) of the Bank in respect of UnitedKingdom is 1.22%, United States of America is 1.34% and Canada is 1.05% of the total funded assets as onMarch 31, 2009 (as on March 31, 2008: United Kingdom was 1.81%, United States of America was 1.57%and Canada was 0.43%). As the net funded exposure to United Kingdom, United States of America and Canadaexceeds 1% of total funded assets, the Bank has made a provision of Rs. 285.0 million on country exposureas on March 31, 2009 (Provision as on March 31, 2008: Rs. 245.0 million).
Risk category
Exposure (net)
as on March 31,
2009
Provision held
as at March 31,
2009
Exposure (net)
as on March 31,
2008
Provision held
as at March 31,
2008
(Rupees in million)
Insignificant .................................................... 442,570.4 285.0 435,312.7 245.0Low................................................................. 172,910.8 — 167,234.5 —Moderate ......................................................... 21,870.7 — 36,697.3 —High ................................................................ 784.1 — 4,730.7 —Very High........................................................ 22.8 — 22.1 —Restricted ........................................................ — — — —Off-Credit........................................................ — — — —
Total ................................................................ 638,158.8 285.0 643,997.3 245.0— of which funded......................................... 289,482.0 — 403,791.3 —
F-141
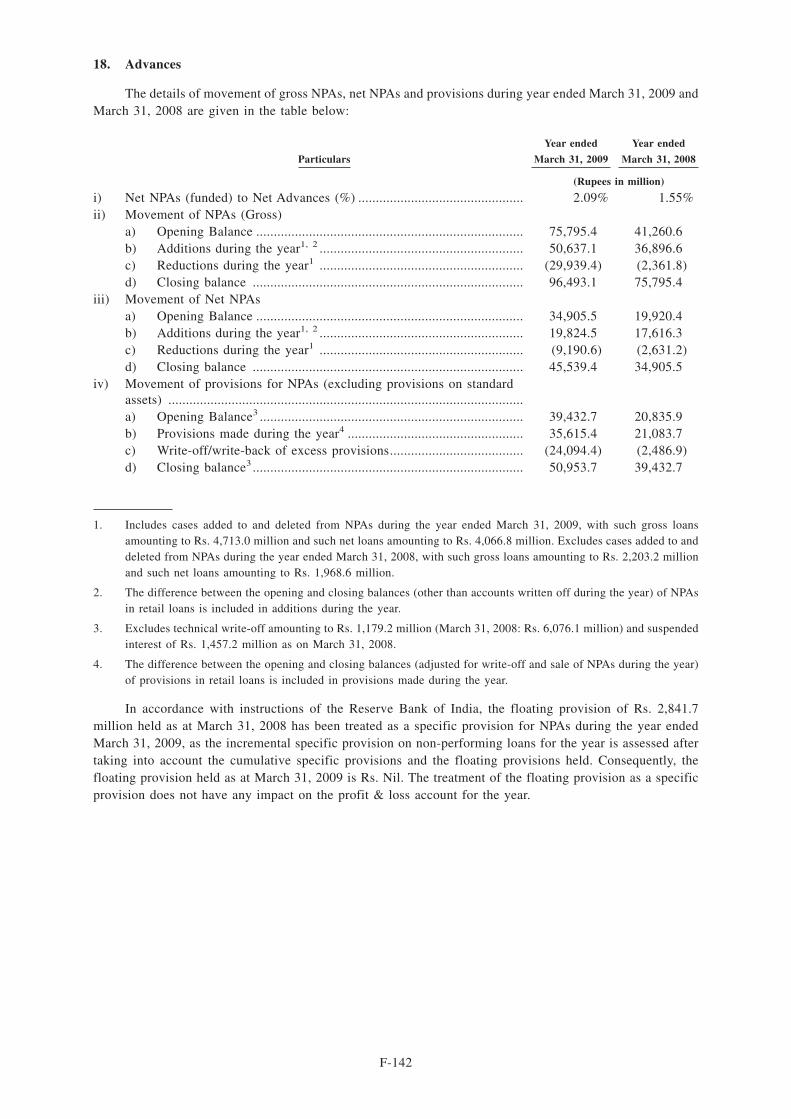
18. Advances
The details of movement of gross NPAs, net NPAs and provisions during year ended March 31, 2009 andMarch 31, 2008 are given in the table below:
Particulars
Year ended
March 31, 2009
Year ended
March 31, 2008
(Rupees in million)
i) Net NPAs (funded) to Net Advances (%) ............................................... 2.09% 1.55%ii) Movement of NPAs (Gross)
a) Opening Balance ............................................................................ 75,795.4 41,260.6b) Additions during the year1, 2 .......................................................... 50,637.1 36,896.6c) Reductions during the year1 .......................................................... (29,939.4) (2,361.8)d) Closing balance ............................................................................. 96,493.1 75,795.4
iii) Movement of Net NPAsa) Opening Balance ............................................................................ 34,905.5 19,920.4b) Additions during the year1, 2 .......................................................... 19,824.5 17,616.3c) Reductions during the year1 .......................................................... (9,190.6) (2,631.2)d) Closing balance ............................................................................. 45,539.4 34,905.5
iv) Movement of provisions for NPAs (excluding provisions on standardassets) .....................................................................................................a) Opening Balance3 ........................................................................... 39,432.7 20,835.9b) Provisions made during the year4 .................................................. 35,615.4 21,083.7c) Write-off/write-back of excess provisions...................................... (24,094.4) (2,486.9)d) Closing balance3 ............................................................................. 50,953.7 39,432.7
1. Includes cases added to and deleted from NPAs during the year ended March 31, 2009, with such gross loansamounting to Rs. 4,713.0 million and such net loans amounting to Rs. 4,066.8 million. Excludes cases added to anddeleted from NPAs during the year ended March 31, 2008, with such gross loans amounting to Rs. 2,203.2 millionand such net loans amounting to Rs. 1,968.6 million.
2. The difference between the opening and closing balances (other than accounts written off during the year) of NPAsin retail loans is included in additions during the year.
3. Excludes technical write-off amounting to Rs. 1,179.2 million (March 31, 2008: Rs. 6,076.1 million) and suspendedinterest of Rs. 1,457.2 million as on March 31, 2008.
4. The difference between the opening and closing balances (adjusted for write-off and sale of NPAs during the year)of provisions in retail loans is included in provisions made during the year.
In accordance with instructions of the Reserve Bank of India, the floating provision of Rs. 2,841.7million held as at March 31, 2008 has been treated as a specific provision for NPAs during the year endedMarch 31, 2009, as the incremental specific provision on non-performing loans for the year is assessed aftertaking into account the cumulative specific provisions and the floating provisions held. Consequently, thefloating provision held as at March 31, 2009 is Rs. Nil. The treatment of the floating provision as a specificprovision does not have any impact on the profit & loss account for the year.
F-142

19. Financial assets transferred during the year to securitisation company (SC)/reconstructioncompany (RC)
The Bank has transferred certain assets to Asset Reconstruction Companies (ARCs) in terms of theguidelines issued by RBI governing such transfer. For the purpose of the valuation of the underlying securityreceipts issued by the underlying trusts managed by ARCs, the security receipts are valued at their respectiveNAVs as advised by the ARCs. The details of the assets transferred during the year ended March 31, 2009 andMarch 31, 2008 are given in the table below:
Year ended
March 31, 2009
Year ended
March 31, 2008
(Rupees in million, except
number of accounts)
A No. of accounts ....................................................................................... 18,429 18,480B Aggregate value (net of provisions) of accounts sold to SC/RC............ 6,810.7 9,344.5C Aggregate consideration .......................................................................... 6,737.9 9,408.2D Additional consideration realised in respect of accounts transferred in
earlier years1............................................................................................ — —E Aggregate gain/(loss) over net book value ............................................. (72.8) 63.7
1. During the year ended March 31, 2009, ARCIL fully redeemed security receipts of three trusts. The Bank realisedRs. 27.6 million over the gross book value in respect of two trusts (March 31, 2008: Rs. Nil). The Bank also realisedan additional amount of Rs. Nil over the gross book value in respect of security receipts already redeemed. Further,the Bank has realised an additional amount of Rs. Nil (March 31, 2008: Rs. 7.7 million) over the gross book valuein respect of security receipts not fully redeemed as on March 31, 2009.
20. Provisions on standard assets
The Bank makes provision on standard assets as per RBI guidelines. During the period ended September30, 2008, the Bank made proportionate additional provision on interest rate and foreign exchange derivativetransaction and gold, as applicable to loan assets in the standard category, in line with RBI circularDBOD.No.BP.31/21.04.157/2008-09 dated August 8, 2008. The Bank has also adopted the revised rates formaking provision on standard assets during the year ended March 31, 2009, in accordance with RBI circularno. DBOD.BP.BC.83/21.01.002/2008-09 dated November 15, 2008.
The Bank has written back Rs. 190.0 million during the year ended March 31, 2009 as compared toincremental provision of Rs. 1,590.0 million made during the year ended March 31, 2008. The Bank has notwritten back any standard asset provision post the aforementioned RBI circular dated November 15, 2008. Theprovision on standard assets held by the Bank at March 31, 2009 was Rs. 14,360.6 million (March 31, 2008:Rs. 14,550.3 million).
21. Provisions and contingencies
The break-up of ‘Provisions and contingencies’ included in the profit and loss account is given below:
Year ended
March 31, 2009
Year ended
March 31, 2008
(Rupees in million)
Provisions for depreciation of investments ...................................................... 977.3 622.6Provision towards non-performing assets......................................................... 37,690.3 25,419.9Provision towards standard assets .................................................................... (190.0) 1,590.0Provision towards income tax1 ......................................................................... 13,558.4 8,953.7Provision towards wealth tax ........................................................................... 30.0 30.0Other provision and contingencies ................................................................... (395.0) 1,413.3
1. Includes fringe benefit tax amounting to Rs. 342.0 million for the year ended March 31, 2009 (March 31, 2008: Rs.392.0 million) and net deferred tax asset amounting to Rs. (4,716.7) million for the year ended March 31, 2009(March 31, 2008: Rs. (7,133.6) million).
F-143

22. Movement in provision for credit card reward points
Year ended
March 31, 2009
Year ended
March 31, 2008
(Rupees in million)Opening provision for reward points ............................................................... 576.3 321.9Provision for reward points made during the year........................................... 599.4 583.5Utilisation/Write back of provision for reward points ..................................... 943.7 329.1Closing provision for reward points1 .............................................................. 232.0 576.3
1. The closing provision is based on the actuarial valuation of accumulated credit card reward points. This amount willbe utilised towards redemption of the credit card reward points.
23. Information in respect of restructured assets
Details of loan assets subjected to restructuring are given below:
Year ended March 31, 2009 Year ended March 31, 2008
CDR
Mechanism
SME Debt
Restructuring Others
CDR
Mechanism
SME Debt
Restructuring Others
(Rupees in million)Standardadvancesrestructured ........
Number of Borrowers 1 7 937 2 — 1Amount outstanding 912.2 252.5 9,781.1 1,013.7 — 14,781.6Sacrifice (diminutionin the fair value) 107.0 0.7 59.6 — — —
Sub standardadvancesrestructured ........
Number of Borrowers — — 51 — — 1Amount outstanding — — 202.1 — — 962.1Sacrifice (diminutionin the fair value) — — 0.7 — — —
Doubtfuladvancesrestructured ........
Number of Borrowers — — — — — —Amount outstanding — — — — — —Sacrifice (diminutionin the fair value) — — — — — —
Total ................... Number of Borrowers 1 7 988 2 — 2Amount outstanding 912.2 252.5 9,983.2 1,013.7 — 15,743.7Sacrifice (diminutionin the fair value) 107.0 0.7 60.3 — — —
1. The above disclosure for the year ended March 31, 2009, excludes reversal of interest income of Rs. 159.1 millionon account of conversion of overdue interest into Funded Interest Term Loan (FITL) and reversal of derivativeincome of Rs. 1,134.5 million on account of conversion of derivative receivables into term loans.
Additional disclosure regarding restructured accounts1:
Particulars Number Amount
(Rupees in million)1. Applications received up to March 31, 2009, for restructuring, in
respect of accounts which were standard as on September 1, 2008 2 .... 1,016 31,048.12. Of (1), proposals approved and implemented as on March 31, 2009,
which thus became eligible for special regulatory treatment and wereclassified as standard assets as on the date of the balance sheet ........... 945 10,945.8
3. Of (1), proposals approved and implemented as on March 31, 2009,but could not be upgraded to the standard category ............................... 30 68.6
4. Of (1), proposals under process/implementation which were standardas on March 31, 2009.............................................................................. 38 19,875.1
5. Of (1), proposals under process/implementation which turned NPA ason March 31, 2009, but are expected to be classified as standardassets on full implementation of the package ......................................... 3 158.6
F-144

1. Excludes cases where terms and conditions of the restructuring were being finalised as on March 31, 2008 and havebeen subsequently finalised. Also, excludes reversal of derivative income receivables proposed to be converted intoterm loans.
2. Includes applications for 950 accounts amounting to Rs. 2,001.2 million from various retail borrowers.
24. Details of non-performing assets purchased/sold, excluding those sold to SC/RC
The Bank has sold certain non-performing assets in terms of the guidelines issued by RBI circular no.DBOD.No.BP.BC.16/21.04.048/2005-06 dated July 13, 2005.
Particulars
Year ended
March 31, 2009
Year ended
March 31, 2008
(Rupees in million, except
number of accounts)
A Number of accounts................................................................................. — 12,545B Aggregate value (net of provisions) of accounts sold, excluding those
sold to SC/RC.......................................................................................... — 515.3C Aggregate consideration .......................................................................... — 499.4D Aggregate gain/(loss) over net book value ............................................. — (15.9)
25. Fixed Assets
Fixed assets include software acquired by the Bank. The movement in software is given below:
Particulars
Year ended
March 31, 2009
Year ended
March 31, 2008
(Rupees in million)
At cost as on March 31st of preceding year .................................................... 4,448.8 3,216.4Additions during the year................................................................................. 818.6 1,235.4Deductions during the year .............................................................................. — (3.0)Depreciation to date ......................................................................................... (3,509.5) (2,847.4)Net block .......................................................................................................... 1,757.9 1,601.4
26. Assets given on lease
Assets under finance lease
The details of finance leases are given below:
Particulars
As on
March 31, 2009
As on
March 31, 2008
(Rupees in million)
Future minimum lease receiptsPresent value of lease receipts ......................................................................... 174.8 325.6Unmatured finance charges .............................................................................. 9.3 28.1
Total .................................................................................................................. 184.1 353.7
Maturity profile of future minimum lease receipts— Not later than one year................................................................................ 176.4 213.3— Later than one year and not later than five years ....................................... 7.7 140.4— Later than five years ................................................................................... — —
Total .................................................................................................................. 184.1 353.7
F-145

Maturity profile of present value of lease rentals
The details of maturity profile of present value of finance lease receipts are given below:
Particulars
As on
March 31, 2009
As on
March 31, 2008
(Rupees in million)
Not later than one year..................................................................................... 167.3 193.0Later than one year and not later than five years ............................................ 7.5 132.6Later than five years......................................................................................... — —
Total .................................................................................................................. 174.8 325.6
27. Early Retirement Option (“ERO”)
The Bank had implemented an Early Retirement Option Scheme 2003 for its employees in July 2003.All employees who had completed 40 years of age and seven years of service with the Bank (including periodof service with entities amalgamated with the Bank) were eligible for the ERO.
The ex-gratia payments under ERO, terminations benefits and leave encashment in excess of theprovision made (net of tax benefits), aggregating to Rs. 1,910.0 million has been amortised over a period offive years commencing August 1, 2003 (the date of retirement of employees exercising the Option being July31, 2003).
On account of the above ERO scheme, an amount of Rs. 118.0 million (March 31, 2008: Rs. 384.0million) has been charged to revenue being the balance of proportionate amount fully amortised during theyear ended March 31, 2009.
28. Provision for income tax
The provision for income tax (including deferred tax and fringe benefit tax) for the year ended March31, 2009 amounted to Rs. 13,558.4 million (March 31, 2008: Rs. 8,953.7 million).
The Bank has a comprehensive system of maintenance of information and documents required bytransfer pricing legislation under section 92-92F of the Income Tax Act, 1961. The Bank is of the opinion thatall international transactions are at arm’s length so that the above legislation will not have material impact onthe financial statements.
29. Deferred tax
As on March 31, 2009 the Bank has recorded net deferred tax asset of Rs. 17,923.1 million (March 31,2008: Rs. 13,233.9 million), which has been included in other assets.
The break-up of deferred tax assets and liabilities into major items is given below:
As on
March 31, 2009
As on
March 31, 2008
(Rupees in million)
Deferred tax assetProvision for bad and doubtful debts ............................................................... 21,597.8 18,043.3Capital loss ....................................................................................................... 131.4 —Others ............................................................................................................... 1,680.3 1,409.9
Total deferred tax assets ................................................................................... 23,409.5 19,453.2
Deferred tax liabilityDepreciation on fixed assets............................................................................. 5,460.1 6,220.5Others ............................................................................................................... — —
Total deferred tax liability ................................................................................ 5,460.1 6,220.5Deferred tax asset/(liability) pertaining to foreign branches............................ (26.3) 1.2
Total net deferred tax asset/(liability) .............................................................. 17,923.1 13,233.9
F-146

During the year ended March 31, 2009, the Bank has created a deferred tax asset on carry forward capitallosses as based on its firm plans it is virtually certain that sufficient future taxable capital gains will beavailable against which the loss can be set off.
30. Dividend distribution tax
For the purpose of computation of dividend distribution tax on the proposed dividend, the Bank hasreduced the dividend distribution tax on dividend received from its Indian subsidiaries as per the amendmentto section 115-O of the Income Tax Act, 1961 vide Finance Bill, 2008, read with Section 294 of the IncomeTax Act, 1961.
31. Derivatives
ICICI Bank is a major participant in the financial derivatives market. The Bank deals in derivatives forbalance sheet management and market making purposes whereby the Bank offers derivative products to itscustomers, enabling them to hedge their risks.
Dealing in derivatives is carried out by identified groups in the treasury of the Bank based on the purposeof the transaction. Derivative transactions are entered into by the treasury front office. Treasury middle officeconducts an independent check of the transactions entered into by the front office and also undertakesactivities such as confirmation, settlement, accounting, risk monitoring and reporting and ensures compliancewith various internal and regulatory guidelines.
The market making and the proprietary trading activities in derivatives are governed by the investmentpolicy of the Bank, which lays down the position limits, stop loss limits as well as other risk limits. The RiskManagement Group (“RMG”) lays down the methodology for computation and monitoring of risk. The RiskCommittee of the Board (“RCB”) reviews the Bank’s risk management policy in relation to various risks(portfolio, liquidity, interest rate, off-balance sheet and operational risks), investment policies and complianceissues in relation thereto. The RCB comprises of independent directors and the Managing Director and CEO.
Risk monitoring of the derivatives portfolio other than credit derivatives is done on a daily basis. Riskmonitoring of the credit derivatives portfolio is done on a monthly basis. The Bank measures and monitors riskusing Value at Risk (“VAR”) approach and the relevant greeks for options. Risk reporting on derivatives formsan integral part of the management information system and the marked to market position and the VAR of thederivatives portfolio other than credit derivatives is reported on a daily basis. The marked to market positionand VAR on the credit derivatives portfolio is reported on a monthly basis.
The use of derivatives for hedging purposes is governed by the hedge policy approved by Asset LiabilityManagement Committee (“ALCO”). Subject to prevailing RBI guidelines, the Bank deals in derivatives forhedging fixed rate, floating rate or foreign currency assets/liabilities. Transactions for hedging and marketmaking purposes are recorded separately. For hedge transactions, the Bank identifies the hedged item (assetor liability) at the inception of the transaction itself. The effectiveness is assessed at the time of inception ofthe hedge and periodically thereafter.
Hedge derivative transactions are accounted for pursuant to the principles of hedge accounting.Derivatives for market making purpose are marked to market and the resulting gain/loss is recorded in theprofit and loss account. The premium on option contracts is accounted for as per Foreign Exchange Dealers’Association of India guidelines. Derivative transactions are covered under International Swap DealersAssociation (“ISDA”) master agreements with the respective counter parties. The exposure on account ofderivative transactions is computed as per RBI guidelines and is marked against the credit limits approved forthe respective counter parties.
F-147

As on March 31, 2009
Sr.
No. Particulars
Currency
derivatives1
Interest rate
derivatives2
(Rupees in million)
1 Derivatives (Notional principal amount)a) For hedging .................................................................................... 21,807.6 236,802.8b) For trading ...................................................................................... 1,190,839.4 3,270,348.6
2 Marked to market positions3
a) Asset (+) ......................................................................................... 24,141.6 3,592.7b) Liability (-) ..................................................................................... — —
3 Credit exposure4 ...................................................................................... 156,118.5 123,036.24 Likely impact of one percentage change in interest rate (100*PV01)5
a) On hedging derivatives6 ................................................................. 212.6 8,902.0b) On trading derivatives .................................................................... 2,446.3 1,943.3
5 Maximum and minimum of 100*PV01 observed during the yeara) On hedging6....................................................................................
Maximum........................................................................................ (194.2) (7,993.6)Minimum ........................................................................................ (564.4) (11,031.3)
b) On trading.......................................................................................Maximum........................................................................................ (1,813.7) 5,597.0Minimum ........................................................................................ (2,710.5) 61.5
1. Options and cross currency interest rate swaps and currency futures are included in currency derivatives.2. Foreign currency interest rate swaps, forward rate agreements and swaptions are included in interest rate derivatives.3. For trading portfolio including accrued interest. Represents net positions.4. Includes accrued interest.5. Amounts given are absolute values on a net basis, excluding options.6. The swap contracts entered for hedging purpose would have an opposite and offsetting impact with the underlying
on-balance sheet items.
As on March 31, 2008
Sr.No. Particulars
Currencyderivatives1
Interest ratederivatives2
(Rupees in million)1 Derivatives (Notional principal amount)
a) For hedging .................................................................................... 27,056.3 206,265.5b) For trading ...................................................................................... 1,536,757.0 6,372,250.2
2 Marked to market positions 3
a) Asset (+) ......................................................................................... 30,085.1 184.5b) Liability (-) ..................................................................................... — —
3 Credit exposure4 ...................................................................................... 109,607.8 83,103.44 Likely impact of one percentage change in interest rate (100*PV01)5
a) On hedging derivatives6 ................................................................. 559.5 8,879.2b) On trading derivatives .................................................................... 1,777.8 2,270.7
5 Maximum and minimum of 100*PV01 observed during the yeara) On hedging6 ..................................................................................
Maximum........................................................................................ (11.6) (4,268.4)Minimum ........................................................................................ (714.7) (9,467.8)
b) On trading .....................................................................................Maximum........................................................................................ (313.2) 2,809.2Minimum ........................................................................................ (1,870.9) 464.9
1. Options and cross currency interest rate swaps are included in currency derivatives.2. Foreign currency interest rate swaps, forward rate agreements and swaptions are included in interest rate derivatives.3. For trading portfolio including accrued interest. Represents net positions.4. Includes accrued interest.5. Amounts given are absolute values on a net basis, excluding options.6. The swap contracts entered for hedging purpose would have an opposite and offsetting impact with the underlying
on-balance sheet items.
F-148
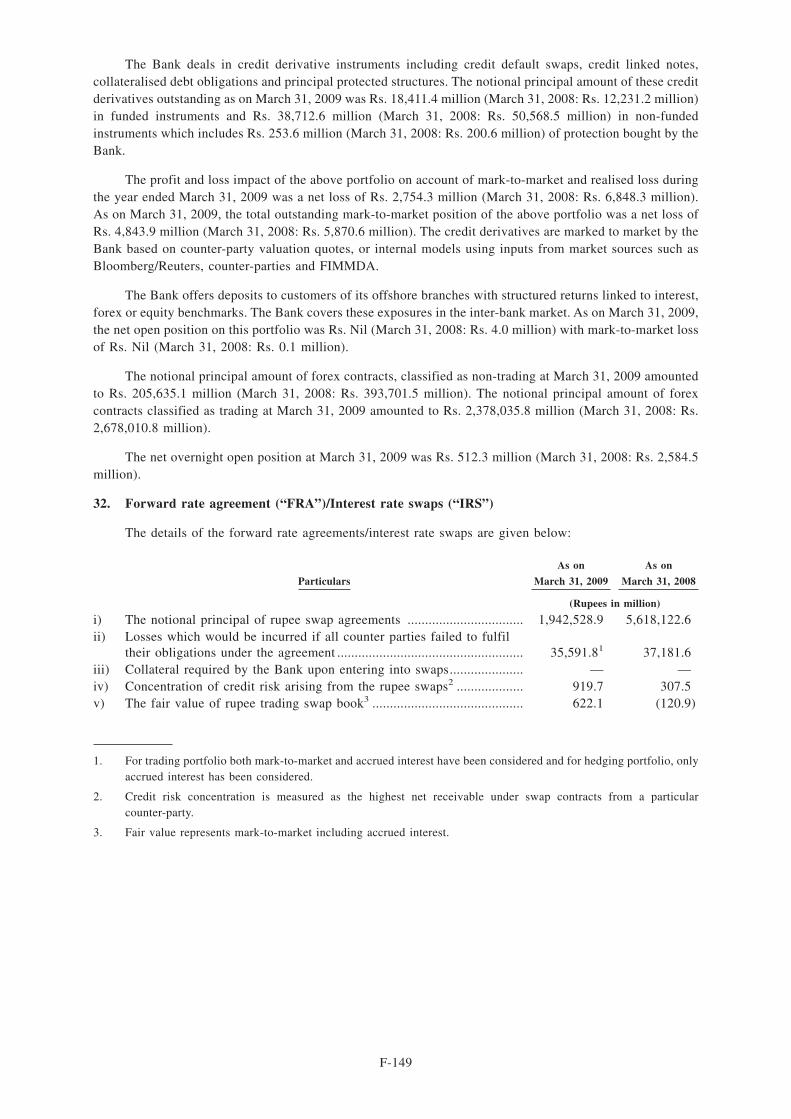
The Bank deals in credit derivative instruments including credit default swaps, credit linked notes,collateralised debt obligations and principal protected structures. The notional principal amount of these creditderivatives outstanding as on March 31, 2009 was Rs. 18,411.4 million (March 31, 2008: Rs. 12,231.2 million)in funded instruments and Rs. 38,712.6 million (March 31, 2008: Rs. 50,568.5 million) in non-fundedinstruments which includes Rs. 253.6 million (March 31, 2008: Rs. 200.6 million) of protection bought by theBank.
The profit and loss impact of the above portfolio on account of mark-to-market and realised loss duringthe year ended March 31, 2009 was a net loss of Rs. 2,754.3 million (March 31, 2008: Rs. 6,848.3 million).As on March 31, 2009, the total outstanding mark-to-market position of the above portfolio was a net loss ofRs. 4,843.9 million (March 31, 2008: Rs. 5,870.6 million). The credit derivatives are marked to market by theBank based on counter-party valuation quotes, or internal models using inputs from market sources such asBloomberg/Reuters, counter-parties and FIMMDA.
The Bank offers deposits to customers of its offshore branches with structured returns linked to interest,forex or equity benchmarks. The Bank covers these exposures in the inter-bank market. As on March 31, 2009,the net open position on this portfolio was Rs. Nil (March 31, 2008: Rs. 4.0 million) with mark-to-market lossof Rs. Nil (March 31, 2008: Rs. 0.1 million).
The notional principal amount of forex contracts, classified as non-trading at March 31, 2009 amountedto Rs. 205,635.1 million (March 31, 2008: Rs. 393,701.5 million). The notional principal amount of forexcontracts classified as trading at March 31, 2009 amounted to Rs. 2,378,035.8 million (March 31, 2008: Rs.2,678,010.8 million).
The net overnight open position at March 31, 2009 was Rs. 512.3 million (March 31, 2008: Rs. 2,584.5million).
32. Forward rate agreement (“FRA”)/Interest rate swaps (“IRS”)
The details of the forward rate agreements/interest rate swaps are given below:
Particulars
As on
March 31, 2009
As on
March 31, 2008
(Rupees in million)
i) The notional principal of rupee swap agreements ................................. 1,942,528.9 5,618,122.6ii) Losses which would be incurred if all counter parties failed to fulfil
their obligations under the agreement ..................................................... 35,591.81 37,181.6iii) Collateral required by the Bank upon entering into swaps..................... — —iv) Concentration of credit risk arising from the rupee swaps2 ................... 919.7 307.5v) The fair value of rupee trading swap book3 ........................................... 622.1 (120.9)
1. For trading portfolio both mark-to-market and accrued interest have been considered and for hedging portfolio, onlyaccrued interest has been considered.
2. Credit risk concentration is measured as the highest net receivable under swap contracts from a particularcounter-party.
3. Fair value represents mark-to-market including accrued interest.
F-149

33. Exchange traded interest rate derivatives
The details of exchange traded interest rate derivatives are given below:
Particulars
As on
March 31, 2009
As on
March 31, 2008
(Rupees in million)
i) Notional principal amount of exchange traded interest rate derivativesundertaken during the year (instrument-wise)a) Euro dollar futures ......................................................................... — —b) Treasury note futures — 10 years .................................................. 7,608.0 7,021.0c) Treasury note futures — 5 years.................................................... — 4,557.6d) Treasury note futures — 2 years.................................................... 6,390.7 1,380.1
ii) Notional principal amount of exchange traded interest rate derivativesoutstanding (instrument-wise)a) Euro dollar futures ......................................................................... — —b) Treasury note futures — 10 years .................................................. — —c) Treasury note futures — 5 years.................................................... — —d) Treasury note futures — 2 years.................................................... — —
iii) Notional principal amount of exchange traded interest rate derivativesoutstanding and not “highly effective ” (instrument-wise) ..................... N.A N.A
iv) Mark-to-market value of exchange traded interest rate derivativesoutstanding and not “highly effective” (instrument-wise) ...................... N.A N.A
1. All the transactions in exchange traded interest rate derivatives have been entered into by foreign branches fortrading portfolios.
34. Penalties/fines imposed by RBI and other banking regulatory bodies
There were no penalties imposed by RBI during the year ended March 31, 2009 (March 31, 2008: Rs.Nil).
Central Bank of Sri Lanka (CBSL) has imposed penalty of LKR 865 (Rs. 400) during the year endedMarch 31, 2009, on Sri Lanka Branch for breach on the maintenance of the Statutory Reserve Requirement(SRR).
35. Small and micro industries
Under the Micro, Small and Medium Enterprises Development Act, 2006 which came into force fromOctober 2, 2006, certain disclosures are required to be made relating to Micro, Small and Medium enterprises.There have been no reported cases of delays in payments to micro and small enterprises or of interest paymentsdue to delays in such payments.
36. Farm loan waiver
The Ministry of Finance, Government of India has issued guidelines for the implementation of theAgriculture debt waiver and relief scheme for farmers on May 23, 2008. The Bank has implemented thescheme as per guidelines issued by RBI vide circular no. DBOD No. BP.BC.26/21.04.048/2008-09 dated July30, 2008 on “Agricultural Debt Waiver and Debt Relief Scheme, 2008 - Prudential norms on incomerecognition, asset classification and provisioning and Capital Adequacy”.
Pursuant to the scheme an aggregate amount of Rs. 2,666.7 million has been waived which is recoverablefrom Government of India. Of the above, an amount of Rs. 773.0 million has been received by March 31, 2009and balance of Rs. 1,893.7 million is receivable in future.
F-150

37. Disclosure of complaints
The movement of the outstanding numbers of complaints is given below:
Particulars
Year ended
March 31, 2009
Year ended
March 31, 2008
a) Number of complaints pending at the beginning of the year ................. 1,863 579b) Number of complaints received during the year ..................................... 102,488 185,431c) Number of complaints redressed during the year ................................... 103,465 184,147d) Number of complaints pending at the end of the year ........................... 8862 1,863
1. From April, 2008, complaints resolved within 1 working day are not included.
2. Complaints pending beyond 30 days as on March 31, 2009, are 31.
The details of awards during the year are given below:
Particulars
Year ended
March 31, 2009
Year ended
March 31, 2008
a) Number of unimplemented awards at the beginning of the year............ 1 4b) Number of awards passed by the Banking Ombudsmen during the
year .......................................................................................................... — 7c) Number of awards implemented during the year .................................... 1 6d) Number of unimplemented awards at the end of the year...................... — 1
38. Comparative figures
Figures for the previous year have been regrouped wherever necessary, to conform to the current year‘spresentation.
SIGNATURES TO SCHEDULES 1 TO 19
For and on behalf of the Board of Directors
N. VaghulChairman
K. V. KamathManaging Director & CEO
Chanda D. KochharJoint Managing Director & CFO
V. VaidyanathanExecutive Director
Sonjoy ChatterjeeExecutive Director
K. RamkumarExecutive Director
Sandeep BatraGroup Compliance Officer &
Company Secretary
Rakesh JhaDeputy Chief Financial Officer
Place: MumbaiDate: April 25, 2009
F-151

To the Members of ICICI Bank Ltd
Auditors’ report on the financial statements of ICICI Bank Limited
1. We have audited the attached Balance Sheet of ICICI Bank Limited (‘the Bank’) as at March 31, 2008and also the Profit and Loss Account and the Cash Flow Statement for the year ended on that date, bothannexed thereto. These financial statements are the responsibility of the Bank’s management. Ourresponsibility is to express an opinion on these financial statements based on our audit. Incorporated inthe said financial statements are the returns of the Singapore and Bahrain branches, audited by anotherauditor.
2. We conducted our audit in accordance with auditing standards generally accepted in India. Thosestandards require that we plan and perform the audit to obtain reasonable assurance about whether thefinancial statements are free of material misstatements. An audit includes examining, on a test basis,evidence supporting the amounts and disclosures in the financial statements. An audit also includesassessing the accounting principles used and significant estimates made by the management, as well asevaluating the overall financial statements presentation. We believe that our audit provides a reasonablebasis for our opinion.
3. We did not audit the financial statements of the Singapore and Bahrain branches of the Bank, whosefinancial statements reflect total assets of Rs. 563,636.6 million as at March 31, 2008, total revenues ofRs. 33,481.8 million and cash flows amounting to Rs. 5,946.0 million for the year then ended. Thesefinancial statements have been audited by another auditor, duly qualified to act as auditors in the countryof incorporation of the branch, whose report has been furnished to us, and was relied upon by us for ouropinion on the financial statements of the Bank.
4. The Balance Sheet and the Profit and Loss Account have been drawn up in accordance with theprovisions of Section 29 of the Banking Regulation Act, 1949 read with Section 211(1) and (2) of theCompanies Act, 1956.
5. We report that:
(i) we have obtained all the information and explanations which, to the best of our knowledge andbelief, were necessary for the purpose of our audit and have found them to be satisfactory;
(ii) the transactions of the Bank, which have come to our notice, have been within the powers of theBank;
(iii) the returns received from the offices and branches of the Bank have been found adequate for thepurposes of our audit.
6. In our opinion, the Balance Sheet, the Profit and Loss Account and the Cash Flow Statement dealt withby this report comply with the Accounting Standards referred to in sub-section (3C) of Section 211 ofthe Companies Act, 1956, to the extent they are not inconsistent with the accounting polices prescribedby the Reserve Bank of India.
7. We further report that:
(i) the Balance Sheet, Profit and Loss Account and cash flow statement dealt with by this report arein agreement with the books of account and the returns;
(ii) in our opinion, proper books of account as required by law have been kept by the Bank so far asappears from our examination of those books;
(iii) the reports on the accounts of the Singapore and Bahrain branches audited by another auditor havebeen dealt with in preparing our report in the manner considered necessary by us;
(iv) as per information and explanation given to us the Central Government has, till date, not prescribedany cess payable under Section 441A of the Companies Act, 1956;
(v) on the basis of written representations received from the directors, as on March 31, 2008, and takenon record by the Board of Directors, we report that none of the directors is disqualified as on March31, 2008 from being appointed as a director in terms of clause (g) of sub-section (1) of Section 274of the Companies Act, 1956;
F-152

8. In our opinion and to the best of our information and according to the explanations given to us and onconsideration of report submitted by the Singapore and Bahrain branch auditors, the said accountstogether with the notes thereon give the information required by the Banking Regulation Act, 1949 aswell as the Companies Act, 1956, in the manner so required for banking companies and give a true andfair view in conformity with the accounting principles generally accepted in India:
(i) in the case of the Balance Sheet, of the state of affairs of the Bank as at March 31, 2008;
(ii) in the case of the Profit and Loss Account, of the profit of the Bank for the year ended on that date;and
(iii) in the case of the Cash Flow Statement, of the cash flows of the Bank for the year ended on thatdate.
for BSR & Co.Chartered Accountants
Akeel Master PartnerMembership No.: 046768
MumbaiApril 26, 2008
F-153

Unconsolidated Balance Sheet as on March 31, 2008
Schedule
As on
31.03.2008
As on
31.03.2007
(Rupees in ’000s)
CAPITAL AND LIABILITIESCapital............................................................................................... 1 14,626,786 12,493,437Reserves and surplus ........................................................................ 2 453,575,309 234,139,207Deposits ............................................................................................ 3 2,444,310,502 2,305,101,863Borrowings........................................................................................ 4 656,484,338 512,560,263Other liabilities and provisions......................................................... 5 428,953,827 382,286,356
TOTAL CAPITAL AND LIABILITIES ........................................ 3,997,950,762 3,446,581,126
ASSETSCash and balances with Reserve Bank of India ............................... 6 293,775,337 187,068,794Balances with banks and money at call and short notice ................ 7 86,635,952 184,144,452Investments ....................................................................................... 8 1,114,543,415 912,578,418Advances........................................................................................... 9 2,256,160,827 1,958,655,996Fixed assets....................................................................................... 10 41,088,975 39,234,232Other assets....................................................................................... 11 205,746,256 164,899,234
TOTAL ASSETS.............................................................................. 3,997,950,762 3,446,581,126
Contingent liabilities......................................................................... 12 11,513,490,113 5,629,599,060Bills for collection ............................................................................ 42,782,842 40,465,610Significant accounting policies and notes to accounts ..................... 18 & 19
The schedules referred to above form an integral part of the Balance Sheet.
As per our Report of even date. For and on behalf of the Board of Directors
For BSR & Co.Chartered Accountants
N. VaghulChairman
K. V. KamathManaging Director & CEO
Chanda D. KochharJoint Managing Director
& CFO
Akeel MasterPartner
Membership No.: 046768
V. VaidyanathanExecutive Director
Madhabi Puri BuchExecutive Director
Sonjoy ChatterjeeExecutive Director
Sandeep BatraGroup Compliance Officer &
Company Secretary
Rakesh JhaDeputy Chief Financial Officer
Charanjit AttraGeneral Manager &
Chief Accountant
MumbaiApril 26, 2008
F-154

Unconsolidated Profit and Loss Account for the year ended March 31, 2008
Schedule
Year ended
31.03.2008
Year ended
31.03.2007
(Rupees in ’000s)
I. INCOMEInterest earned ......................................................................... 13 307,883,429 219,955,876Other income ........................................................................... 14 88,107,628 69,278,726
TOTAL INCOME ........................................................................... 395,991,057 289,234,602
II. EXPENDITUREInterest expended ..................................................................... 15 234,842,423 163,584,984Operating expenses .................................................................. 16 81,541,819 66,905,564Provisions and contingencies ................................................. 17 38,029,536 27,641,854
TOTAL EXPENDITURE................................................................ 354,413,778 258,132,402
III. PROFIT/LOSSNet profit for the year ............................................................. 41,577,279 31,102,200Profit brought forward ............................................................. 9,982,741 2,934,416
TOTAL PROFIT/(LOSS)................................................................ 51,560,020 34,036,616
IV. APPROPRIATIONS/TRANSFERSTransfer to Statutory Reserve .................................................. 10,400,000 7,800,000Transfer to Reserve Fund ........................................................ 3,138 1,168Transfer to Capital Reserve ..................................................... 1,270,000 1,210,000Transfer to Special Reserve..................................................... 1,750,000 4,500,000Proposed equity share dividend............................................... 12,277,018 9,011,694Proposed preference share dividend ........................................ 35 35Corporate dividend tax ........................................................... 1,496,670 1,530,978Balance carried over to balance sheet ..................................... 24,363,159 9,982,741
TOTAL ............................................................................................. 51,560,020 34,036,616
Significant accounting policies and notes to accounts ..................... 18 & 19Earning per share (Refer note 19.6)
Basic (Rs.) ............................................................................... 39.39 34.84Diluted (Rs.) ............................................................................ 39.15 34.64
Face value per share (Rs.).............................................................. 10.00 10.00
The schedules referred to above form an integral part of the Profit and Loss Account.
As per our Report of even date. For and on behalf of the Board of Directors
For BSR & Co.Chartered Accountants
N. VaghulChairman
K. V. KamathManaging Director & CEO
Chanda D. KochharJoint Managing Director
& CFO
Akeel MasterPartner
Membership No.: 046768
V. VaidyanathanExecutive Director
Madhabi Puri BuchExecutive Director
Sonjoy ChatterjeeExecutive Director
Sandeep BatraGroup Compliance Officer &
Company Secretary
Rakesh JhaDeputy Chief Financial Officer
Charanjit AttraGeneral Manager &
Chief Accountant
MumbaiApril 26, 2008
F-155

Unconsolidated Cash Flow Statement for the year ended March 31, 2008
PARTICULARSYear ended31.03.2008
Year ended31.03.2007
(Rupees in ’000s)Cash flow from operating activitiesNet profit before taxes ................................................................................................... 50,560,977 36,480,391Adjustments for:Depreciation and amortisation ....................................................................................... 7,711,011 7,639,002Net (appreciation)/depreciation on investments ............................................................. 10,279,608 9,918,419Provision in respect of non-performing assets (including prudential provision onstandard assets) .............................................................................................................. 27,009,924 21,592,999Provision for contingencies & others............................................................................. 1,413,354 251,311Income from subsidiaries, joint ventures and consolidated entities .............................. (12,783,599) (4,484,915)(Profit)/Loss on sale of fixed assets .............................................................................. (656,069) (1,152,224)
83,535,206 70,244,982
Adjustments for:(Increase)/decrease in investments ................................................................................. (25,015,908) (19,666,157)(Increase)/decrease in advances ..................................................................................... (320,850,355) (511,255,267)Increase/(decrease) in borrowings.................................................................................. 43,122,293 57,039,927Increase/(decrease) in deposits....................................................................................... 126,079,339 654,270,149(Increase)/decrease in other assets ................................................................................. (27,149,533) (28,758,999)Increase/(decrease) in other liabilities and provisions ................................................... 22,330,716 26,886,199
(181,483,448) 178,515,852Refund/(payment) of direct taxes................................................................................... (18,363,292) (18,141,312)
Net cash generated from operating activities (A)...................................................... (116,311,534) 230,619,522
Cash flow from investing activitiesInvestments in subsidiaries and/or joint ventures(including application money) ....................................................................................... (44,379,917) (15,758,166)Income from subsidiaries, joint ventures and consolidated entities .............................. 12,783,799 4,484,915Purchase of fixed assets ................................................................................................. (9,592,487) (4,924,623)Proceeds from sale of fixed assets................................................................................. 1,064,035 4,347,300(Purchase)/sale of held to maturity securities ................................................................ (135,486,579) (171,776,134)
Net cash generated from investing activities (B) ....................................................... (175,611,149) (183,626,708)
Cash flow from financing activitiesProceeds from issue of share capital (including ESOPs)net of issue expenses ..................................................................................................... 197,897,060 2,074,414Net proceeds/(repayment) of bonds (including subordinated debt) ............................... 112,316,167 160,717,380Dividend and dividend tax paid..................................................................................... (10,565,000) (8,646,021)
Net cash generated from financing activities (C) ...................................................... 299,648,227 154,145,774
Effect of exchange fluctuation on translation reserve (D)........................................ (890,065) (327,587)
Net cash and cash equivalents taken over from Sangli Bank Ltd onamalgamation (E) ......................................................................................................... 2,362,563 —
Net increase/(decrease) in cash and cash equivalents(A) + (B) + (C) + (D) +(E)........................................................................................... 9,198,042 200,811,001
Cash and cash equivalents at April 1 ......................................................................... 371,213,247 170,402,245
Cash and cash equivalents at March 31 .................................................................... 380,411,289 371,213,247
Significant accounting policies and notes to accounts (refer Schedule 18 and 19)
The Schedules referred to above form an integral part of the Balance Sheet.
As per our Report of even date For and on behalf of the Board of Directors
For BSR & Co.Chartered Accountants
N. VaghulChairman
K. V. KamathManaging Director & CEO
Chanda D. KochharJoint Managing Director
& CFO
Akeel MasterPartner
Membership No.: 046768
V. VaidyanathanExecutive Director
Madhabi Puri BuchExecutive Director
Sonjoy ChatterjeeExecutive Director
Sandeep BatraGroup Compliance Officer
& Company Secretary
Rakesh JhaDeputy Chief Financial Officer
Charanjit AttraGeneral Manager &
Chief Accountant
Place: MumbaiDate: April 26, 2008
F-156

Schedules forming part of the Balance Sheet
As on
31.03.2008
As on
31.03.2007
(Rupees in ’000s)
SCHEDULE 1 — CAPITALAuthorised capital1,275,000,000 equity shares of Rs. 10 each [March 31, 2007: 1,000,000,000
equity shares of Rs. 10 each] ....................................................................... 12,750,000 10,000,00015,000,000 shares of Rs. 100 each [March 31, 2007: 55,000,000 preference
shares of Rs. 100 each] 1.............................................................................. 1,500,000 5,500,000350 preference shares of Rs. 10 million each [March 31, 2007: 350
preference shares of Rs. 10 million each] ................................................... 3,500,000 3,500,000
Equity share capitalIssued, subscribed and paid-up capital899,266,672 equity shares of Rs. 10 each (March 31, 2007: 889,779,621
equity shares) ............................................................................................... 8,992,667 8,897,796Add: 3,455,008 equity shares of Rs. 10 each fully paid up issued to
shareholders of erstwhile Sangli Bank Limited .............................. 34,550 —Add: 108,598,626 equity shares of Rs. 10 each fully paid up issued vide
prospectus dated June 26, 2007 (includes 13,762,869 sharesissued under green shoe option) ..................................................... 1,085,986 —
Add: 99,898,476 equity shares of Rs. 10 each fully paid up underlying49,949,238 American Depository Shares (ADSs) issued videprospectus dated June 23, 2007 (includes 6,497,462 ADSs issuedunder green shoe option) ............................................................... 998,985 —
Add: 1,468,713 equity shares of Rs. 10 each fully paid up (March 31,2007: 9,487,051 equity shares) issued pursuant to exercise ofemployee stock options .................................................................. 14,687 94,871
11,126,875 8,992,667Less: Calls unpaid ........................................................................................... 859 —Add: 111,603 equity shares forfeited (March 31, 2007: 111,603 equity
shares) ................................................................................................. 770 770
TOTAL EQUITY CAPITAL ......................................................................... 11,126,786 8,993,437Preference share capital[Represents face value of 350 preference shares of Rs. 10 million each
issued to preference share holders of erstwhile ICICI Limited onamalgamation redeemable at par on April 20, 2018] ................................... 3,500,000 3,500,000
TOTAL CAPITAL .......................................................................................... 14,626,786 12,493,437
1. These shares will be of such class and with such rights, privileges, conditions or restrictions as may be determinedby the Bank in accordance with the Articles of Association of the Bank and subject to the legislative provisions forthe time being in that behalf.
F-157

Schedules forming part of the Balance Sheet
As on
31.03.2008
As on
31.03.2007
(Rupees in ’000s)
SCHEDULE 2 — RESERVES AND SURPLUSI. Statutory reserve
Opening balance ........................................................................................... 28,787,307 20,987,307Additions during the year [includes Rs. 206.5 million on amalgamation] .. 10,606,500 7,800,000Deductions during the year........................................................................... — —Closing balance............................................................................................. 39,393,807 28,787,307
II. Special reserveOpening balance ........................................................................................... 19,190,000 14,690,000Additions during the year ............................................................................ 1,750,000 4,500,000Deductions during the year........................................................................... — —Closing balance............................................................................................. 20,940,000 19,190,000
III. Securities premiumOpening balance .......................................................................................... 120,154,919 118,175,597Additions during the year 1 .......................................................................... 197,644,847 1,979,322Deductions during the year 2 ........................................................................ 5,328,736 —Closing balance............................................................................................. 312,471,030 120,154,919
IV. Capital reserveOpening balance ........................................................................................... 6,740,000 5,530,000Additions during the year ............................................................................ 1,270,000 1,210,000Deductions during the year........................................................................... — —Closing balance............................................................................................. 8,010,000 6,740,000
V. Foreign currency translation reserve ............................................................ (1,391,262) (501,197)VI. Reserve fund
Opening balance .......................................................................................... 1,390 222Additions during the year 3 .......................................................................... 3,138 1,168Deductions during the year........................................................................... — —Closing balance............................................................................................. 4,528 1,390
VII. Revenue and other reservesOpening balance .......................................................................................... 49,784,047 50,840,074Additions during the year ............................................................................ — —Deductions during the year 4 ........................................................................ — 1,056,027Closing balance............................................................................................. 49,784,047 49,784,047
VIII. Balance in profit and loss account............................................................... 24,363,159 9,982,741
TOTAL RESERVES AND SURPLUS ................................................................ 453,575,309 234,139,207
1. Includes:-
a) Rs. 86,065.6 million (net of share premium in arrears of Rs. 486.1 million) consequent to public issue videprospectus dated June 26, 2007.
b) Rs. 98,237.4 million consequent to issue of ADSs (including green shoe options exercised) vide prospectusdated June 23, 2007.
c) Rs. 12,799.5 million on exercise of the green shoe option vide prospectus dated June 26, 2007.
d) Rs. 542.3 million (March 31, 2007: Rs. 1,901.9 million) on exercise of employee stock options.
2. Represents:-
a) Rs. 3,482.2 million being the excess of the paid-up value of the shares issued to the shareholders of The SangliBank Limited over the fair value of the net assets acquired on merger and amalgamation expenses as per thescheme of amalgamation.
b) Rs. 1,846.6 million being the share issue expenses, written-off from the securities premium account as per theobjects of the issue.
3. Represents appropriation of 5% of net profit by Sri Lanka branch to meet the requirements of Section 20 of SriLankan Banking Act No 30 of 1988.
4. Represents transition adjustment on account of first time adoption of Accounting Standard 15 (Revised) on“Employee benefits” issued by The Institute of Chartered Accountants of India, for the year ended March 31, 2007.
F-158

Schedules forming part of the Balance Sheet
As on
31.03.2008
As on
31.03.2007
(Rupees in ’000s)
SCHEDULE 3 — DEPOSITSA. I. Demand deposits
i) From banks............................................................................ 5,018,339 4,648,856ii) From others ........................................................................... 241,894,532 209,107,605
II. Savings bank deposits .................................................................... 390,893,090 288,387,894III. Term deposits
i) From banks............................................................................ 125,024,337 145,787,927ii) From others ........................................................................... 1,681,480,204 1,657,169,581
TOTAL DEPOSITS ........................................................................................ 2,444,310,502 2,305,101,863
B. I. Deposits of branches in India......................................................... 2,372,239,318 2,217,017,644II. Deposits of branches outside India ................................................ 72,071,184 88,084,219
TOTAL DEPOSITS ........................................................................................ 2,444,310,502 2,305,101,863
As on
31.03.2008
As on
31.03.2007
(Rupees in ’000s)
SCHEDULE 4 — BORROWINGSI. Borrowings in India
i) Reserve Bank of India .................................................................. — —ii) Other banks .................................................................................... 32,105,635 42,668,594iii) Other institutions and agencies
a) Government of India ............................................................. 1,592,480 2,171,867b) Financial institutions ............................................................. 27,541,146 36,708,119
iv) Borrowings in the form ofBonds and debentures (excluding subordinated debt)- Debentures and bonds guaranteed by the Government of India . 14,815,000 14,815,000- Borrowings under private placement of bonds carrying
maturity of 1 to 30 years from the date of placement ................ 6,545,648 6,784,799Bonds issued under multiple option/safety bonds series- Regular interest bonds ................................................................. 5,393,095 5,566,170- Deep discount bonds.................................................................... 4,401,234 4,564,511- Encash bonds ............................................................................... — 56,015- Tax saving bonds ........................................................................ 17,376,227 20,779,673- Pension bonds .............................................................................. 61,722 61,626
TOTAL BORROWINGS IN INDIA .............................................................. 109,832,187 134,176,374
II. Borrowings outside Indiai) From multilateral/bilateral credit agencies
guaranteed by the Government of India for the equivalent ofRs. 18,402.9 million at March 31, 2008 (March 31, 2007:Rs. 19,151.7 million)...................................................................... 20,966,276 22,701,869
ii) From international banks, institutions and consortiums................. 241,652,121 177,126,582iii) By way of bonds and notes............................................................ 283,229,410 178,353,872iv) Other borrowings............................................................................ 804,344 201,566
TOTAL BORROWINGS OUTSIDE INDIA ................................................. 546,652,151 378,383,889
TOTAL BORROWINGS ................................................................................ 656,484,338 512,560,263
Secured borrowings in I and II above is Rs. Nil.
F-159

Schedules forming part of the Balance Sheet
As on
31.03.2008
As on
31.03.2007
(Rupees in ’000s)
SCHEDULE 5 — OTHER LIABILITIES AND PROVISIONSI. Bills payable ............................................................................................ 29,007,972 42,337,867II. Inter-office adjustments (net) ................................................................. 4,293,542 —III. Interest accrued........................................................................................ 25,968,705 20,408,669IV. Unsecured redeemable/perpetual debentures/bonds
[Subordinated debt included in Tier I and Tier II Capital] ..................... 207,501,787 194,051,111V. Others
a) Security deposits from clients ........................................................ 15,197,638 4,691,762b) Sundry creditors ............................................................................. 74,101,312 68,115,421c) Received for disbursements under special program....................... 2,034,281 1,896,661d) Provision for standard assets .......................................................... 14,550,250 12,948,250e) Other liabilities 1 ............................................................................ 56,298,340 37,836,615
TOTAL OTHER LIABILITIES AND PROVISIONS.................................. 428,953,827 382,286,356
1. Includes:
a) Proposed dividend of Rs. 12,239.6 million [March 31, 2007: Rs. 8,992.7 million].
b) Corporate dividend tax payable of Rs. 1,490.3 million [March 31, 2007: Rs. 1,528.3 million].
As on31.03.2008
As on31.03.2007
(Rupees in ’000s)
SCHEDULE 6 — CASH AND BALANCES WITHRESERVE BANK OF INDIA
I. Cash in hand (including foreign currency notes) .................................... 28,478,239 20,669,585II. Balances with Reserve Bank of India in current accounts ..................... 265,297,098 166,399,209
TOTAL CASH AND BALANCES WITH RESERVE BANK OF INDIA .. 293,775,337 187,068,794
As on31.03.2008
As on31.03.2007
(Rupees in ’000s)
SCHEDULE 7 — BALANCES WITH BANKS ANDMONEY AT CALL AND SHORT NOTICE
I. In Indiai) Balances with banks
a) In current accounts ................................................................ 8,705,555 7,778,635b) In other deposit accounts ...................................................... 3,343,519 12,583,020
ii) Money at call and short noticea) With banks............................................................................. — 1,000,000b) With other institutions ........................................................... — —
TOTAL ........................................................................................................... 12,049,074 21,361,655II. Outside India
i) In current accounts ......................................................................... 16,473,903 15,930,529ii) In other deposit accounts................................................................ 31,635,362 114,269,004iii) Money at call and short notice....................................................... 26,477,613 32,583,264
TOTAL............................................................................................................. 74,586,878 162,782,797TOTAL BALANCES WITH BANKS AND MONEY AT CALL ANDSHORT NOTICE ............................................................................................ 86,635,952 184,144,452
F-160

Schedules forming part of the Balance Sheet
As on
31.03.2008
As on
31.03.2007
(Rupees in ’000s)
SCHEDULE 8 — INVESTMENTSI. Investments in India [net of provisions]
i) Government securities .................................................................... 753,777,483 673,681,742ii) Other approved securities ............................................................... 97,946 601iii) Shares (includes equity and preference shares) ............................ 29,200,790 19,372,558iv) Debentures and bonds ................................................................... 18,871,649 24,628,194v) Subsidiaries and/or joint ventures .................................................. 46,382,774 26,071,831vi) Others (commercial paper, mutual fund units, pass through
certificates, security receipts etc.) ................................................. 202,833,016 123,785,241
TOTAL INVESTMENTS IN INDIA ............................................................. 1,051,163,658 867,540,167II. Investments outside India [net of provisions]
i) Government securities .................................................................... 1,402,546 2,965,737ii) Subsidiaries and/or joint ventures abroad (includes equity and
preference shares) ......................................................................... 38,719,449 14,650,476iii) Others ............................................................................................ 23,257,762 27,422,038
TOTAL INVESTMENTS OUTSIDE INDIA ................................................ 63,379,757 45,038,251
TOTAL INVESTMENTS ............................................................................... 1,114,543,415 912,578,418
III. Investments in IndiaGross value of investments ..................................................................... 1,056,883,463 873,108,274Less: aggregate of provision/depreciation ............................................... 5,719,805 5,568,107
Net investments ...................................................................................... 1,051,163,658 867,540,167IV. Investments outside India
Gross value of investments ..................................................................... 64,358,489 45,052,750Less: aggregate of provision/depreciation ............................................... 978,732 14,499
Net investments ...................................................................................... 63,379,757 45,038,251
TOTAL INVESTMENTS ............................................................................... 1,114,543,415 912,578,418
F-161

Schedules forming part of the Balance Sheet
As on
31.03.2008
As on
31.03.2007
(Rupees in ’000s)
SCHEDULE 9 — ADVANCES [net of provisions]A. i) Bills purchased and discounted ...................................................... 46,763,159 44,947,460
ii) Cash credits, overdrafts and loans repayable on demand .............. 348,051,840 328,642,181iii) Term loans ...................................................................................... 1,755,794,419 1,512,550,418iv) Securitisation, finance lease and hire purchase receivables 1 ........ 105,551,409 72,515,937
TOTAL ADVANCES ....................................................................................... 2,256,160,827 1,958,655,996
B. i) Secured by tangible assets [includes advances againstbook debts] .................................................................................... 1,693,135,659 1,528,133,832
ii) Covered by bank/government guarantees....................................... 42,087,202 34,195,829iii) Unsecured ....................................................................................... 520,937,966 396,326,335
TOTAL ADVANCES ....................................................................................... 2,256,160,827 1,958,655,996
C. I. Advances in Indiai) Priority sector ........................................................................ 597,325,197 552,772,378ii) Public sector .......................................................................... 3,559,887 4,017,005iii) Banks ..................................................................................... 45,947 906,063iv) Others .................................................................................... 1,177,773,278 1,156,860,404
TOTAL ADVANCES IN INDIA..................................................................... 1,778,704,309 1,714,555,850II. Advances outside India
i) Due from banks ..................................................................... 41,225,542 30,027,302ii) Due from others
a) Bills purchased and discounted .................................... 19,965,470 22,000,550b) Commercial loans......................................................... 271,379,347 146,579,129c) Others ........................................................................... 144,886,159 45,493,165
TOTAL ADVANCES OUTSIDE INDIA ....................................................... 477,456,518 244,100,146
TOTAL ADVANCES ....................................................................................... 2,256,160,827 1,958,655,996
1. Includes receivables under lease amounting to Rs. 349.2 million (March 31, 2007 : Rs. 577.9 million).
F-162

Schedules forming part of the Balance Sheet
As on
31.03.2008
As on
31.03.2007
(Rupees in ’000s)
SCHEDULE 10 — FIXED ASSETSI. Premises
At cost as on March 31 of preceding year ............................................ 20,496,202 20,199,439Additions during the year ...................................................................... 2,719,704 1,186,105Deductions during the year .................................................................... (272,987) (889,342)Depreciation to date ............................................................................... (3,326,017) (2,608,478)
Net block ............................................................................................... 19,616,902 17,887,724II. Other fixed assets (including furniture and fixtures)
At cost as on March 31 of preceding year ............................................ 24,352,894 20,531,892Additions during the year ...................................................................... 5,588,730 4,469,584Deductions during the year .................................................................... (603,577) (648,582)Depreciation to date ............................................................................... (15,836,691) (13,038,759)
Net block ............................................................................................... 13,501,356 11,314,135III. Assets given on lease
At cost as on March 31 of preceding year ............................................ 18,136,532 18,954,323Additions during the year ...................................................................... — —Deductions during the year ..................................................................... (57,460) (817,791)Depreciation to date, accumulated lease adjustment and provisions ..... (10,108,355) (8,104,159)
Net block................................................................................................. 7,970,717 10,032,373
TOTAL FIXED ASSETS ................................................................................ 41,088,975 39,234,232
As on
31.03.2008
As on
31.03.2007
(Rupees in ’000s)
SCHEDULE 11 — OTHER ASSETSI. Inter-office adjustments (net) .................................................................. — 3,762,923II. Interest accrued........................................................................................ 34,867,173 29,417,095III. Tax paid in advance/tax deducted at source (net) ................................... 40,660,994 37,661,011IV. Stationery and stamps.............................................................................. 574 1,552V. Non-banking assets acquired in satisfaction of claims 1......................... 3,658,544 3,536,564VI. Others
a) Advance for capital assets.............................................................. 6,404,148 1,896,627b) Outstanding fees and other income ................................................ 5,772,850 4,204,860c) Swap suspense ............................................................................... — 168,266d) Deposits .......................................................................................... 27,606,644 31,538,890e) Deferred tax asset (net) .................................................................. 13,233,940 6,099,534f) Early retirement option expenses not written off........................... 117,979 501,979g) Others ............................................................................................. 73,423,410 46,109,933
TOTAL OTHER ASSETS .............................................................................. 205,746,256 164,899,234
1. Includes certain non-banking assets acquired in satisfaction of claims which are in the process of being transferred
in the Bank’s name.
F-163

Schedules forming part of the Balance Sheet
As on
31.03.2008
As on
31.03.2007
(Rupees in ’000s)
SCHEDULE 12 — CONTINGENT LIABILITIESI. Claims against the Bank not acknowledged as debts.............................. 40,306,033 39,115,895II. Liability for partly paid investments ....................................................... 128,126 168,472III. Liability on account of outstanding forward exchange contracts ........... 3,071,712,304 1,331,560,415IV. Guarantees given on behalf of constituents
a) In India ........................................................................................... 338,313,547 241,625,310b) Outside India .................................................................................. 74,501,645 50,493,774
V. Acceptances, endorsements and other obligations .................................. 250,992,610 186,706,710VI. Currency swaps ....................................................................................... 477,039,283 325,260,384VII. Interest rate swaps, currency options and interest rate futures 1............. 7,067,956,457 3,346,921,704VIII. Other items for which the Bank is contingently liable ........................... 192,540,108 107,746,396
TOTAL CONTINGENT LIABILITIES ........................................................ 11,513,490,113 5,629,599,060
1. Excludes notional amount of options sold amounting to Rs. 597,333.2 million ( March 31, 2007 :Rs. 444,221.2
million).
Schedules forming part of the Profit and Loss Account
Year ended
31.03.2008
Year ended
31.03.2007
(Rupees in ’000s)
SCHEDULE 13 — INTEREST EARNEDI. Interest/discount on advances/bills .......................................................... 226,009,874 160,963,126II. Income on investments 1 ......................................................................... 74,660,091 49,898,395III. Interest on balances with Reserve Bank of India and other
inter-bank funds....................................................................................... 6,119,944 8,085,554IV. Others 2.................................................................................................... 1,093,520 1,008,801
TOTAL INTEREST EARNED....................................................................... 307,883,429 219,955,876
1. Includes amortisation of premium on Government securities of Rs. 8,976.2 million (March 31, 2007: Rs. 9,987.0million).
2. Includes interest on income tax refunds of Rs. 871.0 million (March 31, 2007: Rs. 1,022.7 million).
F-164

Year ended31.03.2008
Year ended31.03.2007
(Rupees in ’000s)
SCHEDULE 14 — OTHER INCOMEI. Commission, exchange and brokerage ................................................... 56,053,127 43,308,555II. Profit/(loss) on sale of investments (net) ................................................ 18,802,235 11,152,403III. Profit/(loss) on revaluation of investments (net)..................................... (680,855) (350,732)IV. Profit/(loss) on sale of land, buildings and other assets (net) 1.............. 656,069 1,152,224V. Profit/(loss) on foreign exchange transactions (net) .............................. 1,101,719 6,439,626VI. Income earned by way of dividends, etc. from subsidiary companies
and/or joint ventures abroad/in India ...................................................... 11,519,500 4,484,915VII. Miscellaneous income (including lease income) 2 .................................. 655,833 3,091,735
TOTAL OTHER INCOME ............................................................................ 88,107,628 69,278,726
1. Includes profit/(loss) on sale of assets given on lease.
2. Includes unrealised gains/(losses) on rupee interest rate derivatives.
Year ended31.03.2008
Year ended31.03.2007
(Rupees in ’000s)
SCHEDULE 15 — INTEREST EXPENDEDI. Interest on deposits.................................................................................. 171,102,433 116,477,051II. Interest on Reserve Bank of India/inter-bank borrowings 1.................... 18,269,621 13,001,023III. Others (including interest on borrowings of erstwhile ICICI Limited) . 45,470,369 34,106,910
TOTAL INTEREST EXPENDED.................................................................. 234,842,423 163,584,984
1. Includes interest paid on inter-bank deposits.
F-165

Schedules forming part of the Profit and Loss Account
Year ended
31.03.2008
Year ended
31.03.2007
(Rupees in ’000s)
SCHEDULE 16 — OPERATING EXPENSESI. Payments to and provisions for employees ............................................. 20,788,974 16,167,490II. Rent, taxes and lighting........................................................................... 5,166,414 3,108,152III. Printing and stationery ............................................................................ 1,742,100 1,524,660IV. Advertisement and publicity.................................................................... 2,078,608 2,177,368V. Depreciation on Bank’s property (including non-banking assets) .......... 3,962,822 3,565,076VI. Depreciation (including lease equalisation) on leased assets ................ 1,820,689 1,882,750VII. Directors’ fees, allowances and expenses ............................................... 4,190 3,849VIII. Auditors’ fees and expenses .................................................................... 23,034 21,203IX. Law charges............................................................................................. 453,673 284,800X. Postages, telegrams, telephones, etc........................................................ 3,305,702 2,925,819XI. Repairs and maintenance .......................................................................... 4,198,727 3,369,533XII. Insurance.................................................................................................. 2,249,540 1,688,971XIII. Direct marketing agency expenses ......................................................... 15,427,433 15,238,964XIV. Other expenditure ................................................................................... 20,319,913 14,946,929
TOTAL OPERATING EXPENSES ............................................................... 81,541,819 66,905,564
Year ended
31.03.2008
Year ended
31.03.2007
(Rupees in ’000s)
SCHEDULE 17 — PROVISIONS AND CONTINGENCIESI. Income tax
- Current period tax................................................................................. 15,695,283 9,443,237- Deferred tax adjustment........................................................................ (7,133,600) (4,464,322)- Fringe benefit tax.................................................................................. 392,015 369,276
II. Wealth tax................................................................................................ 30,000 30,000III. Provision for investments (including credit substitutes) (net) ................ 622,560 419,353IV. Provision for advances (net) 1................................................................. 27,009,924 21,592,999V. Others ...................................................................................................... 1,413,354 251,311
TOTAL PROVISIONS AND CONTINGENCIES ........................................ 38,029,536 27,641,854
1. Includes provisions on standard assets, non-performing advances, non-performing leased assets and others.
F-166

SCHEDULE 18 — SIGNIFICANT ACCOUNTING POLICIES
OVERVIEW
ICICI Bank Limited (“ICICI Bank” or “the Bank”), incorporated in Vadodara, India is a publicly heldbanking company engaged in providing a wide range of banking and financial services including commercialbanking and treasury operations. ICICI Bank is a banking company governed by the Banking Regulation Act,1949.
Basis of preparation
The financial statements have been prepared in accordance with statutory requirements prescribed underthe Banking Regulation Act, 1949. The accounting and reporting policies of ICICI Bank used in thepreparation of these financial statements conform to Generally Accepted Accounting Principles in India(“Indian GAAP”), the guidelines issued by Reserve Bank of India (“RBI”) from time to time and practicesgenerally prevalent in the banking industry in India. The Bank follows the accrual method of accounting,except where otherwise stated, and the historical cost convention.
The preparation of financial statements requires the management to make estimates and assumptionsconsidered in the reported amounts of assets and liabilities (including contingent liabilities) as of the date ofthe financial statements and the reported income and expenses during the reporting period. Managementbelieves that the estimates used in the preparation of the financial statements are prudent and reasonable.Future results could differ from these estimates.
SIGNIFICANT ACCOUNTING POLICIES
1. Revenue recognition
a. Interest income is recognised in the profit and loss account as it accrues except in the case ofnon-performing assets (“NPAs”) where it is recognised, upon realisation, as per the incomerecognition and asset classification norms of RBI.
b. Income from hire purchase operations is accrued by applying the implicit interest rate onoutstanding balances.
c. Income from leases is calculated by applying the interest rate implicit in the lease to the netinvestment outstanding on the lease over the primary lease period. Leases entered into till March31, 2001 have been accounted for as operating leases.
d. Income on discounted instruments is recognised over the tenure of the instrument on a constantyield basis.
e. Dividend is accounted on an accrual basis when the right to receive the dividend is established.
f. Loan processing fee is accounted for upfront when it becomes due.
g. Project appraisal/structuring fee is accounted for at the completion of the agreed service.
h. Arranger fee is accounted for as income when a significant portion of the arrangement/syndicationis completed.
i. Commission received on guarantees issued is amortised on a straight-line basis over the period ofthe guarantee.
j. All other fees are accounted for as and when they become due.
k. Net income arising from sell-down/securitisation of loan assets prior to February 1, 2006 has beenrecognised upfront as interest income. With effect from February 1, 2006, net income arising fromsecuritisation of loan assets is amortised over the life of securities issued or to be issued by thespecial purpose vehicle/special purpose entity to which the assets are sold. Net income arising fromsale of loan assets through direct assignment with recourse obligation is amortised over the life ofunderlying assets sold and net income from sale of loan assets through direct assignment, withoutany recourse obligation, is recognised at the time of sale.
F-167

2. Investments
Investments are accounted for in accordance with the extant RBI guidelines on investment classificationand valuation as given below.
a. All investments are classified into ‘Held to Maturity’, ‘Available for Sale’ and ‘Held for Trading’.Reclassifications, if any, in any category are accounted for as per RBI guidelines. Under eachclassification, the investments are further categorised as (a) government securities, (b) otherapproved securities, (c) shares, (d) bonds and debentures, (e) subsidiaries and joint ventures and(f) others.
b. ‘Held to Maturity’ securities are carried at their acquisition cost or at amortised cost, if acquiredat a premium over the face value. Any premium over the face value of the fixed rate and floatingrate securities acquired is amortised over the remaining period to maturity on a constant yield basisand straight line basis respectively.
c. ‘Available for Sale’ and ‘Held for Trading’ securities are valued periodically as per RBI guidelines.Any premium over the face value of the investments in government securities, classified as‘Available for Sale’, is amortised over the remaining period to maturity on constant yield basis.Quoted investments are valued based on the trades/quotes on the recognised stock exchanges,subsidiary general ledger account transactions, price list of RBI or prices declared by PrimaryDealers Association of India jointly with Fixed Income Money Market and DerivativesAssociation, periodically.
The market/fair value of unquoted government securities which are in the nature of “SLR”securities included in the ‘Available for Sale’ and ‘Held for Trading’ categories is as per the ratespublished by Fixed Income Money Market and Derivatives Association. The valuation of otherunquoted fixed income securities wherever linked to the Yield-to-Maturity (“YTM”) rates, iscomputed with a mark-up (reflecting associated credit risk) over the YTM rates for governmentsecurities published by Fixed Income Money Market and Derivatives Association.
Unquoted equity shares are valued at the break-up value, if the latest balance sheet is available, orat Re. 1, as per RBI guidelines.
Securities are valued scrip-wise and depreciation/appreciation is aggregated for each category. Netappreciation in each category, if any, being unrealised, is ignored, while net depreciation isprovided for.
d. Costs including brokerage and commission pertaining to investments, paid at the time ofacquisition, are charged to the profit and loss account.
e. Equity investments in subsidiaries/joint ventures are categorised as ‘Held to Maturity’ inaccordance with RBI guidelines.
f. Profit on sale of investments in the ‘Held to Maturity’ category is credited to the profit and lossaccount and is thereafter appropriated (net of applicable taxes and statutory reserve requirements)to Capital Reserve. Profit on sale of investments in ‘Available for Sale’ and ‘Held for Trading’categories is credited to profit and loss account.
g. Repurchase and reverse repurchase transactions are accounted for in accordance with the extantRBI guidelines.
h. Broken period interest on debt instruments is treated as a revenue item.
i. At the end of each reporting period, security receipts issued by the asset reconstruction companyare valued in accordance with the guidelines applicable to such instruments, prescribed by RBIfrom time to time. Accordingly, in cases where the cash flows from security receipts issued by theasset reconstruction company are limited to the actual realisation of the financial assets assignedto the instruments in the concerned scheme, the Bank reckons the net asset value obtained fromthe asset reconstruction company from time to time, for valuation of such investments at eachreporting year end.
j. The Bank follows trade date method for accounting of its investments.
F-168

3. Provisions/Write-offs on loans and other credit facilities
a. All credit exposures are classified as per RBI guidelines, into performing and non-performingassets (“NPAs”). Further, NPAs are classified into sub-standard, doubtful and loss assets based onthe criteria stipulated by RBI. In the case of corporate loans, provisions are made for sub-standardand doubtful assets at rates prescribed by RBI. Loss assets and the unsecured portion of doubtfulassets are provided/written off as per the extant RBI guidelines. Provisions on homogeneous retailloans, subject to minimum provisioning requirements of RBI, are assessed at a portfolio level onthe basis of days past due. The Bank holds specific provisions against non-performing loans,general provision against performing loans and floating provisions. The assessment of incrementalspecific provisions is made after taking into consideration all of the above. The specific provisionson retail loans held by the Bank are higher than the minimum regulatory requirements.
b. For restructured/rescheduled assets, provision is made in accordance with the guidelines issued byRBI, which requires a provision equal to the present value of the interest sacrifice to be made atthe time of restructuring.
c. In the case of loan accounts classified as NPAs (other than those subjected to restructuring), theaccount is upgraded to “standard” category if arrears of interest and principal are fully paid by theborrower.
In respect of non-performing loan accounts subjected to restructuring, the account is upgraded tostandard only after the specified period i.e., a period of one year after the date when first paymentof interest or of principal, whichever is earlier, falls due, subject to satisfactory performance of theaccount during the period.
d. Amounts recovered against debts written off in earlier years and provisions no longer considerednecessary in the context of the current status of the borrower are recognised in the profit and lossaccount.
e. In addition to the specific provision on NPAs, the Bank maintains a general provision onperforming loans. The general provision covers the requirements of the RBI guidelines.
f. In addition to the provisions required to be held according to the asset classification status,provisions are held for individual country exposures (other than for home country exposure). Thecountries are categorised into seven risk categories namely insignificant, low, moderate, high, veryhigh, restricted and off-credit and provisioning is made on exposures exceeding 180 days on agraded scale ranging from 0.25% to 100%. For exposures with contractual maturity of less than180 days, 25% of the above provision is required to be held. If the country exposure (net) of theBank in respect of each country does not exceed 1% of the total funded assets, no provision isrequired on such country exposure.
4. Transfer and servicing of assets
The Bank transfers commercial and consumer loans through securitisation transactions. The transferredloans are de-recognised and gains/losses are accounted for only if the Bank surrenders the rights to benefitsspecified in the loan contract. Recourse and servicing obligations are accounted for net of provisions.
In accordance with the RBI guidelines, with effect from February 1, 2006, the Bank accounts for any lossarising from securitisation immediately at the time of sale and the profit/premium arising from securitisationis amortised over the life of the securities issued or to be issued by the special purpose vehicle to which theassets are sold. In the case of loans sold to an asset reconstruction company the gain, if any, is ignored.
F-169

5. Fixed assets and depreciation
Premises and other fixed assets are carried at cost less accumulated depreciation. Cost includes freight,duties, taxes and incidental expenses related to the acquisition and installation of the asset. Depreciation ischarged over the estimated useful life of a fixed asset on a straight-line basis. The rates of depreciation forfixed assets, which are not lower than the rates prescribed in Schedule XIV of the Companies Act, 1956, aregiven below:
Asset Depreciation Rate
Premises owned by the Bank..................................... 1.63%Improvements to leasehold premises ......................... 1.63% or over the lease period, whichever is higherATMs.......................................................................... 12.50%Plant and machinery like air conditioners,photo-copying machines, etc...................................... 10.00%Computers .................................................................. 33.33%Card acceptance devices ............................................ 12.50%Furniture and fixtures................................................. 15.00%Motor vehicles ........................................................... 20.00%Others (including Software and system developmentexpenses) .................................................................... 25.00%
a) Depreciation on leased assets and leasehold improvements is recognised on a straight-line basisusing rates determined with reference to the primary period of lease or rates specified in ScheduleXIV to the Companies Act, 1956, whichever is higher.
b) Assets purchased/sold during the year are depreciated on a pro-rata basis for the actual number ofdays the asset has been put to use.
c) Items costing upto Rs. 5,000/- are depreciated fully over a period of 12 months from the date ofpurchase.
6. Transactions involving foreign exchange
Foreign currency income and expenditure items of domestic operations are translated at the exchangerates prevailing on the date of the transaction. Income and expenditure items of integral foreign operations(representative offices) are translated at weekly average closing rates, and income and expenditure ofnon-integral foreign operations (foreign branches and offshore banking units) are translated at quarterlyaverage closing rates.
Monetary foreign currency assets and liabilities of domestic and integral foreign operations aretranslated at closing exchange rates notified by Foreign Exchange Dealers’ Association of India at the balancesheet date and the resulting profits/losses are included in the profit and loss account.
Both monetary and non-monetary foreign currency assets and liabilities of non-integral foreignoperations are translated at closing exchange rates notified by Foreign Exchange Dealers’ Association of Indiaat the balance sheet date and the resulting profits/losses from exchange differences are accumulated in theforeign currency translation reserve until the disposal of the net investment in the non-integral foreignoperations.
The premium or discount arising on inception of forward exchange contracts that are entered into toestablish the amount of reporting currency required or available at the settlement date of a transaction isamortised over the life of the contract. All other outstanding forward exchange contracts are revalued at theexchange rates notified by Foreign Exchange Dealers’ Association of India for specified maturities and atinterpolated rates for contracts of interim maturities. The resultant gains or losses are recognised in the profitand loss account.
Contingent liabilities on account of guarantees, endorsements and other obligations denominated inforeign currencies are disclosed at the closing exchange rates notified by Foreign Exchange Dealers’Association of India at the balance sheet date.
7. Accounting for derivative contracts
The Bank enters into derivative contracts such as foreign currency options, interest rate and currencyswaps, credit default swaps and cross currency interest rate swaps.
F-170

The swap contracts entered to hedge on-balance sheet assets and liabilities are structured such that theybear an opposite and offsetting impact with the underlying on-balance sheet items. The impact of suchderivative instruments is correlated with the movement of underlying assets and accounted pursuant to theprinciples of hedge accounting. Hedged swaps are accounted for on an accrual basis.
Foreign currency and rupee derivative contracts entered into for trading purposes are marked to marketand the resulting gain or loss (net of provisions, if any) is accounted for in the profit and loss account.
8. Employee Stock Option Scheme (“ESOS”)
The Employees Stock Option Scheme (“the Scheme”) provides for grant of equity shares of the Bankto wholetime directors and employees of the Bank and its subsidiaries. The Scheme provides that employeesare granted an option to acquire equity shares of the Bank that vests in a graded manner. The options may beexercised within a specified period. The Bank follows the intrinsic value method to account for its stock-basedemployees compensation plans. Compensation cost is measured as the excess, if any, of the fair market priceof the underlying stock over the exercise price on the grant date. The fair market price is the latest closingprice, immediately prior to the date of the Board of Directors meeting in which the options are granted, on thestock exchange on which the shares of the Bank are listed. If the shares are listed on more than one stockexchange, then the stock exchange where there is highest trading volume on the said date is considered.
Since the exercise price of the Bank’s stock options are equal to fair market price on the grant date, thereis no compensation cost under the intrinsic value method.
The Finance Act, 2007 introduced Fringe Benefit Tax (“FBT”) on employee stock options. The FBTliability crystallises on the date of exercise of stock options by employees and is computed based on thedifference between fair market value on date of vesting and the exercise price. FBT is recovered fromemployees as per the Scheme.
9. Staff Retirement Benefits
Gratuity
ICICI Bank pays gratuity to employees who retire or resign after a minimum period of five years ofcontinuous service and in case of employees at overseas locations as per the rules in force in the respectivecountries. ICICI Bank makes contributions to four separate gratuity funds, for employees inducted fromerstwhile ICICI Limited (erstwhile ICICI), employees inducted from erstwhile Bank of Madura, employeesinducted from erstwhile The Sangli Bank Limited (erstwhile Sangli Bank) and employees of ICICI Bank otherthan employees inducted from erstwhile ICICI, erstwhile Bank of Madura and erstwhile Sangli Bank.
Separate gratuity funds for employees inducted from erstwhile ICICI, erstwhile Bank of Madura anderstwhile Sangli Bank are managed by ICICI Prudential Life Insurance Company Limited. The gratuity fundfor employees of ICICI Bank, other than employees inducted from erstwhile ICICI and erstwhile Bank ofMadura and erstwhile Sangli Bank is administered by Life Insurance Corporation of India and ICICIPrudential Life Insurance Company Limited.
Actuarial valuation of the gratuity liability for all the above funds is determined by an actuary appointedby the Bank. In accordance with the gratuity funds’ rules, actuarial valuation of gratuity liability is calculatedbased on certain assumptions regarding rate of interest, salary growth, mortality and staff attrition as per theprojected unit credit method.
Superannuation Fund
ICICI Bank contributes 15.0% of the total annual basic salary of each employee to a superannuation fundfor ICICI Bank employees. The employee gets an option on retirement or resignation to commute one-thirdof the total credit balance in his/her account and receive a monthly pension based on the remaining balance.In the event of death of an employee, his or her beneficiary receives the remaining accumulated balance. ICICIBank also gives an option to its employees, allowing them to receive the amount contributed by ICICI Bankalong with their monthly salary during their employment.
Upto March 31, 2005, the superannuation fund was administered solely by Life Insurance Corporationof India. Subsequent to March 31, 2005, both Life Insurance Corporation of India and ICICI Prudential LifeInsurance Company Limited are administering the fund. Employees had the option to retain the existingbalance with Life Insurance Corporation of India or seek a transfer to ICICI Prudential Life InsuranceCompany Limited.
F-171

Pension
The Bank provides for pension, a deferred retirement plan covering certain employees of erstwhile Bankof Madura and certain employees of erstwhile Sangli Bank. The plan provides for a pension payment on amonthly basis to these employees on their retirement based on the respective employee’s salary and years ofemployment with the Bank. For erstwhile Bank of Madura and erstwhile Sangli Bank employees in service,separate pension funds are managed in-house and the liability is funded as per actuarial valuation. The pensionpayments to retired employees of erstwhile Bank of Madura and erstwhile Sangli Bank are being administeredby ICICI Prudential Life Insurance Company Limited, for whom the Bank has purchased master annuitypolicies. Employees covered by the pension plan are not eligible for benefits under the provident fund plan,a defined contribution plan.
Provident Fund
ICICI Bank is statutorily required to maintain a provident fund as a part of retirement benefits to itsemployees. There are separate provident funds for employees inducted from erstwhile Bank of Madura anderstwhile Sangli Bank (other than those employees who have opted for pension), and for other employees ofICICI Bank. In-house trustees manage these funds. Each employee contributes 12.0% of his or her basic salary(10.0% for certain staff of erstwhile Bank of Madura and erstwhile Sangli Bank) and ICICI Bank contributesan equal amount to the funds. The funds are invested according to rules prescribed by the Government of India.
Leave Encashment
The Bank provides for leave encashment benefit, which is a defined benefit scheme, based on actuarialvaluation as at the balance sheet date conducted by an independent actuary.
10. Income Taxes
Income tax expense is the aggregate amount of current tax, deferred tax and fringe benefit tax borne bythe Bank. The income tax provision is determined in accordance with the provisions of the Income Tax Act,1961. Deferred tax adjustments comprise of changes in the deferred tax assets or liabilities during the period.
Deferred tax assets and liabilities are recognised on a prudent basis for the future tax consequences oftiming differences arising between the carrying values of assets and liabilities and their respective tax basis,and carry forward losses. Deferred tax assets and liabilities are measured using tax rates and tax laws that havebeen enacted or substantively enacted at the balance sheet date. The impact of changes in deferred tax assetsand liabilities is recognised in the profit and loss account.
Deferred tax assets are recognised and reassessed at each reporting date, based upon management’sjudgement as to whether their realisation is considered as reasonably certain.
11. Impairment of Assets
Fixed assets are reviewed for impairment whenever events or changes in circumstances indicate that thecarrying amount of an asset may not be recoverable. Recoverability of assets to be held and used is measuredby a comparison of the carrying amount of an asset with future net discounted cash flows expected to begenerated by the asset. If such assets are considered to be impaired, the impairment is recognised by debitingthe profit and loss account and is measured as the amount by which the carrying amount of the assets exceedsthe fair value of the assets.
12. Provisions, contingent liabilities and contingent assets
The Bank estimates the probability of any loss that might be incurred on outcome of contingencies onthe basis of information available up to the date on which the financial statements are prepared. A provisionis recognised when an enterprise has a present obligation as a result of a past event and it is probable that anoutflow of resources will be required to settle the obligation, in respect of which a reliable estimate can bemade. Provisions are determined based on management estimates required to settle the obligation at thebalance sheet date, supplemented by experience of similar transactions. These are reviewed at each balancesheet date and adjusted to reflect the current management estimates. In cases where the available informationindicates that the loss on the contingency is reasonably possible but the amount of loss cannot be reasonablyestimated, a disclosure to this effect is made in the financial statements. In case of remote possibility neitherprovision nor disclosure is made in the financial statements. The Bank does not account for or disclosecontingent assets, if any.
F-172
13. Earnings per share (“EPS”)
Basic earnings per share is calculated by dividing the net profit or loss for the year attributable to equityshareholders by the weighted average number of equity shares outstanding during the year.
Diluted earnings per share reflect the potential dilution that could occur if contracts to issue equity shareswere exercised or converted during the period. Diluted earnings per equity share is computed using theweighted average number of equity shares and dilutive potential equity shares outstanding during the period,except where the results are anti-dilutive.
14. Lease transactions
Lease payments for assets taken on operating lease are recognised as an expense in the profit and lossaccount over the lease term.
15. Cash and cash equivalents
Cash and cash equivalents include cash in hand, balances with RBI, balances with other banks andmoney at call and short notice.
F-173

SCHEDULE 19 — NOTES FORMING PART OF THE ACCOUNTS
The following additional disclosures have been made taking into account the requirements of accountingstandards and Reserve Bank Of India (“RBI”) guidelines in this regard.
1. Merger of the Sangli Bank Limited
The Sangli Bank Limited (Sangli Bank), a banking company incorporated under the Companies Act,1956 and licensed by RBI under the Banking Regulation Act, 1949 was amalgamated with ICICI Bank witheffect from April 19, 2007 in terms of the Scheme of Amalgamation (the Scheme) approved by RBI vide itsorder DBOD No. PSBD 10268/16.01.128/2006-07 dated April 18, 2007 under section 44A(4) of the BankingRegulation Act, 1949. The consideration for the amalgamation was 100 equity shares of ICICI Bank of the facevalue Rs. 10 each fully paid-up for every 925 equity shares of Rs. 10 each of Sangli Bank. Accordingly onMay 28, 2007, ICICI Bank allotted 3,455,008 equity shares of Rs. 10 each to the shareholders of Sangli Bank.
As per the Scheme, the entire undertaking of Sangli Bank including all its assets and liabilities stoodtransferred/deemed to be transferred to and vested in the Bank.
The amalgamation has been accounted as per the scheme in accordance with the purchase method ofaccounting as per Accounting Standard 14 (AS-14) “Accounting for Amalgamations” issued by the Instituteof Chartered Accountants of India. Accordingly the assets and liabilities of Sangli Bank have been accountedat the values at which they were appearing in the books of Sangli Bank as on April 18, 2007 and provisionswere made for the difference between the book values appearing in the books of Sangli Bank and the fair valueas determined by ICICI Bank.
In the books of ICICI Bank, an “Amalgamation Expenses Provision Account” was credited by an amountdetermined for the expenses and costs of the Scheme arising as a direct consequence on account of anychanges in the business or operation of Sangli Bank proposed or considered necessary by the Board ofDirectors of ICICI Bank (including but not limited to rationalisation, upgradation and enhancement of humanresources and expenses relating to modifying signage, modifying stationery, branding, changing systems andnetwork, communication including media costs, impairments of technology and fixed assets, conductinggeneral meetings, payments of listing fees and other statutory and regulatory charges, travel in relation to theconsolidation contemplated in the Scheme, valuation, due diligence, investment banking expenses and chargesrelating to preparation of the Scheme, consultations in relation to the consolidation contemplated in theScheme and training), and other extraordinary expenses on integration and consolidation under the Scheme,to be incurred by the Bank and the balance in such account has been debited to the securities premium account.
Accordingly, the excess of the paid-up value of the shares issued over the fair value of the net assetsacquired (including reserves) of Rs. 3,259.5 million and amalgamation expenses of Rs. 222.7 million havebeen netted off from the securities premium account. The computation of this amount is detailed in the tablebelow:
Particulars Amount Amount
(Rupees in million)
3,455,008 equity shares of face value of Rs. 10 each ..................................... 34.6Less:Net assets of Sangli Bank at April 18, 2007.................................................... (2,500.7)Fair value adjustments...................................................................................... (517.7)Reserves taken over on amalgamation ............................................................. (206.5) (3,224.9)Excess of the paid-up value of the shares issued over the fair value of thenet assets acquired............................................................................................ (3,259.5)Amalgamation expenses ................................................................................... (222.7)
As per Accounting Standard — 14 (AS-14) on “Accounting for Amalgamations” issued by the Instituteof Chartered Accountants of India, under the ‘purchase method’ of accounting for amalgamation, the identityof reserves of the amalgamating entity is not required to be preserved in the books of ICICI Bank. However,the balance in Statutory Reserve Account of Sangli Bank at April 18, 2007 has been added to the StatutoryReserves of ICICI Bank. As a result, the balance in Statutory Reserve is higher to the extent of Rs. 206.5million and the excess of the paid-up value of shares issued over the fair value of the net assets acquired islower to that extent.
F-174

2. Equity issue
The Bank made a follow on public offering of equity shares (including green shoe option) and AmericanDepository Share’s (“ADSs”) vide its prospectus dated June 26, 2007 and June 23, 2007 respectivelyaggregating to Rs. 199,673.5 million. The expenses of the issue amounting to Rs. 1,846.6 million have beenwritten-off against securities premium account as per the objects of the issue. The details of the equity sharesand ADSs issued are given in the table below:
Details
No. of
equity shares
Amount of
securities premium
Aggregate
proceeds
(Rupees in million, except number of shares)
Equity shares of Rs. 10 each at a premium ofRs. 930 per share ...................................................... 61,923,519 57,588.9 58,208.1Equity shares of Rs. 10 each at a premium ofRs. 880 per share ...................................................... 32,912,238 28,962.7 29,291.9Equity shares of Rs. 10 each at a premium ofRs. 930 per share issued under green shoe option .... 13,762,869 12,799.5 12,937.149,949,238 American Depository Share (“ADSs”) ata price of US$ 49.25 per ADSs 1,2,3.......................... 99,898,476 98,237.4 99,236.4
Total ........................................................................... 208,497,102 197,588.5 199,673.5
1. Includes 6,497,462 ADSs issued on exercise of the green shoe option.2. 1 ADS = 2 Equity shares of Rs. 10 each3. Converted at US$ 1 = Rs. 40.34, being noon buying rate on the date of allotment.
3. Capital adequacy ratio
The Bank is subject to the capital adequacy norms stipulated by the Reserve Bank of India (‘RBI’). Asper the earlier applicable capital adequacy guidelines (Basel I), the Bank was required to maintain a minimumratio of total capital to risk adjusted assets and off-balance sheet items of 9.0%, at least half of which mustbe Tier I capital. On April 27, 2007, the Reserve Bank of India issued Prudential Guidelines on CapitalAdequacy and Market Discipline — Implementation of the New Capital Adequacy Framework, which areapplicable to all Indian banks having operational presence outside India from March 31, 2008. Under the newguidelines (Basel II), which are now applicable to the Bank, the Bank is required to maintain a minimum ratioof total capital to risk adjusted assets of 9.0%, with a minimum Tier I capital ratio of 6.0%.
In order to comply with prudential floor prescribed by RBI under the new guidelines (100% of minimumcapital requirement computed as per Basel I framework as on March 31, 2008), the Bank has computed andreported the capital adequacy position as per Basel I and Basel II norms. Since the capital charge as per thenew capital adequacy framework (Basel II) is higher than the Basel I framework, the Bank has maintainedcapital as per Basel II norms.
As per Basel I framework
As per Basel II
framework
As on
March 31, 2008
As on
March 31, 2007
As on
March 31, 2008
(Rupees in million)
Tier I capital............................................................... 381,340.1 215,033.4 421,724.0(of which Lower Tier I).............................................. 26,573.4 22,577.9 26,573.4Tier II capital ............................................................. 121,212.1 123,928.5 78,861.0(of which Upper Tier II) ............................................ 24,510.0 20,012.5 24,510.0Total capital................................................................ 502,552.2 338,961.9 500,585.0Total risk weighted assets .......................................... 3,367,547.0 2,899,930.6 3,584,566.2CRAR (%).................................................................. 14.92% 11.69% 13.97%CRAR - Tier I capital (%) ......................................... 11.32% 7.42% 11.76%CRAR - Tier II capital (%)........................................ 3.60% 4.27% 2.20%Amount of subordinated debt raised as Tier Icapital/Tier II capital during the year ........................ 22,350.0 64,903.5 22,350.0
F-175

4. Business/information ratios
The business/information ratios for the year ended March 31, 2008 and March 31, 2007 are given in thetable below:
Year ended
March 31, 2008
Year ended
March 31, 2007
(i) Interest income to working funds1, 4 ....................................................... 8.29% 7.69%(ii) Non-interest income to working funds1, 4 ............................................... 2.37% 2.42%(iii) Operating profit to working funds1, 4 ...................................................... 2.14% 2.05%(iv) Return on assets2 ..................................................................................... 1.12% 1.09%(v) Profit per employee (Rs. in million) ....................................................... 1.0 0.9(vi) Business per employee (average deposits plus average
advances)3 (Rs. in million)...................................................................... 100.8 102.7
1. For the purpose of computing the ratios, working funds represent the average of total assets as reported to RBI underSection 27 of the Banking Regulation Act, 1949.
2. For the purpose of computing the ratio, assets represent average total assets as reported to RBI in Form X underSection 27 of the Banking Regulation Act, 1949.
3. For the purpose of computing the ratio, deposits and advances are the total deposits and total advances as reportedto RBI in Form A under Section 27 of the Banking Regulation Act, 1949. The average deposits and the averageadvances represent the simple average of the figures reported in Form A to RBI under Section 27 of the BankingRegulation Act, 1949.
4. Previous year figures have been regrouped/re-classified to compare with current year classification.
5. Information about business and geographical segments
Business segments for the year ended March 31, 2008
Pursuant to the guidelines issued by RBI on Accounting Standard- 17 (Segment Reporting)-Enhancement of Disclosures dated April 18, 2007, effective from period ending March 31, 2008, the followingbusiness segments have been reported.
• Retail Banking includes exposures which satisfy the four criteria of orientation, product,granularity and low value of individual exposures for retail exposures laid down in BaselCommittee on Banking Supervision document “International Convergence of CapitalMeasurement and Capital Standards: A Revised Framework”.
• Wholesale Banking includes all advances to trusts, partnership firms, companies and statutorybodies, which are not included under the Retail Banking.
• Treasury includes the entire investment portfolio of the Bank.
• Other Banking includes hire purchase and leasing operations and also includes gain/loss on sale ofbanking & non-banking assets and other items not attributable to any particular business segment.
Income, expenses, assets and liabilities are either specifically identified with individual segments or areallocated to segments on a systematic basis.
All liabilities are transfer priced to a central treasury unit, which pools all funds and lends to the businessunits at appropriate rates based on the relevant maturity of assets being funded after adjusting for regulatoryreserve requirements. While the transfer pricing methodology followed for the period ending March 31, 2007was based on similar principles, the same has been refined further in the current year.
F-176

Pursuant to the reorganisation of the business segments in line with the aforementioned RBI guidelines,the business segments are not comparable to the segments reported for the period ended March 31, 2007.
The business segment results on this basis are given below:
For the year ended March 31, 2008
Particulars
Retail
Banking
Wholesale
Banking
Treasury/
Investment
Banking
Other
Banking
Business Total
(Rupees in million)
1 Revenue.................................... 244,185.4 249,493.5 290,982.6 2,749.2 787,410.72 Less: Inter-segment revenue..... 391,419.63 Total revenue (1) - (2) ............. 395,991.14 Segment results ........................ 10,838.4 36,240.6 5,159.2 252.1 52,490.35 Unallocated expenses ............... 1,929.36 Income tax expenses (net of
deferred tax credit)................... 8,983.7
7 Net Profit (4) - (5) - (6)........... 41,577.3
8 Segment assets ......................... 1,112,510.1 1,263,992.0 1,540,852.6 27,053.4 3,944,408.19 Unallocated assets1................... 53,542.7
10 Total assets (8) + (9)................ 3,997,950.8
11 Segment liabilities .................. 1,152,965.5 1,378,224.6 1,442,104.82 20,360.4 3,993,655.312 Unallocated liabilities............... 4,295.5
13 Total liabilities (11) + (12) ...... 3,997,950.8
14 Capital expenditure .................. 6,430.8 1,364.6 8.5 504.5 8,308.415 Depreciation ............................. 2,836.8 889.1 5.3 2,052.3 5,783.5
1. Includes tax paid in advance/tax deducted at source (net) and deferred tax asset (net).
2. Includes share capital and reserves and surplus.
Business segments for the year ended March 31, 2007
For the year ended March 31, 2007 the Bank reported the following business segments:
• Consumer and Commercial Banking comprising of the retail and corporate banking operations ofthe Bank.
• Investment Banking comprising the treasury operations of the Bank.
Inter-segment transactions were generally based on transfer pricing measures as determined bymanagement. Income, expenses, assets and liabilities were either specifically identified with individualsegments or are allocated to segments on a systematic basis.
F-177
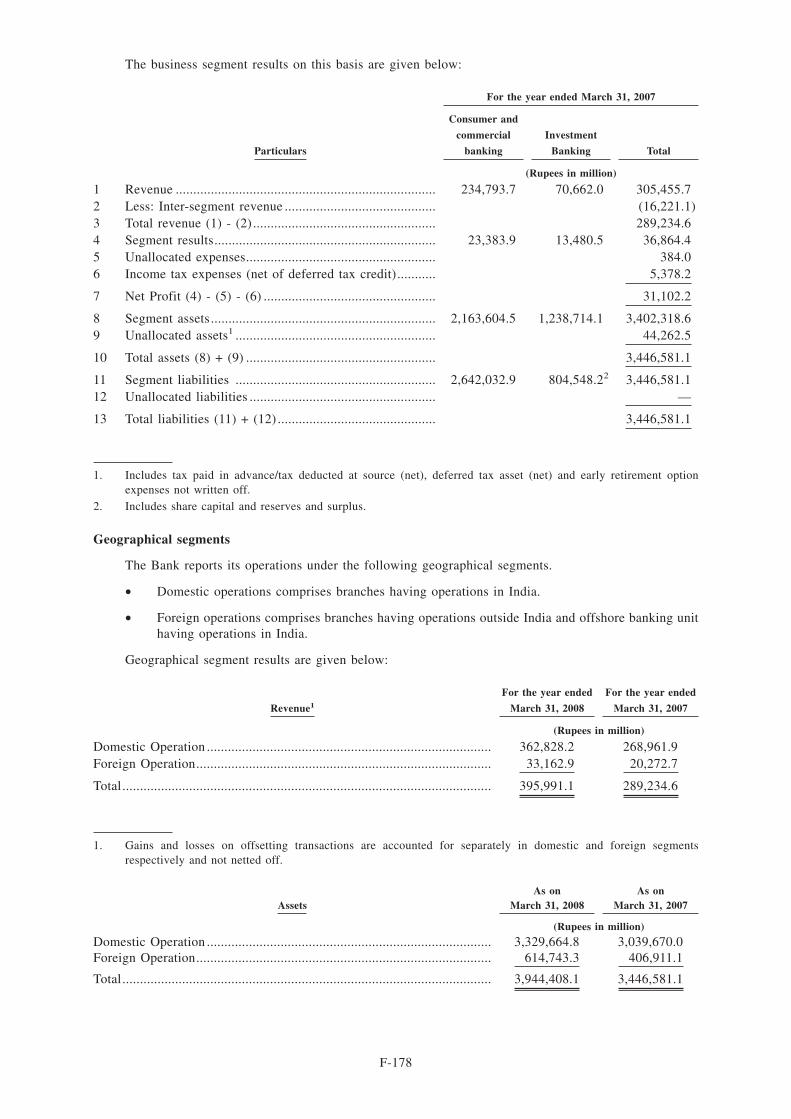
The business segment results on this basis are given below:
For the year ended March 31, 2007
Particulars
Consumer and
commercial
banking
Investment
Banking Total
(Rupees in million)
1 Revenue .......................................................................... 234,793.7 70,662.0 305,455.72 Less: Inter-segment revenue ........................................... (16,221.1)3 Total revenue (1) - (2) .................................................... 289,234.64 Segment results............................................................... 23,383.9 13,480.5 36,864.45 Unallocated expenses...................................................... 384.06 Income tax expenses (net of deferred tax credit)........... 5,378.2
7 Net Profit (4) - (5) - (6) ................................................. 31,102.2
8 Segment assets................................................................ 2,163,604.5 1,238,714.1 3,402,318.69 Unallocated assets1 ......................................................... 44,262.5
10 Total assets (8) + (9) ...................................................... 3,446,581.1
11 Segment liabilities ......................................................... 2,642,032.9 804,548.22 3,446,581.112 Unallocated liabilities ..................................................... —
13 Total liabilities (11) + (12) ............................................. 3,446,581.1
1. Includes tax paid in advance/tax deducted at source (net), deferred tax asset (net) and early retirement optionexpenses not written off.
2. Includes share capital and reserves and surplus.
Geographical segments
The Bank reports its operations under the following geographical segments.
• Domestic operations comprises branches having operations in India.
• Foreign operations comprises branches having operations outside India and offshore banking unithaving operations in India.
Geographical segment results are given below:
Revenue1
For the year ended
March 31, 2008
For the year ended
March 31, 2007
(Rupees in million)
Domestic Operation ................................................................................. 362,828.2 268,961.9Foreign Operation.................................................................................... 33,162.9 20,272.7
Total......................................................................................................... 395,991.1 289,234.6
1. Gains and losses on offsetting transactions are accounted for separately in domestic and foreign segmentsrespectively and not netted off.
AssetsAs on
March 31, 2008As on
March 31, 2007
(Rupees in million)
Domestic Operation ................................................................................. 3,329,664.8 3,039,670.0Foreign Operation.................................................................................... 614,743.3 406,911.1
Total......................................................................................................... 3,944,408.1 3,446,581.1
F-178

6. Earnings per share
Basic and diluted earnings per equity share are computed in accordance with Accounting Standard 20— “Earnings per Share”. Basic earnings per share is computed by dividing net profit after tax by the weightedaverage number of equity shares outstanding during the year. The diluted earnings per share is computed usingthe weighted average number of equity shares and dilutive potential equity shares outstanding during the year.
The computation of earnings per share is given below:
Year ended
March 31, 2008
Year ended
March 31, 2007
(Rupees in million, except per share data)
BasicWeighted average no. of equity shares outstanding ....................... 1,055,591,068 892,820,768Net profit ........................................................................................ 41,577.3 31,102.2Basic earnings per share (Rs.) ...................................................... 39.39 34.84DilutedWeighted average no. of equity shares outstanding ....................... 1,062,103,167 897,743,476Net profit ........................................................................................ 41,577.3 31,102.2Diluted earnings per share (Rs.) ................................................... 39.15 34.64Nominal value per share (Rs.) ....................................................... 10.00 10.00
The dilutive impact is due to options granted to employees by the Bank.
7. Maturity pattern
• In compiling the information of maturity pattern (refer 7 (a) and (b) below), certain estimates andassumptions have been made by the management.
• Assets and liabilities in foreign currency exclude off-balance sheet assets and liabilities.
a) The maturity pattern of assets and liabilities of the Bank as on March 31, 2008 is given below:
Maturity buckets
Loans &
Advances1
Investment
securities1 Deposits1 Borrowings1
Total foreign
currency
assets
Total foreign
currency
liabilities
(Rupees in million)
1 to 14 days................ 93,299.9 144,138.8 150,415.1 18,949.7 67,356.4 49,954.815 to 28 days .............. 27,857.4 102,926.6 105,105.3 5,407.0 11,229.6 12,310.029 days to 3 months ... 155,107.3 110,681.3 377,315.6 37,476.4 64,606.8 60,017.73 to 6 months ............. 156,415.2 106,274.8 353,452.6 98,782.1 31,405.6 82,855.86 months to 1 year ..... 260,207.4 171,675.0 596,599.9 112,847.4 61,401.7 121,563.81 to 3 years................. 773,243.4 208,115.1 812,119.4 176,727.5 66,300.5 143,269.23 to 5 years................. 331,808.1 46,577.8 34,047.3 176,974.8 125,974.1 170,063.8Above 5 years............. 458,222.1 224,154.0 15,255.3 29,319.4 229,717.0 74,283.0
Total ............................ 2,256,160.8 1,114,543.4 2,444,310.5 656,484.3 657,991.7 714,318.1
1. Includes foreign currency balances.
F-179

b) The maturity pattern of assets and liabilities of the Bank as on March 31, 2007 is given below:
Maturity Buckets
Loans &
Advances1
Investment
securities1 Deposits1 Borrowings1
Total foreign
currency
assets
Total foreign
currency
liabilities
(Rupees in million)
1 to 14 days................ 92,885.1 45,292.9 223,743.2 9,453.3 94,285.0 47,662.515 to 28 days .............. 24,562.0 97,922.7 104,126.2 5,694.1 12,626.0 10,878.729 days to 3 months ... 96,063.1 97,022.5 341,989.9 44,171.4 34,763.7 54,592.93 to 6 months ............. 128,770.4 85,208.4 322,724.8 70,423.4 28,473.7 56,766.26 months to 1 year ..... 208,006.2 173,803.9 594,972.4 82,016.6 92,005.7 83,910.91 to 3 years................. 763,016.1 156,450.4 674,036.1 158,216.9 56,812.0 137,945.83 to 5 years................. 251,094.3 68,280.5 31,354.7 122,375.6 68,987.5 103,222.6Above 5 years............. 394,258.8 188,597.1 12,154.6 20,209.0 105,876.0 71,292.1
Total ............................ 1,958,656.0 912,578.4 2,305,101.9 512,560.3 493,829.6 566,271.7
1. Includes foreign currency balances.
8. Related party transactions
The Bank has transactions with its related parties comprising of subsidiaries, associates/joint ventures/other related entities and key management personnel.
Subsidiaries
ICICI Venture Funds Management Company Limited, ICICI Securities Primary Dealership Limited,ICICI Securities Limited, ICICI International Limited, ICICI Trusteeship Services Limited, ICICI HomeFinance Company Limited, ICICI Investment Management Company Limited, ICICI Securities Holdings Inc.,ICICI Securities Inc., ICICI Bank UK PLC, ICICI Bank Canada, ICICI Prudential Life Insurance CompanyLimited1, ICICI Lombard General Insurance Company Limited1, ICICI Prudential Asset ManagementCompany Limited1, ICICI Prudential Trust Limited1, ICICI Bank Eurasia Limited Liability Company andICICI Wealth Management Inc.
1. Jointly controlled entities.
Associates/Joint Ventures/other related entities
ICICI Equity Fund1, ICICI Eco-net Internet and Technology Fund1, ICICI Emerging Sectors Fund1,ICICI Strategic Investments Fund1, ICICI Kinfra Limited1, 2, ICICI West Bengal Infrastructure DevelopmentCorporation Limited1, 2, ICICI Property Trust, Financial Information Network and Operations Limited2, TCW/ICICI Investment Partners LLC, TSI Ventures (India) Private Limited, I-Process Services (India) PrivateLimited2, I-Solutions Providers (India) Private Limited2, NIIT Institute Of Finance, Banking And InsuranceTraining Limited2, ICICI Venture Value Fund2, Comm Trade Services Limited2, Loyalty Solutions & ResearchLimited2, Café Network Limited2, Traveljini.com Limited2 and Firstsource Solutions Limited2(Bank’s holdingis 24.97% as on March 31, 2008).
1. Entities consolidated under Accounting Standard-21 (AS-21) on “Consolidated Financial Statements”.
2. With respect to entities, which have been identified as related parties from the financial year ended March 31, 2008,previous year’s comparative figures have not been reported.
F-180

The following are the significant transactions between the Bank and its related parties.
Insurance services
During the year ended March 31, 2008, the Bank paid insurance premium to insurance subsidiariesamounting to Rs. 1,065.3 million (March 31, 2007: Rs. 1,191.1 million). During the year ended March 31,2008, the Bank received claims from insurance subsidiaries amounting to Rs. 713.9 million (March 31, 2007:Rs. 725.4 million).
Fees and commission
During the year ended March 31, 2008, the Bank received fees from its subsidiaries amounting to Rs.5,748.7 million (March 31, 2007: Rs. 4,427.2 million) and Rs. 72.5 million (March 31, 2007: Rs. Nil) fromits associates/joint ventures/other related entities. During the year ended March 31, 2008, the Bank receivedcommission from its subsidiaries of Rs. 9.3 million (March 31, 2007: Rs. 10.7 million) and Rs. 7.4 million(March 31, 2007: Rs. Nil) from its associates/joint ventures/other related entities on account of guarantees andletters of credit issued.
Lease of premises and facilities
During the year ended March 31, 2008, the Bank charged an aggregate amount of Rs. 982.8 million fromits subsidiaries (March 31, 2007: Rs. 711.5 million) and Rs. 3.9 million (March 31, 2007: Rs. Nil) from itsassociates/joint ventures/other related entities for lease of premises, facilities and other administrative costs.
Sale of housing loan portfolio
During the year ended March 31, 2008, the Bank sold housing loan portfolio to its subsidiary amountingto Rs. 6,231.4 million (March 31, 2007: Rs. 13,171.4 million).
Secondment of employees
During the year ended March 31, 2008, the Bank received Rs. 302.8 million (March 31, 2007: Rs. 136.3million) from its subsidiaries and Rs. 1.8 million (March 31, 2007: Rs. Nil) from its associates/joint ventures/other related entities for secondment of employees.
Purchase of investments
During the year ended March 31, 2008, the Bank purchased certain investments from its subsidiariesamounting to Rs. 7,934.2 million (March 31, 2007: Rs. 14,186.8 million) and from its associates/jointventures/other related entities amounting to Rs. Nil (March 31, 2007: Rs. 944.7 million). During the yearended March 31, 2008, the Bank invested in the equity and preference shares of its subsidiaries amounting toRs. 43,009.2 million (March 31, 2007: Rs. 13,584.7 million) and in its associates/joint ventures/other relatedentities amounting to Rs. 57.5 million (March 31, 2007: Rs. Nil).
Sale of investments
During the year ended March 31, 2008, the Bank sold certain investments to its subsidiaries amountingto Rs. 15,526.7 million (March 31, 2007: Rs. 8,569.2 million).
Redemption/buyback and conversion of investments
During the year ended March 31, 2008, the Bank received a consideration of Rs. 1.2 million (March 31,2007: Rs. 663.9 million) on account of buyback/capital reduction of equity shares by subsidiaries. Units inassociates/joint ventures/other related entities amounting to Rs. 2,762.4 million (March 31, 2007: Rs. 2,795.9million) were redeemed during the year ended March 31, 2008.
Reimbursement of expenses
During the year ended March 31, 2008, the Bank reimbursed expenses to its subsidiaries amounting toRs. 526.8 million (March 31, 2007: Rs. 2,147.7 million), and to its associates/joint ventures/other relatedentities amounting to Rs. 0.8 million (March 31, 2007: Rs. Nil).
F-181
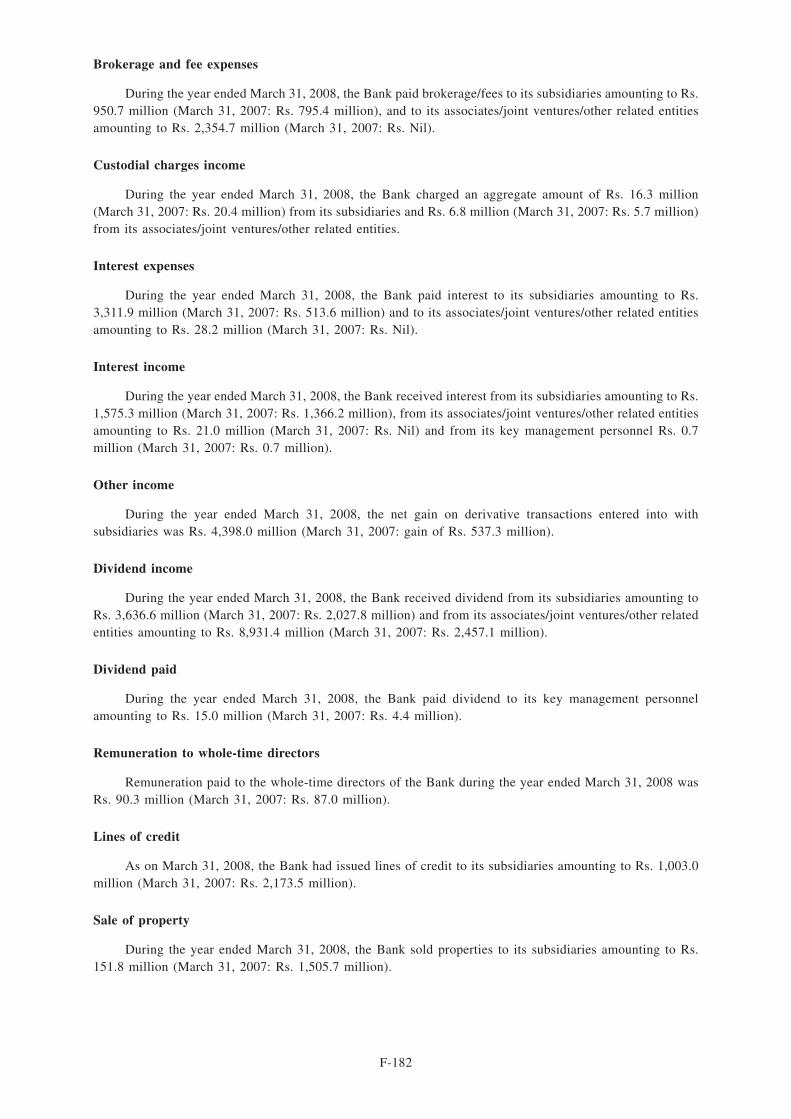
Brokerage and fee expenses
During the year ended March 31, 2008, the Bank paid brokerage/fees to its subsidiaries amounting to Rs.950.7 million (March 31, 2007: Rs. 795.4 million), and to its associates/joint ventures/other related entitiesamounting to Rs. 2,354.7 million (March 31, 2007: Rs. Nil).
Custodial charges income
During the year ended March 31, 2008, the Bank charged an aggregate amount of Rs. 16.3 million(March 31, 2007: Rs. 20.4 million) from its subsidiaries and Rs. 6.8 million (March 31, 2007: Rs. 5.7 million)from its associates/joint ventures/other related entities.
Interest expenses
During the year ended March 31, 2008, the Bank paid interest to its subsidiaries amounting to Rs.3,311.9 million (March 31, 2007: Rs. 513.6 million) and to its associates/joint ventures/other related entitiesamounting to Rs. 28.2 million (March 31, 2007: Rs. Nil).
Interest income
During the year ended March 31, 2008, the Bank received interest from its subsidiaries amounting to Rs.1,575.3 million (March 31, 2007: Rs. 1,366.2 million), from its associates/joint ventures/other related entitiesamounting to Rs. 21.0 million (March 31, 2007: Rs. Nil) and from its key management personnel Rs. 0.7million (March 31, 2007: Rs. 0.7 million).
Other income
During the year ended March 31, 2008, the net gain on derivative transactions entered into withsubsidiaries was Rs. 4,398.0 million (March 31, 2007: gain of Rs. 537.3 million).
Dividend income
During the year ended March 31, 2008, the Bank received dividend from its subsidiaries amounting toRs. 3,636.6 million (March 31, 2007: Rs. 2,027.8 million) and from its associates/joint ventures/other relatedentities amounting to Rs. 8,931.4 million (March 31, 2007: Rs. 2,457.1 million).
Dividend paid
During the year ended March 31, 2008, the Bank paid dividend to its key management personnelamounting to Rs. 15.0 million (March 31, 2007: Rs. 4.4 million).
Remuneration to whole-time directors
Remuneration paid to the whole-time directors of the Bank during the year ended March 31, 2008 wasRs. 90.3 million (March 31, 2007: Rs. 87.0 million).
Lines of credit
As on March 31, 2008, the Bank had issued lines of credit to its subsidiaries amounting to Rs. 1,003.0million (March 31, 2007: Rs. 2,173.5 million).
Sale of property
During the year ended March 31, 2008, the Bank sold properties to its subsidiaries amounting to Rs.151.8 million (March 31, 2007: Rs. 1,505.7 million).
F-182

Letters of Comfort
The Bank has issued letters of comfort on behalf of its foreign subsidiaries namely, ICICI Bank UK PLCand ICICI Bank Canada. The details of the same and their assessed financial impact are given below:
On behalf of To Purpose
ICICI Bank UK PLC ............... Financial Services Authority, UK(“FSA”)
To financially support ICICI Bank UKPLC to ensure that it meets all of itsfinancial obligations as they fall due.
ICICI Bank Canada.................. Office of the Superintendent ofFinancial Institutions, Canada(“OSFI”)
To infuse additional capital shouldICICI Bank Canada’s capital fall belowthe minimum requirement and provideICICI Bank Canada ongoing financial,managerial and operational support.
ICICI Bank Canada.................. Canada Deposit InsuranceCorporation (“CDIC”)
To comply with the Bank Act and theCDIC regulations or by-lawsthereunder and to indemnify CDICagainst all losses, damages, reasonablecosts and expenses arising from failureof ICICI Bank Canada in performingthe same.
As per the assessment done, the financial impact of the above letters issued to overseas regulators is Nilas at March 31, 2008.
In addition to the above, the Bank has also issued letters of comfort in the nature of awareness on behalfof banking and non-banking subsidiaries in respect of their borrowings made or proposed to be made and forother incidental business purposes. As they are in the nature of factual statements or confirmation of facts, theydo not create any financial impact on the Bank.
Related party balances
The balances payable to/receivable from subsidiaries/joint ventures/associates/other related entities/keymanagement personnel included in the balance sheet as on March 31, 2008 are given below:
Items/Related party Subsidiaries
Associates/joint
ventures/other
related entities
Key
Management
Personnel
Relatives
of Key
Management
Personnel Total
(Rupees in million)
Deposits with ICICI Bank................. 11,476.0 268.9 27.1 14.1 11,786.1Deposits of ICICI Bank ................... (17.1) — — — (17.1)Call/term money lent......................... 15,917.8 — — — 15,917.8Call/term money borrowed................ 240.7 — — — 240.7Advances ........................................... 5,002.5 145.5 13.9 — 5,161.9Investments of ICICI Bank ............... 88,178.8 12,109.2 — — 100,288.0Investments of related parties inICICI Bank........................................ 2,250.5 — 8.6 0.5 2,259.6Receivables........................................ 3,351.7 52.5 — — 3,404.2Payables............................................. 436.4 350.1 — — 786.5Guarantees ......................................... 3,400.2 5.0 — — 3,405.2Swaps/forward contracts ................... 508,047.8 — — — 508,047.8Participation Certificate..................... — — — — —Employee Stock OptionsOutstanding (Nos.) ............................ — — 2,860,625 — 2,860,625Employee Stock Options Exercised1 — — 138.1 — 138.1
1. During the year ended March 31, 2008, 317,125 employee stock options were exercised.
F-183

The maximum balance payable to/receivable from subsidiaries/joint ventures/associates/other relatedentities/key management personnel during the year ended March 31, 2008 is given below:
Items/Related party Subsidiaries
Associates/joint
ventures/other
related entities
Key
Management
Personnel
Relatives
of Key
Management
Personnel Total
(Rupees in million)
Deposits with ICICI Bank................. 50,517.8 5,603.3 71.4 22.5 56,215.0Deposits of ICICI Bank ................... 1,120.8 — — — 1,120.8Call/term money lent......................... 17,249.5 — — — 17,249.5Call/term money borrowed................ 2,865.0 — — — 2,865.0Advances .......................................... 11,496.4 1,021.3 28.7 — 12,546.4Investments of ICICI Bank ............... 88,178.8 18,895.0 — — 107,073.8Investments of related parties inICICI Bank........................................ 2,250.51 — 10.81 1.61 2,262.9Receivables........................................ 5,593.5 49.71 — — 5,643.2Payables............................................. 1,483.4 350.11 — — 1,833.5Guarantees ........................................ 3,450.2 5.0 — — 3,455.2Swaps/forward contracts ................... 524,892.6 — — — 524,892.6Participation Certificate..................... — — — — —
1. Maximum balances are determined based on comparison of the total outstanding balances as at each quarter endduring the financial year.
The balances payable to/receivable from subsidiaries/joint ventures/associates/key managementpersonnel included in the balance sheet as on March 31, 2007 are given below:
Items/Related party
Subsidiaries/
Joint Ventures Associates
Key
Management
Personnel
Relatives
of Key
Management
Personnel Total
(Rupees in million)
Deposits with ICICI Bank................. 9,550.6 42.8 51.6 28.1 9,673.1Deposits of ICICI Bank .................... 319.1 — — — 319.1Call/term money lent......................... 11,186.1 — — — 11,186.1Call/term money borrowed................ 0.4 — — — 0.4Advances ........................................... 6,477.3 — 20.6 — 6,497.9Investments of ICICI Bank ............... 43,938.1 13,743.1 — — 57,681.2Investments of related parties inICICI Bank........................................ 496.0 — 14.0 0.1 510.1Receivables........................................ 1,456.5 — — — 1,456.5Payables............................................. 657.8 — — — 657.8Guarantees1 ....................................... 3,449.8 — — — 3,449.8Swaps/forward contracts ................... 214,298.9 — — — 214,298.9Participation certificate ..................... 7,193.9 — — — 7,193.9Employee Stock OptionsOutstanding (Nos.) ............................ — — 1,920,000 — 1,920,000Employee Stock Options Exercised2 — — 459.2 — 459.2
1. Includes letter of undertaking.
2. During the year ended March 31, 2007, 1,884,750 employee stock options were exercised.
F-184

The maximum balance payable to/receivable from subsidiaries/joint ventures/associates/keymanagement personnel during the year ended March 31, 2007 is given below:
Items/Related party
Subsidiaries/
Joint Ventures Associates
Key
Management
Personnel
Relatives
of Key
Management
Personnel Total
(Rupees in million)
Deposits with ICICI Bank................. 16,238.9 3,149.0 69.7 59.3 19,516.9Deposits of ICICI Bank ................... 1,228.8 — — — 1,228.8Call/term money lent......................... 13,098.7 — — — 13,098.7Call/term money borrowed................ 869.4 — — — 869.4Advances .......................................... 6,477.3 — 20.8 — 6,498.1Investments of ICICI Bank ............... 43,938.1 16,539.2 — — 60,477.3Investments of related parties inICICI Bank........................................ 1,533.6 — 14.0 0.1 1,547.7Receivables........................................ 2,325.2 — — — 2,325.2Payables............................................. 1,107.3 — — — 1,107.3Repo .................................................. 423.0 — — — 423.0Reverse repo...................................... 1,880.0 — — — 1,880.0Guarantees1 ....................................... 3,870.5 — — — 3,870.5Swaps/forward contracts ................... 222,532.4 — — — 222,532.4Participation certificate ..................... 161,522.1 — — — 161,522.1
1. Includes letter of undertaking.
9. Securitisation
The Bank sells loans through securitisation and direct assignment. The information on securitisationactivity of the Bank as an originator for the year ended March 31, 2008 and March 31, 2007 is given in thetable below:
Year ended
March 31, 2008
Year ended
March 31, 2007
(Rupees in million, except number of
loans securitised)
Total number of loan assets securitised .................................................. 1,149,931 1,484,398Total book value of loan assets securitised............................................. 140,852.0 116,012.5Sale consideration received for the securitised assets............................. 142,470.4 116,500.6Net gain/(loss) on account of securitisation1 .......................................... 168.2 (65.5)
1. Excludes unamortized gain.
As onMarch 31, 2008
As onMarch 31, 2007
(Rupees in million)
Outstanding credit enhancement.............................................................. 15,601.2 16,712.3Outstanding liquidity facility................................................................... 7,740.8 4,361.0Net outstanding servicing asset/(liability) ............................................... 1,355.4 (371.4)Outstanding subordinate contributions .................................................... 11,459.5 8,225.8
F-185

The outstanding credit enhancement in the form of guarantees amounted to Rs. 29,155.6 million as onMarch 31, 2008 (March 31, 2007: Rs. 8,198.4 million).
The details of provision created at the time of securitisation are given below:
Particulars
Year ended
March 31, 2008
(Rupees in million)
Opening balance ............................................................................................................... 6,885.1Add: Additions during the year........................................................................................ 4,524.2Less: Deductions during the year..................................................................................... 2,222.6Closing balance ................................................................................................................ 9,186.7
10. Staff retirement benefits
Reconciliation of opening and closing balance of the present value of the defined benefit obligation forpension benefits is given below:
Particulars
Year ended
March 31, 2008
Year ended
March 31, 2007
(Rupees in million)
Opening obligations................................................................................. 1,029.4 1,038.5Add: Addition due to amalgamation ....................................................... 1,807.4 —Service cost ............................................................................................. 54.0 6.7Interest cost ............................................................................................. 230.7 78.0Actuarial (gain)/loss ................................................................................ (172.3) (28.2)Liabilities extinguished on settlement ..................................................... (1,071.0) (2.3)Benefits paid............................................................................................ (200.1) (63.3)Obligations at end of year ....................................................................... 1,678.1 1,029.4
Opening plan assets, at fair value ........................................................... 988.5 1,079.5Add: Addition due to amalgamation ....................................................... 584.8 —Expected return on plan assets ................................................................ 115.8 78.9Actuarial gain/(loss) ................................................................................ (118.0) (110.1)Assets distributed on settlement .............................................................. (1,145.2) (2.3)Contributions ........................................................................................... 1,264.3 5.8Benefits paid............................................................................................ (200.1) (63.3)Closing plan assets, at fair value ............................................................ 1,490.1 988.5
Fair value of plan assets at the end of the year...................................... 1,490.1 988.5Present value of the defined benefit obligations at the end of the year . 1,678.1 1,029.4Asset/(liability) ....................................................................................... (188.0) (40.9)
Cost for the yearService cost ............................................................................................. 54.0 6.7Interest cost ............................................................................................. 230.7 78.0Expected return on plan assets ................................................................ (115.8) (78.9)Actuarial (gain)/loss ................................................................................ (54.3) 81.9Curtailments & settlements (gain)/loss ................................................... 74.2 —Net cost.................................................................................................... 188.8 87.7
Investment details of plan assetsMajority of the plan assets are invested in Government securities and corporate bonds.
Assumptions ...........................................................................................Interest rate.............................................................................................. 8.57% 8.35%Salary escalation rate............................................................................... 7.00% 7.00%Estimated rate of return on plan assets ................................................... 8.00% 7.50%
F-186

Reconciliation of opening and closing balance of the present value of the defined benefit obligation forgratuity benefits is given below:
Particulars
Year ended
March 31, 2008
Year ended
March 31, 2007
(Rupees in million)
Opening obligations................................................................................. 1,142.1 1,001.0Add: Addition due to amalgamation/initial recognition of foreignbranches ................................................................................................... 506.6 —Service cost ............................................................................................. 292.8 221.0Interest cost ............................................................................................. 136.4 75.5Actuarial (gain)/loss ................................................................................ (62.0) (63.6)Transitional obligation/(Asset) ................................................................ (0.2) —Benefits paid............................................................................................ (175.3) (91.8)Obligations at end of year ....................................................................... 1,840.4 1,142.1
Opening plan assets, at fair value ........................................................... 891.7 785.3Add: Addition due to amalgamation ....................................................... 73.1 —Expected return on plan assets ................................................................ 74.4 62.5Actuarial gain/(loss) ................................................................................ (24.8) (18.0)Contributions ........................................................................................... 667.6 153.7Benefits paid............................................................................................ (175.3) (91.8)Closing plan assets, at fair value ............................................................ 1,506.7 891.7
Fair value of plan assets at the end of the year...................................... 1,506.7 891.7Present value of the defined benefit obligations at the end of the year . 1,840.4 1,142.1Asset/(liability) ....................................................................................... (333.7) (250.4)
Cost for the yearService cost ............................................................................................. 292.8 221.0Interest cost ............................................................................................. 136.4 75.5Expected return on plan assets ................................................................ (74.4) (62.5)Actuarial (gain)/loss ................................................................................ (37.2) (45.6)Transitional obligation/(Asset) ................................................................ (0.2) —Net cost.................................................................................................... 317.4 188.4
Investment details of plan assetsMajority of the plan assets are invested in insurer managed funds and special deposit schemes.
Assumptions ...........................................................................................Interest rate.............................................................................................. 8.57% 8.35%Salary escalation rate............................................................................... 7.00% 7.00%Estimated rate of return on plan assets ................................................... 8.00% 7.50%
The estimates of future salary increases, considered in actuarial valuation, take into considerationinflation, seniority, promotion and other relevant factors.
The guidance on implementing Accounting Standard 15, Employee Benefits (revised 2005) issued by theAccounting Standards Board (ASB) provides that exempt provident funds which require employers to meetthe interest shortfall are in effect defined benefit plans. The Bank’s actuary has informed that it is notpracticable to actuarially determine the interest shortfall obligation.
F-187

11. Employee Stock Option Scheme (“ESOS”)
In terms of the ESOS, as amended, the maximum number of options granted to any eligible employeein a financial year shall not exceed 0.05% of the issued equity shares of the Bank at the time of grant of theoptions and aggregate of all such options granted to the eligible employees shall not exceed 5% of theaggregate number of the issued equity shares of the Bank on the date(s) of the grant of options. Under the stockoption scheme, options vest in a graded manner over a four-year period, with 20%, 20%, 30% and 30% ofgrants vesting each year, commencing from the end of 12 months from the date of grant. The options can beexercised within 10 years from the date of grant or five years from the date of vesting, whichever is later.
In terms of the Scheme, 15,638,152 options (March 31, 2007: 13,187,783 options) granted to eligibleemployees were outstanding at March 31, 2008.
As per the scheme, the exercise price of ICICI Bank’s options is the last closing price on the stockexchange, which recorded highest trading volume preceding the date of grant of options. Hence, there is nocompensation cost in the year ended March 31, 2008 based on intrinsic value of options. However, if ICICIBank had used the fair value of options based on the Black-Scholes model, compensation cost for the yearended March 31, 2008 would have been higher by Rs. 1,259.9 million and proforma profit after tax would havebeen Rs. 40,317.4 million. On a proforma basis, ICICI Bank’s basic and diluted earnings per share would havebeen Rs. 38.19 and Rs. 37.96 respectively. The key assumptions used to estimate the fair value of optionsgranted during the year ended March 31, 2008 are given below:
Risk-free interest rate........................................................................................................ 7.12% to 8.11%Expected life ..................................................................................................................... 2-6 yearsExpected volatility ............................................................................................................ 36.26% to 38.01%Expected dividend yield.................................................................................................... 1.07%
The weighted average fair value of options granted during the year ended March 31, 2008 is Rs. 376.39.
A summary of the status of the Bank’s stock option plan is given below:
Stock options outstanding
Year ended March 31, 2008 Year ended March 31, 2007
Particulars
Number of
options
Weighted
Average
Exercise Price
Number of
options
Weighted
Average
Exercise Price
(Rupees, except number of options)
Outstanding at the beginning of the year ....... 13,187,783 442.50 17,362,584 262.60Add: Granted during the year......................... 4,956,300 938.41 6,439,900 582.26Less: Lapsed during the year.......................... 1,037,218 582.51 1,127,650 422.81Less: Exercised during the year1 .................... 1,468,713 379.34 9,487,051 210.47Outstanding at the end of the year ................. 15,638,152 596.32 13,187,783 442.50Options exercisable......................................... 3,272,292 411.89 326,259 225.80
1. Excludes options exercised but not allotted.
Summary of stock options outstanding as on March 31, 2008 is given below:
Range of exercise price (Rupees per share)
Number of shares
arising out of
options
(Number of shares)
Weighted average
exercise price
(Rupees)
Weighted average
remaining
contractual life
(Number of years)
105-299 ...................................................................... 164,951 151.20 3.75300-599 ...................................................................... 10,641,216 448.87 7.32600-999 ...................................................................... 4,745,985 932.63 9.081,000-1,399 ................................................................ 86,000 1,135.27 9.68
The options were exercised regularly throughout the year and weighted average share price as per NSEprice volume data during the year ended March 31, 2008 was Rs. 1,044.02 (March 31, 2007: Rs. 750.58).
F-188

The Finance Act 2007 introduced Fringe Benefit Tax (“FBT”) on employee stock options. The FBTliability crystallises on the date of exercise of stock options by employees and is computed based on thedifference between fair market value on date of vesting and the exercise price. As per the ESOS scheme, FBTof Rs. 226.7 million has been recovered from the employees on 1,468,713 stock options exercised during theyear ended March 31, 2008.
12. Preference shares
Certain government securities amounting to Rs. 2,331.8 million (March 31, 2007: Rs. 2,104.8 million)have been earmarked against redemption of preference share capital, which falls due for redemption on April20, 2018, as per the original issue terms.
13. Subordinated debt
During the year ended March 31, 2008, the Bank raised subordinated debt qualifying for Tier I/Tier IIcapital amounting to Rs. 22,350.0 million. The details of these bonds are given below:
Particulars Date of Issue Coupon Rate (%) Tenure Amount
(Rupees in million)
Tranche 1 Option I....... January 10, 2008 10.15% (annually)1 Perpetual2 5,000.0
Total (Tier I) ................ 5,000.0
1. Coupon rate of 10.15% payable annually from January 10, 2008 upto April 30, 2018 and 50 basis points over andabove the coupon rate of 10.15% i.e. 10.65% payable annually for the balance years, if the call option is notexercised by the Bank.
2. Call option exercisable on April 30, 2018 and on every interest payment date thereafter (exercisable with RBIapproval).
Particulars Date of Issue Coupon Rate (%) Tenure Amount
(Rupees in million)
Tranche 1 Option II ..... January 10, 2008 9.70% (annually)1 15 years2 5,000.0
Total (Upper Tier II) .... 5,000.0
1. Coupon rate of 9.70% payable annually from January 10, 2008 upto April 30, 2018 and 50 basis points over andabove the coupon rate of 9.70% i.e. 10.20% payable annually for the balance years, if the call option is not exercisedby the Bank.
2. Call option exercisable on April 30, 2018 (exercisable with RBI approval).
Particulars Date of Issue Coupon Rate (%) Tenure Amount
(Rupees in million)
Tranche 2 Option I....... January 21, 2008 9.15% annually 5 years and 3 months 1,230.0Tranche 2 Option II ..... January 21, 2008 9.25% annually 10 years 1,120.0
Total (Tier II) ............... 2,350.0
Particulars Date of Issue Coupon Rate (%) Tenure Amount
(Rupees in million)
Option A-I .................... November 10, 2007 9.80% annually 5 years and 3 months 6,098.7Option A-II................... November 10, 2007 9.39% monthly 5 years and 3 months 74.8Option B-I .................... November 10, 2007 10.00% annually 10 years 3,718.0Option B-II................... November 10, 2007 9.57% monthly 10 years 108.5
Total (Tier II) ............... 10,000.0
F-189

During the year ended March 31, 2007, the Bank raised subordinated debt qualifying for Tier I/Tier IIcapital amounting to Rs. 97,506.0 million. The details of these bonds are given below:
Particulars Date of Issue Coupon Rate (%) Tenure Amount
(Rupees in million)
Tranche 1 Option I....... January 15, 2007 9.98% (semi-annually)1 Perpetual2 180.0
Total (Tier I) ................ 180.0
1. Coupon rate of 9.98% payable semi-annually from January 15, 2007 upto April 30, 2017 and 100 basis points overand above the coupon rate of 9.98% i.e. 10.98% payable semi-annually for the balance years, if the call option isnot exercised by the Bank.
2. Call option exercisable on April 30, 2017 and on every interest payment date thereafter (exercisable with RBIapproval).
Particulars Date of Issue Coupon Rate (%) Tenure Amount
(Rupees in million)
Tranche 2 Option I....... September 13, 2006 9.98% (semi-annually)1 Perpetual2 5,500.0
Total (Tier I) ................ 5,500.0
1. Coupon rate of 9.98% payable semi-annually for first 10 years, 100 basis points over and above the coupon rate of9.98% i.e. 10.98% payable semi-annually for the balance years, if the call option is not exercised by the Bank.
2. Call option exercisable after 10 years i.e. on September 13, 2016 and on every interest payment date thereafter(exercisable with RBI approval).
Particulars Date of Issue Coupon Rate (%) Tenure Amount
(Rupees in million)
Option I ........................ August 24, 2006 7.25% (semi-annually)1 Perpetual2 15,510.0
Total (Tier I) ................ 15,510.0
1. Coupon rate of 7.25% payable semi-annually on April 30 and October 31 of each year, at a fixed rate per annumof 7.25% till October 31, 2016 and thereafter semi-annually in arrears on April 30, and October 31 of each year ata variable rate equal to six monthly LIBOR plus 2.94%.
2. Call option exercisable after 10 years i.e. on August 23, 2016 and on every interest payment date thereafter(exercisable with RBI approval).
Particulars Date of Issue Coupon Rate (%) Tenure Amount
(Rupees in million)
Tranche 1 Option I....... August 9, 2006 10.10% (semi-annually)1 Perpetual2 2,330.0
Total (Tier I) ................ 2,330.0
1. Coupon rate of 10.10% payable semi-annually for first 10 years, 100 basis points over and above the coupon rateof 10.10% i.e. 11.10% payable semi-annually for the balance years, if the call option is not exercised by the Bank.
2. Call option exercisable after 10 years i.e. on August 9, 2016 and on every interest payment date thereafter(exercisable with RBI approval).
F-190

Particulars Date of Issue Coupon Rate (%) Tenure Amount
(Rupees in million)
Tranche 1 Option II ..... January 15, 2007 9.40% annual 1 15 years2 940.0
Total (Upper Tier II) .... 940.0
1. Coupon rate of 9.40% payable annually from January 15, 2007 upto April 30, 2017 and 10.40% payablesemi-annually thereafter, if the call option is not exercised by the Bank.
2. Call option exercisable on April 30, 2017 (exercisable with RBI approval).
Particulars Date of Issue Coupon Rate (%) Tenure Amount
(Rupees in million)
Option I ....................... January 12, 2007 6.375% (semi-annually)1 15 Years2 33,135.0
Total (Upper Tier II)3 .. 33,135.0
1. Coupon rate semi-annually in arrears at fixed rate per annum equal to 6.375% till April 30, 2017 and thereaftersemi-annually in arrears at six monthly LIBOR plus 2.28%, if the call option is not exercised by the Bank.
2. Call option exercisable on January 12, 2017 (exercisable with RBI approval).
3. The above bonds issued for Upper Tier II capital have been excluded from the capital adequacy ratio (CRAR)computation, pending clarification required by Reserve Bank of India regarding certain terms of these bonds.
Particulars Date of Issue Coupon Rate (%) Tenure Amount
(Rupees in million)
Option I ....................... December 27, 2006 six-monthly libor + 1.40%(semi-annually)1
15 Years2 6,639.0
Total (Upper Tier II).... 6,639.0
1. Floating rate six monthly LIBOR plus 1.40% payable semi-annually on April 15 and October 15 of each year, tillApril 15, 2017 and thereafter semi-annually in arrears on April 15 and October 15 of each year at a rate equal tosix monthly LIBOR plus 2.40%, if the call option is not exercised by the Bank.
2. Call option exercisable on December 27, 2016 (exercisable with RBI approval).
Particulars Date of Issue Coupon Rate (%) Tenure Amount
(Rupees in million)
Tranche 2 Option I ...... July 17, 2006 9.50% annual1 15 years2 10,000.0
Total (Upper Tier II).... 10,000.0
1. Coupon rate of 9.50% for first 10 years. For next 5 years, 50 basis points over and above coupon rate of 9.50% i.e.10.00%, if the call option is not exercised by the Bank.
2. Call option after 10 years, i.e. on July 17, 2016 (exercisable with RBI approval).
Particulars Date of Issue Coupon Rate (%) Tenure Amount
(Rupees in million)
Tranche 1 Option I ...... July 11, 2006 9.00% annual 10 years 20,000.0
Total (Tier II)............... 20,000.0
F-191

Particulars Date of Issue Coupon Rate (%) Tenure Amount
(Rupees in million)
Tranche 5 Option I ...... June 22, 2006 8.95% annual1 15 years2 2,552.0
Total (Upper Tier II).... 2,552.0
1. Coupon rate of 8.95% for first 10 years. For next 5 years, 50 basis points over and above the coupon rate of 8.95%i.e. 9.45% if the call option is not exercised by the Bank.
2. Call option after 10 years, i.e. on June 22, 2016 (exercisable with RBI approval).
Particulars Date of Issue Coupon Rate (%) Tenure Amount
(Rupees in million)
Tranche 4 Option I ...... May 19, 2006 8.50% annual 10 years 230.0Tranche 4 Option II ..... May 19, 2006 8.60% annual 12 years 140.0Tranche 4 Option III.... May 19, 2006 8.40% annual 5 years and 11 months 350.0
Total (Tier II)............... 720.0
14. Investments
The details of investments and the movement of provisions held towards depreciation of investments ofthe Bank as on March 31, 2008 and March 31, 2007 are given below:
Particulars
As on
March 31, 2008
As on
March 31, 2007
(Rupees in million)
1 Value of Investments(i) Gross value of investments
a) In India .................................................................................. 1,056,883.5 873,108.3b) Outside India ......................................................................... 64,358.5 45,052.7
(ii) Provision for depreciationa) In India .................................................................................. (5,719.8) (5,568.1)b) Outside India ......................................................................... (978.7) (14.5)
(iii) Net value of investmentsa) In India .................................................................................. 1,051,163.7 867,540.2b) Outside India ......................................................................... 63,379.8 45,038.2
2. Movement of provisions held towards depreciation on investments(i) Opening balance ............................................................................. 5,582.6 5,066.4(ii) Add: Provisions made during the year........................................... 2,622.7 948.9(iii) Less: Write-off/write back of excess provisions during the year... (1,506.8) (432.7)(iv) Closing balance .............................................................................. 6,698.5 5,582.6
F-192

15. Investment in securities, other than government and other approved securities
i) Issuer composition of investments in securities, other than government and other approvedsecurities.
a) The issuer composition of investments of the Bank in securities, other than government and otherapproved securities as on March 31, 2008 is given below:
No Issuer Amount
Extent of
private
placement
Extent of
‘below
investment
grade’
securities
Extent of
‘unrated’
securities2
Extent of
‘unlisted’
securities2,3
(a) (b) (c) (d)
(Rupees in million)
1 PSUs......................................... 6,022.8 3,000.0 22.5 — —2 FIs ............................................ 11,601.6 6,711.0 — 1,656.0 3,426.03 Banks........................................ 40,374.6 13,376.2 437.8 7,101.2 5,456.04 Private Corporates .................... 35,542.1 14,345.7 — 10,068.9 6,633.65 Subsidiaries/Joint ventures ....... 88,178.8 3,851.4 — 150.0 150.06 Others ....................................... 188,582.0 75,586.5 26,358.2 — —7 Provision held towards
depreciation .............................. (6,067.9) — — — —
Total ......................................... 364,234.0 116,870.8 26,818.5 18,976.1 15,665.9
1. Amounts reported under columns (a), (b), (c) and (d) above are not mutually exclusive.
2. This excludes investments, amounting to Rs. 3,701.4 million, in preference shares of subsidiaries, namely ICICIBank UK PLC and ICICI Bank Canada. This also excludes investments in government securities (Rs. 1,402.5million) of non-Indian origin made by overseas branches.
3. Includes Rs. 1,770.0 million of application money towards bonds issued by banks, which were listed before theAudit Committee Meeting held on April 25, 2008.
b) The issuer composition of investments of the Bank in securities, other than government and otherapproved securities as on March 31, 2007 is given below:
No. Issuer Amount
Extent of
private
placement
Extent of
‘below
investment
grade’
securities
Extent of
‘unrated’
securities2
Extent of
‘unlisted’
securities2,3
(a) (b) (c) (d)
(Rupees in million)
1 PSUs......................................... 2,850.9 251.0 32.1 — —2 FIs ............................................ 9,414.3 4,195.3 577.5 2,656.0 2,656.03 Banks........................................ 23,069.0 1,124.0 2,082.0 9,172.2 8,694.04 Private Corporates .................... 33,348.1 17,104.8 — 16,522.3 15,031.95 Subsidiaries/Joint ventures ....... 44,005.8 4,821.1 — 150.0 150.06 Others ....................................... 131,732.4 63,006.5 27,470.5 0.1 —7 Provision held towards
depreciation .............................. (5,524.4) — — — —
Total ......................................... 238,896.1 90,502.7 30,162.1 28,500.6 26,531.9
F-193
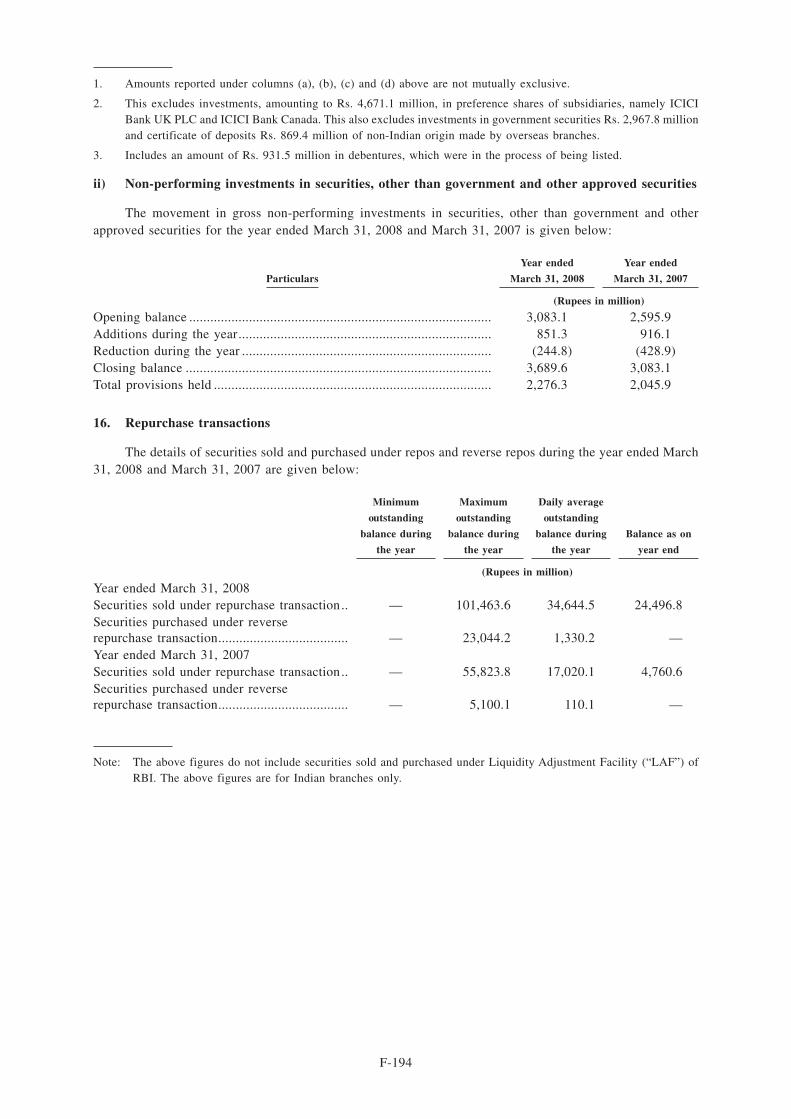
1. Amounts reported under columns (a), (b), (c) and (d) above are not mutually exclusive.
2. This excludes investments, amounting to Rs. 4,671.1 million, in preference shares of subsidiaries, namely ICICIBank UK PLC and ICICI Bank Canada. This also excludes investments in government securities Rs. 2,967.8 millionand certificate of deposits Rs. 869.4 million of non-Indian origin made by overseas branches.
3. Includes an amount of Rs. 931.5 million in debentures, which were in the process of being listed.
ii) Non-performing investments in securities, other than government and other approved securities
The movement in gross non-performing investments in securities, other than government and otherapproved securities for the year ended March 31, 2008 and March 31, 2007 is given below:
Particulars
Year ended
March 31, 2008
Year ended
March 31, 2007
(Rupees in million)
Opening balance ...................................................................................... 3,083.1 2,595.9Additions during the year........................................................................ 851.3 916.1Reduction during the year ....................................................................... (244.8) (428.9)Closing balance ....................................................................................... 3,689.6 3,083.1Total provisions held ............................................................................... 2,276.3 2,045.9
16. Repurchase transactions
The details of securities sold and purchased under repos and reverse repos during the year ended March31, 2008 and March 31, 2007 are given below:
Minimum
outstanding
balance during
the year
Maximum
outstanding
balance during
the year
Daily average
outstanding
balance during
the year
Balance as on
year end
(Rupees in million)
Year ended March 31, 2008Securities sold under repurchase transaction.. — 101,463.6 34,644.5 24,496.8Securities purchased under reverserepurchase transaction..................................... — 23,044.2 1,330.2 —Year ended March 31, 2007Securities sold under repurchase transaction.. — 55,823.8 17,020.1 4,760.6Securities purchased under reverserepurchase transaction..................................... — 5,100.1 110.1 —
Note: The above figures do not include securities sold and purchased under Liquidity Adjustment Facility (“LAF”) ofRBI. The above figures are for Indian branches only.
F-194

17. Lending to sensitive sectors
The Bank has lending to sectors, which are sensitive to asset price fluctuations. The sensitive sectorsinclude capital market and real estate.
The position of lending to capital market is given below:
As on
March 31, 2008
As on
March 31, 2007
(Rupees in million)
Capital market sectori) Direct investment in equity shares, convertible debentures and
units of equity-oriented mutual funds the corpus of which is notexclusively invested in corporate debt. .......................................... 29,240.6 12,773.5
ii) Advances against shares/bonds/debentures or other securities oron clean basis to individuals for investment in shares (includingIPOs/ESOPs), convertible bonds, convertible debentures, andunits of equity-oriented mutual funds. ........................................... 14,324.2 7,763.8
iii) Advances for any other purposes where shares or convertiblebonds or convertible debentures or units of equity orientedmutual funds are taken as primary security.1 ................................. 423.2 N.A
iv) Advances for any other purposes to the extent secured by thecollateral security of shares or convertible bonds or convertibledebentures or units of equity oriented mutual funds. 2.................. 1,692.3 N.A
v) Secured and unsecured advances to stockbrokers and guaranteesissued on behalf of stockbrokers and market markers.3 ................ 26,342.6 15,160.8
vi) Loans sanctioned to corporates against the security ofshares/bonds/debentures or other securities or on clean basis formeeting promoter’s contribution to the equity of new companiesin anticipation of raising resources. ............................................... — —
vii) Bridge loans to companies against expected equity flows/issues. . — —viii) Underwriting commitments taken up by the Bank in respect of
primary issue of shares or convertible bonds or convertibledebentures or units of equity oriented mutual funds. .................... — —
ix) Financing to stockbrokers for margin trading. ............................... — —x) All exposures to Venture Capital Funds (both registered and
unregistered). .................................................................................. 12,805.2 19,499.7
Total................................................................................................ 84,828.1 55,197.8
1 & 2. Revised guideline on capital market exposure is applicable from April 1, 2007. Data up to March 31, 2007 is basedon old guidelines.
3. It includes a guarantee of Rs. 3,040.0 million (March 31, 2007: Rs. 3,040.0 million) issued on behalf of a corporatecustomer to ensure equity capital contribution.
F-195

The summary of lending to real estate sector is given below:
As on
March 31, 2008
As on
March 31, 2007
(Rupees in million)
Real estate sectorI Direct exposure........................................................................................ 779,388.9 751,382.9
i) Residential mortgages, .................................................................. 630,857.6 595,153.0of which housing loans upto Rs. 1.5/2.0 million1 ........................ 314,071.6 300,137.0
ii) Commercial real estate2.................................................................. 137,336.2 142,509.8iii) Investments in mortgage backed securities
(MBS) and other securitised exposure .......................................... 11,195.1 13,720.1a. Residential ............................................................................. 11,195.1 13,720.1b. Commercial real estate .......................................................... — —
II Indirect exposure ..................................................................................... 33,613.5 45,785.0Fund based and non-fund based exposures onNational Housing Bank (NHB) and HousingFinance Companies (HFCs) ................................................................... 20,901.3 30,214.4Others ...................................................................................................... 12,712.2 15,570.6
Total3 ....................................................................................................... 813,002.4 797,167.9
1. Figures as on March 31, 2007 are for housing loans up to Rs. 1.5 million.
2. Commercial real estate exposure include loans given to land and building developers for construction, corporatesfor their real estate requirements and to individuals/firms/corporates against non-residential premises.
3. Excludes non-banking assets acquired in satisfaction of claims.
18. Details of Single Borrower Limit (“SBL”), Group Borrower Limit (“GBL”) exceeded by the Bank
During the year ended March 31, 2008, the Bank had no single borrower and group borrower, whichexceeded the prudential exposure limits prescribed by RBI.
19. Risk category-wise country-wise exposure
As per the extant RBI guidelines, the country exposure of the Bank is categorised into various riskcategories listed in the following table. The funded country exposure (net) of the Bank in respect of UnitedKingdom is 1.81% and United States of America is 1.57% of the total funded assets as on March 31, 2008 (ason March 31, 2007: United Kingdom was 0.98% and United States of America was 0.68%). As the net fundedexposure to United Kingdom and United States of America exceeds 1% of total funded assets, the Bank hasmade a provision of Rs. 245.0 million on country exposure as on March 31, 2008 (Provision as on March 31,2007: Nil).
Risk category
Exposure (net)
as on March 31,
2008
Provision held
as at March 31,
2008
Exposure (net)
as on March 31,
2007
Provision held
as at March 31,
2007
(Rupees in million)
Insignificant .................................................... 435,312.7 245.0 277,784.2 —Low................................................................. 167,234.5 — 126,883.7 —Moderate ......................................................... 36,697.3 — 20,616.3 —High ................................................................ 4,730.7 — 1,565.1 —Very High........................................................ 22.1 — 404.3 —Restricted ........................................................ — — — —Off-Credit........................................................ — — — —
Total ................................................................ 643,997.3 245.0 427,253.6 —
- of which funded ........................................... 403,791.3 — 308,348.8 —
F-196

20. Advances
The details of movement of gross NPAs, net NPAs and provisions during year ended March 31, 2008 andMarch 31, 2007 are given in the table below:
Particulars
Year ended
March 31, 20083
Year ended
March 31, 2007
(Rupees in million)
i) Net NPAs (funded) to Net Advances (%) ............................................... 1.55% 1.02%ii) Movement of NPAs (Gross)
a) Opening Balance ............................................................................ 41,260.6 22,225.9b) Additions during the year1, 2 .......................................................... 36,896.6 21,610.0c) Reductions during the year1 .......................................................... (2,361.8) (2,575.3)d) Closing balance4 ............................................................................. 75,795.4 41,260.6
iii) Movement of Net NPAsa) Opening Balance ............................................................................ 19,920.4 10,526.8b) Additions during the year1, 2 .......................................................... 17,616.3 11,835.8c) Reductions during the year1 .......................................................... (2,631.2) (2,442.2)d) Closing balance ............................................................................. 34,905.5 19,920.4
(iv) Movement of provisions for NPAs (excluding provisions on standardassets)a) Opening Balance5 ........................................................................... 20,835.9 11,427.5b) Provisions made during the year6 ................................................. 19,510.7 11,179.5c) Write-off/write-back of excess provisions...................................... (913.9) (1,771.1)d) Closing balance5 ............................................................................. 39,432.7 20,835.9
1. Excludes cases added to and deleted from NPAs in the same year with such gross loans amounting to Rs. 2,203.2million (March 31, 2007: Rs. 7,841.8 million) and such net loans amounting to Rs. 1,968.6 million (March 31, 2007:Rs. 6,770.8 million).
2. The difference between the opening and closing balances of NPAs in retail loans is included in additions during theyear.
3. Includes non-performing loans acquired on merger of Sangli Bank.
4. Includes suspended interest and claims received from ECGC/DICGC of Rs. 1,457.2 million (March 31, 2007: Rs.504.3 million) on working capital loan.
5. Excludes technical write-off amounting to Rs. 6,076.1 million (March 31, 2007: Rs. 6,230.5 million) and suspendedinterest and claims received from ECGC/DICGC of Rs. 1,457.2 million (March 31, 2007: Rs. 504.3 million).
6. Net of reduction in provisions due to sale of retail non-performing assets.
There was no change in the floating provision of Rs. 2,841.7 million, which is included in the total NPAprovision.
F-197

21. Financial assets transferred during the year to securitisation company (SC)/reconstructioncompany (RC)
The Bank has transferred certain assets to Asset Reconstruction Company (India) Limited (ARCIL) interms of the guidelines issued by RBI governing such transfer. For the purpose of the valuation of theunderlying security receipts issued by the underlying trusts managed by ARCIL, the security receipts arevalued at their respective NAVs as advised by the ARCIL. The details of the assets transferred during the yearended March 31, 2008 and March 31, 2007 are given in the table below:
Year ended
March 31, 2008
Year ended
March 31, 2007
(Rupees in million, except no. of accounts)
A No. of accounts .......................................................................... 18,480 19B Aggregate value (net of provisions) of accounts sold to
SC/RC ........................................................................................9,344.5 8,169.6
C Aggregate consideration............................................................. 9,408.2 8,024.7D Additional consideration realised in respect of accounts
transferred in earlier years1 .......................................................— —
E Aggregate gain/(loss) over net book value ................................ 63.7 (144.9)
1. During the year ended March 31, 2008, ARCIL fully redeemed security receipts of Nil trusts. The Bank realised Rs.Nil over the gross book value in respect of these trusts (March 31, 2007: Rs. 849.0 million). The Bank also realisedan additional amount of Rs. Nil over the gross book value in respect of security receipts already redeemed. Further,the Bank has realised an additional amount of Rs. 7.7 million (March 31, 2007: Rs. 43.5 million) over the gross bookvalue in respect of security receipts not fully redeemed as on March 31, 2008. During the year ended March 31, 2008security receipts of net book value amounting to Rs. 4,777.9 million were sold to ARCIL at a sale consideration ofRs. 4,820.0 million. The net loss on this transaction was Rs. 100.6 million and provision release was Rs. 142.7million.
22. Provisions on standard assets
During the year ended March 31, 2007, RBI increased the requirement of general provisioning to 2% onstandard loans relating to personal loans, loans and advances qualifying as capital market exposure, credit cardreceivables, advances to non-deposit taking systemically important non-banking financial companies (NBFCs)and commercial real estate loans. On standard loans for residential housing beyond Rs. 2.0 million, theprovisioning requirement was increased to 1% from the earlier level of 0.4%. In accordance with the revisedRBI guidelines, a general provision of Rs. 1,590.0 million has been made during the year ended March 31,2008 (March 31, 2007: Rs. 7,310.0 million). The provision on standard assets held by the Bank in accordancewith RBI guidelines was Rs. 14,550.3 million (including Rs. 12.0 million transferred on account of merger ofthe Sangli Bank Limited effective April 19, 2007) at March 31, 2008 (March 31, 2007: Rs. 12,948.3 million).
F-198

23. Provisions and contingencies
The break-up of ‘Provisions and contingencies’ included in the profit and loss account is given below:
Year ended
March 31, 2008
Year ended
March 31, 2007
(Rupees in million)
Provisions for depreciation of investments ...................................................... 622.6 419.4Provision towards non-performing assets......................................................... 25,419.9 14,283.0Provision towards standard assets .................................................................... 1,590.0 7,310.0Provision towards income tax1 ......................................................................... 8,953.7 5,348.2Provision towards wealth tax ........................................................................... 30.0 30.0Other provision and contingencies ................................................................... 1,413.3 251.3
1. Includes fringe benefit tax amounting to Rs. 392.0 million and creation of net deferred tax asset amounting to Rs.(7,133.6) million
24. Information in respect of restructured assets
Details of loan assets subjected to restructuring are given below:
Particulars Year ended March 31, 2008 Year ended March 31, 2007
No. Amount
Interest
Sacrifice No. Amount
Interest
Sacrifice
(Rupees in million)
i) Total amount of loan assetssubjected to restructuring,rescheduling, renegotiation ............... 4 16,757.41 — 5 527.2 —of which under CDR......................... 2 1,013.7 — 3 273.8 —
ii) The amount of standard assetssubjected to restructuring,rescheduling, renegotiation ............... 3 15,795.31 — 4 405.3 —of which under CDR......................... 2 1,013.7 — 3 273.8 —
iii) The amount of sub-standard assetssubjected to restructuring,rescheduling, renegotiation ............... 1 962.1 — 1 121.9 —of which under CDR......................... — — — — — —
iv) The amount of doubtful assetssubjected to restructuring,rescheduling, renegotiation ............... — — — — — —of which under CDR......................... — — — — — —
1. Includes cases where terms and conditions of the restructuring are being finalised.
Above details exclude cases that were approved by Corporate Debt Restructuring (CDR) forum anddisclosed in earlier years by the Bank and in which certain terms and conditions have been modified by CDRForum during the current year.
During the year ended March 31, 2008, there has been no debt restructuring for small and mediumenterprises.
F-199

25. Details of non-performing assets purchased/sold, excluding those sold to SC/RC
The Bank has sold certain non-performing assets in terms of the guidelines issued by RBI circular no.DBOD.No.BP.BC.16/21.04.048/2005-06 dated July 13, 2005 on such sale.
Particulars
Year ended
March 31, 2008
Year ended
March 31, 2007
(Rupees in million)
A No. of accounts ....................................................................................... 12,545 —B Aggregate value (net of provisions) of accounts sold, excluding those
sold to SC/RC..........................................................................................515.3 —
C Aggregate consideration .......................................................................... 499.4 —D Aggregate gain/(loss) over net book value ............................................. (15.9) —
26. Fixed Assets
Fixed assets include software acquired by the Bank. The movement in software is given below:
Particulars
Year ended
March 31, 2008
Year ended
March 31, 2007
(Rupees in million)
At cost as on March 31st of preceding year .................................................... 3,216.4 2,852.7Additions during the year................................................................................. 1,235.4 455.9Deductions during the year .............................................................................. (3.0) (92.2)Depreciation to date ......................................................................................... (2,847.4) (2,385.9)Net block .......................................................................................................... 1,601.4 830.5
27. Assets given on lease
There are no assets given under operating lease as at March 31, 2008 and March 31, 2007.
27.1 Assets under finance lease
The details of finance leases are given below:
Particulars
As on
March 31, 2008
As on
March 31, 2007
(Rupees in million)
Total of future minimum lease receipts............................................................ 353.7 617.3Present value of lease receipts ......................................................................... 325.6 548.8Unmatured finance charges .............................................................................. 28.1 68.5Maturity profile of future minimum lease receipts
- Not later than one year .............................................................................. 213.3 323.4- Later than one year and not later than five years...................................... 140.4 293.9- Later than five years .................................................................................. — —
Total .................................................................................................................. 353.7 617.3
27.2 Maturity profile of present value of lease rentals
The details of maturity profile of present value of finance lease receipts are given below:
Particulars
As on
March 31, 2008
As on
March 31, 2007
(Rupees in million)
Not later than one year..................................................................................... 193.0 282.6Later than one year and not later than five years ............................................ 132.6 266.2Later than five years......................................................................................... — —
Total .................................................................................................................. 325.6 548.8
F-200

28. Early Retirement Option (“ERO”)
The Bank had implemented an Early Retirement Option Scheme 2003 for its employees in July 2003.All employees who had completed 40 years of age and seven years of service with the Bank (including periodof service with entities amalgamated with the Bank) were eligible for the ERO.
The ex-gratia payments under ERO, terminations benefits and leave encashment in excess of theprovision made (net of tax benefits), aggregating to Rs. 1,910.0 million is being amortised over a period offive years commencing August 1, 2003 (the date of retirement of employees exercising the Option being July31, 2003).
On account of the above ERO scheme, an amount of Rs. 384.0 million (March 31, 2007: Rs. 384.0million) has been charged to revenue being the proportionate amount amortised for the year ended March 31,2008.
29. Provision for income tax
The provision for income tax (including deferred tax and fringe benefit tax) for the year ended March31, 2008 amounted to Rs. 8,953.7 million (March 31, 2007: Rs. 5,348.2 million).
The Bank has a comprehensive system of maintenance of information and documents required bytransfer pricing legislation under section 92-92F of the Income Tax Act, 1961. The Bank is of the opinion thatall international transactions are at arm’s length so that the above legislation will not have material impact onthe financial statements.
30. Deferred tax
As on March 31, 2008 the Bank has recorded net deferred tax asset of Rs. 13,233.9 million (March 31,2007: Rs. 6,099.6 million), which has been included in other assets.
The break-up of deferred tax assets and liabilities into major items is given below:
As on
March 31, 2008
As on
March 31, 2007
(Rupees in million)
Deferred Tax AssetProvision for bad and doubtful debts ............................................................... 18,043.3 11,758.5Capital loss ....................................................................................................... — —Others ............................................................................................................... 1,409.9 884.0
Total Deferred Tax Assets ................................................................................ 19,453.2 12,642.5Deferred Tax LiabilityDepreciation on fixed assets............................................................................. 6,220.5 6,543.3Others ............................................................................................................... — —
Total Deferred Tax Liability............................................................................. 6,220.5 6,543.3Deferred tax asset pertaining to foreign branches............................................ 1.2 0.4
Total net deferred tax asset/(liability) .............................................................. 13,233.9 6,099.6
31. Dividend distribution tax
For the purpose of computation of dividend distribution tax on the proposed dividend, the Bank hasreduced the dividend distribution tax on dividend received from its Indian subsidiaries as per the amendmentto section 115-O of the Income Tax Act, 1961 vide Finance Bill, 2008, read with Section 294 of the IncomeTax Act, 1961.
32. Derivatives
ICICI Bank is a major participant in the financial derivatives market. The Bank deals in derivatives forbalance sheet management and market making purposes, whereby the Bank offers derivative products to itscustomers, enabling them to hedge their risks.
Dealing in derivatives is carried out by identified groups in the treasury of the Bank based on the purposeof the transaction. Derivative transactions are entered into by the treasury front office. Treasury middle officeconducts an independent check of the transactions entered into by the front office and also undertakesactivities such as confirmation, settlement, accounting, risk monitoring and reporting and ensures compliancewith various internal and regulatory guidelines.
F-201

The market making and the proprietary trading activities in derivatives are governed by the investmentpolicy of the Bank, which lays down the position limits, stop loss limits as well as other risk limits. The RiskManagement Group (“RMG”) lays down the methodology for computation and monitoring of risk. The RiskCommittee of the Board (“RCB”) reviews the Bank’s risk management policy in relation to various risks(portfolio, liquidity, interest rate, off-balance sheet and operational risks), investment policies and complianceissues in relation thereto. The RCB comprises of independent directors and the Managing Director and CEO.
Risk monitoring of the derivatives portfolio other than credit derivatives is done on a daily basis. Riskmonitoring of the credit derivatives portfolio is done on a monthly basis. The Bank measures and monitors riskusing Value-at-Risk (“VAR”) approach and the relevant sensitivity measures for options. Risk reporting onderivatives forms an integral part of the management information system and the marked to market positionand the VAR of the derivatives portfolio other than credit derivatives is reported on a daily basis. The markedto market position and VAR on the credit derivatives portfolio is reported on a monthly basis.
The use of derivatives for hedging purposes is governed by the hedge policy approved by Asset LiabilityManagement Committee (“ALCO”). Subject to prevailing RBI guidelines, the Bank deals in derivatives forhedging fixed rate, floating rate or foreign currency assets/liabilities. Transactions for hedging and marketmaking purposes are recorded separately. For hedge transactions, the Bank identifies the hedged item (assetor liability) at the inception of the transaction itself. The effectiveness is assessed at the time of inception ofthe hedge and periodically thereafter.
Hedge derivative transactions are accounted for pursuant to the principles of hedge accounting.Derivatives for market making purpose are marked to market and the resulting gain/loss is recorded in theprofit and loss account. The premium on option contracts is accounted for as per Foreign Exchange Dealers’Association of India guidelines. Derivative transactions are covered under International Swap DealersAssociation (“ISDA”) master agreements with the respective counter parties. The exposure on account ofderivative transactions is computed as per RBI guidelines and is marked against the credit limits approved forthe respective counter parties.
As on March 31, 2008
Sr. No. Particulars
Currency
derivatives1
Interest rate
derivatives2
(Rupees in million)
1 Derivatives (Notional principal amount)3
a) For hedging ................................................................................ 27,056.3 206,265.5b) For trading ................................................................................. 993,177.9 6,318,496.0
2 Marked to market positions4
a) Asset (+) .................................................................................... 30,085.1 184.5b) Liability (-) ................................................................................ — —
3 Credit exposure5.................................................................................. 109,607.8 83,103.44 Likely impact of one percentage change in interest rate
(100*PV01)6
a) On hedging derivatives7............................................................. 559.5 8,879.2b) On trading derivatives................................................................ 1,777.8 2,270.7
5 Maximum and minimum of 100*PV01 observed during the yeara) On hedging7
Maximum ................................................................................... (11.6) (4,268.4)Minimum.................................................................................... (714.7) (9,467.8)
b) On tradingMaximum ................................................................................... (313.2) 2,809.2Minimum.................................................................................... (1,870.9) 464.9
1. Options and cross currency interest rate swaps are included in currency derivatives.2. Foreign currency interest rate swaps; forward rate agreements and swaptions are included in interest rate derivatives.3. Excludes notional amount of options sold for Rs. 597,333.2 million.4. For trading portfolio including accrued interest. Represents net positions.5. Includes accrued interest.6. Amounts given are absolute values.7. The swap contracts entered for hedging purpose would have an opposite and offsetting impact with the underlying
on-balance sheet items.
F-202

As on March 31, 2007
Sr. No ParticularsCurrency
derivatives1
Interest ratederivatives2
(Rupees in million)
1 Derivatives (Notional principal amount)3
a) For hedging ................................................................................ 1,441.0 145,066.4b) For trading ................................................................................. 730,931.6 2,794,743.1
2 Marked to market positions4
a) Asset (+) .................................................................................... 5,044.8 1,828.6b) Liability (-) ................................................................................ — —
3 Credit exposure ................................................................................... 40,376.0 42,433.44 Likely impact of one percentage change in interest rate
(100*PV01)5
a) On hedging derivatives6............................................................. 12.5 5,031.7b) On trading derivatives................................................................ 683.7 684.8
5 Maximum and minimum of 100*PV01 observed during the yeara) On hedging6
Maximum ................................................................................... — (1,098.1)Minimum.................................................................................... (14.5) (5,031.9)
b) On tradingMaximum ................................................................................... 1,934.0 1,965.5Minimum.................................................................................... (847.8) (369.5)
1. Options and cross currency interest rate swaps are included in currency derivatives.
2. Foreign currency interest rate swaps; forward rate agreements and swaptions are included in interest rate derivatives.
3. Excludes notional amount of options sold for Rs. 444,221.2 million.
4. For trading portfolio excluding accrued interest. Represents net positions.
5. Amounts given are absolute values.
6. The swap contracts entered for hedging purpose would have an opposite and offsetting impact with the underlyingon-balance sheet items.
The Bank deals in credit derivative instruments including credit default swaps, credit linked notes,collateralised debt obligations and principal protected structures. The notional principal amount of these creditderivatives outstanding at March 31, 2008 was Rs. 12,231.2 million in funded instruments and Rs. 50,568.5million in non-funded instruments which includes Rs. 200.6 million of protection bought by the Bank. Themark- to- market loss as on March 31, 2008 on the above portfolio was Rs. 5,870.6 million, which has beenprovided for through the profit and loss account. The profit and loss impact on the above portfolio on accountof mark-to-market and realised losses during the year ended March 31, 2008 was a net loss of Rs. 6,848.3million.
The credit derivatives are marked to market by the Bank based on counter-party valuation quotes, orinternal models using inputs from market sources such as Bloomberg/Reuters, counter-parties and FIMMDA.
The Bank offers deposits to customers of its offshore branches with structured returns linked to interest,forex or equity benchmarks. The Bank covers these exposures in the inter-bank market. As on March 31, 2008,the net open position on this portfolio was Rs. 4.0 million with mark-to-market of Rs. 0.1 million as on thatdate, which has been provided for through profit and loss account.
The notional principal amount of forex contracts classified as hedging amounted to Rs. 393,701.5million (March 31, 2007: Rs. 288,639.6 million).
The notional principal amount of forex contracts classified as trading amounted to Rs. 2,678,010.8million (March 31, 2007: Rs. 1,042,920.8 million).
The net overnight open position at March 31, 2008 was Rs. 2,584.5 million (March 31, 2007: Rs. 1,279.7million).
F-203

33. Forward rate agreement (“FRA”)/Interest rate swaps (“IRS”)
The details of the forward rate agreements/interest rate swaps are given below:
Particulars
As on
March 31, 2008
As on
March 31, 2007
(Rupees in million)
i) The notional principal of rupee swap agreements1 ................................. 5,618,122.6 2,389,261.3ii) Losses which would be incurred if all counter parties failed to fulfil
their obligations under the agreement ..................................................... 37,181.6 37,605.4iii) Collateral required by the Bank upon entering into swaps..................... — —iv) Concentration of credit risk arising from the rupee swaps2 ................... 307.5 657.9v) The fair value of rupee trading swap book3 ........................................... (120.9) 1,111.4
1. Notional principal of swap agreements includes both hedge and trading portfolio.
2. Credit risk concentration is measured as the highest net receivable under swap contracts from a particularcounter-party.
3. Fair value represents dirty mark-to-market.
34. Exchange traded interest rate derivatives
The details of exchange traded interest rate derivatives are given below:
Particulars
As on
March 31, 2008
As on
March 31, 2007
(Rupees in million)
i) Notional principal amount of exchange tradedinterest rate derivatives undertaken during theyear (instrument-wise)a) Euro dollar futures ......................................................................... — —b) Treasury note futures — 10 years .................................................. 7,021.0 22,476.0c) Treasury note futures — 5 years.................................................... 4,557.6 3,399.0d) Treasury note futures — 2 years.................................................... 1,380.1 N.A
ii) Notional principal amount of exchange tradedinterest rate derivatives outstanding (instrument-wise)a) Euro dollar futures ......................................................................... — —b) Treasury note futures — 10 years .................................................. — 652.1c) Treasury note futures — 5 years.................................................... — 130.4d) Treasury note futures — 2 years.................................................... — —
iii) Notional principal amount of exchange tradedinterest rate derivatives outstanding and not“highly effective ” (instrument-wise) ...................................................... N.A N.A
iv) Mark-to-market value of exchange tradedinterest rate derivatives outstanding and not“highly effective” (instrument-wise) ....................................................... N.A N.A
Note: All the transactions in exchange traded derivatives have been entered into by foreign branches for tradingportfolio.
F-204

35. Penalties/fines imposed by RBI and other regulatory bodies
There were no penalties imposed by RBI during the year ended March 31, 2008 (March 31, 2007: Rs.Nil).
Securities and Futures Commission (SFC), Hong Kong had charged the Bank with carrying on thebusiness of dealing in securities in Hong Kong without having a license to do so. Pursuant to the chargespreferred vide issue of summons on March 30, 2007 and the submissions of SFC and the Bank, the EasternMagistrate’s Court, Hong Kong, on April 10, 2007, fined the Bank a sum of HKD 40,000 (Rs. 0.2 million) andrequired the Bank to reimburse investigation costs to SFC.
36. Premium amortisation
As per general clarification from RBI dated July 11, 2007 on circular DBOD.BP.BC.87/21.04.141/2006-07 dated April 20, 2007, the Bank has deducted the amortisation of premium on governmentsecurities from “Income on investment” in Schedule 13, which was earlier included in “Profit/(Loss) onrevaluation of investments (net)” in Schedule 14.
37. Small and micro industries
Under the Micro, Small and Medium Enterprises Development Act, 2006 which came into force fromOctober 2, 2006, certain disclosures are required to be made relating to Micro, Small and Medium enterprises.There have been no reported cases of delays in payments to micro and small enterprises or of interest paymentsdue to delays in such payments.
38. Farm loan waiver
The Union Finance Minister, in his budget proposal for Financial Year 2008-09, announced a debt reliefscheme for farmers, which would cover agricultural loans disbursed by scheduled commercial banks, regionalrural banks and co-operative credit institutions up to March 31, 2007, overdue as on December 31, 2007 andwhich remained unpaid upto February 28, 2008. The Bank has not considered any expected receipts and hasretained provisions on all eligible loans as per its current provisioning norms, pending the quantification andacceptance of its claims as per guidelines of the debt relief scheme.
39. Disclosure of complaints
The movement of the outstanding numbers of complaints is given below:
Particulars
Year ended
March 31, 20081
Year ended
March 31, 2007
a) No. of complaints pending at the beginning of the year ........................ 579 777b) No. of complaints received during the year ............................................ 185,431 35,462c) No. of complaints redressed during the year .......................................... 184,147 35,660d) No. of complaints pending at the end of the year .................................. 1,863 579
1. Includes,
a) complaints received via customer service touch points (phone banking) with effect from October 1, 2007,
b) complaints received through e-mail with effect from April 1, 2007.
c) The number of complaints are not comparable with the previous year due to the implementation of the abovecomplaint tracking mechanism during the year.
F-205

The details of awards during the year is given below:
Particulars
Year ended
March 31, 2008
Year ended
March 31, 2007
a) No. of unimplemented awards at the beginning of the year................... 41 0b) No. of awards passed by the Banking Ombudsmen during the year ...... 7 7c) No. of awards implemented during the year ........................................... 6 3d) No. of unimplemented awards at the end of the year............................. 1 4
1. The 4 awards pending as on March 31, 2007, had become null and void, as customers did not accept them.
40. Change in estimate in the retail agriculture loan portfolios provisioning
During the year, the Bank has changed its basis of estimating provisions in respect of certain retailagriculture loan portfolios. The impact of the change on the profit after tax for the year ended March 31, 2008is not significant.
41. Comparative figures
Figures for the previous year have been regrouped wherever necessary, to conform to the current year‘spresentation.
SIGNATURES TO SCHEDULES 1 TO 19
For and on behalf of the Board of Directors
N. VaghulChairman
K. V. KamathManaging Director & CEO
Chanda D. KochharJoint Managing Director & CFO
V. VaidyanathanExecutive Director
Madhabi Puri BuchExecutive Director
Sonjoy ChatterjeeExecutive Director
Sandeep BatraGroup Compliance Officer
& Company Secretary
Rakesh JhaDeputy Chief Financial Officer
Charanjit AttraGeneral Manager & Chief Accountant
Place: MumbaiDate: April 26, 2008
F-206

ISSUER
ICICI BANK LIMITEDacting through its Hong Kong Branch
Unit 1504B-1505, Level 15International Commerce Centre1 Austin Road West, Kowloon
Hong Kong
LEGAL ADVISORS
To the Issuer as to United States lawDavis Polk & Wardwell LLP
450 Lexington AveNew York, NY
U.S.A.
To the Initial Purchasers as toUnited States law
Latham & Watkins LLP9 Raffles Place
#42-02Republic Plaza
Singapore 048619
To the Initial Purchasers as toIndian law
Amarchand & Mangaldas &Suresh A. Shroff & Co.
Peninsula Chambers,Peninsula Corporate ParkGanpatrao Kadam Marg
Lower Parel, Mumbai � 400013India
To the Initial Purchasers as toHong Kong law
Latham & Watkins LLP41st Floor, One Exchange Square
8 Connaught Place, CentralHong Kong
To the Trustee as toNew York law
Clifford Chance28th Floor, Jardine House
One Connaught PlaceHong Kong
INDEPENDENT ACCOUNTANTS
BSR & Co. (Until June 28, 2010)Chartered Accountants
KPMG House 11, Citi Studio,Kamala Mills Compound448, Senapati Bapat Marg
Lower Parel, Mumbai�400 013India
S. R. Batliboi & Co. (From June 28, 2010)Chartered Accountants
6th Floor, Express TowersNariman Point, Mumbai — 400 021
India
TRUSTEE & PAYING AGENTThe Bank of New York Mellon
101 Barclay StreetNew York, New York 10286
U.S.A.
SINGAPORE LISTING COUNSELShook Lin & Bok LLP
1 Robinson Road#18-00 AIA TowerSingapore 048 542
US$1,000,000,000
ICICI Bank Limited, acting through its Hong Kong branch
5.75% Notes due 2020
Issue Price: 99.542%
OFFERING MEMORANDUM
Barclays Capital
Citi
Deutsche Bank
November 8, 2010