Embed Size (px)
Citation preview

PanAust Limited For the half-year ended 30 June 2013 (Previous corresponding period: Year ended 31 December 2012) Results for Announcement to the Market
APPENDIX 4D
Half-Year Report
For the Period Ended 30 June 2013
PanAust Limited
ABN 17 011 065 160
US$’000
Sales revenue from ordinary activities Up 6% to 326,051
Sales revenue, derivative gains and other income
Up 12% to 339,324
Profit after income tax Down 38% to 43,416
Profit after income tax for the period attributable to members
Down 38%
to 38,912
Operating result - EBITDA* Down 5% to 130,476
Interim Dividend
The Board of Directors resolved today to pay an interim dividend for the June half-year of 3.00 cents (Australian) per share (unfranked). The interim dividend is to be paid on 25 September 2013 to shareholders on the register as at 7:00pm (AEST) on 5 September 2013 (the Record Date). The full amount of the interim dividend will be paid from conduit foreign income and accordingly, PanAust will not retain Australian withholding tax on distribution of dividend payments to non-resident shareholders. The financial impact of this interim dividend has not been recognised in the financial statements for the half-year ended 30 June 2013 and will be recognised in subsequent financial statements.
Interim Dividend 3.00 cents
Franked amount per share Nil Record date for determining entitlement to dividend 5-Sep-2013 Dividend payment date 25-Sep-2013
The Dividend Reinvestment Plan (DRP) will apply in relation to the interim dividend. The DRP provides eligible shareholders with the option of reinvesting all or part of their dividends in additional PanAust shares without paying any brokerage or other entry costs. Participation in the DRP is voluntary. Eligible shareholders can elect to take up shares in the Company at a price determined by the arithmetic average of the daily volume weighted average price of Shares traded on the Australian Securities Exchange over each of the five trading days commencing on 9 September 2013. No discount will apply to shares issued under the DRP for this interim dividend. Shares issued under the DRP will rank equally with existing ordinary fully paid shares.
Key Ratios 30 June 2013 30 June 2012
Basic earnings per share (cents) 6.54 10.57
Net tangible assets backing per ordinary share ($) 1.65 1.51
The accompanying financial report, comprises the balance sheet as at 30 June 2013, the statement of profit or loss and other comprehensive income, statement of changes in equity and cash flow statement for the period ended on that date, a summary of accounting policies, other notes and directors’ report.
* Operating results – EBITDA* is an adjusted measure of earnings before interest, taxes, depreciation and
amortisation (EBITDA). This measurement basis equals net profit before tax excluding the effects of profit or loss items such as depreciation, amortisation, impairment, interest revenue and interest expense. This measurement also excludes the effects of equity-settled share-based payments, exploration costs expensed and the provision for rehabilitation expensed (refer to note 3 of the consolidated financial statements).
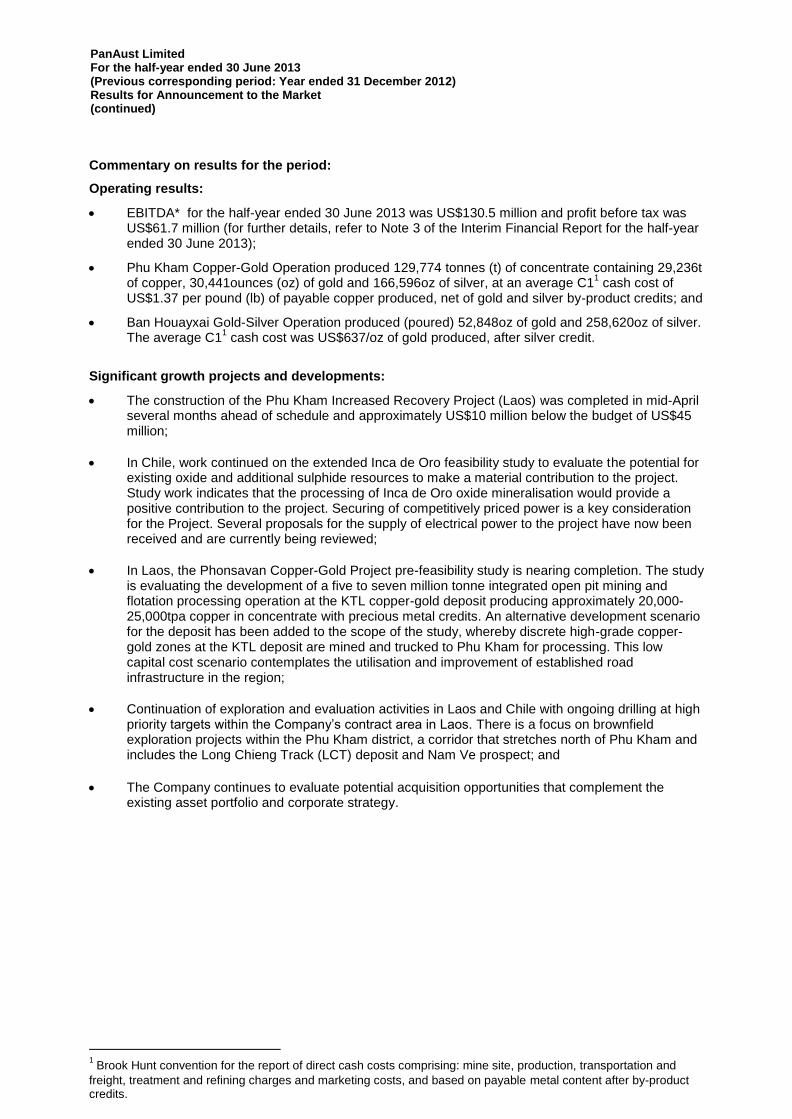
PanAust Limited For the half-year ended 30 June 2013 (Previous corresponding period: Year ended 31 December 2012) Results for Announcement to the Market (continued)
Commentary on results for the period:
Operating results:
EBITDA* for the half-year ended 30 June 2013 was US$130.5 million and profit before tax was US$61.7 million (for further details, refer to Note 3 of the Interim Financial Report for the half-year ended 30 June 2013);
Phu Kham Copper-Gold Operation produced 129,774 tonnes (t) of concentrate containing 29,236t of copper, 30,441ounces (oz) of gold and 166,596oz of silver, at an average C1
1 cash cost of
US$1.37 per pound (lb) of payable copper produced, net of gold and silver by-product credits; and
Ban Houayxai Gold-Silver Operation produced (poured) 52,848oz of gold and 258,620oz of silver. The average C1
1 cash cost was US$637/oz of gold produced, after silver credit.
Significant growth projects and developments:
The construction of the Phu Kham Increased Recovery Project (Laos) was completed in mid-April several months ahead of schedule and approximately US$10 million below the budget of US$45 million;
In Chile, work continued on the extended Inca de Oro feasibility study to evaluate the potential for existing oxide and additional sulphide resources to make a material contribution to the project. Study work indicates that the processing of Inca de Oro oxide mineralisation would provide a positive contribution to the project. Securing of competitively priced power is a key consideration for the Project. Several proposals for the supply of electrical power to the project have now been received and are currently being reviewed;
In Laos, the Phonsavan Copper-Gold Project pre-feasibility study is nearing completion. The study is evaluating the development of a five to seven million tonne integrated open pit mining and flotation processing operation at the KTL copper-gold deposit producing approximately 20,000-25,000tpa copper in concentrate with precious metal credits. An alternative development scenario for the deposit has been added to the scope of the study, whereby discrete high-grade copper-gold zones at the KTL deposit are mined and trucked to Phu Kham for processing. This low capital cost scenario contemplates the utilisation and improvement of established road infrastructure in the region;
Continuation of exploration and evaluation activities in Laos and Chile with ongoing drilling at high priority targets within the Company’s contract area in Laos. There is a focus on brownfield exploration projects within the Phu Kham district, a corridor that stretches north of Phu Kham and includes the Long Chieng Track (LCT) deposit and Nam Ve prospect; and
The Company continues to evaluate potential acquisition opportunities that complement the existing asset portfolio and corporate strategy.
1 Brook Hunt convention for the report of direct cash costs comprising: mine site, production, transportation and
freight, treatment and refining charges and marketing costs, and based on payable metal content after by-product credits.

PanAust Limited ABN 17 011 065 160
Interim Financial Report for the half-year ended 30 June 2013

PanAust Limited ABN 17 011 065 160
Interim Financial Report For the half-year ended 30 June 2013
Contents
Page
Directors' report 1 Interim financial statements
Consolidated statement of comprehensive income 12 Consolidated balance sheet 13 Consolidated statement of changes in equity 14 Consolidated statement of cash flows 15 Notes to consolidated financial statements 16
Directors' declaration 31 Independent auditor's review report to the members 32
This interim financial report does not include all the notes of the type normally included in an annual financial report. Accordingly, this report is to be read in conjunction with the annual report for the year ended 31 December 2012 and any public announcements made by PanAust Limited during the interim reporting period in accordance with the continuous disclosure requirements of the Corporations Act 2001.
PanAust Limited is a company limited by shares, incorporated and domiciled in Australia. Its registered office and principal place of business is:
PanAust Limited Level 1 15 James Street
Fortitude Valley, Queensland AUSTRALIA 4006
Postal address is:
PanAust Limited PO Box 2297 Fortitude Valley BC, Queensland AUSTRALIA 4006

PanAust Limited Directors' report
For the half-year ended 30 June 2013
1
Directors' report Your Directors present their report on the consolidated entity (referred to hereafter as the 'Company', ‘Group’ or 'PanAust') consisting of PanAust Limited and the entities it controlled at the end of, or during, the half-year ended 30 June 2013.
Directors
Garry Hounsell B.Bus. (Accounting) FCA CPA FAICD (Chairman, Non-Executive Director)
Gary Stafford B.Sc. (Hons, Mining Engineering) MAusIMM (Managing Director)
Nerolie Withnall B.A., LLB FAICD (Non-Executive Director)
Geoff Handley B.Sc. (Hons, Geology and Chemistry) MAusIMM FAICD. Acc. Dir. (Non-Executive Director)
Geoff Billard B.Econ., B.Com. (Hons, Economics) FCPA FAICD (Non-Executive Director)
Zezhong Li M.Laws, M.Public Administration International Development (Non-Executive Director)
John Crofts B.Bus. (Transport, Economics & Accounting) (Non-Executive Director)
Ken Pickering B.Applied Science (Mineral Engineering) (Non-Executive Director)
Annabelle Chaplain B.A., MBA FAICD (Non-Executive Director)
Principal activities
PanAust Limited is an Australia-based mining company. The principal activities of the Group during the half-year ended 30 June 2013 were as follows:
(a) Production and sale of copper-gold concentrate from the Phu Kham Copper-Gold Operation, Laos; (b) Production and sale of gold-silver doré from the Ban Houayxai Gold-Silver Operation, Laos; and (c) Exploration and evaluation of projects in Laos and Chile.
Significant changes in the state of affairs
Significant changes in the state of affairs of the Group during the half-year ended 30 June 2013 and to the date of this report were as follows: • The half-year captured the first full six months of production and costs from the expanded operations at Phu
Kham following the completion of the Phu Kham Upgrade at the end of October 2012 (prior to which costs were capitalised). Implementation of the Upgrade was designed to increase annual ore processing rates from 12 million tonnes to 16 million tonnes and timed to compensate for a scheduled reduction in ore head grade.
• Construction of the Increased Recovery Project at Phu Kham was completed in mid-April with the ramp-up
and optimisation well advanced by 30 June 2013. Accordingly, copper recovery rates for all ore types have steadily increased and in June the relative improvement in copper recovery was estimated to be five percentage points which is consistent with the design recovery model.
• New Ore Reserves for Phu Kham and Ban Houayxai were announced to the ASX on 19 February 2013. Life of Mine (LOM) plans are being developed for each operation. The LOM plan for Phu Kham will consider the impact of higher annual processing rates of 18 million tonnes compared to the design rate of 16 million tonnes. Scheduling for the Ban Houayxai LOM plan has confirmed that the Ban Houayxai Operation should produce 110,000 ounces of gold during 2013.
• A pre-feasibility study is underway at the Phonsavan Copper-Gold Project and is scheduled to be completed during the September quarter 2013. The study is evaluating the development of an integrated open pit mining and flotation processing operation at the KTL copper-gold deposit producing approximately 20,000-25,000 tonnes per annum copper in concentrate with precious metals credits. Trucking of higher-grade mineralisation to Phu Kham for processing is also being evaluated as an alternative development scenario to the integrated mining and processing approach.
• On 22 January 2013, Phu Bia Mining Limited, a subsidiary of the Group, entered into amended agreements for debt facilities totalling US$275 million. The facilities comprise a US$250 million revolving debt facility with a syndicate of seven banks led by ANZ bank, and a US$25 million working capital facility with ANZ (Laos).
PanAust Limited Directors' report For the half-year ended 30 June 2013 (continued)
2
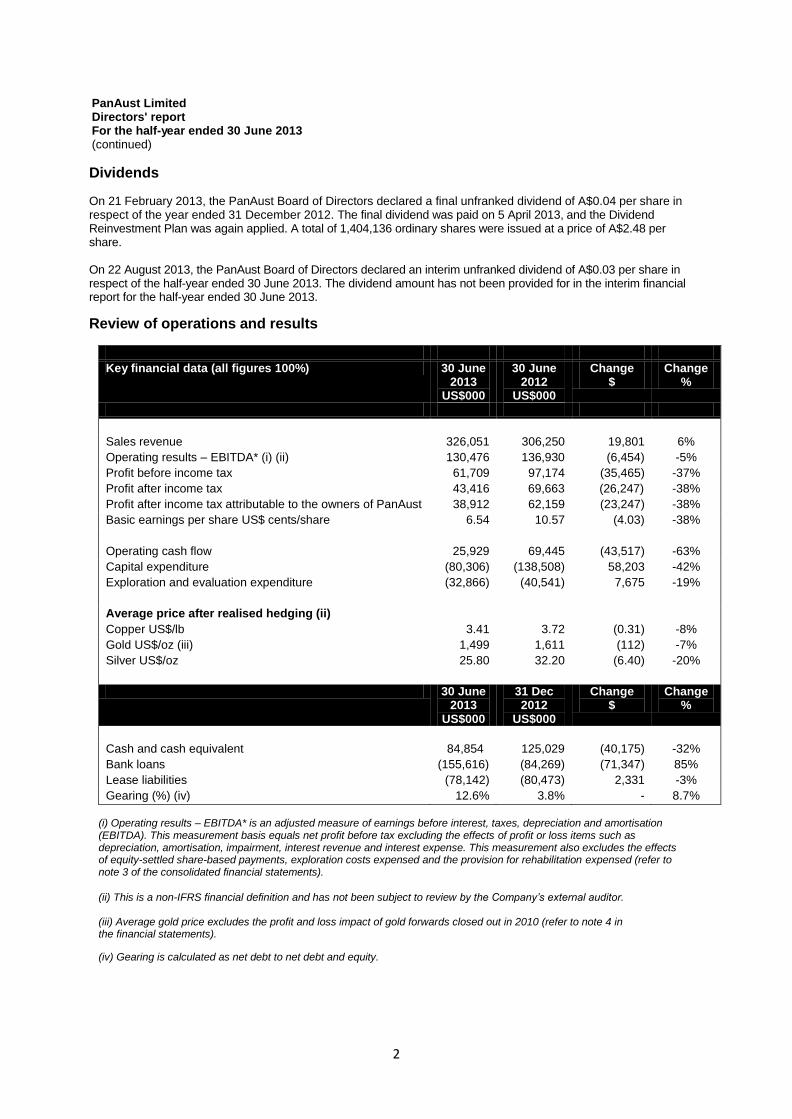
Dividends
On 21 February 2013, the PanAust Board of Directors declared a final unfranked dividend of A$0.04 per share in respect of the year ended 31 December 2012. The final dividend was paid on 5 April 2013, and the Dividend Reinvestment Plan was again applied. A total of 1,404,136 ordinary shares were issued at a price of A$2.48 per share. On 22 August 2013, the PanAust Board of Directors declared an interim unfranked dividend of A$0.03 per share in respect of the half-year ended 30 June 2013. The dividend amount has not been provided for in the interim financial report for the half-year ended 30 June 2013. Review of operations and results
Key financial data (all figures 100%) 30 June 2013
US$000
30 June 2012
US$000
Change $
Change %
Sales revenue 326,051 306,250 19,801 6%
Operating results – EBITDA* (i) (ii) 130,476 136,930 (6,454) -5%
Profit before income tax 61,709 97,174 (35,465) -37%
Profit after income tax 43,416 69,663 (26,247) -38%
Profit after income tax attributable to the owners of PanAust 38,912 62,159 (23,247) -38%
Basic earnings per share US$ cents/share 6.54 10.57 (4.03) -38%
Operating cash flow 25,929 69,445 (43,517) -63%
Capital expenditure (80,306) (138,508) 58,203 -42%
Exploration and evaluation expenditure (32,866) (40,541) 7,675 -19%
Average price after realised hedging (ii)
Copper US$/lb 3.41 3.72 (0.31) -8%
Gold US$/oz (iii) 1,499 1,611 (112) -7%
Silver US$/oz 25.80 32.20 (6.40) -20%
30 June 2013
US$000
31 Dec 2012
US$000
Change $
Change %
Cash and cash equivalent 84,854 125,029 (40,175) -32%
Bank loans (155,616) (84,269) (71,347) 85%
Lease liabilities (78,142) (80,473) 2,331 -3%
Gearing (%) (iv) 12.6% 3.8% - 8.7%
(i) Operating results – EBITDA* is an adjusted measure of earnings before interest, taxes, depreciation and amortisation (EBITDA). This measurement basis equals net profit before tax excluding the effects of profit or loss items such as depreciation, amortisation, impairment, interest revenue and interest expense. This measurement also excludes the effects of equity-settled share-based payments, exploration costs expensed and the provision for rehabilitation expensed (refer to note 3 of the consolidated financial statements).
(ii) This is a non-IFRS financial definition and has not been subject to review by the Company’s external auditor. (iii) Average gold price excludes the profit and loss impact of gold forwards closed out in 2010 (refer to note 4 in the financial statements).
(iv) Gearing is calculated as net debt to net debt and equity.

PanAust Limited Directors' report For the half-year ended 30 June 2013 (continued)
3
Review of operations and results (continued)
PanAust is a growth-orientated mining company with a reputation for delivering capital efficient mine developments with competitive operating cost structures. The successful expansion of Phu Kham and completion of Ban Houayxai in 2012, together with the Increased Recovery Project during the June half 2013 and a conservatively geared and strong balance sheet will provide a broad cash flow platform to support the Company’s growth. Phu Kham continues to perform strongly following ramp-up of ore processing rates after completion of the Upgrade with further improvements expected following implementation of the Increased Recovery Project and Ban Houayxai has emerged as a low cost gold producer. Completion of the Increased Recovery Project at Phu Kham signals the conclusion of approximately US$350 million of capital development projects over the past three years. Looking ahead to the December half, with lower capital expenditures forecast, cash flow is expected to benefit from higher scheduled production and lower sustaining capital at both Phu Kham and Ban Houayxai. Profit after income tax Profit after income tax decreased 38% to US$43.4 million on higher revenue compared to the corresponding period in 2012. The June half 2013 results captured a full six months of production and operating costs from Ban Houayxai (compared to one month in the corresponding period in 2012) and a full half of expanded operations at Phu Kham (following the completion of the Phu Kham Upgrade at the end of October 2012). However, copper, gold and silver prices were lower and depreciation and amortisation charges increased commensurate with the completion of Ban Houayxai in June 2012 and the completion of the Phu Kham Upgrade.
PanAust Group sales revenue for the half-year ended 30 June 2013 increased by US$19.8 million (6%) compared with the previous corresponding period (US$326.1 million). Phu Kham contributed US$242.2 million to Group revenue (before derivative gains/losses) – down 17%. Copper sales were down 6% from the corresponding period in 2012 and the average realised price of copper was 13% lower. Although gold sales at Phu Kham remained stable, the average realised price of gold received was 10% lower. The impact of lower Phu Kham sales revenue was more than offset by increased gold-silver doré sales from the Ban Houayxai Gold-Silver operation over a full six months of production in 2013 compared to one month in the corresponding period in 2012. Overall, Ban Houayxai contributed US$85.9 million in sales revenue in the reporting period, representing 26% of Group sales revenue. Copper derivative gains of US$12.3 million were recognised for the half-year ended 30 June 2013, partially offsetting the decreased revenue from the fall in copper prices, compared with a US$1.4 million loss in the first half of 2012. Total mining operations costs increased US$36.3 million (41%) to US$124.3 million reflecting a complete half-year of production at the Ban Houayxai Operation in 2013 together with increased material mined and processed at Phu Kham. The increase in absolute costs at Phu Kham was primarily due to a 17% increase in total material mined and a 21% increase in ore processed as Phu Kham transitioned to lower grade ore. Employee benefits increased compared to the corresponding period in 2012 by 48% to US$48.0 million, mainly attributable to a complete half-year of production at Ban Houayxai in the June half 2013 and the transfer of employees from construction and pre-operating duties (costs capitalised) at Ban Houayxai and the Phu Kham Upgrade to commercial production operational duties (where costs are expensed). Prior to the commencement of commercial production at Ban Houayxai on 1 June 2012 the number of operational employees (costs expensed) across the Group was 2,168. Since that date, the number of operational employees has increased by 48% to 3,213. The Phu Kham employee numbers grew from 1,716 to 1,879 and there are 680 employees at Ban Houayxai. The balance (202) of the growth in employee numbers, relates to concentrate logistics (full six months of owner-operate), security personnel (move from contractor to direct employment) and shared services in Vientiane, Laos.

PanAust Limited Directors' report For the half-year ended 30 June 2013 (continued)
4
Review of operations and results (continued)
Changes in the value of inventories during the half-year ended 30 June 2013 resulted in an increase in the value of (at cost) stockpiles on hand, since 31 December 2012, of US$16.1 million, comprising gold doré and gold in circuit valued at US$6.4 million, copper-gold concentrate valued at US$15.8 million and stockpiles of ore valued at
US$24.1 million; compared to values at 31 December 2012 of US$7.1 million, US$10.8 million and US$12.2 million respectively. Depreciation and amortisation charges increased compared to the corresponding period in 2012 by US$25.5 million. The increase is partly attributable to a complete half-year of depreciation of the Ban Houayxai assets (US$15.6 million) with depreciation on the Phu Kham Upgrade plant and associated mobile equipment which was commissioned in late 2012 accounting for most of the balance. EBITDA*
The June half 2013 EBITDA* reduced US$6.5 million (5%) compared with the corresponding period in 2012 to US$130.5 million. Increased sales from a full half- year of production from the Ban Houayxai Gold-Silver operation, favourable non-cash adjustments for increases in stockpiles and deferred waste were offset by lower commodity prices and an increase in total operating costs. The increase in operating costs was commensurate with a full half-year of operations at Ban Houayxai and a full half-year of expanded operations at Phu Kham following the completion of the Phu Kham Upgrade. Operating cash flow
Operating cash flow decreased 63% compared to the corresponding period in 2012 to US$25.9 million in 2013. The decrease is largely a reflection of: lower realised copper, gold and silver prices; higher total costs associated with an increase in material mined and processed; and a US$17.6 million build-up of stores inventory to accommodate wet season demands. Review of operations and results by segment
To ensure the optimal structure for a rapidly growing and geographically diverse business, PanAust is structured into three business units: PanAust Asia, PanAust South America, and Project Development. Corporate functions provide support to the three business units, in particular financial control; strategic direction; management of Group-wide geological activities (including exploration); and, the oversight of the corporate governance function.
The following sections report on operations, exploration and project development activity within the PanAust Asia and the PanAust South America business units.

PanAust Limited Directors' report For the half-year ended 30 June 2013 (continued)
5
Review of operations and results (continued)
PanAust Asia
Key operational data Measure 30 June
2013 30 June
2012 Change
Change %
Phu Kham operation
Ore mined T 9,174,219 6,572,762 2,601,457 40%
Waste mined T 10,986,522 10,695,083 291,438 3%
Total material mined T 20,160,741 17,267,845 2,892,895 17%
Total material milled Dmt 8,453,020 7,001,904 1,451,116 21%
Concentrate produced Dmt 129,774 124,023 5,751 5%
Copper produced T 29,236 29,681 (445) -1%
Gold produced Oz 30,441 28,923 1,518 5%
Silver produced Oz 166,596 236,087 (69,491) -29%
Average C1 cash cost (i) (iv) US$/lb copper
1.37 1.03 0.34 33%
Payable copper in concentrate sold T 27,070 28,716 (1,646) -6%
Payable gold in concentrate sold Oz 30,013 30,108 (95) 0%
Payable silver in concentrate sold Oz 165,651 215,885 (50,234) -23%
Ban Houayxai operation (ii)
Ore mined T 2,584,126 832,398 1,751,728 210%
Waste mined T 1,191,168 783,423 407,745 52%
Total material mined T 3,775,294 1,615,821 2,159,473 134%
Total material milled Dmt 2,062,987 534,586 1,528,401 286%
Gold poured Oz 52,848 12,664 40,184 317%
Silver poured Oz 258,620 10,074 248,546 2467%
Average C1 cash cost (iii) (iv) US$/oz gold 637 514 123 24%
Payable gold in doré sold Oz 52,632 9,552 43,080 451%
Payable silver in doré sold Oz 248,036 7,044 240,992 3421% (i) Average C1 cash cost is per pound of payable copper produced, net of gold and silver byproduct credits (C1, Brook Hunt Convention). (ii) The first gold-silver doré was poured at the Ban Houayxai Gold-Silver Operation on 1 May 2012; commercial production was declared from 1 June 2012. (iii) Average C1 cash cost is per ounce of gold produced, net of silver byproduct credits (C1, Brook Hunt Convention). (iv) C1 Cash Costs (a non-IFRS financial definition) and key operational data have not been subject to review by the Company’s external auditor.

PanAust Limited Directors' report For the half-year ended 30 June 2013 (continued)
6
Review of operations and results (continued) PanAust Asia (continued) Phu Kham Copper-Gold Operation, Laos (PanAust 90%)
Phu Kham finished the half-year strongly with successive monthly mining records achieved for total material mined and ore mined. The operation continued to process ore at a rate above the plant nameplate capacity of 16Mtpa (million tonnes per annum) with total ore processed for the half-year of 8.5Mt to produce 129,774t of concentrate containing 29,236t of copper, 30,441oz of gold and 166,596oz of silver (June half 2012: 124,023t of concentrate containing 29,681t of copper, 28,923oz of gold and 236,087 of silver). The average cash cost, net of by-product credits (C1 Brook Hunt convention) for the half-year was US$1.37/lb copper (June half 2012: US$1.03/lb). The difference in cash costs largely reflects lower grades of ore processed and lower realised prices for precious metal credits. Phu Kham Increased Recovery Project Construction of the Increased Recovery Project was completed in mid-April, several months ahead of schedule and approximately US$10 million below the budget of US$45 million. The Project is designed to increase metallurgical recovery rates for copper and gold, each by approximately six percentage points and is expected to result in a reduction in cash costs. The Project stems from a two-year evaluation of various methods to improve metallurgical recoveries at Phu Kham. Plant-scale test work (four separate trials) confirmed that by incorporating a strategy of less selective rougher flotation in combination with additional regrind and cleaner flotation capacity, life-of-mine recovery rates for both copper and gold could be significantly increased. Ramp-up and optimisation was well advanced at 30 June 2013 with copper recovery rates steadily increasing. In June 2013 the relative improvement in copper recovery was estimated to be five percentage points, consistent with the design recovery model. Tailings Storage Facility Sustaining capital expenditure at Phu Kham has historically been dominated by development costs associated with progressive construction of the Tailings Storage Facility (TSF) retaining wall. The most recent TSF lift was completed during the June 2013 quarter, and has resulted in a substantial increase in tailings catchment. A review is being undertaken to determine when the next TSF lift will be required, however, it is envisaged that expenditures for the next twelve months will be significantly reduced. Ban Houayxai Gold-Silver Operation, Laos (PanAust 90%)
The Ban Houayxai Gold-Silver Operation is PanAust's second operation. It is located 25 kilometres west of the Phu Kham Copper-Gold Operation in Laos. Ban Houayxai commenced production of gold-silver doré in May 2012 and commercial production was declared from 1 June 2012. Ban Houayxai performed strongly during the half-year with ore processing rates above the design capacity of 4Mtpa achieved on a blend of softer ores. During the half-year, a total of 2.1 million tonnes of ore were processed to produce doré containing 52,848oz of gold and 258,620oz of silver. The silver grade of ore processed has steadily increased with a greater proportion of transitional ore in mill feed. The Operation has emerged as a low cost gold producer on both a C1 and total cash cost (including royalty, sustaining capital and lease principal and interest charges) basis. The average C1 cash cost was US$637/oz of gold after silver credits. Total cash cost for the June half 2013 was US$878/oz after silver credits.

PanAust Limited Directors' report For the half-year ended 30 June 2013 (continued)
7
Review of operations and results (continued) PanAust Asia (continued) Pre-development and exploration projects PanAust has a corporate strategy focused on growth by discovery, acquisition and development. Key components of this strategy are: a commitment to progressing capital efficient organic growth opportunities; the acquisition of producing or pre-development copper assets; and pursuit of an active exploration and resource development program in Laos and Chile. Phonsavan Copper-Gold Project, Laos (PanAust 90%) A pre-feasibility study is underway at the Phonsavan Copper-Gold Project and will be completed during the September quarter 2013. The study is evaluating the development of a five to seven million tonne integrated open pit mining and flotation processing operation at the KTL copper-gold deposit producing approximately 20,000-25,000tpa copper in concentrate with precious metal credits. An alternative development scenario for the deposit has recently been added to the scope of the study, whereby discrete high-grade copper gold zones at the KTL deposit are mined and trucked to Phu Kham for processing. This low capital cost scenario contemplates the utilisation and improvement of established road infrastructure in the region. Phu Kham district, Laos (PanAust 90%)
The Phu Kham district is a high priority target for exploration and resource development. Several targets have been identified in a corridor that stretches at least six kilometres from Phu Kham northwest to the Long Chieng Track (LCT) deposit and beyond to the Nam Ve prospect which is seven kilometres northwest of LCT. Puthep Copper Project, Thailand (PanAust 49%) PanAust has commenced a trade sale process for the Puthep Copper Project in conjunction with its joint venture partner, Padaeng Industry Public Company Limited (Padaeng). PanAust holds a 49% beneficial interest in the Project. In mid-2012, an Information Memorandum on the Puthep Copper Project was compiled for the benefit of potential interested parties. As at 30 June 2013, there were a number of interested parties partaking in the potential sale process. PanAust South America Inca de Oro Copper-Gold Project (60.45% PanAust, joint venture with Codelco), Chile The Inca de Oro sulphide feasibility study, which was completed in the June quarter 2012, concluded that the cost profile after the first five years of production needed to be improved for the Inca de Oro Project to be economically robust. The joint venture partners agreed that there was significant potential to improve the project through evaluation of the oxide resources at Inca de Oro and the definition and the potential identification and incorporation of higher value mineralisation from nearby deposits into the development plan. Work continued during the June half of 2013 on the extended Inca de Oro feasibility study to evaluate the potential for existing oxide and additional sulphide resources to make a material contribution to the project. Study work indicates that the processing of Inca de Oro oxide mineralisation would provide a positive contribution to the project. Securing of competitively priced power is a key consideration for the Project. Several proposals for the supply of electrical power to the project are being reviewed.

PanAust Limited Directors' report For the half-year ended 30 June 2013 (continued)
8
Review of operations and results (continued) PanAust South America (continued) Carmen Copper-Gold Deposit, Chile (100% PanAust) A program of drilling was undertaken during the June half of 2013 at the Carmen deposit which is situated approximately 14 kilometres southwest of Inca de Oro. The Carmen deposit is near surface and, subject to the results of the feasibility study, may support a low strip ratio satellite open-pit to augment Inca de Oro mill feed. PanAust’s strategy is to demonstrate that the incorporation into the mining schedule of higher value (through a higher contained metal value and potentially lower strip ratio) mineralisation from Carmen will materially improve the operating cost profile identified in the feasibility study for the Inca de Oro Project and thereby improve the robustness of that project. Likely developments and expected results of operations
PanAust is well positioned to achieve full year production of 62,000t to 65,000t of copper in concentrate and precious metal production in concentrate and doré of 160,000oz to 175,000oz of gold and approximately one million ounces of silver. Metallurgical recovery rates at Phu Kham are expected to improve as the benefits of the Increased Recovery Project are realised together with scheduled improvements in ore quality during the December half 2013. The Phu Kham Operation is likely to process more than 17 million tonnes of ore for the full year in 2013 on a blend of moderate and hard ores. Strong operating performance is expected to continue at the Ban Houayxai Gold-Silver Operation. The Operation is expected to produce approximately 110,000 oz of gold in 2013, its first full year of operation.
PanAust has a corporate strategy focused on growth by discovery, acquisition and development. Key components of this strategy are: a commitment to progressing capital efficient organic growth opportunities; the acquisition of producing or pre-development copper assets; and pursuit of an active exploration and resource development program in Laos and Chile. Resource development at the Phonsavan Copper-Gold Project and brownfield successes in the Phu Kham district have the potential to secure further growth in the medium to longer term. With the operations performing to plan, the single most material business risk exposure to the achievement of anticipated financial outcomes is the impact on future sales revenue of changes in commodity prices for copper, gold and silver.

PanAust Limited Directors' report For the half-year ended 30 June 2013 (continued)
9
Sustainability and safety PanAust recognises that sustainable business development is essential for its ongoing success particularly as a Company with a significant presence in a developing country such as Laos. The Company has an important role to play in improving the standard of living of current and future generations through meeting the global demand for copper and precious metals in a responsible way. The Company’s 2012 Sustainability Report was released on 31 May 2013. This report met the requirements of Application Level A+ of the Global Reporting Initiative (GRI) reporting framework. Contribution in the local Community
PanAust supports community development in villages affected by the Company’s mining operations, exploration activities and haulage routes through dedicated community development funds. The goal of these programmes is to help communities develop sustainable socioeconomic livelihoods that will continue beyond the life of the mine. In the vicinity of Phu Kham, Ban Houayxai and Phonsavan, PanAust continues to advance a number of community development projects with a focus on agriculture, education, health, infrastructure and small business development. Further discussion in relation to these community development projects can be found in the 2012 PanAust Sustainability Report published on the Company's website. Safety PanAust’s safety performance continues to be a strong focus of the Company. The Total Recordable Injury (TRI) frequency rate (TRI’s per million man hours) as at 30 June 2013 on an annual rolling average basis was 1.62 (30 June 2012: 2.60). The Lost Time Injury (LTI) frequency rate (LTI’s per million man hours) as at 30 June 2013 on an annual rolling average basis was 0.16 (30 June 2012: 0.14). The Company’s focus is to continue improving its safety performance through targeting “hotspot” areas, with a focus on contractor management, passenger transport, vehicle safety specifications and working at heights. Environment There were no significant environmental incidents (Level 4 or 5 incidents as defined in the 2012 Sustainability Report) during the half-year ended 30 June 2013 (2012: nil).

PanAust Limited Directors' report For the half-year ended 30 June 2013 (continued)
10
Auditor independence declaration A copy of the Auditors' Independence Declaration as required under section 307C of the Corporations Act 2001 is attached on page 32.
Rounding of amounts The Company is of a kind referred to in Class Order 98/100, issued by the Australian Securities and Investments Commission, relating to the 'rounding off' of amounts in the directors' report. Amounts in the directors' report have been rounded off in accordance with that Class Order to the nearest thousand dollars, or in certain cases, to the nearest dollar.
Auditor PricewaterhouseCoopers continues in office in accordance with the Corporations Act 2001.
This report is made in accordance with a resolution of Directors.
Garry Hounsell Director
Gary Stafford Director Sydney 22 August 2013

PricewaterhouseCoopers, ABN 52 780 433 757Riverside Centre, 123 Eagle Street, BRISBANE QLD 4000, GPO Box 150, BRISBANE QLD 4001T: +61 7 3257 5000, F: +61 7 3257 5999, www.pwc.com.au
Liability limited by a scheme approved under Professional Standards Legislation.11
Auditor’s Independence Declaration
As lead auditor for the review of PanAust Limited for the half year ended 30 June 2013, I declare thatto the best of my knowledge and belief, there have been:
a) no contraventions of the auditor independence requirements of the Corporations Act 2001 inrelation to the review; and
b) no contraventions of any applicable code of professional conduct in relation to the review.
This declaration is in respect of PanAust Limited and the entities it controlled during the period.
Debbie Smith BrisbanePartner 22 August 2013PricewaterhouseCoopers

PanAust LimitedConsolidated statement of profit or loss and other comprehensive incomeFor the half-year ended 30 June 2013
Half-year
Notes
30 June2013
US$'000
30 June2012*
US$'000
Sales revenue 4 326,051 306,250Derivative gains/(losses) 4 12,395 (3,832)
Other income 4 878 1,124Changes in inventories of finished goods and work in progress 16,106 5,976Mining operations costs (124,331) (88,041)Employee benefits expense (48,033) (32,506)Royalties (18,657) (17,278)Copper concentrate haulage (13,578) (13,712)Treatment and refining charges (12,136) (9,661)Marketing, realisation and freight costs (6,588) (6,209)
Other expenses (4,914) (6,456)
127,193 135,655
Interest and finance charges 5 (10,919) (8,686)Depreciation and amortisation expense 9 (54,565) (29,085)
Put option premium expense - (710)
Profit before income tax 61,709 97,174
Income tax expense (18,293) (27,511)
Profit after income tax for the half-year 43,416 69,663
Other comprehensive incomeItems that may be reclassified subsequently to profit or loss:
Cash flow hedges, net of tax 2,081 2,184
Total comprehensive income for the half-year 45,497 71,847
Profit after income tax is attributable to:Owners of PanAust Limited 38,912 62,159
Non-controlling interests 4,504 7,504
43,416 69,663
Total comprehensive income for the half-year is attributable to:Owners of PanAust Limited 40,785 64,125
Non-controlling interests 4,712 7,722
45,497 71,847
Cents Cents
Earnings per share attributable to the ordinary equity holders of theCompany:Basic earnings per share 14 6.54 10.57Diluted earnings per share 14 6.52 10.53
* See note 2 for details regarding the restatement as a result of a change in accounting policyshould be read inconsolidated statement of profit or loss and other comprehensive incomeThe above
conjunction with the accompanying notes.
12

PanAust LimitedConsolidated balance sheetAs at 30 June 2013
Notes
30 June2013
US$'000
31 December2012
US$'000
1 January2012*
US$'000
ASSETSCurrent assetsCash and cash equivalents 84,854 125,029 155,525Receivables and other assets 8 18,424 20,103 15,672Inventories 6 145,671 111,917 56,279
Derivative financial instruments 7 6,647 486 4,248
Total current assets 255,596 257,535 231,724
Non-current assetsReceivables and other assets 8 12,732 21,537 53,449Investments accounted for using the equity method 23,558 23,414 23,151Property, plant and equipment 9 923,742 885,575 507,392Exploration, evaluation, and mine development 10 216,262 183,333 342,871Intangible assets 13,965 13,965 13,965
Derivative financial instruments 7 196 158 2,431
Total non-current assets 1,190,455 1,127,982 943,259
Total assets 1,446,051 1,385,517 1,174,983
LIABILITIESCurrent liabilitiesTrade and other payables 76,341 87,958 84,495Borrowings 11 39,087 113,130 14,961Current tax liabilities 951 23,591 30,418
Provisions 13,174 14,651 13,564
Total current liabilities 129,553 239,330 143,438
Non-current liabilitiesTrade and other payables 587 1,466 3,334Borrowings 11 194,671 51,612 92,019Deferred tax liabilities 31,928 27,472 21,181Provisions 54,427 52,700 34,426
Derivative financial instruments 7 - 2,590 -
Total non-current liabilities 281,613 135,840 150,960
Total liabilities 411,166 375,170 294,398
Net assets 1,034,885 1,010,347 880,585
EQUITYContributed equity 12 552,407 548,029 542,617Reserves 13 35,010 30,738 21,941
Retained earnings 13 338,174 324,395 201,055
PanAustCapital and reserves attributable to owners ofLimited 925,591 903,162 765,613
Non-controlling interests 15 109,294 107,185 114,972
Total equity 1,034,885 1,010,347 880,585
* See note 2 for details regarding the restatement as a result of a change in accounting policyshould be read in conjunction with the accompanying notes.consolidated balance sheetThe above
13

PanAust LimitedConsolidated statement of changes in equityFor the half-year ended 30 June 2013
Attributable to owners ofPanAust Limited
2012Half-yearNotes
Contributedequity
US$'000ReservesUS$'000
RetainedearningsUS$'000
TotalUS$'000
Non-con-trolling
interestsUS$'000
Totalequity
US$'000
1 January 2012Balance at 542,617 21,941 213,119 777,677 116,312 893,989Adjustment relating to change inaccounting policy (net of tax) 2 - - (12,064) (12,064) (1,340) (13,404)
Restated total equity at the beginning offinancial periodthe 542,617 21,941 201,055 765,613 114,972 880,585
Profit after income tax 2 - - 62,159 62,159 7,504 69,663Changes in fair value of cash flow hedges,net of tax - 1,966 - 1,966 218 2,184
Total comprehensive income for theperiod - 1,966 62,159 64,125 7,722 71,847
Transactions with owners in their capacityas owners:Contributions of equity, net of transactioncosts 1,954 - - 1,954 - 1,954Total changes in non-controlling interests - - - - (26,482) (26,482)
Employee share based payments - 1,180 - 1,180 - 1,180
1,954 1,180 - 3,134 (26,482) (23,348)
30 June 2012Balance at 544,571 25,087 263,214 832,872 96,212 929,084
Half year 2013
1 January 2013Balance at 548,029 30,738 336,753 915,520 108,558 1,024,078Adjustment relating to change inaccounting policy (net of tax) 2 - - (12,358) (12,358) (1,373) (13,731)
Restated total equity at the beginning offinancial periodthe 548,029 30,738 324,395 903,162 107,185 1,010,347
Profit after income tax - - 38,912 38,912 4,504 43,416Changes in fair value of cash flow hedges,net of tax - 1,873 - 1,873 208 2,081
Total comprehensive income for theperiod - 1,873 38,912 40,785 4,712 45,497
Transactions with owners in their capacityas owners:Contributions of equity, net of transactioncosts 12 4,378 - - 4,378 - 4,378Total changes in non-controlling interests - - - - 1,547 1,547Dividends provided for or paid - - (25,133) (25,133) (4,150) (29,283)
Employee share based payments 13 - 2,399 - 2,399 - 2,399
4,378 2,399 (25,133) (18,356) (2,603) (20,959)
Balance at 30 June 2013 552,407 35,010 338,174 925,591 109,294 1,034,885
should be read in conjunction with the accompanyingconsolidated statement of changes in equityThe abovenotes.
14

PanAust LimitedConsolidated statement of cash flowsFor the half-year ended 30 June 2013
Half-year30 June
2013US$'000
30 June2012
US$'000
Cash flows from operating activitiesReceipts from customers 331,897 301,262Payments to suppliers and employees (inclusive of goods and services tax) (265,068) (186,264)Receipts for derivatives 3,606 2,510
Payments for income tax (33,801) (41,208)
36,634 76,300
Interest and fees paid (8,447) (4,891)Interest received 199 919
Put option premium paid (2,457) (2,883)
Net cash inflow from operating activities 25,929 69,445
Cash flows from investing activitiesPayments for property, plant and equipment (54,412) (39,901)Payments for brownfield development costs (25,894) (98,607)Payments for exploration and evaluation costs (32,866) (40,541)
Payments for investments in associates (144) (162)
Net cash outflow from investing activities (113,316) (179,211)
Cash flows from financing activitiesProceeds from borrowings 70,660 40,000Proceeds from issues of shares 756 1,954Proceeds from issues of shares to non-controlling interest 1,547 4,642Finance lease payments (11,058) (8,470)Dividends paid to Company's shareholders (21,511) -
Drawdown finance lease 8,727 22,649
Net cash inflow from financing activities 49,121 60,775
Net decrease in cash and cash equivalents (38,266) (48,991)
Cash and cash equivalents at the beginning of the financial year 125,029 155,525
Effects of exchange rate changes on cash and cash equivalents (1,909) 500
Cash and cash equivalents at end of the half-year 84,854 107,034
should be read in conjunction with the accompanying notes.consolidated statement of cash flowsThe above
15
PanAust LimitedNotes to the consolidated financial statementsFor the half-year ended 30 June 2013
1 Summary of significant accounting policies
This interim financial report for the half-year reporting period ended 30 June 2013 has been prepared inaccordance with Accounting Standard AASB 134 Interim Financial Reporting and the Corporations Act 2001.
This interim financial report does not include all the notes of the type normally included in an annual financialreport. Accordingly, this report is to be read in conjunction with the annual report for the year ended 31 December2012 and any public announcements made by PanAust Limited during the interim reporting period in accordancewith the continuous disclosure requirements of the Corporations Act 2001.
(a) Basis of preparation
The accounting policies adopted are consistent with those of the previous financial year and correspondinginterim reporting period except for:
Stripping costs incurred in the production phase of a mining operation
The stripping costs are accounted for as variable production costs to be included in the costs of inventoryproduced during the period in which they are incurred. Stripping costs are capitalised in ‘Mine Properties’ as astripping activity asset when the stripping activity has future economic benefit by providing improved access to anidentified ore body and when the costs associated with the activity can be measured reliably.
Refer to note 2 for the impact of the change in the accounting policy applied retrospectively.
(b) Comparatives
Comparative information has been reclassified where appropriate to enhance comparability.
2 Impacts of the change in the accounting policy – IFRIC 20
IFRIC 20 Stripping Costs in the Production Phase of a Surface Mine (the Interpretation) is effective for annualperiods beginning on or after 1 January 2013. The Interpretation is applied to production stripping costs incurredon or after the beginning of the earliest period presented. The opening balance of any capitalised stripping assetmust be assessed to determine if it relates to a component that will give rise to future improved access. If not, thebalance is written off through opening retained earnings. The tables below present the impact of the Company’sresults due to the change of the above accounting policy.
31 December Increase / 31 December 01 January Increase / 01 January2012 (Decrease) 2012 2012 (Decrease) 2012
(restated) (restated)US$'000 US$'000 US$'000 US$'000 US$'000 US$'000
Balance sheet (extract)Inventory 111,890 27 111,917 56,279 - 56,279Property, plant andequipment 903,910 (18,335) 885,575 525,264 (17,872) 507,392
Deferred tax liabilities (32,049) 4,577 (27,472) (25,649) 4,468 (21,181)
Net assets 1,024,078 (13,731) 1,010,347 893,989 (13,404) 880,585
Retained earnings 336,753 (12,358) 324,395 213,119 (12,064) 201,055
Non-controlling interest 108,558 (1,373) 107,185 116,312 (1,340) 114,972
Total Equity 1,024,078 (13,731) 1,010,347 893,989 (13,404) 880,585
16

PanAust LimitedNotes to the consolidated financial statementsFor the half-year ended 30 June 2013(continued)
2 (continued)Impacts of the change in the accounting policy – IFRIC 20
30 June Increase / 30 June2012 (Decrease) 2012
(restated)US$'000 US$'000 US$'000
Statement of comprehensive income (extract)Change in inventories of finished goods and work in progress 5,501 475 5,976Mining operations costs (82,361) (5,680) (88,041)
Depreciation and amortisation (29,084) (1) (29,085)
Profit before income tax 102,380 (5,206) 97,174
Income tax expense (28,813) 1,302 (27,511)
Profit after income tax 73,567 (3,904) 69,663
Other comprehensive incomeItems that maybe reclassified subsequently to profit or loss:
Cash flow hedges, net of tax 2,184 - 2,184
Total comprehensive income for the half-year 75,751 (3,904) 71,847
Profit after income tax attributable to
Owners of PanAust Limited 65,673 (3,514) 62,159
Non-controlling interest 7,894 (390) 7,504
73,567 (3,904) 69,663
Total comprehensive income is attributable to:
Owners of PanAust Limited 67,639 (3,514) 64,125
Non-controlling interests 8,112 (390) 7,722
75,751 (3,904) 71,847
Basic and diluted earnings per share for the prior year have also been restated. The amount of the change forboth basic and diluted earnings per share was decreased by 0.59 cent per share.
Property, plant and equipment were also impacted with an increase to inventory of9Inventories and Note6NoteUS$27,000 and a reduction by US$18,335,000 to deferred stripping costs.
17

PanAust LimitedNotes to the consolidated financial statementsFor the half-year ended 30 June 2013(continued)
3 Segment information
(a) Description of segments
(i) Business segments
The consolidated entity operates solely in the mining and mineral exploration industry.
(ii) Operating segments
Operating segments have been determined based on the analysis provided in the reports reviewed by the ChiefOperating Decision Maker (CODM), being the Managing Director, in assessing performance and determiningstrategy. The CODM considers the business from a geographic basis represented by: PanAust Asia; PanAustSouth America; and Corporate, which includes Project Development and Operational Improvement. Thecorporate head office in Brisbane provides the business units with support in relation to finance, commercial andtechnical services, risk management, human resources, governance and public reporting. The Corporate andPanAust South America segments are currently disclosed as "Other".
(b) Segment information
PanAust Asia Other Eliminations ConsolidatedUS$'000 US$'000 US$'000 US$'000
Half-year 2013Sales revenue 326,051 - - 326,051Derivative gains 12,395 - - 12,395Interest revenue 54 8,838 (8,693) 199Other revenue 679 - - 679
Total segment revenue 339,179 8,838 (8,693) 339,324
Segment result - EBITDA* (iii) 139,470 (8,994) - 130,476
Segment assets 1,228,164 563,949 (346,062) 1,446,051
Segment liabilities 739,657 7,871 (336,362) 411,166
PanAust Asia Other Eliminations ConsolidatedUS$'000 US$'000 US$'000 US$'000
Half-year 2012Sales revenue 306,250 - - 306,250Derivative losses (3,832) - - (3,832)Interest revenue 77 4,526 (3,862) 741Other revenue 381 2 - 383
Total segment revenue 302,876 4,528 (3,862) 303,542
Segment result - EBITDA* (iii) 139,979 (3,049) - 136,930
Segment assets 1,109,553 476,175 (317,823) 1,267,905
Segment liabilities 617,092 35,648 (317,823) 334,917
18

PanAust LimitedNotes to the consolidated financial statementsFor the half-year ended 30 June 2013(continued)
3 (continued)Segment information
(b) (continued)Segment information
(iii) EBITDA*
The CODM assesses the performance of the operating segments based on an adjusted measure of earningsbefore interest, taxes, depreciation and amortisation ('EBITDA'). This measurement excludes the effects ofequity-settled share-based payments, exploration costs expensed and the provision for rehabilitation expensed.
A reconciliation of the EBITDA to operating profit before income tax is provided as follows:
PanAust Asia Other Eliminations ConsolidatedUS$'000 US$'000 US$000 US$'000
30 June 2013EBITDA* 139,470 (8,994) - 130,476Interest income 54 8,838 (8,693) 199Interest expense and finance charges (19,578) (34) 8,693 (10,919)Depreciation and amortisation (54,036) (529) - (54,565)Share-based payments (821) (1,578) - (2,399)Exploration costs expensed (965) - - (965)Provision for rehabilitation expensed (118) - - (118)
Profit/(loss) before income tax 64,006 (2,297) - 61,709
PanAust Asia Other Eliminations ConsolidatedUS$'000 US$'000 US$'000 US$'000
30 June 2012EBITDA* 139,979 (3,049) - 136,930Interest income 77 4,526 (3,862) 741Interest expense and finance charges (12,544) (4) 3,862 (8,686)Put option premium expense (710) - - (710)Depreciation and amortisation (28,651) (434) - (29,085)Share-based payments (420) (760) - (1,180)
Exploration costs expensed (836) - - (836)
Profit/(loss) before income tax 96,895 279 - 97,174
19

PanAust LimitedNotes to the consolidated financial statementsFor the half-year ended 30 June 2013(continued)
4 Sales revenue, derivative gains/(losses) and other income
Half-year30 June
2013US$'000
30 June2012
US$'000
From continuing operationsSales revenueCopper in concentrate (a) 193,590 237,088Gold in concentrate 44,382 49,515Silver in concentrate 4,267 6,693Realised losses on gold hedges (c) (2,081) (2,184)Gold in doré 79,472 14,954
Silver in doré 6,421 184
326,051 306,250
Derivative gains/(losses)Copper sales realised derivative gains (b) 3,607 821Copper sales unrealised derivative gains/(losses) (b) 8,699 (2,222)Gold and silver sales realised derivative gains (d) - 1,873
Copper and gold put options unrealised net derivative gains/(losses) 89 (4,304)
12,395 (3,832)
338,446 302,418
Other incomeInterest Income 199 741Sundry income 354 383
Net gain on disposal of property, plant and equipment 325 -
878 1,124
(a) Copper in concentrate
PanAust delivers concentrate to customers on the industry standard basis using the prevailing London MetalExchange (LME) copper price or a pre-determined fixed price.
For those sales based on the prevailing LME copper price, the customer makes a provisional payment toPanAust against a provisional invoice for the contained copper and precious metal credits (for gold and silver) inthe shipment. Final settlement of the payment is based on the average LME copper price over a subsequentpricing period as specified by the terms of the sales contract.
The period commencing on the date of shipment to the end of the pricing period is known as the QuotationalPeriod (QP). The QP historically reflects the average time to elapse (usually three to four months) between thedate of shipment and the date of processing by the smelter at final destination. This pricing methodology isnormal for the industry.
The Company hedges between 50% to 90% (but no less than 50%) of the copper price exposure based on theprovisional invoice pricing to minimise any potential for a liability (refund of proceeds to the customer) resultingfrom a lower price being realised during the QP (compared to the prevailing price applied to determine theprovisional payment). Accordingly, a lower copper price at the end of the QP compared to the provisional invoicewill result in a hedging gain, which will be offset by any decrease in the revenue recognised on final invoice. Ahigher copper price at the end of the QP compared to the provisional invoice will result in a hedging loss, whichwill be offset by any increase in the revenue recognised on final invoice.
20

PanAust LimitedNotes to the consolidated financial statementsFor the half-year ended 30 June 2013(continued)
4 (continued)Sales revenue, derivative gains/(losses) and other income
(a) (continued)Copper in concentrate
At balance sheet date, provisional invoices for copper issued with an open QP have been revalued at rates whichprovide an estimate of the average settlement price and resulted as follows:
30 June 2013 30 June 2012
Tonnes US$/t US$/lb Tonnes US$/t US$/lb
12,766 6,731 3.05 13,353 7,691 3.49
The aforementioned have resulted in an unfavourable US$4.0 million (2012: US$0.8 million unfavourable)mark-to-market adjustment to profit or loss for outstanding provisional pricing of sales at balance date, which hadprovisioned invoices raised at average prices of US$7,047/t (US$3.20/lb)
(b) Copper sales derivative gains/(losses)
From the 2011 financial year, the Company discontinued the application of hedge accounting for provisional pricecopper exposure. The accounting treatment now closely aligns the mark-to-market movement through the profitor loss of both the revalued provisional invoices, and the copper swaps undertaken to hedge the exposure tomovements in the copper price.
The table below summarises the realised/unrealised gains and losses from settlement of copper derivativesduring the half-year ended, as well as the mark-to-market value of outstanding copper derivatives as at 30 June2013.
30 June 2013 30 June 2012
US$
Average hedgeprice US$
Average hedgeprice
Tonnes million US$/t US$/lb Tonnes million US$/t US$/lb
Realised gains/(losses) 11,180 3.6 7,729 3.51 17,750 0.8 8,249 3.74
Unrealised gains on outstanding QPcopper derivatives 7,200 3.8 7,275 3.30 4,725 0.1 7,727 3.50
Unrealised gains on outstandinglonger term copper derivatives 2,125 2.8 8,062 3.66 5,180 (0.9) 7,513 3.41
(c) Realised losses on gold hedges
In 2010, the Phu Kham project financing was renegotiated and, as a result, the gold forward contracts wereclosed out in August 2010 at an average rate of US$1,244 per ounce. The unrealised losses recognised in thehedging reserve at the time of the close out of these gold forwards will remain in the hedging reserve and berecognised as realised hedge losses in line with the original gold forward maturity profile. In the half-year ended30 June 2013, a loss of US$2.1 million (2012: US$2.2 million loss) was recognised as realised on gold forwards.A final amount of US$2.1 million will be expensed over the remaining two quarters through to December 2013.
(d) Gold and silver derivative gains
During 2011, gold and silver forwards were taken out over 35,565oz gold and 166,602oz silver. These forwardswere subsequently closed out, resulting in a gain of US$2.2 million, with US$0.3 million realised in 2011. Theremaining US$1.9 million of this gain was realised in the six months to June 2012. No further gold or silverderivatives have been entered into during the half-year ended 30 June 2013.
21

PanAust LimitedNotes to the consolidated financial statementsFor the half-year ended 30 June 2013(continued)
5 Interest and finance charges
30 June2013
US$'000
30 June2012
US$'000
Interest and finance chargesInterest on bank debt facility 2,169 1,238Interest on lease facilities 1,532 1,364Finance charges 3,237 3,049Amortisation of prepaid finance charges 1,961 963
Other interest 576 452
9,475 7,066
Unwinding of discount on restoration provision 1,444 1,620
10,919 8,686
6 Inventories
for explanations of a change in accounting policy made in the accounting for deferred stripping2Refer to note31and1 January 2012and retrospective adjustments recognised onperiodsfinancialcosts in previous
The amounts disclosed in this note are after these adjustments.2012.December
30 June2013
US$'000
31 December2012
US$'000
Raw materials and store inventoryRaw materials and consumables - at cost 99,813 82,037
Provision for obsolete stores (451) (301)
99,362 81,736
Work in progressWork in progress - at cost 24,074 12,242
Gold in circuit - at cost 2,249 3,409
26,323 15,651
Finished goodsCopper-gold concentrate - at cost 15,842 10,843
Gold bullion - at cost 4,144 3,687
19,986 14,530
Total inventories 145,671 111,917
22

PanAust LimitedNotes to the consolidated financial statementsFor the half-year ended 30 June 2013(continued)
7 Derivative financial instruments
30 June2013
US$'000
31 December2012
US$'000
Current assetsCopper forward contracts 6,587 478
Copper put options 60 8
Total current derivative financial instrument assets 6,647 486
Non-current assets
Copper put options 196 158
Total non-current derivative financial instruments 196 158
Non-current liabilities
Copper forward contracts - 2,590
Total non-current derivative financial instrument liabilities - 2,590
Net derivative financial instruments assets/(liabilities) 6,843 (1,946)
On 22 January 2013, Phu Bia Mining Limited entered into amended and restated facilities agreements for debtfacilities, under which there is no longer a mandatory requirement by the banks for the Company to hedge 20% ofthe Phu Kham copper production on a rolling 24 month basis. The provisional price hedging protocol remainsintact.
(a) Copper price risk hedging
The Company manages the copper provisional price risk on sales contracts (over the quotational period) andshort term production (6 to 12 months) with a combination of bank hedging facilities and negotiated fixed priceterms with customers.
As at 30 June 2013, the Company had entered into several copper swap contracts and fixed price agreements aspart of its short term hedging program for copper concentrate sales which are subject to quotational period priceadjustments. Refer to Note 4(b) for further details.
To protect the Company against the downside copper price risk on future production, put options have beenestablished to cover 7,677t of copper, deliverable through to July 2014, at an average strike price of US$4,960/t(US$2.25/lb) in addition to copper swaps over 2,125t, maturing between October 2013 and December 2013, atan average price of US$8,062/t (US$3.66/lb).
23

PanAust LimitedNotes to the consolidated financial statementsFor the half-year ended 30 June 2013(continued)
8 Receivables and other assets
30 June2013
US$'000
31 December2012
US$'000
Current assetsTrade receivables (a) 6,368 10,131Other receivables (a) 176 1,120
(b)Government of Laos receivable 4,313 -
10,857 11,251
Prepayments - insurance and general 6,883 8,168
Prepayments - lease facility fees 684 684
7,567 8,852
Total current assets 18,424 20,103
Non-current assetsPrepayments 779 1,121
Government of Laos receivable (b) 11,953 20,416
Total non-current assets (c) 12,732 21,537
(a) As at 30 June 2013, no trade receivables or other receivables were past due or impaired (31 December 2012:nil). It is expected that these amounts will be received when due. The Company does not hold any collateral inrelation to these receivables.
(b) PanAust owns a 90% interest (2012: 90%) in the Lao registered company, Phu Bia Mining Limited (Phu BiaMining), through the Company’s wholly owned subsidiary, Pan Mekong Exploration Pty Limited.
The Government of Laos exercised its option to acquire a 10% interest in Phu Bia Mining. A ShareholdersAgreement was executed in May 2011, and the Share Transfer Agreement ('STA') was signed by theGovernment of Laos and Pan Mekong Exploration Pty Limited on 2 August 2012. Under the agreement, theGovernment of Laos acquired its 10% shareholding interest in Phu Bia Mining. A purchase price amounting toUS$29 million for the transfer of shares to the Government of Laos has been agreed. The amount receivable isdiscounted to factor the passage of time.
In February 2013, Phu Bia Mining declared an additional dividend, with 10% of that dividend, amounting to $4.15million, being payable to the Government of Laos. In accordance with the STA, the amount was applied againstthe receivable.
(c) The value of non-current assets approximates their fair value.
24

PanAust LimitedNotes to the consolidated financial statementsFor the half-year ended 30 June 2013(continued)
9 Property, plant and equipment
for explanations of a change in accounting policy made in the accounting for deferred stripping2Refer to note31and1 January 2012and retrospective adjustments recognised onperiodsfinancialcosts in previous
The amounts disclosed in this note are after these adjustments.2012.December
Officeequipment
Deferredstripping
costsMine
properties
Miningplant and
equipmentMotor
vehicles TotalUS$'000 US$'000 US$'000 US$'000 US$'000 US$'000
As at 31 December 2012Cost or fair value 12,536 40,343 342,561 760,426 17,669 1,173,535Accumulated depreciation (4,807) - (89,995) (168,992) (5,831) (269,625)Adjustment relating to change inaccounting policy - (18,335) - - - (18,335)
Net book amount 7,729 22,008 252,566 591,434 11,838 885,575
Half-year ended 30 June 2013Opening net book amount 7,729 22,008 252,566 591,434 11,838 885,575Additions 1,110 12,625 8,967 70,229 - 92,931Transfer in/(out) 1,453 - - (2,053) 600 -Depreciation charge (1,015) (874) (12,440) (38,623) (1,613) (54,565)
Asset write-off, net (199) - - - - (199)
Closing net book amount 9,078 33,759 249,093 620,987 10,825 923,742
As at 30 June 2013Cost or fair value 15,099 34,633 351,528 828,602 18,269 1,248,131
Accumulated depreciation (6,021) (874) (102,435) (207,615) (7,444) (324,389)
Net book amount 9,078 33,759 249,093 620,987 10,825 923,742
10 Exploration, evaluation, and mine development
Preproductionexploration &
evaluationMine
pre-productionMine
development TotalUS$'000 US$'000 US$'000 US$'000
As at 31 December 2012Opening net book amount 132,710 29,010 181,151 342,871Additions 71,444 4,491 62,779 138,714Impairment charge (a) (5,047) - - (5,047)
Transfers out (15,774) (33,501) (243,930) (293,205)
Net book amount 183,333 - - 183,333
Preproductionexploration &
evaluationMine
pre-productionMine
development TotalUS$'000 US$'000 US$'000 US$'000
Half-year ended 30 June 2013Carrying amount at start of year 183,333 - - 183,333Additions 32,929 - - 32,929
Net book amount 216,262 - - 216,262
25
PanAust LimitedNotes to the consolidated financial statementsFor the half-year ended 30 June 2013(continued)
10 (continued)Exploration, evaluation, and mine development
(a) The ultimate recoupment of costs carried forward for exploration and evaluation phases is dependent on thesuccessful development and commercial exploitation or sale of the respective mining areas. The impairmentexpense recognised represents the accumulated costs incurred in exploration of areas where there is nocontinuing significant activity planned in relation to the area.
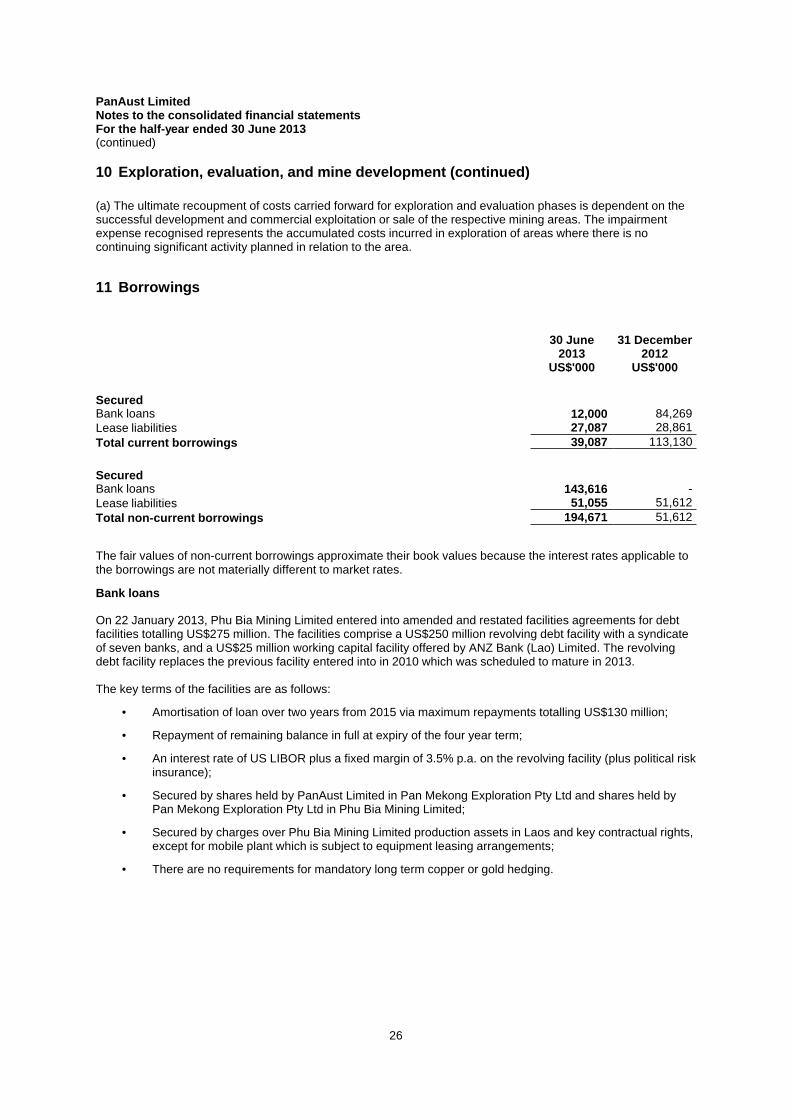
11 Borrowings
30 June2013
US$'000
31 December2012
US$'000
SecuredBank loans 12,000 84,269
Lease liabilities 27,087 28,861
Total current borrowings 39,087 113,130
SecuredBank loans 143,616 -
Lease liabilities 51,055 51,612
Total non-current borrowings 194,671 51,612
The fair values of non-current borrowings approximate their book values because the interest rates applicable tothe borrowings are not materially different to market rates.
Bank loans
On 22 January 2013, Phu Bia Mining Limited entered into amended and restated facilities agreements for debtfacilities totalling US$275 million. The facilities comprise a US$250 million revolving debt facility with a syndicateof seven banks, and a US$25 million working capital facility offered by ANZ Bank (Lao) Limited. The revolvingdebt facility replaces the previous facility entered into in 2010 which was scheduled to mature in 2013.
The key terms of the facilities are as follows:
• Amortisation of loan over two years from 2015 via maximum repayments totalling US$130 million;
• Repayment of remaining balance in full at expiry of the four year term;
• An interest rate of US LIBOR plus a fixed margin of 3.5% p.a. on the revolving facility (plus political riskinsurance);
• Secured by shares held by PanAust Limited in Pan Mekong Exploration Pty Ltd and shares held byPan Mekong Exploration Pty Ltd in Phu Bia Mining Limited;
• Secured by charges over Phu Bia Mining Limited production assets in Laos and key contractual rights,except for mobile plant which is subject to equipment leasing arrangements;
• There are no requirements for mandatory long term copper or gold hedging.
26

PanAust LimitedNotes to the consolidated financial statementsFor the half-year ended 30 June 2013(continued)
12 Contributed equity
(a) Share capital
30 June2013
Shares
31 December2012
Shares
30 June2013
US$'000
31 December2012
US$'000
Ordinary shares - fully paid (c) 619,084,930 605,962,322 552,407 548,029
Treasury shares (23,802,060) (12,578,995) - -
595,282,870 593,383,327 552,407 548,029
(b) Movements in ordinary share capital
Date DetailsNumber of
sharesIssuedprice US$'000
1 January 2013 Opening balance 605,962,322 548,029Dividend reinvestment plan 1,404,136 2.580 3,622Executive Long Term Share Plan 11,223,065 - -Executive Long Term Share Planexercised 202,660 2.650 537Executive options exercised 100,000 2.190 219
Employees share rights exercised 192,747 - -
30 June 2013 Balance 619,084,930 552,407
Treasury shares (i) (23,802,060) -
30 June 2013 Balance excluding treasury shares 595,282,870 552,407
(i) Represents shares issued under the Executive Long Term Share Plan (LTSP). The LTSP is a loan backedshare plan, under which the Company issues shares or a trustee transfers shares to the executive at marketvalue. The purchase price of the share is funded by a loan from the Company.
(c) Ordinary shares
Ordinary shares have the right to receive dividends as declared and, in the event of a winding up of theCompany, to participate in the proceeds from the sale of all surplus assets in proportion to the number of andamounts paid up on shares held.
Ordinary shares entitle their holder to one vote per share, either in person or by proxy, at a meeting of theCompany.
27

PanAust LimitedNotes to the consolidated financial statementsFor the half-year ended 30 June 2013(continued)
13 Reserves and retained earnings
(a) Reserves
30 June2013
US$'000
31 December2012
US$'000
Hedging reserve - cash flow hedges (1,855) (3,728)
Share-based payments reserve 36,865 34,466
35,010 30,738
30 June2013
US$'000
31 December2012
US$'000
Movement
Hedging reserve - cash flow hedgesOpening balance (3,728) (8,153)
Transfer to net profit 1,873 4,425
Closing balance (1,855) (3,728)
Share based payments reserveOpening balance 34,466 30,094
Employee share based payments 2,399 4,372
Closing balance 36,865 34,466
(b) Retained earnings
Note
30 June2013
US$'000
31 December2012
US$'000
1 JanuaryBalance 2 324,395 201,055periodNet profit for the 38,912 141,979
Dividends (i) (25,133) (18,639)
Closing balance 338,174 324,395
(i) On 21 February 2013, the PanAust Board of Directors declared an unfranked dividend of A$0.04 per share fora total amount of A$24,135,000 (US$25,133,000). The dividend was paid on 5 April 2013.
28

PanAust LimitedNotes to the consolidated financial statementsFor the half-year ended 30 June 2013(continued)
13 (continued)Reserves and retained earnings
(b) (continued)Retained earnings
IFRIC 20 Stripping Costs in the Production Phase of a Surface Mine (the Interpretation) is effective for annualperiods beginning on or after 1 January 2013. The following table presents the impact of the change in the Grouppolicy. Refer to Note 2 for further details.
31 December Increase / 31 December 01 January Increase / 01 January2012 (Decrease) 2012 2012 (Decrease) 2012
(restated) (restated)US$'000 US$'000 US$'000 US$'000 US$'000 US$'000
Balance sheet (extract)EquityBalance 1 January 213,119 (12,064) 201,055 80,998 - 80,998Net profit for the year end 142,273 (294) 141,979 132,121 (12,064) 120,057
Dividends (18,639) - (18,639) - - -
Closing balance 336,753 (12,358) 324,395 213,119 (12,064) 201,055
14 Earnings per share
(a) Reconciliation of earnings used in calculating earnings per share
Half-year30 June
2013US$'000
30 June2012
US$'000
The following reflects the income used in the calculations of basicand diluted earnings per share:Profit attributable to ordinary equity holders of the Company 38,912 62,159
(b) Weighted average number of shares used as denominator
Half-year2013
Number2012
Number
Weighted average number of ordinary shares used as the denominator incalculating basic earnings per share 595,282,870 588,261,995
Adjustments for calculation of diluted earnings per share:
Unlisted securities 1,854,096 2,246,707
Adjusted weighted average number of ordinary shares used in calculatingdiluted profit per share 597,136,966 590,508,702
29

PanAust LimitedNotes to the consolidated financial statementsFor the half-year ended 30 June 2013(continued)
15 Non-controlling interests
30 June2013
US$'000
31 December2012
US$'000
Interest in:Share capital 62,920 61,373Minority interest - hedge reserves (206) (414)
Retained earnings 46,580 46,226
109,294 107,185
16 Events occurring after the reporting period
On 22 August 2013, the PanAust Board of Directors declared an interim unfranked dividend of A$0.03 per sharein respect of the half-year ended 30 June 2013. The dividend amount has not been provided for in the interimfinancial report for the half-year ended 30 June 2013.
No other matter or circumstance has occurred subsequent to the half-year ended that has significantly affected,or may significantly affect, the operations of the Company, the results of those operations or the state of affairs ofthe Company or economic entity in subsequent financial years.
30

PanAust LimitedDirectors' declaration30 June 2013
opinion:Directors'In the
(a) are in accordance with the30to16pagesand notes set out oninterim financial statementstheincluding:2001,Corporations Act
(i) and other mandatoryCorporations Regulations 2001complying with Accounting Standards, theprofessional reporting requirements, and
(ii) and of30 June 2013entity's financial position as atconsolidatedgiving a true and fair view of theits performance for the half-year ended on that date, and
(b) there are reasonable grounds to believe that PanAust Limited will be able to pay its debts as and whenthey become due and payable.
This declaration is made in accordance with a resolution of the Directors.
Garry HounsellDirector
Gary StaffordDirector
Sydney22 August 2013
31

PricewaterhouseCoopers, ABN 52 780 433 757Riverside Centre, 123 Eagle Street, BRISBANE QLD 4000, GPO Box 150, BRISBANE QLD 4001T: +61 7 3257 5000, F: +61 7 3257 5999, www.pwc.com.au
Liability limited by a scheme approved under Professional Standards Legislation.32
Independent auditor’s review report to the members ofPanAust Limited
Report on the Half-Year Financial Report
We have reviewed the accompanying half-year financial report of PanAust Limited, which comprisesthe balance sheet as at 30 June 2013, and the income statement, the statement of comprehensiveincome, statement of changes in equity and statement of cash flows for the half-year ended on thatdate, selected explanatory notes and the directors’ declaration for the PanAust Limited Group (theconsolidated entity). The consolidated entity comprises both PanAust Limited (the company) and theentities it controlled during that half-year.
Directors’ responsibility for the half-year financial report
The directors of the company are responsible for the preparation of the half-year financial report thatgives a true and fair view in accordance with Australian Accounting Standards (including theAustralian Accounting Interpretations) and the Corporations Act 2001 and for such internal control asthe directors determine is necessary to enable the preparation of the half-year financial report that isfree from material misstatement whether due to fraud or error.
Auditor’s responsibility
Our responsibility is to express a conclusion on the half-year financial report based on our review. Weconducted our review in accordance with Auditing Standard on Review Engagements ASRE 2410Review of a Financial Report Performed by the Independent Auditor of the Entity, in order to statewhether, on the basis of the procedures described, we have become aware of any matter that makes usbelieve that the financial report is not in accordance with the Corporations Act 2001 including: givinga true and fair view of the consolidated entity’s financial position as at 30 June 2013 and itsperformance for the half-year ended on that date; and complying with Accounting Standard AASB 134Interim Financial Reporting and the Corporations Regulations 2001. As the auditor of PanAustLimited, ASRE 2410 requires that we comply with the ethical requirements relevant to the audit of theannual financial report.
A review of a half-year financial report consists of making enquiries, primarily of persons responsiblefor financial and accounting matters, and applying analytical and other review procedures. A review issubstantially less in scope than an audit conducted in accordance with Australian Auditing Standardsand consequently does not enable us to obtain assurance that we would become aware of all significantmatters that might be identified in an audit. Accordingly, we do not express an audit opinion.
Independence
In conducting our review, we have complied with the independence requirements of the CorporationsAct 2001.

33
Conclusion
Based on our review, which is not an audit, we have not become aware of any matter that makes usbelieve that the half-year financial report of PanAust Limited is not in accordance with theCorporations Act 2001 including:
(a) giving a true and fair view of the consolidated entity’s financial position as at 30 June 2013 and ofits performance for the half-year ended on that date; and
(b) complying with Accounting Standard AASB 134 Interim Financial Reporting and theCorporations Regulations 2001.
PricewaterhouseCoopers
Debbie Smith BrisbanePartner 22 August 2013