Embed Size (px)
Citation preview

HURRICANE HO us urface Water i GS
RAINFALL
Hortens produced h a y rains o er
Puerto Ri co . . p ciall y in the ea. t rn half
of the island. The SG raingage
network reported 24-hour rainfall totals
that ranged from less than 4 inches in
most of w st rn Puerto Ri co to nearl y 24
inches on the peaks of the Si rra d
Luquillo and Sierra d ayey. For . ome
raingage . lati ons, notab ly those in the
eastern interior, the rainfall exceeded the
I 00-year. 24-hour recorded maximum
va lu s. xt rem ly heavy rainfa ll was
reported in the towns of Cayey, aguas,
Comerfo, Gurabo, Orocovis, and San
Lorenzo.
67 '00'
18 00'
10 ~ Kil0t.,(n£RS
2'0 llfS
U.S. Department of the Interior-U.S. Geological Survey
66 30'
FLOODING
During ptemb r I 0, 1996, mo t of th mountainou int ri r, and · eral
area. along th n rth m, a t rn , and
outh rn oa. L of Pu rto Ri o exp rienced mod rate to . er fl od .
I mo. t half of th i.land's 76 town. were
af~ ct d b the e flo d . The mo t s flooding occulT d within th ba in: north
of the insular h drologic di id : th Rfo
Grand de Manatf (at th town. of Oroco i , Moro i , iale: , Manatf, and Barcelon ta) , the Rfo de Ia Plata (at the town of Cayey, merfo, Toa Ita, Toa
Baja, and Dorado) , the Rfo d Bayam6n (a t the town of B a am6n), the Rfo Piedra.
(at Hato Rey) , and the Rfo Grande de Lofza (a t the towns of San Lorenzo, Gurabo, Caguas, Trujillo Ito, Carolina.
an6 ana. , Lofza, and Rfo Grande) (fig. I ). ignifican t flooding also o curred at
Jayuya, Arecibo, and Sal in as.
66'00' 65'30'
ATLANTIC OCEAN
EXPLANATION
Rainfall totals range 1n 1nches
. <400 • 1200..15.99
4 00..7.99 16 00· 19.99
CARIBBEAN SEA • 8.00..1 1.99 • 20.00·23 99
0 Well • To""
- Moontatn range
Figure 1. National Weather Service 24-hour rainfall distribution in Puerto Rico for Hurricane Hortense, September 9-10, 1996. Town names in alphabetical order are: A, Arecibo ; B, Barceloneta ; Ba, Bayam6n ; Cg , Caguas; Ca, Cayey; Ci , Ciales; Co , Comerio; CR, Cabo Rojo ; D. Dorado; Gn , Guanica; G, Gurabo; Gy , Guayanilla; Ho, Hormigueros; HR . Hato Rey; Ja , Jayuya; La, Lajas; Ma, Manati; Mo, Morovis; My, Mayaguez; 0 , Orocovis ; RG , Rio Grande; RP , Rio Piedras ; Sa , Salinas ; SG , San German; SL, San Lorenzo; TA, Toa Alta ; TB, Toa Baja; Tj , Trujillo Alto , and ; Ya , Yauco. Mountain ranges are : 1, Sierra de Cayey , and ; 2, Sierra de Luqu illo .
------------------Earth Science in the Public Service------------------

d\ ater inundat d downtown information from gaging tation
throughout Puerto Ri o (fig. 2). High
water mark w re urveyed hortl after
th e ent to det rmine the p ak tag at
Indir t m a ur m nt ar b ing condu t d at it wh r th hi t rical
and di charg w r antly.
ite wh re r cording in trum nt fail d
r were damaged during the flo d.
H dro logi information indicat that ft d of m d rat t ity
wer de troyed r e erely damag d by the flo dwater ( ed ral mergency Manag ment Agency, written commun. , 1996 . Man land lide · occurred on the lop of the i land' mountain u
during ariou day be au e th main thoroughfare wer ob tructed or de troyed by ftoodwat r and land lide .
S MMARY OF FLOOD STAGES A D DISCHARGES
uring the ept mber I 0, 1996 ft d, th .S . G o logica l urvey c llect d peak tag and discharge
18'30'
18'00'
R•oGrando deMasco
Rio Guanajtbo
67'00' 66' 30'
CARIBBEAN SEA
66'00' 65'30'
< Rio FaJatdO
Rio Blanco
Rlo Humacao
Explanation
Su~ace-water gagong station and Site number reloood to on table 1
f ' Reservoir or 111{1000
Figure 2. Location of U.S. Geological Survey surface-water gaging stations in Puerto Rico summarized in table 1.
Table 1. Summary of peak stages and discharges prior to and during September 10, 1996, at selected U.S. Geological Survey streamflow-gaging stations in Puerto Rico
[mi2,. quare mile ; ft, feel above an arbitrary datum· ft3/ , cubic feet per econd ; Hw , highway; no. number;--, n t d termined; >, oreal r than]
Previous maximum discharge Flood of September 10, 1996
Drainage Peak Maximum Peak 1Peak Recurrence Site Station area stage discharge stage discharge interval no. number Station name (mi2) Date (ft) (ft3/s) (ft) (ft3/s) (years)
500 14600 2Rfo amuy at Tre Pueblo. 10/199 1 12.42 1,030 19.58 3,650 inkhole
2 50015700 Rfo amuy near Hatillo I 0/1985 24.75 10,500 24.5 10,400 10
3 50025155 2Rfo aliente at oabey near 9.25 06/ 1994 13.92 5,900 19.29 14,500 Ja uya
4 50030460 Rfo Oroco i. at Oroco i 5.03 01/1992 11 .53 2,320 16. 5 8,070 30
5 5003 1200 Rfo rand de Manatf near 55.2 05/19 5 17.89 48,000 18.83 53 ,000 30 M rovi.
6 50034000 Rfo Bauta n ar Orocovis 16.7 10/1970 2 1.90 17,800 25 . 14 25 ,900 40
7 50035000 Rfo Grand de Manatf at iale: 128 10/1970 24.00 125,000 25.20 128,000 40
8 50038 100 Rfo rande de M anatf at Hwy 2 197 I 0/1985 33.79 97,500 36.36 > 140,000 >30 n ar Manatf
9 50038. 20 Rfo ibuco below orozal 15. 1 11/1979 19.80 13,600 20.30 13,800 10
10 50043000 Rfo de Ia Pl ata at Proy cto La 54.8 01/1992 36.39 73,600 34. 10 63,000 20 Plata
II 50043800 2Rfo de Ia Plata at omerfo 109 01/ 1992 29.22 127,000 28.4 1 11 8,000
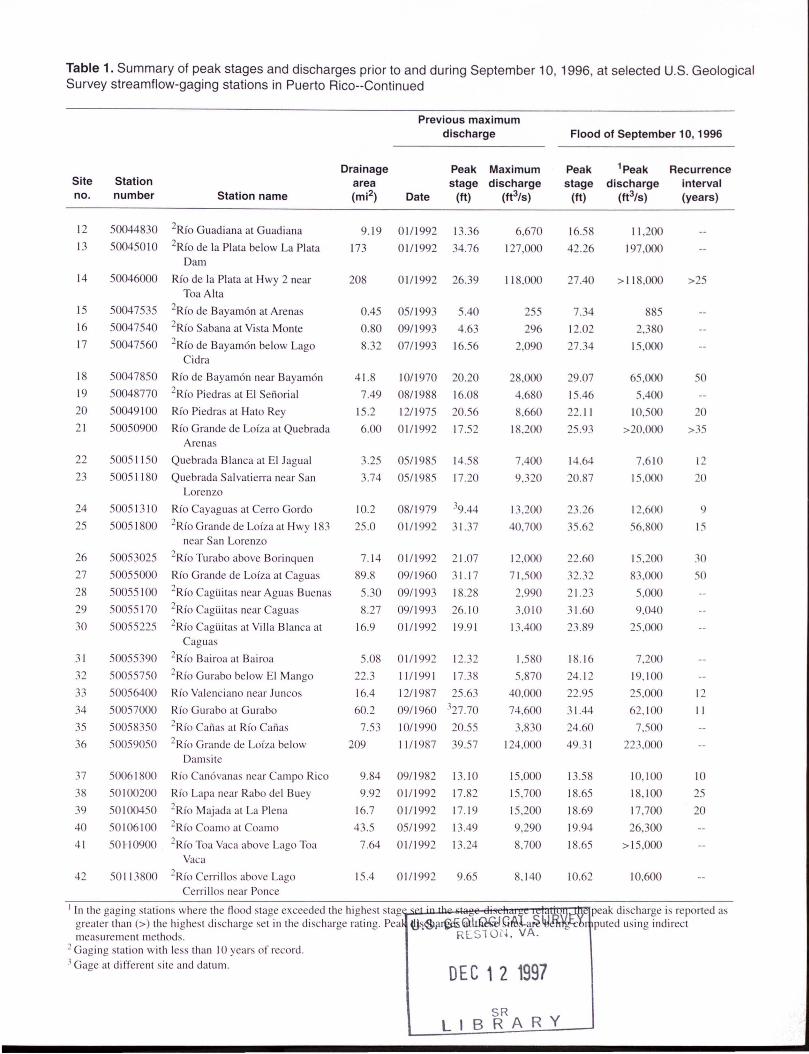
Table 1. Summary of peak stages and discharges prior to and during September 10, 1996, at selected U.S. Geological Survey streamflow-gaging stations in Puerto Rico--Continued
Site no.
12
13
14
15
16
17
18
19
20
21
22
23
24
25
26
27
28
29
30
31
32
33
34
35
36
37
38
9
40
41
42
1 ln th
Station number Station name
50044830 2Rfo Guadiana at Guadiana
50045010 2Rfo de la Plata below La Plata Dam
50046000 Rfo d Ia Plata at Hwy 2 near Toa Ita
50047535 2Rfo de Bayam6n at Arena
50047540 2Rfo abana at Vi ta Monte
50047560 2Rfo de Bayam6n below Lago idra
50047850 Rfo d Bayam6n near Bayam n
50048770 2Rfo Pi dra at El Sefiorial
50049100 Rfo Piedra at Hato Rey
50050900 Rfo Grande de Lofza at Qu brada Arena
5005 I I 50 Quebrada Blanca at El Jagua1
50051 180 Qu brada SalvatieiTa near an Lor nzo
5005 13 1 0 Rfo Ca agua at Cerro Gordo
50051800 2Rfo Grande de Lofza at Hwy 183 near San Lorenzo
50053025 2Rfo Turabo above Borinquen
50055000 Rfo Grande de Lofza at Cagua
50055 100 2Rfo CagO ita n arAgua Buenas
50055 170 2Rfo CagO ita near agua
50055225 2Rfo CagO ita at Villa Blanca at Caguas
50055390 2Rfo Bairoa at Bairoa
50055750 2Rfo Gurabo below El Mango
50056400 Rfo Val nciano near Junco
50057000 Rfo Gurabo at Gurabo
50058350 2Rfo afia at Rfo Canas
50059050 2Rfo Grande de Lofza below Dam ite
50061800 Rfo an vana n ar Camp Rico
SO I 00200 Rfo Lapa n ar Rabo d I Bu
50 I 00450 2Rfo Majada at La Plena
50106100 2Rfo oamo at oamo
SO 110900 2Rfo Toa Vaca abo e Lag Toa Vaca
50113800
ear · of r cord.
Previous maximum discharge
Drainage area (mi2)
Peak Maximum stage discharge
Date (ft) (ft3/s)
9.19 0111992 1 . 6
173 0111992 34.76
208 0111992 26. 9
0.45 OS/ 1993 5.40
0. 0 09/1993 4.63
8.32 07/1993 16.56
41.8
7.49
15.2
6.00
3.25
3.74
10.2
25.0
7. 14
89.8
5.30
8.27
16.9
1011970
08/19 8
12/1975
0 1/1992
05/1985
05/1985
08/1979
01/1992
01/1992
09/ 1960
09/ 1993
09/199
01/1992
20.20
16.0
20.56
17.52
14.58
17.20
39.44
31.37
21.07
3 1.17
18.28
26.10
19.91
5.08 0 1/1992 12.32
22.3 J 1/1991 I 7.38
16.4 I 211987 25.63
60.2 09/1960 327.70
7.53 10/l990 20.55
209 I 1/1987 39.57
9.84 09/19 2 I . 10
9.92 01/1992 17.82
16.7 0 I I 1992 I 7. 19
43.5 05/1992 J 3.49
7.64 01/1992 13 .24
15.4 0 1/1992 9.65
6,670
127,0 0
11 0 0
255
296
2,090
28,000
4,6 0
,660
18,200
7,400
9,320
1 ,200
40,700
12,000
71 500
2,990
3,0 10
13.400
1,580
5, 70
40 000
74,600
3,830
124,000
IS 000
15,700
15,200
9,290
8,700
,140
DEC 1 2 1997
SR LIBRARY
Flood of September 10, 1996
Peak stage
(ft)
16.5
42.26
27.40
7.34
12.02
27. 4
29.07
15.46
22. 1 J
25.93
14.64
20. 7
2 .26
35.62
22.60
32.32
2 1.23
31.60
23.89
18. 16
24. 12
22 .95
3 1.44
24.60
49. I
13.5
I .65
1 .69
19.94
1 .65
10.62
1Peak discharge
(ft3/s)
J 1,20
197,0
>II ,
2
15 ,000
5,
5,4
10 500
>20 0
7,6 10
15 ,0 0
12, 00
56, 00
15 ,200
3,0 0
5,000
9,040
25,000
7,200
19, 1
25,0 0
62,100
7,500
223, 00
10, 1 0
I ,100
17,700
26,300
> 15 000
10,600
Recurrence interval (years)
>2
>
so
2
12
20
9
15
30
so
12
II
10
25
20
Ba am ' n. th Rfo Pi dra. , th Rf rand
d L fza, th Rfo Lapa and the Rfo
M ajada (. e fi g . . 4, and 5). lo d
. tag . . eli ·charg ·. recurr nee int r al .
and oth r inf rmati on p rtin nt to · I t d
gaging . tation. within th . e ba ·in: ar
ummari zed in tab I I . For purp . e.- of
mpari . on. th tab le al. includ : th
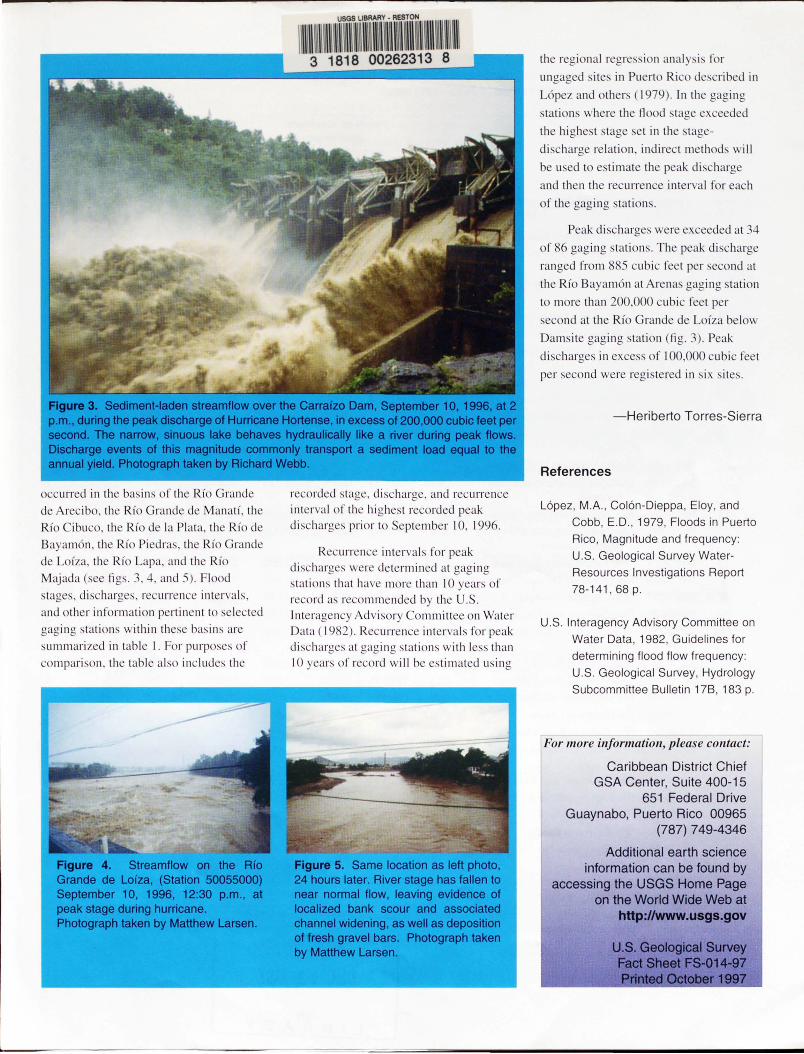
Figure 4. Streamflow on the Rro Grande de Lorza, (Station 50055000) September 10, 1996, 12:30 p.m., at peak stage during hurricane. Photograph taken by Matthew Larsen.
R utT nee int r al r r p ak
f
di.- ll'lrg sat oao ing stati on.· w ith le. · than 10 ar. ofr c rei will b : timat cl u. ing
Figure 5. Same location as left photo, 24 hours later. River stage has fallen to near normal flow, leaving evidence of localized bank scour and associated channel widening, as well as deposition of fresh gravel bars. Photograph taken by Matthew Larsen.
th r bi nal r gr .. i n ana l .-i. f r
in Pu rt Ri · d ribed in
L6p z and th r ( 1979). In th
of th gaging. tation .
f
rang cl fr m
D am. it gaging tati n (fig. 3). P ak
eli . harg . in e c of I 00.000 cubic f t
ncl wer regi tered in ·ix it .
- Heriberto Torres-Sierra
References
Lopez, M.A. , Col6n-Dieppa, Eloy and
Cobb, E.D., 1979, Floods in Puerto
Rico , Magnitude and frequency:
U.S. Geological Survey Water
Resources Investigations Report
78-141 , 68 p .
U.S. Interagency Advisory Committee on
Water Data, 1982, Guidelines for
determining flood flow frequency:
U.S. Geological Survey, Hydrology
Subcommittee Bulletin 178, 183 p.
For more information please contact:
Caribbean District Chief GSA Center, Suite 400-15
651 Federal Drive Guaynabo, Puerto Rico 00965
(787) 7 49-4346
Additional earth science information can be found by
accessing the USGS Home Page on the World Wide Web at
http://www.usgs.gov