Embed Size (px)
Citation preview

U.S. URBANIZATION TRENDS:INVESTMENT IMPLICATIONS FORCOMMERCIAL REAL ESTATE
JANUARY 2015
BackgroundPage 2
Urbanization DriversPage 2
Population TrendsPage 3
Public TransitPage 4
The DebatePage 5
Suburban ChangesPage 5
MillennialsPage 6
Benefi ts from CitiesPage 8
Implications ForCommercial Real EstatePage 9
Prepared by:
Anthony WirthMarc RasmussenGlobal Strategy &
Research Team
The way that many people choose to live is changing. In 2011, for the fi rst time in nearly one hundred years, the rate of urban population growth outpaced the suburbs.
Americans once fl ocked to the suburbs in search of a better life. Today it is America’s cities that entice younger workers with better options for their careers and lifestyles.
The suburbs are clearly not going away. The shift to urban living remains incremental and much of it is actually taking place in suburban areas. For commercial real estate investors, this presents pockets of opportunity across the country.
More than ever, talent is clustering in dense, urban areas. There is a locational advantage to living and working in cities. America’s primary global competitiveness as a country is centered around its urban areas and the amenities and opportunities that they offer.

2 | CBRE GLOBAL INVESTORS
BACKGROUND
Cities became dirty and dangerous after the industrial revolution with the rise of factories and crime. After the suburban fl ight of the 1950s, large-scale social unrest in the 1960s and the crack epidemic of the 1980s, the term “inner city” took on increasingly negative connotations. The deterioration of cities then became a prime focus of city offi cials, and many urban areas have become much safer and more appealing. Downtown areas have become not only a place to work but also to live.
Millennials are becoming an integral part of the workforce, and they are looking to reduce time and expenses spent on commuting and transportation. As a result, millennials are forgoing the comforts of larger detached homes they grew up in and are instead opting to live close to work, transit and amenities.
Several factors have contributed to the renewed interest in urban living:
1. Deindustrialization of central cities
2. Changing lifestyle preferences
3. Shifting demographics:
a. Living single: the overall share of married Americans declined from 72% in 1960 to 51% in 2010
b. Marrying later: median age at fi rst marriage has never been higher for brides (26.5 years) and grooms (28.7 years)
c. Smaller families: 3.33 persons was the average household size in 1960, down to 2.58 in 2010
(Exhibit 1)
URBANIZATION DRIVERSAnother reason for slower outward growth is that many cities have reached their boundaries, and it is much more diffi cult to build on unincorporated county land. Developers crunch the numbers, look at the path of least resistance and decide that it is simply easier to focus on infi lling areas that were initially bypassed during past periods of urbanization.
Source: U.S. Census Bureau
EXHIBIT 1: The Average U.S. Household Size Has Declined
2.4
2.6
2.8
3.0
3.2
3.4
1960 1964 1968 1972 1976 1980 1984 1988 1992 1996 2000 2004 2008 2012
Ave
rage
U.S
. H
ouse
hold
Siz
e
Sources: Payton Chung (West North), National Resources Inventory
EXHIBIT 2: Acres of Land Developed
0
500
1,000
1,500
2,000
2,500
1982-1987 1987-1992 1992-1997 1997-2002 2002-2007 2007-2010
Thou
sand
s of
Acr
es
The drop-off in developed land started before the housing bubble and Great Recession. It is a fact, not just urbanist wishful thinking. (Exhibit 2)
Many national retailers are realizing that densely populated urban areas are undersupplied and are focusing on scaled down facilities for future growth. WalMart and Target, which built their businesses in recent decades by focusing on the suburbs, have dramatically changed course. After seeing the suburbs saturated and sales growth fl atten, they are now intensely focused on smaller store formats in urban locations to capitalize on one of the nation’s few underserved retail opportunities. Other retailers are following suit.
Governments, especially local offi cials, are recognizing the role urbanization plays in creating productive, vibrant, cultural and social spaces.
As Americans continue to weigh the trade-off between location-location-location and access-access-access, the country’s largest urban areas are looking more like a patchwork of urban nodes. This can mean more polycentric areas with mini pockets of urbanism connected to each other by improved public transit options. This is one of the several factors driving urban growth. (Exhibit 3)
Source: ULI Infrastructure 2014
EXHIBIT 3: Key Trends Driving Urban Growth
22%
37%
47%
54%
59%
61%
64%
70%
82%
0% 20% 40% 60% 80% 100%
Rise of car sharing
Climate change or extreme weather
Innovative or flexible parking policies
Increases in technology
Use of infrasturcture pricing innovations
Cost and availability of energy
Families with children choosing to live in your city or area
Growing demand for compact, walkable development
The public's willingness or ability to pay for infrastructure
Percent Saying “Dramatic” or “Significant” Impact

INVESTMENT IMPLICATIONS FOR COMMERCIAL REAL ESTATE | 3
Researchers at MIT and NYU that study urban physics (analyzing urban variables such as crime and traffi c to understand emerging patterns, problems and opportunities for change) say that offi ces need to be designed more like neighborhoods. Companies are phasing out conventional workspaces in favor of connected spaces that encourage innovation and collaboration.
POPULATION TRENDS
The pace of U.S. population growth is trending down. However, the U.S. has 39 counties with one million-plus people, and almost all of them are growing at a much faster rate than the nation (the counties that include Detroit and Cleveland are exceptions). More of the U.S. population growth in the last few decades has been attributable to urban locations. (Exhibit 4)
Metropolitan areas with fi ve million or more residents increased on average by double-digit percentage rates between 2000 and 2010. The city that had the greatest increase in its downtown population (defi ned as within two miles of the central city’s city hall) was Chicago, where 48,000 people moved into the area. Runners-up include New York,
EXHIBIT 4: The U.S. Urban Population Will Continue to Grow
Source: United Nations
0
50,000
100,000
150,000
200,000
250,000
300,000
350,000
400,000
Popu
latio
n (t
hous
ands
)
Urban
Rural
EXHIBIT 5: Recent Population Growth Has Been Concentrated in City Centers
Note: Calculations are based on the averages of all the metro areas and the average of all metro areas within each specifi ed segmentSource: U.S. Census Bureau
San Francisco, Philadelphia and Washington, D.C. The major population losers were the inner-suburbs. Thus, while downtowns and the more far-fl ung periphery areas showed population growth, it was the inner-suburbs that tended to decline. (Exhibit 5)
-6%
0%
6%
12%
18%
24%
30%
0 1 2 3 4 5 6 7 8 9 10 11 12Popu
latio
n G
row
th (
2000-2
010)
Distance from City Hall (miles)
Metros with Population > 5 M
-6%
0%
6%
12%
18%
24%
30%
0 1 2 3 4 5 6 7 8 9 10 11 12Popu
latio
n G
row
th (
2000-2
010)
Distance from City Hall (miles)
Metros with Population of 2 ½-5 M
-6%
0%
6%
12%
18%
24%
30%
0 1 2 3 4 5 6 7 8 9 10 11 12
Popu
latio
n G
row
th (
2000-2
010)
Distance from City Hall (miles)
Metros with Population of 1-2 ½ M

4 | CBRE GLOBAL INVESTORS
The Department of Housing and Urban Development and the U.S. Census Bureau have released statistics saying that by 2025, only 10% of new households (ex: adult children leaving their parents’ households, singles moving out of shared housing, etc.) will have children. Some forecasters have even said that by 2025 only 25% of all U.S. households will have children. (Exhibit 6)
EXHIBIT 6: Homeownership Rate by Age of Family Head
There will defi nitely be demand for more detached homes in the future, but many of them will be closely clustered around urban nodes with walkable streets and improved amenities. The American Institute of Architects’ 2013 Home Design Trends Survey shows an increased preference among all homeowners for mixed-use developments. (Exhibit 7)
Source: U.S. Census Bureau
EXHIBIT 7: What Homeowners Want
Source: American Institute of Architect’s 2013 Home Design Trends Survey
EXHIBIT 8: Transit Ridership
Source: APTA; % change represents cumulative change from 1990Q1 - 2014Q1
0.0
0.5
1.0
1.5
2.0
2.5
3.0
1990 1994 1998 2002 2006 2010 2014
Qua
rter
ly R
ider
ship
, Bill
ions
of
Trip
s
Total Ridership
Bus
Heavy Rail
Light Rail
Commuter Rail
Other
14%
52%
11%
PUBLIC TRANSIT
Public transportation use in the U.S. in 2013 rose to 10.7 billion trips – the highest number in 57 years. However, recent growth in public transit ridership is almost entirely attributable to increased heavy rail (subway) ridership, which is almost exclusively located in ultra-urban locations. Ridership on light rail, commuter rail and buses has increased at a much slower pace, or even declined, over the past decade. (Exhibit 8)
0% 20% 40% 60%
Preference forMixed-Use Developments
Desire forRecreational Activities
2012
2013
40%
50%
60%
70%
80%
90%
94 95 96 97 98 99 00 01 02 03 04 05 06 07 08 09 10 11 12 13
62 and Over
40-61
Under 40

INVESTMENT IMPLICATIONS FOR COMMERCIAL REAL ESTATE | 5
EXHIBIT 9: Examples of Increased Property Values Following the Opening of Nearby Public Transit
Source: Center for Transit-Oriented Development, 2008
Studies have defi nitively shown that properties located near transit have a higher value. This difference in property net income and market values from proximity to transit increases even further for suburban properties. (Exhibit 9 & 10)
Car ridership in the U.S. has stopped increasing, and is actually trending down, when measured by vehicle miles driven and adjusted for population growth. (Exhibit 11)
EXHIBIT 10: Properties Near Transit (1998-2008)
Source: “Investment Returns from Responsible Property Investments: Energy Effi cient Transit-oriented and Urban Regenreation Offi ce Properties in the US from 1998-2008,” Pivo and Fisher (2008).
Suburbs CBD
Net Income +12.70% +4.50%
Market Values +16.20% +10.40%
Cap Rates – 0.30% – 0.20%
THE DEBATE
The suburbs are not going away. Many Americans still want tree-lined streets, soccer leagues and tranquil cul-de-sacs. But they are also getting tired of punishing commutes and endless sprawl. More people are placing a higher value on cultural amenities and are shunning isolated, single-class communities. Popular culture frequently highlights the negative qualities of chain-store-laden tract-housing-dominated suburban sprawl.
The indie rock band Arcade Fire took home a Grammy for “The Suburbs,” an entire album dedicated to teen angst and isolation as felt by the band members after growing up in Houston’s The Woodlands master-planned community; but that may just be what they felt at the time. Many of today’s younger urban professionals may eventually be drawn to the suburbs as they begin to raise families and they search for better-quality schools, a yard of one’s own and more space for storage.
SUBURBAN CHANGES
Many suburbs are getting an urban makeover. Mixed-use development, thoughtful public space, transit options and community-focused street-level development are allowing some suburban cities to redevelop themselves into more walkable communities.
Richard Florida, writing in Urban Land, describes what he calls “The Great Reset,” the movement from simply creating denser communities to creating more people-friendly communities: “The Great Reset is not just about the intensifi cation of cities but their extensifi cation, as great metropolitan areas morph into even larger mega-regions. Our suburbs need to be reimagined and rebuilt as more walkable, human-scale, mixed-use places. They are the next arena and next agenda for large-scale place making.”
EXHIBIT 11: Estimated Vehicle Miles Driven On All U.S. Roads
Source: Federal Reserve, dshort.com
0%
10%
20%
30%
40%
50%
60%
70%
1970 1975 1980 1985 1990 1995 2000 2005 2010
Population-Adjusted Cumulative Growth
18%
45%
120%
167%
0% 50% 100% 150% 200%
Condominiums
Apartments
Non-RetailCommercial
Retail(San Diego Trolley, 2004)
(Santa Clara County VTA Light Rail, 2002)
(Santa Clara County VTA Light Rail, 2002)
(San Diego Trolley, 2001)

6 | CBRE GLOBAL INVESTORS
More than half of Americans live in suburbs. Approximately 75% of postwar construction has happened in the suburbs. Diverse suburban neighborhoods in the U.S. now vastly outnumber diverse city neighborhoods. Many suburbs have created urban pockets by building high-quality public transit to ease traffi c congestion and are encouraging mixed-use or high-rise construction instead of more single-family housing.
William Frey, one of the most respected demographers in the U.S., has written that the distinction between cities and suburbs is falling apart. He believes that suburbs are becoming more diverse ethnically, socioeconomically and in their real estate, with more housing and retail options in close proximity to offi ce, fl ex space and other uses.
Furthermore, opportunities are arising as efforts to reduce our “carbon footprint” are becoming engrained into the culture of real estate investment management fi rms. The built environment is by far the largest contributor to greenhouse gas emissions, dwarfi ng both industrial production and automobile driving. Retrofi tting and redeveloping suburban real estate has the potential to be very profi table while also helping fi rms achieve their goals for environmental stewardship.
There now numerous reports and websites that study and analyze walkability in U.S. cities. A study by George Washington University1 indicates that metros found to have high walkable urbanism are models for the future development patterns of many – and possibly most – of the largest 30 U.S. metros. These trends suggest future demand for tens of millions of square feet of walkable urban development and hundreds of new walkable urban places. This demand would provide an economic foundation for the U.S. economy, similar to the building of drivable suburbs in the mid-to-late 20th century. The author writes that, “I believe the future, based on my research throughout the country, belongs to the urbanization of the suburbs.”
MILLENNIALS
Millennials, people born between the early eighties and late nineties, are driving the steady movement toward more compact suburban growth. This 80 million-member demographic is entering the market for housing and jobs, and they tend to favor the convenience of urban-style environments. (Exhibit 12)
Millennials are multi-modal; they choose the best transportation mode (driving, transit, bike or walk) based on the trip they are planning to take. Communities that attract millennials have a multitude of transportation choices and urban lifestyle components (whether they live in cities or in the suburbs). As a result, the top 15 markets will represent a larger percentage of the labor force in the future. (Exhibit 13)
Millennials will dominate the workforce by 2015 and will comprise 75% of the workforce by 2030, according to the BLS. They are the workers that employers want to attract and retain – especially in the TAMI segment (technology, advertising, media and information businesses). The oldest millennials are approaching their mid-30s and are now in positions to start making decisions on offi ce space.
Will millennials commit to cities as a place to remain, settle down and raise families? There is not yet enough evidence to say yes or no.
EXHIBIT 12: Percentage Ranking at Top (6-10 score out of 10)
Millennials Gen XBaby
Boomers
Short distance to workand school
82% 71% 67%
Walkability 76% 67% 67%
Distance to family/friends 69% 57% 60%
Distance to shopping/entertainment
71% 58% 67%
Convenience of public transportation
57% 45% 50%
Source: ULI America in 2013 Survey
1 Foot Traffi c Ahead: Ranking Walkable Urbanism in America’s Largest Metros; Christopher Leinberger and Patrick Lynch, George Washington University, 2014
EXHIBIT 13: The Largest Metros Will Account For a Higher Share of Future U.S. Job Growth
Source: United Nations
30%
31%
32%
33%
34%
35%
0
50
100
150
200
250
Top
15 L
abor
For
ce (pe
rcen
t of
tot
al)
Labo
r Fo
re (m
illio
ns)
Total U.S. Top 15 Metros Top 15 Mkt %
Millennials have a stronger preference for city living and a high propensity to rent – factors that have contributed to urban gentrifi cation, strong apartment demand and development activity in markets across the country. And while millennials tend to want to live alone, they are also highly social creatures: they want newer apartments with well-appointed indoor and outdoor common areas, coffee bars, communal grills and high-speed internet access in public areas.

INVESTMENT IMPLICATIONS FOR COMMERCIAL REAL ESTATE | 7
The choice to live in cities is no longer economic; it is cultural. Millennials prefer to live downtown and closer to work. North America used to account for only one-third of the worldwide car sharing market in 2006. That share had increased to over 50% by 2012. (Exhibit 14)
EXHIBIT 14: Worldwide Car Sharing Services
The cultural shift of millennials has not gone unnoticed by employers. Companies are opening offi ces in CBD adjacent locations so that employees can have the desired urban-amenitized lifestyle in close proximity to work. These areas
Source: United Nations
5%
61%34%
Australia
Asia
Europe
North America
2%
9%
39%
51%
2006 2012
% of Membership
EXHIBIT 15: Bellwether “Innovation” Districts
Lake Union
South of Market
Silicon Beach
Uptown
Midtown
River North
Seaport District
Midtown South
Bellwether “Innovation” Districts
0%
20%
Metro CBD District
Vac
ancy
are rapidly growing in popularity and have now become known as “innovation” districts due to the high-concentration of industry-leading companies and vibrant startups. These districts have been historically underdeveloped, but cutting-edge companies are now embracing the alternative location as a way to break-out from the traditional CBD offi ce space profi le and to design creative, open-plan environments that promote collaboration. This trend is most prevalent in the millennial-driven high-tech industry where competition is fi erce to attract and retain top talent. Many “innovation” districts now have lower vacancy rates than their respective metro average and even the CBDs. The growing corporate presence in “innovation” districts has led to a boom in apartment and retail development as well. (Exhibit 15)
Of course, cost is still an enormous challenge. Studies show that millennials may say they want to live in a nice building near Main and Main, but they frequently choose to live further away where they can actually afford the rent; and boomers also say they want to live near developments with a mix of shops, but they are focused on preservation of their capital and are not interested in taking on more expenses by moving to a city with a high cost of living. Developers should make their offerings attractive and appealing, but they cannot lose sense of costs and affordability as supply increases.
Source: CBRE Econometric Advisors

8 | CBRE GLOBAL INVESTORS
EXHIBIT 16: Share of Venture Capital Investment Going To Center Cities, Walkable Suburbs and Other Places
58.0%
16.4%
15.7%
66.1%
88.0%
46.9%
85.5%
53.3%
53.8%
19.8%
80.8%
20.4%
13.8%
51.7%
37.7%
9.4%
10.7%
14.4%
12.9%
28.6%
33.1%
25.9%
9.2%
15.4%
42.0%
74.2%
84.3%
23.2%
12.0%
49.3%
14.5%
32.3%
33.3%
51.6%
19.0%
46.5%
60.3%
39.0%
46.9%
0% 20% 40% 60% 80% 100%
Baltimore, MD
Dallas, TX
Philadelphia, PA
Seattle, WA
Austin, TX
Chicago, IL
San Diego, CA
Washington, DC
Washington, DC-BaltimoreCombined Area
Los Angeles, CA
New York, NY
Boston-Cambridge, MA
San Jose, CA
San Francisco, CA
San Francisco-Silicon ValleyCombined Bay Area
Share of Metro Venture Capital Investment
Major City Walkable Suburbs Other
$13,476M
$8,486M
$4,990M
$3,275M
$2,980M
$2,381M
$1,265M
$1,127M
$942M
$668M
$630M
$570M
$340M
$250M
$138M
Source: Martin Prosperity Institute; The Atlantic
2 Urban America: U.S. Cities in the Global Economy; McKinsey Global Institute; April 2012
BENEFITS FROM CITIES
More than 10% of global GDP growth through 2025 will come from large U.S. cities.2
Suburban offi ce parks are no longer attracting all of the newer and more innovative companies. The share of venture capital investment in the U.S. that is going to central city areas and to walkable suburban areas is growing. (Exhibit 16)
80% of the U.S. population lives in large cities, vs. less than 60% in Europe.2
Three-fourths of the U.S. lead in per capita GDP over Western Europe is explained by differences in the regions’ largest cities.2
INVESTMENT IMPLICATIONS FOR COMMERCIAL REAL ESTATE | 9
IMPLICATIONS FOR COMMERCIAL REAL ESTATE
Urban commercial real estate has historically outperformed its suburban counterpart. High-rise apartment rents, located primarily in urban cores, have grown almost twice as fast as garden-style apartments. A similar trend has persisted in downtown offi ce versus suburban offi ce. Strong rent growth and lower vacancies have given investors the confi dence to deploy capital in the urban areas.
The spread between urban and suburban offi ce cap rates, and high-rise versus garden-style apartments, are near the widest point in over 14 years. The prominence of urbanization will continue to fuel sustained demand for real estate in core, urban areas, which is benefi cial for commercial real estate.
EXHIBIT 17: Offi ce Vacancy Rates
Source: CBRE Econometric Advisors
0%
5%
10%
15%
20%
25%
88 89 90 91 92 93 94 95 96 97 98 99 00 01 02 03 04 05 06 07 08 09 10 11 12 13 14
Suburban Class B/C
Suburban All
Downtown All
Downtown Class A
There are three main factors that drive real estate investment values: land, buildings and tenants. Many businesses will continue to pay for property that provides access to a broad, skilled labor pool that is available in central locations. Urban offi ce and apartments will be a perk for employees, and investors will continue to demand property in central business and “innovation” districts.
Although the macro trends support urbanization, urban investing is diffi cult and requires experience. Investors and developers will need to be selective in choosing a building or potential development site. Preferred locations for investment and development should show strong projections for solid demand, higher occupancy, strong rent growth, and elevated marketability and liquidity.
Below are some key qualities to consider:
A) Properties should be located on streets not roads. Streets have life, pedestrians, cyclists, tourists, workers, commuters, cyclists, etc. Roads convey cars from Point A to Point B.
B) Good locations have handsome buildings with old bones and urban fabric that has become fi ne-grained over time, drawing in both millennials and boomers.
C) Access to amenities and public transportation is vital for tenants and will drive long-term demand.
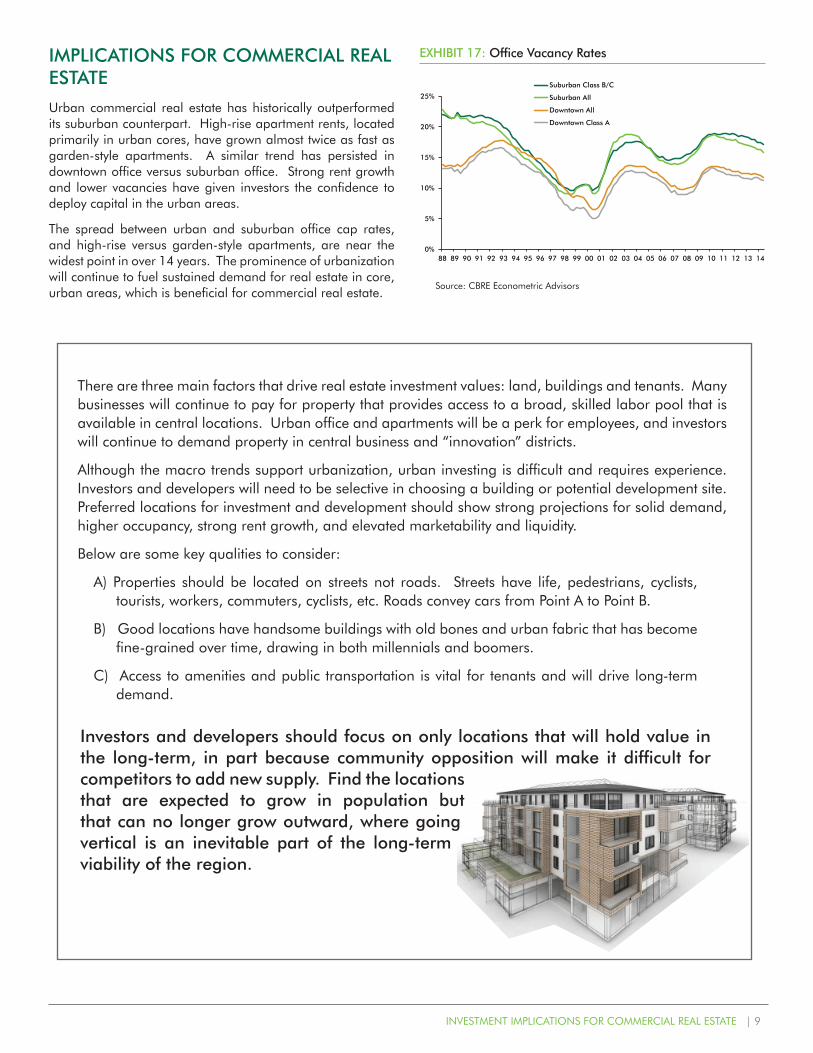
Investors and developers should focus on only locations that will hold value in the long-term, in part because community opposition will make it diffi cult for competitors to add new supply. Find the locations that are expected to grow in population but that can no longer grow outward, where going vertical is an inevitable part of the long-term viability of the region.

10 | CBRE GLOBAL INVESTORS
EXHIBIT 18: Offi ce Rents EXHIBIT 19: Offi ce Price Per SF
Source: CCBRE Econometric Advisors Source: Real Capital Analytics
+72 cents/year
+32 cents/year
$10.00
$15.00
$20.00
$25.00
$30.00
$35.00
$40.00
$45.00
88 89 90 91 92 93 94 95 96 97 98 99 00 01 02 03 04 05 06 07 08 09 10 11 12 13 14
Downtown
Suburban
EXHIBIT 20: Offi ce Cap Rates
Source: Real Capital Analytics
EXHIBIT 21: Offi ce Appreciation
Source: NCREIF, 1994=100
5.0%
5.5%
6.0%
6.5%
7.0%
7.5%
8.0%
8.5%
9.0%
9.5%
01
Q1
01
Q3
02
Q1
02
Q3
03
Q1
03
Q3
04
Q1
04
Q3
05
Q1
05
Q3
06
Q1
06
Q3
07
Q1
07
Q3
08
Q1
08
Q3
09
Q1
09
Q3
10
Q1
10
Q3
11
Q1
11
Q3
12
Q1
12
Q3
13
Q1
13
Q3
14
Q1
Office - Sub
Office - CBD
80
90
100
110
120
130
140
150
160
170
180
99 00 01 02 03 04 05 06 07 08 09 10 11 12 13 14
CBD Office
Suburban Office
+$11/year
+$2/year
$-
$50
$100
$150
$200
$250
$300
$350
$400
$450
01 02 03 04 05 06 07 08 09 10 11 12 13 14
Office - CBD
Office - Sub
OFFICE −WHERE AND WHAT TO BUY AND BUILD
Location
CBDs or “innovation districts” that provide work/live/play environments and attract business services and creative industries
Suburban nodes that provide a highly amenitized “edge city” environment
Readily accessible mass transit
Building Features
Rectangular fl oor plates between 23k and 35k SF
High parking ratios for buildings not near mass transit
Green, such as LEED certifi cation, high HVAC effi ciency and natural lighting
Ability to provide on-site amenities e.g. fi tness center, meeting/concierge facilities

INVESTMENT IMPLICATIONS FOR COMMERCIAL REAL ESTATE | 11
EXHIBIT 22: Apartment Rents
Source: CBRE Econometric Advisors Source: Real Capital Analytics
EXHIBIT 23: Apartment Cap Rates
EXHIBIT 24: Apartment Price Per Unit EXHIBIT 25: Apartment Appreciation
Source: Real Capital Analytics Source: NCREIF, 1994=100
4.0%
4.5%
5.0%
5.5%
6.0%
6.5%
7.0%
7.5%
8.0%
8.5%
9.0%
01
Q1
01
Q3
02
Q1
02
Q3
03
Q1
03
Q3
04
Q1
04
Q3
05
Q1
05
Q3
06
Q1
06
Q3
07
Q1
07
Q3
08
Q1
08
Q3
09
Q1
09
Q3
10
Q1
10
Q3
11
Q1
11
Q3
12
Q1
12
Q3
13
Q1
13
Q3
14
Q1
Garden
Mid/Highrise
+$7,800/year
+$1,500/year
$-
$50,000
$100,000
$150,000
$200,000
$250,000
$300,000
01
Q1
01
Q3
02
Q1
02
Q3
03
Q1
03
Q3
04
Q1
04
Q3
05
Q1
05
Q3
06
Q1
06
Q3
07
Q1
07
Q3
08
Q1
08
Q3
09
Q1
09
Q3
10
Q1
10
Q3
11
Q1
11
Q3
12
Q1
12
Q3
13
Q1
13
Q3
14
Q1
Mid/Highrise
Garden
100
110
120
130
140
150
160
170
180
99 00 01 02 03 04 05 06 07 08 09 10 11 12 13 14
High-Rise
Garden Style
APARTMENTS −WHERE AND WHAT TO BUY AND BUILD
Location
Major population centers in coastal markets where low housing affordability is a barrier to homeownership
High population/job growth markets, primarily in the West and South
Infi ll neighborhoods close to growing employment nodes or “innovation districts,” preferably with good transit access and quality school
Community Features
“Lifestyle” apartments that appeal to affl uent renters-by-choice
Comprehensive amenity package including resort pool, club house, fi tness center, social areas with Wi-Fi, concierge services and “green” features
Building height, unit mix and size, and parking provision that’s competitive in the market area
Upgraded unit features such as granite countertops, stainless steel appliances, washer/dryers and high ceilings
+39/year
+19/year
$500
$800
$1,100
$1,400
$1,700
94 95 96 97 98 99 00 01 02 03 04 05 06 07 08 09 10 11 12 13 14
High-Rise
Garden-Style

12 | CBRE GLOBAL INVESTORS
www.cbreglobalinvestors.com
Please note that the content of this report is for informational purposes only and should not be viewed as investment advice or an offer or solicitation. Any opinions are solely those of CBRE Global Investors and are subject to change without notice, and may not be consistent with market trends or future events. This report is based on current public information that we consider reliable, but we do not represent it is accurate, updated or complete, and it should not be relied on as such.
14:148