Embed Size (px)
Citation preview

U.S. Urban Segregation

It Can’t be Created by Law . . .
• Processes & Conditions that support segregation– Self selection – choosing to live where people are
mostly like you– Channeling – Real estate agents tend to show homes
in certain areas to people who fit certain categories – example: white home buyers may have to specifically ask to see houses in north county, otherwise they will be shown homes in St. Charles county, West County, or South County
– Socio-economic levels may discourage some buyers form looking in areas that are beyond their means.
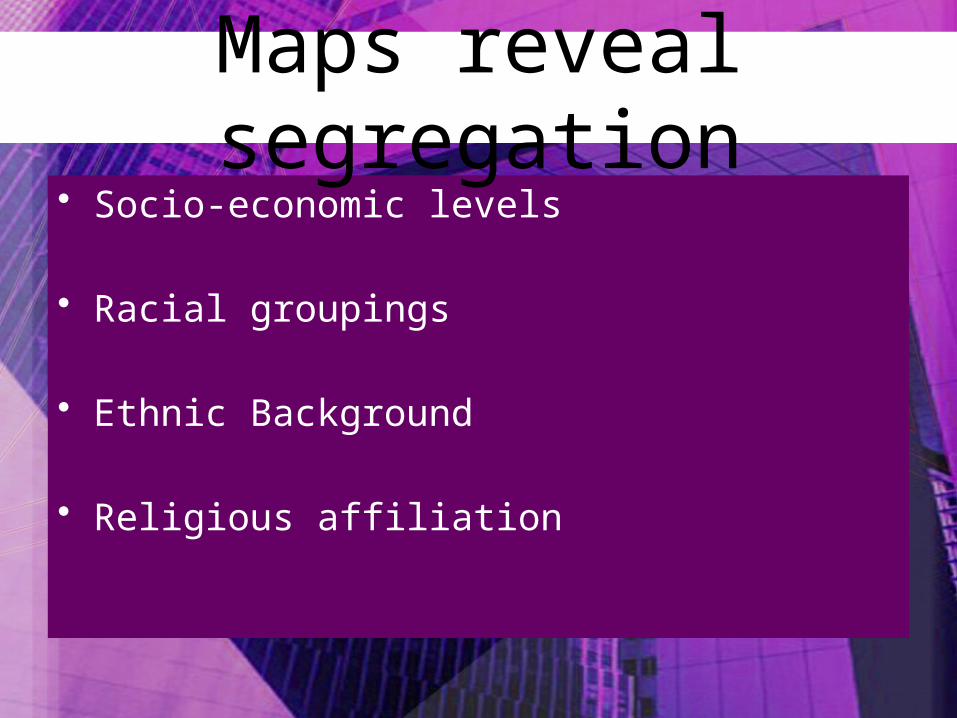
Maps reveal segregation
• Socio-economic levels
• Racial groupings
• Ethnic Background
• Religious affiliation


Chicago

Chicago

Denver• Yellow –
Hispanic (mostly west of I-25)
• Green - “White” (mostly east of I-25)

ON THE FOLLOWING MAPS, THE DARKER THE GREEN, THE HIGHER THE PERCENTAGE OF AFRICAN- AMERICAN RESIDENTS (2000 CENSUS DATA)INTERACTIVE MAP CAN SHOW ASIAN, HISPANIC, WHITE, AND INCOME (DEFAULT IS BLACK):
http://www.umich.edu/~lawrace/seg.htm

Chicago, IL.• Compare
with the socio- economic map above.

St. Louis

Atlanta, Georgia

Boston, Mass.

Seattle, Wash.

Minneapolis, Min.

Las Vegas, Nevada

New York

IN THE FOLLOWING MAPS, WHITE AREAS ARE PINK, BLACK ONES ARE BLUE, HISPANIC ORANGE, AND ASIAN GREEN.

Detroit, Michigan

New York

Minneapolis, Min.

Long Beach, Calif.

Miami, Fl.

San Jose, Calif.

New Orleans, Louisiana

Washington, D.C.

San Francisco

Houston, Texas
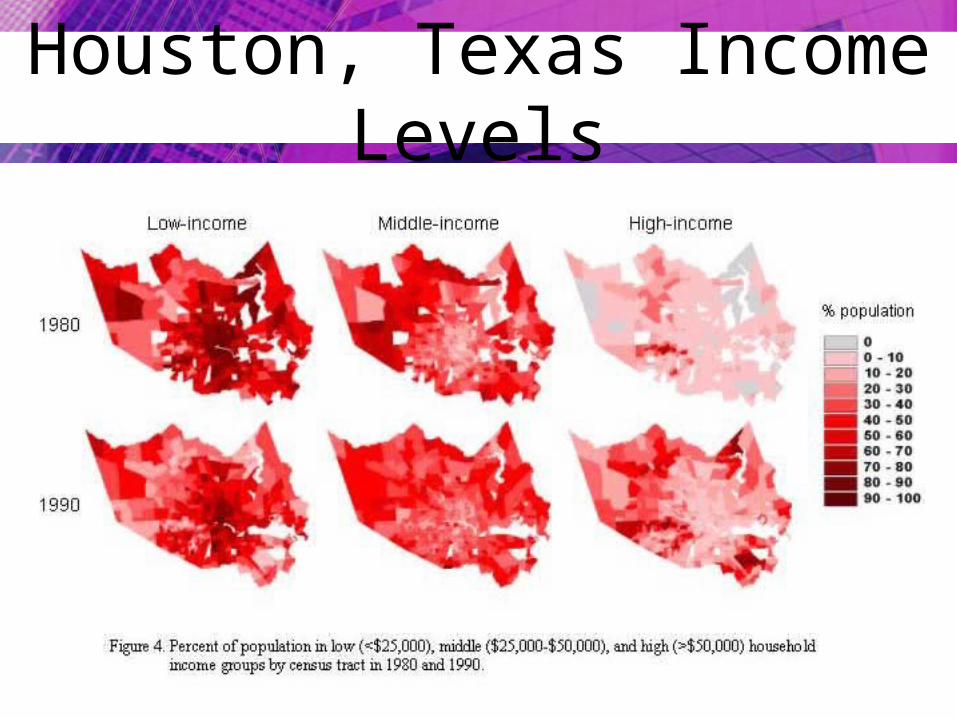
Houston, Texas Income Levels

Minneapolis
• Compare with maps of racial/ethnic segregation.


L.A. Highway impact enlarged


Milwaukee, Wisconsin


Cleveland


• Austin, TX

• Austin, TX