Embed Size (px)
Citation preview
U.S. Trade with Free Trade Agreement (FTA)
Partners
James K. Jackson
Specialist in International Trade and Finance
April 24, 2018
Congressional Research Service
7-5700
www.crs.gov
R44044
U.S. Trade with Free Trade Agreement (FTA) Partners
Congressional Research Service
Summary During the Obama Administration, the United States negotiated two mega-regional free trade
agreements that its participants argued were comprehensive and high-standard: the Trans-Pacific
Partnership (TPP) among the United States and 11 other countries, and the U.S.-European
Transatlantic Trade and Investment Partnership (T-TIP). The 12 TPP countries signed the
agreement in February 2016, but the agreement required ratification by each country before it
could enter into force. In the United States, this required implementing legislation by Congress.
Upon taking office, President Trump withdrew the United States from the TPP and halted further
negotiations on the T-TIP, but may reengage in the TPP under different terms. The remaining 11
partners to the TPP concluded, without U.S. participation, a revised TPP, now identified as the
Comprehensive and Progressive Agreement for Trans-Pacific Partnership (CPTPP). The Trump
Administration is also attempting to revise the two largest existing U.S. FTAs, through the
ongoing renegotiation of the North American Free Trade Agreement (NAFTA), and modification
talks regarding the U.S.-South Korea (KORUS) FTA.
President Trump has addressed trade broadly and trade agreements more directly through an
assertive trade enforcement agenda and vocal skepticism of past U.S. trade agreements and the
potential benefits of trade. The Trump Administration has characterized U.S. trade agreements as
unfair and detrimental to the economy, a viewpoint that is not shared by U.S. trading partners,
established economic analysis, and various business and consumer groups. For some observers,
the growing globalization of the economy raises concerns that the cost of U.S. leadership in the
global arena is outstripping the benefits of U.S. global engagement. Others argue that the United
States needs to renegotiate its role and require others to share more of the costs. The Trump
Administration’s approach does not rule out the possibility that some countries are not fully
abiding by international trade agreements and rules. Such actions may distort market performance
and erode public support for the international trade system.
Discussions of FTAs often focus on trade balances, particularly U.S. bilateral merchandise trade
balances with its FTA partner countries, as one way of measuring the success of the agreements.
Although bilateral merchandise trade balances can provide a quick snapshot of the U.S. trade
relationship with a particular country, most economists argue that such balances serve as
incomplete measures of the comprehensive nature of the trade and economic relationship between
the United States and its FTA partners. Indeed, current trade agreements include trade in services,
provisions for investment, and trade facilitation, among others that are not reflected in bilateral
merchandise trade balances.
This report presents data on U.S. merchandise (goods) trade with its Free Trade Agreement (FTA)
partner countries. The data are presented to show bilateral trade balances for individual FTA
partners and groups of countries representing such major agreements as the North America Free
Trade Agreement (NAFTA) and the Central American Free Trade Agreement and Dominican
Republic (CAFTA-DR) relative to total U.S. trade balances. This report also discusses the issues
involved in using bilateral merchandise trade balances as a standard for measuring the economic
effects of a particular FTA.
U.S. Trade with Free Trade Agreement (FTA) Partners
Congressional Research Service
Contents
Background ..................................................................................................................................... 1
U.S. Trade with FTA Partner Countries ........................................................................................... 4
Bilateral Trade Balances ................................................................................................................. 11
Global Value Chains ...................................................................................................................... 15
Issues for Congress ........................................................................................................................ 16
Figures
Figure 1. U.S. Merchandise Trade: Exports, Imports, and Balances, 1980-2017 ........................... 3
Figure 2. Global Trade, Percentage Change, Volume and Value, 2000-2018 .................................. 3
Figure 3. U.S. Merchandise Trade Deficit With FTA Partners as a Share of
Total U.S. Merchandise Trade Deficit, 2007-2017 ....................................................................... 4
Figure 4. U.S. Merchandise and Services Balances With Major Partner Groups, 2016.................. 5
Figure 5. U.S. Merchandise Exports and Imports by Principal End-Use Category, 2017 ............. 13
Figure 6. Share of Foreign Value Added in Exports, by Country or Region, 2010 ....................... 16
Figure A-1. U.S. Trade With Canada, China, and Mexico (Select years1990-2017) .................... 19
Tables
Table 1. U.S. Free Trade Agreements and Date of Congressional Approval ................................... 2
Table 2. U.S. Merchandise and Services Trade with FTA Partner Countries, 2016 ........................ 5
Table 3. U.S. Merchandise Trade Balances with FTA Partner Countries, 2003-2017 ..................... 8
Table 4. Estimated U.S. Trade Balance of Crude Oil and Products With FTA Partners .................. 9
Table 5. International Trade Commission Estimates of the Economic Effects of
U.S. Trade Agreements............................................................................................................... 10
Table 6. U.S. Long-run Export and Import Elasticities ................................................................. 14
Table B-1. U.S. Trade with Australia: Top 10 Products, 2014 ...................................................... 20
Table B-2. U.S. Trade with Bahrain: Top 10 Products, 2014 ........................................................ 21
Table B-3. U.S. Trade with Canada: Top 10 Products, 2014 ......................................................... 21
Table B-4. U.S. Trade with Chile: Top 10 Products, 2014 ............................................................ 22
Table B-5. U.S. Trade with Colombia: Top 10 Products, 2014 ..................................................... 23
Table B-6. U.S. Trade with Costa Rica: Top 10 Products, 2014 ................................................... 23
Table B-7. U.S. Trade with Dominican Republic: Top 10 Products, 2014 .................................... 24
Table B-8. U.S. Trade with El Salvador: Top 10 Products, 2014 .................................................. 25
Table B-9. U.S. Trade with Guatemala: Top 10 Products, 2014 .................................................... 25
Table B-10. U.S. Trade with Honduras: Top 10 Products, 2014 ................................................... 26
Table B-11. U.S. Trade with Israel: Top 10 Products, 2014 .......................................................... 27

U.S. Trade with Free Trade Agreement (FTA) Partners
Congressional Research Service
Table B-12. U.S. Trade with Jordan: Top 10 Products, 2014 ........................................................ 27
Table B-13. U.S. Trade with South Korea: Top 10 Products, 2014 ............................................... 28
Table B-14. U.S. Trade with Mexico: Top 10 Products, 2014 ....................................................... 29
Table B-15. U.S. Trade with Morocco: Top 10 Products, 2014 .................................................... 29
Table B-16. U.S. Trade with Nicaragua: Top 10 Products, 2014 .................................................. 30
Table B-17. U.S. Trade with Oman: Top 10 Products, 2014 ......................................................... 31
Table B-18. U.S. Trade with Panama: Top 10 Products, 2014 ...................................................... 31
Table B-19. U.S. Trade with Peru: Top 10 Products, 2014............................................................ 32
Table B-20. U.S. Trade with Singapore: Top 10 Products, 2014 ................................................... 33
Appendixes
Appendix A. U.S.-NAFTA Trade .................................................................................................. 18
Appendix B. U.S. Trade with FTA Partner Countries, Top 10 Export and Import
Commodities, 2014 .................................................................................................................... 20
Contacts
Author Contact Information .......................................................................................................... 33

U.S. Trade with Free Trade Agreement (FTA) Partners
Congressional Research Service 1
Background During the Obama Administration, the United States considered two mega-regional free trade
agreements that its participants argued were comprehensive and high-standard: the Trans-Pacific
Partnership (TPP) among the United States and 11 other countries, and the U.S.-European
Transatlantic Trade and Investment Partnership (T-TIP). The 12 TPP countries signed the
agreement in February 2016, but the agreement required ratification by each country before it
could enter into force. In the United States, this required implementing legislation by Congress.
The agreements aimed to reduce and eliminate barriers to trade, enhance trade rules and
disciplines, and develop closer economic and strategic ties among the negotiating parties. Upon
taking office, however, President Trump withdrew the United States from the TPP and halted
further negotiations on the T-TIP. The remaining 11 partners to the TPP concluded, without U.S.
participation, a revised TPP, now identified as the Comprehensive and Progressive Agreement for
Trans-Pacific Partnership (CPTPP). The Trump Administration is also attempting to revise the
two largest existing U.S. FTAs, through the ongoing renegotiation of the North American Free
Trade Agreement (NAFTA), and modification talks regarding the U.S.-South Korea (KORUS)
FTA.
President Trump has addressed trade broadly and trade agreements more directly through an
assertive trade enforcement agenda and vocal skepticism of past U.S. trade agreements and the
potential benefits of trade. For the Trump Administration, the U.S. trade deficit often serves as a
proxy for evaluating the success or failure of U.S. trade policy and is viewed as the source of a
number of ills afflicting the U.S. economy, including the rate of unemployment, slow gains in
wages, and income inequality. The Trump Administration also has characterized U.S. trade
agreements as unfair and detrimental to the economy, a viewpoint that is not shared by U.S.
trading partners, established economic analysis, and various business and consumer groups. For
some observers, the growing globalization of the economy raises concerns that the cost of U.S.
leadership in the global arena is outstripping the benefits of U.S. global engagement. Others argue
that the United States needs to renegotiate its role and require others to share more of the costs.
Trade agreement negotiations have sparked a debate over the impact of FTAs on the U.S.
economy and on U.S. trade with its FTA partners, particularly the impact of FTAs on bilateral
trade balances.1 At times, data on U.S. trade with FTA partner countries are provided by various
groups in different formats, which present various conclusions about U.S. trade balances with
FTA partners. This report presents U.S. trade data with its FTA partners in different ways in order
to demonstrate the effect these differences have on conclusions about U.S. trade balances. It also
provides some basic information on the nature of U.S. bilateral trade with its 20 FTA partner
countries. In particular, the data indicate U.S. total trade balances, trade balances with all FTA
partners, and trade balances with the 17 FTA partners with agreements signed after 2000, which
excludes Israel, Canada, and Mexico.
Between 1985 and 2011, the United States entered into 14 FTAs with 20 countries. The countries
and the year in which the agreement received congressional approval are listed in Table 1.
1 For additional information, see CRS Report R44546, The Economic Effects of Trade: Overview and Policy
Challenges, by James K. Jackson, and CRS Report R44551, The Trans-Pacific Partnership (TPP): Analysis of
Economic Studies, by James K. Jackson.

U.S. Trade with Free Trade Agreement (FTA) Partners
Congressional Research Service 2
Table 1. U.S. Free Trade Agreements and Date of Congressional Approval
Israel (1985) Canada (1987)
Canada FTA subsumed with Mexico under the North
American Free Trade Agreement (NAFTA) (1994)
Jordan (2001)
Australia (2004) Chile (2004)
Singapore (2004) Costa Rica, El Salvador, Guatemala, Honduras, Nicaragua,
and the Dominican Republic under the Dominican
Republic-Central America Free Trade Agreement
(CAFTA-DR) (2005)
Morocco (2006) Bahrain (2006)
Oman (2006) Peru (2007)
Colombia (2011) Panama (2011)
South Korea (2011)
Source: Office of the United States Trade Representative.
The U.S. Census Bureau is the official source for data on U.S. import and export statistics for
goods and services. In this memorandum, U.S. merchandise trade data are represented by Census
Bureau data on U.S. total merchandise exports and U.S. total merchandise imports. Data on
services for recent years reflect expanded data on services for countries with which the United
States has negotiated an FTA. The merchandise trade data reported by the Census Bureau are
comparable to the types of data that are reported by other countries. U.S. merchandise trade, or
trade in goods, with FTA partner countries represents nearly 70% of all U.S. exports in goods and
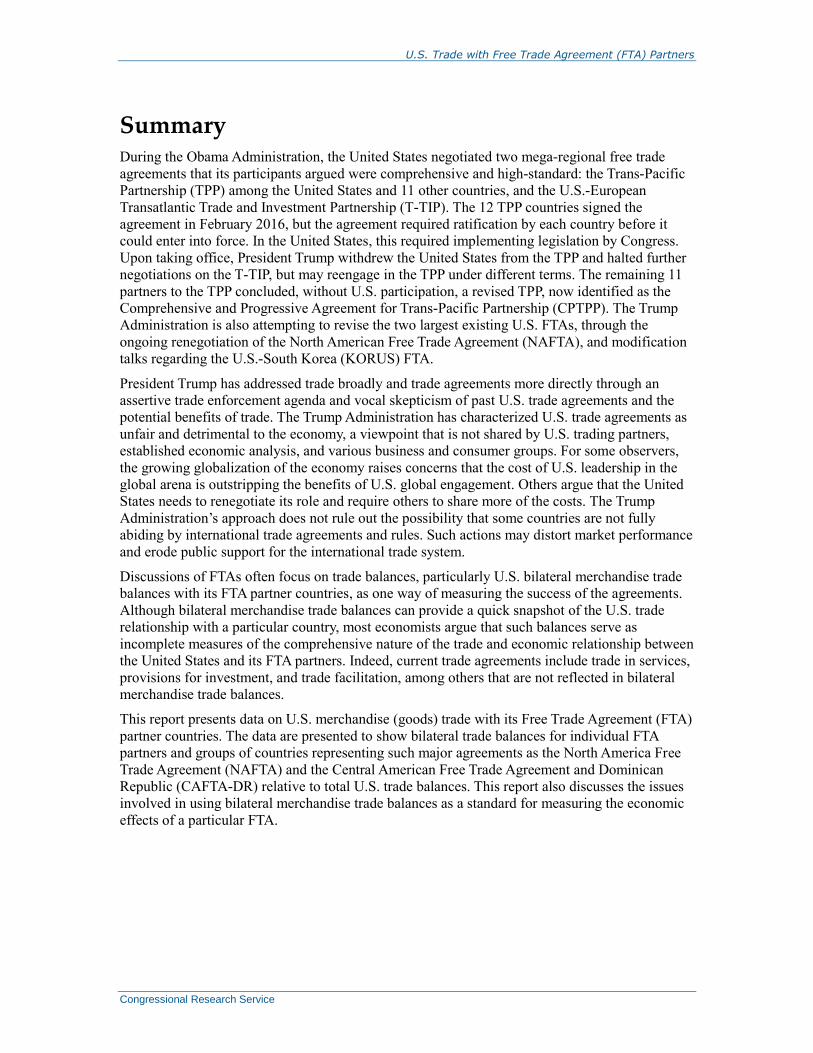
services, and more than 80% of all U.S. imports of goods and services.2 As indicated in Figure 1,
the United States consistently has experienced a deficit in its merchandise goods trade account
since at least 1980. U.S. merchandise exports and imports, and global trade generally, dropped
sharply in 2009 as a result of the global financial crisis, which limited the amount of funds that
were available for trade financing, and the economic recession that negatively affected consumer
spending and business investment.
2 Council of Economic Advisors, Economic Report of the President, February, 2015, p. 390, Table B-5.
U.S. Trade with Free Trade Agreement (FTA) Partners
Congressional Research Service 3
Figure 1. U.S. Merchandise Trade: Exports, Imports, and Balances, 1980-2017
Source: U.S. Census Bureau. Figure created by CRS.
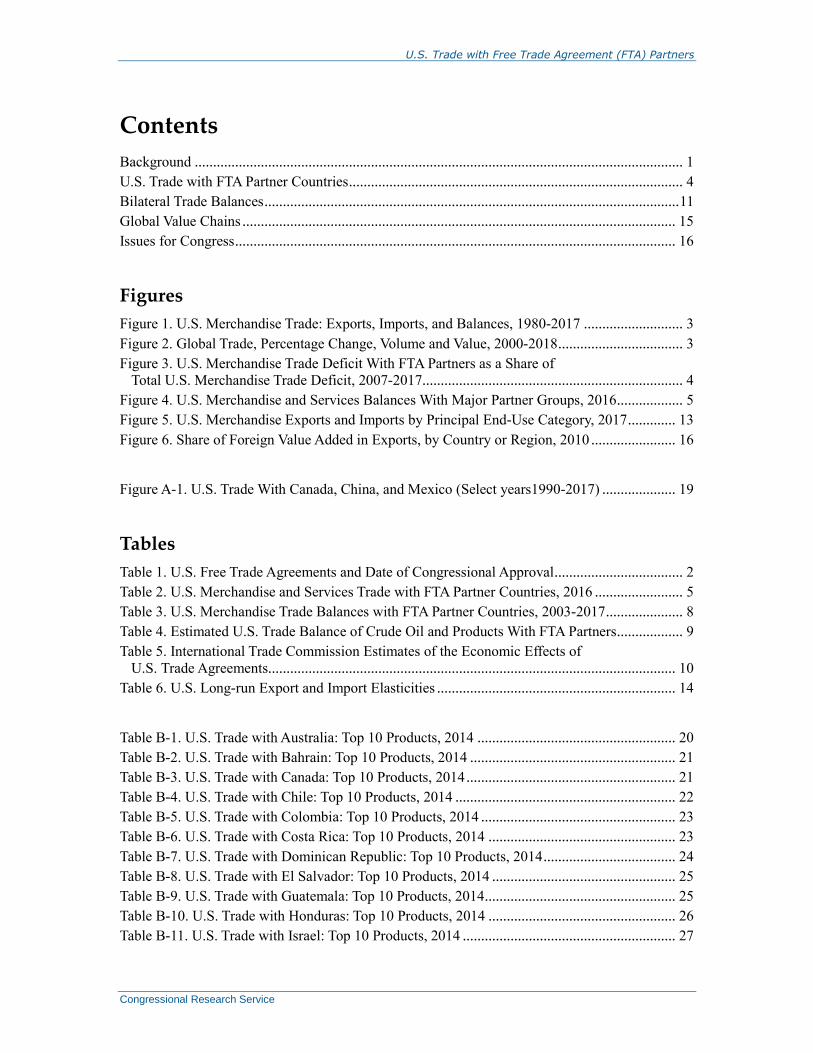
Global trade also slowed in both volume and value terms after 2010. Since 2012, trade volumes
have recovered, reflecting an increase in global and major area GDP, while trade values reflect
volatility in commodity prices and exchange rates, as indicated in Figure 2. In part, the slowdown
likely reflects legacy issues associated with the 2008-2009 global financial crisis and recession.
The value of trade has varied, likely due to the drop and subsequent rise in commodity and oil
prices, especially since 2014, reflecting changes in the direction of China’s economic policies,
among other factors.3 The slowdown and subsequent increase in trade volumes likely reflects the
progressive increase in economic growth since 2012 in both developed and developing
economies.
Figure 2. Global Trade, Percentage Change, Volume and Value, 2000-2018
Source: International Monetary Fund. Figure created by CRS.
3 See CRS Report RS22204, U.S. Trade Deficit and the Impact of Changing Oil Prices, by James K. Jackson.

U.S. Trade with Free Trade Agreement (FTA) Partners
Congressional Research Service 4
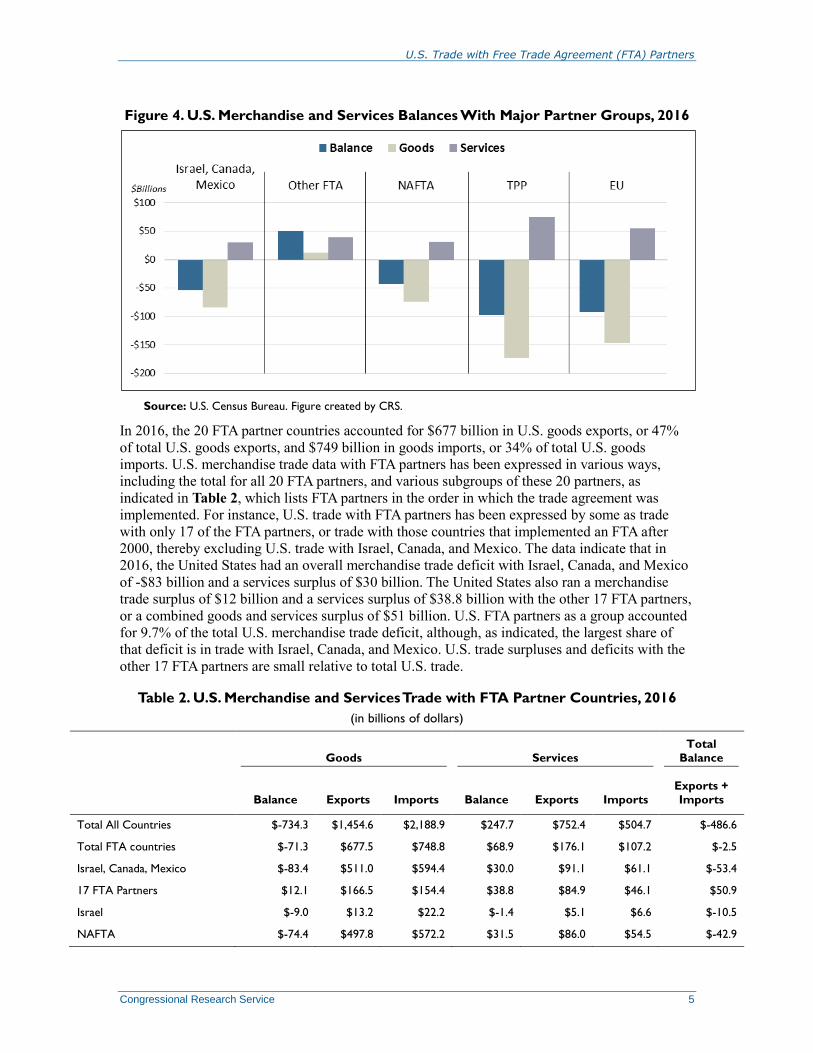
U.S. Trade with FTA Partner Countries As Table 2 indicates, the United States experienced an overall merchandise trade deficit in 2016
of $734.3 billion and a surplus in services trade of $247.7 billion, for a combined total of -$486.6
billion. During the same year, the United States ran a merchandise trade deficit of -$71.3 billion
with the 20 FTA partner countries and a services surplus of $68.9 billion, or a goods and services
deficit of -$2.5 billion. The share of the U.S. trade deficit with FTA partners, however, has fallen
by nearly half over the 2007-2017 period, from 18% to about 10% of the total U.S. merchandise
trade deficit, as indicated in Figure 3.
Figure 3. U.S. Merchandise Trade Deficit With FTA Partners as a Share of
Total U.S. Merchandise Trade Deficit, 2007-2017
Source: U.S. Census Bureau. Figure created by CRS.
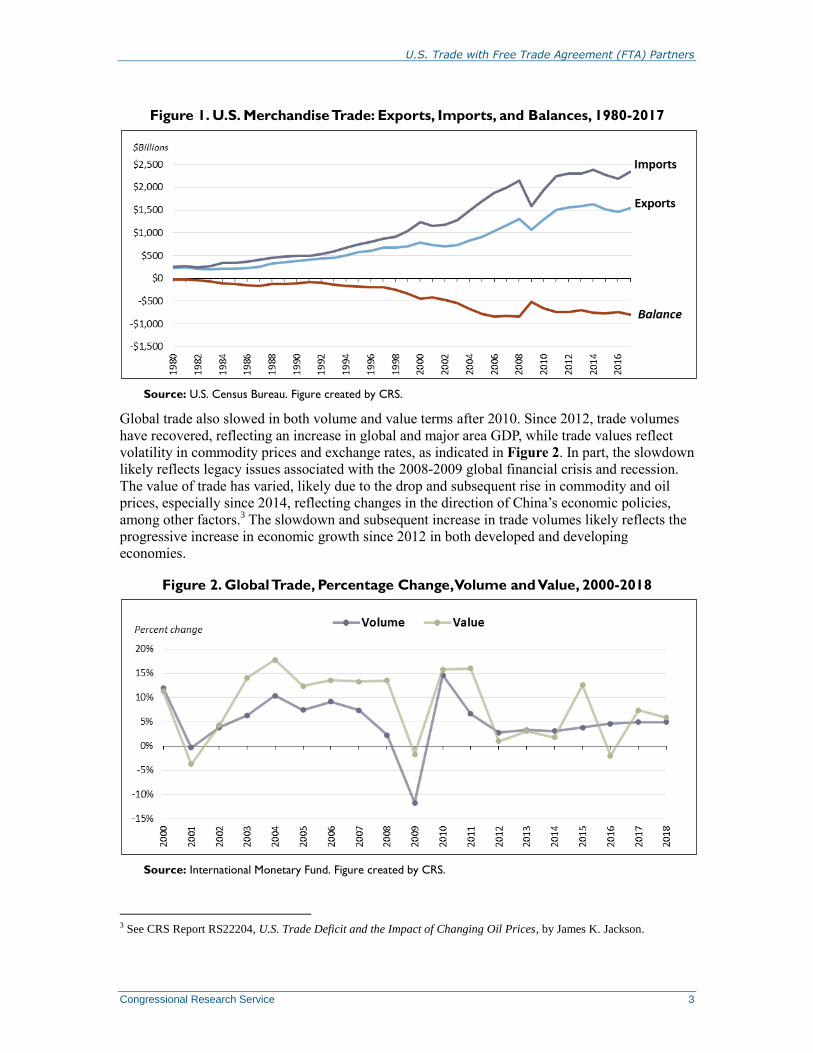
In trade with the European Union in 2016, the United States ran a goods deficit of -$146 billion
and a services surplus of $54.8 billion, or a combined goods and services deficit of -$91.5 billion,
as indicated in Figure 4. With proposed TPP countries, the United States experienced a deficit in
goods trade in 2016 of -$172 billion, mostly with Japan, Mexico, and Vietnam, and a services
surplus of $75 billion, or a combined total of -$97 billion.
U.S. Trade with Free Trade Agreement (FTA) Partners
Congressional Research Service 5
Figure 4. U.S. Merchandise and Services Balances With Major Partner Groups, 2016
Source: U.S. Census Bureau. Figure created by CRS.
In 2016, the 20 FTA partner countries accounted for $677 billion in U.S. goods exports, or 47%
of total U.S. goods exports, and $749 billion in goods imports, or 34% of total U.S. goods
imports. U.S. merchandise trade data with FTA partners has been expressed in various ways,
including the total for all 20 FTA partners, and various subgroups of these 20 partners, as
indicated in Table 2, which lists FTA partners in the order in which the trade agreement was
implemented. For instance, U.S. trade with FTA partners has been expressed by some as trade
with only 17 of the FTA partners, or trade with those countries that implemented an FTA after
2000, thereby excluding U.S. trade with Israel, Canada, and Mexico. The data indicate that in
2016, the United States had an overall merchandise trade deficit with Israel, Canada, and Mexico
of -$83 billion and a services surplus of $30 billion. The United States also ran a merchandise
trade surplus of $12 billion and a services surplus of $38.8 billion with the other 17 FTA partners,
or a combined goods and services surplus of $51 billion. U.S. FTA partners as a group accounted
for 9.7% of the total U.S. merchandise trade deficit, although, as indicated, the largest share of
that deficit is in trade with Israel, Canada, and Mexico. U.S. trade surpluses and deficits with the
other 17 FTA partners are small relative to total U.S. trade.
Table 2. U.S. Merchandise and Services Trade with FTA Partner Countries, 2016
(in billions of dollars)
Goods Services
Total
Balance
Balance Exports Imports Balance Exports Imports
Exports +
Imports
Total All Countries $-734.3 $1,454.6 $2,188.9 $247.7 $752.4 $504.7 $-486.6
Total FTA countries $-71.3 $677.5 $748.8 $68.9 $176.1 $107.2 $-2.5
Israel, Canada, Mexico $-83.4 $511.0 $594.4 $30.0 $91.1 $61.1 $-53.4
17 FTA Partners $12.1 $166.5 $154.4 $38.8 $84.9 $46.1 $50.9
Israel $-9.0 $13.2 $22.2 $-1.4 $5.1 $6.6 $-10.5
NAFTA $-74.4 $497.8 $572.2 $31.5 $86.0 $54.5 $-42.9
U.S. Trade with Free Trade Agreement (FTA) Partners
Congressional Research Service 6
Goods Services
Total
Balance
Balance Exports Imports Balance Exports Imports
Exports + Imports
Canada $-11.2 $266.8 $278.1 $24.0 $54.0 $30.0 $12.8
Mexico $-63.2 $231.0 $294.2 $7.5 $32.0 $24.6 $-55.7
Jordan $-0.1 $1.5 $1.6 $0.1 $0.7 $0.6 $0.0
Australia $12.7 $22.2 $9.5 $14.7 $22.0 $7.3 $27.4
Chile $4.1 $12.9 $8.8 $2.6 $4.3 $1.7 $6.7
Singapore $9.1 $26.9 $17.8 $9.7 $16.9 $7.3 $18.7
CAFTA-DR $5.5 $28.9 $23.4 $-2.2 $8.2 $10.4 $3.3
Costa Rica $1.6 $5.9 $4.3 $-0.8 $2.1 $2.9 $0.8
Dominican Republic $3.1 $7.8 $4.7 $-2.8 $1.8 $4.6 $0.3
El Salvador $0.5 $3.0 $2.5 $0.4 $1.1 $0.7 $0.9
Guatemala $2.0 $5.9 $3.9 $0.6 $1.6 $1.0 $2.6
Honduras $0.2 $4.8 $4.6 $0.5 $1.2 $0.6 $0.7
Nicaragua $-1.8 $1.5 $3.3 $-0.2 $0.4 $0.6 $-2.0
Morocco $0.8 $1.9 $1.0 $-0.1 $0.6 $0.6 $0.8
Bahrain $0.1 $0.9 $0.8 $-0.8 $0.3 $1.0 $-0.6
Oman $0.7 $1.8 $1.1 $0.2 $0.5 $0.3 $0.8
Peru $1.8 $8.0 $6.2 $1.1 $2.7 $1.6 $2.9
Colombia $-0.7 $413.1 $13.8 $3.2 $6.2 $3.0 $2.5
Panama $5.7 $6.1 $0.4 $0.3 $1.5 $1.3 $6.0
Korea, South $-27.7 $42.3 $69.9 $10.1 $21.1 $11.0 $-17.6
Proposed FTAs
Trans-Pacific Partnership (TPP) $-172.4 $657.3 $829.7 $75.2 $184.0 $108.8 $-97.2
European Union (T-TIP) $-146.3 $270.3 $416.7 $54.8 $231.2 $176.5 $-91.5
Source: U.S. Census Bureau.
Note. Countries are listed in the order in which the FTA was implemented, or proposed.
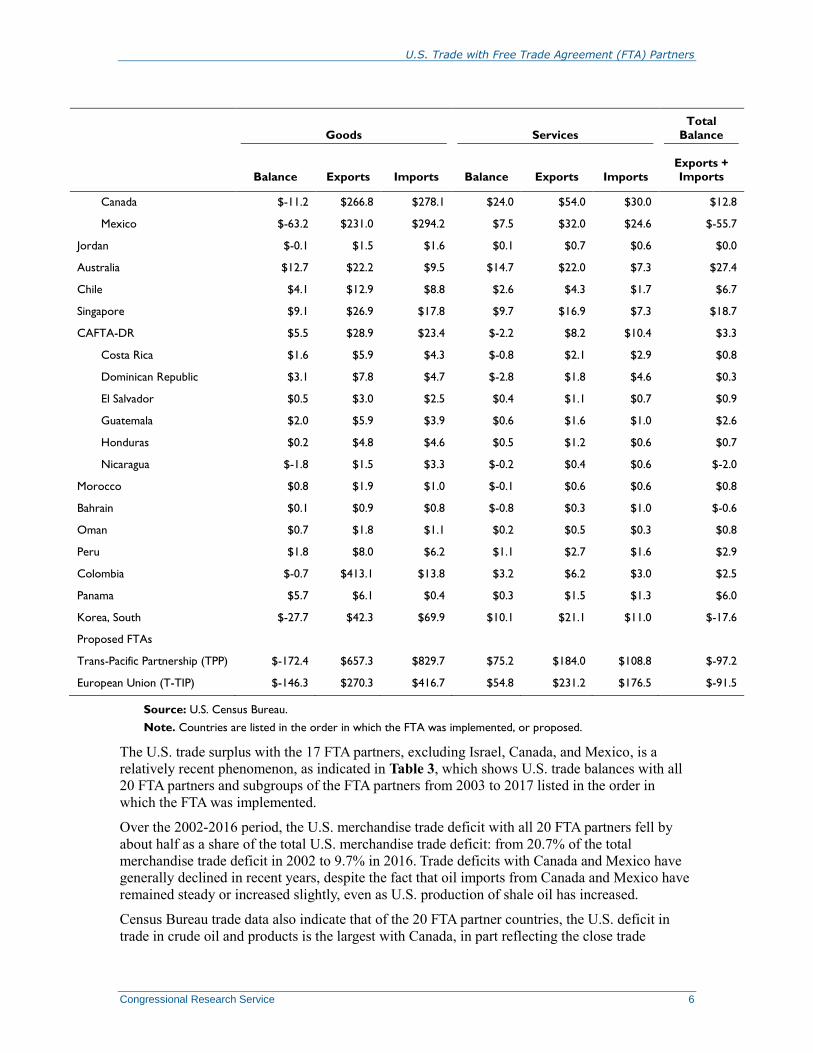
The U.S. trade surplus with the 17 FTA partners, excluding Israel, Canada, and Mexico, is a
relatively recent phenomenon, as indicated in Table 3, which shows U.S. trade balances with all
20 FTA partners and subgroups of the FTA partners from 2003 to 2017 listed in the order in
which the FTA was implemented.
Over the 2002-2016 period, the U.S. merchandise trade deficit with all 20 FTA partners fell by
about half as a share of the total U.S. merchandise trade deficit: from 20.7% of the total
merchandise trade deficit in 2002 to 9.7% in 2016. Trade deficits with Canada and Mexico have
generally declined in recent years, despite the fact that oil imports from Canada and Mexico have
remained steady or increased slightly, even as U.S. production of shale oil has increased.
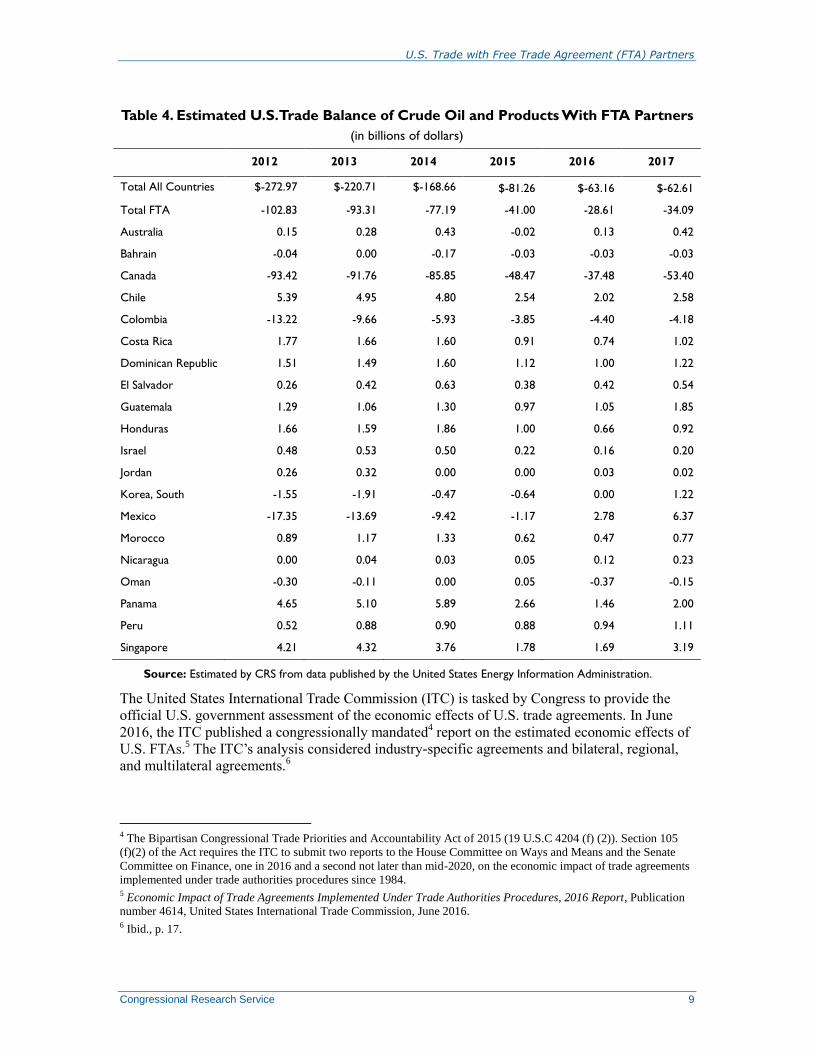
Census Bureau trade data also indicate that of the 20 FTA partner countries, the U.S. deficit in
trade in crude oil and products is the largest with Canada, in part reflecting the close trade
U.S. Trade with Free Trade Agreement (FTA) Partners
Congressional Research Service 7
relationship between Canada and the United States and the U.S. trade deficit with Canada in
petroleum trade. As indicated in Table 4, Canada accounted for $48 billion of the $80 billion U.S.
trade deficit in oil and petroleum products in 2015 and Mexico accounted for $1.2 billion of the
energy trade deficit. Canada also accounted for 60% of the U.S. crude oil trade deficit in 2015, up
from 20% in 2008. The sharp decline in the U.S. oil trade deficit largely reflects the sharp drop in
petroleum prices in 2014 and 2015
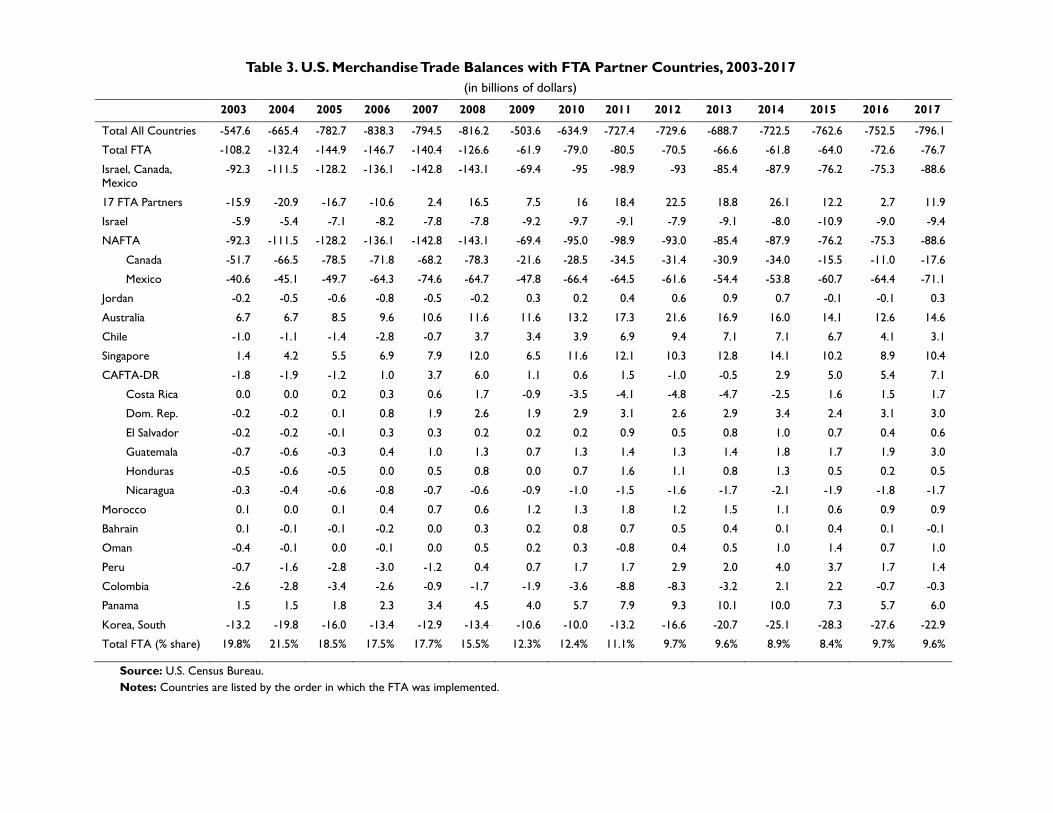
Table 3. U.S. Merchandise Trade Balances with FTA Partner Countries, 2003-2017
(in billions of dollars)
2003 2004 2005 2006 2007 2008 2009 2010 2011 2012 2013 2014 2015 2016 2017
Total All Countries -547.6 -665.4 -782.7 -838.3 -794.5 -816.2 -503.6 -634.9 -727.4 -729.6 -688.7 -722.5 -762.6 -752.5 -796.1
Total FTA -108.2 -132.4 -144.9 -146.7 -140.4 -126.6 -61.9 -79.0 -80.5 -70.5 -66.6 -61.8 -64.0 -72.6 -76.7
Israel, Canada, Mexico
-92.3 -111.5 -128.2 -136.1 -142.8 -143.1 -69.4 -95 -98.9 -93 -85.4 -87.9 -76.2 -75.3 -88.6
17 FTA Partners -15.9 -20.9 -16.7 -10.6 2.4 16.5 7.5 16 18.4 22.5 18.8 26.1 12.2 2.7 11.9
Israel -5.9 -5.4 -7.1 -8.2 -7.8 -7.8 -9.2 -9.7 -9.1 -7.9 -9.1 -8.0 -10.9 -9.0 -9.4
NAFTA -92.3 -111.5 -128.2 -136.1 -142.8 -143.1 -69.4 -95.0 -98.9 -93.0 -85.4 -87.9 -76.2 -75.3 -88.6
Canada -51.7 -66.5 -78.5 -71.8 -68.2 -78.3 -21.6 -28.5 -34.5 -31.4 -30.9 -34.0 -15.5 -11.0 -17.6
Mexico -40.6 -45.1 -49.7 -64.3 -74.6 -64.7 -47.8 -66.4 -64.5 -61.6 -54.4 -53.8 -60.7 -64.4 -71.1
Jordan -0.2 -0.5 -0.6 -0.8 -0.5 -0.2 0.3 0.2 0.4 0.6 0.9 0.7 -0.1 -0.1 0.3
Australia 6.7 6.7 8.5 9.6 10.6 11.6 11.6 13.2 17.3 21.6 16.9 16.0 14.1 12.6 14.6
Chile -1.0 -1.1 -1.4 -2.8 -0.7 3.7 3.4 3.9 6.9 9.4 7.1 7.1 6.7 4.1 3.1
Singapore 1.4 4.2 5.5 6.9 7.9 12.0 6.5 11.6 12.1 10.3 12.8 14.1 10.2 8.9 10.4
CAFTA-DR -1.8 -1.9 -1.2 1.0 3.7 6.0 1.1 0.6 1.5 -1.0 -0.5 2.9 5.0 5.4 7.1
Costa Rica 0.0 0.0 0.2 0.3 0.6 1.7 -0.9 -3.5 -4.1 -4.8 -4.7 -2.5 1.6 1.5 1.7
Dom. Rep. -0.2 -0.2 0.1 0.8 1.9 2.6 1.9 2.9 3.1 2.6 2.9 3.4 2.4 3.1 3.0
El Salvador -0.2 -0.2 -0.1 0.3 0.3 0.2 0.2 0.2 0.9 0.5 0.8 1.0 0.7 0.4 0.6
Guatemala -0.7 -0.6 -0.3 0.4 1.0 1.3 0.7 1.3 1.4 1.3 1.4 1.8 1.7 1.9 3.0
Honduras -0.5 -0.6 -0.5 0.0 0.5 0.8 0.0 0.7 1.6 1.1 0.8 1.3 0.5 0.2 0.5
Nicaragua -0.3 -0.4 -0.6 -0.8 -0.7 -0.6 -0.9 -1.0 -1.5 -1.6 -1.7 -2.1 -1.9 -1.8 -1.7
Morocco 0.1 0.0 0.1 0.4 0.7 0.6 1.2 1.3 1.8 1.2 1.5 1.1 0.6 0.9 0.9
Bahrain 0.1 -0.1 -0.1 -0.2 0.0 0.3 0.2 0.8 0.7 0.5 0.4 0.1 0.4 0.1 -0.1
Oman -0.4 -0.1 0.0 -0.1 0.0 0.5 0.2 0.3 -0.8 0.4 0.5 1.0 1.4 0.7 1.0
Peru -0.7 -1.6 -2.8 -3.0 -1.2 0.4 0.7 1.7 1.7 2.9 2.0 4.0 3.7 1.7 1.4
Colombia -2.6 -2.8 -3.4 -2.6 -0.9 -1.7 -1.9 -3.6 -8.8 -8.3 -3.2 2.1 2.2 -0.7 -0.3
Panama 1.5 1.5 1.8 2.3 3.4 4.5 4.0 5.7 7.9 9.3 10.1 10.0 7.3 5.7 6.0
Korea, South -13.2 -19.8 -16.0 -13.4 -12.9 -13.4 -10.6 -10.0 -13.2 -16.6 -20.7 -25.1 -28.3 -27.6 -22.9
Total FTA (% share) 19.8% 21.5% 18.5% 17.5% 17.7% 15.5% 12.3% 12.4% 11.1% 9.7% 9.6% 8.9% 8.4% 9.7% 9.6%
Source: U.S. Census Bureau.
Notes: Countries are listed by the order in which the FTA was implemented.
U.S. Trade with Free Trade Agreement (FTA) Partners
Congressional Research Service 9
Table 4. Estimated U.S. Trade Balance of Crude Oil and Products With FTA Partners
(in billions of dollars)
2012 2013 2014 2015 2016 2017
Total All Countries $-272.97 $-220.71 $-168.66 $-81.26 $-63.16 $-62.61
Total FTA -102.83 -93.31 -77.19 -41.00 -28.61 -34.09
Australia 0.15 0.28 0.43 -0.02 0.13 0.42
Bahrain -0.04 0.00 -0.17 -0.03 -0.03 -0.03
Canada -93.42 -91.76 -85.85 -48.47 -37.48 -53.40
Chile 5.39 4.95 4.80 2.54 2.02 2.58
Colombia -13.22 -9.66 -5.93 -3.85 -4.40 -4.18
Costa Rica 1.77 1.66 1.60 0.91 0.74 1.02
Dominican Republic 1.51 1.49 1.60 1.12 1.00 1.22
El Salvador 0.26 0.42 0.63 0.38 0.42 0.54
Guatemala 1.29 1.06 1.30 0.97 1.05 1.85
Honduras 1.66 1.59 1.86 1.00 0.66 0.92
Israel 0.48 0.53 0.50 0.22 0.16 0.20
Jordan 0.26 0.32 0.00 0.00 0.03 0.02
Korea, South -1.55 -1.91 -0.47 -0.64 0.00 1.22
Mexico -17.35 -13.69 -9.42 -1.17 2.78 6.37
Morocco 0.89 1.17 1.33 0.62 0.47 0.77
Nicaragua 0.00 0.04 0.03 0.05 0.12 0.23
Oman -0.30 -0.11 0.00 0.05 -0.37 -0.15
Panama 4.65 5.10 5.89 2.66 1.46 2.00
Peru 0.52 0.88 0.90 0.88 0.94 1.11
Singapore 4.21 4.32 3.76 1.78 1.69 3.19
Source: Estimated by CRS from data published by the United States Energy Information Administration.
The United States International Trade Commission (ITC) is tasked by Congress to provide the
official U.S. government assessment of the economic effects of U.S. trade agreements. In June
2016, the ITC published a congressionally mandated4 report on the estimated economic effects of
U.S. FTAs.5 The ITC’s analysis considered industry-specific agreements and bilateral, regional,
and multilateral agreements.6
4 The Bipartisan Congressional Trade Priorities and Accountability Act of 2015 (19 U.S.C 4204 (f) (2)). Section 105
(f)(2) of the Act requires the ITC to submit two reports to the House Committee on Ways and Means and the Senate
Committee on Finance, one in 2016 and a second not later than mid-2020, on the economic impact of trade agreements
implemented under trade authorities procedures since 1984. 5 Economic Impact of Trade Agreements Implemented Under Trade Authorities Procedures, 2016 Report, Publication
number 4614, United States International Trade Commission, June 2016. 6 Ibid., p. 17.

U.S. Trade with Free Trade Agreement (FTA) Partners
Congressional Research Service 10
The commission’s economic analysis, as indicated in Table 5, indicates that in 2012 U.S. bilateral
and regional trade agreements increased U.S. aggregate trade by about 3% and U.S. real GDP and
U.S. employment by less than 1%, $32.2 billion and 159,300 fulltime equivalent employees,
respectively, and increased bilateral trade with partner countries by 26.3%. The ITC’s analysis
also indicated that agreements that focus on specific industries have had larger impacts on trade
in their targeted industries than do bilateral agreements that cover many sectors. The ITC also
estimated that FTAs provided
gains to consumers through lower prices to the extent that the lower-priced items
were present in consumers’ budgets;
greater product variety;
increased receipts for intellectual property; and
a positive effect, on average, on U.S. bilateral merchandise trade balances with
partner countries.
Table 5. International Trade Commission Estimates of the Economic Effects of
U.S. Trade Agreements
Type of economic impact Findings
Effects on bilateral trade The bilateral and regional trade agreements increased bilateral
trade with partner countries by 26.3% in 2012.
Effects on total exports and imports The bilateral and regional trade agreements increased total U.S.
exports by 3.6% in 2012. They increased total U.S. imports by
2.3%.
Effects on real GDP The bilateral and regional trade agreements increased real GDP
by $32.2 billion (0.2%) in 2012.
Effects on U.S. labor markets The bilateral and regional trade agreements increased total
employment by 159,300 fulltime equivalent employees (0.1%) and
increased real wages by 0.3% in 2012.
Effects on U.S. receipts for intellectual property Increases in patent protection since the Agreement on Trade-
Related Aspects of Intellectual Property Rights (TRIPS) entered
into force increased U.S. international receipts for the use of
intellectual property by $10.3 billion (12.6%) in 2010.
Effects on international investment The bilateral and regional trade agreements had a mixed effect on
foreign direct investment, in some cases increasing and in other cases decreasing inbound and outbound investment flows.
Effects on bilateral trade balances The bilateral and regional trade agreements had a positive effect,
on average, on U.S. bilateral merchandise trade balances with the
partner countries, increasing trade surpluses or reducing trade
deficits by a total of $87.5 billion (59.2%) in 2015.
Effects on U.S. consumers The bilateral and regional trade agreements resulted in tariff
savings of up to $13.4 billion in 2014, with a significant part of
these savings benefiting U.S. consumers, and also increased the
variety of products imported by the United States.

U.S. Trade with Free Trade Agreement (FTA) Partners
Congressional Research Service 11
Type of economic impact Findings
Effects of the Information Technology
Agreement (ITA) on U.S. information technology
exports
The ITA increased annual U.S. exports of covered information
technology products by $34.4 billion (56.7%) in 2010.
Effects of the Uruguay Round and NAFTA tariff
reductions on U.S. steel imports
These agreements are estimated to have increased annual U.S.
steel imports by $1.2 billion (14.7%) in 2000.
Effects on U.S. employment in the textile and
apparel industries
Rising imports, due in part to the Agreement on Textiles and
Clothing (ATC), accounted for most of the reduction in U.S.
employment in the apparel industry between 1998 and 2014.
Source: Economic Impact of Trade Agreements Implemented Under Trade Authorities Procedures, 2016 Report,
Publication number 4614, United States International Trade Commission, June 2016, p. 21.
Bilateral Trade Balances In most cases, economists question the usefulness of using bilateral trade balances as indicators of
trade relations, of the effectiveness of a trade agreement, or of the costs and benefits of a trade
agreement. In general terms, viewing trade balances in isolation or as a measure of a trade
agreement represents an approach that is fundamentally different from general economic
arguments concerning the costs and benefits of trade and trade agreements. Economists generally
argue that from the perspective of a large open economy with liberalized capital flows and
floating exchange rates, such as the United States, broad macroeconomic forces, particularly
domestic saving and investment levels, determine the overall trade deficit or surplus. They argue
that, with floating exchange rates (most developed economies have floating exchange rates, while
many smaller developing economies do not have fully floating currencies) and highly liberalized
flows of capital across national borders, domestic macroeconomic forces determine the demand
for and supply of capital that, in turn, drive cross-border capital flows, which are a major factor in
determining the international exchange value of the dollar and, therefore, the overall U.S. trade
balance. Factors external to the U.S. economy often are particularly important in determining the
value of the dollar, which serves as the international reserve currency.
While many of the economic arguments can be arcane at times, economists generally contend that
from this overall economic perspective both consumers and producers benefit as a result of
liberalized trade and that the gains for the economy as a whole outweigh the costs, irrespective of
the bilateral trade deficit or surplus. Most economists argue that the economy as a whole operates
more efficiently as a result of competition through international trade and that consumers
throughout the economy experience a wider variety of goods and services at varying levels of
quality and price than would be possible in an economy closed to international trade. They also
contend that trade may have a long-term positive dynamic effect on an economy that enhances
both production and employment. In addition, U.S. trade agreements comprise a broad range of
issues that may affect trade and commercial relations over the long run between the negotiating
parties, particularly for developing and emerging economies.
At the same time, bilateral trade balances are influenced by a seemingly innumerable list of
economic activities at the micro level, or at the level of the individual firm or consumer, that are
as diverse as the trading partners themselves. These activities can include, but are not limited to,
the overall level of economic development; the abundance of raw materials; relative rates of
economic growth; rates of technological change; changes in productivity; differences in rates of
inflation; changes in commodity prices (especially the price of oil); and changes in exchange
rates.
U.S. Trade with Free Trade Agreement (FTA) Partners
Congressional Research Service 12
Most economists also recognize that a broad range of activities can affect national economies and
trade balances overall to a greater degree than even the most robust bilateral or international trade
agreement. Generally, it is very difficult to unravel the complicated linkages that exist within the
economy in order to derive cause and effect relationships, that is, attempting to link a specific
trade agreement with movements in bilateral trade balances. For instance, movements in
international exchange rates, such as the decline in the value of the peso in late 1994, followed by
a financial crisis in Mexico and severe economic recession,7 had a major impact on U.S.-Mexico
trade that arguably was greater than anything that could have been anticipated by the completion
of NAFTA. More recently, the appreciation of the dollar relative to most other currencies is
expected to reduce U.S. exports overall, if the appreciation is sustained, but it would also reduce
the costs of U.S. imports, which would tend to lower the overall U.S. merchandise trade deficit—
at least in the short run. In addition, large changes in the price of crude oil, similar to that which
occurred in 2009, are expected to lower the overall U.S. trade deficit, given the significant role
that crude oil plays in U.S. imports. Also, global trade has been affected by such macroeconomic
events as the 2008-2009 financial crisis and associated economic recession in the United States
and elsewhere, which caused global trade to decline by 30% in 2009 from the previous year. (For
additional information, see Appendix A.)
On a bilateral basis, trade balances are shaped by a host of factors, as indicated above. Indeed,
U.S. FTA partners display a great deal of variation in their economies, ranging from Canada,
which is a highly developed open economy that is within close proximity to the United States, to
small, Central American developing economies that are different in structure from the U.S.
economy and are at some physical distance from the United States. In addition, many U.S. FTA
partners represent economies that are substantially smaller than the U.S. economy and often are
limited in what they produce. As a result, U.S. trade with these countries often is concentrated in
a small number of items and often is comprised of trade in raw materials and intermediate
processed goods, as indicated in Appendix B. In most of the countries that have an FTA with the
United States, the top 10 export and import commodities account for significant shares of total
bilateral trade: more than 90% in some cases. In some cases, bilateral trade is reliant on trade in
raw materials and agricultural commodities; in other cases, bilateral trade is based on trade in
energy items, particularly U.S. trade with Canada and Mexico. Such differences in the underlying
structure of trade with particular trading partners, however, complicate efforts to compare the
performance of one trade agreement with another and to derive cause and effect relationships
between the implementation of an FTA and bilateral trade balances.
Another factor that can affect bilateral trade relations and trade balances is the composition of
trade relationships, which are distinct from one country to another. While trade agreements
determine the rules by which nations conduct trade and provide incentives to consumers in the
form of lower tariff rates and firms in the form of lower trade barriers, behavioral characteristics
of consumers and firms determine how those incentives affect bilateral trade. Economists often
attempt to estimate the impact of a trade agreement on bilateral trade based on estimates of the
strength of the responsiveness by consumers and firms to the incentives provided by the
agreement. The responsiveness of consumers and firms to the incentives associated with trade
agreements seems to vary by different types of goods, or by major end-use categories. Consumer
purchases of luxury goods, for instance, are highly responsive to changes in prices and
consumers’ incomes, while consumer consumption of agricultural products is less responsive.
7 Whitt, Joseph A. Jr., “The Mexican Peso Crisis,” Economic Review, Federal Reserve Bank of Atlanta,
January/February 1996.

U.S. Trade with Free Trade Agreement (FTA) Partners
Congressional Research Service 13
The U.S. Census Bureau provides summary information concerning U.S. trade by grouping U.S.
merchandise trade into six major end-use categories, including (1) foods, feeds, and beverages;
(2) industrial supplies, including petroleum; (3) capital goods, or machinery and equipment that
are used in manufacturing of other items; (4) automotive vehicles and parts; (5) consumer goods;
and (6) other goods. As indicated in Figure 5, trade in food and agricultural commodities,
industrial supplies (including petroleum products), capital goods and other goods are greater as a
share of U.S. exports than of U.S. imports, but U.S. imports of automotive vehicles and parts and
consumer goods are a greater share of U.S. imports compared with U.S. exports.
Figure 5. U.S. Merchandise Exports and Imports by Principal End-Use Category,
2017
Source: U.S. Census Bureau. Figure created by CRS.
The structural composition of U.S. trade, or the role of the six categories listed above as shares of
U.S. trade, plays a role in shaping bilateral trade relationships. This structural composition of U.S.
trade also has important implications for the persistence of the annual U.S. merchandise trade
deficit, despite significant changes in the global growth in merchandise trade, major multinational
trade liberalization, and the various FTAs the United States has implemented. This subject is of
continuing interest to academic economists, who have focused on the way U.S. trade flows
respond to changes in national incomes and in prices, specified by economists as the price and
income elasticity of trade.8
8 Foreign demand for U.S. goods and services is determined by foreign income, the prices of U.S. goods and services,
and the prices of goods and services that compete with U.S. goods and services in the foreign market. Similarly, U.S.
demand for foreign goods and services is determined by U.S. income, the prices of foreign goods and services, and the
prices of goods and services that compete with foreign goods and services in the U.S. market. The income elasticity of
demand for imports measures to what extent changes in an importing country’s income affect change in its imports.
Similarly, the income elasticity of demand for exports measures to what extent changes in foreign countries’ income
affect the exporting country’s exports. Crane, Leland, Meredith A. Crowley, and Saad Quayyum, “Understanding the
Evolution of Trade Deficits: Trade Elasticities of Industrialized Countries,” Economic Perspectives, 4Q2007, Federal
Reserve Bank of Chicago, 2007, p. 4. Academic research on trade elasticities is based on the article: Houthakker, H.S.,
and Stephen P. Magee, “Income and Price Elasticities in World Trade,” The Review of Economics and Statistics, May
1969, pp. 111-125. Examples of recent research include: Mann, Catherine, and Katharina Pluck, “Understanding the
U.S. Trade Deficit,” in G7 Current Account Imbalances: Sustainability and Adjustment, ed. by Richard H. Clarida,
University of Chicago Press, May 2007; Gangnes, Byron S., Alyson C. Ma, and Ari Van Assche, Global Value Chains
(continued...)
U.S. Trade with Free Trade Agreement (FTA) Partners
Congressional Research Service 14
Trade elasticities measure how much a country’s imports or exports will change in response to
changes in national incomes or the relative price of imported goods and services to domestically
produced ones.9 While economists have developed varied estimates of the elasticities, depending
on the particular study, one result common among the various studies covering different time
periods and using different econometric methods is that U.S. demand for foreign imports is
estimated to be more sensitive to changes in income and prices than is foreign demand for U.S.
exports.
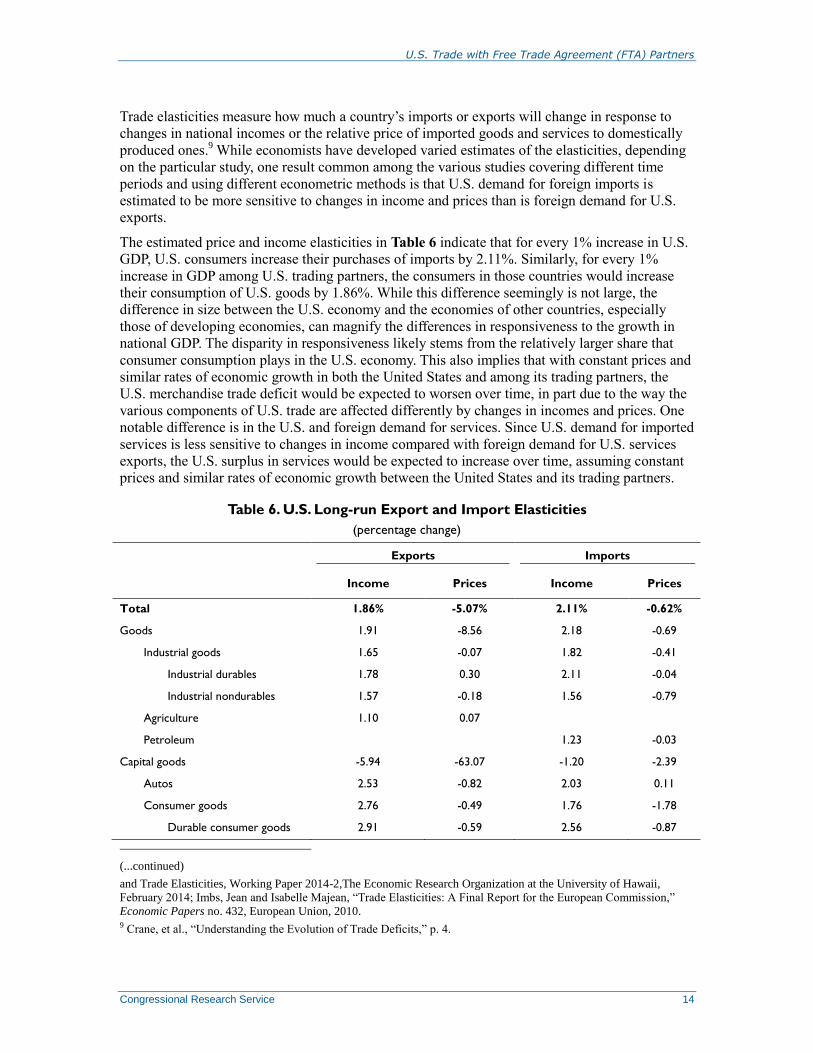
The estimated price and income elasticities in Table 6 indicate that for every 1% increase in U.S.
GDP, U.S. consumers increase their purchases of imports by 2.11%. Similarly, for every 1%
increase in GDP among U.S. trading partners, the consumers in those countries would increase
their consumption of U.S. goods by 1.86%. While this difference seemingly is not large, the
difference in size between the U.S. economy and the economies of other countries, especially
those of developing economies, can magnify the differences in responsiveness to the growth in
national GDP. The disparity in responsiveness likely stems from the relatively larger share that
consumer consumption plays in the U.S. economy. This also implies that with constant prices and
similar rates of economic growth in both the United States and among its trading partners, the
U.S. merchandise trade deficit would be expected to worsen over time, in part due to the way the
various components of U.S. trade are affected differently by changes in incomes and prices. One
notable difference is in the U.S. and foreign demand for services. Since U.S. demand for imported
services is less sensitive to changes in income compared with foreign demand for U.S. services
exports, the U.S. surplus in services would be expected to increase over time, assuming constant
prices and similar rates of economic growth between the United States and its trading partners.
Table 6. U.S. Long-run Export and Import Elasticities
(percentage change)
Exports Imports
Income Prices Income Prices
Total 1.86% -5.07% 2.11% -0.62%
Goods 1.91 -8.56 2.18 -0.69
Industrial goods 1.65 -0.07 1.82 -0.41
Industrial durables 1.78 0.30 2.11 -0.04
Industrial nondurables 1.57 -0.18 1.56 -0.79
Agriculture 1.10 0.07
Petroleum 1.23 -0.03
Capital goods -5.94 -63.07 -1.20 -2.39
Autos 2.53 -0.82 2.03 0.11
Consumer goods 2.76 -0.49 1.76 -1.78
Durable consumer goods 2.91 -0.59 2.56 -0.87
(...continued)
and Trade Elasticities, Working Paper 2014-2,The Economic Research Organization at the University of Hawaii,
February 2014; Imbs, Jean and Isabelle Majean, “Trade Elasticities: A Final Report for the European Commission,”
Economic Papers no. 432, European Union, 2010. 9 Crane, et al., “Understanding the Evolution of Trade Deficits,” p. 4.
U.S. Trade with Free Trade Agreement (FTA) Partners
Congressional Research Service 15
Exports Imports
Income Prices Income Prices
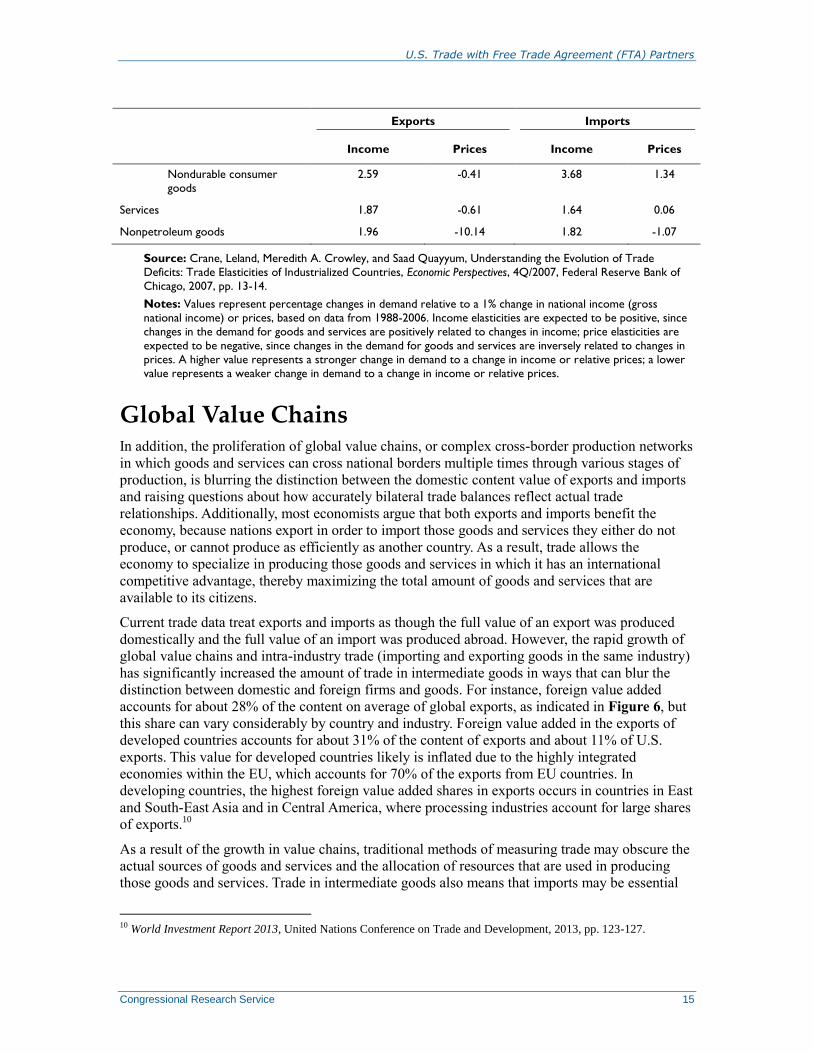
Nondurable consumer
goods
2.59 -0.41 3.68 1.34
Services 1.87 -0.61 1.64 0.06
Nonpetroleum goods 1.96 -10.14 1.82 -1.07
Source: Crane, Leland, Meredith A. Crowley, and Saad Quayyum, Understanding the Evolution of Trade
Deficits: Trade Elasticities of Industrialized Countries, Economic Perspectives, 4Q/2007, Federal Reserve Bank of
Chicago, 2007, pp. 13-14.
Notes: Values represent percentage changes in demand relative to a 1% change in national income (gross
national income) or prices, based on data from 1988-2006. Income elasticities are expected to be positive, since
changes in the demand for goods and services are positively related to changes in income; price elasticities are
expected to be negative, since changes in the demand for goods and services are inversely related to changes in
prices. A higher value represents a stronger change in demand to a change in income or relative prices; a lower
value represents a weaker change in demand to a change in income or relative prices.
Global Value Chains In addition, the proliferation of global value chains, or complex cross-border production networks
in which goods and services can cross national borders multiple times through various stages of
production, is blurring the distinction between the domestic content value of exports and imports
and raising questions about how accurately bilateral trade balances reflect actual trade
relationships. Additionally, most economists argue that both exports and imports benefit the
economy, because nations export in order to import those goods and services they either do not
produce, or cannot produce as efficiently as another country. As a result, trade allows the
economy to specialize in producing those goods and services in which it has an international
competitive advantage, thereby maximizing the total amount of goods and services that are
available to its citizens.
Current trade data treat exports and imports as though the full value of an export was produced
domestically and the full value of an import was produced abroad. However, the rapid growth of
global value chains and intra-industry trade (importing and exporting goods in the same industry)
has significantly increased the amount of trade in intermediate goods in ways that can blur the
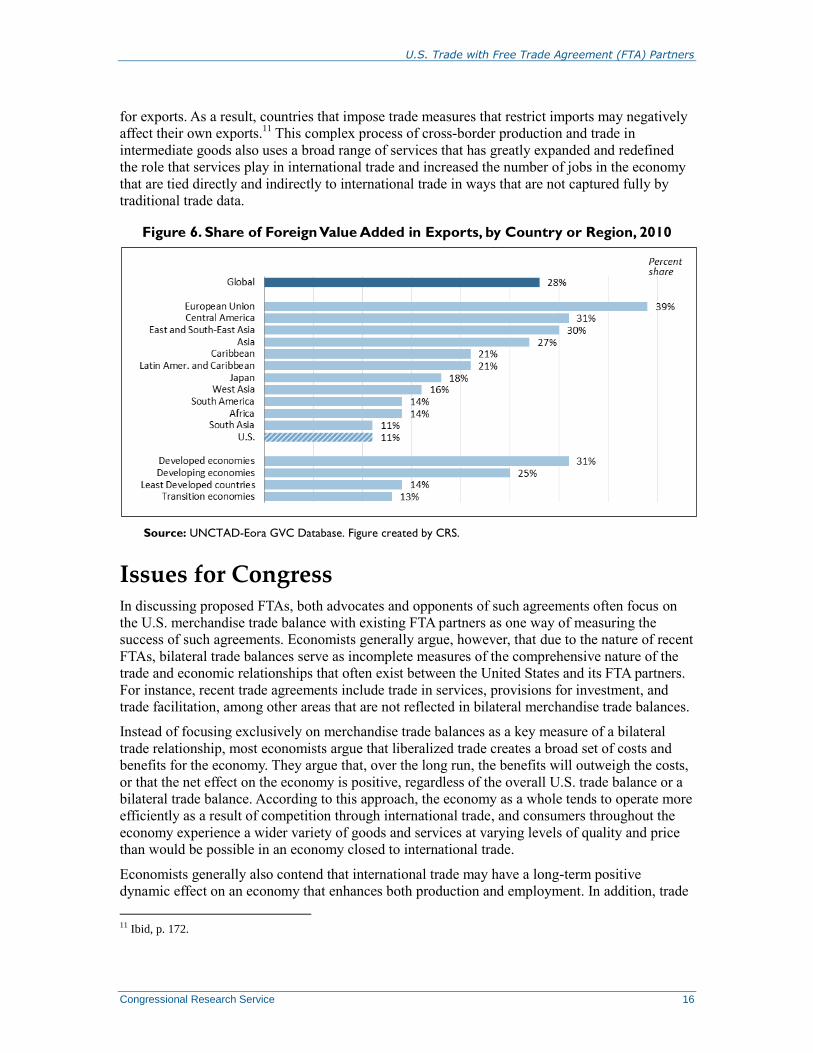
distinction between domestic and foreign firms and goods. For instance, foreign value added
accounts for about 28% of the content on average of global exports, as indicated in Figure 6, but
this share can vary considerably by country and industry. Foreign value added in the exports of
developed countries accounts for about 31% of the content of exports and about 11% of U.S.
exports. This value for developed countries likely is inflated due to the highly integrated
economies within the EU, which accounts for 70% of the exports from EU countries. In
developing countries, the highest foreign value added shares in exports occurs in countries in East
and South-East Asia and in Central America, where processing industries account for large shares
of exports.10
As a result of the growth in value chains, traditional methods of measuring trade may obscure the
actual sources of goods and services and the allocation of resources that are used in producing
those goods and services. Trade in intermediate goods also means that imports may be essential
10 World Investment Report 2013, United Nations Conference on Trade and Development, 2013, pp. 123-127.
U.S. Trade with Free Trade Agreement (FTA) Partners
Congressional Research Service 16
for exports. As a result, countries that impose trade measures that restrict imports may negatively
affect their own exports.11
This complex process of cross-border production and trade in
intermediate goods also uses a broad range of services that has greatly expanded and redefined
the role that services play in international trade and increased the number of jobs in the economy
that are tied directly and indirectly to international trade in ways that are not captured fully by
traditional trade data.
Figure 6. Share of Foreign Value Added in Exports, by Country or Region, 2010
Source: UNCTAD-Eora GVC Database. Figure created by CRS.
Issues for Congress In discussing proposed FTAs, both advocates and opponents of such agreements often focus on
the U.S. merchandise trade balance with existing FTA partners as one way of measuring the
success of such agreements. Economists generally argue, however, that due to the nature of recent
FTAs, bilateral trade balances serve as incomplete measures of the comprehensive nature of the
trade and economic relationships that often exist between the United States and its FTA partners.
For instance, recent trade agreements include trade in services, provisions for investment, and
trade facilitation, among other areas that are not reflected in bilateral merchandise trade balances.
Instead of focusing exclusively on merchandise trade balances as a key measure of a bilateral
trade relationship, most economists argue that liberalized trade creates a broad set of costs and
benefits for the economy. They argue that, over the long run, the benefits will outweigh the costs,
or that the net effect on the economy is positive, regardless of the overall U.S. trade balance or a
bilateral trade balance. According to this approach, the economy as a whole tends to operate more
efficiently as a result of competition through international trade, and consumers throughout the
economy experience a wider variety of goods and services at varying levels of quality and price
than would be possible in an economy closed to international trade.
Economists generally also contend that international trade may have a long-term positive
dynamic effect on an economy that enhances both production and employment. In addition, trade
11 Ibid, p. 172.
U.S. Trade with Free Trade Agreement (FTA) Partners
Congressional Research Service 17
agreements of the type currently being negotiated by the United States comprise a broad range of
issues that could have significant economic effects on trade and commercial relations over the
long run between the negotiating parties, particularly for developing and emerging economies.
Economists and others also acknowledge that the negative effects of international trade and trade
agreements, particularly potential job losses and lower wages, often are distributed
disproportionately with the effects falling more heavily on some workers and on some firms. As a
consequence, governments often have implemented programs to provide benefits to those
negatively affected by trade agreements to ease their transition to other economic activities.
Most economists also argue that bilateral merchandise trade balances do not serve well as a basis
for comparing the relative merits of particular FTAs, because each bilateral trade relationship is
unique to the particular trading partners and is subject to a great number of factors. These unique
bilateral trade relationships reflect underlying fundamentals that shape the composition of the
particular trade relationship. As a consequence of the underlying composition of bilateral trade
relationships, bilateral trade and trade balances respond differently to trade liberalization, which
makes it difficult to compare the U.S. experience with individual FTA partners.
Furthermore, the growth of global value chains and inter-industry trade are blurring the
distinction between exports and imports and fundamentally changing the meaning of bilateral
trade balances. Cross-border trade in intermediate goods not only has increased as a share of total
trade in the economy, but it has expanded the role of services in international trade in ways that
are not fully credited in bilateral trade data. As a consequence of the growth in global value
chains, exports and imports are growing less distinct: policies that affect a nation’s imports
ultimately affect its exports and vice versa. Trade in intermediate goods also means that imports
are essential inputs into the production of exports. As a result, countries that impose trade
measures that restrict imports invariably negatively affect their own exports. This loss of
distinction between exports and imports as strictly domestic or foreign activities further
complicates efforts to distinguish between exports and imports on a bilateral basis.
Congress has considered, and may again consider, two mega-regional free trade agreements that
its participants argue are comprehensive and high-standard: the concluded Trans-Pacific
Partnership (TPP) among the United States and 11 other countries, and the U.S.-European
Transatlantic Trade and Investment Partnership (T-TIP). Since the two agreements could have
potentially economy-wide effects, Congress may choose to examine the current methods that are
used to collect data on U.S. exports and imports and the potential costs and benefits of improving
the data to have them more fully reflect the resource costs they may imply for the economy.
Congress may also choose to examine the state of data collection and analysis on workers and
industries and the states where they are located in order to determine those that may be the most
vulnerable to economic dislocations as one way of anticipating the costs and benefits of the
proposed agreements to the economy as a whole. Congress may also choose to examine the role
that global value chains are playing in the economy and the impact they are having on the
nation’s ability to assess the impact of exports and imports on the allocation of resources in the
economy.

U.S. Trade with Free Trade Agreement (FTA) Partners
Congressional Research Service 18
Appendix A. U.S.-NAFTA Trade NAFTA is often cited as an example of a trade agreement that performed differently than some
had anticipated, because the United States continued to experience a merchandise trade deficit
with the two NAFTA partners. For some, however, the agreement is seen as an example of the
impact that broad economic events can have on trading partners in ways that that are not
anticipated at the time an FTA is negotiated, but can outweigh the impact of the agreement. In
particular, China’s accession to the WTO in 2001 affected U.S. trade relations and those of its
NAFTA partners in a number of ways. China’s accession to the WTO reduced China’s barriers to
trade and investment, which tended to increase trade between the United States and China and
boosted U.S. investment in China. As a result of the increased amount of U.S. trade with China,
U.S. trade with other countries, including Canada and Mexico, were affected. In particular, U.S.
imports from China of computer equipment, apparel, and semiconductors reduced imports of such
items from other countries.
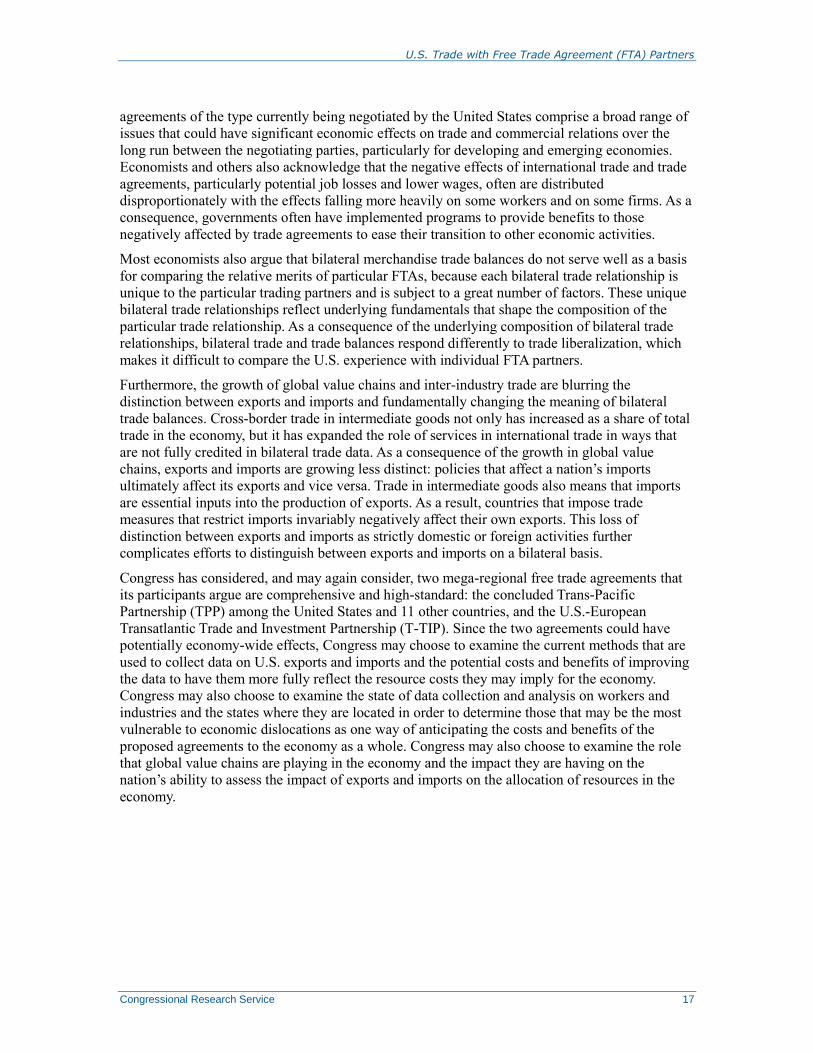
These various events played out differently with U.S. trade partners, as indicated in Figures A-1
and A-2, which show the average share of U.S. imports and exports with Canada, Mexico, and
China in five-year periods from 1989 to 2017.12
In 1989, total U.S. imports were $473 billion,
with Canada, Mexico, and China accounting for $88 billion, $27 billion, and $12 billion,
respectively. In terms of shares, these three countries accounted for 18.6%, 5.7%, and 2.5%,
respectively, of total U.S. imports.
By 2000, total U.S. imports had grown to $1.2 trillion, with imports from Canada ($231 billion),
Mexico ($136 billion), and China ($100 billion) accounting for shares of 19%, 11.5%, and 8.2%,
respectively. During the period 1990-2000, Canada’s share of total U.S. imports rose slightly,
while shares of imports from Mexico doubled and shares of imports from China nearly
quadrupled. Between 2000 and 2017, however, Canada’s share of total U.S. imports fell to
account for 12.8%, while Mexico’s share rose slightly to 13.4%, and China’s share more than
doubled to account for 21.4% of total U.S. imports. The data reflect the average share of U.S.
imports over five-year periods, except for the data for 1990, which reflect the share in 1990, and
the share in 2017, which reflects the average share over the two-year 2016-2017 period.
The data indicate that Canada’s share of U.S. imports grew little under the NAFTA agreement
(implemented in 1994) until 2000, after which that share has fallen, while imports from Mexico
experienced their greatest average rate of growth as a share of U.S. imports between 1995 and
2000. On the other hand, imports from China grew steadily as a share of U.S. total imports over
the entire period, but they grew at a faster rate after China was admitted into the WTO in 2001. A
similar trend holds for shares of U.S. exports, with the share of U.S. exports with Canada
declining after 2000, while the share of U.S. exports with China experiencing a steady increase in
total U.S. exports. The share of U.S. exports going to Mexico dipped during the period just before
and during the 2008-2009 recession, but rebounded as a modest pace after 2010. As previously
indicated, bilateral trade balances are influenced by a broad range of factors. As a result, it is very
difficult to unravel the complicated linkages that exist within the economy in order to derive
cause and effect relationships between a trade agreement and the impact that agreement might
have on bilateral trade balances.
12 The data are organized into five-year periods to illustrate trends and shifts in those trends.
U.S. Trade with Free Trade Agreement (FTA) Partners
Congressional Research Service 19
Figure A-1. U.S. Trade With Canada, China, and Mexico (Select years1990-2017)
Source: U.S. Census Bureau. Figure created by CRS.
Notes: Values represent five-year averages, except for 1990 and 2017.
U.S. Trade with Free Trade Agreement (FTA) Partners
Congressional Research Service 20
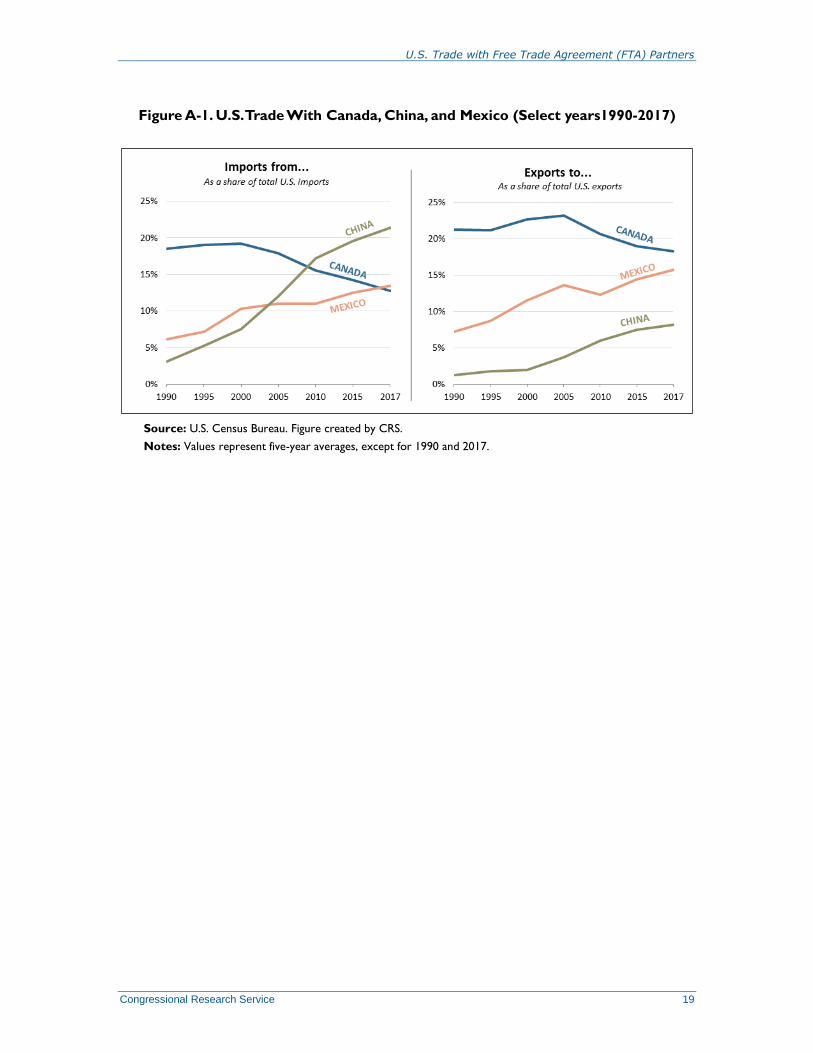
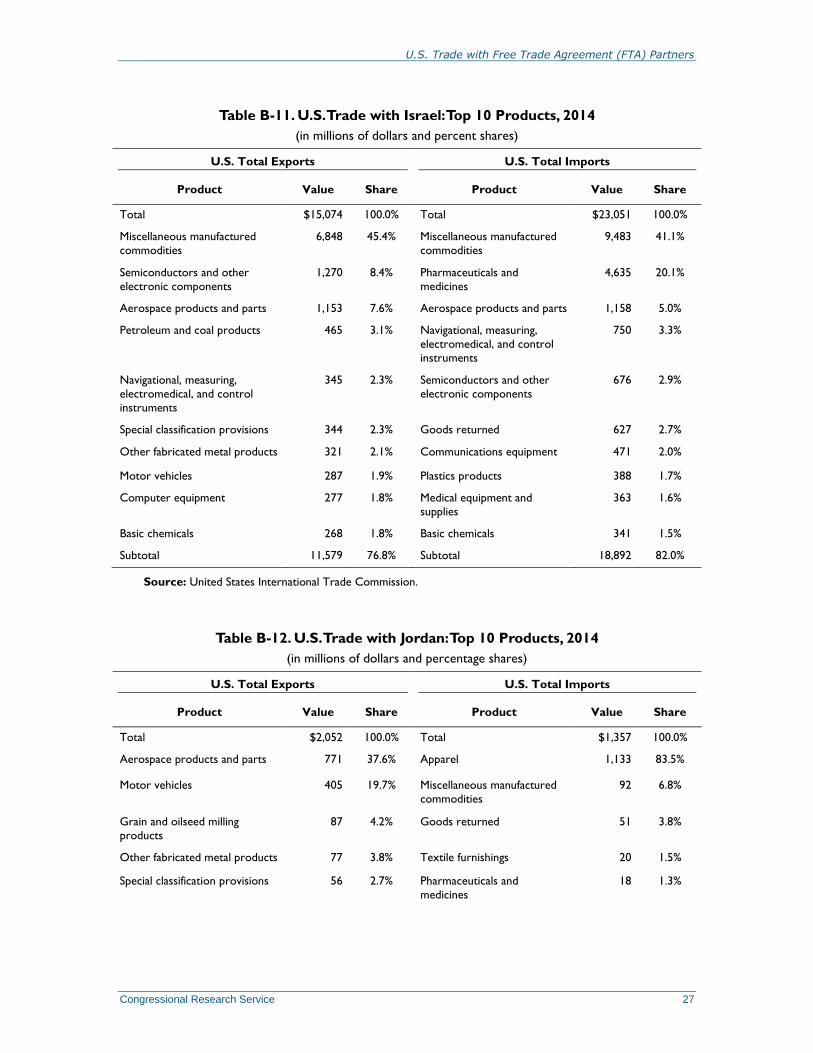
Appendix B. U.S. Trade with FTA Partner Countries,
Top 10 Export and Import Commodities, 2014 This Appendix presents 2014 data on the top 10 U.S. export and import commodities by value
and share of total bilateral exports and imports, respectively, for the 20 countries with which the
United States currently has an FTA.
Table B-1. U.S. Trade with Australia: Top 10 Products, 2014
(in millions of dollars and percentage shares)
U.S. Total Exports U.S. Total Imports
Product Value Share Product Value Share
Total $26,668 100.0% Total $10,670 100.0%
Aerospace products and parts 2,364 8.9% Meat products and meat
packaging products
2,750 25.8%
Motor vehicles 2,294 8.6% Nonferrous metal and
processing
1,033 9.7%
Agriculture and construction
machinery
1,986 7.4% Goods returned 681 6.4%
Special classification provisions 1,385 5.2% Aerospace products and parts 510 4.8%
Navigational, measuring,
electromedical, and control
instruments
1,171 4.4% Metal ores 483 4.5%
Other general purpose
machinery
1,108 4.2% Beverages 460 4.3%
Medical equipment and supplies 1,101 4.1% Medical equipment and
supplies
432 4.0%
Motor vehicle parts 887 3.3% Miscellaneous manufactured
commodities
411 3.9%
Pharmaceuticals and medicines 869 3.3% Pharmaceuticals and
medicines
335 3.1%
Engines, turbines, and power
transmission equipment
853 3.2% Navigational, measuring,
electromedical, and control
instruments
303 2.8%
Subtotal $14,018 52.6% Subtotal $7,399 69.3%
Source: United States International Trade Commission.

U.S. Trade with Free Trade Agreement (FTA) Partners
Congressional Research Service 21
Table B-2. U.S. Trade with Bahrain: Top 10 Products, 2014
(in millions of dollars and percentage shares)
U.S. Total Exports U.S. Total Imports
Product Value Share Product Value Share
Total $1,060 100.0% Total $965 100.0%
Motor vehicles 263 24.8% Alumina and aluminum and
processing
254 26.3%
Special classification provisions 221 20.8% Petroleum and coal products 164 17.0%
Aerospace products and parts 120 11.3% Pesticides, fertilizers and
other agricultural chemicals
150 15.5%
Other general purpose
machinery
47 4.4% Apparel 133 13.8%
Navigational, measuring,
electromedical, and control
instruments
34 3.2% Textile furnishings 69 7.1%
Agriculture and construction
machinery
30 2.8% Goods returned 67 6.9%
Dairy products 27 2.5% Basic chemicals 43 4.5%
Miscellaneous manufactured
commodities
24 2.3% Plastics products 31 3.2%
Resin, synthetic rubber &
artificial & synthetic fibers &
filament
22 2.1% Miscellaneous manufactured
commodities
24 2.5%
Other fabricated metal products 17 1.6% Other general purpose
machinery
8 0.8%
Subtotal $804 75.8% Subtotal $944 97.8%
Source: United States International Trade Commission.
Table B-3. U.S. Trade with Canada: Top 10 Products, 2014
(in millions of dollars and percentage shares)
U.S. Total Exports U.S. Total Imports
Product Value Share Product Value Share
Total $312,032 100.0% Total $346,063 100.0%
Motor vehicles 26,932 8.6% Oil and gas 96,128 27.8%
Motor vehicle parts 25,958 8.3% Motor vehicles 44,249 12.8%
Oil and gas 16,796 5.4% Petroleum and coal products 15,756 4.6%
Petroleum and coal products 15,086 4.8% Motor vehicle parts 14,630 4.2%
Agriculture and construction
machinery
11,179 3.6% Goods returned 12,006 3.5%

U.S. Trade with Free Trade Agreement (FTA) Partners
Congressional Research Service 22
U.S. Total Exports U.S. Total Imports
Product Value Share Product Value Share
Special classifications 10,562 3.4% Nonferrous metal and
processing
10,496 3.0%
Other general purpose
machinery
9,821 3.1% Aerospace products and
parts
10,351 3.0%
Computer equipment 8,723 2.8% Basic chemicals 8,247 2.4%
Basic chemicals 8,114 2.6% Pulp, paper, and paperboard
mill products
7,316 2.1%
Iron and steel and ferroalloy 7,853 2.5% Resin, synthetic rubber, &
artificial & synthetic fibers &
filament
6,171 1.8%
Subtotal $141,023 45.2% Subtotal $225,350 65.1%
Source: United States International Trade Commission.
Table B-4. U.S. Trade with Chile: Top 10 Products, 2014
(in millions of dollars and percentage shares)
U.S. Total Exports U.S. Total Imports
Product Value Share Product Value Share
Total $16,631 100.0% Total $9,491 100.0%
Petroleum and coal products 5,107 30.7% Nonferrous metal and
processing
2,393 25.2%
Aerospace products and parts 1,635 9.8% Fruits and tree nuts 1,527 16.1%
Agriculture and construction
machinery
925 5.6% Farmed fish and related
products
1,000 10.5%
Basic chemicals 694 4.2% Fish, fresh, chilled or frozen
and other marine products
638 6.7%
Special classification provisions 648 3.9% Rubber products 395 4.2%
Computer equipment 606 3.6% Fruit and vegetable preserves
and specialty goods
391 4.1%
Motor vehicles 527 3.2% Basic chemicals 339 3.6%
Oil and gas 439 2.6% Veneer, plywood, and
engineered wood products
317 3.3%
Other general purpose
machinery
430 2.6% Beverages 301 3.2%
Resin, synthetic rubber, &
artificial & synthetic fibers &
filament
420 2.5% Other wood products 300 3.2%
Subtotal $11,432 68.7% Subtotal $7,601 80.1%
Source: United States International Trade Commission.

U.S. Trade with Free Trade Agreement (FTA) Partners
Congressional Research Service 23
Table B-5. U.S. Trade with Colombia: Top 10 Products, 2014
(in millions of dollars and percentage shares)
U.S. Total Exports U.S. Total Imports
Product Value Share Product Value Share
Total $20,317 100.0% Total $18,234 100.0%
Petroleum and coal products 6,342 31.2% Oil and gas 10,312 56.6%
Basic chemicals 1,289 6.3% Nonferrous metal and
processing
1,790 9.8%
Oilseeds and grains 1,270 6.3% Fruits and tree nuts 1,298 7.1%
Communications equipment 882 4.3% Petroleum and coal products 1,014 5.6%
Computer equipment 849 4.2% Mushrooms, nursery and
related products
662 3.6%
Aerospace products and parts 834 4.1% Coal and petroleum gases 648 3.6%
Resin, synthetic rubber, &
artificial & synthetic fibers &
filament
681 3.4% Miscellaneous manufactured
commodities
263 1.4%
Agriculture and construction
machinery
612 3.0% Special classification
provisions
252 1.4%
Special classification provisions 550 2.7% Goods returned 185 1.0%
Other general purpose
machinery
549 2.7% Apparel 183 1.0%
Subtotal $13,857 68.2% Subtotal $16,607 91.1%
Source: United States International Trade Commission.
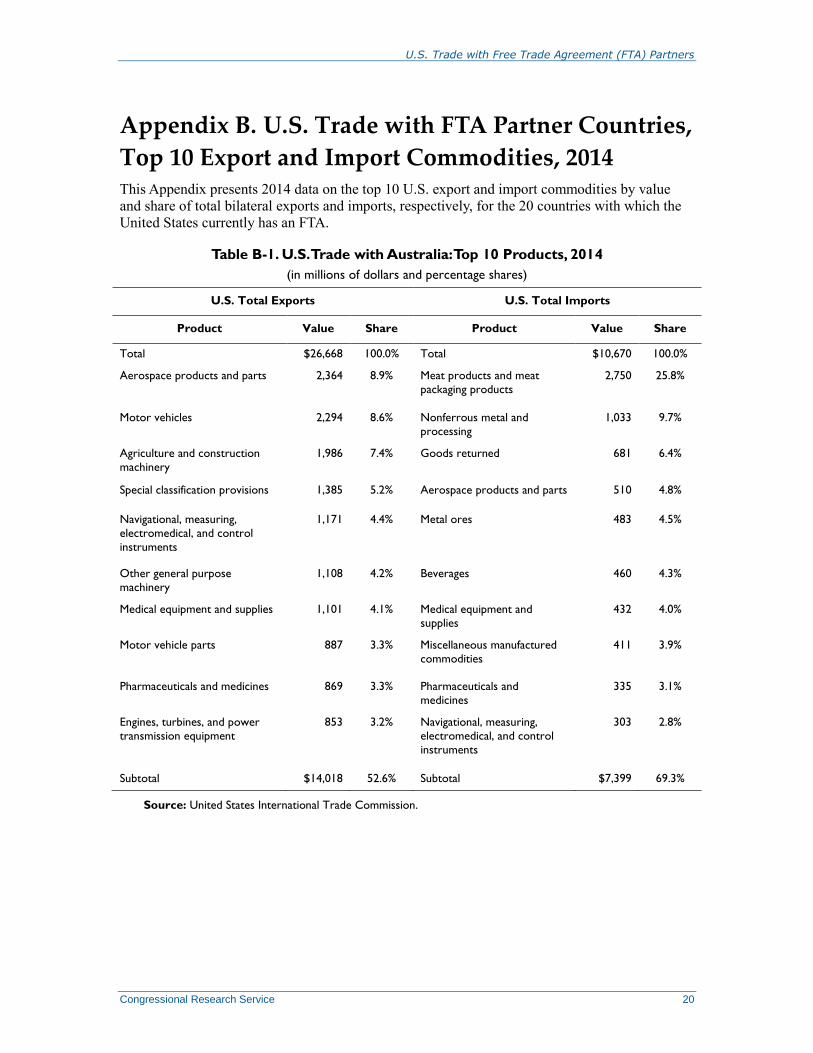
Table B-6. U.S. Trade with Costa Rica: Top 10 Products, 2014
(in millions of dollars and percentage shares)
U.S. Total Exports U.S. Total Imports
Product Value Share Product Value Share
Total $7,026 100.0% Total $9,508 100.0%
Petroleum and coal products 1,964 28.0% Semiconductors and other
electronic components
5,592 58.8%
Semiconductors and other
electronic components
593 8.4% Fruit and tree nuts 1,116 11.7%
Aerospace products and parts 345 4.9% Medical equipment and
supplies
1,004 10.6%
Communications equipment 344 4.9% Navigational, measuring,
electromedical, and control
instruments
263 2.8%
U.S. Trade with Free Trade Agreement (FTA) Partners
Congressional Research Service 24
U.S. Total Exports U.S. Total Imports
Product Value Share Product Value Share
Resin, synthetic rubber, &
artificial & synthetic fibers &
filament
329 4.7% Fruit and vegetable preserves
and specialty foods
163 1.7%
Oilseeds and grains 294 4.2% Motor vehicle parts 114 1.2%
Special classification provisions 260 3.7% Plastics products 104 1.1%
Medical equipment and supplies 227 3.2% Electrical equipment and components
97 1.0%
Pulp, paper, and paperboard mill products
227 3.2% Rubber products 87 0.9%
Computer equipment 210 3.0% Fish, fresh, chilled or frozen
and other marine products
84 0.9%
Subtotal $4,793 68.2% Subtotal $8,624 90.7%
Source: United States International Trade Commission.
Table B-7. U.S. Trade with Dominican Republic: Top 10 Products, 2014
(in millions of dollars and percentage shares)
U.S. Total Exports U.S. Total Imports
Product Value Share Product Value Share
Total $7,955 100.0% Total $4,519 100.0%
Petroleum and coal products 1,408 17.7% Apparel 725 16.0%
Oil and gas 485 6.1% Medical equipment and
supplies
710 15.7%
Grain and oilseed milling
products
403 5.1% Tobacco products 522 11.6%
Motor vehicles 323 4.1% Electrical equipment 329 7.3%
Oilseeds and grains 312 3.9% Miscellaneous manufactured
commodities
257 5.7%
Fibers, yarns, and threads 308 3.9% Footwear 256 5.7%
Special classification provisions 304 3.8% Navigational, measuring,
electromedical, and control
instruments
215 4.8%
Miscellaneous manufactured
commodities
267 3.4% Plastics products 185 4.1%
Plastics products 231 2.9% Goods returned 113 2.5%
Medical equipment and supplies 227 2.9% Oil and gas 105 2.3%
Subtotal $4,269 53.7% Subtotal $3,419 75.7%
Source: United States International Trade Commission.

U.S. Trade with Free Trade Agreement (FTA) Partners
Congressional Research Service 25
Table B-8. U.S. Trade with El Salvador: Top 10 Products, 2014
(in millions of dollars and percentage shares)
U.S. Total Exports U.S. Total Imports
Product Value Share Product Value Share
Total $3,347 100.0% Total $2,396 100.0%
Petroleum and coal products 815 24.4% Apparel 1,634 68.2%
Oilseeds and grains 234 7.0% Knit apparel 262 10.9%
Special classification provisions 217 6.5% Sugar and confectionary
products
88 3.7%
Resin, synthetic rubber, &
artificial & synthetic fibers &
filament
205 6.1% Fruits and tree nuts 46 1.9%
Fabrics 182 5.4% Waste and scrap 41 1.7%
Fibers, yarns, and threads 166 5.0% Motor vehicle parts 37 1.5%
Aerospace products and parts 122 3.6% Goods returned 33 1.4%
Grain and oilseed milling
products
111 3.3% Footwear 27 1.1%
Computer equipment 102 3.0% Semiconductors and other
electronic components
23 1.0%
Knit apparel 88 2.6% Other nonmetallic mineral
products
21 0.9%
Subtotal $2,241 67.0% Subtotal $2,212 92.3%
Source: United States International Trade Commission.
Table B-9. U.S. Trade with Guatemala: Top 10 Products, 2014
(in millions of dollars and percentage shares)
U.S. Total Exports U.S. Total Imports
Product Value Share Product Value Share
Total $6,057 100.0% Total $4,217 100.0%
Petroleum and coal products 1,789 29.5% Apparel 1,335 31.7%
Special classification provisions 423 7.0% Fruits and tree nuts 1,194 28.3%
Oilseeds and grains 354 5.8% Nonferrous metal and
processing
370 8.8%
Grain and oilseed milling
products
254 4.2% Vegetables and melons 254 6.0%
Resins, synthetic rubber, &
artificial & synthetic fibers &
filament
217 3.6% Oil and gas 226 5.4%
Pulp, paper, and paperboard mill
products
211 3.5% Sugar and confectionary
products
158 3.7%

U.S. Trade with Free Trade Agreement (FTA) Partners
Congressional Research Service 26
U.S. Total Exports U.S. Total Imports
Product Value Share Product Value Share
Meat products and meat
packaging products
196 3.2% Fruit and vegetable preserves
and specialty foods
119 2.8%
Computer equipment 175 2.9% Waste and scrap 63 1.5%
Basic chemicals 146 2.4% Beverages 45 1.1%
Communications equipment 140 2.3% Basic chemicals 45 1.1%
Subtotal $3,905 64.5% Subtotal $3,809 90.3%
Source: United States International Trade Commission.
Table B-10. U.S. Trade with Honduras: Top 10 Products, 2014
(in millions of dollars and percent shares)
U.S. Total Exports U.S. Total Imports
Product Value Share Product Value Share
Total $5,932 100.0% Total $4,643 100.0%
Petroleum and coal products 1,516 25.6% Apparel 2,395 51.6%
Fibers, yarns, and threads 1,005 16.9% Motor vehicle parts 595 12.8%
Special classification provisions 377 6.4% Fruit and tree nuts 416 9.0%
Fabrics 328 5.5% Fish, fresh, chilled or frozen
and other marine products
192 4.1%
Oil and gas 274 4.6% Knit apparel 177 3.8%
Oilseeds and grains 233 3.9% Nonferrous metal and
processing
160 3.4%
Electrical equipment and
components
185 3.1% Apparel accessories 103 2.2%
Grain and oilseed milling
products
130 2.2% Tobacco products 85 1.8%
Resin, synthetic rubber, &
artificial & synthetic fibers &
filament
119 2.0% Goods returned 69 1.5%
Communications equipment 112 1.9% Vegetables and melons 62 1.3%
Subtotal $4,280 72.2% Subtotal $4,254 91.6%
Source: United States International Trade Commission.
U.S. Trade with Free Trade Agreement (FTA) Partners
Congressional Research Service 27
Table B-11. U.S. Trade with Israel: Top 10 Products, 2014
(in millions of dollars and percent shares)
U.S. Total Exports U.S. Total Imports
Product Value Share Product Value Share
Total $15,074 100.0% Total $23,051 100.0%
Miscellaneous manufactured
commodities
6,848 45.4% Miscellaneous manufactured
commodities
9,483 41.1%
Semiconductors and other
electronic components
1,270 8.4% Pharmaceuticals and
medicines
4,635 20.1%
Aerospace products and parts 1,153 7.6% Aerospace products and parts 1,158 5.0%
Petroleum and coal products 465 3.1% Navigational, measuring,
electromedical, and control
instruments
750 3.3%
Navigational, measuring,
electromedical, and control
instruments
345 2.3% Semiconductors and other
electronic components
676 2.9%
Special classification provisions 344 2.3% Goods returned 627 2.7%
Other fabricated metal products 321 2.1% Communications equipment 471 2.0%
Motor vehicles 287 1.9% Plastics products 388 1.7%
Computer equipment 277 1.8% Medical equipment and
supplies
363 1.6%
Basic chemicals 268 1.8% Basic chemicals 341 1.5%
Subtotal 11,579 76.8% Subtotal 18,892 82.0%
Source: United States International Trade Commission.
Table B-12. U.S. Trade with Jordan: Top 10 Products, 2014
(in millions of dollars and percentage shares)
U.S. Total Exports U.S. Total Imports
Product Value Share Product Value Share
Total $2,052 100.0% Total $1,357 100.0%
Aerospace products and parts 771 37.6% Apparel 1,133 83.5%
Motor vehicles 405 19.7% Miscellaneous manufactured
commodities
92 6.8%
Grain and oilseed milling
products
87 4.2% Goods returned 51 3.8%
Other fabricated metal products 77 3.8% Textile furnishings 20 1.5%
Special classification provisions 56 2.7% Pharmaceuticals and
medicines
18 1.3%

U.S. Trade with Free Trade Agreement (FTA) Partners
Congressional Research Service 28
U.S. Total Exports U.S. Total Imports
Product Value Share Product Value Share
Communications equipment 52 2.5% Ventilation, heating, air-
conditioning, and commercial
refrigeration equipment
7 0.5%
Fruits and tree nuts 36 1.8% Tobacco products 6 0.4%
Navigational, measuring,
electromedical, and control
instruments
36 1.8% Basic chemicals 5 0.4%
Other general purpose
machinery
32 1.6% Fruit and vegetable preserves
and specialty foods
4 0.3%
Motor vehicle parts 28 1.4% Plastics products 3 0.2%
Subtotal $1,578 76.9% Subtotal $1,339 98.6%
Source: United States International Trade Commission.
Table B-13. U.S. Trade with South Korea: Top 10 Products, 2014
(in millions of dollars and percentage shares)
U.S. Total Exports U.S. Total Imports
Product Value Share Product Value Share
Total $44,544 100.0% Total $69,606 100.0%
Semiconductors and other
electronic components
4,024 9.0% Motor vehicles 14,687 21.1%
Basic chemicals 3,299 7.4% Communications equipment 8,248 11.8%
Aerospace products and parts 3,153 7.1% Motor vehicle parts 6,418 9.2%
Industrial machinery 2,809 6.3% Semiconductors and other
electronic components
5,106 7.3%
Oilseeds and grains 1,862 4.2% Iron and steel and ferroalloy 4,246 6.1%
Meat products and meat
packaging products
1,817 4.1% Petroleum and coal products 3,775 5.4%
Navigational, measuring,
electromedical, and control
instruments
1,726 3.9% Household appliances and
miscellaneous machines
1,524 2.2%
Other fabricated metal products 1,321 3.0% Rubber products 1,461 2.1%
Waste and scrap 1,304 2.9% Agriculture and construction
machinery
1,401 2.0%
Other general purpose
machinery
1,298 2.9% Resin, synthetic rubber, &
artificial & synthetic fibers &
filament
1,340 1.9%
Subtotal $22,613 50.8% Subtotal $48,205 69.3%
Source: United States International Trade Commission.
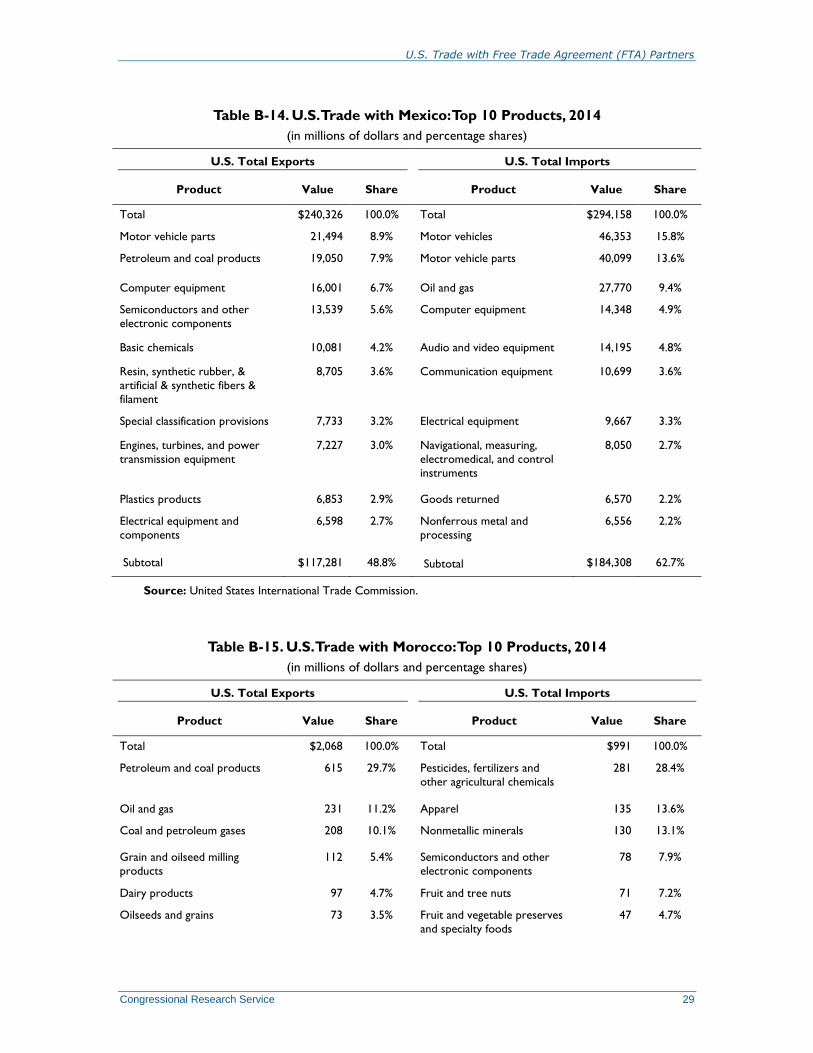
U.S. Trade with Free Trade Agreement (FTA) Partners
Congressional Research Service 29
Table B-14. U.S. Trade with Mexico: Top 10 Products, 2014
(in millions of dollars and percentage shares)
U.S. Total Exports U.S. Total Imports
Product Value Share Product Value Share
Total $240,326 100.0% Total $294,158 100.0%
Motor vehicle parts 21,494 8.9% Motor vehicles 46,353 15.8%
Petroleum and coal products 19,050 7.9% Motor vehicle parts 40,099 13.6%
Computer equipment 16,001 6.7% Oil and gas 27,770 9.4%
Semiconductors and other
electronic components
13,539 5.6% Computer equipment 14,348 4.9%
Basic chemicals 10,081 4.2% Audio and video equipment 14,195 4.8%
Resin, synthetic rubber, &
artificial & synthetic fibers &
filament
8,705 3.6% Communication equipment 10,699 3.6%
Special classification provisions 7,733 3.2% Electrical equipment 9,667 3.3%
Engines, turbines, and power
transmission equipment
7,227 3.0% Navigational, measuring,
electromedical, and control
instruments
8,050 2.7%
Plastics products 6,853 2.9% Goods returned 6,570 2.2%
Electrical equipment and
components
6,598 2.7% Nonferrous metal and
processing
6,556 2.2%
Subtotal $117,281 48.8% Subtotal $184,308 62.7%
Source: United States International Trade Commission.
Table B-15. U.S. Trade with Morocco: Top 10 Products, 2014
(in millions of dollars and percentage shares)
U.S. Total Exports U.S. Total Imports
Product Value Share Product Value Share
Total $2,068 100.0% Total $991 100.0%
Petroleum and coal products 615 29.7% Pesticides, fertilizers and
other agricultural chemicals
281 28.4%
Oil and gas 231 11.2% Apparel 135 13.6%
Coal and petroleum gases 208 10.1% Nonmetallic minerals 130 13.1%
Grain and oilseed milling
products
112 5.4% Semiconductors and other
electronic components
78 7.9%
Dairy products 97 4.7% Fruit and tree nuts 71 7.2%
Oilseeds and grains 73 3.5% Fruit and vegetable preserves
and specialty foods
47 4.7%

U.S. Trade with Free Trade Agreement (FTA) Partners
Congressional Research Service 30
U.S. Total Exports U.S. Total Imports
Product Value Share Product Value Share
Basic chemicals 59 2.9% Motor vehicle parts 42 4.2%
Pulp, paper, and paperboard mill
products
53 2.6% Seafood products, prepared,
canned and packaged
40 4.0%
Aerospace products and parts 53 2.6% Special classification
provisions
27 2.7%
Other agricultural products 45 2.2% Grain and oilseed milling
products
19 1.9%
Subtotal $1,547 74.8% Subtotal $869 87.7%
Source: United States International Trade Commission.
Table B-16. U.S. Trade with Nicaragua: Top 10 Products, 2014
(in millions of dollars and percentage shares)
U.S. Total Exports U.S. Total Imports
Product Value Share Product Value Share
Total $1,014 100.0% Total $3,104 100.0%
Fabrics 112 11.0% Apparel 1,505 48.5%
Special classification provisions 105 10.4% Motor vehicle parts 479 15.4%
Grain and oilseed milling
products
83 8.2% Fruits and tree nuts 250 8.1%
Computer equipment 47 4.6% Meat products and meat
packaging products
231 7.4%
Oilseed and grains 46 4.5% Nonferrous metal and
processing
191 6.2%
Agriculture and construction
machinery
33 3.3% Tobacco products 127 4.1%
Petroleum and coal products 29 2.9% Fish, fresh, chilled or frozen
and other marine products
92 3.0%
Communications equipment 27 2.7% Sugar and confectionary
products
41 1.3%
Other general purpose
machinery
26 2.6% Waste and scrap 31 1.0%
Motor vehicles 24 2.4% Goods returned 24 0.8%
Subtotal $532 52.5% Subtotal $2,970 95.7%
Source: United States International Trade Commission.
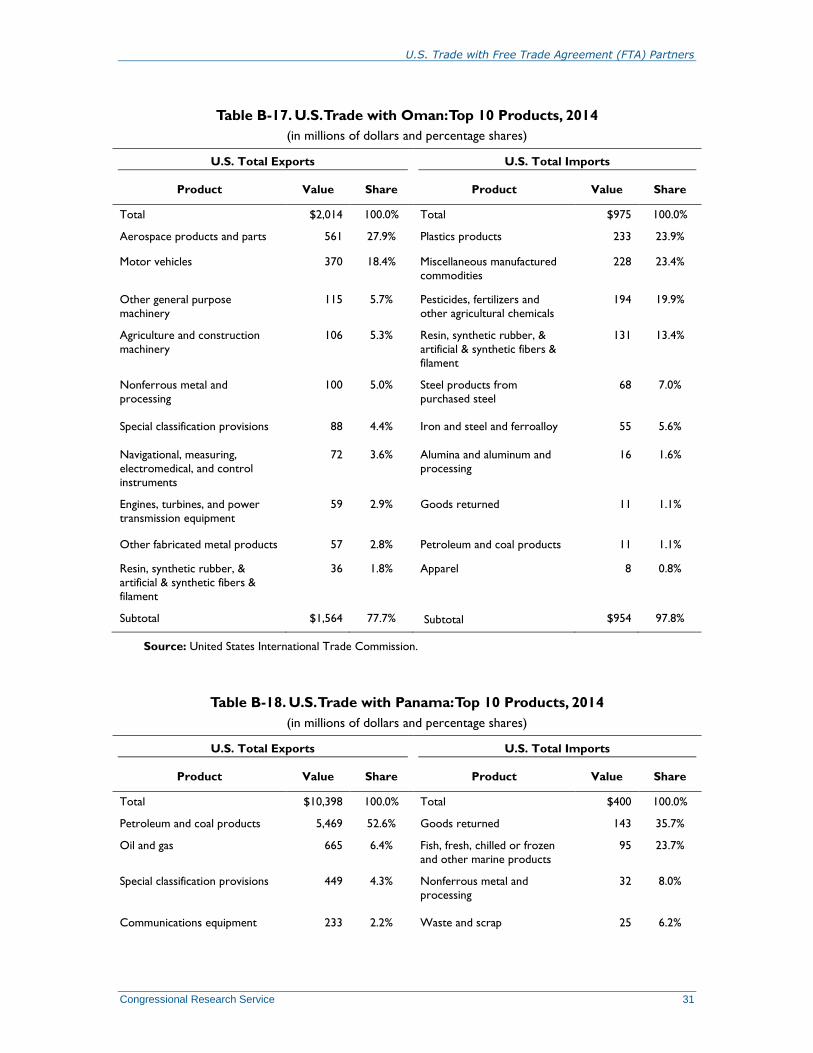
U.S. Trade with Free Trade Agreement (FTA) Partners
Congressional Research Service 31
Table B-17. U.S. Trade with Oman: Top 10 Products, 2014
(in millions of dollars and percentage shares)
U.S. Total Exports U.S. Total Imports
Product Value Share Product Value Share
Total $2,014 100.0% Total $975 100.0%
Aerospace products and parts 561 27.9% Plastics products 233 23.9%
Motor vehicles 370 18.4% Miscellaneous manufactured
commodities
228 23.4%
Other general purpose
machinery
115 5.7% Pesticides, fertilizers and
other agricultural chemicals
194 19.9%
Agriculture and construction
machinery
106 5.3% Resin, synthetic rubber, &
artificial & synthetic fibers &
filament
131 13.4%
Nonferrous metal and
processing
100 5.0% Steel products from
purchased steel
68 7.0%
Special classification provisions 88 4.4% Iron and steel and ferroalloy 55 5.6%
Navigational, measuring,
electromedical, and control
instruments
72 3.6% Alumina and aluminum and
processing
16 1.6%
Engines, turbines, and power
transmission equipment
59 2.9% Goods returned 11 1.1%
Other fabricated metal products 57 2.8% Petroleum and coal products 11 1.1%
Resin, synthetic rubber, &
artificial & synthetic fibers &
filament
36 1.8% Apparel 8 0.8%
Subtotal $1,564 77.7% Subtotal $954 97.8%
Source: United States International Trade Commission.
Table B-18. U.S. Trade with Panama: Top 10 Products, 2014
(in millions of dollars and percentage shares)
U.S. Total Exports U.S. Total Imports
Product Value Share Product Value Share
Total $10,398 100.0% Total $400 100.0%
Petroleum and coal products 5,469 52.6% Goods returned 143 35.7%
Oil and gas 665 6.4% Fish, fresh, chilled or frozen
and other marine products
95 23.7%
Special classification provisions 449 4.3% Nonferrous metal and
processing
32 8.0%
Communications equipment 233 2.2% Waste and scrap 25 6.2%

U.S. Trade with Free Trade Agreement (FTA) Partners
Congressional Research Service 32
U.S. Total Exports U.S. Total Imports
Product Value Share Product Value Share
Computer equipment 197 1.9% Fruit and tree nuts 15 3.7%
Soaps, cleaning compounds, and
toilet preparations
178 1.7% Sugar and confectionary
products
14 3.5%
Beverages 173 1.7% Petroleum and coal products 8 2.0%
Motor vehicles 172 1.7% Beverages 7 1.7%
Agriculture and construction
machinery
165 1.6% Special classification
provisions
7 1.7%
Iron and steel and ferroalloy 148 1.4% Foods 5 1.2%
Subtotal $7,849 75.5% Subtotal $352 87.9%
Source: United States International Trade Commission.
Table B-19. U.S. Trade with Peru: Top 10 Products, 2014
(in millions of dollars and percentage shares)
U.S. Total Exports U.S. Total Imports
Product Value Share Product Value Share
Total $10,070 100.0% Total $6,079 100.0%
Petroleum and coal products 2,738 27.2% Nonferrous metal and
processing
1,543 25.4%
Agriculture and construction
machinery
677 6.7% Petroleum and coal products 914 15.0%
Oilseeds and grains 659 6.5% Fruit and tree nuts 628 10.3%
Computer equipment 602 6.0% Apparel 609 10.0%
Resin, synthetic rubber, &
artificial & synthetic fibers &
filament
444 4.4% Oil and gas 365 6.0%
Basic chemicals 402 4.0% Vegetables and melons 338 5.6%
Communications equipment 392 3.9% Fruit and vegetable preserves
and specialty foods
308 5.1%
Other general purpose
machinery
343 3.4% Fish, fresh, chilled or frozen
and other marine products
276 4.5%
Special classification provisions 282 2.8% Nonmetallic minerals 120 2.0%
Engines, turbines, and power
transmission equipment
238 2.4% Metal ores 119 2.0%
Subtotal $6,777 67.3% Subtotal $5,221 85.9%
Source: United States International Trade Commission.
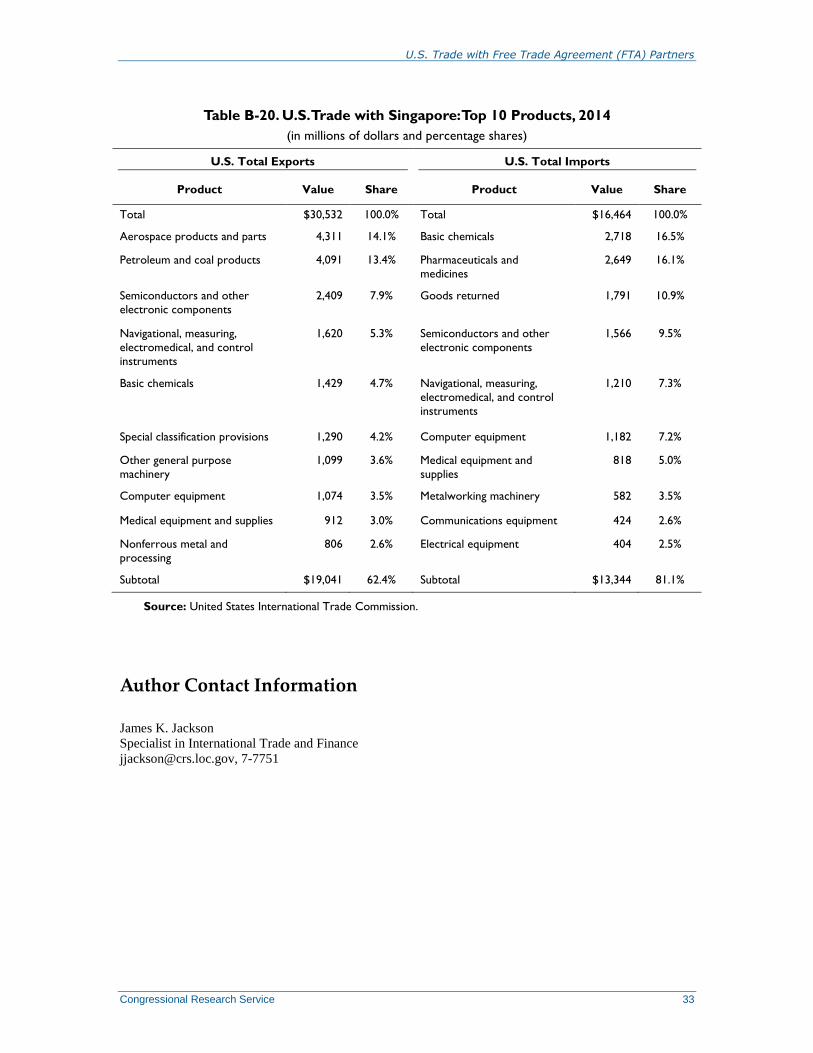
U.S. Trade with Free Trade Agreement (FTA) Partners
Congressional Research Service 33
Table B-20. U.S. Trade with Singapore: Top 10 Products, 2014
(in millions of dollars and percentage shares)
U.S. Total Exports U.S. Total Imports
Product Value Share Product Value Share
Total $30,532 100.0% Total $16,464 100.0%
Aerospace products and parts 4,311 14.1% Basic chemicals 2,718 16.5%
Petroleum and coal products 4,091 13.4% Pharmaceuticals and
medicines
2,649 16.1%
Semiconductors and other
electronic components
2,409 7.9% Goods returned 1,791 10.9%
Navigational, measuring,
electromedical, and control
instruments
1,620 5.3% Semiconductors and other
electronic components
1,566 9.5%
Basic chemicals 1,429 4.7% Navigational, measuring,
electromedical, and control
instruments
1,210 7.3%
Special classification provisions 1,290 4.2% Computer equipment 1,182 7.2%
Other general purpose
machinery
1,099 3.6% Medical equipment and
supplies
818 5.0%
Computer equipment 1,074 3.5% Metalworking machinery 582 3.5%
Medical equipment and supplies 912 3.0% Communications equipment 424 2.6%
Nonferrous metal and
processing
806 2.6% Electrical equipment 404 2.5%
Subtotal $19,041 62.4% Subtotal $13,344 81.1%
Source: United States International Trade Commission.
Author Contact Information
James K. Jackson
Specialist in International Trade and Finance
[email protected], 7-7751