Embed Size (px)
Citation preview

Executive Summary
T he U.S. solar energy industry grew to new heights in 2008 and many industry observers expect that growth to continue in 2009. Total capacity grew by 1,265 megawatts (MW)1 in 2008, up from 1,159 MW installed in 2007.2 This brings the total installed capacity up by 16 percent to 9,183 MW. Capacity in both
photovoltaic (PV) and solar water heating systems grew at record levels. And while no new concentrating solar power (CSP) plants were completed in 2008, projects totaling more than 6,000 MW are in the pipeline most with signed purchase power agreements. Solar pool heating capacity grew at a slower rate than in 2007, reflecting conditions in the residential real estate market.
The industry saw some of the most significant national solar policy victories ever in late 2008. The Emergency Economic Stabilization Act of 2008 (EESA), enacted on October 3, extended the 30-percent solar investment tax credit (ITC) for eight years, lifted the cap for residential PV installations, allowed application of the tax credits against the alternative minimum tax (AMT) and removed the prohibition against utilities’ use of the ITC. This long-term policy stability will help companies in the U.S. solar market make longer-term investment decisions and attract better financing. This will support solar energy’s crucial contributions to the shift to clean, renewable power. Many state and local governments also adopted innovative policies to speed the adoption of solar energy.
There were a few setbacks. The Bureau of Land Management announced a moratorium on applications for solar development on federal lands, which was repealed after an outcry from the industry and renewable energy advocates. The solar industry has not been immune to the global economic crisis. Many companies are encountering problems accessing sufficient credit; a few have announced significant layoffs. Several major institutional investors have decreased their involvement in renewables in response to global credit pressures.3
2008US Solar Industry Year in Review
1 A megawatt of solar electric capacity (PV and CSP) provides enough electricity to power between 150 and 250 homes. 2 All photovoltaic capacities are reported in megawatts-direct current (MWDC) unless stated otherwise. All concentrating solar power capacities are reported in megawatts-alternating current (MWAC). All thermal collectors (solar water heaters, solar pool heaters, etc.) are reported in megawatts-thermal (MWTh) converted using the standard adopted by the European Solar Thermal Industry Federation, 0.7 kilowatts per square meter.3 Hudson Clean Energy Partners, L.P., January 8, 2009. Report updated March 31, 2009. For additional information and a PDF of this report with clickable hyperlinks, visit www.SEIA.org.
2 Solar Energy Industries Association US Solar Industry Year in Review 2008 3
Despite these hurdles, the U.S. solar marketplace grew substantially in 2008 and is poised for continued advancements in 2009. With the easing of supply bottlenecks and the aggressive alternative-energy investments provided by 2008’s EESA and 2009’s American Recovery and Reinvestment Act, going solar will be increasingly attractive and affordable for families, businesses and utilities across the country.
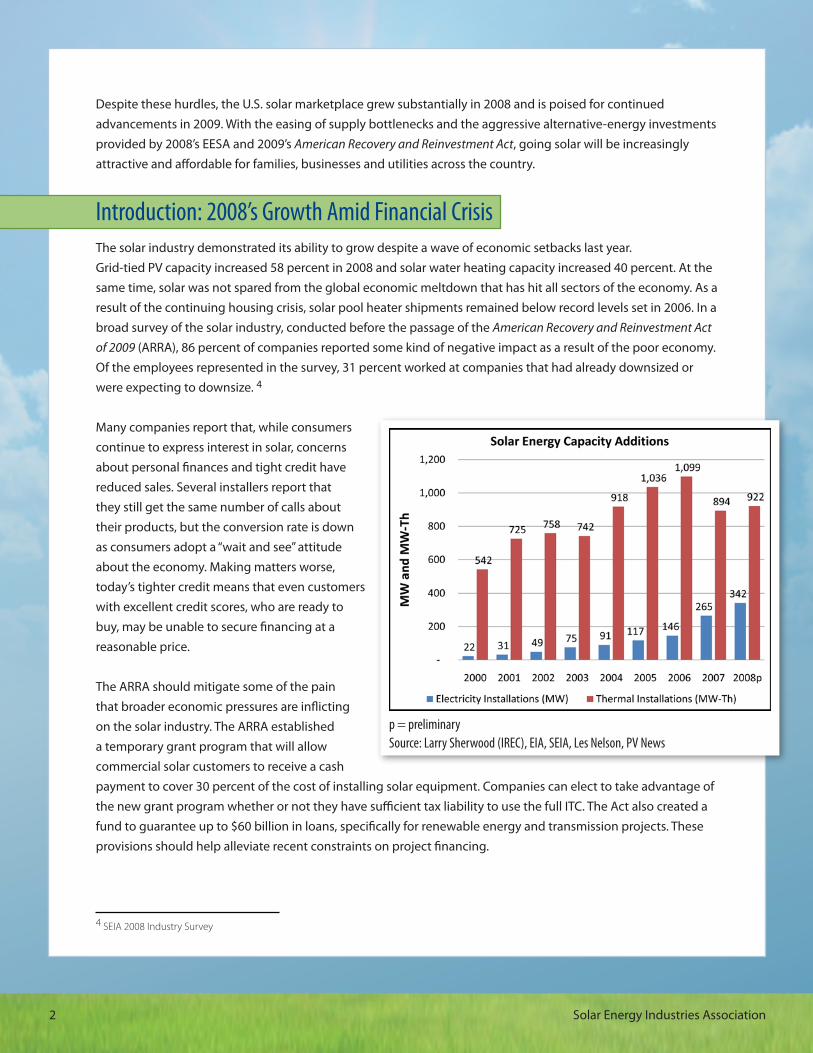
Introduction: 2008’s Growth Amid Financial CrisisThe solar industry demonstrated its ability to grow despite a wave of economic setbacks last year. Grid-tied PV capacity increased 58 percent in 2008 and solar water heating capacity increased 40 percent. At the same time, solar was not spared from the global economic meltdown that has hit all sectors of the economy. As a result of the continuing housing crisis, solar pool heater shipments remained below record levels set in 2006. In a broad survey of the solar industry, conducted before the passage of the American Recovery and Reinvestment Act of 2009 (ARRA), 86 percent of companies reported some kind of negative impact as a result of the poor economy. Of the employees represented in the survey, 31 percent worked at companies that had already downsized or were expecting to downsize. 4
Many companies report that, while consumers continue to express interest in solar, concerns about personal finances and tight credit have reduced sales. Several installers report that they still get the same number of calls about their products, but the conversion rate is down as consumers adopt a “wait and see” attitude about the economy. Making matters worse, today’s tighter credit means that even customers with excellent credit scores, who are ready to buy, may be unable to secure financing at a reasonable price.
The ARRA should mitigate some of the pain that broader economic pressures are inflicting on the solar industry. The ARRA established a temporary grant program that will allow commercial solar customers to receive a cash payment to cover 30 percent of the cost of installing solar equipment. Companies can elect to take advantage of the new grant program whether or not they have sufficient tax liability to use the full ITC. The Act also created a fund to guarantee up to $60 billion in loans, specifically for renewable energy and transmission projects. These provisions should help alleviate recent constraints on project financing.
4 SEIA 2008 Industry Survey
p = preliminarySource: Larry Sherwood (IREC), EIA, SEIA, Les Nelson, PV News

2 Solar Energy Industries Association US Solar Industry Year in Review 2008 3
Federal Solar Policy
Investment Tax Credit Extended and Improved On October 3rd, with only three months left until the most important solar policy in the U.S. was set to expire, Congress passed and the President signed The Emergency Economic Stabilization Act of 2008. The bill included an 8-year extension of the federal solar ITC, eliminated the prohibition on use of the ITC by utilities, removed the $2,000 cap on residential electric systems and allowed the credit to count against AMT. This long-term extension, combined with broadened incentives, provides the policy stability needed to permit the long-term planning and investment necessary for the U.S. industry to reach its full potential.
A Glimpse Ahead: the American Recovery and Reinvestment ActOn Feb. 17, 2009, President Obama toured a solar installation at the Denver Museum of Nature and Science, and was introduced by Blake Jones, founder and president of Namasté Solar, before signing the American Recovery and Reinvestment Act. This unprecedented economic stimulus package has many provisions designed to boost the green economy. It supports renewable energy technologies with billions in incentives, including, an estimated $5.5 billion for government procurement of energy efficiency and renewable energy projects.
In addition to establishing a temporary cash grant program as an optional substitute to the ITC, the ARRA lifted the $2,000 cap on residential solar water heating systems. This broadens market opportunities for the solar thermal industry. Other provisions include a 30-percent tax credit for renewable energy manufacturing facilities and a loan guarantee program for renewable energy projects. SEIA members can see additional details of the solar policies enacted as part of the ARRA at SEIA’s Web site.
State Round-Up From Hawaii to Massachusetts, states and cities made headlines with new solar policies in 2008.
CALIFORNIA In one of the most talked-about and innovative new solar policies of the year, the city of Berkeley established a program allowing city residents to finance solar installations through an assessment on their property taxes. This financing model allows home owners who choose to go solar to recover the cost of their system even if they need to sell their house in less than five years. California also became the first state to adopt a feed-in tariff (FiT) for solar-derived electricity used on water treatment plants.
A 6-kW PV system provides 85 percent of this Washington, D.C. home’s electricity. Courtesy: Standard Solar

4 Solar Energy Industries Association US Solar Industry Year in Review 2008 5
HAWAII The U.S. leader in solar water heating, Hawaii moved to raise the bar by requiring new residential construction to include solar water heaters by 2010. The ultimate effectiveness of this policy, and the ongoing demand for solar water heaters in the state, will depend on the treatment of a loophole that currently allows developers to comply with the mandate using synthetic gas or propane.
MARYLAND The Old Line State increased its Renewable Portfolio Standard (RPS) goals to 20 percent by 2022. The first solar carve-out step, or minimum requirement, under the state’s RPS became effective in 2008, putting the state on its way to obtaining 2 percent of its electricity from solar in 2022. The state also extended property tax exemptions for solar energy systems to commercial installations and exempted solar energy systems from sales and use taxes.
MASSACHUSETTS Lawmakers in the Commonwealth passed a host of solar policies, including loan and grant programs and an updated RPS. Most notable is the “Commonwealth Solar” rebate program, which offers $1.00 to $4.40 per watt for grid-tied systems. This program is expected to support the installation of 27 MW in solar capacity.
MISSOURI When voters in the Show Me State went to the polls in November, they showed the country they are serious about renewable energy and solar by passing an RPS calling for 15 percent of the state’s electricity to come from renewable sources by 2021. Of this amount, 13.3 percent, or 2 percent of the state’s total electricity consumption, must come from solar power by 2021.
OHIO The state legislature adopted an RPS with a solar carve-out, which is expected to result in 820 MW of solar capacity by 2024.
----------------------------------------------------------------------- For more on state and local incentives for solar and other renewable energies, visit the Database of State Incentives for Renewables and Efficiency managed by the North Carolina Solar Center at www.dsireusa.org.
Just outside Washington, D.C., Lakelands Park Middle School inMontgomery County hosts a 111-kW rooftop PV system, deployed under a solar PPA with SunEdison. Courtesy: SunEdison
Grid-Tied PV Capacity in the States (MW-dc)
State Installed in 2008 Cumulative
California* 178.6 530.1
New Jersey 22.5 70.2
Colorado 21.6 35.7
Nevada 14.9 34.2
Hawaii 11.3 15.8
New York 7.0 21.9
Arizona 6.4 25.3
Connecticut 5.3 8.8
Oregon 4.7 7.5
North Carolina 4.0 4.7
Others 15.3 36.4
TOTAL 292 791
Source: Larry Sherwood (IREC)
* This figure differs from the figure issued by the California Public Utilities Commission because CPUC reports capacity under PVUSA Test Conditions (PTC) ratings and we report capacity under Standard Test Conditions (STC) ratings.
4 Solar Energy Industries Association US Solar Industry Year in Review 2008 5
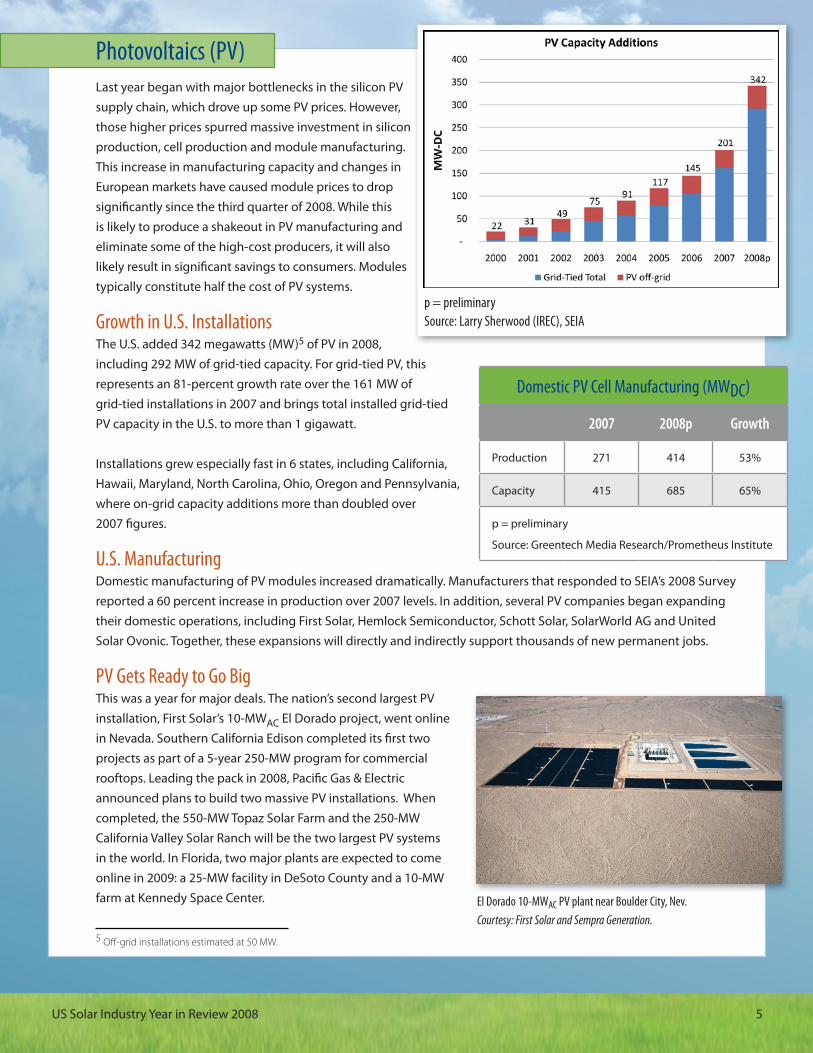
Photovoltaics (PV)Last year began with major bottlenecks in the silicon PV supply chain, which drove up some PV prices. However, those higher prices spurred massive investment in silicon production, cell production and module manufacturing. This increase in manufacturing capacity and changes in European markets have caused module prices to drop significantly since the third quarter of 2008. While this is likely to produce a shakeout in PV manufacturing and eliminate some of the high-cost producers, it will also likely result in significant savings to consumers. Modules typically constitute half the cost of PV systems.
Growth in U.S. InstallationsThe U.S. added 342 megawatts (MW)5 of PV in 2008, including 292 MW of grid-tied capacity. For grid-tied PV, this represents an 81-percent growth rate over the 161 MW of grid-tied installations in 2007 and brings total installed grid-tied PV capacity in the U.S. to more than 1 gigawatt.
Installations grew especially fast in 6 states, including California, Hawaii, Maryland, North Carolina, Ohio, Oregon and Pennsylvania, where on-grid capacity additions more than doubled over 2007 figures.
U.S. ManufacturingDomestic manufacturing of PV modules increased dramatically. Manufacturers that responded to SEIA’s 2008 Survey reported a 60 percent increase in production over 2007 levels. In addition, several PV companies began expanding their domestic operations, including First Solar, Hemlock Semiconductor, Schott Solar, SolarWorld AG and United Solar Ovonic. Together, these expansions will directly and indirectly support thousands of new permanent jobs.
PV Gets Ready to Go BigThis was a year for major deals. The nation’s second largest PV installation, First Solar’s 10-MWAC El Dorado project, went online in Nevada. Southern California Edison completed its first two projects as part of a 5-year 250-MW program for commercial rooftops. Leading the pack in 2008, Pacific Gas & Electric announced plans to build two massive PV installations. When completed, the 550-MW Topaz Solar Farm and the 250-MW California Valley Solar Ranch will be the two largest PV systems in the world. In Florida, two major plants are expected to come online in 2009: a 25-MW facility in DeSoto County and a 10-MW farm at Kennedy Space Center.
Domestic PV Cell Manufacturing (MWDC)
2007 2008p Growth
Production 271 414 53%
Capacity 415 685 65%
p = preliminary
Source: Greentech Media Research/Prometheus Institute
El Dorado 10-MWAC PV plant near Boulder City, Nev. Courtesy: First Solar and Sempra Generation.
5 Off-grid installations estimated at 50 MW.
p = preliminarySource: Larry Sherwood (IREC), SEIA

6 Solar Energy Industries Association US Solar Industry Year in Review 2008 7
Concentrating Solar PowerNew technology developments, demonstration plants and commercialized storage technologies in 2008 paved the way for Concentrating Solar Power (CSP) development to break out over the next few years.
In December, Florida Power & Light Energy Resources (formerly FPL Energy) began construction of the first U.S. CSP facility outside the Southwest. This parabolic trough plant will supply 75 MW of power to augment the electricity produced at a natural gas plant in Martin County, Florida. Once this plant is completed, the U.S. will have 494 MW of CSP, up from the current 419 MW.
Technology DevelopmentsTwo companies began operating test facilities in the U.S. in 2008. Ausra completed a 5-MW demonstration plant in Bakersfield, Calif., as a precursor to the 177-MW linear Fresnel plant the company agreed to construct for Pacific Gas & Electric. In addition, SkyFuel premiered and began testing its SkyTrough technology at the National Renewable Energy Laboratory in Golden, Colorado.
The world’s first CSP plant with thermal storage – which allows the plant to continue producing electricity even after the sun goes down – was installed in the province of Granada in Spain. The 50-MW Andasol 1 went online in November and is capable of producing electricity for more than 7 hours without sunlight.
TransmissionEfforts to increase transmission capacity for renewable energy resources are moving forward in the West with California’s Renewable Energy Transmission Initiative (RETI) and the Western Governors’ Association’s Western Renewable Energy Zone Initiative. While no new transmission lines have been built yet as a result of these initiatives, the collaborative planning process appears hopeful.
Land AccessAs dozens of CSP plants move closer to commercialization, land access issues become more important. While many of the planned projects will be developed on privately owned land, some of the nation’s best solar resources are on public property. In 2008, the Bureau of Land Management (BLM), which manages much of the public land being considered for solar development, began conducting a Programmatic Environmental Impact Statement study (PEIS) for solar installations on its land. While this 2-year study is expected to expedite application processing in the future, it is not expected to be finalized until 2010.

6 Solar Energy Industries Association US Solar Industry Year in Review 2008 7
Concentrating Solar Power Installations
Project Developer and Project Name Technology Capacity (MW)
OPERATIONAL
Acciona - Nevada Solar One Trough 64
Solargenix - Saguaro Solar Power Plant Trough 1
Solel SEGS Plants - 9 Plants in California Trough 354
TOTAL OPERATIONAL 419
UNDER DEVELOPMENT
Abengoa Solar - Solana plant Trough 280
Ausra - Carrizo Energy Solar Farm Linear Fresnel 177
BrightSource Energy - Ivanpah Tower 300
BrightSource Energy - Ivanpah Tower 100
BrightSource Energy - Other projects Tower 1,200
Emcore/SunPeak Power - Southwestern U.S. Lens CPV 200
eSolar - Gaskell Sun Tower (Phase I) Tower 105
eSolar - Gaskell Sun Tower (Phase II) Tower 140
FPL - Martin Next Generation Solar Energy Center Trough 75
GreenVolts, Inc. - GV1 CPV 2
Harper Lake, LLC - Harper Lake Solar Plant Trough 250
Inland Energy, Inc. - Palmdale Hybrid Gas-Solar plant Trough 50
Inland Energy, Inc. - Victorville Hybrid Gas-Solar plant Trough 50
NextEra Energy Resources - Beacon Solar Energy Project Trough 250
San Joaquin Solar, LLC - San Juaquin Solar 1 Trough 53
San Joaquin Solar, LLC - San Juaquin Solar 2 Trough 53
Solel - Mojave Solar Park Trough 553
Sopogy - Keahole Solar Power MicroCSP 1
Solar Millennium – Nye County project 1 Trough 250
Solar Millennium – Nye County project 2 Trough 250
Stirling Energy Systems - SES Solar One Dish-engine 500
Stirling Energy Systems - SES Solar One Expansion Dish-engine 350
Stirling Energy Systems - SES Solar Two Dish-engine 300
Stirling Energy Systems - SES Solar Two Expansion Dish-engine 600
Source: SEIA and Morse Associates For the most current list of major projects, including PV projects, click here.

8 Solar Energy Industries Association US Solar Industry Year in Review 2008 9
Meanwhile, the list of pending applications for solar development on BLM lands has now grown to more than 200 projects, each of which will be processed individually. Fortunately, the ARRA provided additional funding for the BLM, some of which will be used to speed up the processing of these applications – so the backlog might not be as long as initially feared.
Solar ThermalSolar thermal continues to be one of the easiest ways to go solar. There were an estimated 139 megawatts thermal-equivalent ( MWTh) of solar water heating system shipments in 2008, a 50-percent increase over 2007. Solar pool heater shipments were 762 MWTh in 2008, 3 percent lower than 2007 shipments, reflecting the ongoing troubles in the housing market.
The investment tax credit for solar water heating systems was extended to 2016 in October 2008; a $2,000 cap remained in place until the passage of the ARRA in February 2009. The uncapped residential ITC for residential solar water heating is expected to expand the market for SWH by making systems more affordable everywhere and by making larger, more complex heating systems more economical in colder climates.
Water HeatingSWH installations continued to grow in 2008 with an estimated 20,500 systems installed. Total capacity has reached an estimated 485 MWTh. Hawaii continues to dominate the U.S. market due to high energy prices and abundant sunlight. However, the U.S. lags behind other countries such as China, where 1 in 10 households has a SWH system.6
With more than 80 million detached single-family homes in the U.S., each of which needs heated water, the market for SWH is substantial, particularly given its affordability. The U.S. Department of Energy (DOE) has set a goal of designing a “zero-energy home,” which would produce as much energy as it uses, by the year 2020. Recognizing that SWH is a crucial element in this effort, DOE decided recently to make
Solar water heating system installed by groSolar on Fenway Park provides one third of the stadium’s hot water.Courtesy: Boston Red Sox
6 Li, Ling, “China to Push Use of Solar Water Heaters” Worldwatch Institute, 5/8/07
p = preliminarySource: Les Nelson (Western Renewables Group), EIA and SEIA
8 Solar Energy Industries Association US Solar Industry Year in Review 2008 9
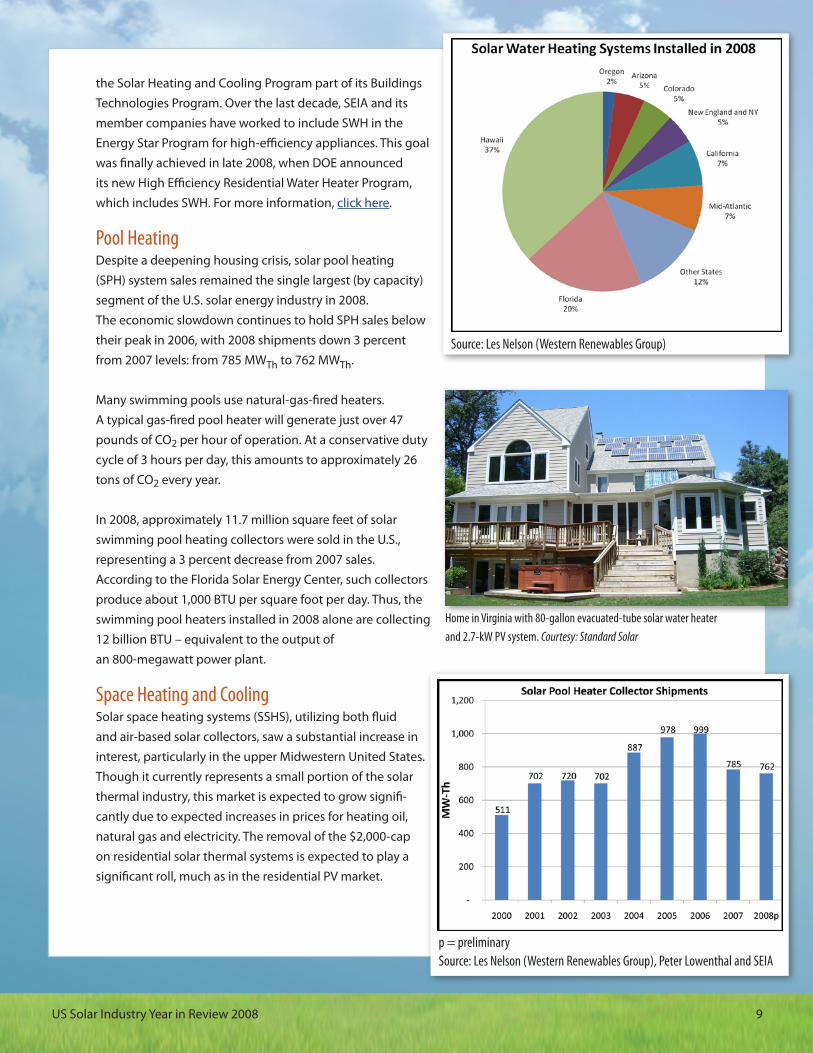
the Solar Heating and Cooling Program part of its Buildings Technologies Program. Over the last decade, SEIA and its member companies have worked to include SWH in the Energy Star Program for high-efficiency appliances. This goal was finally achieved in late 2008, when DOE announced its new High Efficiency Residential Water Heater Program, which includes SWH. For more information, click here.
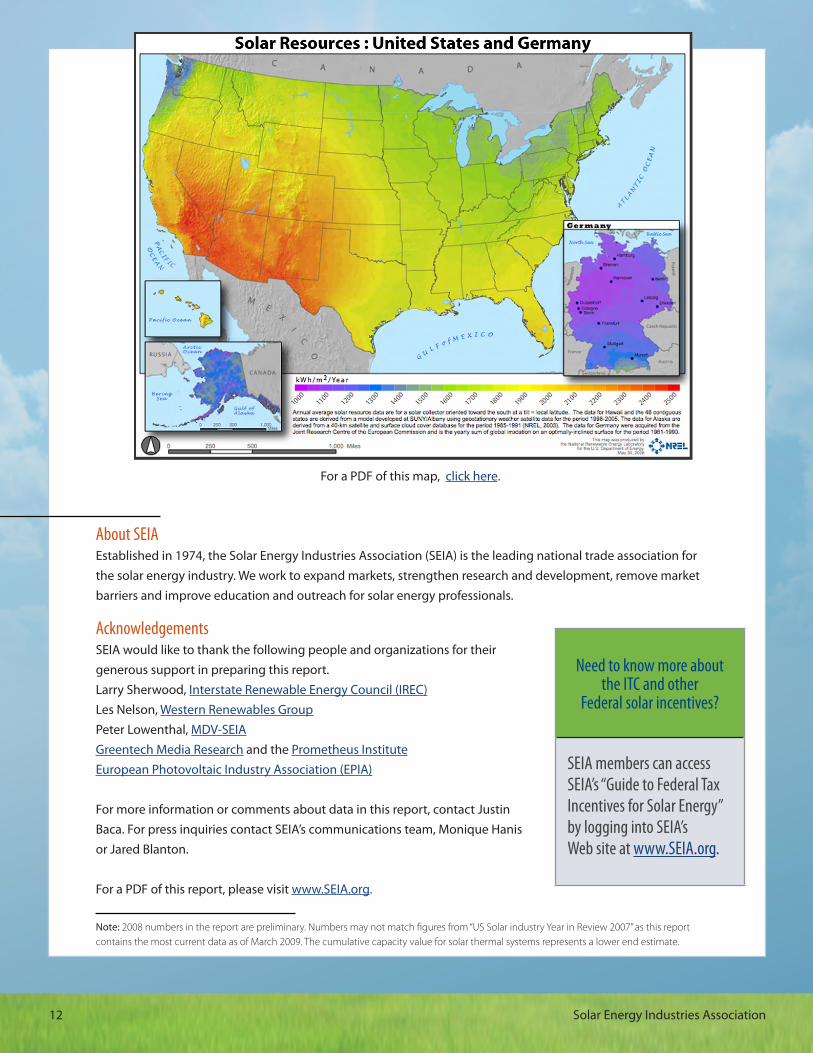
Pool HeatingDespite a deepening housing crisis, solar pool heating (SPH) system sales remained the single largest (by capacity) segment of the U.S. solar energy industry in 2008.The economic slowdown continues to hold SPH sales below their peak in 2006, with 2008 shipments down 3 percent from 2007 levels: from 785 MWTh to 762 MWTh.
Many swimming pools use natural-gas-fired heaters. A typical gas-fired pool heater will generate just over 47 pounds of CO2 per hour of operation. At a conservative duty cycle of 3 hours per day, this amounts to approximately 26 tons of CO2 every year.
In 2008, approximately 11.7 million square feet of solar swimming pool heating collectors were sold in the U.S., representing a 3 percent decrease from 2007 sales. According to the Florida Solar Energy Center, such collectors produce about 1,000 BTU per square foot per day. Thus, the swimming pool heaters installed in 2008 alone are collecting 12 billion BTU – equivalent to the output ofan 800-megawatt power plant.
Space Heating and CoolingSolar space heating systems (SSHS), utilizing both fluid and air-based solar collectors, saw a substantial increase in interest, particularly in the upper Midwestern United States. Though it currently represents a small portion of the solar thermal industry, this market is expected to grow signifi-cantly due to expected increases in prices for heating oil, natural gas and electricity. The removal of the $2,000-cap on residential solar thermal systems is expected to play a significant roll, much as in the residential PV market.
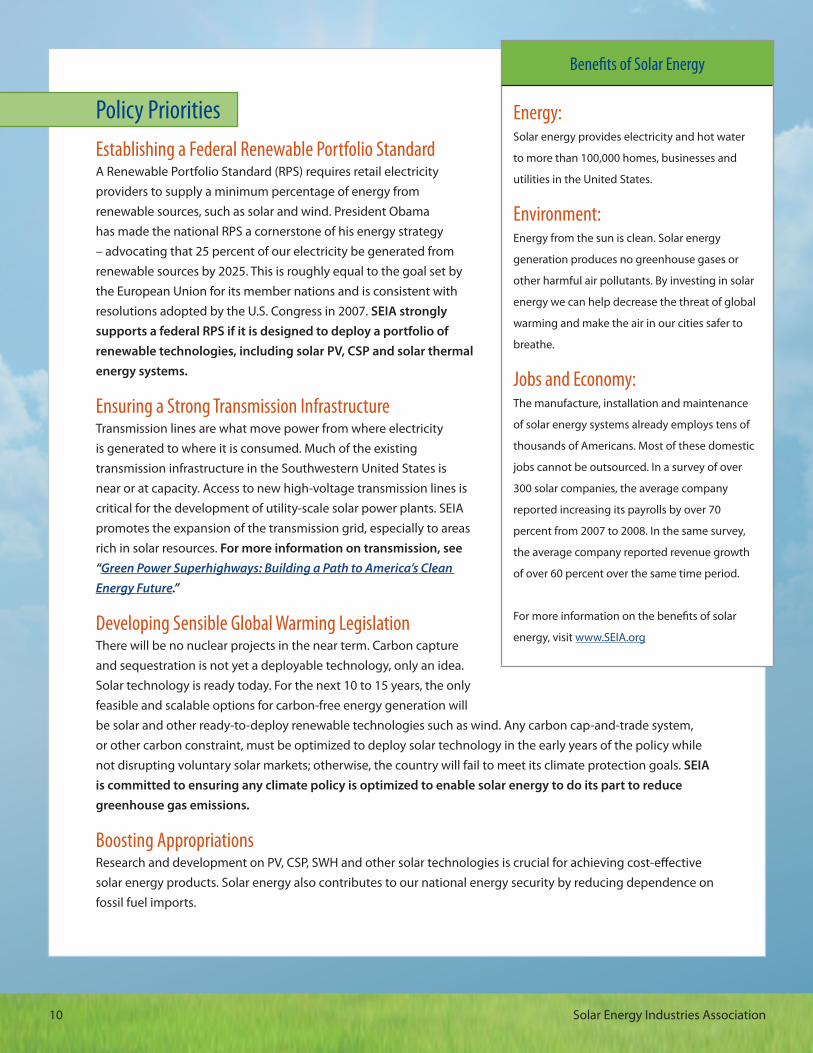
Home in Virginia with 80-gallon evacuated-tube solar water heaterand 2.7-kW PV system. Courtesy: Standard Solar
Source: Les Nelson (Western Renewables Group)
p = preliminarySource: Les Nelson (Western Renewables Group), Peter Lowenthal and SEIA
10 Solar Energy Industries Association US Solar Industry Year in Review 2008 11
Policy PrioritiesEstablishing a Federal Renewable Portfolio StandardA Renewable Portfolio Standard (RPS) requires retail electricity providers to supply a minimum percentage of energy from renewable sources, such as solar and wind. President Obama has made the national RPS a cornerstone of his energy strategy – advocating that 25 percent of our electricity be generated from renewable sources by 2025. This is roughly equal to the goal set by the European Union for its member nations and is consistent with resolutions adopted by the U.S. Congress in 2007. SEIA strongly supports a federal RPS if it is designed to deploy a portfolio of renewable technologies, including solar PV, CSP and solar thermal energy systems.
Ensuring a Strong Transmission InfrastructureTransmission lines are what move power from where electricity is generated to where it is consumed. Much of the existing transmission infrastructure in the Southwestern United States is near or at capacity. Access to new high-voltage transmission lines is critical for the development of utility-scale solar power plants. SEIA promotes the expansion of the transmission grid, especially to areas rich in solar resources. For more information on transmission, see “Green Power Superhighways: Building a Path to America’s Clean Energy Future.”
Developing Sensible Global Warming LegislationThere will be no nuclear projects in the near term. Carbon capture and sequestration is not yet a deployable technology, only an idea. Solar technology is ready today. For the next 10 to 15 years, the only feasible and scalable options for carbon-free energy generation will be solar and other ready-to-deploy renewable technologies such as wind. Any carbon cap-and-trade system, or other carbon constraint, must be optimized to deploy solar technology in the early years of the policy while not disrupting voluntary solar markets; otherwise, the country will fail to meet its climate protection goals. SEIA is committed to ensuring any climate policy is optimized to enable solar energy to do its part to reduce greenhouse gas emissions.
Boosting AppropriationsResearch and development on PV, CSP, SWH and other solar technologies is crucial for achieving cost-effective solar energy products. Solar energy also contributes to our national energy security by reducing dependence on fossil fuel imports.
Benefits of Solar Energy
Energy:Solar energy provides electricity and hot water
to more than 100,000 homes, businesses and
utilities in the United States.
Environment:Energy from the sun is clean. Solar energy
generation produces no greenhouse gases or
other harmful air pollutants. By investing in solar
energy we can help decrease the threat of global
warming and make the air in our cities safer to
breathe.
Jobs and Economy:The manufacture, installation and maintenance
of solar energy systems already employs tens of
thousands of Americans. Most of these domestic
jobs cannot be outsourced. In a survey of over
300 solar companies, the average company
reported increasing its payrolls by over 70
percent from 2007 to 2008. In the same survey,
the average company reported revenue growth
of over 60 percent over the same time period.
For more information on the benefits of solar
energy, visit www.SEIA.org

10 Solar Energy Industries Association US Solar Industry Year in Review 2008 11
SEIA supports expansion of the Department of Energy’s Solar Energy Technologies Program and the solar water heating work under the Building Technologies Program, and works to secure more funding for the department through the Congressional Appropriations process.
International Round-Up of Policy and Market Events in 2008The U.S. overtook Japan in 2008, becoming the third largest installer of PV solar energy worldwide; but it continues to lag behind Europe. China and Germany continue to be the largest markets for solar water heaters. Though no new domestic CSP plants went online in 2008, the U.S. continues to host the majority of the world’s CSP capacity. Two major adjustments in Europe are expected to affect the global market for solar energy. Germany reached a step point in its feed-in tariff and reduced the amount of the solar tariff by 10 percent, slightly more than expected, to 34.2-48.8 euro cents per kilowatt-hour. Spain implemented a cap on its feed-in tariff program, restricting incentive-eligible solar installations to 500 MW in 2009, a massive drop in the size of this major market. To compound that problem, it appears that many of the systems installed in 2008 may count towards the 500-MW cap for 2009.
Declining incentives in Europe, increased supply worldwide, and the slump in the global economy are expected to depress solar product prices in 2009, potentially making solar more affordable in the United States.
Total Installed US Solar CapacityAs of the end of 2008, the U.S. had a total of 9,183 MW of solar energy capacity. This includes 1,547 MW of electric capacity (PV and CSP) and 7,636 MW of thermal capacity (water heating, pool heating, and space heating).
Solar Electricity New Capacity and Total Capacity in 2008
Country New Capacity in 2008
Cumulative Capacity
Spain 2,281 MW 2,973 MW
Germany 1,500 MW 5,308 MW
United States 342 MW 1,547 MW
Japan 235 MW (est.) 2,173 MW
Italy 150-200 MW(est.) 321 MW
France 105 MW 175 MW
Sources: IREC, EPIA, CNE, PV News, SEIA
Includes PV and CSP
Source: Larry Sherwood (IREC), EIA, SEIA, Les Nelson, PV News
12 Solar Energy Industries Association
About SEIAEstablished in 1974, the Solar Energy Industries Association (SEIA) is the leading national trade association for the solar energy industry. We work to expand markets, strengthen research and development, remove market barriers and improve education and outreach for solar energy professionals.
AcknowledgementsSEIA would like to thank the following people and organizations for their generous support in preparing this report. Larry Sherwood, Interstate Renewable Energy Council (IREC)Les Nelson, Western Renewables GroupPeter Lowenthal, MDV-SEIAGreentech Media Research and the Prometheus InstituteEuropean Photovoltaic Industry Association (EPIA)
For more information or comments about data in this report, contact Justin Baca. For press inquiries contact SEIA’s communications team, Monique Hanis or Jared Blanton. For a PDF of this report, please visit www.SEIA.org.
For a PDF of this map, click here.
Note: 2008 numbers in the report are preliminary. Numbers may not match figures from “US Solar industry Year in Review 2007” as this report contains the most current data as of March 2009. The cumulative capacity value for solar thermal systems represents a lower end estimate.
Need to know more aboutthe ITC and other
Federal solar incentives?
SEIA members can access SEIA’s “Guide to Federal Tax Incentives for Solar Energy” by logging into SEIA’s Web site at www.SEIA.org.