Embed Size (px)
Citation preview
US Renewable Energy Markets: Financial
Perspective
ByMichael D. Ware
Advance Capital Markets, Inc.Washington Council of Governments
Washington, DCJune 22, 2005
2
“The way we produce and consume energy hasn’t
changed much in decades.”
Business Week
October 11, 2004
3
Overview
• Financial Markets for RE are Driven by Key Factors
•Economic•Financial•Political
• Review of RE in the U.S.• Potential Local Applications
4
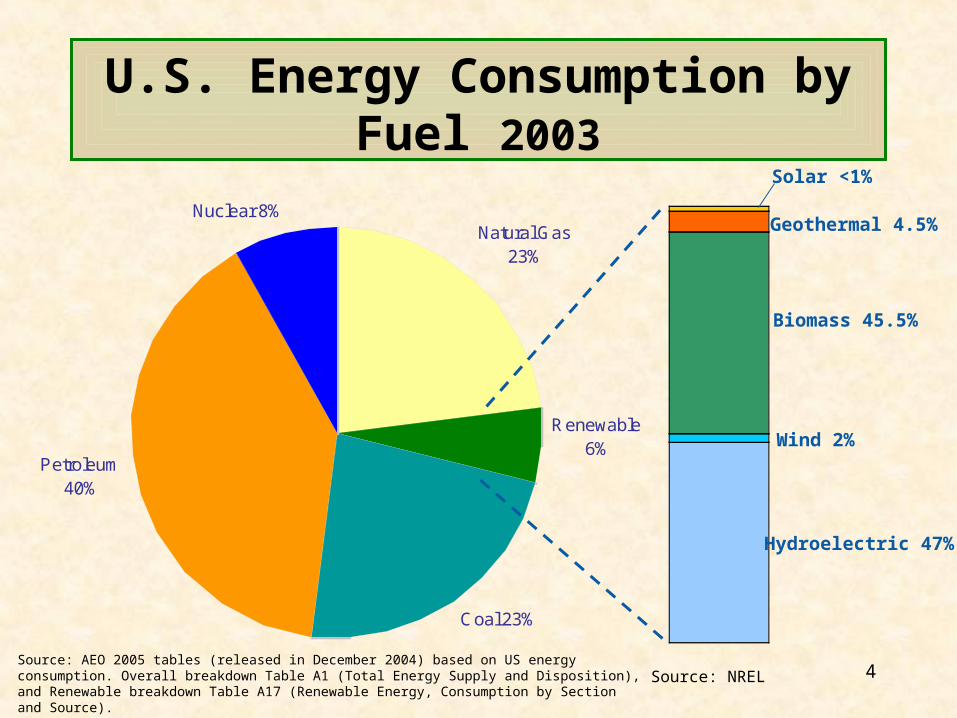
U.S. Energy Consumption by Fuel 2003
Source: NREL
Coal 23%
Petroleum 40%
Renewable 6%
Natural Gas 23%
Nuclear 8%
Wind 2%
Biomass 45.5%
Hydroelectric 47%
Geothermal 4.5%
Solar <1%
Source: AEO 2005 tables (released in December 2004) based on US energy consumption. Overall breakdown Table A1 (Total Energy Supply and Disposition), and Renewable breakdown Table A17 (Renewable Energy, Consumption by Section and Source).
5
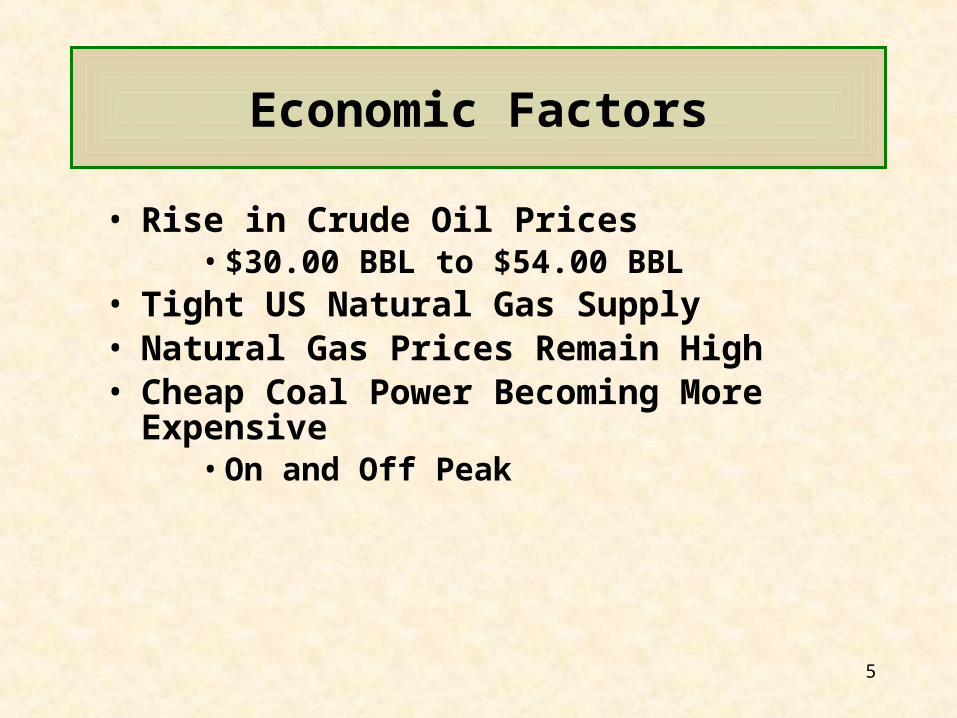
Economic Factors
• Rise in Crude Oil Prices•$30.00 BBL to $54.00 BBL
• Tight US Natural Gas Supply• Natural Gas Prices Remain High• Cheap Coal Power Becoming More
Expensive•On and Off Peak
6
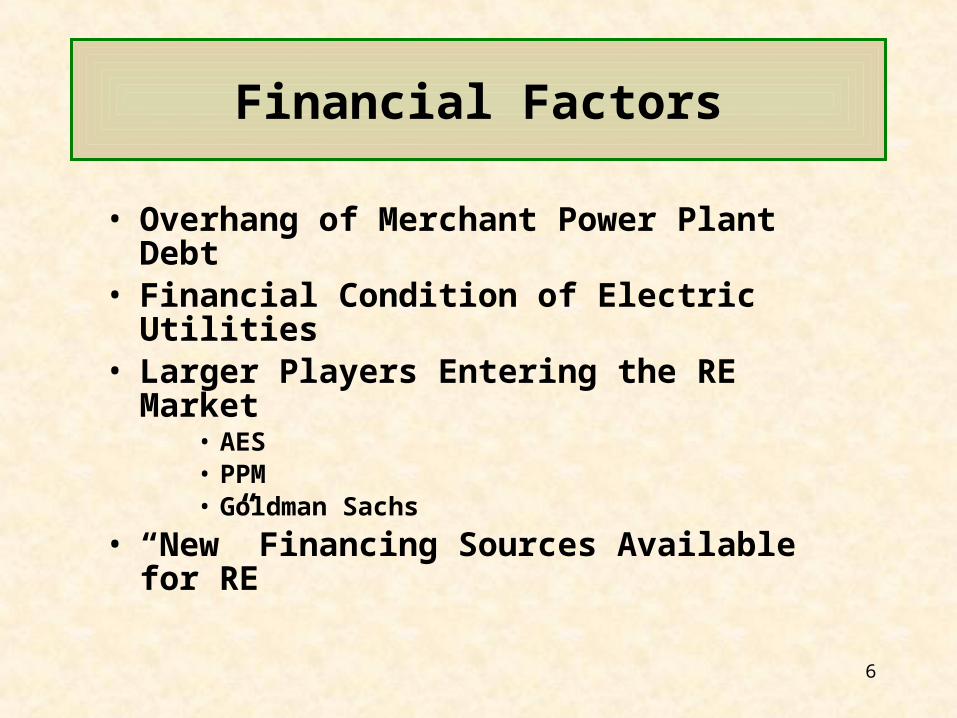
Financial Factors
• Overhang of Merchant Power Plant Debt
• Financial Condition of Electric Utilities
• Larger Players Entering the RE Market
• AES• PPM• Goldman Sachs
• “New” Financing Sources Available for RE
7
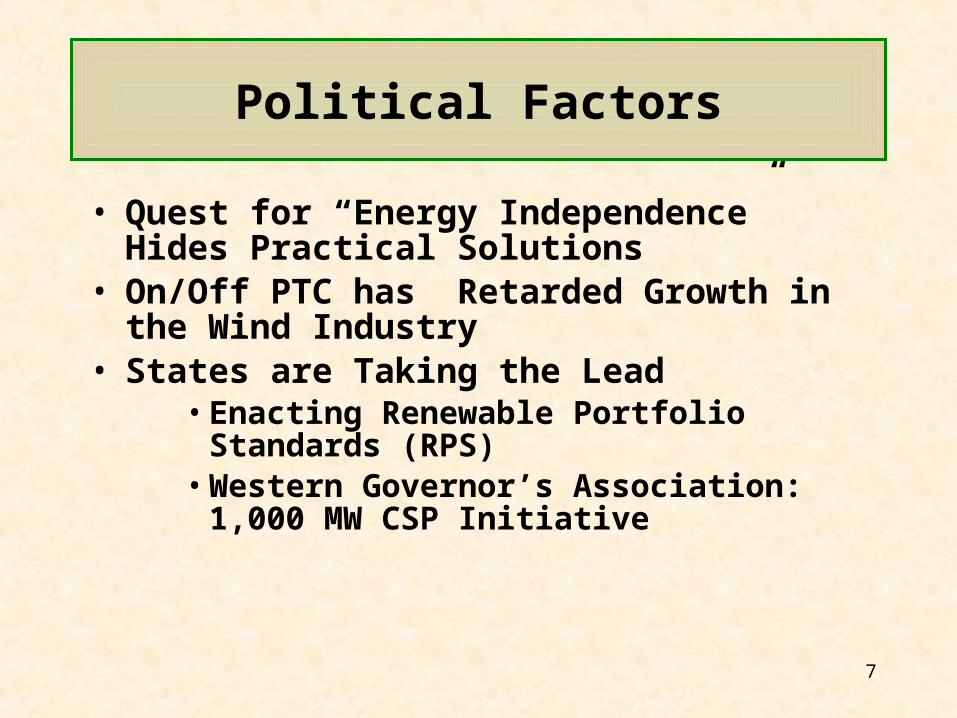
• Quest for “Energy Independence” Hides Practical Solutions
• On/Off PTC has Retarded Growth in the Wind Industry
• States are Taking the Lead•Enacting Renewable Portfolio
Standards (RPS)•Western Governor’s Association:
1,000 MW CSP Initiative
Political Factors
8
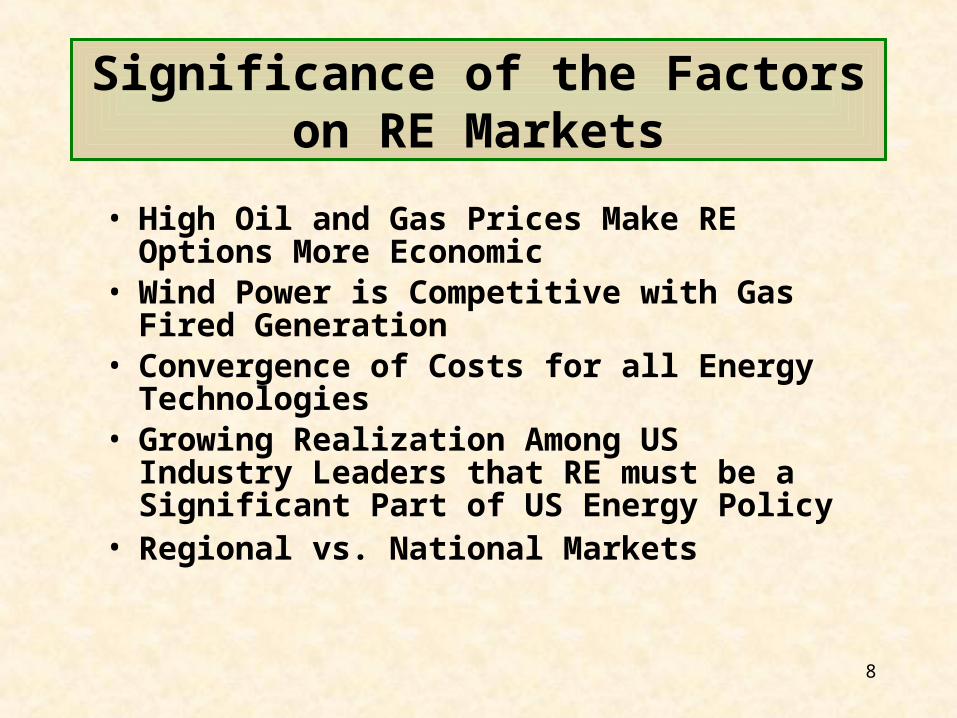
Significance of the Factors on RE Markets
• High Oil and Gas Prices Make RE Options More Economic
• Wind Power is Competitive with Gas Fired Generation
• Convergence of Costs for all Energy Technologies
• Growing Realization Among US Industry Leaders that RE must be a Significant Part of US Energy Policy
• Regional vs. National Markets

9
Review of RE in the US
10
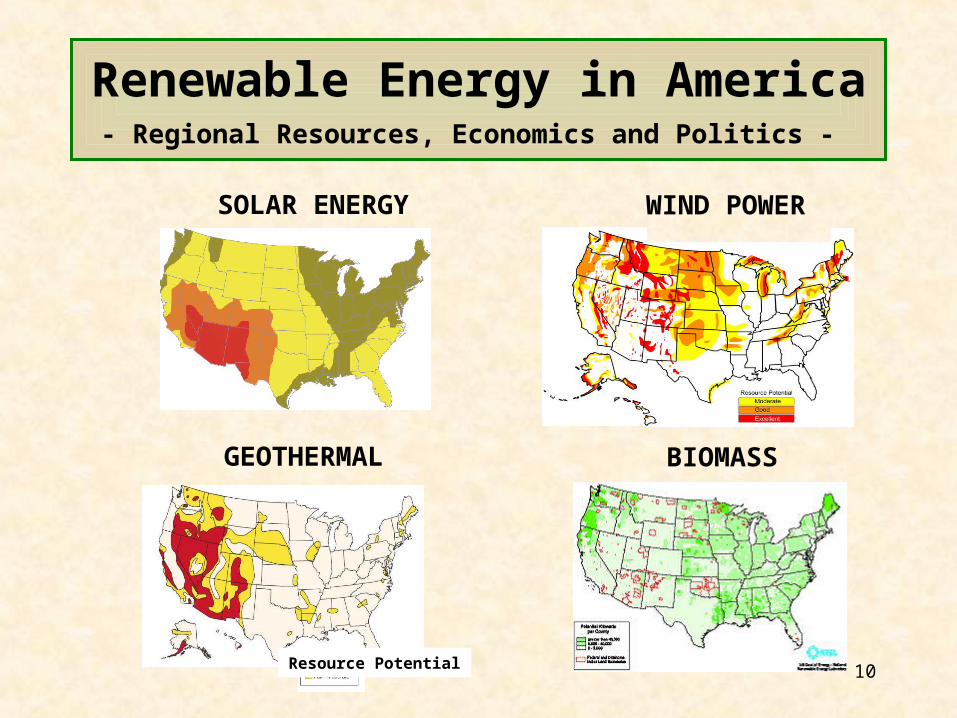
Renewable Energy in America
- Regional Resources, Economics and Politics -
Resource Potential
SOLAR ENERGY WIND POWER
GEOTHERMAL BIOMASS
11
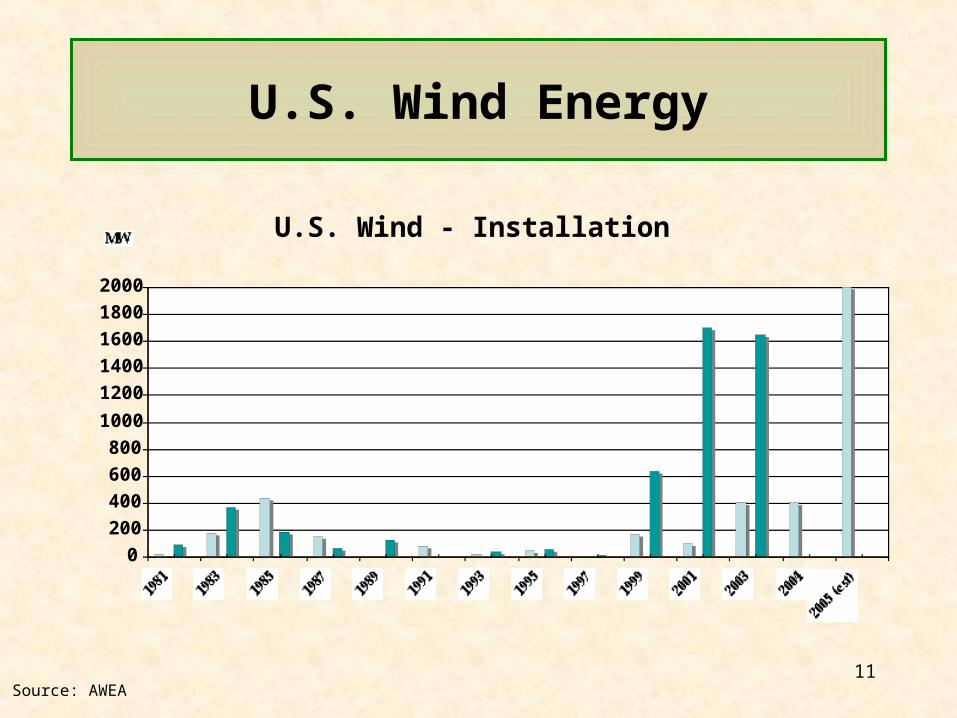
U.S. Wind Energy
U.S. Wind - Installation by Year
0200400600800
1000
12001400160018002000
1981 1983 1985 1987 1989 1991 1993 1995 1997 1999 2001 2003 2004
2005 (est)
MW
Source: AWEA
12
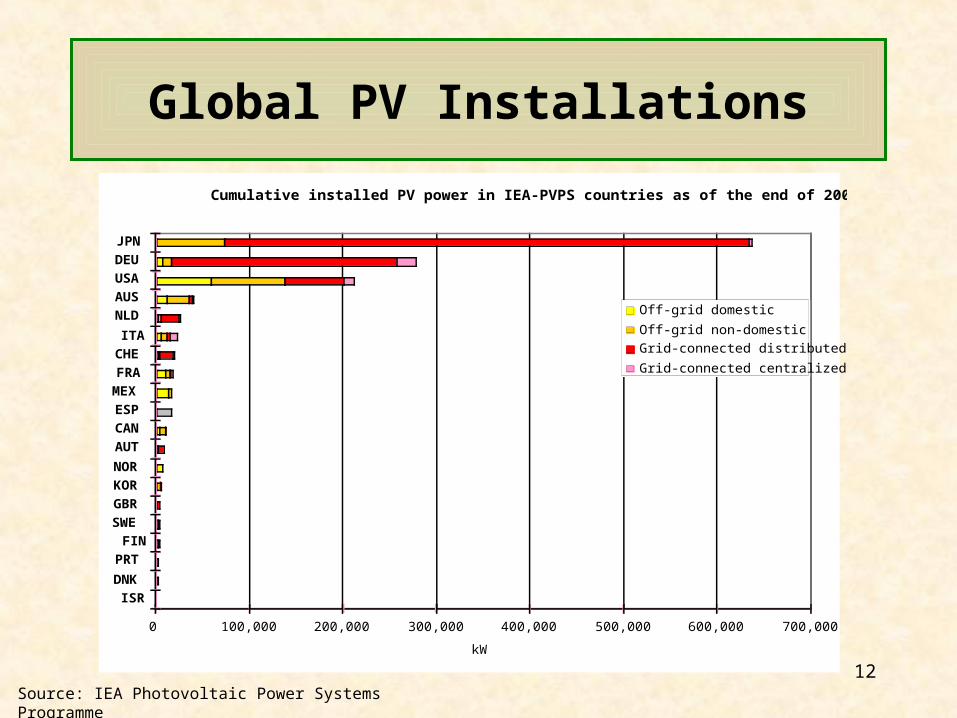
Global PV Installations
Cumulative installed PV power in IEA-PVPS countries as of the end of 2002
0 100,000 200,000 300,000 400,000 500,000 600,000 700,000
ISR
DNK
PRT
FIN
SWE
GBR
KOR
NOR
AUT
CAN
ESP
MEX
FRA
CHE
ITA
NLD
AUS
USA
DEU
JPN
kW
Off-grid domestic
Off-grid non-domestic
Grid-connected distributed
Grid-connected centralized
Source: IEA Photovoltaic Power Systems Programme
13
U.S. Geothermal Energy
Source: Geothermal Energy Association
14
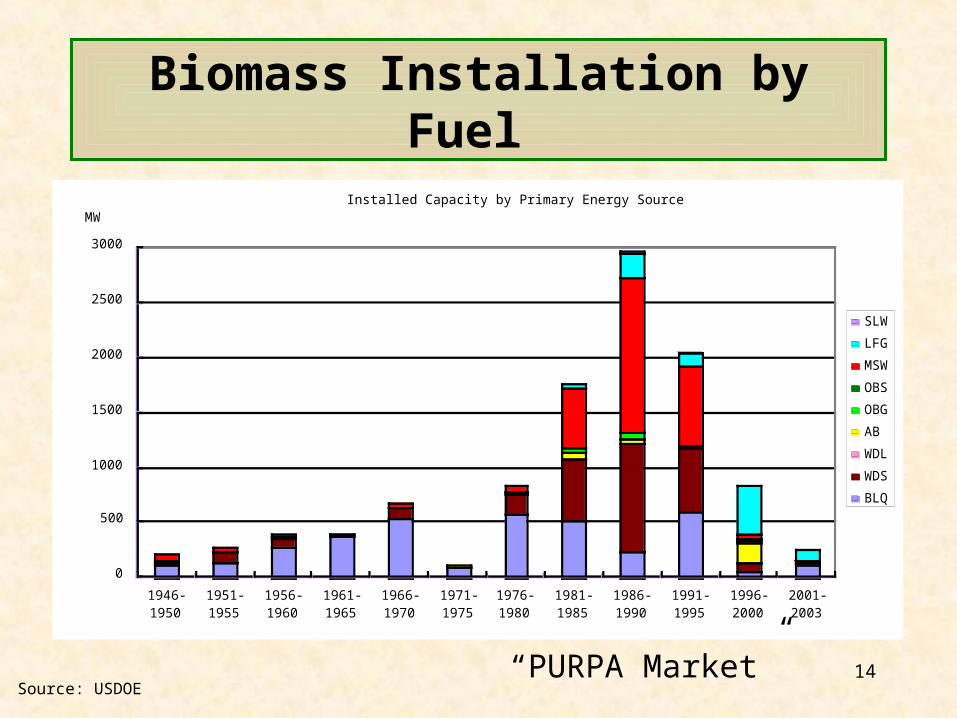
Biomass Installation by Fuel
Source: USDOE
Installed Capacity by Primary Energy Source
0
500
1000
1500
2000
2500
3000
1946-1950
1951-1955
1956-1960
1961-1965
1966-1970
1971-1975
1976-1980
1981-1985
1986-1990
1991-1995
1996-2000
2001-2003
MW
SLW
LFG
MSW
OBS
OBG
AB
WDL
WDS
BLQ
“PURPA Market”
15
Fuel Ethanol Production
Source: Renewable Fuel Association
16
Key Trends in Financial Markets
• More VC Firms Investing in RE Technology
• Private Equity Investments in Solar and Wind
• Equity Investors Driven by Tax Credits for Wind and CSP
• New Investors in Renewable Fuels• Increasing Interest in Hybrid and Off -
Grid Applications• States and Local Governments making
Funds Available for RE• E.g. Mass Renewable Energy Trust
17
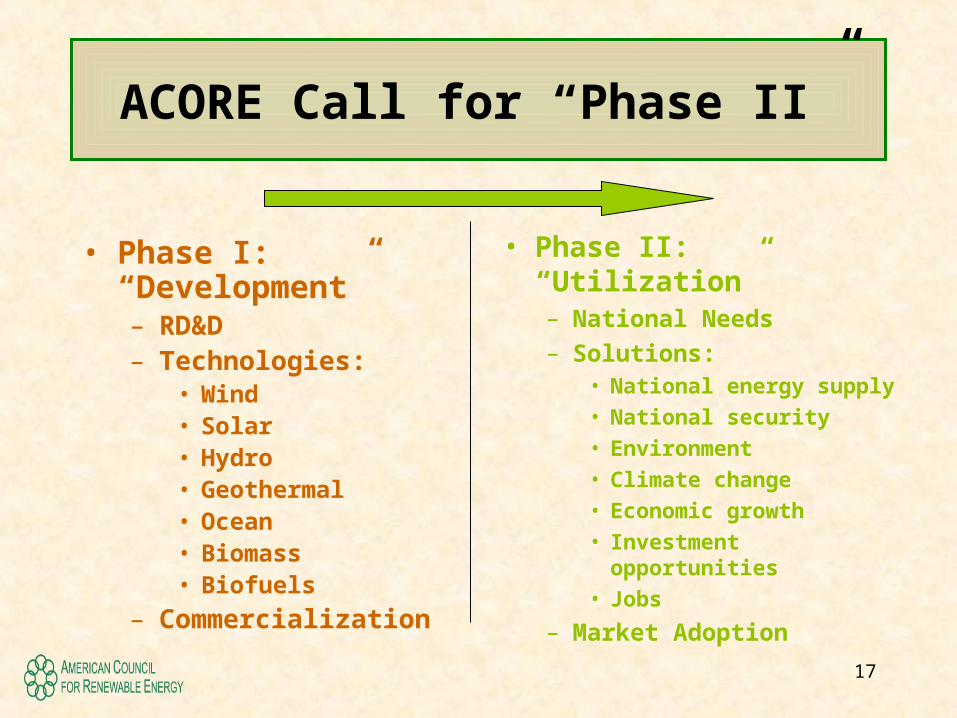
ACORE Call for “Phase II”
• Phase I: “Development”– RD&D– Technologies:
• Wind • Solar• Hydro• Geothermal• Ocean• Biomass• Biofuels
– Commercialization
• Phase II: “Utilization”– National Needs
– Solutions:• National energy supply
• National security
• Environment
• Climate change
• Economic growth
• Investment opportunities
• Jobs
– Market Adoption
18
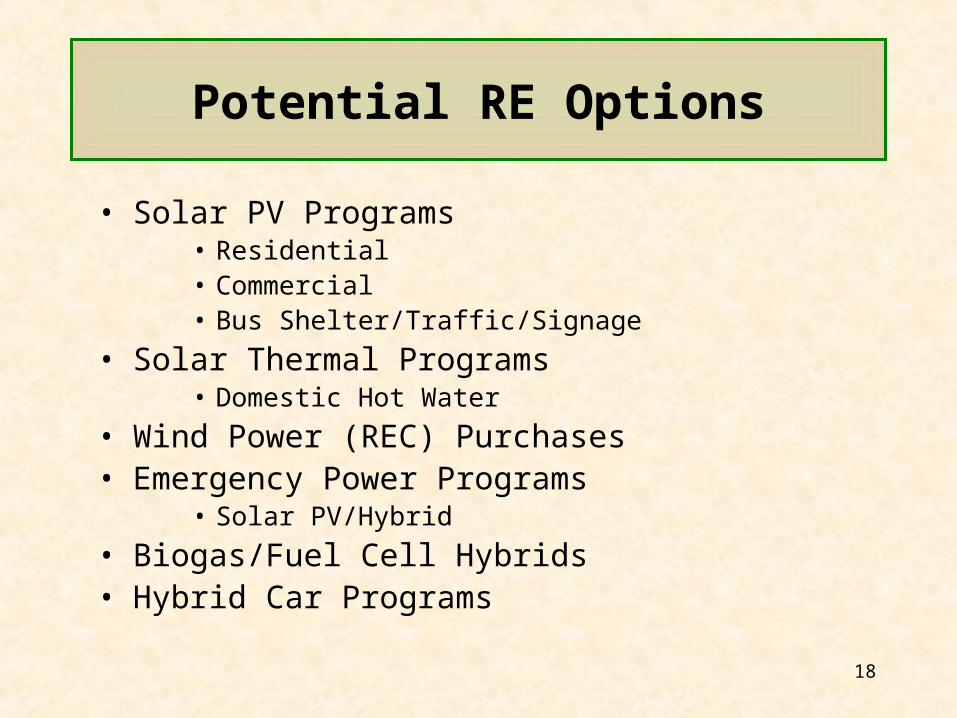
Potential RE Options
• Solar PV Programs• Residential• Commercial• Bus Shelter/Traffic/Signage
• Solar Thermal Programs• Domestic Hot Water
• Wind Power (REC) Purchases• Emergency Power Programs
• Solar PV/Hybrid
• Biogas/Fuel Cell Hybrids• Hybrid Car Programs

Extra Slides
20
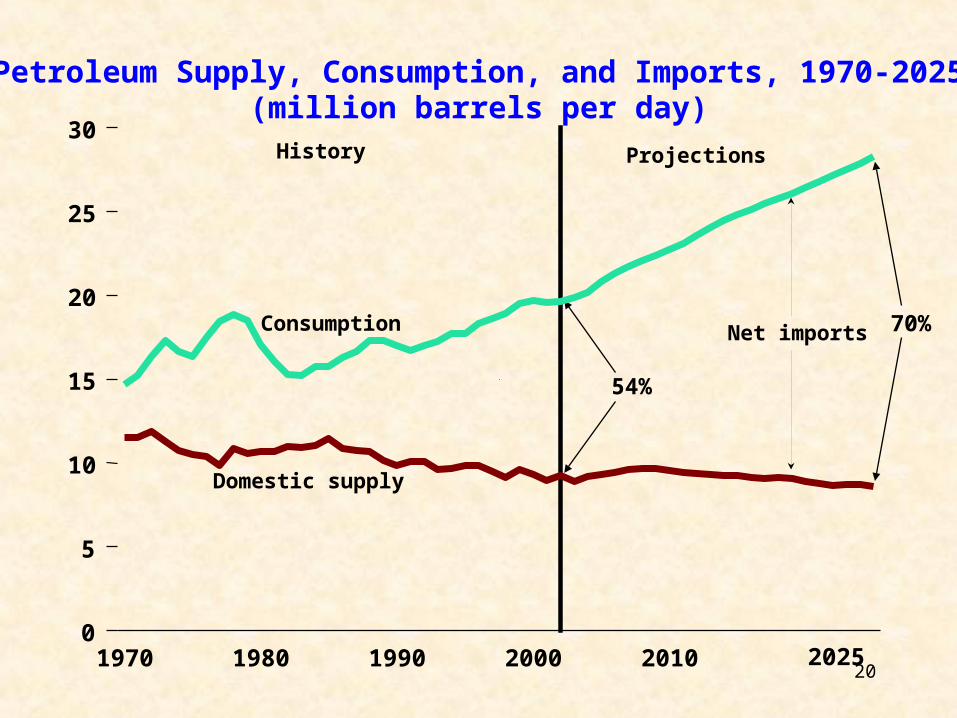
54%
70%
1970 1980 1990 2000 2010 20250
5
10
15
20
25
30
Domestic supply
Consumption
History Projections
Net imports
Petroleum Supply, Consumption, and Imports, 1970-2025(million barrels per day)
Primary Driver of Increased Consumption
• Power sector consumption of natural gas projected to increase significantly every year:
Source: Energy Ventures Group
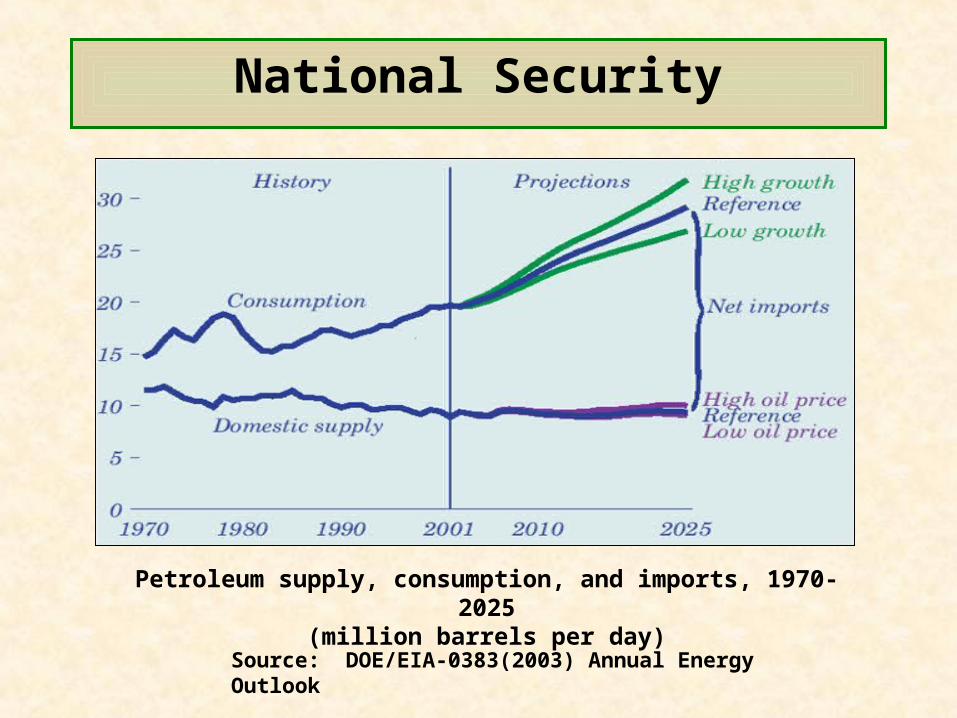
Petroleum supply, consumption, and imports, 1970-2025(million barrels per day)
Source: DOE/EIA-0383(2003) Annual Energy Outlook
National Security