Embed Size (px)
Citation preview

U.S. Regional Approaches to Energy Policy and CO2 Mitigation
The California Experience
Tom Bottorff
Senior Vice President, Regulatory Affairs
Pacific Gas and Electric Company
May 13, 2014

Topics for Discussion
• Programs aimed at reducing greenhouse gas (GHG) emissions
• PG&E’s emissions
• Key issues
• What’s next?
2

PG&E – Company Overview
3
Company Facts
Over 21,000 employees
70,000 square-mile service territory
$15.6 billion in revenues
Peak electricity demand: ~20,000 MW
Over 15 million people served
… about 1 in 20 Americans
• 5.2 million electric distribution customers
• 4.4 million natural gas distribution customers
Over 50% of PG&E’s electric supply comes from
non-greenhouse gas emitting facilities
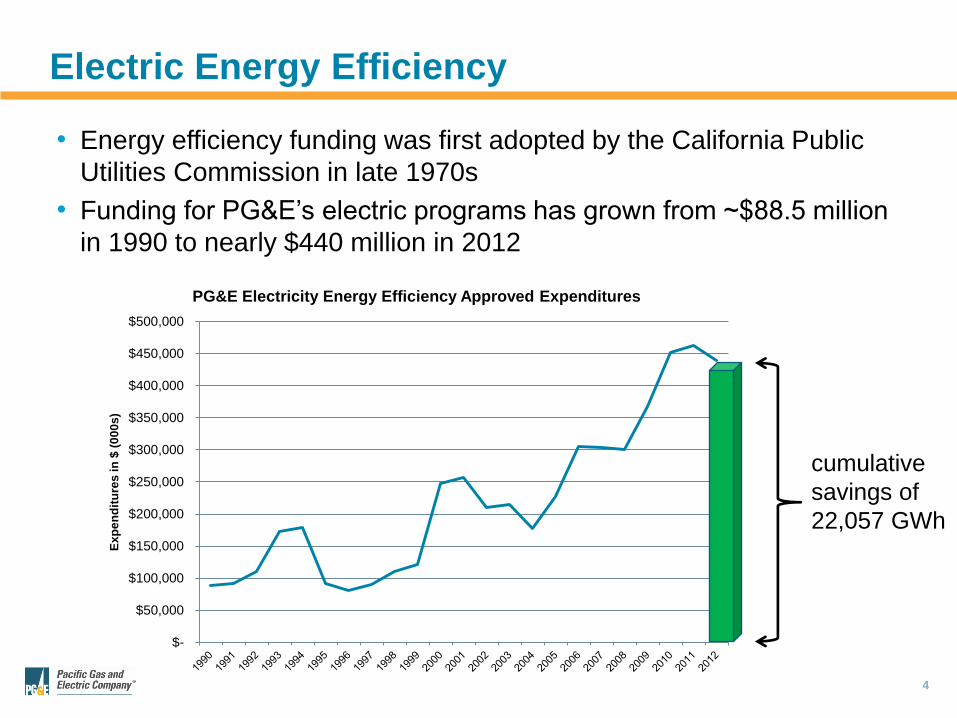
Electric Energy Efficiency
• Energy efficiency funding was first adopted by the California Public
Utilities Commission in late 1970s
• Funding for PG&E’s electric programs has grown from ~$88.5 million
in 1990 to nearly $440 million in 2012
4
cumulative
savings of
22,057 GWh
$-
$50,000
$100,000
$150,000
$200,000
$250,000
$300,000
$350,000
$400,000
$450,000
$500,000
Ex
pe
nd
itu
res
in
$ (
00
0s
)
PG&E Electricity Energy Efficiency Approved Expenditures

California’s Renewable Portfolio Standard (RPS)
• First adopted by state legislature in 2002
– Required 20% renewables by 2017
– Large hydro (above 30 MW) not considered “renewable”
• In 2006, goal was accelerated to 20% by 2010
• In 2011, target was increased to 33% by 2020
5

PG&E’s Electric Resource Mix Over Time
6
“Other” includes market purchases and other fossil resources.
1997 data from PG&E’s 1997 10K Report (report issued in spring 1998).
2013 statistics are subject to independent audit and verification that will not be completed until October 2014.
Eligible Renewables
22%
Nuclear 22%
Large Hydro 11%
Natural Gas + Other
45%
2013 (Preliminary) 2020 Projected
Nuclear 20%
Large Hydro 11%
Renewable Energy
14%
Nuclear 20%
Hydro 16%
Natural Gas + Other
50%
1997
Eligible
Renewables
33%
Natural Gas
+ Other
36%

2013 Preliminary
22% of total bundled retail sales
2020 Projected
33% of total bundled retail sales
Sources of Renewable Power – Today and in 2020
7
Source: PG&E’s 2013 Preliminary Annual 33% RPS Compliance Report; note that 2013 statistics are subject to independent audit and verification
that will not be completed until October 2014. *Generic means PG&E will procure from to-be-determined resources; some of these resources will be
procured through mandated programs such as: RAM, ReMAT and the upcoming SB 1122 bioenergy feed-in tariff.

PG&E a Leader in Retail Solar Photovoltaic
PG&E All Other U.S. Utilities Combined
* 2012 Solar Electric Power Association Annual Survey (full 2013 dataset not yet available )
* * 2013 Solar Electric Power Association Rankings
8
• One-fourth of customer solar installations in the U.S. are in
PG&E's service territory.*
• PG&E ranks #1 in installed megawatts for 2013 with 1,470 MW.**

Assembly Bill 32
• Signed into law in 2006; first mandatory greenhouse gas (GHG)
reduction law in US
• Requires California to reduce GHG emissions to 1990 levels
by 2020 (431 million metric tons (MMT))
– 15% decrease from 2020 business-as-usual forecast of 509 MMT
• Required California Air Resources Board (ARB) to develop plan to
achieve reductions (e.g., low carbon fuel standard, RPS, Cap-and-Trade)
• Cap-and-Trade compliance obligations for electric generating
facilities and imported electricity began on January 1, 2013
9

California’s Cap-and-Trade Program
10
• Economy-wide program (covers 85% of the California economy)
• Number of emissions allowances available in the market declines over time
• Options for compliance: direct reductions, allowances, offsets
0
100
200
300
400
Mil
lio
n M
etr
ic T
on
s C
O2e
Statewide Annual Allowance Budget
1st compliance period:
large stationary sources
2nd and 3rd compliance periods: large
stationary sources, suppliers of natural gas,
and suppliers of transportation fuels
334
162
394

Adding It Up: PG&E’s Avoided Emissions
11
*ARB unspecified electricity emissions rate used to calculate total avoided emissions in 2012 for resources added since 2004.
** Delivered electricity emissions rate calculated using plant-specific emission factors, rates corresponding to fuel type when
plant-specific factors were not available, and ARB’s unspecified rate for any unspecified power.
~17 MMT**
0.00
5.00
10.00
15.00
20.00
25.00
30.00
2012
Mil
lio
n M
etr
ic T
on
s C
O2
Emissions Avoided in 2012 Due to Added RPS-Eligible Renewables, Electric Energy Efficiency, and Distributed Solar PV
Avoided
emissions
~12 MMT*
Avoided emissions
due to renewables
Avoided emissions due
to distributed solar PV
Avoided emissions due
to energy efficiency
Remaining emissions
from delivered electricity

How We Compare
Sources: US/CA averages – US Environmental Protection Agency eGRID2012 Version 1.0, which contains year 2009 information configured to reflect the
electric power industry’s current structure as of May 10, 2012. PG&E – The Climate Registry, a third-party verification of greenhouse gas emissions data.
12
Benchmarking CO2 Emissions for Delivered Electricity
1,216
659
445
0
200
400
600
800
1,000
1,200
1,400
U.S. Average CA Average PG&E
Po
un
ds o
f C
O2
pe
r M
Wh
2012

Key Issues
Cost:
• A 2009 CPUC report estimated that: “In 2020, the total statewide electricity expenditures of the 33% RPS Reference Case is projected to be … 10.2% higher compared to the all-gas scenario.” *
Integration:
• “Over-generation is the most significant operational challenge to overcome… in a 50% RPS scenario, there would be excess power for 23% of the hours annually…” **
• [Hawaii’s] “PUC said it is increasingly concerned with reliability and curtailments, especially operational challenges confronting the Oahu and Kauai island grids due to potential integration of large amounts of solar PV capacity.”
13
Sources:
* “33% RPS Implementation Analysis Preliminary Results: Executive Summary,” prepared by the California Public Utilities Commission,
June 2009; page 7.
** E3’s report titled “Investigating a Higher Renewables Portfolio Standard in California”
*** News item from SNL by Jeff Stanfield titled “Hawaii PUC rejects utility resource plans as ‘fundamentally flawed’ ” - April 30, 2014

What’s Next: Path to 2050 GHG Reductions
14
Ag. & ForestryRes. & Comm.
Transportation
Electricity Generation
Industrial
0
100
200
300
400
500
600
2000 2010 2020 2030 2040 2050
Ca
lifo
rnia
GH
G E
mis
sio
ns
Inve
nto
ry
(Mil
lio
n M
etr
ic T
on
s C
O2
e)
2020 emissions limit: 431 MMT CO2e
2050 goal: 86 MMT CO2e
2030 goal?
Historic
Emissions

One Option to Achieve CA’s 2050 GHG Goal
15 Source: The Technology Path to Deep Greenhouse Gas Emissions Cuts by 2050:
The Pivotal Role of Electricity http://www.ethree.com/publications/index_2010.php

What’s Next? Federal Regulation of GHG Emissions
Section 111(d) directs EPA to provide states with guidelines for
determining a new performance standard for existing sources of air
pollution:
PG&E’s current position:
– Differentiated standards for states or fossil-fuel types may be appropriate
in the near term; in the long term, EPA should move towards a single
standard nationwide
– Standard should be expressed in both a rate-based (e.g., lbs./MWh) and
mass-based form (e.g., tons) to allow states flexibility in demonstrating
equivalency through their programs
– States should be given flexibility on how to meet the standard (e.g., using
cap-and-trade program, increasing renewables or energy efficiency)
16
Conclusions
17
• Energy efficiency and renewables have
been major contributors to achieving
current GHG-reduction goals
• California is investigating the appropriate
role of renewables in meeting further GHG
reductions
• Additional focus and efforts are needed to
reduce transportation and industrial sector
emissions – the electricity sector can help!
• Integration solutions are needed to support
California’s increasing renewable mix

Questions?
18