Embed Size (px)
Citation preview
RREEF Real Estate
RESEARCH REPORT
www.rreef.com
U.S. Real Estate Strategic Outlook
March 2012

RREEF REAL ESTATE U.S. Real Estate Strategic Outlook | March 2012 1
Table of Contents Executive Summary ................................................................................. 2
The Economy ........................................................................................... 5
Capital Markets ........................................................................................ 6
Real Estate Performance ......................................................................... 9
Property Market Fundamentals ................................................................ 9
Outlook for Real Estate Securities .......................................................... 10
Outlook for Debt Investment ................................................................... 11
Outlook for the Apartment Sector ........................................................... 13
Outlook for the Industrial Sector ............................................................. 18
Outlook for the Office Sector .................................................................. 23
Outlook for the Retail Sector .................................................................. 27
RREEF Real Estate U.S. House Portfolio .............................................. 32
Sustainability Strategy ............................................................................ 35
Important Notes ..................................................................................... 37
Global Research Team .......................................................................... 38
Prepared By:
Alan Billingsley Director Head of Americas Research [email protected] Ross Adams Vice President Industrial Specialist [email protected] Marc Feliciano Managing Director [email protected] Bill Hersler Vice President Office Specialist [email protected] Ana Leon Assistant Vice President Property Market Research [email protected] Andrew J. Nelson Director Retail Specialist [email protected] Mark G. Roberts Managing Director Global Head of Research [email protected] Kurt. W. Roeloffs Managing Director Global Chief Investment Officer [email protected] Alex Symes Vice President Economic & Quantitative Analysis [email protected] Brooks Wells Director Apartment Specialist [email protected]

RREEF REAL ESTATE U.S. Real Estate Strategic Outlook | March 2012 2
Executive Summary In a year when one of the best performing assets was long-term U.S. Treasuries, real estate put in a highly respectable performance. Total returns in the NCREIF Property Index (NPI) for 2011 came in at approximately 14 percent, compared to over 16 percent for 10-year U.S. Treasuries. In a flat and rocky year for most investors, few asset classes came close to producing such attractive returns.
Economic Outlook A series of global events in Japan and North Africa/Middle East created significant headwinds for the global and U.S. economies during the past year. In addition, political dysfunction in the United States and Europe has not only kept the two regions from dealing effectively with difficult economic problems, but has caused investors to question their ability or determination to avoid catastrophic consequences.
A more fragile economy would have succumbed to this pounding by receding into another recession. Not only was this avoided in the United States, but GDP grew by 1.7 percent in 2011, producing nearly 1.6 million jobs. This is net of nearly 300,000 jobs lost in the public sector, thereby reflecting a private sector that is experiencing sustained, if not vigorous, growth.
The next couple years are expected to be a continuation of the slow but sustained growth of the past year. More expiring stimulus and attempts to bring the public debt under control will continue to be fiscal drags on growth, and the U.S. Congress is unlikely to be of any assistance to economic recovery in the coming election year. Of more concern, European sovereign debt will continue to be a worry, and at the very least will have negative impacts on trade and U.S. banks with European exposure.
A stronger above-trend economic recovery is not expected until 2014, after which several years of healthy growth are forecast. Thus, in the mid- to long-term, real estate markets should experience full recovery. This recovery should also lead to new supply, which will moderate our rent growth forecasts by 2015 or 2016.
Outlook for Real Estate Although significant economic risks remain, fears of a “double-dip” recession have receded. In response, investors are shifting modestly to a more offensive position, rather than the highly defensive strategy of the past few years. During the past year, real estate transactions increased by over 50 percent, illustrating increased appreciation of the asset class. With economic recovery still in its early stages, however, most investor capital is expected to remain focused on the safest core assets in the best early recovery metros. Nevertheless, some capital is migrating to second tier metro markets to capture higher yield. During the recovery, capital initially chased apartments, given their early recovery performance, followed by major metro CBD office, which benefited from investor optimism. During the past year, capital expanded its targets to also include retail, which experienced a surge in activity. Industrial appears to be the last sector to attract attention, with sales just beginning to surge.
Real estate markets responded positively to the steady, although restrained economic growth. The severe recession of 2008 and 2009 delayed or banished plans for any new construction

RREEF REAL ESTATE U.S. Real Estate Strategic Outlook | March 2012 3
that had been previously considered. Negligible new supply is a significant positive for core investors, as even modest economic growth is producing noticeable improvement in demand in most markets and all sectors. With occupancy and rents on the rise, investors have noticed. Yields have been bid down for top quality properties in primary markets. This real estate recovery has been unique in that values for core properties have rebounded in its early phases. With such front-loaded returns, expectations for future returns have moderated considerably. Nevertheless, increased capital is expected to target real estate in the coming year.
Healthy but more moderate returns are anticipated for real estate going forward, with a total return of around 9 percent forecast for 2012, with total returns averaging between 8 and 9 percent over the next five years. Apartments will lead returns in the coming year, reflecting the sector’s outperformance in income growth along with strong capital demand. However, over the five-year outlook, the sector will underperform, reflecting the front-loaded nature of the sector’s recovery. At the other end of the spectrum, office properties will lag in the coming year, but are forecast to be the top performer over the next five years, with back-loaded returns. This pattern is consistent with the sector’s performance in past recoveries. Returns for industrial properties appear particularly attractive, given forecast outperformance in both the near and longer term. However, its forecast five-year average total returns fall short of that forecast for office, but are less back-loaded. Retail properties will track more closely with overall returns over the forecast period.
Markets that offer the greatest potential for outperformance in both the near and longer terms for a core portfolio include:
Apartments in Boston, New York, San Francisco, San Jose, Southern California, and South Florida;
Industrial warehouse in Fort Lauderdale, Los Angeles, Miami, New York/New Jersey, Oakland, Orange County, Riverside, San Jose, and Seattle;
Industrial flex in Los Angeles, Miami, Oakland, Orange County, San Jose, and Seattle; and
CBD office in Boston, Denver, Los Angeles, Miami, New York, and Seattle;
Suburban office in Los Angeles, Orange County, and San Diego;
Dominant community, power, street frontage and lifestyle centers in a wide variety of metros, with a focus on supply constrained markets such as Austin, Los Angeles, New York, Orange County, San Diego, San Francisco, San Jose, Seattle.
Caution should be used in the following markets due to late recovery, weak fundamentals, and/or aggressive values for a core portfolio include:
Apartments in Atlanta, Dallas and Houston, due to weak growth potential;
Apartments in Washington D.C. due to high valuations relative to growth potential and supply risk;
Boston warehouse industrial due to weak growth potential;
Flex industrial in Atlanta, Baltimore, Boston, Chicago, Dallas and Houston;
RREEF REAL ESTATE U.S. Real Estate Strategic Outlook | March 2012 4
Commodity suburban office in any metro;
CBD office in Washington D.C. due to high valuation relative to growth potential;
CBD office in Minneapolis, Oakland, and Philadelphia due to weak rent growth potential;
Suburban office in Chicago, Dallas, Northern New Jersey, and Philadelphia.
Atlanta, Chicago and Philadelphia, which are the least attractive metros for retail;
Grocery-anchored neighborhood centers and regional malls due to high valuations relative to growth potential; and
Second tier retail properties, due to extreme risk of under-performing assets.
Strategic Recommendations Private Real Estate: As previously discussed, lower returns are forecast for core real estate over the next five years compared with the past two. Relative to the NPI, we recommend a modest underweight to apartments, given the significant appreciation already achieved; a significant overweight to industrial, given its strong prospects for income and appreciation over the next five years; modest underweight to office, given its anticipated late recovery and heavy weighting in the index; and a modest overweight to retail, given its stability and RREEF Real Estate’s forecast for a strong recovery.
Given the growing traction of the economy and strong performance of real estate over the last two years, some investors may find attractive opportunities in moving up the risk curve. This could include value-added investments in properties with leasing risk or opportunities for repositioning in markets with strong near-term performance and growth. Since capital has been highly focused on prime markets, higher risk investors might consider second tier metros that have strong growth prospects and where capital is not yet focused. These are typically late recovery metros that have not yet shown evidence of growth. Largely leased properties with limited tenant roll-over potential in such metros that are forecast to experience strong growth in 2014 through 2016 could be attractive value-added or core-plus investments.
Since it is still early in the recovery cycle to support new development, except for apartments in select markets, opportunistic investing is largely limited to debt. Significant debt maturities loom over the next few years for over-leveraged properties. Opportunities for acquiring high quality assets by buying distressed debt remain a popular strategy, as does providing mezzanine debt at attractive yields to allow for refinancing. Apartment development in the strongest urban centers can also be attractive. Caution needs to be exerted, however, as the development pipeline is ramping up in some metros that could hurt rent growth in the longer term.
Real Estate Securities: After turning in a respectable performance of 8.3 percent total return in 2011, REITs continue to trade at premiums to their net asset values (NAVs). This positive momentum is forecast to carry through 2012, with forecast total returns of between 10 and 15 percent. U.S. real estate securities are forecast to be an attractive investment during the coming year.

RREEF REAL ESTATE U.S. Real Estate Strategic Outlook | March 2012 5
Real Estate Debt: With the recovery of the real estate market on more solid ground, and with significant debt maturities looming, attractive opportunities will emerge for debt investment across a wide spectrum ranging from traditional lending to rescue capital. The gap between mortgage maturities and new originations during the next few years will provide opportunities for investors with a variety of appetites for risk, from conservative lenders taking advantage of the availability of prime property loans to opportunistic investors willing to inject capital into properties with maturing loans with very high loan-to-value ratios at higher rates of return. Loans originated during the forecast period will benefit from the following:
Bottom-of-the-cycle origination. with property values and loan-to-value ratios markedly lower than in the recent past;
A rising rent, occupancy and income growth environment; and
Dry construction pipelines
The Economy As had been expected, recovery from severe financial crisis in the United States has been slow. While banks appeared to have recovered quickly and returned to profitability after the initial meltdown, it became clear in 2011 that more structural reforms were required, greatly tempering their returns. More significantly, the recession uncovered serious weakness in some European economies, placing the banking sector into crisis. With a much weaker policy response in Europe than in the United States, these problems are far from being resolved, placing additional burdens on the domestic and international economies. A downgrade in U.S. debt rating, due to squabbling policy-makers, supply shocks from the Arab Spring, Tōhoku earthquake and Tsunami in Japan, and historic flooding in Thailand created additional strains on the economy.
A weaker economy would have succumbed to renewed recession, but the year ended on a relatively positive note. Although far from robust, the economy continues to evidence steady gradual improve-ment. The weekly initial unemploy-ment claims ended the year at 375,000 on a four-week moving average, below a key threshold of 400,000 that is commensurate with stronger employment gains in the headline statistics. Job growth averaged over 130,000 per month for the year, bringing unemployment down to 8.5 percent in December. Retail sales moved up modestly during the holiday season, growing 3.7 percent after adjusting for inflation over 2010, reflecting improvement in consumer confidence. The distressed housing market appears to be nearing bottom, also providing benefits to consumer confidence.
Forecast Annual Job Growth 2009-2016
Sources: IHS Global Insight, RREEF Real Estate.
As of March 2012.
-5,989
-967
1,600 1,600 1,9002,400 2,600 2,300
-8,000
-6,000
-4,000
-2,000
0
2,000
4,000
2009 2010 2011 2012 2013 2014 2015 2016
Annu
al C
hang
e (in
thou
sand
s of
jobs
)
RREEF Forecast

RREEF REAL ESTATE U.S. Real Estate Strategic Outlook | March 2012 6
The most important drivers to this recovery have been energy, professional and business ser-vices, health services, manufacturing, technology and trade. As economic growth expands further, recovery will broaden to additional sectors, including consumption. In the absence of further headwinds, robust economic growth is forecast.
Unfortunately, 2012 will be another year facing significant headwinds in the United States. Solving the debt problems and reigniting growth in Europe is likely to be a time-consuming and messy process, which will impact U.S. banking and trade. Closer to home, the U.S. government is no closer to resolving this nation’s long-term debt issues, while further damage to the near-term recovery is still possible. Even if these U.S. and global debt issues could be resolved optimally, they would still be a drag on growth. While a modest improvement from 2011, the coming year is forecast to experience continued gradual recovery, with anticipated job creation of about 140,000 per month. Longer-term, growth should accelerate. The previous employment peak should be achieved in 2014, and the unemployment rate should fall below 7 percent in 2016.
These economic forecasts continue to have large risks to the downside. Currently, the most significant risks appear to come from abroad. The European crisis, while currently seeming manageable, still has the potential for grave failures that could lead to some countries leaving the Euro. Risks of conflict with Iran are increasing, which would take Middle East conflict to a totally new level, which at the very least would cause a spike in oil prices. Further, we should not underestimate the potential for the U.S. government to make severe fiscal blunders that could significantly hinder the recovery.
Capital Markets Capital is rapidly returning to real estate, although from a low in 2009 that suggested near total collapse. Nonetheless, volume in 2011 nearly reached 2004 levels, which was a fairly healthy recovery year. Total volume increased 51 percent in the past year, reaching an estimated $186 billion, slightly above the 11-year average of $180 billion.
Real Estate Transaction Volumes
Sources: Real Estate Capital Analytics and RREEF Real Estate.
As of March 2012.
Sources of capital are broadening as real estate is increasingly viewed as a desirable investment class, given its yields relative to risk in an improving market. With real estate producing improving occupancy, rents and income, investors are becoming more confident in
Private35%
Inst'l/Eq Fund31%Listed/REITs
16%
Crossborder9%
User/Other7%
Unknown2%
80102
124
190
293317
359
146
60
123
186
0
50
100
150
200
250
300
350
400
01 02 03 04 05 06 07 08 09 10 11
Capital Flows 2001-2011 ($Billions) 2011 Buyer Profile Flow
RREEF REAL ESTATE U.S. Real Estate Strategic Outlook | March 2012 7
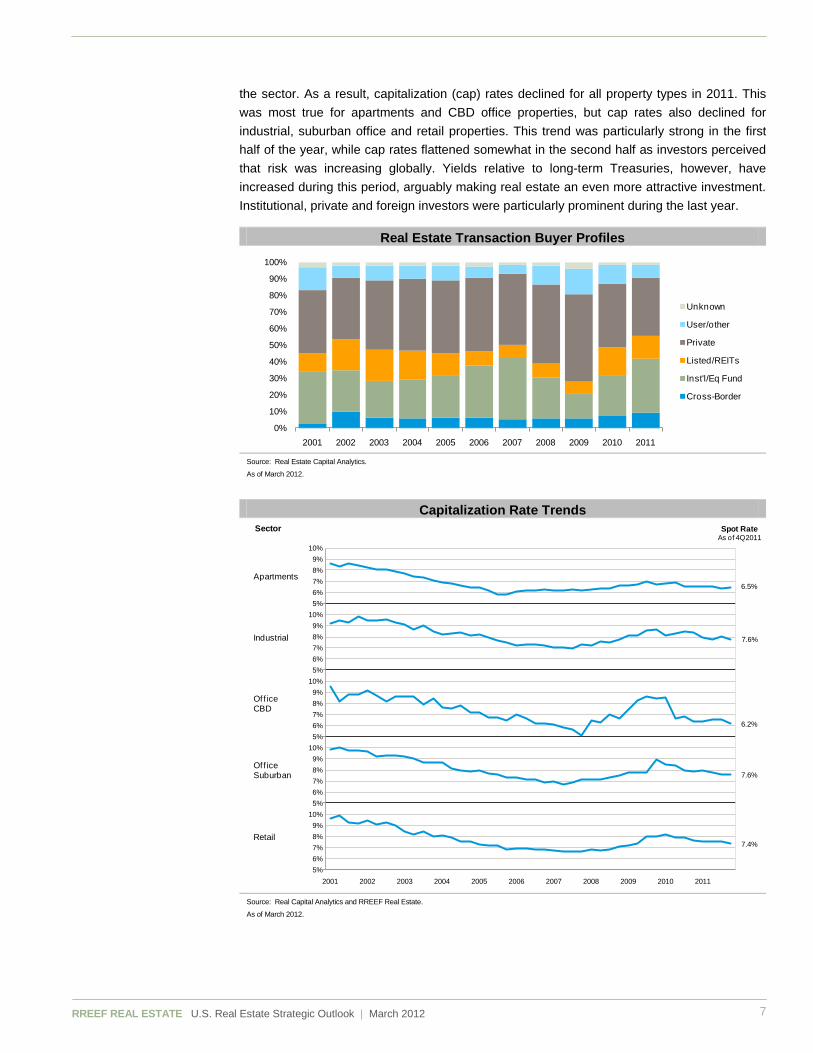
the sector. As a result, capitalization (cap) rates declined for all property types in 2011. This was most true for apartments and CBD office properties, but cap rates also declined for industrial, suburban office and retail properties. This trend was particularly strong in the first half of the year, while cap rates flattened somewhat in the second half as investors perceived that risk was increasing globally. Yields relative to long-term Treasuries, however, have increased during this period, arguably making real estate an even more attractive investment. Institutional, private and foreign investors were particularly prominent during the last year.
Real Estate Transaction Buyer Profiles
Source: Real Estate Capital Analytics.
As of March 2012.
Capitalization Rate Trends
Source: Real Capital Analytics and RREEF Real Estate.
As of March 2012.
0%
10%
20%
30%
40%
50%
60%
70%
80%
90%
100%
2001 2002 2003 2004 2005 2006 2007 2008 2009 2010 2011
Unknown
User/other
Private
Listed/REITs
Inst'l/Eq Fund
Cross-Border
6.5%
7.6%
6.2%
7.4%
7.6%
5%6%7%8%9%
10%5%6%7%8%9%
10%5%6%7%8%9%
10%5%6%7%8%9%
10%5%6%7%8%9%
10%
2001 2002 2003 2004 2005 2006 2007 2008 2009 2010 2011
Spot RateAs of 4Q2011
Sector
Apartments
Industrial
Of f iceCBD
Off iceSuburban
Retail
RREEF REAL ESTATE U.S. Real Estate Strategic Outlook | March 2012 8
Capitalization Rate Spread Trends
Note: Spreads to 10-year Treasury.
Source: RREEF Real Estate.
As of March 2012.
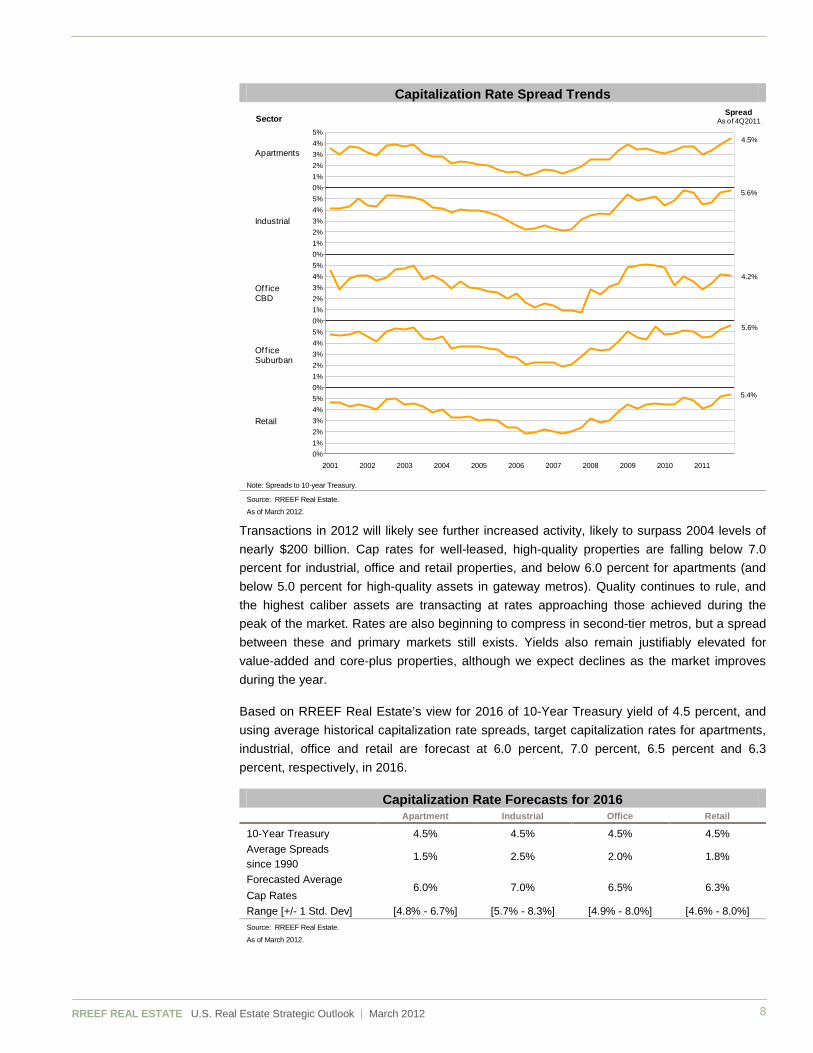
Transactions in 2012 will likely see further increased activity, likely to surpass 2004 levels of nearly $200 billion. Cap rates for well-leased, high-quality properties are falling below 7.0 percent for industrial, office and retail properties, and below 6.0 percent for apartments (and below 5.0 percent for high-quality assets in gateway metros). Quality continues to rule, and the highest caliber assets are transacting at rates approaching those achieved during the peak of the market. Rates are also beginning to compress in second-tier metros, but a spread between these and primary markets still exists. Yields also remain justifiably elevated for value-added and core-plus properties, although we expect declines as the market improves during the year.
Based on RREEF Real Estate’s view for 2016 of 10-Year Treasury yield of 4.5 percent, and using average historical capitalization rate spreads, target capitalization rates for apartments, industrial, office and retail are forecast at 6.0 percent, 7.0 percent, 6.5 percent and 6.3 percent, respectively, in 2016.
Capitalization Rate Forecasts for 2016 Apartment Industrial Office Retail
10-Year Treasury 4.5% 4.5% 4.5% 4.5% Average Spreads since 1990
1.5% 2.5% 2.0% 1.8%
Forecasted Average 6.0% 7.0% 6.5% 6.3%
Cap Rates Range [+/- 1 Std. Dev] [4.8% - 6.7%] [5.7% - 8.3%] [4.9% - 8.0%] [4.6% - 8.0%] Source: RREEF Real Estate.
As of March 2012.
4.5%
5.6%
4.2%
5.4%
5.6%
0%1%2%3%4%5%0%1%2%3%4%5%0%1%2%3%4%5%0%1%2%3%4%5%0%1%2%3%4%5%
2001 2002 2003 2004 2005 2006 2007 2008 2009 2010 2011
SpreadAs of 4Q2011Sector
Apartments
Industrial
Of f iceCBD
Off iceSuburban
Retail

RREEF REAL ESTATE U.S. Real Estate Strategic Outlook | March 2012 9
Real Estate Performance Spreads between the 10-year U.S. Treasury and real estate are at historic highs at the low end of the range, with the T-Bill at nearly 2 percent at year-end 2011 and cap rates for apartments at 6.5 percent, according to Real Capital Analytics, the spread is 450 basis points. For institutional quality assets, the cap rate is estimated at 5.5 percent, for a spread of 350 basis points. At the high end of the range, with cap rates at 7.6 percent for industrial and suburban office, the spread is 560 basis points. With the treasury rate forecast to remain low over the next couple years, it is unlikely that cap rates will rise. Even with an uptick in the risk-free rate, as projected in 2014 through 2016, it is likely that the spread will narrow as investors move more aggressively into real estate, allowing cap rates to remain compressed.
NCREIF Property Index Forecast by Year
2012 2013 2014 2015 2016 Annual 5-Year
Forecast
Apartment Income Return 5.2% 5.3% 5.5% 5.6% 5.8% 5.5% Capital Return 6.5% 3.4% (1.2%) (2.5%) (0.3%) 1.2% Total Return 11.6% 8.7% 4.2% 3.1% 5.5% 6.6%
Industrial Income Return 6.5% 6.4% 6.4% 6.4% 6.4% 6.4% Capital Return 2.7% 3.0% 3.6% 2.5% 1.9% 2.7% Total Return 9.2% 9.3% 9.9% 8.9% 8.3% 9.1%
Office Income Return 6.7% 6.6% 6.6% 6.4% 6.3% 6.5% Capital Return 0.4% 2.3% 4.7% 3.3% 4.3% 3.0% Total Return 7.1% 8.8% 11.3% 9.7% 10.6% 9.5%
Retail Income Return 6.6% 6.5% 6.4% 6.3% 6.1% 6.4% Capital Return 1.9% 1.9% 2.1% 1.9% 1.9% 1.9% Total Return 8.4% 8.4% 8.5% 8.1% 8.1% 8.3%
NPI Income Return 6.2% 6.2% 6.2% 6.2% 6.1% 6.2% Capital Return 2.7% 2.6% 2.4% 1.3% 2.2% 2.2% Total Return 8.9% 8.8% 8.5% 7.5% 8.3% 8.4%
Sources: IHS Global Insight and RREEF Real Estate.
As of March 2012.
Property Market Fundamentals U.S. Vacancy Rate Trends
Actual Projected
2008 2009 2010 2011 2012 2013 2014 2015 2016
Apartment 6.8% 8.2% 6.7% 5.3% 4.5% 4.1% 4.0% 4.8% 5.4%
Industrial 11.8% 14.3% 14.3% 13.5% 12.3% 11.1% 10.3% 10.2% 10.2%
Office 14.2% 16.6% 16.5% 16.1% 15.5% 14.2% 12.6% 12.0% 12.3%
Retail 8.7% 10.3% 10.7% 10.8% 10.3% 9.6% 9.3% 9.0% 9.1%
Sources: REIS, CBRE-EA (History) and RREEF Real Estate (Forecast).
As of March 2012.
All property market sectors are firmly into recovery, but each sector is at a different stage of the cycle. Apartments have completed their second year of solid rent growth along with a dramatic rise in occupancy and income. As a result, the sector is firmly in the growth phase of the cycle. The industrial, office and retail sectors stabilized in 2010 and experienced only nominal rent growth during the past year, but are firmly in the recovery phase of the cycle. Absorption achieved in 2011 bodes well for stronger rent growth in 2012 in all sectors. It

RREEF REAL ESTATE U.S. Real Estate Strategic Outlook | March 2012 10
should also be noted that there are dramatic differences in performance by metro, submarket and asset quality. Nonetheless, with a broadly based economic recovery, virtually all markets are well poised for future growth.
Sector Rent Comparison Summary 4Q2011 2011 = 100
Note: Industrial & Retail rents are NNN.
Sources: REIS, CBRE-EA (History); RREEF (Forecast).
As of March 2012.
Outlook for Real Estate Securities After outperforming the private real estate market for two years in a row, equity real estate public securities underperformed in 2011, producing a still respectable 8.3 percent total return according to the NAREIT all equity index, compared with 14.3 percent for the private market.1
Positive momentum is carrying into 2012, and it is likely that REITs will continue to trade above their NAVs during the coming year. Real estate securities are maintaining a favorable cost of capital, compared to private real estate investors, with common equity priced at a premium to NAV and unsecured and perpetual preferred equity yields at all time lows. REITs continue to use this competitive advantage to acquire and develop assets at accretive spreads. Unlevered IRRs currently range from 7.0 to 8.5 percent for new acquisitions. Based on our expectations of a continued low interest rate environment, we expect REITs to gener-ate 10 to 15 percent returns for the year, utilizing conservative leverage.
Outside of a hiccup in the market during the third quarter, REITs continued to trade at premiums to their net asset values (NAVs) throughout 2011, and the sector outperformed in the fourth quarter, returning 15.3 percent.
Positive momentum in the public markets bodes well for the private markets. Real estate securities tend to lead private real estate by three or four quarters, and property values are likely to rise during the next year to meet the anticipated levels predicted by the stock market. The exhibit below shows the lag for private real estate returns versus the public market share premium. More interestingly, the addition of new public companies in the past year, with more expected in 2012, equates to more capital coming to the sector. Increased capital typically translates into further price level increases. While not likely to fuel another bubble, at least in the near-term, this should support higher capital appreciation in 2012.
1 Unleveraged returns in the NCREIF National Property Index
80
90
100
110
120
130
140
150
2007 2008 2009 2010 2011 2012 2013 2014 2015 2016
Apartments - NNN
Industrial
Office CBD - NNN
Office Suburban - NNN
Retail

RREEF REAL ESTATE U.S. Real Estate Strategic Outlook | March 2012 11
Share Price Premium to NAV vs. Annualized NPI
Sources: Green Street Advisors and RREEF Real Estate.
As of January 2012.
Outlook for Debt Investment The U.S. real estate market is beginning to emerge from a severe debt crisis, one so severe that it helped precipitate the worst financial crisis in U.S. history since the Great Depression. Prior to this crisis, lending markets were characterized by loose underwriting standards, high transaction volume and velocity, along with accelerating valuations for underlying assets. After this bubble inevitably burst in late 2007, mortgage rate spreads skyrocketed to 1400 basis points2
U.S. Fixed Rate CMBS Super Senior AAA Spread to 10 Year Treasuries
over the next year. The debt markets froze, while real estate fundamentals faltered in the resultant recession, as rental rates decreased, vacancy rates increased and asset sales and property values plummeted. By 2010, cautious optimism and a more disciplined approach to the market took hold. During this past year, real estate fundamentals and transaction volume improved further, providing greater confidence in recovery. Nevertheless, mortgage rate spreads remain slightly elevated from pre-crisis levels reflecting the new market temperament.
Sources: Bloomberg, Morgan Stanley, Federal Reserve.
As of February 2012.
2 Super Senior CMBS AAA notes relative to 10-year U.S. Treasuries
-50%
-40%
-30%
-20%
-10%
0%
10%
20%
30%
40%
-50%
-40%
-30%
-20%
-10%
0%
10%
20%
30%
40%
1990
1990
1991
1992
1992
1993
1994
1994
1995
1996
1996
1997
1998
1998
1999
2000
2000
2001
2002
2002
2003
2004
2004
2005
2006
2006
2007
2008
2008
2009
2010
2010
2011
NAV Premium (All REITs) NPI
Avg. Premium to NAV since 1990: 2.5%
0200400600800
1000120014001600
Dec
-06
Apr-
07
Aug-
07
Dec
-07
Apr-
08
Aug-
08
Dec
-08
Apr-
09
Aug-
09
Dec
-09
Apr-
10
Aug-
10
Dec
-10
Apr-
11
Aug-
11
Dec
-11
Basis Points
RREEF REAL ESTATE U.S. Real Estate Strategic Outlook | March 2012 12
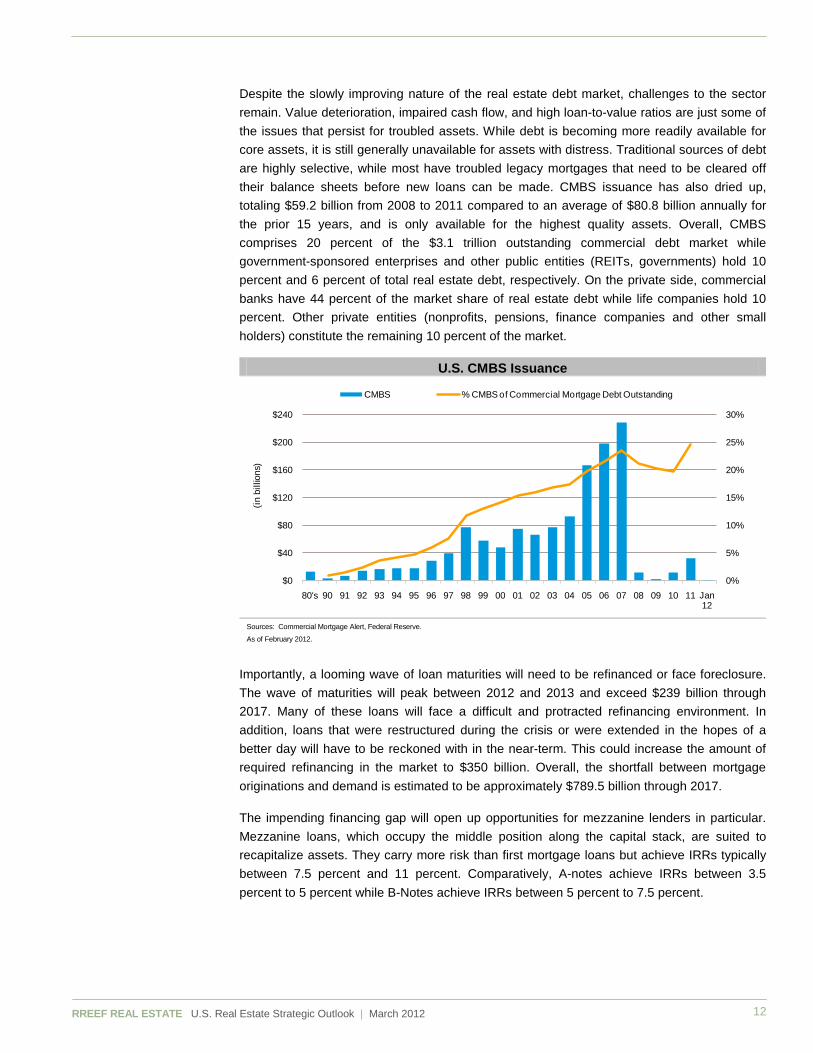
Despite the slowly improving nature of the real estate debt market, challenges to the sector remain. Value deterioration, impaired cash flow, and high loan-to-value ratios are just some of the issues that persist for troubled assets. While debt is becoming more readily available for core assets, it is still generally unavailable for assets with distress. Traditional sources of debt are highly selective, while most have troubled legacy mortgages that need to be cleared off their balance sheets before new loans can be made. CMBS issuance has also dried up, totaling $59.2 billion from 2008 to 2011 compared to an average of $80.8 billion annually for the prior 15 years, and is only available for the highest quality assets. Overall, CMBS comprises 20 percent of the $3.1 trillion outstanding commercial debt market while government-sponsored enterprises and other public entities (REITs, governments) hold 10 percent and 6 percent of total real estate debt, respectively. On the private side, commercial banks have 44 percent of the market share of real estate debt while life companies hold 10 percent. Other private entities (nonprofits, pensions, finance companies and other small holders) constitute the remaining 10 percent of the market.
U.S. CMBS Issuance
Sources: Commercial Mortgage Alert, Federal Reserve.
As of February 2012.
Importantly, a looming wave of loan maturities will need to be refinanced or face foreclosure. The wave of maturities will peak between 2012 and 2013 and exceed $239 billion through 2017. Many of these loans will face a difficult and protracted refinancing environment. In addition, loans that were restructured during the crisis or were extended in the hopes of a better day will have to be reckoned with in the near-term. This could increase the amount of required refinancing in the market to $350 billion. Overall, the shortfall between mortgage originations and demand is estimated to be approximately $789.5 billion through 2017.
The impending financing gap will open up opportunities for mezzanine lenders in particular. Mezzanine loans, which occupy the middle position along the capital stack, are suited to recapitalize assets. They carry more risk than first mortgage loans but achieve IRRs typically between 7.5 percent and 11 percent. Comparatively, A-notes achieve IRRs between 3.5 percent to 5 percent while B-Notes achieve IRRs between 5 percent to 7.5 percent.
0%
5%
10%
15%
20%
25%
30%
$0
$40
$80
$120
$160
$200
$240
80's 90 91 92 93 94 95 96 97 98 99 00 01 02 03 04 05 06 07 08 09 10 11 12
(in b
illio
ns)
CMBS % CMBS of Commercial Mortgage Debt Outstanding
Jan12

RREEF REAL ESTATE U.S. Real Estate Strategic Outlook | March 2012 13
With the CMBS market retrenching and investor demand for Collateralized Debt Obligations (CDOs) waning, mezzanine lending has been regaining market share in the debt space. In addition, with life insurance companies demanding higher quality collateral on senior loans, they are willing to accept a relatively modest yield which accrues to the benefit of the mezzanine lender and results in competitive risk-adjusted returns. In addition, in today’s market, the amount of equity provided by the borrower is in the range of 20 percent. This is in stark contrast to the mid-2000’s when borrowers provided only 5 percent to 10 percent equity. As a result, because the amount of equity required by lenders is higher, the risk of capital loss is lower for the mezzanine lender because capital values would need to decline by a greater amount today before it impacts the mezzanine lender. The chart below outlines the current yields of various fixed income instruments as well as mid-point IRRs across the real estate capital stack.
Market Yields and IRR Projections – Year-end 2011
*Data as of 3Q2011
** Mid-range IRRs based on RREEF projections.
Sources: Federal Reserve, Ibbotson, NAREIT, Moody’s Economy.com, Bloomberg.
As of March 2012.
Outlook for the Apartment Sector Strong Fundamentals and Aggressive Pricing Invite New Supply Threat: Widely recognized by commercial real estate investors as the best-performing sector over the past two years, apartment is the first property type to have transitioned from recovery into the growth phase of the cycle. Apartments benefited from an early surge in demand that resulted in a sharp recovery in occupancy and rents. Typically short one-year leases have allowed rent growth to rapidly translate into income growth, while high vacancy rates and longer lease terms have created a significant lag in other sectors. Renewed employment growth translated almost immediately into multi-family demand, given that many of the newly employed are in the prime renter age group, the “Echo Boomers,” who represent a significant demographic surge. This population also has less of a propensity for home ownership than previous generations, with the recent performance of the for-sale housing market reinforcing this view.
11.0%
9.3%
6.3%
4.3%
7.2%
6.7%
6.5%
4.7%
4.7%
4.1%
3.8%
3.6%
2.9%
1.9%
0% 2% 4% 6% 8% 10% 12%
Equity**
Mezzanine Loan**
B-Note**
A-Note**
Barclays IG BBB CMBS
Barclays High Yield REIT Index
ACLI Mortgage Constant for Fixed Loans*
ACLI Bond Equivalent Yield for Fixed Loans*
ACLI Contract Interest Rate for Fixed Loans*
Barclays Investment Grade REIT Index
REIT Equity Dividend Yield
Barclays BBB Corporate
Barclays IG AAA CMBS
10-Year Treasury
Spot Yields
IRRs

RREEF REAL ESTATE U.S. Real Estate Strategic Outlook | March 2012 14
In addition, rental demand is receiving some support from previous homeowners who experienced distress with their mortgages. As a result, the homeownership rate has declined to levels last experienced in the 1990’s.
With rental demand far exceeding new supply, rent growth has been robust. During the third quarter of 2011, the overall national average effective rent for the sector surpassed the previous rent peak established at the end of 2007. Washington D.C., San Francisco and San Jose have all now exceeded their prior peak rents by upwards of 10 percent. Late economic recovery metros, including the Southern California markets of Los Angeles, Orange County and Riverside/San Bernardino, along with Atlanta and Phoenix, are still below their previous peak levels.
Apartment Market Recovery Snapshot Effective Rents as Percent of Peak (as of 3Q2011)
Recovery Leaders Recovery Laggards
Austin (104%) Portland (104%) Atlanta (95%) Orange County (96%) Baltimore (108%) San Francisco (108%) Fort Lauderdale (98%) Phoenix (89%) Boston (107%) San Jose (109%) Houston (98%) Riverside/San Berdo (96%)
Chicago (106%) Washington D.C. (110%) Los Angeles (94%) West Palm Beach (96%)
U.S. Average = 102% of Previous Peak (2007-08) Sources: Axiometrics and RREEF Real Estate.
As of March 2012.
The vacancy rate for the nation is expected to fall below 5 percent in 2012 with average effective rents posting similar increases as last year, and growth ranging between 3 to 5 percent. New completions are expected to remain at historic lows through 2013, allowing for continued strong rent growth during the near term. Longer term, a construction pipeline is building, which is likely to moderate rent growth in the outer years of our five-year forecast.
As the vacancy rate is forecast to tighten further, leasing conditions will continue to favor landlords. Sustained rent growth is projected to average 4 to 5 percent per year through 2014. If the three-year fore-cast is realized, average effective rents will be 17 percent above the previous 2007 peak. For comparison, peak-to-peak average ef-fective rents were only 10 percent higher during the 2006 to 2007 compared with levels achieved in the 1999 to 2000 cycle.
Developers are currently focused on building in prime urban/infill locations located in the Gateway cities – a historic shift from previous cycles when Sunbelt cities and the outer suburbs received the majority of activity. Washington D.C. has been first to experience a
Apartment Market Forecasts - National Fundamentals U.S. Supply/Demand & Vacancy
Sources: CBRE-EA and RREEF Real Estate.
As of March 2012.
0.01.02.03.04.05.06.07.08.09.0
(50)
0
50
100
150
200
250
2001
2002
2003
2004
2005
2006
2007
2008
2009
2010
2011
2012
F
2013
F
2014
F
2015
F
2016
F
Vacancy Trend %
Supp
ly/D
eman
d (th
s. o
f uni
ts)
Completions Net Absorption Vacancy Trend

RREEF REAL ESTATE U.S. Real Estate Strategic Outlook | March 2012 15
significant surge in new construction, while the downtown/infill areas of San Francisco, San Jose, Seattle, Chicago, Boston, and Texas have all recently witnessed a rush to development. Such activity is now beginning to migrate to later recovery metros, including Florida and Southern California.
U.S. Apartments Rent Growth vs. Vacancy
Sources: REIS, Axiometrics and RREEF Real Estate.
As of March 2012.
Although the near-term outlook for apartments remains robust, the sector is expected to reach the mature phase of the real estate cycle during the outer years of our forecast. While there are structural trends to consider that could prolong or boost its strong run of performance, cyclical trends and an intensifying construction pipeline are expected to temper NOI growth during the outer years of the forecast. After stabilizing in the low-four percent range during midterm, the overall U.S. multi-family vacancy rate is expected to begin trending up in 2015, while rent growth decelerates.
Multi-family is expected to maintain its status as the preferred property type for real estate investors in 2012. Investor optimism and historically low mortgage rates from enthusiastic lenders are reflected in the sub-five percent capitalization rates that are typically required to acquire Class A multi-family properties in prime markets. Capitalization rates for high-barrier-to-entry coastal markets, particularly New York, Washington D.C., and San Francisco, have now compressed to the low-four percent range. Although further cap rate compression is unlikely, pricing for multi-family is expected to remain aggressive. However, as market conditions mature, cap rates are expected to increase during the later years of the forecast. Although GSE reform will remain stalled in Congress until after the 2012 election, the potential restructuring of mortgage finance enterprises, which are central to the multi-family debt market, remains a risk. Another cautionary flag to investors is the aggressive underwriting needed in order to justify current multi-family pricing, another potential risk given where the sector is positioned in the real estate cycle.
With premier multi-family properties trading at very expensive prices that are often above replacement cost, coupled with market fundamentals maturing during the outer years of the forecast, caution is advised when investing in this property sector. A more tactical approach is now recommended that encompasses both short and long-term investment strategies.
2.0
3.0
4.0
5.0
6.0
7.0
8.0
9.0
-10.0
-7.5
-5.0
-2.5
0.0
2.5
5.0
7.5
10.0
1997
1998
1999
2000
2001
2002
2003
2004
2005
2006
2007
2008
2009
2010
2011
2012
2013
2014
2015
2016
Percent Vacant
Annu
al P
erce
nt R
ent G
row
th
Effective Rent Growth Vacancy Rate Average Vacancy 1993-2011RREEF Forecast

RREEF REAL ESTATE U.S. Real Estate Strategic Outlook | March 2012 16
Sector Strategies and Megatrends: Apartments are the one property sector of commercial real estate where most, if not all markets in the United States are producing rent growth. Nevertheless, some metros experienced growth earlier than others and future performance will also diverge by metro and submarket. While the sector has long been perceived as a desirable and relative stable investment, and is the only property type that has been capable of producing sustained rent growth over the long term, the sector is experiencing some fundamental changes. Structural changes will impact the coming decade: (1) renting has become a more favorable lifestyle choice; (2) demand for rental housing will be particularly strong due to demographic trends; and (3) consumer demand has shifted away from suburban to urban/infill submarkets. Thus, while the overall sector should benefit from these macro changes, some markets and submarkets will significantly out-perform.
Research and experience are showing that the “Echo Boom” generation has an even stronger bias toward rental housing than those of the past. Just as importantly, this group is very location sensitive, particularly those within the highly educated and professional classes that can afford institutional quality housing. This major demographic gravitates towards “youth magnet” cities that embrace the youth culture, provide good jobs and offer the quality of life that they desire. These tend to be the coastal gateway markets. In addition, urban/infill submarkets will be preferred over commodity suburban communities both in the near and longer term. “Green” initiatives improve marketability with this generation, such as energy reduction, recycling and bicycle storage.
Metros that experienced the earliest and strongest economic recovery also produced the most significant surge in apartment demand. These most significantly included Washington D.C., New York, Austin, Dallas and Houston. As the tech sector took hold, these were followed by Boston, San Francisco, San Jose and Seattle. Investors were quick to see this trend, and apartment pricing has been bid to highly aggressive levels, given their near-term, strong performance, their growth potential, and inexpensive and highly available financing. In particular, investors have favored metros with high incomes and housing costs, which tend to have high barriers to entry, and therefore have a stronger long-term outlook. In all of these metros, investment is focused on the strongest and most desirable infill submarkets, and does not generally include commodity suburban locations.
A second tier of metros is also now attracting considerable investor attention that have shown strong market fundamentals, but their growth is either a little later or less spectacular than the first tier metros. These include Chicago, Denver, Fort Lauderdale, Los Angeles, Miami, Northern New Jersey, Oakland/East Bay, Orange County, Portland, and San Diego. These are generally high barrier to entry and expensive for-sale housing markets, and are working through their for-sale housing oversupply. As a result, they are expected to outperform in the long term.
RREEF REAL ESTATE U.S. Real Estate Strategic Outlook | March 2012 17
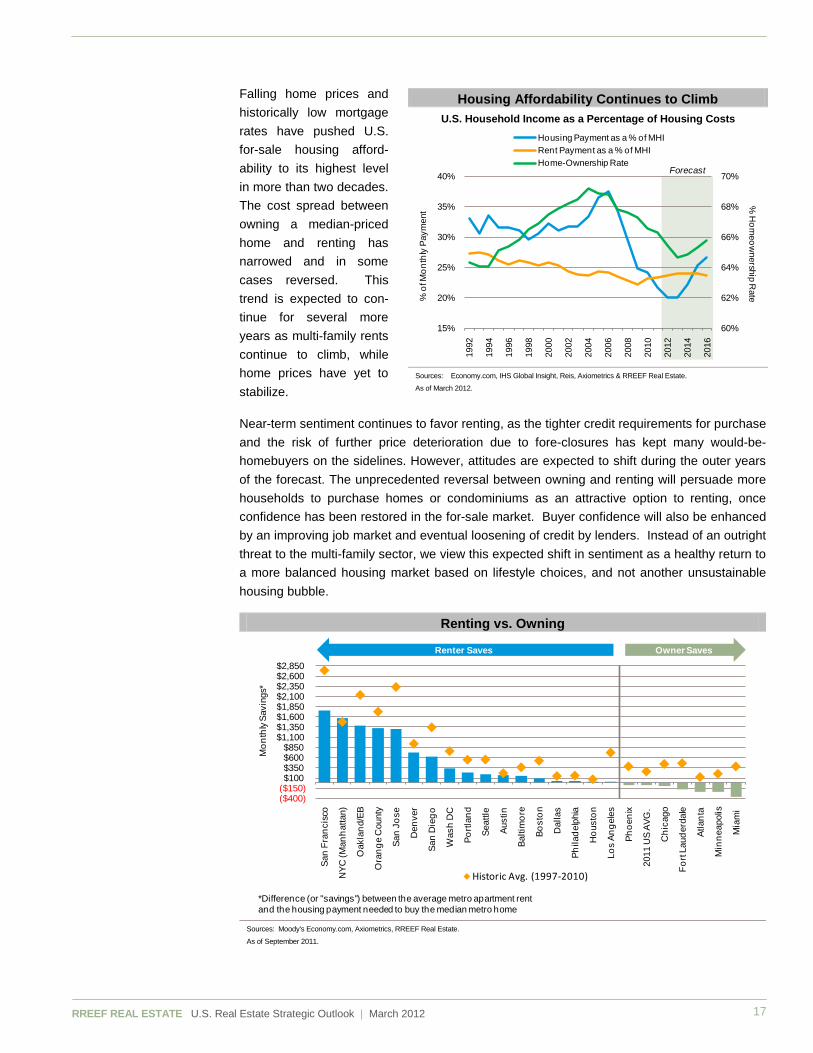
Falling home prices and historically low mortgage rates have pushed U.S. for-sale housing afford-ability to its highest level in more than two decades. The cost spread between owning a median-priced home and renting has narrowed and in some cases reversed. This trend is expected to con-tinue for several more years as multi-family rents continue to climb, while home prices have yet to stabilize.
Near-term sentiment continues to favor renting, as the tighter credit requirements for purchase and the risk of further price deterioration due to fore-closures has kept many would-be-homebuyers on the sidelines. However, attitudes are expected to shift during the outer years of the forecast. The unprecedented reversal between owning and renting will persuade more households to purchase homes or condominiums as an attractive option to renting, once confidence has been restored in the for-sale market. Buyer confidence will also be enhanced by an improving job market and eventual loosening of credit by lenders. Instead of an outright threat to the multi-family sector, we view this expected shift in sentiment as a healthy return to a more balanced housing market based on lifestyle choices, and not another unsustainable housing bubble.
Renting vs. Owning
Sources: Moody's Economy.com, Axiometrics, RREEF Real Estate.
As of September 2011.
($400)($150)$100 $350 $600 $850
$1,100 $1,350 $1,600 $1,850 $2,100 $2,350 $2,600 $2,850
San
Fran
cisc
o
NYC
(Man
hatta
n)
Oak
land
/EB
Ora
nge
Cou
nty
San
Jose
Den
ver
San
Die
go
Was
h D
C
Portl
and
Seat
tle
Aust
in
Balti
mor
e
Bost
on
Dal
las
Phila
delp
hia
Hou
ston
Los
Ange
les
Phoe
nix
2011
US
AVG
.
Chi
cago
Fort
Laud
erda
le
Atla
nta
Min
neap
olis
Mia
mi
Mon
thly
Savi
ngs*
2011 Historic Avg. (1997-2010)
*Difference (or "savings") between the average metro apartment rent and the housing payment needed to buy the median metro home
Owner SavesRenter Saves
Housing Affordability Continues to Climb U.S. Household Income as a Percentage of Housing Costs
Sources: Economy.com, IHS Global Insight, Reis, Axiometrics & RREEF Real Estate.
As of March 2012.
60%
62%
64%
66%
68%
70%
15%
20%
25%
30%
35%
40%
1992
1994
1996
1998
2000
2002
2004
2006
2008
2010
2012
2014
2016
% H
omeow
nership Rate%
of M
onth
ly P
aym
ent
Housing Payment as a % of MHIRent Payment as a % of MHI Home-Ownership Rate
Forecast

RREEF REAL ESTATE U.S. Real Estate Strategic Outlook | March 2012 18
As multi-family rents climb, the savings from owning versus renting will strengthen the case for buying homes in traditionally highly affordable markets such as Atlanta, Chicago, Dallas, Florida, Houston, Minneapolis, and Phoenix. While most first-time home-buyers remain on the sidelines in these metros for now, this will change during the forecast as “savings” from owning becomes more compelling to existing renters.
While home affordability has increased across all metros, there are still markets where renting offers significant savings over home-ownership. Markets that have a high percentage of renters by choice/necessity include the high-cost coastal markets of the San Francisco Bay Area, New York, Coastal Southern California, Pacific Northwest and Washington D.C.. Although new supply is focused on these markets, we expect it to subside in the outer years of our forecast. As the for-sale condominium market recovers, developers will shift the construction pipeline toward for-sale housing, which traditionally has supported higher land values. In addition, conversions of rentals to condominiums could resume. As a result, these markets are most capable of outperforming the U.S. average for rent growth over the long term.
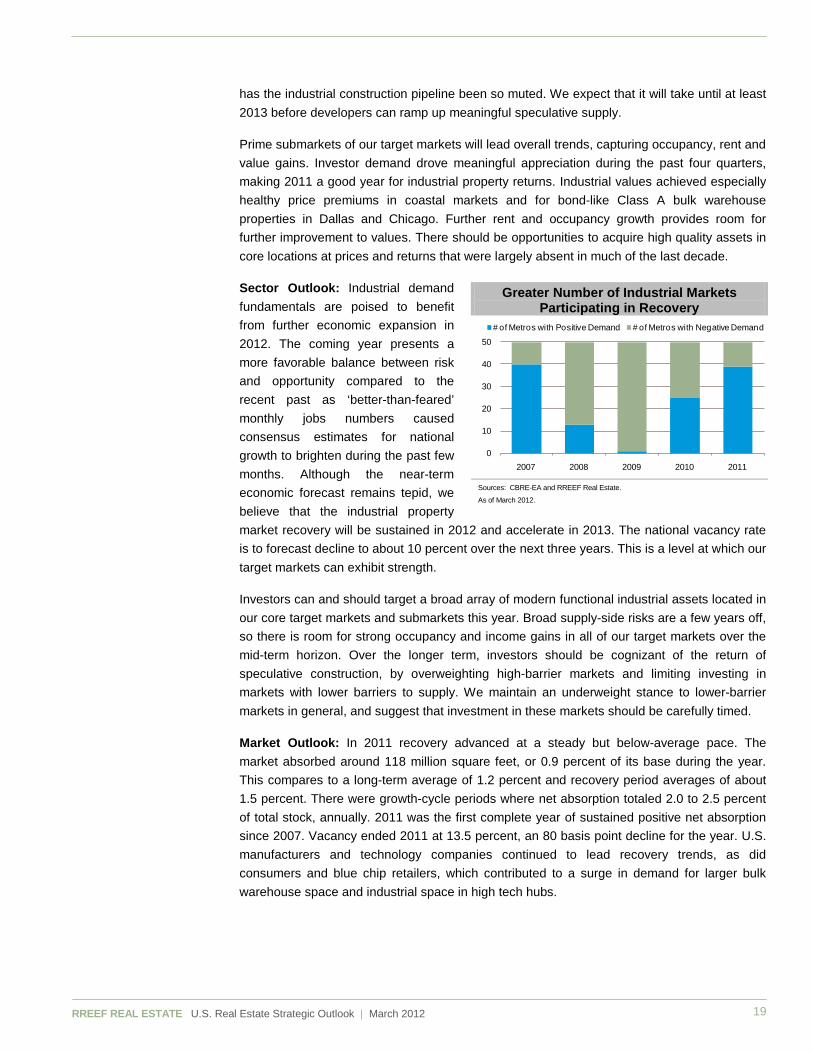
Outlook for the Industrial Sector Recovery Continues in 2012, Despite Unsure Waters: The industrial property sector is a good bet for core real estate investors in 2012. A recovery in market fundamentals is clearly underway, but general sentiment and investor preferences remain mixed, exhibited by narrowly focused attention on a few top markets and in assets with ultra-safe rent rolls. Industrial sector fundamentals took a few steps forward in 2011, as renewed demand drove positive net absorption and vacancy declines in about 80 percent of the top 50 metropolitan areas. Additionally, effective market rents lifted off bottom in a handful of leading coastal markets. The vast majority of industrial markets remain oversupplied, but recovery momentum is headed in the right direction.
Key economic drivers proved resilient in 2011 and should support favorable industrial space demand in the future. Retail spending and inter-national trade have normal-ized and should grow mod-erately in 2012 and more strongly thereafter, fueling warehouse demand. Con-tinued uplift for U.S. manu-facturers and high tech firms should aid near-term reco-very for multi-tenant indust-rial properties. Sustained employment and population growth unmistakably drive improved demand fundamentals. Benefits of improved demand accrue faster when there is a supply-side gap, which is currently in place in the United States. In no period during the last 30 years
Industrial Market Forecasts – National Fundamentals U.S. Supply/Demand & Vacancy
Sources: CBRE-EA and RREEF Real Estate.
As of March 2012.
0.0
3.0
6.0
9.0
12.0
15.0
18.0
(300)
(200)
(100)
0
100
200
300
2001
2002
2003
2004
2005
2006
2007
2008
2009
2010
2011
2012
F
2013
F
2014
F
2015
F
2016
F
Vacancy Trend %
Supp
ly/D
eman
d (M
SF)
Completions Net Absorption Vacancy Trend
RREEF REAL ESTATE U.S. Real Estate Strategic Outlook | March 2012 19
has the industrial construction pipeline been so muted. We expect that it will take until at least 2013 before developers can ramp up meaningful speculative supply.
Prime submarkets of our target markets will lead overall trends, capturing occupancy, rent and value gains. Investor demand drove meaningful appreciation during the past four quarters, making 2011 a good year for industrial property returns. Industrial values achieved especially healthy price premiums in coastal markets and for bond-like Class A bulk warehouse properties in Dallas and Chicago. Further rent and occupancy growth provides room for further improvement to values. There should be opportunities to acquire high quality assets in core locations at prices and returns that were largely absent in much of the last decade.
Sector Outlook: Industrial demand fundamentals are poised to benefit from further economic expansion in 2012. The coming year presents a more favorable balance between risk and opportunity compared to the recent past as ‘better-than-feared’ monthly jobs numbers caused consensus estimates for national growth to brighten during the past few months. Although the near-term economic forecast remains tepid, we believe that the industrial property market recovery will be sustained in 2012 and accelerate in 2013. The national vacancy rate is to forecast decline to about 10 percent over the next three years. This is a level at which our target markets can exhibit strength.
Investors can and should target a broad array of modern functional industrial assets located in our core target markets and submarkets this year. Broad supply-side risks are a few years off, so there is room for strong occupancy and income gains in all of our target markets over the mid-term horizon. Over the longer term, investors should be cognizant of the return of speculative construction, by overweighting high-barrier markets and limiting investing in markets with lower barriers to supply. We maintain an underweight stance to lower-barrier markets in general, and suggest that investment in these markets should be carefully timed.
Market Outlook: In 2011 recovery advanced at a steady but below-average pace. The market absorbed around 118 million square feet, or 0.9 percent of its base during the year. This compares to a long-term average of 1.2 percent and recovery period averages of about 1.5 percent. There were growth-cycle periods where net absorption totaled 2.0 to 2.5 percent of total stock, annually. 2011 was the first complete year of sustained positive net absorption since 2007. Vacancy ended 2011 at 13.5 percent, an 80 basis point decline for the year. U.S. manufacturers and technology companies continued to lead recovery trends, as did consumers and blue chip retailers, which contributed to a surge in demand for larger bulk warehouse space and industrial space in high tech hubs.
Greater Number of Industrial Markets Participating in Recovery
Sources: CBRE-EA and RREEF Real Estate.
As of March 2012.
0
10
20
30
40
50
2007 2008 2009 2010 2011
# of Metros with Positive Demand # of Metros with Negative Demand

RREEF REAL ESTATE U.S. Real Estate Strategic Outlook | March 2012 20
U.S. Industrial Rent Growth vs. Vacancy
Sources: CBRE-EA and RREEF Real Estate.
As of March 2012.
The Global Gateway and national inland hub markets continue to lead demand trends. Strong activity in Atlanta, Chicago and Dallas during the second half of 2011 lifted their total net absorption figures into the top 10 among U.S. metros. Riverside, Los Angeles, Phoenix and Houston also exhibited strong demand and are expected to be top demand performers in 2012, although Phoenix will retain a high vacancy rate. We expect Global Gateway markets will continue to perform well in 2012 as will a growing number of other markets, aided by low supply levels. Total net absorption is expected to rise to about 1.5 percent of stock in 2012 and peak at 1.7 percent in 2013 and 2014. Construction is forecast to remain very low, averaging only 0.6 percent of stock through 2014, less than half of longer term averages. As vacancy declines we expect effective market rents will increase by 2.0 to 3.0 percent in 2012 as a function of lower concessions, and then jump by 10 to 15 percent by 2014.
Distinct regional economic growth should stimulate broader demand trends in 2012. Our top picks for 2012 and over the next few years are comprised of metro markets that benefit from some or all of the following; trade linkages to Asia, Mexico/Latin America and Canada, have larger populations with above average growth and incomes, transportation hubs, high tech, medical and energy nodes.
4.05.06.07.08.09.010.011.012.013.014.015.0
-15.0-12.5-10.0-7.5-5.0-2.50.02.55.07.5
10.012.5
1992
1993
1994
1995
1996
1997
1998
1999
2000
2001
2002
2003
2004
2005
2006
2007
2008
2009
2010
2011
2012
2013
2014
2015
2016
Percent Vacant
Annu
al P
erce
nt R
ent G
row
th
Effective Rent Growth Vacancy Rate Average Vacancy 1993-2011RREEF Forecast
RREEF REAL ESTATE U.S. Real Estate Strategic Outlook | March 2012 21
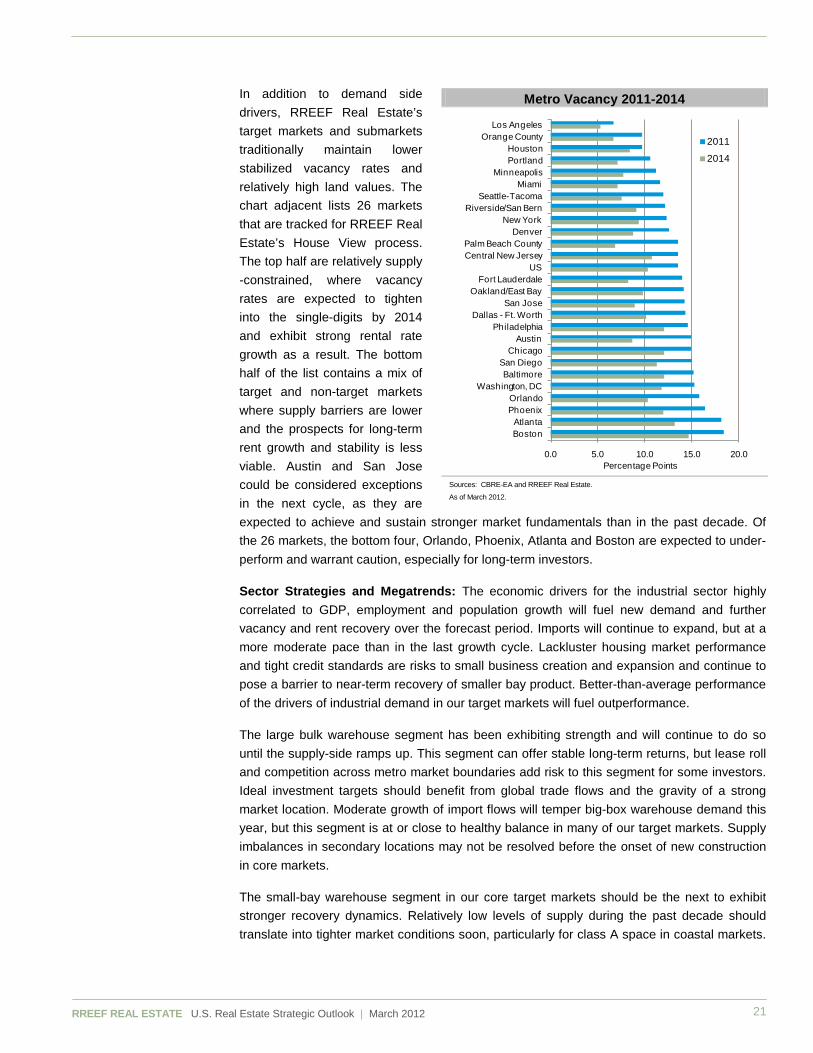
In addition to demand side drivers, RREEF Real Estate’s target markets and submarkets traditionally maintain lower stabilized vacancy rates and relatively high land values. The chart adjacent lists 26 markets that are tracked for RREEF Real Estate’s House View process. The top half are relatively supply -constrained, where vacancy rates are expected to tighten into the single-digits by 2014 and exhibit strong rental rate growth as a result. The bottom half of the list contains a mix of target and non-target markets where supply barriers are lower and the prospects for long-term rent growth and stability is less viable. Austin and San Jose could be considered exceptions in the next cycle, as they are expected to achieve and sustain stronger market fundamentals than in the past decade. Of the 26 markets, the bottom four, Orlando, Phoenix, Atlanta and Boston are expected to under-perform and warrant caution, especially for long-term investors.
Sector Strategies and Megatrends: The economic drivers for the industrial sector highly correlated to GDP, employment and population growth will fuel new demand and further vacancy and rent recovery over the forecast period. Imports will continue to expand, but at a more moderate pace than in the last growth cycle. Lackluster housing market performance and tight credit standards are risks to small business creation and expansion and continue to pose a barrier to near-term recovery of smaller bay product. Better-than-average performance of the drivers of industrial demand in our target markets will fuel outperformance.
The large bulk warehouse segment has been exhibiting strength and will continue to do so until the supply-side ramps up. This segment can offer stable long-term returns, but lease roll and competition across metro market boundaries add risk to this segment for some investors. Ideal investment targets should benefit from global trade flows and the gravity of a strong market location. Moderate growth of import flows will temper big-box warehouse demand this year, but this segment is at or close to healthy balance in many of our target markets. Supply imbalances in secondary locations may not be resolved before the onset of new construction in core markets.
The small-bay warehouse segment in our core target markets should be the next to exhibit stronger recovery dynamics. Relatively low levels of supply during the past decade should translate into tighter market conditions soon, particularly for class A space in coastal markets.
Metro Vacancy 2011-2014
Sources: CBRE-EA and RREEF Real Estate.
As of March 2012.
0.0 5.0 10.0 15.0 20.0
BostonAtlanta
PhoenixOrlando
Washington, DCBaltimore
San DiegoChicago
AustinPhiladelphia
Dallas - Ft. WorthSan Jose
Oakland/East BayFort Lauderdale
USCentral New JerseyPalm Beach County
DenverNew York
Riverside/San BernSeattle-Tacoma
MiamiMinneapolis
PortlandHouston
Orange CountyLos Angeles
Percentage Points
2011
2014

RREEF REAL ESTATE U.S. Real Estate Strategic Outlook | March 2012 22
Market rents are 20 to 30 percent below replacement cost levels, so as vacancy tightens there is potential for strong rent gains in coming years. If the next expansion cycle is sustained, well located class B small-bay product will benefit strongly, as well.
Flex, Business Park and R&D space (non-warehouse) requires more selectivity today, but good assets in coastal markets will provide attractive returns. Investments should be directed to core submarkets of high-barrier metros where economic growth is expected to be above average and demand turned positive in 2011. Markets in California, the Pacific Northwest, South Florida and the Northeast are attractive currently, but only for highly functional product. New industries tend to require more intensive office and parking use. Similar to suburban office, assets in highly amenitized locations tend to lead market averages. This segment is also forecast to recover strongly in the mid-term horizon, lagging warehouse by a year.
Warehouse vs. Non-Warehouse
Sources: CBRE-EA and RREEF Real Estate.
As of March 2012.
The exhibit above compares the historical performance of the warehouse and non-warehouse segments of the U.S. industrial market. It also provides a forecast of absorption and vacancy rates by both segments. Although warehouse and non-warehouse vacancy rates have generally tracked each other over the longer term, warehouse vacancy has remained relatively high since 2006. This divergence is largely due to greater levels of new construction in the last cycle. Non-warehouse vacancy moved up and down through the last cycle based primarily on demand-side rather than supply dynamics. The non-warehouse segment suffered substantial negative demand in 2008 and 2009. This was a sharper contraction than was experienced during the past two cycles. In those earlier cycles, warehouse fundamentals recovered earlier than non-warehouse. Thus, in recovery phases, warehouse has outpaced non-warehouse, capturing 71 percent of net absorption in the 1990’s and 74 percent in the 2000’s recovery/early growth periods. Similarly, warehouse has been outperforming in the current early recovery phase. Historically, during the mature growth phases, non-warehouse has outperformed. It performed particularly well in the mature growth phases of the high-tech dominated late 1990’s. A weak dollar and healthier high tech environment today has better implications for non-warehouse space demand compared to the recent past, and expanding trade will drive demand. Our forecasted performance on the exhibit assumes non-warehouse space demand will total 25 percent of total demand during the forecast recovery, in-line with
-6%
-3%
0%
3%
6%
9%
12%
15%
1992 1994 1996 1998 2000 2002 2004 2006 2008 2010 2012 2014 2016
Rate of Change Occupied Whse. Space Rate of Change Occupied Non-Whse SpaceNon-Whse Vacancy Whse Vacancy
RREEF Forecast

RREEF REAL ESTATE U.S. Real Estate Strategic Outlook | March 2012 23
the mid-2000’s growth cycle. With that assumption and a proportionate share of new construction, vacancy in the non-warehouse segment would decline to 9 percent in 2016, producing strong rent growth.
With the expansion of the Panama Canal nearing reality, investors should consider the implication of the resultant changes in trade lanes. The overall impact is highly positive, as long-term growth of global trade will require expanded port infrastructure. The United States’ largest port, the combined Ports of Los Angeles and Long Beach (POLA/LB), cannot accommodate this projected growth in spite of on-going physical and operational improvements. The canal expansion will allow some goods to reach closer to their destinations on the East Coast. We expect that the primary beneficiaries of larger ships passing through the Canal will be Norfolk and Savannah/Charleston. This benefit, however, may not happen rapidly, and it will not likely threaten the viability of West coast port volumes. These east and west coast ports will both continue to serve expanding markets in their respective regions. One consequence of increased trade flows directly to the east, however, may be heightened competition among large-bay warehouse hubs in the Southeast and Northeast, as connections to western rail carriers becomes less vital in future supply chain efficiency. Today, by a wide margin, the most economical route from China to any market in the United States is through POLA/LB. Until that changes significantly, Southern California and western U.S. trade flows and property market dynamics will remain a good bet.
Outlook for the Office Sector Are We There Yet? U.S. office markets are not yet in full recovery, but a modest rebound is taking root. As office job growth outpaces the overall economy, the sector will reach a point in the next few years where it will generate the strongest rebound among the property types, as it has done in past recoveries. Submarkets in leading metros have already posted 2011 rent gains ahead of their anticipated pace – Austin, Boston, Houston, New York, San Francisco and San Jose – portending broader recovery to come. Nonetheless, the path to wider recovery in the United States will be sluggish and segmented, as early leading submarkets remain clustered in gateway metros and those with tech- and energy-rich economies. Even stalwart investment locations, such as New York and Washington D.C., are not without vulnerable submarkets. Urban submarkets remain key foundations for investment, but select close-in suburban nodes are also poised for accelerated rent recovery, particularly when considering their growth potential beyond the next two years.
Office Market Forecasts - National Fundamentals U.S. Supply/Demand & Vacancy
Sources: CBRE-EA and RREEF Real Estate.
As of March 2012.
12.0
13.0
14.0
15.0
16.0
17.0
(100)(80)(60)(40)(20)
0 20 40 60 80
100
2001
2002
2003
2004
2005
2006
2007
2008
2009
2010
2011
2012
F
2013
F
2014
F
2015
F
2016
F
Vacancy Trend %
Supp
ly/D
eman
d (M
SF)
Completions Net Absorption Vacancy Trend
RREEF REAL ESTATE U.S. Real Estate Strategic Outlook | March 2012 24
Key drivers of office space demand include the technology, professional and business services, and energy sectors. The U.S. economy continues to become office-based, with an increasing share of total employment working within offices. While near-term demand and rent growth are forecast to be modest for the sector, office should outperform over the longer five-year outlook. Limited new supply is anticipated during this period except in Washington D.C., allowing for strong market improvement in the outer years of our forecast.
The relatively late timing of this recovery, however, presents inherent risks to investing in this sector. In addition, challenges facing demand recovery arise from shadow space lingering in empty cubicles, tenants focusing on more efficient space utilization, and increasing hurdles facing the finance and federal government (including their contractors) sectors. These challenges have been incorporated into our forecasts, but result in a delayed recovery for this sector.
Office Absorption vs. Job Growth for Sum of Markets
Sources: CBRE-EA and RREEF Real Estate.
As of March 2012.
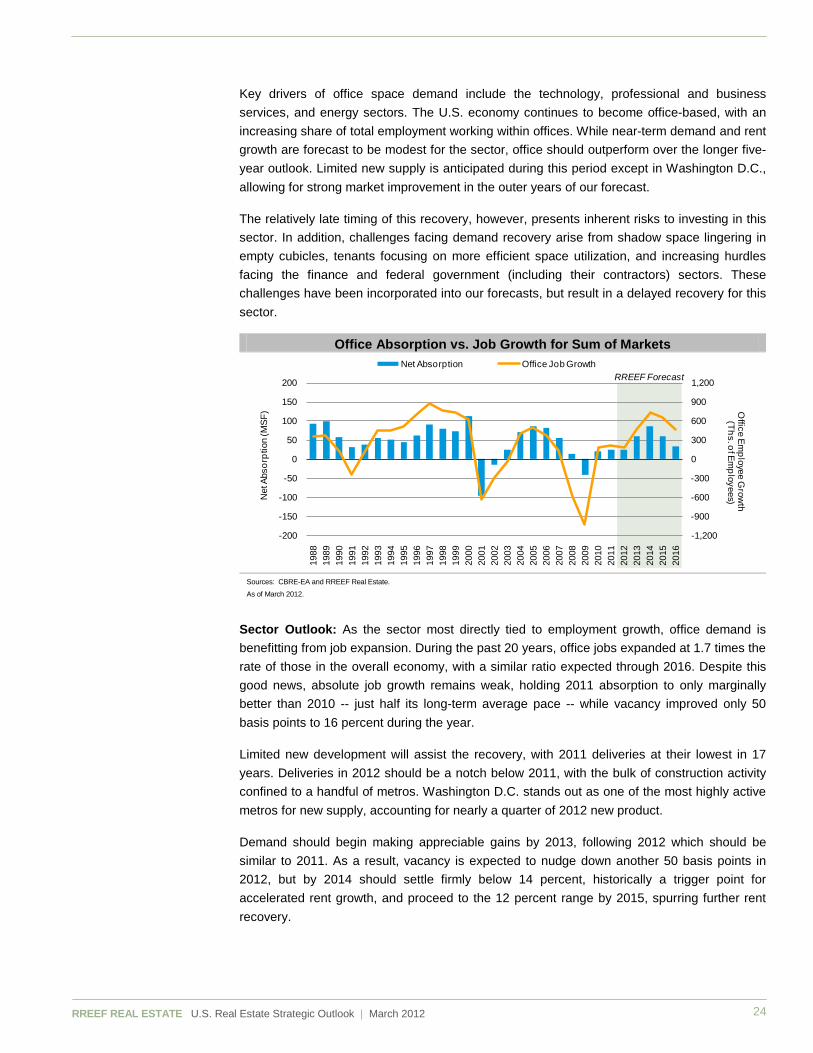
Sector Outlook: As the sector most directly tied to employment growth, office demand is benefitting from job expansion. During the past 20 years, office jobs expanded at 1.7 times the rate of those in the overall economy, with a similar ratio expected through 2016. Despite this good news, absolute job growth remains weak, holding 2011 absorption to only marginally better than 2010 -- just half its long-term average pace -- while vacancy improved only 50 basis points to 16 percent during the year.
Limited new development will assist the recovery, with 2011 deliveries at their lowest in 17 years. Deliveries in 2012 should be a notch below 2011, with the bulk of construction activity confined to a handful of metros. Washington D.C. stands out as one of the most highly active metros for new supply, accounting for nearly a quarter of 2012 new product.
Demand should begin making appreciable gains by 2013, following 2012 which should be similar to 2011. As a result, vacancy is expected to nudge down another 50 basis points in 2012, but by 2014 should settle firmly below 14 percent, historically a trigger point for accelerated rent growth, and proceed to the 12 percent range by 2015, spurring further rent recovery.
-1,200
-900
-600
-300
0
300
600
900
1,200
-200
-150
-100
-50
0
50
100
150
200
1988
1989
1990
1991
1992
1993
1994
1995
1996
1997
1998
1999
2000
2001
2002
2003
2004
2005
2006
2007
2008
2009
2010
2011
2012
2013
2014
2015
2016
Office Em
ployee Grow
th(Ths. of Em
ployees)Net
Abs
orpt
ion
(MSF
)
Net Absorption Office Job GrowthRREEF Forecast

RREEF REAL ESTATE U.S. Real Estate Strategic Outlook | March 2012 25
U.S. Office Rent Growth vs. Vacancy
Sources: CBRE-EA and RREEF Real Estate.
As of March 2012.
Market Outlook: The office recovery remains highly segmented. Early recovery office markets have been dominated by tech, energy, finance and government. In the past year, San Francisco, Austin and San Jose were top performers, with Boston not far behind, reflecting the particular strength of technology-driven markets. Rapid recovery of New York, the global center of finance, benefited from federal stimulus to the sector. In addition, it is also benefiting from a nascent technology sector and creative industries. Washington D.C., an office market that fell the least in the recession and was the earliest out-performer in the recovery, slowed in 2011. Houston has been the top market in the energy sector, recovering early, but was still a top performer in 2011.
Some early recovery markets have moved out of the top ten for remaining rent growth during the next five years, while others will continue to be leaders. Although the financial sector faced a downgrade stemming from regulatory reform and the European debt crisis, New York still remains among the top expected gainers in rent during the forecast period. In spite of strong absorption and rent growth already achieved, Boston, Seattle, San Francisco and Houston are still forecast to be top performers, especially early in the forecast period. Other tech based metros that experienced the earliest and strongest growth, have dropped below the top 10 for future growth, but nonetheless are forecast to achieve strong growth. In all of these cases, 2016 rents are forecast to exceed prior peak cycle levels.
Washington D.C., the nation’s earliest recovery metro, is braking to a standstill after clocking 5 million square feet absorbed in 2010. The metro has had its outlook lowered due to anticipated cuts in Federal government and contractor employment, as the President and Congress continue to implement fiscal austerity. Combined with the city’s relatively robust pipeline of new supply, rent growth for the metro is forecast to lag.
Several metro office markets that are experiencing a relatively late recovery, but with excellent future prospects, top the list for absorption and rent growth over the next five years. In particular, these include Orange County, San Diego and Los Angeles, indicating demand drivers are beginning to take hold in Southern California. Portions of Oakland/East Bay are forecast to experience a similar but more restrained pattern, with spillover benefits from the west side of the Bay. However, Orange County, San Diego and Oakland are not forecast to
7.5
10.0
12.5
15.0
17.5
20.0
-12.5-10.0-7.5-5.0-2.50.02.55.07.5
10.012.5
1988
1989
1990
1991
1992
1993
1994
1995
1996
1997
1998
1999
2000
2001
2002
2003
2004
2005
2006
2007
2008
2009
2010
2011
2012
2013
2014
2015
2016
Percent Vacant
Annu
al P
erce
nt R
ent G
row
th
Effective Rent Growth Vacancy Rate Average Vacancy 1993-2011RREEF Forecast

RREEF REAL ESTATE U.S. Real Estate Strategic Outlook | March 2012 26
reach their prior peaks within the next five years, offering further growth potential. Other metros forecast to put in a good performance are Denver, Portland, Chicago, Dallas and South Florida, with rents generally at or exceeding their previous peak by 2016.
Several metros tracked by RREEF Real Estate will lag the recovery substantially. In general, these are metros that were particularly pummeled by the recession, and also have weak drivers for recovery. These include Atlanta, Phoenix, Charlotte and Riverside where rents and occupancy have fallen the most. However, these markets are also capable of tremendous growth when caught at the right time in the cycle. Phoenix and Charlotte are forecast to experience particularly strong rent growth over the next five years. However, rent levels in 2016 will remain significantly below their previous peak, reflecting the extent of their fall during the recession and the latency of their recovery. Several other metros, including Philadelphia, Northern New Jersey and Sacramento are expected to be chronic laggards.
Sector Strategies and Megatrends: Gateway metros with vibrant downtowns will continue to see outperformance for core investment strategies. Their near-term positive outlook is magnified by their competitive edge relative to recent downgrades in demand, and concerns about shadow vacancy and tenants’ more efficient use of office space. Even within the strongest metros, performance is split, with core CBD or other central employment areas leading suburban locations. This trend is expected to continue, as we see the shift from suburbs to CBD as a long-term structural change. Nevertheless, recovery is expected to spread more widely to suburban markets as some firms seek lower cost options. However, well-functioning CBDs, with their much tighter vacancies, will allow for stronger and earlier rent growth recovery.
In some metros, the core CBD is being overshadowed by nearby submarkets in the central urban core. To a large extent, this has been driven by technology, creative services or boutique financial services. These submarkets include:
Back Bay and Cambridge in Boston;
Midtown South in New York, including SOHO and the Meatpacking District;
Lake Union and Downtown Bellevue in Seattle; and
South of Market Area in San Francisco;
These are metros that support a strong CBD, but also support these emerging or boutique submarkets. Most of the submarkets above are actually outperforming the CBD, due to current market demand drivers and conditions. Longer term, however, they will be complimentary to the CBD.
CBD vs. Suburban Vacancy
Sources: CBRE-EA and RREEF Real Estate.
As of March 2012.
0%
5%
10%
15%
20%
1999
2000
2001
2002
2003
2004
2005
2006
2007
2008
2009
2010
2011
2012
2013
2014
2015
2016
CBD Suburban Difference
Based on selected CBD and suburban submarkets.
RREEF REAL ESTATE U.S. Real Estate Strategic Outlook | March 2012 27
Other target office investment metros do not support a strong CBD, so that investment should target dominant alternatives to the central core. In most cases, these are mixed use environments that are well-served by public transport, although are generally more automobile-centric than CBD markets. These include:
West Los Angeles, generally including the corridor from Miracle Mile to Santa Monica in Los Angeles;
North Cities, focusing on University Town Center, in San Diego;
Irvine/Newport Beach in Orange County; and
Coral Gables in Miami;
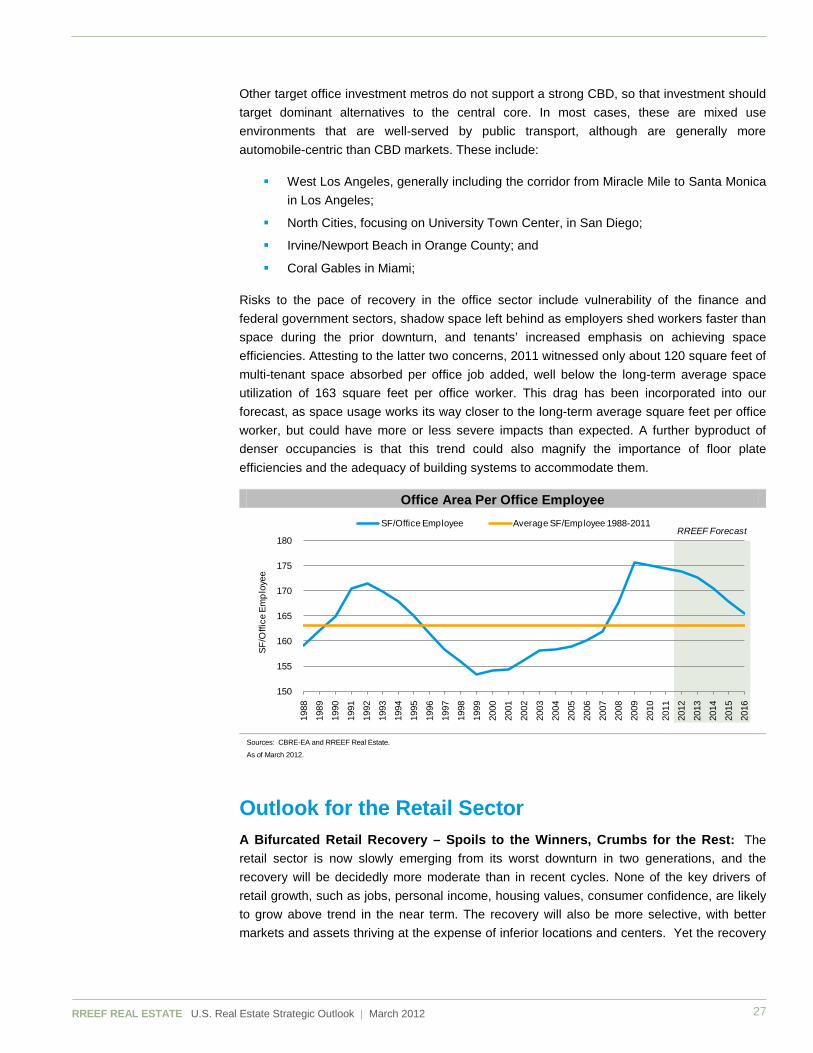
Risks to the pace of recovery in the office sector include vulnerability of the finance and federal government sectors, shadow space left behind as employers shed workers faster than space during the prior downturn, and tenants’ increased emphasis on achieving space efficiencies. Attesting to the latter two concerns, 2011 witnessed only about 120 square feet of multi-tenant space absorbed per office job added, well below the long-term average space utilization of 163 square feet per office worker. This drag has been incorporated into our forecast, as space usage works its way closer to the long-term average square feet per office worker, but could have more or less severe impacts than expected. A further byproduct of denser occupancies is that this trend could also magnify the importance of floor plate efficiencies and the adequacy of building systems to accommodate them.
Office Area Per Office Employee
Sources: CBRE-EA and RREEF Real Estate.
As of March 2012.
Outlook for the Retail Sector A Bifurcated Retail Recovery – Spoils to the Winners, Crumbs for the Rest: The retail sector is now slowly emerging from its worst downturn in two generations, and the recovery will be decidedly more moderate than in recent cycles. None of the key drivers of retail growth, such as jobs, personal income, housing values, consumer confidence, are likely to grow above trend in the near term. The recovery will also be more selective, with better markets and assets thriving at the expense of inferior locations and centers. Yet the recovery
150
155
160
165
170
175
180
1988
1989
1990
1991
1992
1993
1994
1995
1996
1997
1998
1999
2000
2001
2002
2003
2004
2005
2006
2007
2008
2009
2010
2011
2012
2013
2014
2015
2016
SF/O
ffice
Em
ploy
ee
SF/Office Employee Average SF/Employee 1988-2011RREEF Forecast

RREEF REAL ESTATE U.S. Real Estate Strategic Outlook | March 2012 28
will bring some outstanding investment opportunities. Construction remains at historic lows, so even demand recovery translates directly into occupancy gains. Equally important, as the retail sector increasingly sorts between winners and losers, those centers at the top will face less “effective” competition, providing disproportionate gains in occupancy and rents. Thus, investors must be especially discriminating in their acquisitions and strategies as well, passing on the commodity assets and seeking out the truly dominant properties and supply-constrained markets. High street retail and upscale centers should outperform overall.
Looking for a New Type of Recovery: The retail sector is finally showing sustained positive momentum following initial tentative growth after the recent severe consumer recession. However, this recovery will look different from those in prior expansions, with more moderated growth. Retail spending grew by nearly 8 percent in 2011, a very strong showing for the economy. However, this included on-line sales, automobiles and other sales that are not typically conducted in retail centers. For national chain stores (not including Wal-Mart), sales increased by less than 5 percent, allowing only selected markets and assets to benefit from recovery. As a result, a significant portion of retail space will continue to struggle in the coming years. Retail vacancies peaked in 2011 at historic highs, but unlike in prior cycles, the surge in vacant space was not driven by supply excesses. Indeed, construction was relatively restrained during the last expansion, and now is effectively at a standstill. Rather, it was the unprecedented decline in retail leasing, attributable to a combination of macroeconomic forces as well as convulsions roiling the retail sector itself.
With consumers now beginning to regain confidence, retail sales are returning to pre-recessionary levels, allowing vacancies to decline. Nevertheless, absorption has been tepid, given that retailers have been cautious about expansion and have been focused on profitability. With continuing downward pressure on “bricks and mortar” retail space from on-line sales, they have been reducing their space needs. With a more positive outlook, retailers are once again looking at expansion for 2012. With virtually no new supply in the pipeline, the prospects for renewed rent growth are improving. Following the rent declines of the last few years, increasing retail sales, and little new supply, the stage is set for above-inflation rent gains. Retailers have spent the past several years restoring their balance sheets and improving sales productivity, and can therefore afford higher rents. In addition, they are upgrading their locations, re-sizing stores, and planning new store openings and retail concepts. In the absence of new supply, new demand from retailers will translate into occupancy and rent gains for existing centers, providing for some select attractive investment opportunities.
Location Location Location: Location has always been paramount for retailers, but it is an even more important factor today. Healthy national retailers will pay to be in the top-tier markets and locations, and they are convinced that their sales will support higher occupancy costs. On the other hand, they are shedding second-tier markets and locations, even when rents are very low. This selectivity is creating a tiered segmentation of retail centers. The top tier will prosper. Less desirable properties will flounder. Accordingly, investors will need to be as discriminating in their acquisition strategies as retailers are in their site selections.
Under-demolished: While some retail centers will be able to compete for less productive retailers and other related uses on the basis of low cost, many of these lesser quality properties may have difficulty in retaining sustainable tenancy. The retail sector is not so
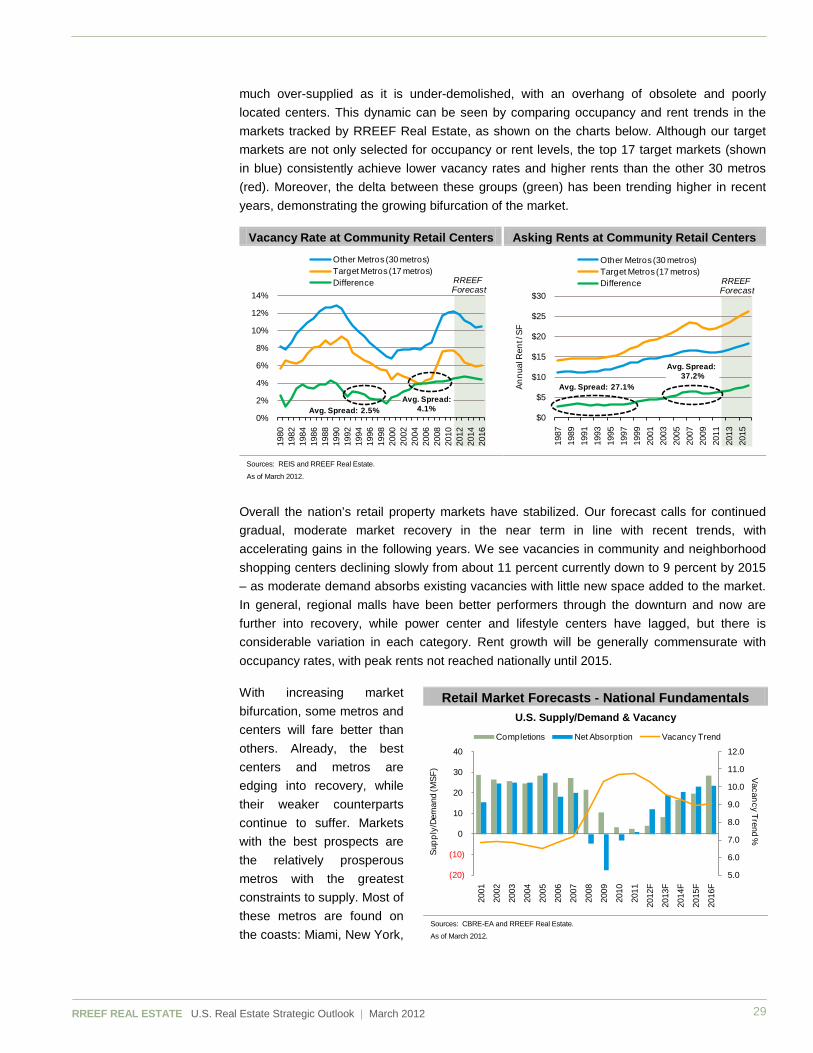
RREEF REAL ESTATE U.S. Real Estate Strategic Outlook | March 2012 29
much over-supplied as it is under-demolished, with an overhang of obsolete and poorly located centers. This dynamic can be seen by comparing occupancy and rent trends in the markets tracked by RREEF Real Estate, as shown on the charts below. Although our target markets are not only selected for occupancy or rent levels, the top 17 target markets (shown in blue) consistently achieve lower vacancy rates and higher rents than the other 30 metros (red). Moreover, the delta between these groups (green) has been trending higher in recent years, demonstrating the growing bifurcation of the market.
Vacancy Rate at Community Retail Centers Asking Rents at Community Retail Centers
Sources: REIS and RREEF Real Estate.
As of March 2012.
Overall the nation’s retail property markets have stabilized. Our forecast calls for continued gradual, moderate market recovery in the near term in line with recent trends, with accelerating gains in the following years. We see vacancies in community and neighborhood shopping centers declining slowly from about 11 percent currently down to 9 percent by 2015 – as moderate demand absorbs existing vacancies with little new space added to the market. In general, regional malls have been better performers through the downturn and now are further into recovery, while power center and lifestyle centers have lagged, but there is considerable variation in each category. Rent growth will be generally commensurate with occupancy rates, with peak rents not reached nationally until 2015.
With increasing market bifurcation, some metros and centers will fare better than others. Already, the best centers and metros are edging into recovery, while their weaker counterparts continue to suffer. Markets with the best prospects are the relatively prosperous metros with the greatest constraints to supply. Most of these metros are found on the coasts: Miami, New York,
0%
2%
4%
6%
8%
10%
12%
14%
1980
1982
1984
1986
1988
1990
1992
1994
1996
1998
2000
2002
2004
2006
2008
2010
2012
2014
2016
Other Metros (30 metros)Target Metros (17 metros)Difference
Avg. Spread: 4.1%Avg. Spread: 2.5%
RREEF Forecast
$0
$5
$10
$15
$20
$25
$30
1987
1989
1991
1993
1995
1997
1999
2001
2003
2005
2007
2009
2011
2013
2015
Annu
al R
ent /
SF
Other Metros (30 metros)Target Metros (17 metros)Difference RREEF
Forecast
Avg. Spread: 27.1%
Avg. Spread: 37.2%
Retail Market Forecasts - National Fundamentals U.S. Supply/Demand & Vacancy
Sources: CBRE-EA and RREEF Real Estate.
As of March 2012.
5.0
6.0
7.0
8.0
9.0
10.0
11.0
12.0
(20)
(10)
0
10
20
30
40
2001
2002
2003
2004
2005
2006
2007
2008
2009
2010
2011
2012
F
2013
F
2014
F
2015
F
2016
F
Vacancy Trend %
Supp
ly/D
eman
d (M
SF)
Completions Net Absorption Vacancy Trend
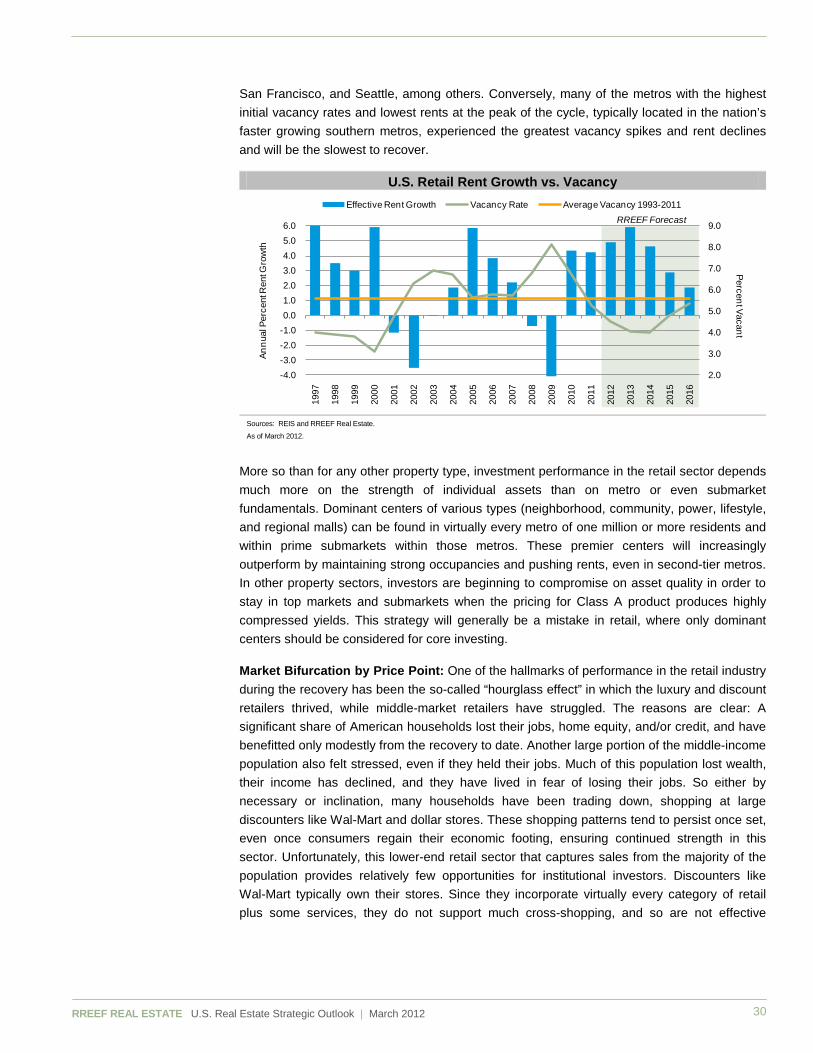
RREEF REAL ESTATE U.S. Real Estate Strategic Outlook | March 2012 30
San Francisco, and Seattle, among others. Conversely, many of the metros with the highest initial vacancy rates and lowest rents at the peak of the cycle, typically located in the nation’s faster growing southern metros, experienced the greatest vacancy spikes and rent declines and will be the slowest to recover.
U.S. Retail Rent Growth vs. Vacancy
Sources: REIS and RREEF Real Estate.
As of March 2012.
More so than for any other property type, investment performance in the retail sector depends much more on the strength of individual assets than on metro or even submarket fundamentals. Dominant centers of various types (neighborhood, community, power, lifestyle, and regional malls) can be found in virtually every metro of one million or more residents and within prime submarkets within those metros. These premier centers will increasingly outperform by maintaining strong occupancies and pushing rents, even in second-tier metros. In other property sectors, investors are beginning to compromise on asset quality in order to stay in top markets and submarkets when the pricing for Class A product produces highly compressed yields. This strategy will generally be a mistake in retail, where only dominant centers should be considered for core investing.
Market Bifurcation by Price Point: One of the hallmarks of performance in the retail industry during the recovery has been the so-called “hourglass effect” in which the luxury and discount retailers thrived, while middle-market retailers have struggled. The reasons are clear: A significant share of American households lost their jobs, home equity, and/or credit, and have benefitted only modestly from the recovery to date. Another large portion of the middle-income population also felt stressed, even if they held their jobs. Much of this population lost wealth, their income has declined, and they have lived in fear of losing their jobs. So either by necessary or inclination, many households have been trading down, shopping at large discounters like Wal-Mart and dollar stores. These shopping patterns tend to persist once set, even once consumers regain their economic footing, ensuring continued strength in this sector. Unfortunately, this lower-end retail sector that captures sales from the majority of the population provides relatively few opportunities for institutional investors. Discounters like Wal-Mart typically own their stores. Since they incorporate virtually every category of retail plus some services, they do not support much cross-shopping, and so are not effective
2.0
3.0
4.0
5.0
6.0
7.0
8.0
9.0
-4.0-3.0-2.0-1.00.01.02.03.04.05.06.0
1997
1998
1999
2000
2001
2002
2003
2004
2005
2006
2007
2008
2009
2010
2011
2012
2013
2014
2015
2016
Percent Vacant
Annu
al P
erce
nt R
ent G
row
th
Effective Rent Growth Vacancy Rate Average Vacancy 1993-2011RREEF Forecast

RREEF REAL ESTATE U.S. Real Estate Strategic Outlook | March 2012 31
anchors of retail centers. Dollar stores are not particular about location and pay little rent, and many are freestanding stores not part of shopping centers.
Meanwhile, highly-skilled and affluent households have disproportionately recovered their wealth and confidence since the recession. This prosperous population, which curtailed their shopping well in excess of their needs during the recession, has returned to the marketplace in force. Luxury retailers, including upscale department stores, are exhibiting impressive gains. For example, monthly sales in 2011 rose an average of 8.1 percent at luxury department stores compared to 3.5 percent at all department stores and 4.7 percent for all retailers (excluding Wal-Mart). Aside from greater affluence, these shoppers also support greater confidence, which is highly correlated with spending. The Conference Board Consumer Confidence Index was 77.0 in December 2011 for households with incomes of at least $50,000, compared to 69.5 for all households and only 47.7 for households with incomes between $25,000 and $35,000. Centers that have successfully targeted the luxury retail sector are performing very well. Upscale regional malls and a few lifestyle or fashion centers dominate this sector and have become extremely popular with investors.
High Street Retail: Several trends highlighted in this Strategic Outlook together point to the outstanding potential for high street retail, the main street-level, pedestrian shopping districts of major cities. This retail responds to emerging changes in lifestyle of U.S. professional classes, both young and more mature, who are increasingly favoring urban mixed use environments. They are seeking these environments to live, work, shop and find entertainment. Successful street frontage retail tends to be a mixture of luxury or upscale shopping, dining, entertainment and services. Our analysis demonstrates that high street retail consistently achieves lower vacancy and turnover and much higher rents than traditional shopping centers. In addition, it is less at risk from on-line retailing. Yet this niche has been largely ignored by institutional investors to date, possibly due to challenges in assembling and managing these assets.
These assets can be expected to outperform in the coming years. The central business districts of major cities typically are among the most supply-constrained markets with significant barriers to new construction, providing relatively predictable competitive dynamics. At the same time, retail in the CBD and infill commercial districts benefits from the greater preference for urban living, working and shopping environments among Baby Boomer empty-nesters and Echo Boomers alike. Further, high street retail districts tend to attract the luxury retailers that are the strength of the sector, and these sites often generate the greatest sale volumes (and command the highest rents) in these chains. Together with the more limited pool of buyers, these factors make a compelling case for greater consideration of high street retail in institutional investor portfolios.
Necessity Retailing: The grocery industry has consolidated in recent decades, with one to two national or regional chains generally dominating each metro. At the same time, the remaining traditional grocers are facing new types of competition at both the high and especially low end of the spectrum: gourmet and organic retailers appeal to higher-income consumers, while discount supermarkets (e.g., Bi-Lo, Save-A-Lot, Grocery Outlet) and discount retailers with more grocery offerings (e.g., Wal-Mart, Target) cater to less affluent households. Meanwhile, all consumers seem to appreciate the convenience and savings offered by smaller specialty groceries such as Fresh and Easy or Trader Joe’s.
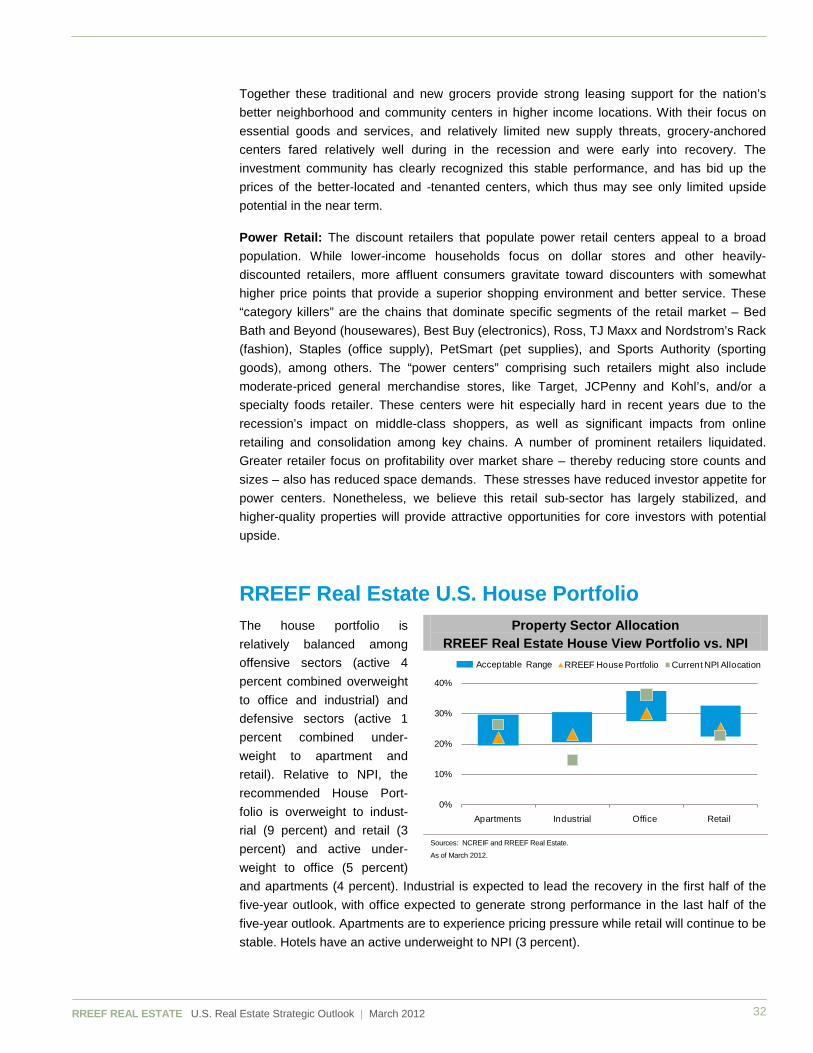
RREEF REAL ESTATE U.S. Real Estate Strategic Outlook | March 2012 32
Together these traditional and new grocers provide strong leasing support for the nation’s better neighborhood and community centers in higher income locations. With their focus on essential goods and services, and relatively limited new supply threats, grocery-anchored centers fared relatively well during in the recession and were early into recovery. The investment community has clearly recognized this stable performance, and has bid up the prices of the better-located and -tenanted centers, which thus may see only limited upside potential in the near term.
Power Retail: The discount retailers that populate power retail centers appeal to a broad population. While lower-income households focus on dollar stores and other heavily-discounted retailers, more affluent consumers gravitate toward discounters with somewhat higher price points that provide a superior shopping environment and better service. These “category killers” are the chains that dominate specific segments of the retail market – Bed Bath and Beyond (housewares), Best Buy (electronics), Ross, TJ Maxx and Nordstrom’s Rack (fashion), Staples (office supply), PetSmart (pet supplies), and Sports Authority (sporting goods), among others. The “power centers” comprising such retailers might also include moderate-priced general merchandise stores, like Target, JCPenny and Kohl’s, and/or a specialty foods retailer. These centers were hit especially hard in recent years due to the recession’s impact on middle-class shoppers, as well as significant impacts from online retailing and consolidation among key chains. A number of prominent retailers liquidated. Greater retailer focus on profitability over market share – thereby reducing store counts and sizes – also has reduced space demands. These stresses have reduced investor appetite for power centers. Nonetheless, we believe this retail sub-sector has largely stabilized, and higher-quality properties will provide attractive opportunities for core investors with potential upside.
RREEF Real Estate U.S. House Portfolio The house portfolio is relatively balanced among offensive sectors (active 4 percent combined overweight to office and industrial) and defensive sectors (active 1 percent combined under-weight to apartment and retail). Relative to NPI, the recommended House Port-folio is overweight to indust-rial (9 percent) and retail (3 percent) and active under-weight to office (5 percent) and apartments (4 percent). Industrial is expected to lead the recovery in the first half of the five-year outlook, with office expected to generate strong performance in the last half of the five-year outlook. Apartments are to experience pricing pressure while retail will continue to be stable. Hotels have an active underweight to NPI (3 percent).
Property Sector Allocation RREEF Real Estate House View Portfolio vs. NPI
Sources: NCREIF and RREEF Real Estate.
As of March 2012.
0%
10%
20%
30%
40%
Apartments Industrial Office Retail
RREEF House Portfolio Current NPI AllocationAcceptable Range

RREEF REAL ESTATE U.S. Real Estate Strategic Outlook | March 2012 33
House Portfolio Construction – Sector Allocation
Sector NPI Weights Research Forecasts
Quantitative Input1 Qualitative
Inputs Weights
House Portfolio2
Active Bet 3
Recommended House Portfolio
Range
Apartment 26%
• Strong near term growth • Current rents are already above
the previous peak • New supply and competition
from for-sale housing in longer term
20% Largely fully priced 22% (4%) 17% - 27%
Industrial 14%
• Rents are at 75-80% of the previous peak, have the furthest to recover
• Economic drivers especially supportive of this sector
23%
Attractive relative
valuation, poised to
outperform
23% 9% 18% - 28%
Office 35% • Rents are at 80% of the
previous peak, with CBD leading • High prices but slow recovery
26% Too early/
Late recovery
30% (5%) 25% - 35%
Retail 22%
• Rents are at 80-85% of the previous peak
• Rent to sales ratio at a historically favourable level
• Construction at historic lows
31%
Attractive relative
valuation, stable cash
flow
25% 3% 20% - 30%
Hotel 3% N/A 0% N/A 0% (3%) 0% 1Quantitative inputs based on RREEF Quantitative Allocation Model. 2 Qualitative Inputs include inputs from Transactions, Asset Management and Portfolio Management teams. 3
Source: NCREIF and RREEF Real Estate. House Portfolio is the target allocation that incorporates both qualitative and quantitative views in addition to tactical and strategic considerations.
As of March 2012.
By region, we have overweight to the West (6 percent) and East (3 percent) and underweight to the South (7 percent) and Midwest (2 percent).
House Portfolio Construction – Regional Allocation
Sector NPI Weights Research Forecasts
Quantitative Input1 Qualitative
Inputs Weights
House Portfolio2
Active Bet 3
Recommended House Portfolio
Range
East 34% Large financial center and globally linked metros outperform, near and long-term
28% Overweight 22% 3% 32% - 42%
Midwest 10%
Average and below average growth limit upside. Near-term recovery lifts metros with favorable industries
6% Underweight 23% (2%) 3% - 13%
South 22%
Fast-growth and low cost characteristics of stimulate demand and recovery, but uneven prospects
32% Underweight 30% (7%) 10% - 20%
West 34%
Recovery from sharp contraction begins. Knowledge-based and globally linked metros lead and outperform
35% Overweight 25% 6% 35% - 45%
1Quantitative inputs based on RREEF Quantitative Allocation Model. 2 Qualitative Inputs include inputs from Transactions, Asset Management and Portfolio Management teams. 3
Source: NCREIF and RREEF Real Estate. House Portfolio is the target allocation that incorporates both qualitative and quantitative views in addition to tactical and strategic considerations.
As of March 2012.
House Portfolio Construction Considerations and Risks If our forecast for above-trend economic and real estate growth in conjunction with favorable capital market conditions is wrong, the Scenario Analysis (see “Results of House Portfolio Scenario Analysis”) suggests that allocating in line with the House Portfolio will result in equal or better performance against the NPI under four different scenarios. Only under Scenario IV,

RREEF REAL ESTATE U.S. Real Estate Strategic Outlook | March 2012 34
which is the bull market period, the House Portfolio will underperform; however, we expect to move towards a more offensive position compared to last year later in 2012 and early 2013.
Results of House Portfolio Scenario Analysis
Apartment Industrial Office Retail
House Portfolio Recommendation 22% 23% 30% 25%
Scenario I
(1989Q1 – 1993Q4)
Scenario II (1994Q1 – 1998Q4)
Scenario III
(2001Q1 – 2003Q4)
NPI
Returns House
Portfolio NPI
Returns House
Portfolio NPI
Returns House
Portfolio
Annualized Total Return 0.20% 0.69% 10.81% 12.18% 7.67% 9.82% Volatility 3.58% 4.55% 2.02% 1.96% 1.08% 0.91% Sharpe Ratio (2.05) (1.51) 2.23 2.98 2.89 5.80
Scenario IV
(2004Q1 – 2007Q2)
Scenario V (2007Q3 – 2010Q2)
NPI Returns House Portfolio NPI Returns House Portfolio
Annualized Total Return 17.08% 16.97% (4.71%) (3.16%) Volatility 1.66% 1.86% 8.25% 7.24% Sharpe Ratio 7.56 6.72 (1.01) (0.94) Note: Risk Free Rate used for Sharpe Ratio calculation is the average 10-Year Treasury Yield for the relevant period. For illustrative purposes only. House Portfolio Returns are shown gross of advisory fees. Performance would have been lower if fees had been shown. Please see "Important Notes" for more information. Represents back-tested performance. Please see disclosure at bottom of page for more information regarding the use back-tested performance. Past performance is no guarantee of future results3
Sources: NCREIF and RREEF Real Estate.
.
As of March 2012.
In Scenario I (S&L crisis) the House Portfolio outperforms by 47 basis points per annum albeit, with higher volatility. Office was the main proponent of negative returns and higher volatility during this time, so an underweight helps returns. Both the House Portfolio and NPI have negative risk-adjusted returns although the House Portfolio’s Sharpe Ratio is more favorable.
Scenario II (1990’s real estate crash, market turns into recovery) somewhat reflects our current expectation for the 2012-16 period. Our House Portfolio recommendations results in a 137 basis point improvement in returns over the NPI during this period with similar levels of volatility.
In Scenario III (dotcom bust, economic recession) the House Portfolio outperforms by 213 basis points per annum with slightly lower volatility during this period. Risk-adjusted returns are al-most double that of NPI.
In Scenario IV (strong bull market, rapid credit expansion) the House Portfolio underperforms NPI in terms of return and volatility. This is the only scenario where the House Portfolio lags. Returns are down 13 basis points while volatility is up leading to lower risk-adjusted returns.
3 Simulated/Back-tested Performance: Please note that simulated/back-tested performance results have inherent limitations. The performance results do not represent results of actual trading using client assets, but were obtained by the retroactive application of constraint assumptions to actual allocations. No representation is being made that any account will achieve profits or losses similar to those shown. These simulated returns do not reflect the deduction of investment advisory fees. A client’s return will be reduced by advisory fees and any other expenses that may be incurred in the management of its investment advisory account. Past performance is not guarantee of future results.

RREEF REAL ESTATE U.S. Real Estate Strategic Outlook | March 2012 35
In Scenario V (credit crunch, real estate downturn) the House Portfolio outperforms by 156 basis points per annum due to an overweight to retail and underweight to office. However, volatility is extremely high during this period resulting in negative Sharpe ratios for both the House Portfolio and NPI. The risk-adjusted returns for the House Portfolio are only marginally better than NPI.
Sustainability Strategy In addition to the traditional market, financial and risk factors that must be considered in capital allocations, investors increasingly must take into account the sustainability of the assets they acquire and how they are managed. This is particularly true for real property markets, where a diverse but convergent set of economic, market, and regulatory forces are combining to move the industry to adopt greener practices. Indeed, the move to sustainability in many leading markets around the world has been redefining standards of institutional-quality buildings and the responsibilities of fiduciaries. In the coming years, questions about any “green premiums” will increasingly shift to a proliferation of “brown discounts.”
A 2011 study by Johnson Controls (JCI)4
Sustainability has also been propelled by both rising government mandate and evolving local market standards. Even when not required by law, tenants are increasingly demanding greener facilities: to attract employees, impress customers and to satisfy shareholders.
of 4,000 global executives and building owners responsible for energy management and investment decisions found that 70 percent of respondents viewed energy management as very or extremely important, up 10 percentage points over the prior year. With building owners and tenants facing higher energy costs in recent years – and the risks of still more increases in the future – the greatest motivation toward sustainability across all regions in the JCI study was the cost savings that green technologies and practices deliver to building owners and tenants alike. Financial incentives to improve building performance further strengthen the economics of investments in building performance, and were the second most often cited factor in the JCI study.
Little known only a decade ago, there are now some 8,700 LEED-certified buildings globally, covering more than 1.6 billion gross square feet of building area, plus another 1,100 buildings certified under the BREEAM standard.5
This confluence of forces is leading to increasing evidence of the value that sustainability adds to buildings and portfolios. Controlling for key building attributes, three 2010 studies
According to the U.S. Green Building Council, one million square feet of building area world-wide is now registered for potential certification every day. A multitude of other certification systems have also been adopted across the globe, in addition to numerous energy assessment protocols, both voluntary and mandatory.
6 of real estate in the United States found an average rents premium of four percent for ENERGY STAR7
4 Johnson Controls, International Facility Management Association and the Urban Land Institute (2011): “2011 Energy Efficiency Indicator: Global Results.”
labeled buildings, and five to seven percent for LEED-certification, and one study
5 LEED stands for Leadership in Energy and Environmental Design, an assessment system developed by the U.S. Green Building Council. BREEAM is the BRE Environmental Assessment Method established in the UK by the Building Research Establishment (BRE). 6 Fuerst and McAllister, American Real Estate and Urban Economic Association (2010) : “Green Noise or Green Value?”; CBRE & McGraw Hill: “Do Green Buildings Make Dollars and Sense?” (2010); Eichholtz, Kok and Quigley: “Doing Well by Doing Good? Green Office Buildings” (2010). 7 ENERGY STAR is a program administered by the U.S. Department of Energy that benchmarks the energy usage of buildings, awarding labels for buildings in the top quartile for energy performance.

RREEF REAL ESTATE U.S. Real Estate Strategic Outlook | March 2012 36
identified an average sales price premium of 25 percent for both designations. While the precise magnitude of these premiums may be debated, the direction is clear and incontrovertible and consistent with virtually all known reputable studies conducted throughout the world.
Governmental resolve is strengthening to address global warming through increasingly strict mandates and requirements in the US real estate industry. Assembly Bill 1103 in California requires disclosure of energy performance upon the acquisition, leasing or financing of commercial buildings greater than 50,000 square feet; in New York City, buildings of the same size must submit annual energy benchmarking reports as part of PlaNYC; and in Washington D.C., benchmarking through ENERGY STAR is not only mandatory, but must also be publicly disclosed in some cases. Similar legislation is pending or proposed in many other major cities and states, particularly in most of the ten C40 cities8
Accordingly, sustainability considerations are becoming an increasingly important and integral component of commercial real estate investment decisions. Of course, market standards and government regulations vary widely by geography and product type, requiring that investors understand the nuances of local environmental standards and regulations as well as the traditional market and financial factors that underpin investment decisions. Responsible fiduciary practices now demand that investment managers possess and apply such knowledge to identify and manage the risks and opportunities that sustainability presents.
within the US. New York City has also taken the additional step of forming an Energy Efficiency Corporation to structure loan programs and provide a layer of financing to accelerate energy efficiency investments in commercial buildings, and this program is now being proposed in other jurisdictions.
8 The C40 Cities Climate Leadership Group (C40) is a network of large cities from around the world committed to implementing meaningful and sustainable climate-related actions locally that will help address climate change globally.

RREEF REAL ESTATE U.S. Real Estate Strategic Outlook | March 2012 37
Important Notes © 2012. All rights reserved. RREEF Real Estate, part of RREEF Alternatives, the alternative investments business of Deutsche Asset Management, the asset management division of Deutsche Bank AG offers a range of real estate investment strategies, including: core and value-added and opportunistic real estate, real estate debt, and real estate and infrastructure securities. In the United States RREEF Real Estate relates to the asset management activities of RREEF America L.L.C., and Deutsche Investment Management Americas Inc.; in Germany: RREEF Investment GmbH, RREEF Management GmbH and RREEF Spezial Invest GmbH; in Australia: Deutsche Asset Management (Australia) Limited (ABN 63 116 232 154) an Australian financial services license holder; in Japan: Deutsche Securities Inc. (For DSI, financial advisory (not investment advisory) and distribution services only); in Hong Kong: Deutsche Bank Aktiengesellschaft, Hong Kong Branch (for RREEF Real Estate’s direct real estate business), and Deutsche Asset Management (Hong Kong) Limited (for RREEF Real Estate’s real estate securities business); in Singapore: Deutsche Asset Management (Asia) Limited (Company Reg. No. 198701485N); in the United Kingdom: Deutsche Alternative Asset Management (UK) Limited, Deutsche Alternative Asset Management (Global) Limited and Deutsche Asset Management (UK) Limited; in Italy: RREEF Fondimmobiliari SGR S.p.A.; and in Denmark, Finland, Norway and Sweden: Deutsche Alternative Asset Management (UK) Limited and Deutsche Alternative Asset Management (Global) Limited; in addition to other regional entities in the Deutsche Bank Group. Key RREEF Real Estate research personnel are voting members of various RREEF Real Estate investment committees. Members of the investment committees vote with respect to underlying investments and/or transactions and certain other matters subjected to a vote of such investment committee. Additionally, research personnel receive, and may in the future receive incentive compensation based on the performance of a certain investment accounts and investment vehicles managed by RREEF Real Estate and its affiliates. This material was prepared without regard to the specific objectives, financial situation or needs of any particular person who may receive it. It is intended for informational purposes only. It does not constitute investment advice, a recommendation, an offer, solicitation, the basis for any contract to purchase or sell any security or other instrument, or for Deutsche Bank AG or its affiliates to enter into or arrange any type of transaction as a consequence of any information contained herein. Neither Deutsche Bank AG nor any of its affiliates gives any warranty as to the accuracy, reliability or completeness of information which is contained in this document. Except insofar as liability under any statute cannot be excluded, no member of the Deutsche Bank Group, the Issuer or any officer, employee or associate of them accepts any liability (whether arising in contract, in tort or negligence or otherwise) for any error or omission in this document or for any resulting loss or damage whether direct, indirect, consequential or otherwise suffered by the recipient of this document or any other person. The views expressed in this document constitute Deutsche Bank AG or its affiliates’ judgment at the time of issue and are subject to change. This document is only for professional investors. This document was prepared without regard to the specific objectives, financial situation or needs of any particular person who may receive it. No further distribution is allowed without prior written consent of the Issuer. An investment in real estate involves a high degree of risk, including possible loss of principal amount invested, and is suitable only for sophisticated investors who can bear such losses. The value of shares/ units and their derived income may fall or rise. Any forecasts provided herein are based upon RREEF Real Estate’s opinion of the market at this date and are subject to change dependent on the market. Past performance or any prediction, projection or forecast on the economy or markets is not indicative of future performance. The forecasts provided are based upon our opinion of the market as at this date and are subject to change, dependent on future changes in the market. Any prediction, projection or forecast on the economy, stock market, bond market or the economic trends of the markets is not necessarily indicative of the future or likely performance. Certain RREEF Real Estate investment strategies may not be available in every region or country for legal or other reasons, and information about these strategies is not directed to those investors residing or located in any such region or country. For Investors in the United Kingdom: Issued and approved in the United Kingdom by Deutsche Alternative Asset Management (UK) Limited, Deutsche Alternative Asset Management (Global) Limited, and Deutsche Asset Management (UK) Limited of One Appold Street, London, EC2A 2UU. Authorised and regulated by the Financial Services Authority. This document is a “non-retail communication” within the meaning of the FSA‟s Rules and is directed only at persons satisfying the FSA‟s client categorisation criteria for an eligible counterparty or a professional client. This document is not intended for and should not be relied upon by a retail client. When making an investment decision, potential investors should rely solely on the final documentation relating to the investment or service and not the information contained herein. The investments or services mentioned herein may not be appropriate for all investors and before entering into any transaction you should take steps to ensure that you fully understand the transaction and have made an independent assessment of the appropriateness of the transaction in the light of your own objectives and circumstances, including the possible risks and benefits of entering into such transaction. You should also consider seeking advice from your own advisers in making this assessment. If you decide to enter into a transaction with us you do so in reliance on your own judgment. For Investors in Australia: In Australia, Issued by Deutsche Asset Management (Australia) Limited (ABN 63 116 232 154), holder of an Australian Financial Services License. This information is only available to persons who are professional, sophisticated, or wholesale investors under the Corporations Act. An investment with Deutsche Asset Management is not a deposit with or any other type of liability of Deutsche Bank AG ARBN 064 165 162, Deutsche Asset Management (Australia) Limited or any other member of the Deutsche Bank AG Group. The capital value of and performance of an investment with Deutsche Asset Management is not guaranteed by Deutsche Bank AG, Deutsche Asset Management (Australia) Limited or any other member of the Deutsche Bank Group. Deutsche Asset Management (Australia) Limited is not an Authorised Deposit taking institution under the Banking Act 1959 nor regulated by the Australian Prudential Authority. Investments are subject to investment risk, including possible delays in repayment and loss of income and principal invested. For Investors in Hong Kong: Interests in the funds may not be offered or sold in Hong Kong or other jurisdictions, by means of an advertisement, invitation or any other document, other than to Professional Investors or in circumstances that do not constitute an offering to the public. This document is therefore for the use of Professional Investors only and as such, is not approved under the Securities and Futures Ordinance (SFO) or the Companies Ordinance and shall not be distributed to non-Professional Investors in Hong Kong or to anyone in any other jurisdiction in which such distribution is not authorised. For the purposes of this statement, a Professional investor is defined under the SFO.

www.rreef.com
I-026612-1.1
Global Research Team Global
Mark Roberts Global Head of Research [email protected]
Kurt W. Roeloffs Global Chief Investment Officer [email protected]
Americas
Alan Billingsley Head of Research, Americas [email protected] Marc Feliciano Chief Investment Officer, Americas [email protected] Ross Adams Industrial Specialist [email protected] Bill Hersler Office Specialist [email protected] Ana Leon Property Market Research [email protected]
Andrew J. Nelson Retail Specialist [email protected] Alex Symes Economic & Quantitative Analysis [email protected] Brooks Wells Apartment Specialist [email protected] Stella Yun Xu Property Market Research [email protected]
Europe
Simon Durkin Head of Research, Europe [email protected] Gianluca Muzzi Chief Investment Officer, Europe [email protected] Jaroslaw Morawski Property Market Research [email protected] Nazanin Nobahar Property Market Research [email protected]
Arezou Said Property Market Research [email protected] Maren Vaeth Property Market Research [email protected] Simon Wallace Property Market Research [email protected]
Asia Pacific
Koichiro Obu Head of Research, Japan/Korea [email protected] Leslie Chua Head of Research, Asia Pacific ex-Japan/Korea [email protected]
Paul Keogh Chief Investment Officer, Asia Pacific [email protected] Orie Endo Property Market Research [email protected] Edward Huong Property Market Research [email protected]
Office Locations:
Frankfurt Mainzer Landstraße 178-190 60327 Frankfurt am Main Germany Tel: +49 69 71704 0 Hong Kong Floor 58 International Commerce Center 1 Austin Road West, Kowloon Hong Kong Tel: +852 2203 8888 London 1 Appold Street London EC2A 2UU United Kingdom Tel: +44 20 754 58000 New York 345 Park Avenue 25th Floor New York NY10017-1270 United States Tel:+1 212 454 6260 Paris Floor 4 3 Avenue de Friedland Paris France Tel: +33 1 44 95 63 80 San Francisco 101 California Street 26th Floor San Francisco CA 94111 United States Tel:+1 415 781 3300 Singapore One Raffles Quay South Tower 048583 Singapore Tel: +65 6423 8385 Tokyo Floor 17 Sanno Park Tower 2-11-1 Nagata-cho Chiyoda-Ku Tokyo Japan Tel:+81 3 5156 6000